Embed Size (px)
Citation preview
American Institute of Aeronautics and Astronautics
1
A Numerical and Experimental Study of Compression-
Loaded Composite Panels With Cutouts
Robert P. Thornburgh*
US Army Research Laboratory, Vehicle Technology Directorate, Hampton, VA, 23681
and
Mark W. Hilburger †
NASA Langley Research Center, Hampton, VA, 23681
Results from a numerical and experimental study on the effects of laminate orthotropy
and circular cutout size on the response of compression-loaded composite curved panels are
presented. Several 60-in-radius composite panels with four different laminate
configurations were tested with cutout diameters that range from 10% to 60% of the panel
width. Finite-element analyses were performed for each panel in order to identify the effects
boundary conditions, measured initial geometric imperfections and thickness variations had
on the nonlinear and buckling behavior of the panels. The compression-loaded panels
considered herein exhibited two separate types of behavior depending on the laminate
stacking sequence and cutout size. More specifically, some of the panels exhibited the
classical “snap-through” type buckling response; however, some of the panels exhibited a
monotonically increasing stable response and achieved compressive loads in excess of twice
the predicted linear bifurcation buckling load. In general, the finite-element analyses were
able to predict accurately the nonlinear response and buckling loads of the panels and the
prebuckling and postbuckling out-of-plane deformations and strains.
I. Introduction
URVED panels are a common structural element found in many aerospace vehicles. With the requirement to
reduce structural weight of aircraft and to exploit stiffness tailoring of fiber-reinforced, laminated-composites to
enhance performance, it is necessary to understand the structural stability characteristics of thin-walled curved
panels that may possess high degrees of material orthotropy and anisotropy. In addition, many new vehicle designs
are allowing for panel elements to operate in the postbuckling regime in an effort to reduce overall structural weight.
Thus, the prebuckling and postbuckling response characteristics of composite curved panels also need to be well
understood. For the past thirty years, buckling loads for shell structures have been obtained, to a large extent, by
conducting linear bifurcation buckling analyses of idealized, geometrically perfect shell structures and by using
empirical “knockdown” factors that account for the effects of geometric imperfections and other unknowns. This
analysis approach can result in overly conservative estimates of the buckling load of the shell. Furthermore, very
little information on the postbuckling stiffness of composite panels with cutouts is available for design purposes. An
alternative method for the design of compression-loaded curved panels is the use of a highly accurate or “high-
fidelity” finite-element analysis or semi-analytical analyses that include the effects of initial geometric
imperfections, thickness variations, boundary conditions, and load introduction effects1. Whereas the capability to
perform high-fidelity analyses has existed for some time, the accuracy of these methods has not been experimentally
validated for the entire range of practical panel geometries and materials used in aerospace applications.
The lack of experimental validation for the stability analysis of curved panels is due, in part, to the difficulty in
accurately quantifying the differences between an idealized panel analysis and a corresponding experimentally
tested panel. In particular, the initial geometric imperfections, boundary conditions, and load distribution must be
known to a high degree of accuracy. The sensitivity of the buckling load of compression-loaded composite panels to
initial geometric imperfection has been well documented 2-5
. However, it has been shown that curved panels can
* Aerospace Engineer, Vehicle Technology Directorate, Mail Stop 266, AIAA Member.
† Aerospace Engineer, Mechanics of Structures and Material Branch, Mail Stop 190, AIAA Member.
C
https://ntrs.nasa.gov/search.jsp?R=20060020244 2018-07-16T04:43:20+00:00Z
American Institute of Aeronautics and Astronautics
2
also be very sensitive to mismatches between the panel and fixture geometries, the magnitude of elastic edge
restraints along the loaded edges, and the selection of knife edges that are sometimes used to simulate test-fixture-
induced in-plane friction effects and rotational restraints6. Previous testing of curved quasi-isotropic panels
demonstrated that some panels exhibit larger magnitude prebuckling out-of-plane deformations and buckling loads
than those predicted using finite-element analysis7. It was suggested by the author that this observed difference in
the test and analysis results was primarily caused by test-fixture-induced friction along the clamped end creating
circumferential restraint. Subsequent work6 also showed other possible causes for the observed behavior. In
general, there still exists a need for better understanding of the mechanics of the stability of compression-loaded
curved composite panels.
It is a common practice in aerospace structural design to add cutouts to curved panels in order to serve as access
ports, doors, and often reduce structural weight. These panels are expected to meet safety margins and other design
requirements. Multiple authors have studied the effects of rectangular cutouts on the buckling response of
compression-loaded composite panels 8-11
. Several studies also appear in the literature that illustrate the effects of a
circular cutout on the buckling response of compression-loaded curved panels constructed from aluminum12
and a
quasi-isotropic graphite-epoxy laminated composite7. Both of these works indicated that the circular cutout size
greatly affects the buckling characteristics of curved panels. For example, panels with relatively small circular
cutouts (e.g., cutout-diameter-to-panel-width ratios ≤ 0.2) exhibit a distinct buckling event with an inward collapse,
similar to the classical snap-through buckling response of a compression-loaded curved panel without a cutout.
However, panels with larger cutouts (e.g., cutout-diameter-to-panel-width ratios > 0.3) typically exhibit a stable,
monotonically increasing nonlinear load-shortening response with large magnitude out-of-plane deformations from
the onset of loading.
A review of the literature indicates that whereas the response of isotropic and quasi-isotropic compression-
loaded curved panels with cutouts is becoming better understood, the interaction between panel orthotropy, cutout
size, geometric imperfection and boundary conditions is not fully understood for compression-loaded composite
curved panels. Thus, the objective of this paper is to identify the effects of laminate orthotropy and circular cutout
size on the response of compression-loaded composite curved panels, and to provide validation data for high-fidelity
finite-element analysis of these panels. To this end, curved composite panels with four different laminate
configurations were tested with cutout diameters that range from 10% to 60% of the panel width. Finite-element
analyses were performed for each panel in order to identify the effects of boundary conditions, initial geometric
imperfections, and thickness variations on the prebuckling and postbuckling response of the panels.
II. Experimental Test Configuration
The experiments presented in this paper were designed to illustrate how laminate orthotropy and cutout size
affect the response of compression-loaded panels. A total of twenty-eight panels were tested in this study. Four
laminate stacking sequences were tested, including an axially stiff laminate [02 / ±45]3s, a circumferentially stiff
laminate [902 / ±45]3s, and two angle-ply laminates [±60]6s and [+606 / -606]s. The panels were manufactured from
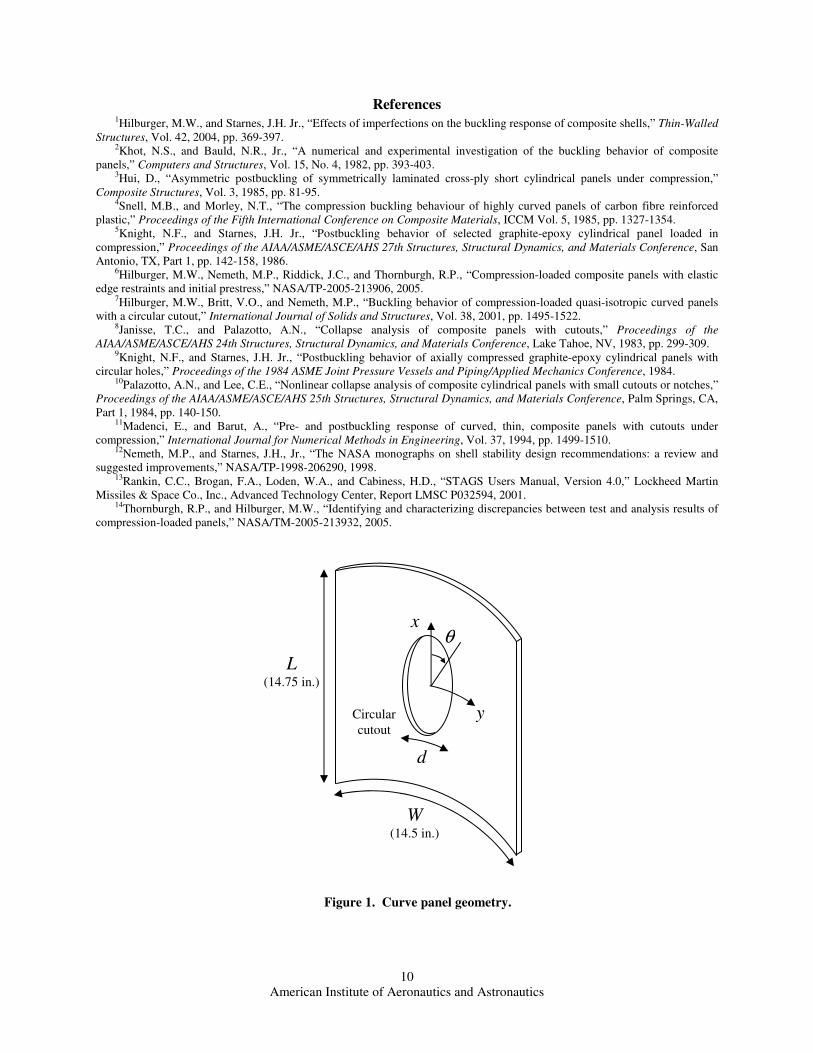
AS4/3502 graphite-epoxy tape material with a nominal ply thickness of 0.005 in. The panel geometry is illustrated
in Figure 1. Each panel had a total panel height, L, of 14.75 in. and an arc-width, W, of 14.5 in. The panels were
designed to have a nominal radius-of-curvature of 60 in., however residual curing stresses from the manufacturing
process resulted in panel radii that range from 51 in. to 57 in. Panels without a cutout were manufactured and with
panels having circular cutouts of six different cutout-diameter-to-panel-width ratios (d/W) that range from 0.1 to 0.6
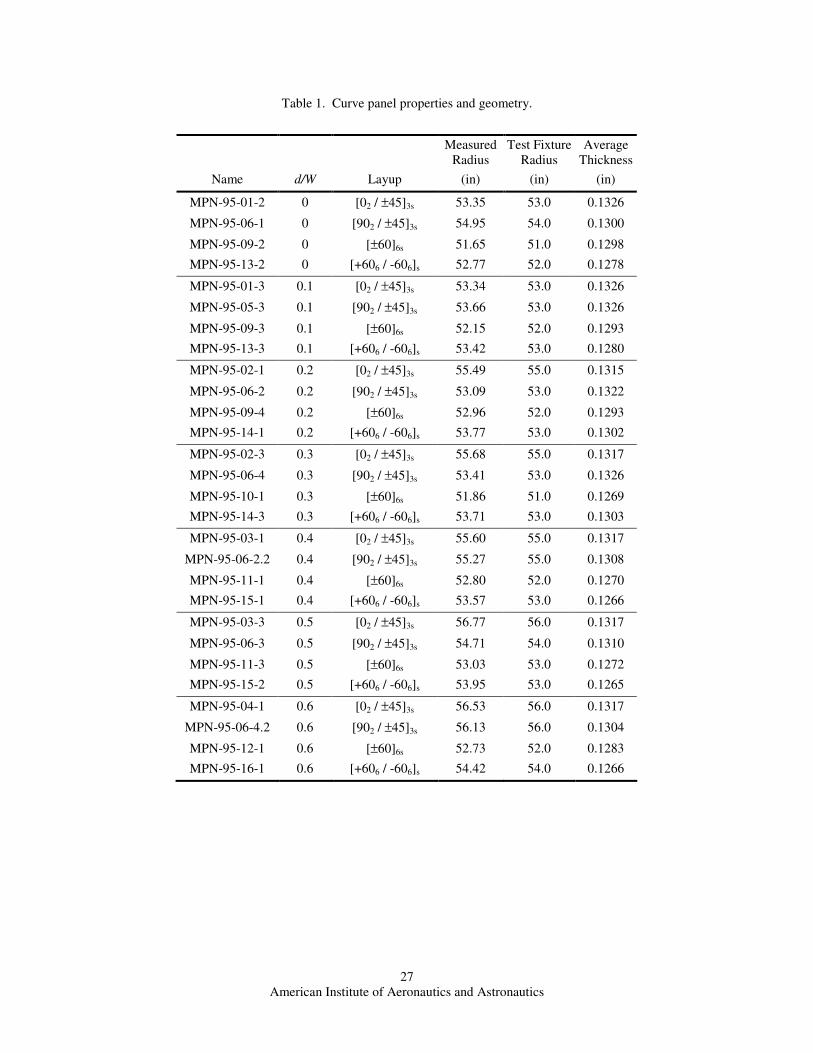
for each laminate. A summary of the panel geometry data, including the measured radius-of-curvature for each of
the panels and the test-fixture radius used during experimental testing is presented in Table 1.
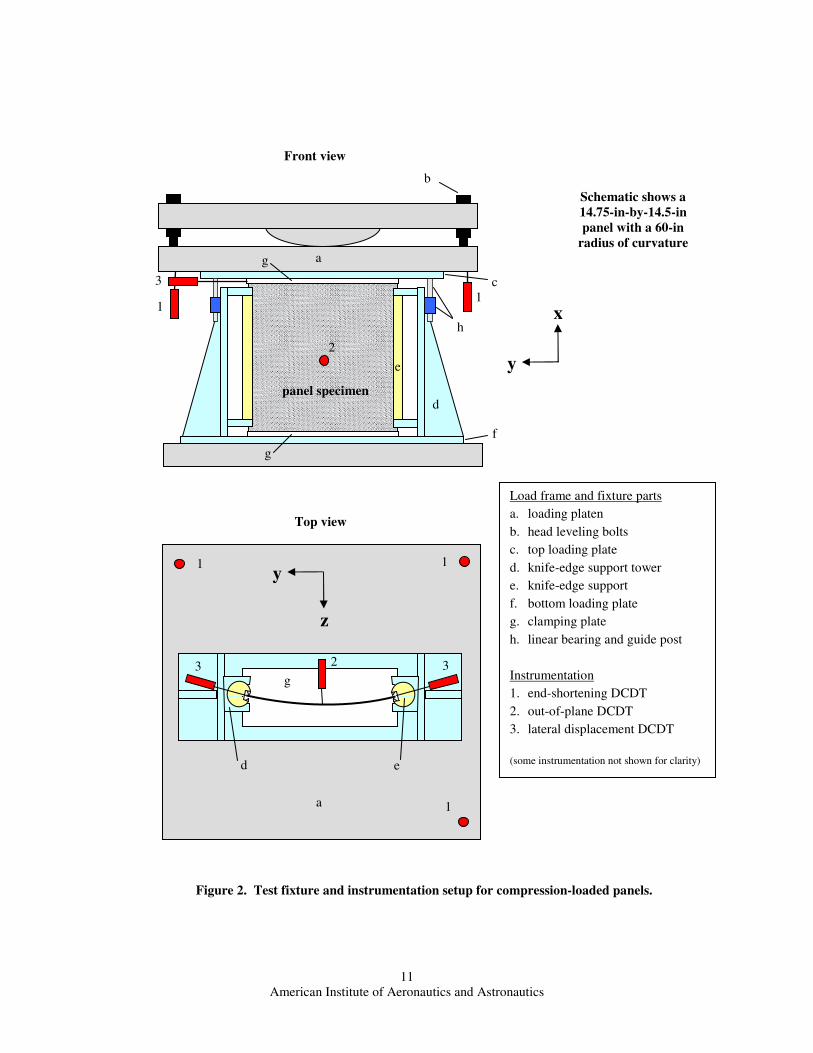
The test fixture developed for this study was designed to apply clamped boundary conditions along the curved
loaded edges (w = dw/dx = 0, Nxy = 0) and simply supported boundary conditions along the sides (w = 0, Mx = 0)
(see Fig. 2). The out-of-plane displacement is defined as w, and the inplane stress resultant and bending moment are
symbolized by N and M, respectively. The curved loaded edges of the panel were clamped between a set of 3/8-in-
thick clamping plates (g). These plates were precision machined (±0.0005 in tolerance) to hold the curved edges at a
precise radius-of-curvature and perpendicular to the loading plate. In addition, the panels were each tested with
clamping plate radii that closely matched the measured panel radii in order to minimize initial panel prestress
associated with panel-fixture geometry mismatch, as described by Hilburger et al.6 The unloaded edges of the panel
were supported by knife-edge supports (e) to simulate simply supported edges. The knife-edge supports were
mounted in fixed support towers (d) that allowed the knife edges to rotate about the loading axis and maintain
vertical alignment during testing. The clamping plates on the loaded edges of the panel and the knife-edge supports
American Institute of Aeronautics and Astronautics
3
were tightened against the panel to a finger tight condition (5-10 lb-in). The top loading plate (c) was free to move in
the loading direction, relative to the rest of the fixture, by means of a set of linear bearings and guide posts (h).
Three direct-current differential transformers (DCDTs) were used to measure the displacement of the upper
platen relative to the lower platen and one DCDT measured the out-of-plane center displacement of the panel. Two
DCDTs were used to measure the lateral displacement near the top of the panel. In addition, a three-dimensional
video image correlation system VIC-3D was used to measure the in-plane and out-of-plane panel deformations, and
the strains. VIC-3D is a commercially available displacement and strain measurement system developed by
Correlated Solutions Inc. and uses a proprietary mathematical correlation method to analyze digital image data taken
while a test specimen is subjected to load. Consecutive digital images taken during test are used to monitor changes
in a high-contrast speckle pattern applied to the surface of the specimen as the specimen is loaded. The image data
is processed to produce in-plane and out-of-plane full-field displacements and full-field in-plane surface strains.
A Coordinate Measurement Machine (CMM) was used to determine the geometric imperfection and thickness
variation for each panel specimen prior to testing. However, the resulting imperfection measurements were not as
accurate as was desired. The panels were first measured while installed in the test fixture prior to being
instrumented with strain gages. The test fixture used at that time was sized for a 60 in radius panel. The mismatch
between the panel and test fixture geometries, as described earlier, would likely result in some unknown amount of
panel deformation and prestress upon installation of the panel into the fixture. By measuring the stress free panel
shape and incorporating this data into the finite-element model, the initial test-fixture-induced deformation and
prestress of the panel prior to loading, can be simulated. Thus, the panel imperfection was subsequently remeasured
in a stress-free state by using a specially designed panel fixture. However, this second measurement occurred after
the panels had been instrumented with strain gages, and the wires severely hindered the imperfection measurement
and resulted in many erroneous data points in the imperfection where the CMM contacted a wire as opposed to the
surface of the panel. The imperfection data was filtered to remove the erroneous data values and a twenty-five term
trigonometric series was fit to the imperfection data. It was believed that five trigonometric terms in each direction
would adequately approximate the geometric imperfection since shorter wavelength terms would have less influence
on the buckling of panels with this geometry.
III. Finite-Element Model and Analysis Method
The panels presented in this study were analyzed with the STAGS (STructural Analysis of General Shells) finite-
element analysis code13
. STAGS is designed for the static and dynamic analysis of general shells and can include
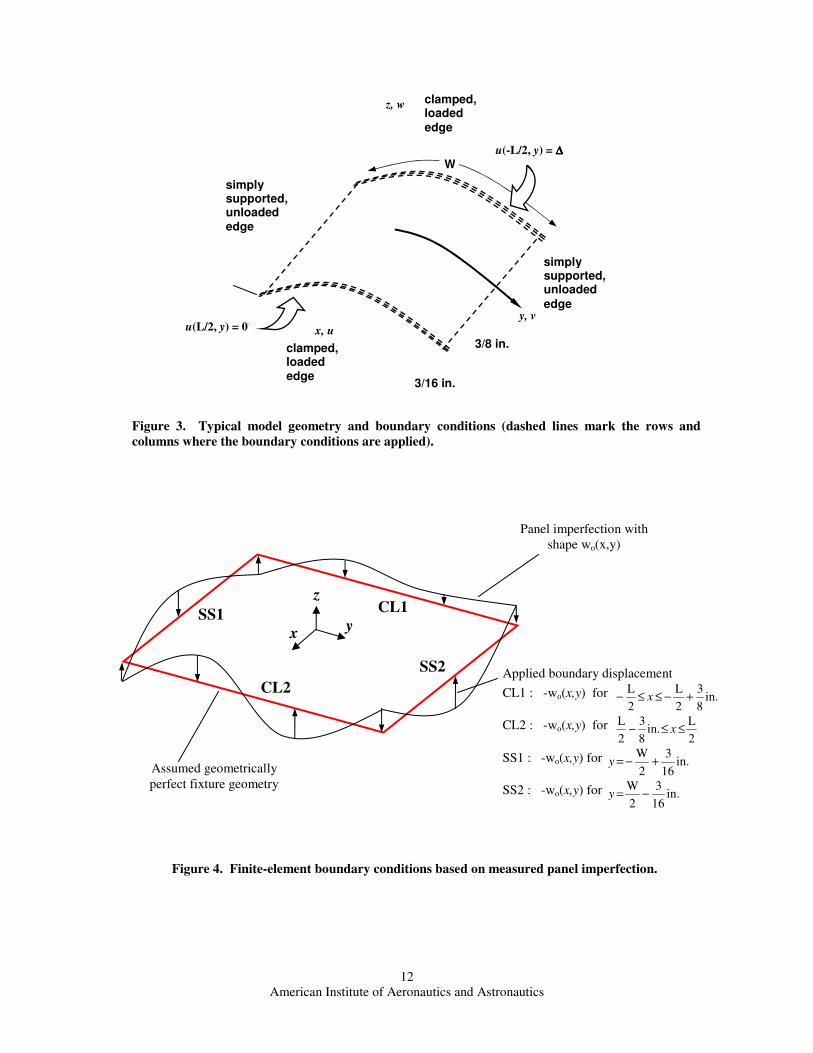
both geometric imperfections and nonuniform wall thickness in its analysis. The panel is defined by an x-y-z
curvilinear coordinate system with the origin at the center of the panel, as illustrated in Figure 3. The positive x-axis
is directed along the longitudinal axis of the panel; the z-axis is directed outward, normal to the surface of the panel
and the y-axis is circumferential coordinate. Displacements u, v and w refer to the mid-surface axial, circumferential
and out-of-plane displacements, respectively. The knife-edge-support conditions were simulated by prescribing a
displacement, w, along a line 3/16 in. from each unloaded edge of the panel and the clamped edge conditions were
applied in the boundary regions that extend 3/8 in. in from each loaded edge as shown in Figure 3. The compressive
load is introduced by applying a uniform end shortening displacement ∆ to one end of the panel while holding the
other end of the panel fixed on the boundary; that is u(-L/2, y) = ∆ and u(L/2, y) = 0.
Multiple analyses were performed for each panel to determine the effects of boundary conditions, initial
geometric imperfections and thickness variation on the compression response. Based on previous work 6,14
it was
believed that test-fixture induced friction prevented circumferential expansion of the panel where it contacted the top
and bottom loading plates. In order to verify this assertion, the panel was modeled both with a v = 0 boundary
condition and with free expansion along the top and bottom clamped edges. In addition, both geometrically perfect
panels and panels with an initial out-of-plane geometric imperfection were modeled, so that the effects of the
loaded-edge boundary condition could be differentiated from the effects caused by imperfection. Similarly, panel
analyses were conducted that considered uniform thickness and measured thickness variations. The comparison of
these results permitted determination of the significance of thickness non-uniformity on the response of this class of
curved panels. The material properties were calculated using the rule-of-mixtures based on the properties of the
graphite fibers and the epoxy matrix and assumed that the fiber volume was constant. The material properties used
in the analysis are listed in Table 2.
The measured geometric imperfections and thickness variations were included into the finite-element models by
using a user-defined imperfection subroutine, DIMP, and a user-defined shell wall property subroutine, WALL,
respectively. The test fixture support conditions along the clamped edges and knife-edges were defined by using a
user-defined load subroutine, USRLD. A USRLD subroutine was used because it provided a convenient means of
American Institute of Aeronautics and Astronautics
4
applying the displacements on the panel edges that simulate putting a geometrically imperfect panel specimen into a
more geometrically precise test fixture. More specifically, the subroutine specifies displacements on the edges of
the panel to be equal to the negative of the imperfection values of the panel associated with the four boundary
regions. Thus, the stress-free panel (initial geometry plus imperfection) is forced to conform to the geometry of the
fixture, which was assumed to be perfect (see Fig. 4). These boundary conditions are held constant throughout the
loading of the panel and the compression load is applied to the panel by enforcing a uniform end-shortening
displacement in a second load set.
IV. Experimental Results
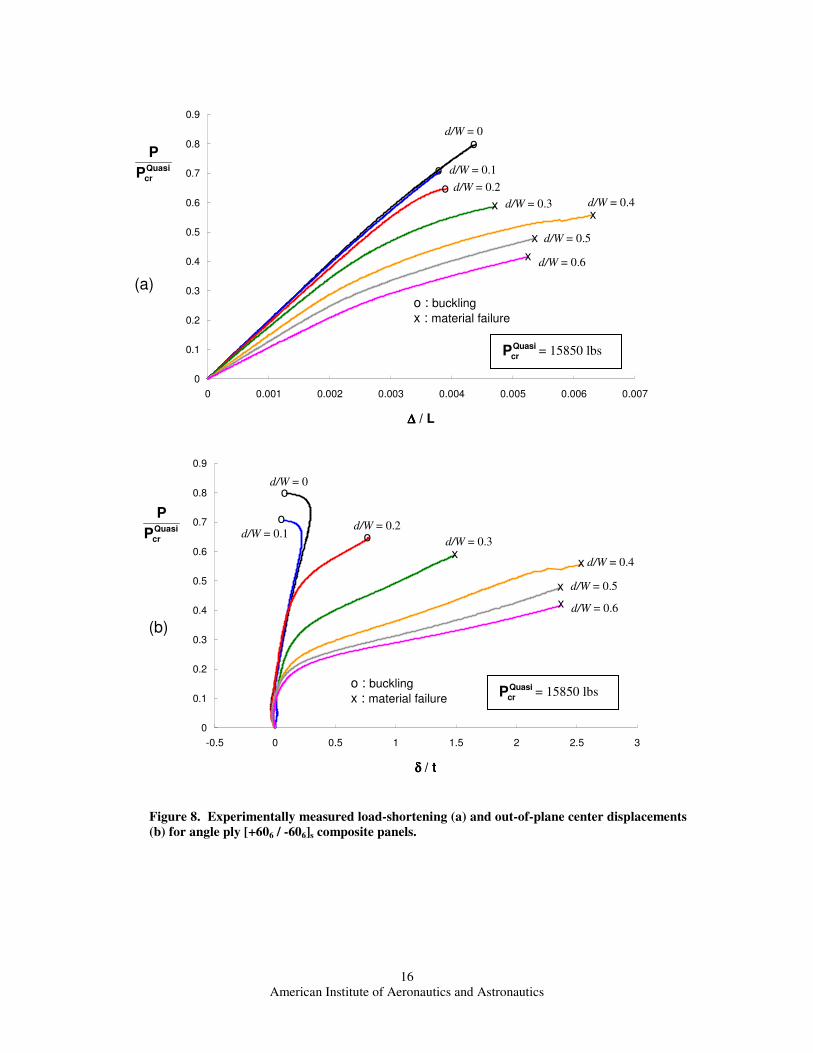
The measured load–end-shortening and load–out-of-plane-displacement response curves for all twenty-eight
panels are presented in Figures 5-8. The end-shortening ∆ is normalized by the total panel length L, and the out-of-
plane displacement δ is normalized by the panel thickness t. The out-of-plane displacement is measured at either the
center of the panel or edge of the cutout. The axial compression load P is normalized using the linear bifurcation
buckling load for the corresponding geometrically perfect quasi-isotropic [±45 / 0 / 90]3s panelQuasi
crP = 15850 lbs.
Each figure contains the results for a particular laminate stacking sequence, for each of the cutout sizes tested. The
results for the [02 / ±45]3s, [902 / ±45]3s, [±60]6s and [+606 / -606]s laminates are shown in Figs. 5, 6, 7 and 8,
respectively. Overall the compression-loaded panels exhibited two separate sets of behavior depending on the
laminate stacking sequence. The circumferentially stiff laminates (Fig. 6) and two angle-ply laminates (Fig. 7 and
8) all exhibited a similar nonlinear response trends for each of the various cutout sizes, whereas the axially stiff
laminates behaved in very different manner. Based on this observed behavior, the results for the circumferentially
stiff laminates and angle-ply laminates will be presented first, and the corresponding results for the axially stiff
laminates will discussed separately.
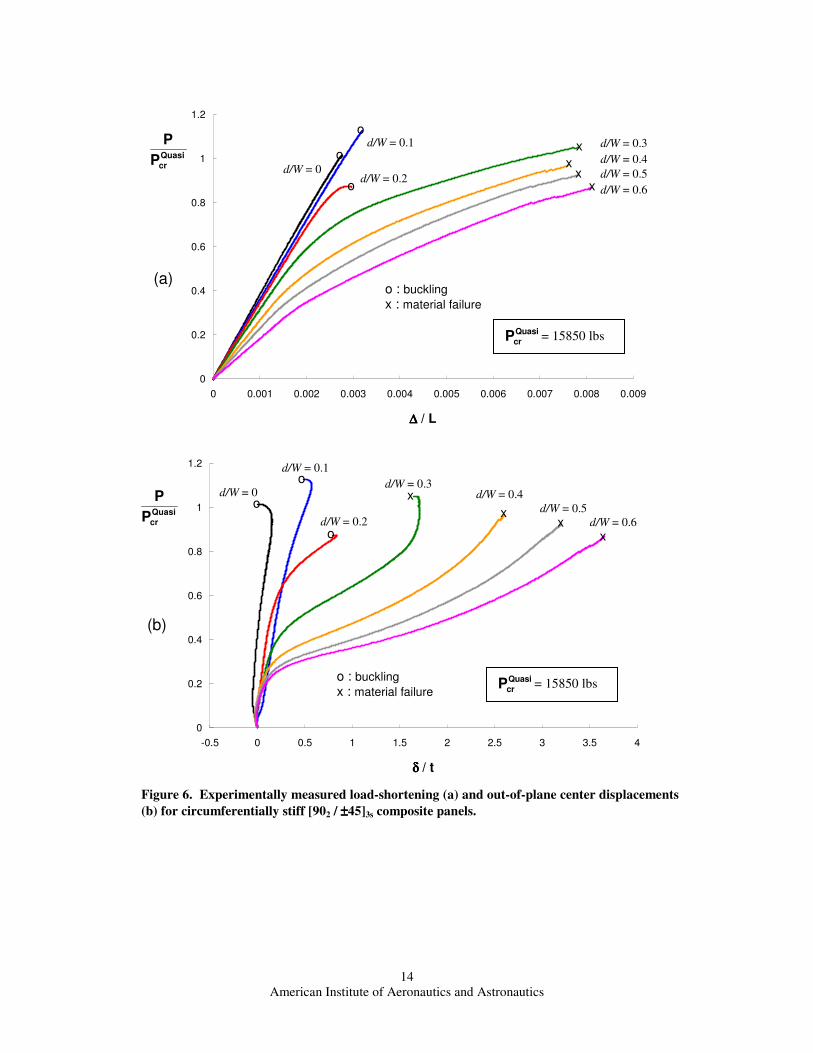
A. [902 / ±45]3s, [±60]6s and [+606 / -606]s laminates
The results indicate that the panels with no cutouts and relatively small cutouts exhibited a distinct buckling
point, marked with an open circle symbol in Figs. 6-8, followed by a dynamic inward snap-through buckling
response and a significant reduction in axial load. It should be noted that the snap-though portion of the response
curves in Figs. 5-8 are omitted for clarity. The panels all initially deformed radially outward at low load levels prior
to buckling (Figs 6(b), 7(b), and 8(b)). This outward deformation at low load levels is characteristic of compression-
loaded curved panels that are circumferentially restrained along the loaded edges. This prebuckling outward
deformation response has been shown to cause a significant increase in the buckling load, e.g., in some cases greater
than twice the predicted linear bifurcation buckling load, and a nonlinear load–end-shortening response7. In
contrast, the circumferentially stiff laminates and the two angle-ply laminates presented here do not exhibit the
nonlinear load–end-shortening response curves or large magnitude buckling loads as observed in the corresponding
quasi-isotropic panels. In general, the panels exhibited a slight decrease in the buckling load as cutout size
increased. The exception was the [902 / ±45]3s panel with a cutout size of d/W = 0.1, which had a larger buckling
load than the corresponding panel without a cutout. This difference in the response trend is attributed to differences
in the initial geometric imperfections of the panel without the cutout and panel with a d/W = 0.1. Specifically, the
panel without the cutout has an initial inward bulge and the panel with a d/W = 0.1 has a slight outward bulge. The
inward bulge in the panel will tend to promote inward radial deformations sympathetic to buckling and overall panel
softening whereas the initial outward bulge leads to initial outward deformations and an overall panel stiffening as
indicated in Fig. 6b.
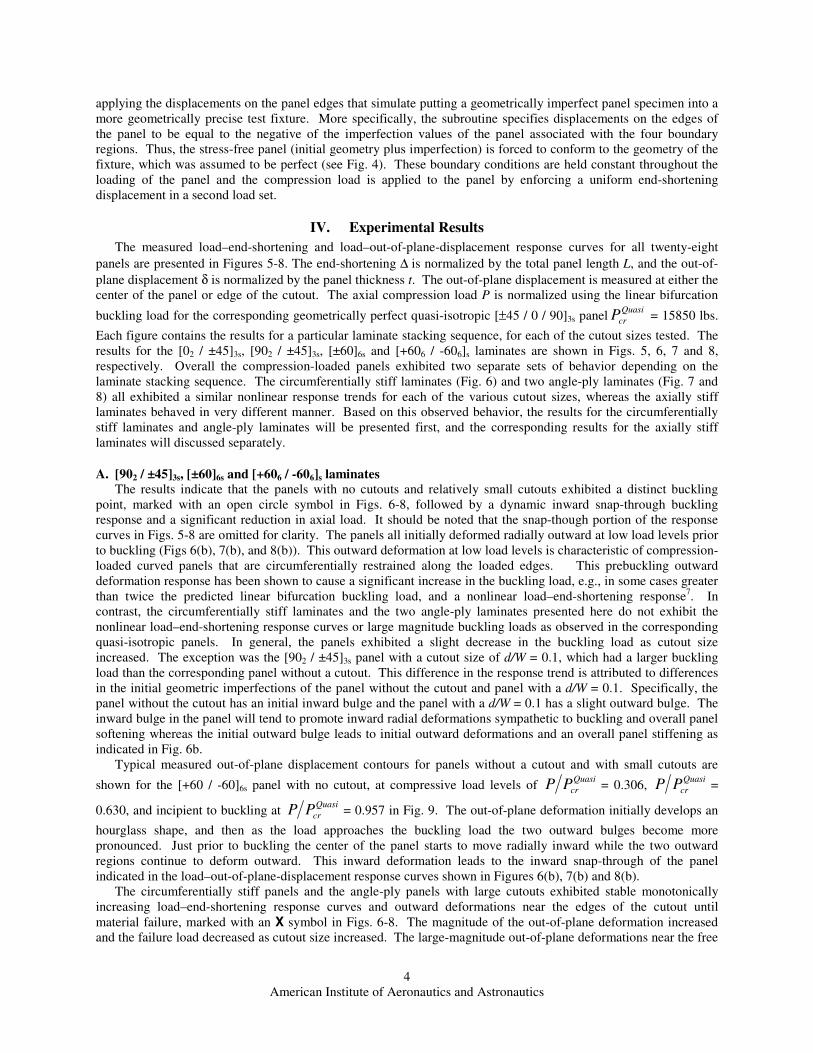
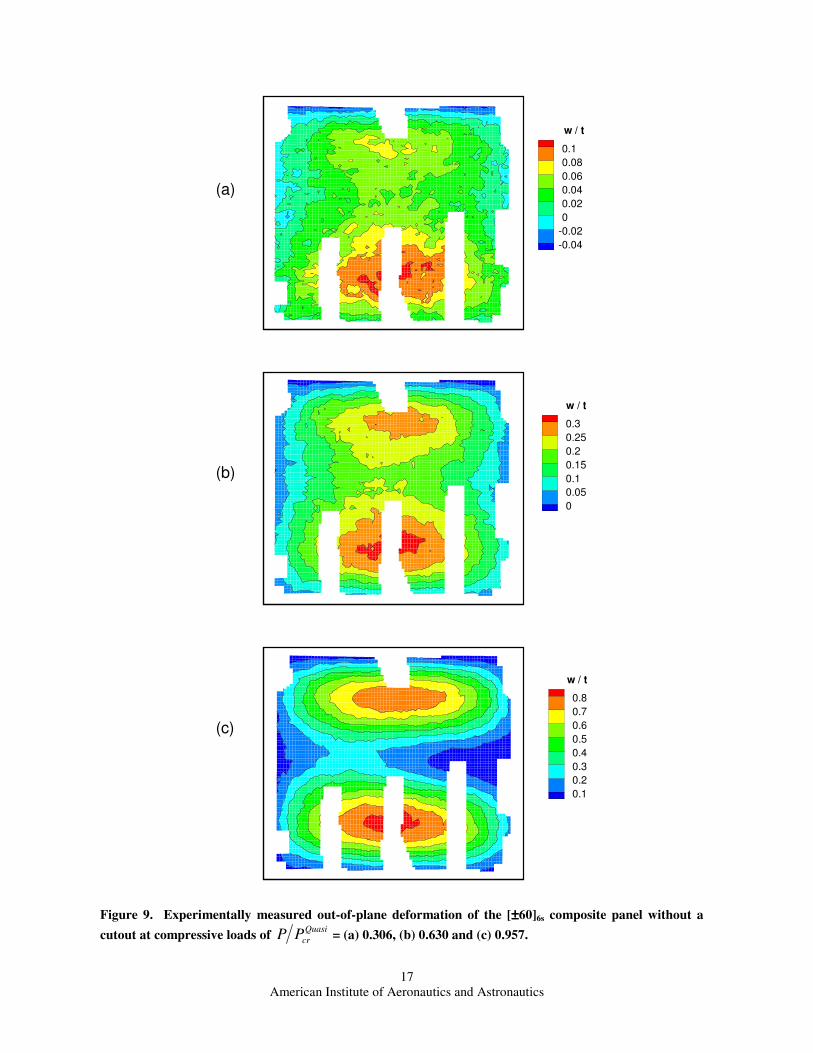
Typical measured out-of-plane displacement contours for panels without a cutout and with small cutouts are
shown for the [+60 / -60]6s panel with no cutout, at compressive load levels of Quasi
crPP = 0.306, Quasi
crPP =
0.630, and incipient to buckling at Quasi
crPP = 0.957 in Fig. 9. The out-of-plane deformation initially develops an
hourglass shape, and then as the load approaches the buckling load the two outward bulges become more
pronounced. Just prior to buckling the center of the panel starts to move radially inward while the two outward
regions continue to deform outward. This inward deformation leads to the inward snap-through of the panel
indicated in the load–out-of-plane-displacement response curves shown in Figures 6(b), 7(b) and 8(b).
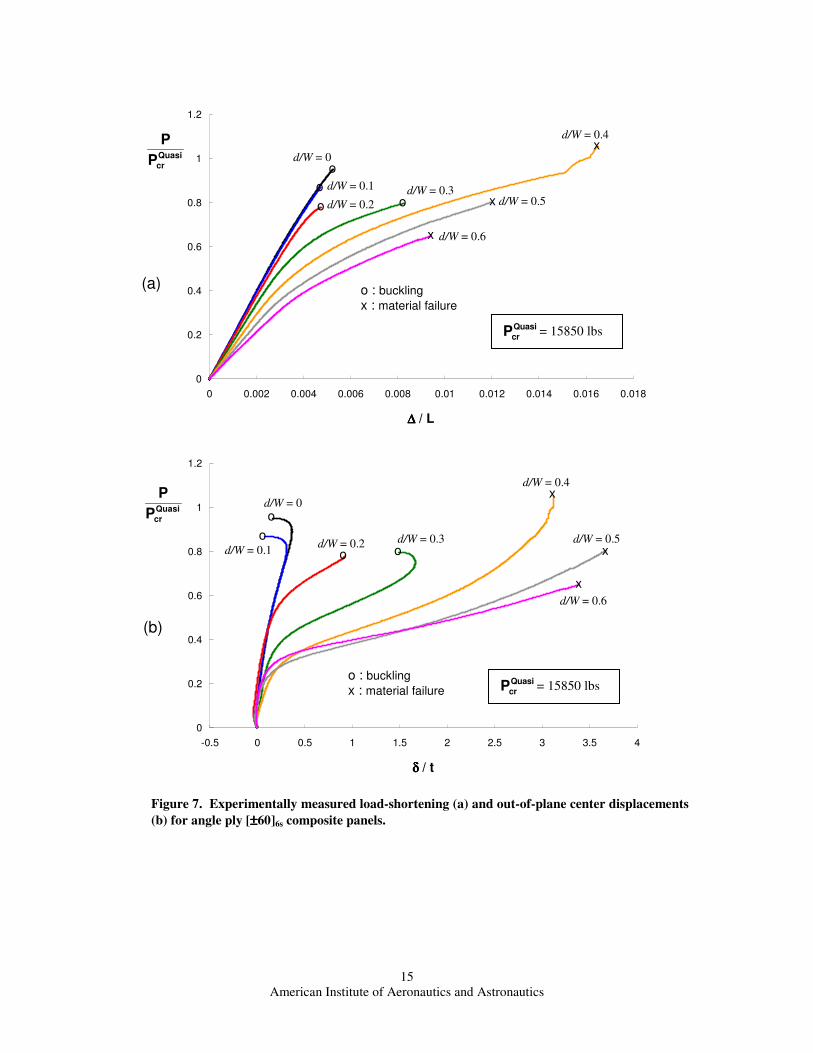
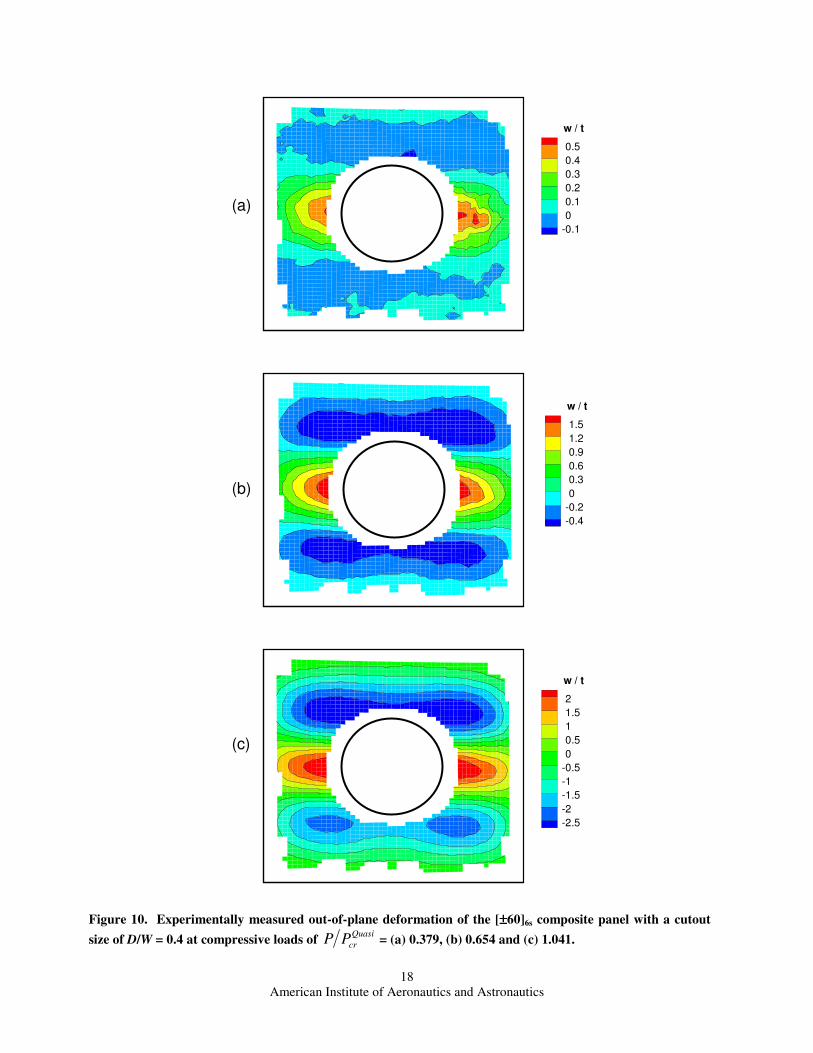
The circumferentially stiff panels and the angle-ply panels with large cutouts exhibited stable monotonically
increasing load–end-shortening response curves and outward deformations near the edges of the cutout until
material failure, marked with an X symbol in Figs. 6-8. The magnitude of the out-of-plane deformation increased
and the failure load decreased as cutout size increased. The large-magnitude out-of-plane deformations near the free
American Institute of Aeronautics and Astronautics
5
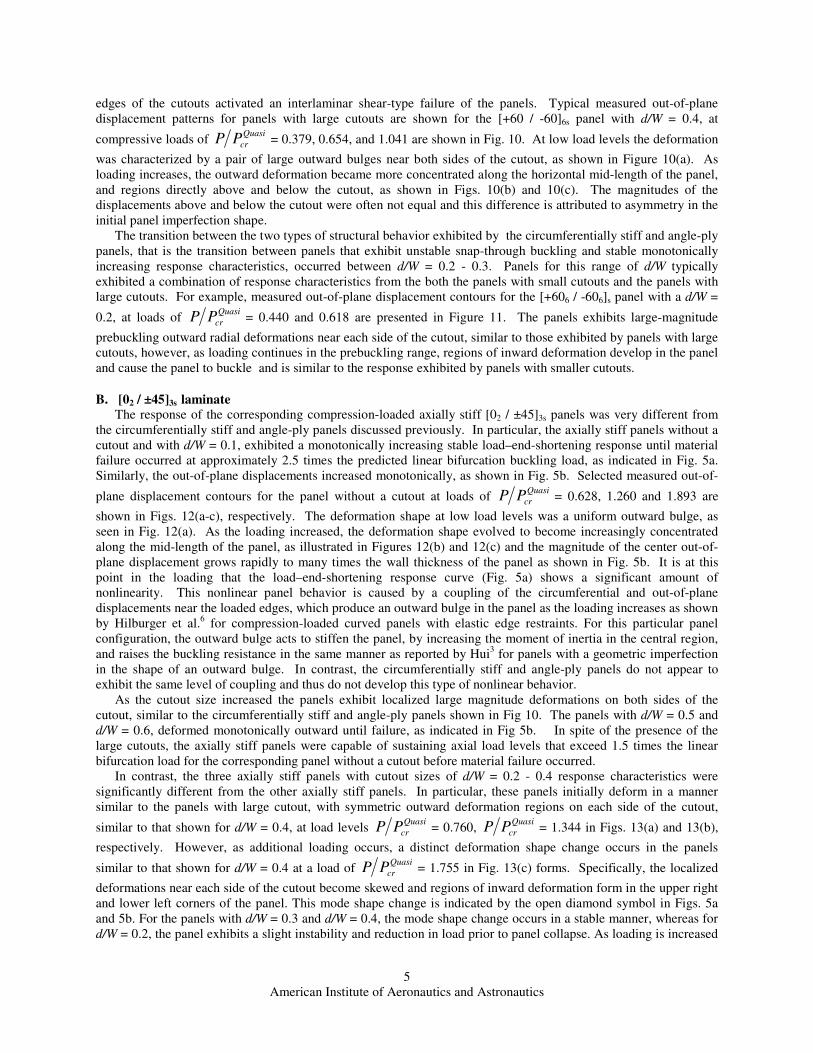
edges of the cutouts activated an interlaminar shear-type failure of the panels. Typical measured out-of-plane
displacement patterns for panels with large cutouts are shown for the [+60 / -60]6s panel with d/W = 0.4, at
compressive loads of Quasi
crPP = 0.379, 0.654, and 1.041 are shown in Fig. 10. At low load levels the deformation
was characterized by a pair of large outward bulges near both sides of the cutout, as shown in Figure 10(a). As
loading increases, the outward deformation became more concentrated along the horizontal mid-length of the panel,
and regions directly above and below the cutout, as shown in Figs. 10(b) and 10(c). The magnitudes of the
displacements above and below the cutout were often not equal and this difference is attributed to asymmetry in the
initial panel imperfection shape.
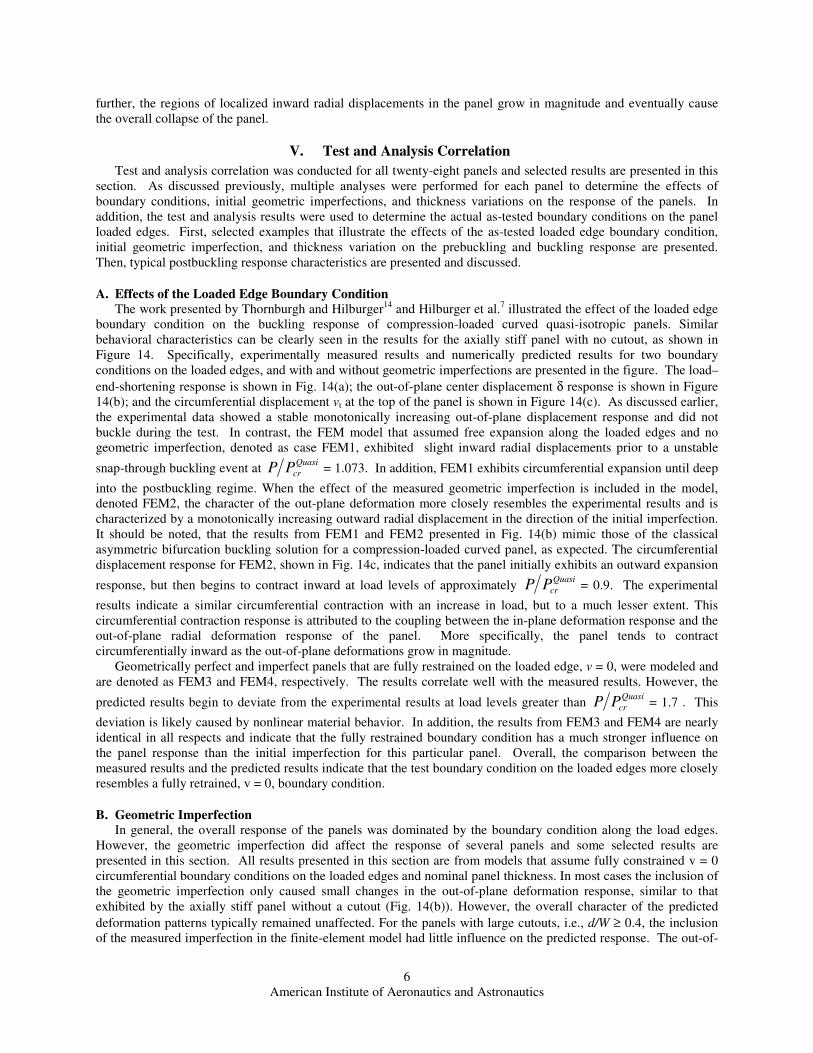
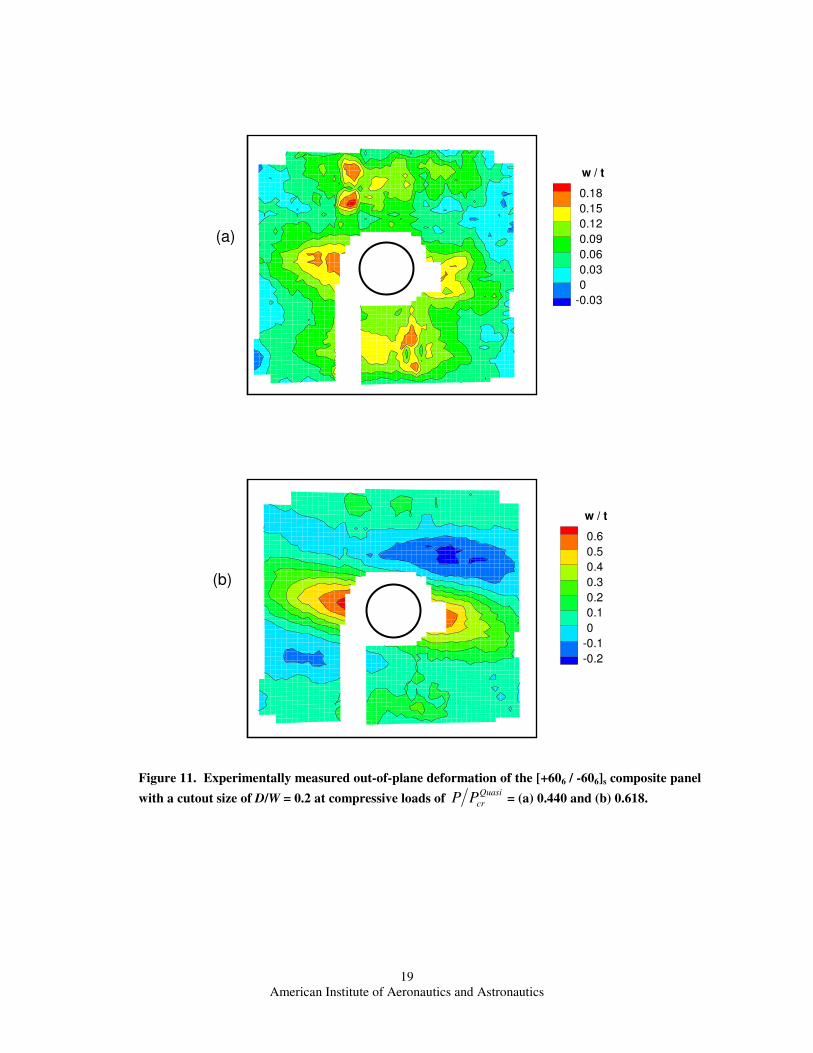
The transition between the two types of structural behavior exhibited by the circumferentially stiff and angle-ply
panels, that is the transition between panels that exhibit unstable snap-through buckling and stable monotonically
increasing response characteristics, occurred between d/W = 0.2 - 0.3. Panels for this range of d/W typically
exhibited a combination of response characteristics from the both the panels with small cutouts and the panels with
large cutouts. For example, measured out-of-plane displacement contours for the [+606 / -606]s panel with a d/W =
0.2, at loads of Quasi
crPP = 0.440 and 0.618 are presented in Figure 11. The panels exhibits large-magnitude
prebuckling outward radial deformations near each side of the cutout, similar to those exhibited by panels with large
cutouts, however, as loading continues in the prebuckling range, regions of inward deformation develop in the panel
and cause the panel to buckle and is similar to the response exhibited by panels with smaller cutouts.
B. [02 / ±45]3s laminate
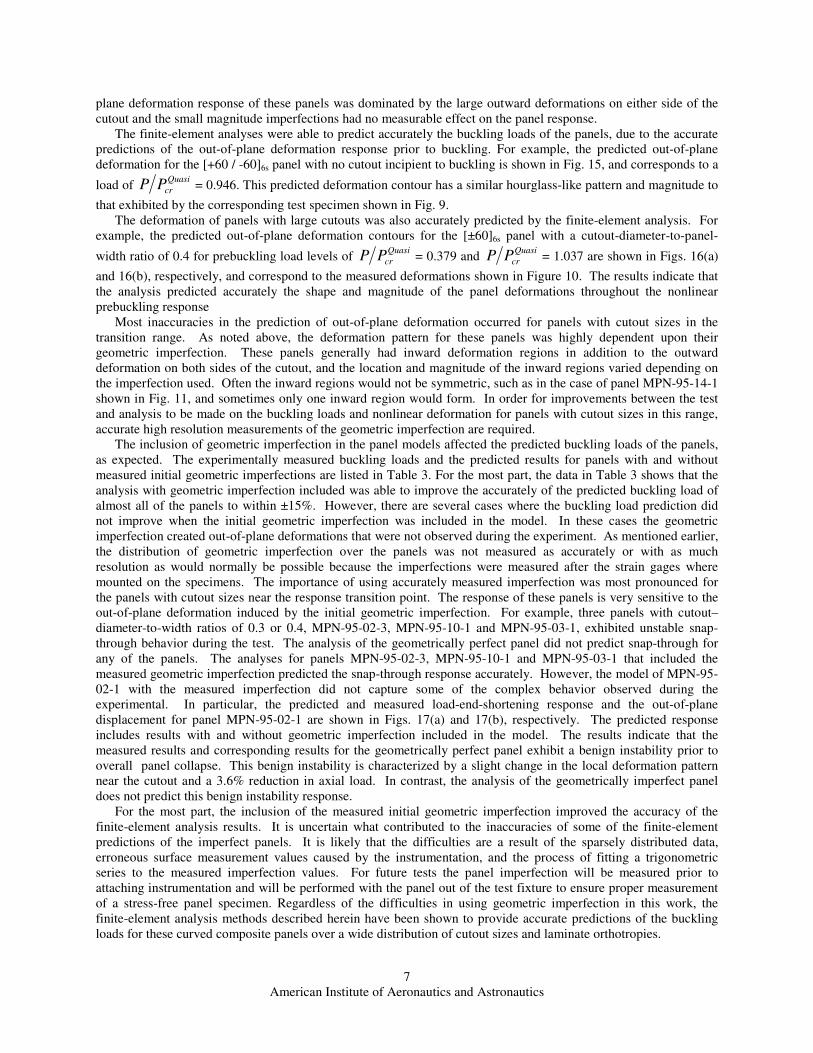
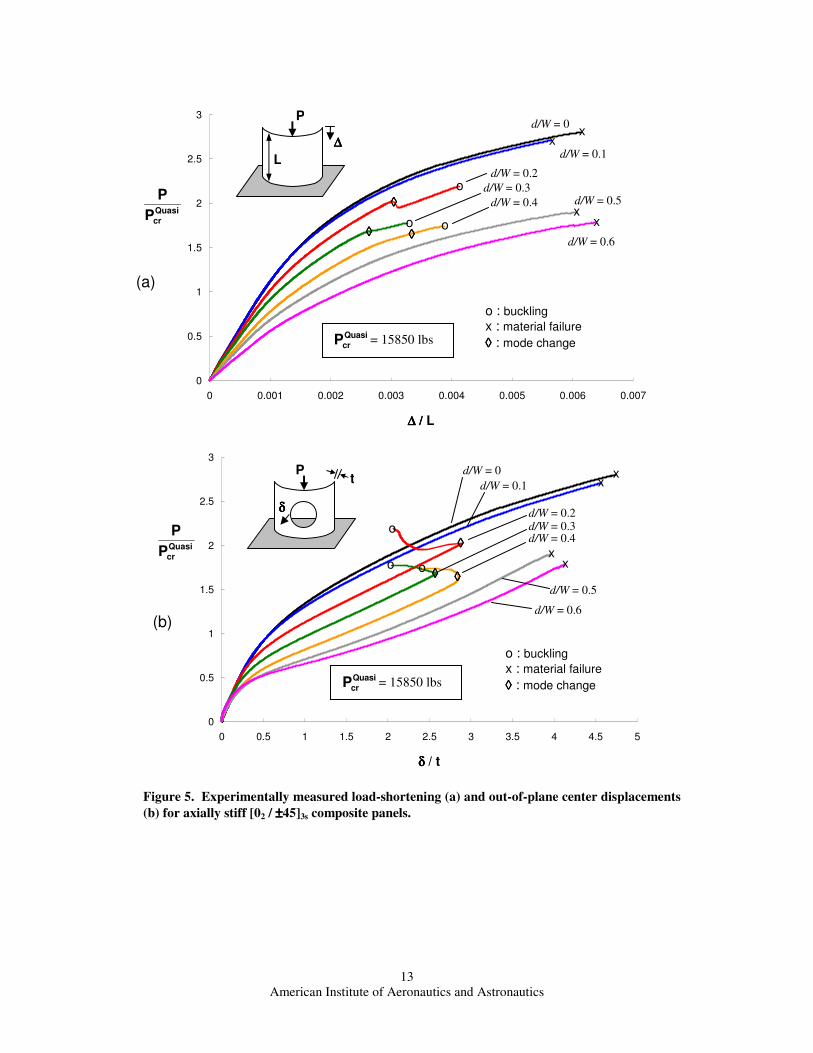
The response of the corresponding compression-loaded axially stiff [02 / ±45]3s panels was very different from
the circumferentially stiff and angle-ply panels discussed previously. In particular, the axially stiff panels without a
cutout and with d/W = 0.1, exhibited a monotonically increasing stable load–end-shortening response until material
failure occurred at approximately 2.5 times the predicted linear bifurcation buckling load, as indicated in Fig. 5a.
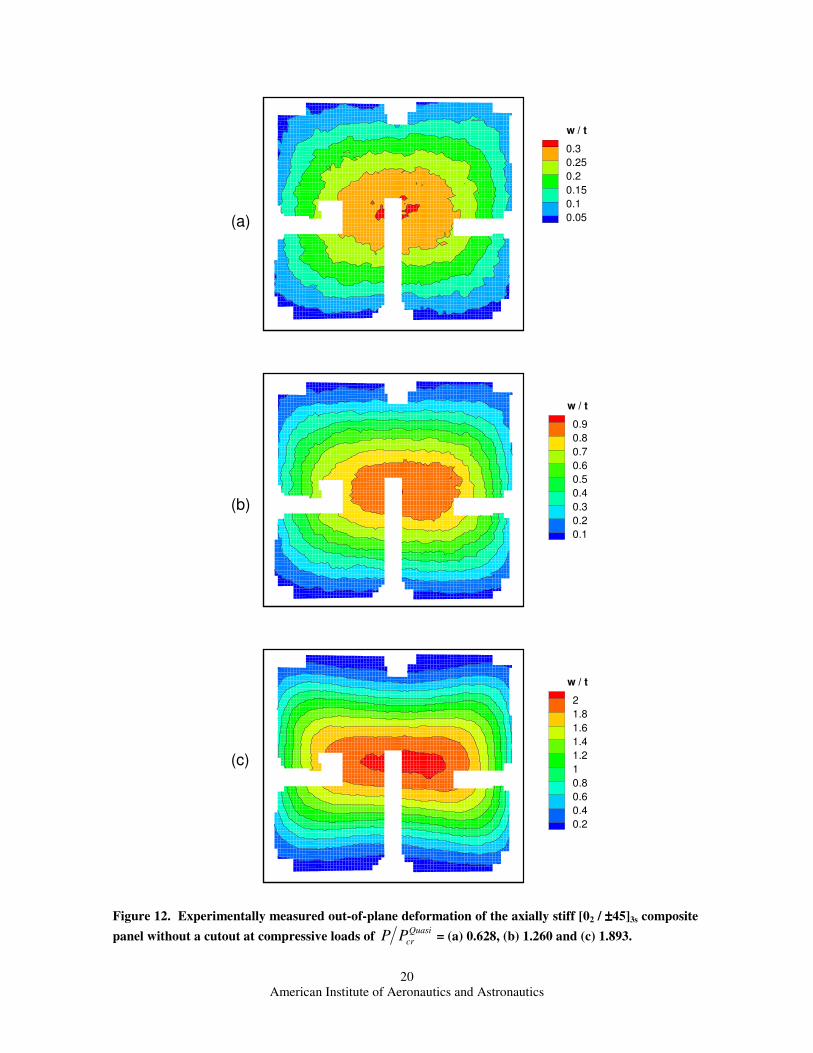
Similarly, the out-of-plane displacements increased monotonically, as shown in Fig. 5b. Selected measured out-of-
plane displacement contours for the panel without a cutout at loads of Quasi
crPP = 0.628, 1.260 and 1.893 are
shown in Figs. 12(a-c), respectively. The deformation shape at low load levels was a uniform outward bulge, as
seen in Fig. 12(a). As the loading increased, the deformation shape evolved to become increasingly concentrated
along the mid-length of the panel, as illustrated in Figures 12(b) and 12(c) and the magnitude of the center out-of-
plane displacement grows rapidly to many times the wall thickness of the panel as shown in Fig. 5b. It is at this
point in the loading that the load–end-shortening response curve (Fig. 5a) shows a significant amount of
nonlinearity. This nonlinear panel behavior is caused by a coupling of the circumferential and out-of-plane
displacements near the loaded edges, which produce an outward bulge in the panel as the loading increases as shown
by Hilburger et al.6 for compression-loaded curved panels with elastic edge restraints. For this particular panel
configuration, the outward bulge acts to stiffen the panel, by increasing the moment of inertia in the central region,
and raises the buckling resistance in the same manner as reported by Hui3 for panels with a geometric imperfection
in the shape of an outward bulge. In contrast, the circumferentially stiff and angle-ply panels do not appear to
exhibit the same level of coupling and thus do not develop this type of nonlinear behavior.
As the cutout size increased the panels exhibit localized large magnitude deformations on both sides of the
cutout, similar to the circumferentially stiff and angle-ply panels shown in Fig 10. The panels with d/W = 0.5 and
d/W = 0.6, deformed monotonically outward until failure, as indicated in Fig 5b. In spite of the presence of the
large cutouts, the axially stiff panels were capable of sustaining axial load levels that exceed 1.5 times the linear
bifurcation load for the corresponding panel without a cutout before material failure occurred.
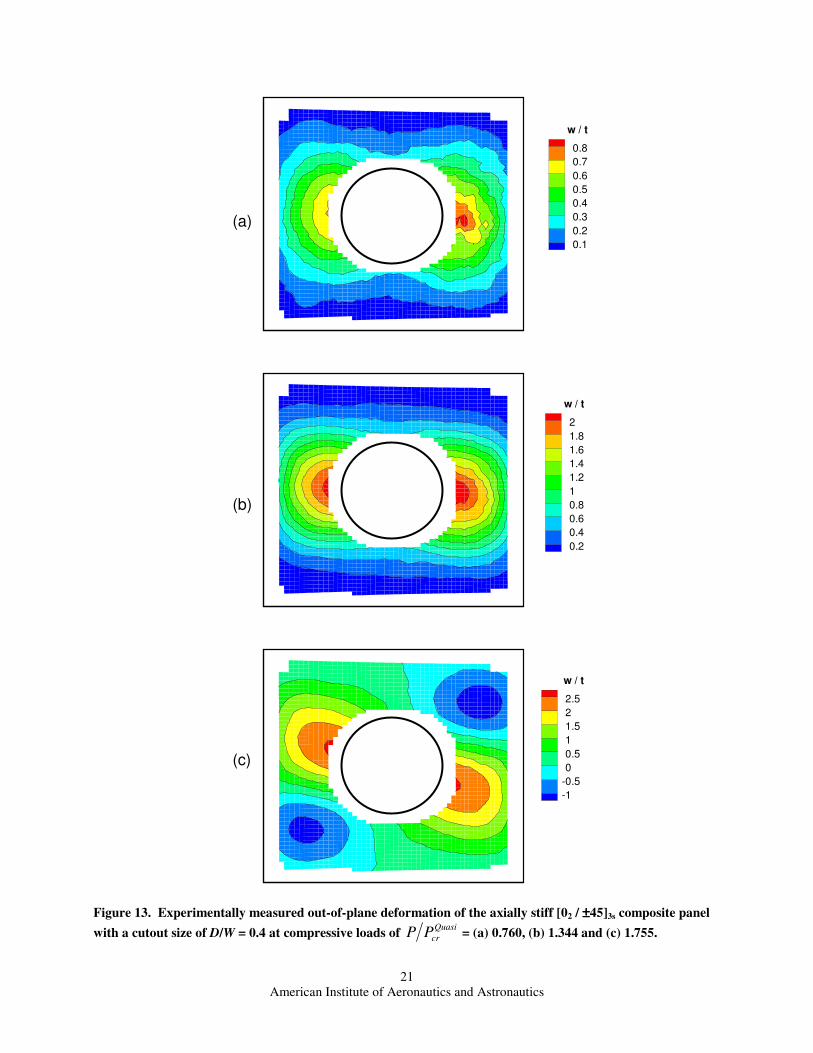
In contrast, the three axially stiff panels with cutout sizes of d/W = 0.2 - 0.4 response characteristics were
significantly different from the other axially stiff panels. In particular, these panels initially deform in a manner
similar to the panels with large cutout, with symmetric outward deformation regions on each side of the cutout,
similar to that shown for d/W = 0.4, at load levels Quasi
crPP = 0.760, Quasi
crPP = 1.344 in Figs. 13(a) and 13(b),
respectively. However, as additional loading occurs, a distinct deformation shape change occurs in the panels
similar to that shown for d/W = 0.4 at a load of Quasi
crPP = 1.755 in Fig. 13(c) forms. Specifically, the localized
deformations near each side of the cutout become skewed and regions of inward deformation form in the upper right
and lower left corners of the panel. This mode shape change is indicated by the open diamond symbol in Figs. 5a
and 5b. For the panels with d/W = 0.3 and d/W = 0.4, the mode shape change occurs in a stable manner, whereas for
d/W = 0.2, the panel exhibits a slight instability and reduction in load prior to panel collapse. As loading is increased
American Institute of Aeronautics and Astronautics
6
further, the regions of localized inward radial displacements in the panel grow in magnitude and eventually cause
the overall collapse of the panel.
V. Test and Analysis Correlation
Test and analysis correlation was conducted for all twenty-eight panels and selected results are presented in this
section. As discussed previously, multiple analyses were performed for each panel to determine the effects of
boundary conditions, initial geometric imperfections, and thickness variations on the response of the panels. In
addition, the test and analysis results were used to determine the actual as-tested boundary conditions on the panel
loaded edges. First, selected examples that illustrate the effects of the as-tested loaded edge boundary condition,
initial geometric imperfection, and thickness variation on the prebuckling and buckling response are presented.
Then, typical postbuckling response characteristics are presented and discussed.
A. Effects of the Loaded Edge Boundary Condition
The work presented by Thornburgh and Hilburger14
and Hilburger et al.7 illustrated the effect of the loaded edge
boundary condition on the buckling response of compression-loaded curved quasi-isotropic panels. Similar
behavioral characteristics can be clearly seen in the results for the axially stiff panel with no cutout, as shown in
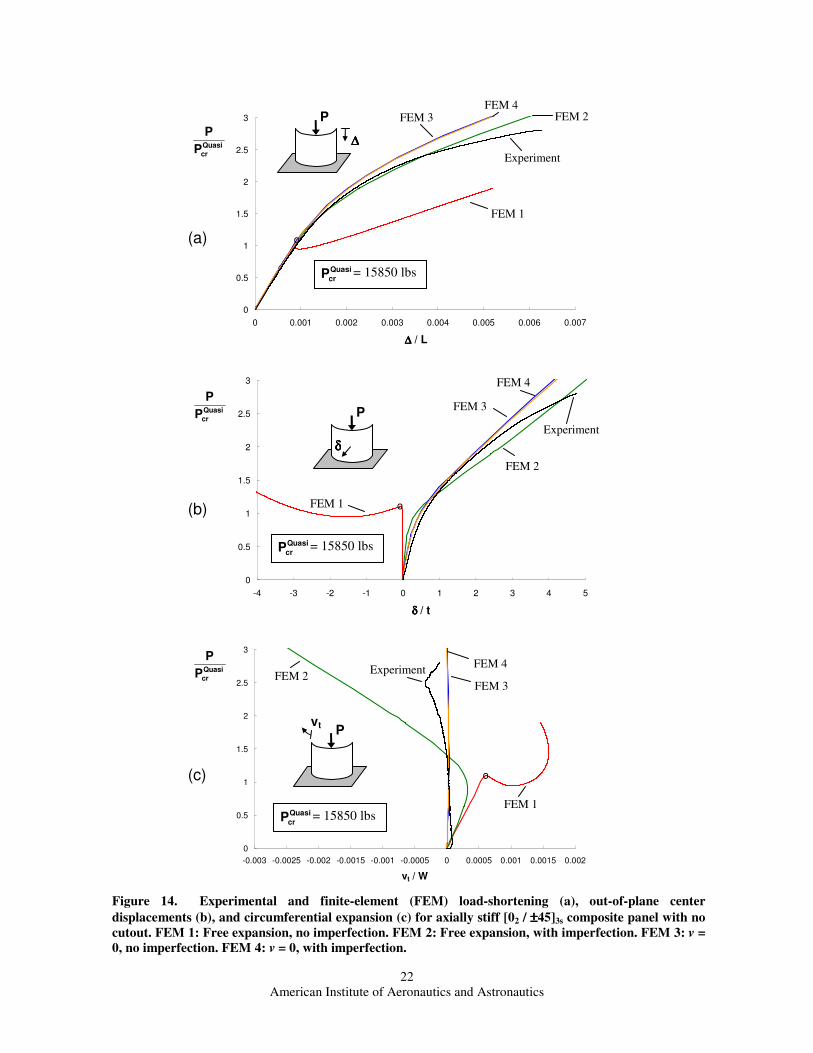
Figure 14. Specifically, experimentally measured results and numerically predicted results for two boundary
conditions on the loaded edges, and with and without geometric imperfections are presented in the figure. The load–
end-shortening response is shown in Fig. 14(a); the out-of-plane center displacement δ response is shown in Figure
14(b); and the circumferential displacement vt at the top of the panel is shown in Figure 14(c). As discussed earlier,
the experimental data showed a stable monotonically increasing out-of-plane displacement response and did not
buckle during the test. In contrast, the FEM model that assumed free expansion along the loaded edges and no
geometric imperfection, denoted as case FEM1, exhibited slight inward radial displacements prior to a unstable
snap-through buckling event at Quasi
crPP = 1.073. In addition, FEM1 exhibits circumferential expansion until deep
into the postbuckling regime. When the effect of the measured geometric imperfection is included in the model,
denoted FEM2, the character of the out-plane deformation more closely resembles the experimental results and is
characterized by a monotonically increasing outward radial displacement in the direction of the initial imperfection.
It should be noted, that the results from FEM1 and FEM2 presented in Fig. 14(b) mimic those of the classical
asymmetric bifurcation buckling solution for a compression-loaded curved panel, as expected. The circumferential
displacement response for FEM2, shown in Fig. 14c, indicates that the panel initially exhibits an outward expansion
response, but then begins to contract inward at load levels of approximately Quasi
crPP = 0.9. The experimental
results indicate a similar circumferential contraction with an increase in load, but to a much lesser extent. This
circumferential contraction response is attributed to the coupling between the in-plane deformation response and the
out-of-plane radial deformation response of the panel. More specifically, the panel tends to contract
circumferentially inward as the out-of-plane deformations grow in magnitude.
Geometrically perfect and imperfect panels that are fully restrained on the loaded edge, v = 0, were modeled and
are denoted as FEM3 and FEM4, respectively. The results correlate well with the measured results. However, the
predicted results begin to deviate from the experimental results at load levels greater than Quasi
crPP = 1.7 . This
deviation is likely caused by nonlinear material behavior. In addition, the results from FEM3 and FEM4 are nearly
identical in all respects and indicate that the fully restrained boundary condition has a much stronger influence on
the panel response than the initial imperfection for this particular panel. Overall, the comparison between the
measured results and the predicted results indicate that the test boundary condition on the loaded edges more closely
resembles a fully retrained, v = 0, boundary condition.
B. Geometric Imperfection
In general, the overall response of the panels was dominated by the boundary condition along the load edges.
However, the geometric imperfection did affect the response of several panels and some selected results are
presented in this section. All results presented in this section are from models that assume fully constrained v = 0
circumferential boundary conditions on the loaded edges and nominal panel thickness. In most cases the inclusion of
the geometric imperfection only caused small changes in the out-of-plane deformation response, similar to that
exhibited by the axially stiff panel without a cutout (Fig. 14(b)). However, the overall character of the predicted
deformation patterns typically remained unaffected. For the panels with large cutouts, i.e., d/W ≥ 0.4, the inclusion
of the measured imperfection in the finite-element model had little influence on the predicted response. The out-of-
American Institute of Aeronautics and Astronautics
7
plane deformation response of these panels was dominated by the large outward deformations on either side of the
cutout and the small magnitude imperfections had no measurable effect on the panel response.
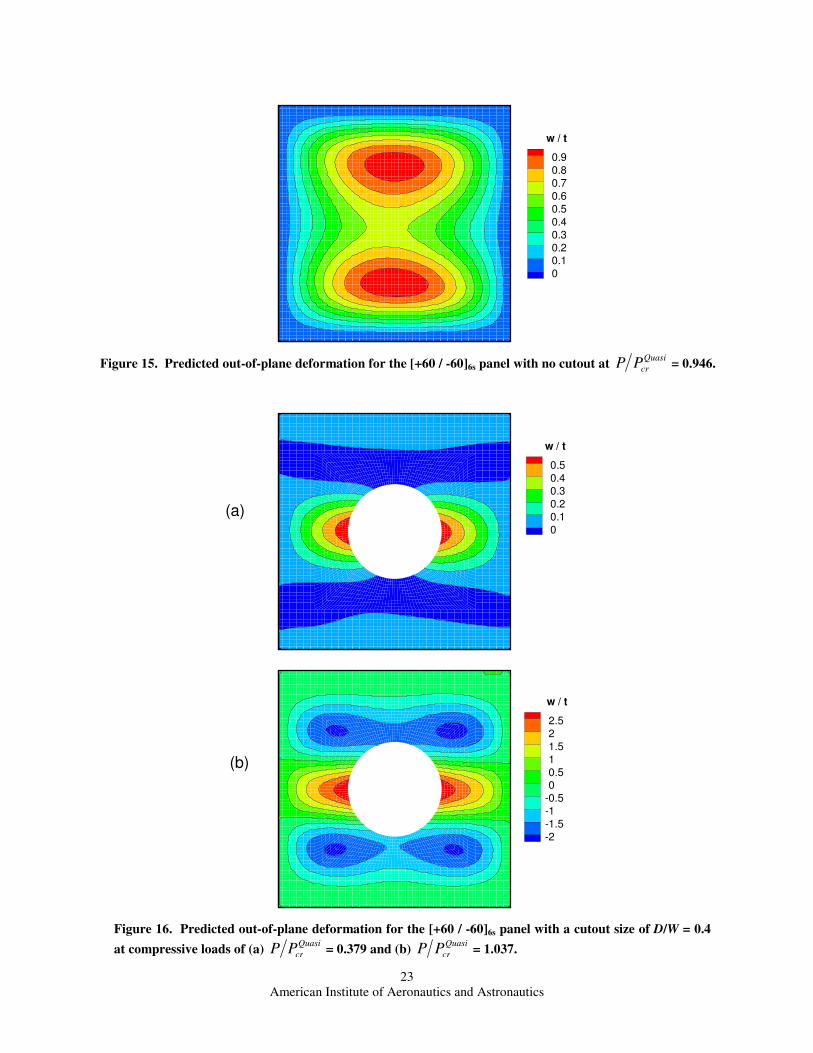
The finite-element analyses were able to predict accurately the buckling loads of the panels, due to the accurate
predictions of the out-of-plane deformation response prior to buckling. For example, the predicted out-of-plane
deformation for the [+60 / -60]6s panel with no cutout incipient to buckling is shown in Fig. 15, and corresponds to a
load of Quasi
crPP = 0.946. This predicted deformation contour has a similar hourglass-like pattern and magnitude to
that exhibited by the corresponding test specimen shown in Fig. 9.
The deformation of panels with large cutouts was also accurately predicted by the finite-element analysis. For
example, the predicted out-of-plane deformation contours for the [±60]6s panel with a cutout-diameter-to-panel-
width ratio of 0.4 for prebuckling load levels of Quasi
crPP = 0.379 and Quasi
crPP = 1.037 are shown in Figs. 16(a)
and 16(b), respectively, and correspond to the measured deformations shown in Figure 10. The results indicate that
the analysis predicted accurately the shape and magnitude of the panel deformations throughout the nonlinear
prebuckling response
Most inaccuracies in the prediction of out-of-plane deformation occurred for panels with cutout sizes in the
transition range. As noted above, the deformation pattern for these panels was highly dependent upon their
geometric imperfection. These panels generally had inward deformation regions in addition to the outward
deformation on both sides of the cutout, and the location and magnitude of the inward regions varied depending on
the imperfection used. Often the inward regions would not be symmetric, such as in the case of panel MPN-95-14-1
shown in Fig. 11, and sometimes only one inward region would form. In order for improvements between the test
and analysis to be made on the buckling loads and nonlinear deformation for panels with cutout sizes in this range,
accurate high resolution measurements of the geometric imperfection are required.
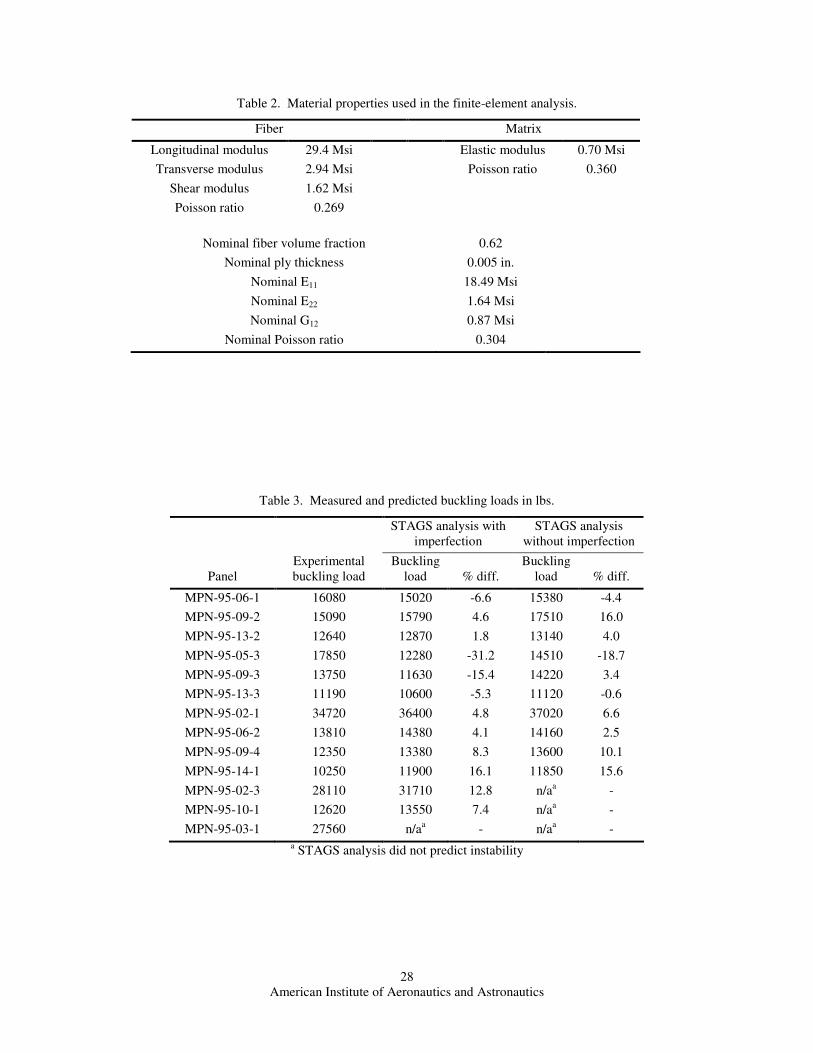
The inclusion of geometric imperfection in the panel models affected the predicted buckling loads of the panels,
as expected. The experimentally measured buckling loads and the predicted results for panels with and without
measured initial geometric imperfections are listed in Table 3. For the most part, the data in Table 3 shows that the
analysis with geometric imperfection included was able to improve the accurately of the predicted buckling load of
almost all of the panels to within ±15%. However, there are several cases where the buckling load prediction did
not improve when the initial geometric imperfection was included in the model. In these cases the geometric
imperfection created out-of-plane deformations that were not observed during the experiment. As mentioned earlier,
the distribution of geometric imperfection over the panels was not measured as accurately or with as much
resolution as would normally be possible because the imperfections were measured after the strain gages where
mounted on the specimens. The importance of using accurately measured imperfection was most pronounced for
the panels with cutout sizes near the response transition point. The response of these panels is very sensitive to the
out-of-plane deformation induced by the initial geometric imperfection. For example, three panels with cutout–
diameter-to-width ratios of 0.3 or 0.4, MPN-95-02-3, MPN-95-10-1 and MPN-95-03-1, exhibited unstable snap-
through behavior during the test. The analysis of the geometrically perfect panel did not predict snap-through for
any of the panels. The analyses for panels MPN-95-02-3, MPN-95-10-1 and MPN-95-03-1 that included the
measured geometric imperfection predicted the snap-through response accurately. However, the model of MPN-95-
02-1 with the measured imperfection did not capture some of the complex behavior observed during the
experimental. In particular, the predicted and measured load-end-shortening response and the out-of-plane
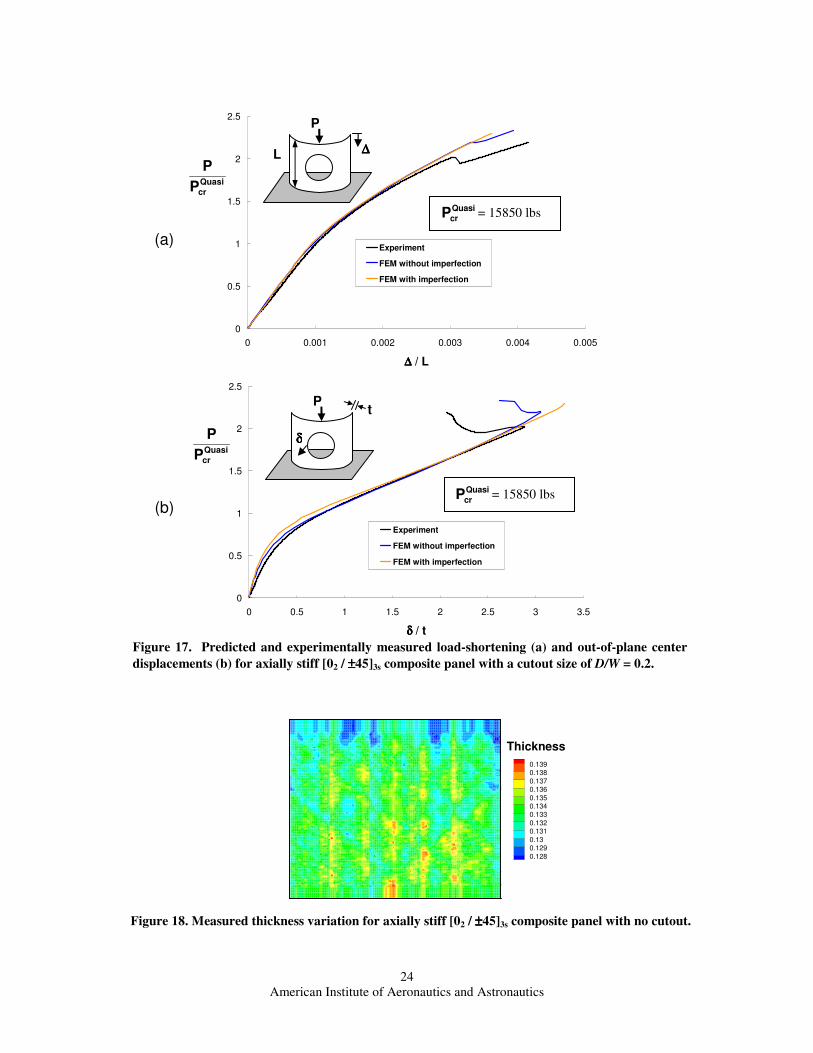
displacement for panel MPN-95-02-1 are shown in Figs. 17(a) and 17(b), respectively. The predicted response
includes results with and without geometric imperfection included in the model. The results indicate that the
measured results and corresponding results for the geometrically perfect panel exhibit a benign instability prior to
overall panel collapse. This benign instability is characterized by a slight change in the local deformation pattern
near the cutout and a 3.6% reduction in axial load. In contrast, the analysis of the geometrically imperfect panel
does not predict this benign instability response.
For the most part, the inclusion of the measured initial geometric imperfection improved the accuracy of the
finite-element analysis results. It is uncertain what contributed to the inaccuracies of some of the finite-element
predictions of the imperfect panels. It is likely that the difficulties are a result of the sparsely distributed data,
erroneous surface measurement values caused by the instrumentation, and the process of fitting a trigonometric
series to the measured imperfection values. For future tests the panel imperfection will be measured prior to
attaching instrumentation and will be performed with the panel out of the test fixture to ensure proper measurement
of a stress-free panel specimen. Regardless of the difficulties in using geometric imperfection in this work, the
finite-element analysis methods described herein have been shown to provide accurate predictions of the buckling
loads for these curved composite panels over a wide distribution of cutout sizes and laminate orthotropies.
American Institute of Aeronautics and Astronautics
8
C. Effects of Thickness Variation
A typical measured thickness profile for the panels is shown in Fig. 18 for the axially stiff panel without a
cutout. The measured thickness across the surface of all of the panels varied by about ±0.005 in. from the average
thickness. This corresponded to about a ±8 percent variation in the bending stiffness. However, in most cases the
results for the analyses that included the effects of the thickness variation were indistinguishable from the results for
the analyses that assumed uniform thickness. The reason for this insensitivity to the thickness non-uniformity is that
the deformation responses of the panels considered herein have much longer wavelengths than the wavelength of the
thickness variation. In thin-walled cylinders, for example, where the initial buckling event is more localized, the
short wave-length thickness variations of this magnitude can have a greater effect on the deformation and buckling
load.
D. Typical Postbuckling Response Characteristics
The results presented in the previous sections indicate that good correlation can be obtained when the proper
boundary conditions and the measured initial geometric imperfections are included in the finite-element model.
Subsequent analyses were conducted for each panel using these validated finite element models and the results were
used to identify typical panel response characteristics. Selected results from analyses of panels that exhibited
unstable snap-through type buckling behavior are presented in this section. Specifically, load–end-shortening
response curves, load–radial-displacement response curves, and stress and strain distributions are presented. All
results presented in this section were obtained by using finite-element models that assumed a v = 0 boundary
condition on the loaded edges (i.e., fully restrained circumferential displacement), included the measured initial
geometric imperfection, and measured thickness variation.
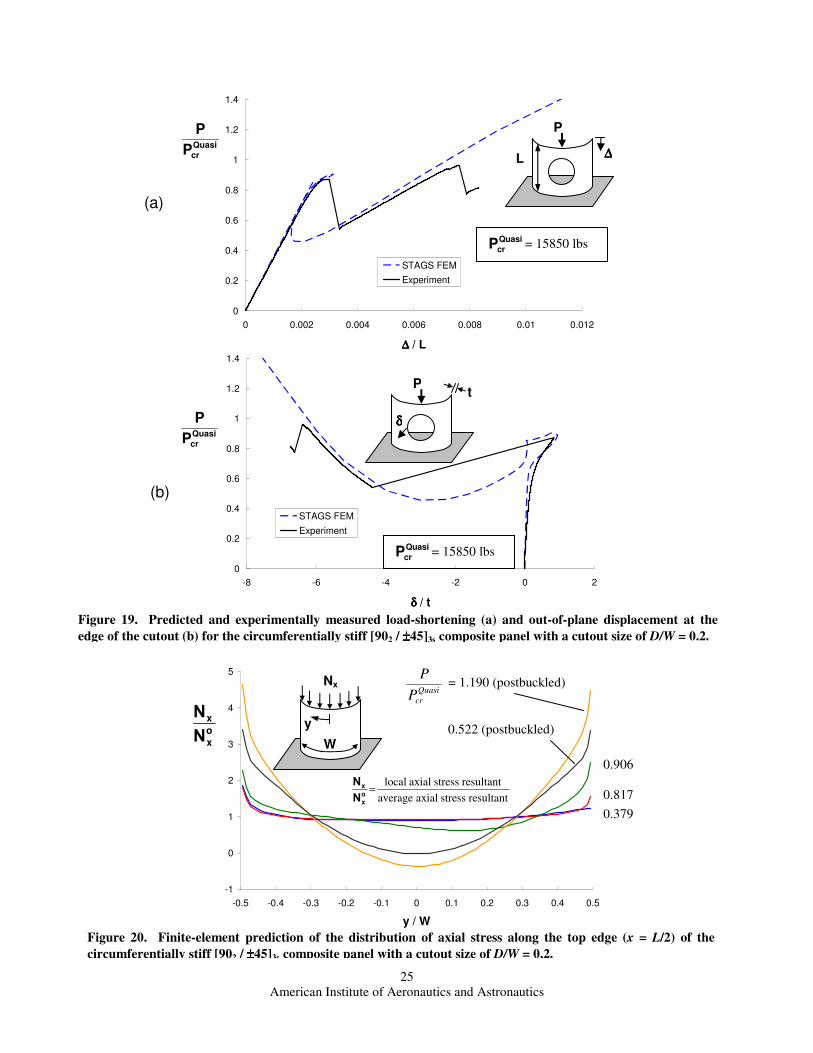
A comparison was made between the experimentally measured and numerically predicted postbuckled
deformations for the panels that exhibited a snap-through buckling event during testing and did not suffer significant
material failure. A typical example of the measured and predicted load-shortening response and the out-of-plane
displacement at the edge of the cutout are presented for the circumferentially stiff [902 / ±45]3s panel with a cutout–
diameter- to-panel-width ratio of 0.2 in Figs. 19(a) and 19(b), respectively. The results indicate that the load–end-
shortening response exhibits a nonlinear response above a load level of approximately P/Pcr = 0.8 (see Fig. 19a) and
is attributed to the rapid loss of effective axial stiffness associated with the large magnitude radial deformation
response indicated in Fig. 19b. The results also indicate that the complex nonlinear prebuckling load–end-
shortening response is predicted accurately by the finite-element analysis however, there is a slight discrepancy in
the radial deformation prediction. A portion of the observed discrepancies in the radial deformations can be
attributed to the fact that the displacement measurement is very sensitive to the location in which the measurement
was made, particularly when it is in a region of rapidly varying displacements near a discontinuity like a cutout.
Specifically, a slight shift in the displacement measurement position can cause a significant change in the measured
displacement value. The overall character of the post buckling response was also predicted accurately and indicates
inward radial deformations that are greater than six times the panel wall thickness. However, there are some slight
discrepancies in the load–end-shortening and radial displacement response. Specifically, the finite-element analysis
under predicts the end-shortening and the out-of-plane displacements by approximately 5%. Although this under
prediction in the postbuckled region was relatively small, it was typical of all of the comparisons made, and
indicated a trend rather than a random event. The exact cause of this is discrepancy is uncertain. The strains in the
postbuckled region are very large (>1%) and it is likely that there is some material nonlinearity that is being
manifested. This hypothesis is supported by the fact that panels which did not buckle also showed an under
prediction of both the out-of-plane displacements and load-shortening at large load levels. This can be seen in the
results presented for the axially stiff panel with no cutout shown in Figure 14. The radial deformation response
could also be strongly influenced by any errors in the measured thickness and lamina stiffness properties.
Another possible contributor to the under prediction of the displacements in the postbuckled region can be
observed when the axial stress resultants along the loaded edges of the panel are examined. Figure 20 shows the
finite-element analysis prediction of the axial stress resultant (Nxx) distribution along the top edge (x = L/2) of the
circumferentially stiff panel with a cutout size of d/W = 0.2. The stress resultant is normalized by the average axial
stress resultant (Nxxo = P/W) and the circumferential coordinate is normalized by the panel arc-width (W). Figure 20
shows results at prebuckling load levels of Quasi
crPP = 0.379, 0.817 and 0.906, and at postbuckling load levels of
Quasi
crPP = 0.522 and 1.190. The results show how the load is shifted away from the center of the panel towards
the edges after the panel buckles. An important characteristic to note is that, in the postbuckled region of loading,
the center of the loaded edge is under a tensile load in the finite-element model. Physically, this is not possible with
American Institute of Aeronautics and Astronautics
9
the test fixture used since the panel would simply deform away from the loading plates during the experiment. This
response phenomenon will create an error in the panel load and out-of-plane deformations predicted by the finite-
element analysis. This error in modeling could be eliminated by one of the various finite-element methods to model
the contact region between the panel and the top and bottom loading plates, but this has not been done in the present
study.
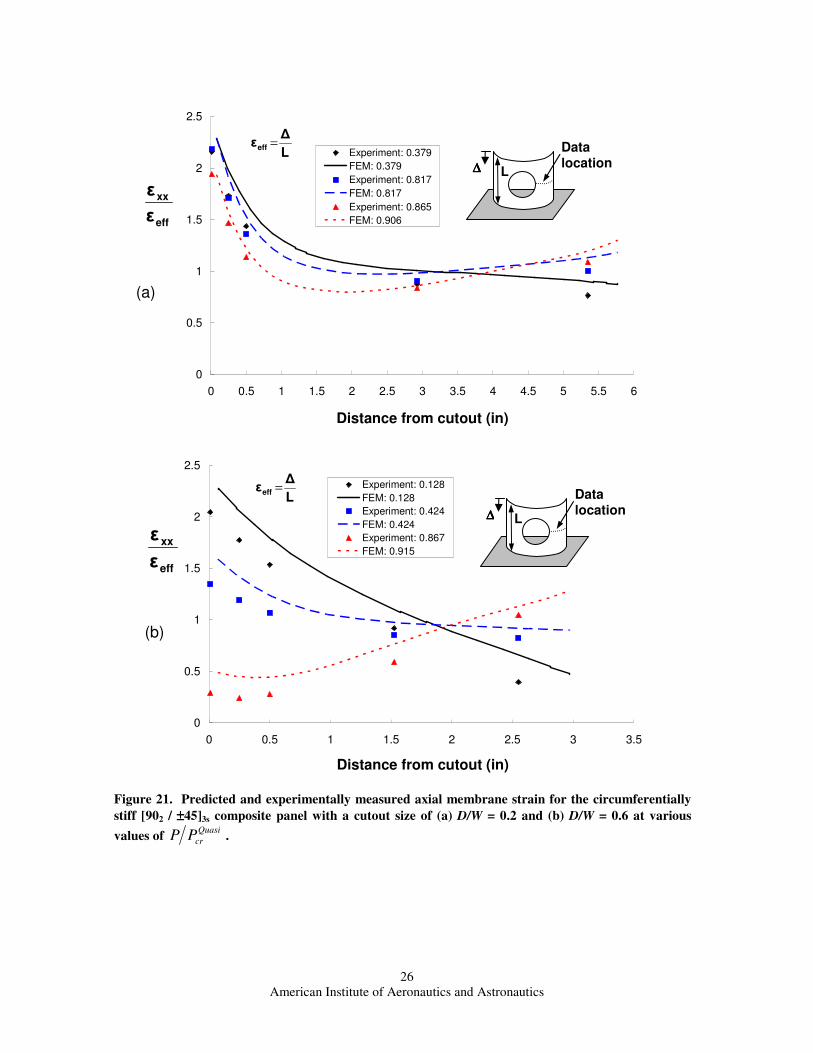
Experimentally measured and numerically predicted axial strains were compared during the investigation and
selected results for two circumferentially stiff [902 / ±45]3s panels with d/W = 0.2 and d/W = 0.6 are shown in Figs
21a and 21b, respectively. The solid lines in Fig. 21 represent the predicted axial membrane strain (εxx), and the
filled symbols represent the corresponding experimentally measured strains. The strains were obtained at the mid-
length of the panel, x = 0, and the horizontal axis in Fig. 21 indicates the circumferential distance from the edge of
the cutout. The strains have all been normalized by the effective panel strain (εxxo = ∆/L) to provide an indication of
the magnitude of the strain concentration near the cutout. The load levels being compared in Fig. 21a for d/W = 0.2
are Quasi
crPP = 0.379, 0.817, and just prior to panel buckling, that is Quasi
crPP = 0.865 for the test and Quasi
crPP =
0.906 for the analysis. The results indicate two response characteristics which were typical of all of the panels with
small cutouts, specifically, that the strain concentration near the cutout attenuates rapidly and the panel exhibits
slight redistribution of load toward the unloaded edges as loading and out-of-plane displacements increased. In
general, as the panel cutout diameter increased, the magnitude of localized bending displacements and strains near
both sides of the cutout increased and the membrane strain in that region decreased. This type of membrane strain
redistribution is typically very pronounced for panels with d/W > 0.3. For example, results for the circumferentially
stiff panel with d/W = 0.6, shown in Fig. 21(b), exhibits a factor of 4.5 reduction in local axial membrane strains
near the cutout as the local bending in panel increases.
It should be noted that in some cases the predicted strains were larger in magnitude (5-15%) than the
corresponding measured strain. Some of the observed discrepancies are attributed to the fact that the strain
measurement is very sensitive to the location in which the measurement was made particularly when it is in a region
of rapidly varying strains near a discontinuity like a cutout. Specifically, a slight shift in the strain measurement
position can cause a significant change in the measured strain value.
VI. Conclusion
Results from a numerical and experimental study on the effect of laminate orthotropy and circular cutout size on
the response of compression-loaded composite panels have been presented. Curved composite panels with four
different laminate configurations were tested with cutout diameters ranging from 10% to 60% of the panel width.
Overall the compression-loaded panels exhibited two separate types of behavior with characteristics that depended
on the laminate orthotropy. The circumferentially stiff laminates and the two angle-ply laminates with no cutouts
and relatively small cutouts (e.g. d/W = 0.1) exhibited a distinct buckling point followed by a dynamic inward snap-
through buckling response. The circumferentially stiff panels and the angle-ply panels with large cutouts exhibited a
stable monotonically increasing response characterized by large magnitude outward deformations near the edges of
the cutout. In contrast, the compression-loaded axially stiff panels with no cutout or with a cutout size of d/W = 0.1
exhibited a monotonically increasing stable response and did not buckle inward like the corresponding
circumferentially stiff and angle ply panels. However, the axially stiff panels with cutout sizes of d/W = 0.5 and d/W
= 0.6, deformed monotonically outward until failure in a manner very similar to the deformation of the other panels
with large cutouts. The three axially stiff panels with cutout sizes of d/W = 0.2, 0.3, and 0.4 exhibited an unstable
inward snap-through type buckling behavior and benign prebuckling deformation pattern changes prior to overall
buckling. Finite-element analyses were performed for each panel in order to identify the influence of specific
modeling features, such as boundary conditions, initial geometric imperfections and thickness variation, on the
accuracy of the analysis results. A comparison of the finite-element analyses with the experimental results showed
that the friction along the loaded edges prevented lateral expansion during loading and was best modeled by using a
v = 0 boundary condition along these edges. The inclusion of the measured panel thickness nonuniformity into the
finite-element analysis did not have a noticeable effect on the predicted panel response. The overall response of the
panels examined was dominated by the boundary condition along the loaded edges, and, to a lesser extent, the
measured geometric imperfection. In general, the finite-element analyses were able to predict accurately the
buckling loads of the panels and the prebuckling and postbuckling out-of-plane deformation response. However,
some discrepancies were observed for panels with intermediate sized cutouts, d/W = 0.2 and 0.3, because of an
apparent increase in imperfection sensitivity and the fact that there were errors in the measured geometric
imperfections used in the analysis models.
American Institute of Aeronautics and Astronautics
10
References 1Hilburger, M.W., and Starnes, J.H. Jr., “Effects of imperfections on the buckling response of composite shells,” Thin-Walled
Structures, Vol. 42, 2004, pp. 369-397. 2Khot, N.S., and Bauld, N.R., Jr., “A numerical and experimental investigation of the buckling behavior of composite
panels,” Computers and Structures, Vol. 15, No. 4, 1982, pp. 393-403. 3Hui, D., “Asymmetric postbuckling of symmetrically laminated cross-ply short cylindrical panels under compression,”
Composite Structures, Vol. 3, 1985, pp. 81-95. 4Snell, M.B., and Morley, N.T., “The compression buckling behaviour of highly curved panels of carbon fibre reinforced
plastic,” Proceedings of the Fifth International Conference on Composite Materials, ICCM Vol. 5, 1985, pp. 1327-1354. 5Knight, N.F., and Starnes, J.H. Jr., “Postbuckling behavior of selected graphite-epoxy cylindrical panel loaded in
compression,” Proceedings of the AIAA/ASME/ASCE/AHS 27th Structures, Structural Dynamics, and Materials Conference, San
Antonio, TX, Part 1, pp. 142-158, 1986. 6Hilburger, M.W., Nemeth, M.P., Riddick, J.C., and Thornburgh, R.P., “Compression-loaded composite panels with elastic
edge restraints and initial prestress,” NASA/TP-2005-213906, 2005. 7Hilburger, M.W., Britt, V.O., and Nemeth, M.P., “Buckling behavior of compression-loaded quasi-isotropic curved panels
with a circular cutout,” International Journal of Solids and Structures, Vol. 38, 2001, pp. 1495-1522. 8Janisse, T.C., and Palazotto, A.N., “Collapse analysis of composite panels with cutouts,” Proceedings of the
AIAA/ASME/ASCE/AHS 24th Structures, Structural Dynamics, and Materials Conference, Lake Tahoe, NV, 1983, pp. 299-309. 9Knight, N.F., and Starnes, J.H. Jr., “Postbuckling behavior of axially compressed graphite-epoxy cylindrical panels with
circular holes,” Proceedings of the 1984 ASME Joint Pressure Vessels and Piping/Applied Mechanics Conference, 1984. 10Palazotto, A.N., and Lee, C.E., “Nonlinear collapse analysis of composite cylindrical panels with small cutouts or notches,”
Proceedings of the AIAA/ASME/ASCE/AHS 25th Structures, Structural Dynamics, and Materials Conference, Palm Springs, CA,
Part 1, 1984, pp. 140-150. 11Madenci, E., and Barut, A., “Pre- and postbuckling response of curved, thin, composite panels with cutouts under
compression,” International Journal for Numerical Methods in Engineering, Vol. 37, 1994, pp. 1499-1510. 12Nemeth, M.P., and Starnes, J.H., Jr., “The NASA monographs on shell stability design recommendations: a review and
suggested improvements,” NASA/TP-1998-206290, 1998. 13Rankin, C.C., Brogan, F.A., Loden, W.A., and Cabiness, H.D., “STAGS Users Manual, Version 4.0,” Lockheed Martin
Missiles & Space Co., Inc., Advanced Technology Center, Report LMSC P032594, 2001. 14Thornburgh, R.P., and Hilburger, M.W., “Identifying and characterizing discrepancies between test and analysis results of
compression-loaded panels,” NASA/TM-2005-213932, 2005.
Circular
cutout
W
(14.5 in.)
L (14.75 in.)
d
y
x θ
Figure 1. Curve panel geometry.
American Institute of Aeronautics and Astronautics
11
Front view
Top view
Load frame and fixture parts
a. loading platen
b. head leveling bolts
c. top loading plate
d. knife-edge support tower
e. knife-edge support
f. bottom loading plate
g. clamping plate
h. linear bearing and guide post
Instrumentation
1. end-shortening DCDT
2. out-of-plane DCDT
3. lateral displacement DCDT
(some instrumentation not shown for clarity)
1 1
1
2 3 3 g
a
d e
h
a g
f
e
d
c
b
g
2
3
1 1
panel specimen
Schematic shows a
14.75-in-by-14.5-in
panel with a 60-in
radius of curvature
x
y
z
y
Figure 2. Test fixture and instrumentation setup for compression-loaded panels.
American Institute of Aeronautics and Astronautics
12
Assumed geometrically
perfect fixture geometry
Panel imperfection with
shape wo(x,y)
Applied boundary displacement
CL1 : -wo(x,y) for in.8
3
2
L
2
L+−≤≤− x
CL2 : -wo(x,y) for 2
Lin.
8
3
2
L≤≤− x
SS1 : -wo(x,y) for in.16
3
2
W+−=y
SS2 : -wo(x,y) for in.16
3
2
W−=y
x y
z CL1
CL2
SS1
SS2
W u(-L/2, y) = ∆∆∆∆
u(L/2, y) = 0
simply supported, unloaded
edge
3/16 in.
3/8 in. x, u
y, v
clamped,loaded edge
z, w
clamped,loaded edge
simply supported,unloaded edge
Figure 3. Typical model geometry and boundary conditions (dashed lines mark the rows and
columns where the boundary conditions are applied).
Figure 4. Finite-element boundary conditions based on measured panel imperfection.
American Institute of Aeronautics and Astronautics
13
0
0.5
1
1.5
2
2.5
3
0 0.001 0.002 0.003 0.004 0.005 0.006 0.007
∆ / ∆ / ∆ / ∆ / L
0
0.5
1
1.5
2
2.5
3
0 0.5 1 1.5 2 2.5 3 3.5 4 4.5 5
δδδδ / t
QuasicrP
P
QuasicrP
P
x x
x
x x
x x
x
o
o o
o
o
o
◊◊◊◊
◊◊◊◊ ◊◊◊◊
◊◊◊◊
◊◊◊◊ ◊◊◊◊
o : buckling x : material failure
◊◊◊◊ : mode change
QuasicrP = 15850 lbs
QuasicrP = 15850 lbs
o : buckling x : material failure
◊◊◊◊ : mode change
(a)
(b)
t P
δδδδ
P
∆∆∆∆
L
d/W = 0
d/W = 0.1
d/W = 0.2 d/W = 0.3
d/W = 0.4 d/W = 0.5
d/W = 0.6
d/W = 0
d/W = 0.1
d/W = 0.2 d/W = 0.3 d/W = 0.4
d/W = 0.5
d/W = 0.6
Figure 5. Experimentally measured load-shortening (a) and out-of-plane center displacements
(b) for axially stiff [02 / ±±±±45]3s composite panels.
American Institute of Aeronautics and Astronautics
14
0
0.2
0.4
0.6
0.8
1
1.2
0 0.001 0.002 0.003 0.004 0.005 0.006 0.007 0.008 0.009
∆∆∆∆ / L
0
0.2
0.4
0.6
0.8
1
1.2
-0.5 0 0.5 1 1.5 2 2.5 3 3.5 4
δδδδ / t
QuasicrP
P
QuasicrP
P
x o
o
o
x x
x
x
o
o
o x
x x
o : buckling x : material failure
o : buckling x : material failure
QuasicrP = 15850 lbs
QuasicrP = 15850 lbs
(a)
(b)
d/W = 0
d/W = 0.1
d/W = 0.2
d/W = 0.3
d/W = 0.4 d/W = 0.5
d/W = 0.6
d/W = 0
d/W = 0.1
d/W = 0.2
d/W = 0.3 d/W = 0.4
d/W = 0.5 d/W = 0.6
Figure 6. Experimentally measured load-shortening (a) and out-of-plane center displacements
(b) for circumferentially stiff [902 / ±±±±45]3s composite panels.
American Institute of Aeronautics and Astronautics
15
0
0.2
0.4
0.6
0.8
1
1.2
0 0.002 0.004 0.006 0.008 0.01 0.012 0.014 0.016 0.018
∆ ∆ ∆ ∆ / L
0
0.2
0.4
0.6
0.8
1
1.2
-0.5 0 0.5 1 1.5 2 2.5 3 3.5 4
δδδδ / t
QuasicrP
P
QuasicrP
P
x
o
x
x
o o
o
x
o x
x
o
o
o
o : buckling x : material failure
QuasicrP = 15850 lbs
o : buckling x : material failure
QuasicrP = 15850 lbs
(a)
(b)
d/W = 0
d/W = 0.1
d/W = 0.2 d/W = 0.3
d/W = 0.4
d/W = 0.5
d/W = 0.6
d/W = 0
d/W = 0.1 d/W = 0.2 d/W = 0.3
d/W = 0.4
d/W = 0.5
d/W = 0.6
Figure 7. Experimentally measured load-shortening (a) and out-of-plane center displacements
(b) for angle ply [±±±±60]6s composite panels.
American Institute of Aeronautics and Astronautics
16
0
0.1
0.2
0.3
0.4
0.5
0.6
0.7
0.8
0.9
0 0.001 0.002 0.003 0.004 0.005 0.006 0.007
∆∆∆∆ / L
0
0.1
0.2
0.3
0.4
0.5
0.6
0.7
0.8
0.9
-0.5 0 0.5 1 1.5 2 2.5 3
δδδδ / t
QuasicrP
P
QuasicrP
P
x
o
o
o
x
x
x
x
o
o
o
x
x
x
o : buckling x : material failure
QuasicrP = 15850 lbs
o : buckling x : material failure
QuasicrP = 15850 lbs
(a)
(b)
d/W = 0
d/W = 0.1
d/W = 0.2
d/W = 0.3 d/W = 0.4
d/W = 0.5
d/W = 0.6
d/W = 0
d/W = 0.1 d/W = 0.2
d/W = 0.3
d/W = 0.4
d/W = 0.5
d/W = 0.6
Figure 8. Experimentally measured load-shortening (a) and out-of-plane center displacements
(b) for angle ply [+606 / -606]s composite panels.
American Institute of Aeronautics and Astronautics
17
w / t
0.1
0.08
0.06
0.04
0.02
0
-0.02
-0.04
w / t
0.3
0.25
0.2
0.15
0.1
0.05
0
w / t
0.8
0.7
0.6
0.5
0.4
0.3
0.2
0.1
(b)
(a)
(c)
Figure 9. Experimentally measured out-of-plane deformation of the [±±±±60]6s composite panel without a
cutout at compressive loads of Quasi
crPP = (a) 0.306, (b) 0.630 and (c) 0.957.
American Institute of Aeronautics and Astronautics
18
w / t
0.5
0.4
0.3
0.2
0.1
0
-0.1
w / t
1.5
1.2
0.9
0.6
0.3
0
-0.2
-0.4
w / t
2
1.5
1
0.5
0
-0.5
-1
-1.5
-2
-2.5
(b)
(a)
(c)
Figure 10. Experimentally measured out-of-plane deformation of the [±±±±60]6s composite panel with a cutout
size of D/W = 0.4 at compressive loads of Quasi
crPP = (a) 0.379, (b) 0.654 and (c) 1.041.
American Institute of Aeronautics and Astronautics
19
w / t
0.18
0.15
0.12
0.09
0.06
0.03
0
-0.03
w / t
0.6
0.5
0.4
0.3
0.2
0.1
0
-0.1
-0.2
(b)
(a)
Figure 11. Experimentally measured out-of-plane deformation of the [+606 / -606]s composite panel
with a cutout size of D/W = 0.2 at compressive loads of Quasi
crPP = (a) 0.440 and (b) 0.618.
American Institute of Aeronautics and Astronautics
20
w / t
0.3
0.25
0.2
0.15
0.1
0.05
w / t
0.9
0.8
0.7
0.6
0.5
0.4
0.3
0.2
0.1
w / t
2
1.8
1.6
1.4
1.2
1
0.8
0.6
0.4
0.2
(b)
(a)
(c)
Figure 12. Experimentally measured out-of-plane deformation of the axially stiff [02 / ±±±±45]3s composite
panel without a cutout at compressive loads of Quasi
crPP = (a) 0.628, (b) 1.260 and (c) 1.893.
American Institute of Aeronautics and Astronautics
21
w / t
0.8
0.7
0.6
0.5
0.4
0.3
0.2
0.1
w / t
2
1.8
1.6
1.4
1.2
1
0.8
0.6
0.4
0.2
w / t
2.5
2
1.5
1
0.5
0
-0.5
-1
(b)
(a)
(c)
Figure 13. Experimentally measured out-of-plane deformation of the axially stiff [02 / ±±±±45]3s composite panel
with a cutout size of D/W = 0.4 at compressive loads of Quasi
crPP = (a) 0.760, (b) 1.344 and (c) 1.755.
American Institute of Aeronautics and Astronautics
22
0
0.5
1
1.5
2
2.5
3
0 0.001 0.002 0.003 0.004 0.005 0.006 0.007
∆∆∆∆ / L
0
0.5
1
1.5
2
2.5
3
-4 -3 -2 -1 0 1 2 3 4 5
δδδδ / t
0
0.5
1
1.5
2
2.5
3
-0.003 -0.0025 -0.002 -0.0015 -0.001 -0.0005 0 0.0005 0.001 0.0015 0.002
vt / W
(a)
(b)
(c)
Quasi
crP
P
Quasi
crP
P
Quasi
crP
P
P
δδδδ
P vt
P
∆∆∆∆
Quasi
crP = 15850 lbs
Quasi
crP = 15850 lbs
Quasi
crP = 15850 lbs
FEM 1
FEM 3 FEM 2 FEM 4
Experiment
FEM 1
FEM 3
FEM 2
FEM 4
Experiment
FEM 1
FEM 3 FEM 2
FEM 4 Experiment
o
o
o
Figure 14. Experimental and finite-element (FEM) load-shortening (a), out-of-plane center
displacements (b), and circumferential expansion (c) for axially stiff [02 / ±±±±45]3s composite panel with no
cutout. FEM 1: Free expansion, no imperfection. FEM 2: Free expansion, with imperfection. FEM 3: v =
0, no imperfection. FEM 4: v = 0, with imperfection.
American Institute of Aeronautics and Astronautics
23
w / t
0.9
0.8
0.7
0.6
0.5
0.4
0.3
0.20.1
0
w / t
0.5
0.4
0.3
0.2
0.1
0
w / t
2.5
2
1.5
1
0.50
-0.5
-1
-1.5
-2
Figure 15. Predicted out-of-plane deformation for the [+60 / -60]6s panel with no cutout at Quasi
crPP = 0.946.
(b)
(a)
Figure 16. Predicted out-of-plane deformation for the [+60 / -60]6s panel with a cutout size of D/W = 0.4
at compressive loads of (a) Quasi
crPP = 0.379 and (b) Quasi
crPP = 1.037.
American Institute of Aeronautics and Astronautics
24
0
0.5
1
1.5
2
2.5
0 0.001 0.002 0.003 0.004 0.005
∆∆∆∆ / L
Experiment
FEM without imperfection
FEM with imperfection
0
0.5
1
1.5
2
2.5
0 0.5 1 1.5 2 2.5 3 3.5
δδδδ / t
Experiment
FEM without imperfection
FEM with imperfection
0.1390.138
0.1370.136
0.1350.1340.133
0.1320.131
0.130.129
0.128
Thickness
Figure 17. Predicted and experimentally measured load-shortening (a) and out-of-plane center
displacements (b) for axially stiff [02 / ±±±±45]3s composite panel with a cutout size of D/W = 0.2.
QuasicrP
P
QuasicrP
P
(a)
(b)
t P
δδδδ
QuasicrP = 15850 lbs
QuasicrP = 15850 lbs
P
L ∆∆∆∆
Figure 18. Measured thickness variation for axially stiff [02 / ±±±±45]3s composite panel with no cutout.
American Institute of Aeronautics and Astronautics
25
0
0.2
0.4
0.6
0.8
1
1.2
1.4
0 0.002 0.004 0.006 0.008 0.01 0.012
∆∆∆∆ / L
STAGS FEM
Experiment
0
0.2
0.4
0.6
0.8
1
1.2
1.4
-8 -6 -4 -2 0 2
δδδδ / t
STAGS FEM
Experiment
-1
0
1
2
3
4
5
-0.5 -0.4 -0.3 -0.2 -0.1 0 0.1 0.2 0.3 0.4 0.5
y / W
QuasicrP
P
QuasicrP
P
(a)
(b)
t P
δδδδ
QuasicrP = 15850 lbs
QuasicrP = 15850 lbs
P
L ∆∆∆∆
ox
x
Ν
Ν
Quasi
crP
P = 1.190 (postbuckled)
0.522 (postbuckled)
0.817
0.906
0.379
resultant stress axial average
resultant stress axial local=
ox
x
Ν
Ν
Nx
y
W
Figure 19. Predicted and experimentally measured load-shortening (a) and out-of-plane displacement at the
edge of the cutout (b) for the circumferentially stiff [902 / ±±±±45]3s composite panel with a cutout size of D/W = 0.2.
Figure 20. Finite-element prediction of the distribution of axial stress along the top edge (x = L/2) of the
circumferentially stiff [902 / ±±±±45]3s composite panel with a cutout size of D/W = 0.2.
American Institute of Aeronautics and Astronautics
26
0
0.5
1
1.5
2
2.5
0 0.5 1 1.5 2 2.5 3 3.5 4 4.5 5 5.5 6
Distance from cutout (in)
Experiment: 0.379
FEM: 0.379
Experiment: 0.817
FEM: 0.817
Experiment: 0.865
FEM: 0.906
0
0.5
1
1.5
2
2.5
0 0.5 1 1.5 2 2.5 3 3.5
Distance from cutout (in)
Experiment: 0.128
FEM: 0.128
Experiment: 0.424
FEM: 0.424
Experiment: 0.867
FEM: 0.915
eff
xx
ε
ε
eff
xx
ε
ε
(a)
(b)
L
∆εeff =
L
∆εeff =
∆∆∆∆ L
Data location
∆∆∆∆ L
Data location
Figure 21. Predicted and experimentally measured axial membrane strain for the circumferentially
stiff [902 / ±±±±45]3s composite panel with a cutout size of (a) D/W = 0.2 and (b) D/W = 0.6 at various
values of Quasi
crPP .
American Institute of Aeronautics and Astronautics
27
Table 1. Curve panel properties and geometry.
Name d/W Layup
Measured
Radius
(in)
Test Fixture
Radius
(in)
Average
Thickness
(in)
MPN-95-01-2 0 [02 / ±45]3s 53.35 53.0 0.1326
MPN-95-06-1 0 [902 / ±45]3s 54.95 54.0 0.1300
MPN-95-09-2 0 [±60]6s 51.65 51.0 0.1298
MPN-95-13-2 0 [+606 / -606]s 52.77 52.0 0.1278
MPN-95-01-3 0.1 [02 / ±45]3s 53.34 53.0 0.1326
MPN-95-05-3 0.1 [902 / ±45]3s 53.66 53.0 0.1326
MPN-95-09-3 0.1 [±60]6s 52.15 52.0 0.1293
MPN-95-13-3 0.1 [+606 / -606]s 53.42 53.0 0.1280
MPN-95-02-1 0.2 [02 / ±45]3s 55.49 55.0 0.1315
MPN-95-06-2 0.2 [902 / ±45]3s 53.09 53.0 0.1322
MPN-95-09-4 0.2 [±60]6s 52.96 52.0 0.1293
MPN-95-14-1 0.2 [+606 / -606]s 53.77 53.0 0.1302
MPN-95-02-3 0.3 [02 / ±45]3s 55.68 55.0 0.1317
MPN-95-06-4 0.3 [902 / ±45]3s 53.41 53.0 0.1326
MPN-95-10-1 0.3 [±60]6s 51.86 51.0 0.1269
MPN-95-14-3 0.3 [+606 / -606]s 53.71 53.0 0.1303
MPN-95-03-1 0.4 [02 / ±45]3s 55.60 55.0 0.1317
MPN-95-06-2.2 0.4 [902 / ±45]3s 55.27 55.0 0.1308
MPN-95-11-1 0.4 [±60]6s 52.80 52.0 0.1270
MPN-95-15-1 0.4 [+606 / -606]s 53.57 53.0 0.1266
MPN-95-03-3 0.5 [02 / ±45]3s 56.77 56.0 0.1317
MPN-95-06-3 0.5 [902 / ±45]3s 54.71 54.0 0.1310
MPN-95-11-3 0.5 [±60]6s 53.03 53.0 0.1272
MPN-95-15-2 0.5 [+606 / -606]s 53.95 53.0 0.1265
MPN-95-04-1 0.6 [02 / ±45]3s 56.53 56.0 0.1317
MPN-95-06-4.2 0.6 [902 / ±45]3s 56.13 56.0 0.1304
MPN-95-12-1 0.6 [±60]6s 52.73 52.0 0.1283
MPN-95-16-1 0.6 [+606 / -606]s 54.42 54.0 0.1266
American Institute of Aeronautics and Astronautics
28
Table 2. Material properties used in the finite-element analysis.
Fiber Matrix
Longitudinal modulus 29.4 Msi Elastic modulus 0.70 Msi
Transverse modulus 2.94 Msi Poisson ratio 0.360
Shear modulus 1.62 Msi
Poisson ratio 0.269
Nominal fiber volume fraction 0.62
Nominal ply thickness 0.005 in.
Nominal E11 18.49 Msi
Nominal E22 1.64 Msi
Nominal G12 0.87 Msi
Nominal Poisson ratio 0.304
Table 3. Measured and predicted buckling loads in lbs.
STAGS analysis with
imperfection
STAGS analysis
without imperfection
Panel
Experimental
buckling load
Buckling
load % diff.
Buckling
load % diff.
MPN-95-06-1 16080 15020 -6.6 15380 -4.4
MPN-95-09-2 15090 15790 4.6 17510 16.0
MPN-95-13-2 12640 12870 1.8 13140 4.0
MPN-95-05-3 17850 12280 -31.2 14510 -18.7
MPN-95-09-3 13750 11630 -15.4 14220 3.4
MPN-95-13-3 11190 10600 -5.3 11120 -0.6
MPN-95-02-1 34720 36400 4.8 37020 6.6
MPN-95-06-2 13810 14380 4.1 14160 2.5
MPN-95-09-4 12350 13380 8.3 13600 10.1
MPN-95-14-1 10250 11900 16.1 11850 15.6
MPN-95-02-3 28110 31710 12.8 n/aa -
MPN-95-10-1 12620 13550 7.4 n/aa -
MPN-95-03-1 27560 n/aa - n/a
a -
a STAGS analysis did not predict instability