Embed Size (px)
Citation preview
A Numerical and Statistical Analysis of the Fractured Rock Aquifer System in Ploemeur, France to Quantify Local and Regional Recharge
Stacey E. Law
Thesis submitted to the faculty of the Virginia Polytechnic Institute and State University in partial fulfillment of the requirements for the degree of
Master of Science
In Geosciences
Thomas J. Burbey (Chair) Ryan M. Pollyea
Laurent Longuevergne
June 11, 2019 Blacksburg, VA
Keywords: hydrogeology, Ploemeur, vadose zone, fractured rock aquifer, recharge
Copyright © 2019, Stacey E. Law
A Numerical and Statistical Analysis of the Fractured Rock Aquifer System in Ploemeur, France to Quantify Local and Regional Recharge
Stacey E. Law
ABSTRACT
Groundwater recharge is an essential metric for understanding and protecting
groundwater resources. Quantifying this parameter remains extremely challenging due to
the uncertainties associated with the extent to which the vadose zone affects groundwater
movement and the highly heterogeneous nature of the aquifer systems being monitored.
The difficulty surrounding recharge quantification is compounded when considering a
fractured rock aquifer system, where classification and modeling is complicated by highly
complex structural geology. However, the ability to distinguish the character and geometry
of fractured rock aquifers is indispensable for quantifying recharge to evaluate sustainable
yields, as well as for implementing protective measures to manage these systems.
The primary intention of this study is to assess the hydrogeologic properties that
have led the unique recharge signals within the fractured crystalline-rock aquifer system
near Ploemeur, France. Infiltration and groundwater movement are characterized via time-
series hydraulic head and precipitation data collected at daily, monthly, yearly, and at
decadal intervals. In spite of the nearly one million cubic meters of groundwater extraction,
measured drawdowns are marginal, suggesting that local and regional recharge plays a
significant role in moderating water-level declines and raising questions as to the origins
of the substantial inflow required to sustain this complex system. A roughly two-month lag
has been observed between seasonal water level and monthly precipitation at Ploemeur,
which has previously been attributed solely to slow vertical migration of water through the
low-permeability micaschist layer to the fractured contact zone and interconnected fault.

However, results from this study suggest that a significant portion of the observed lag can
be attributed to vadose-zone processes, particularly the thickness of the vadose zone. This
investigation also reveals a recharge signal that continues throughout the calendar year,
departing from the traditional simplified concept that recharge quantity is essentially
equivalent to the value of evapotranspiration subtracted from infiltration.
A Numerical and Statistical Analysis of the Fractured Rock Aquifer System in Ploemeur, France to Quantify Local and Regional Recharge
Stacey E. Law
GENERAL AUDIENCE ABSTRACT
Groundwater recharge is the amount of water added to underground water sources,
called aquifers. This occurs as precipitation falls to the ground, moves downward through
the unsaturated subsurface, and accumulates at the top of the saturated zone, deemed the
water table. The saturated zone is so named because all pore spaces between sediment
grains or crevices in rocks are fully filled with water. Understanding groundwater recharge
is important to the protection of groundwater resources, but is hard to estimate due to the
lack of knowledge about water movement in the unsaturated zone and the uncertainties
related to the systems being studied. Aquifers forming within fractured rocks are even more
challenging to investigate, because the complex geological structures are difficult to
replicate with computer modeling. However, fractured rock aquifers are an important
groundwater resource, and understanding them is the first step in estimating recharge
within the system. Recharge estimates are used to calculate how much water can be safely
removed from the aquifer for years to come, so that the resource can remain protected.
The aim of this investigation is to assess the aquifer properties that lead to the
unique recharge signal in a fractured crystalline-rock aquifer in Ploemeur, France, where
nearly 1 million cubic meters of water have been removed each year since 1991 but water
table levels have not fallen significantly. This behavior raises questions about the water
returned to the system as recharge that is sustaining such a highly productive resource. This
site also shows a roughly two-month lag between seasonal precipitation falling and the

reflection of that precipitation recorded in the water level of the aquifer. It was previously
thought that the lag occurred because water travelled slowly through the mica-schist layer,
which has little pore space for water to move, and into the contact zone and interconnected
fault. However, this study shows instead that a majority of the lag is associated with the
unsaturated zone properties and processes, particularly thickness. This investigation also
shows recharge entering the aquifer system throughout the calendar year, a departure from
earlier studies conceptualizations.

vi
Acknowledgements
I would first like to thank my advisor, Dr. Thomas Burbey, for taking me on as both a student and a teaching assistant and providing me the opportunity to work on such an interesting and challenging project. I deeply appreciate his support and assistance in adapting a portion of this large-scale investigation to fit the scope of my time at Virginia Tech, and I will always be grateful for his classes that completely changed my opinion of MATLAB (for the better).
I am very grateful to my committee members Dr. Ryan Pollyea and Dr. Laurent Longuevergne for their invaluable feedback during my annual reviews, and for generously lending their time, expertise, and perspectives to this project.
I am appreciative of the funding and support received from the National Science Foundation and the Geosciences Department at Virginia Tech that made this work possible and supported my continued education. This department and its incredible professors, students, and administrators gave me innumerable opportunities for growth and pushed the boundaries of my personal and professional development, and for that I give all of my thanks.
Finally, my journey through grad school would not have been possible without my
support system. To Mom, Dad, and Trish, for cheering me on from up in PA and giving me the freedom and confidence to venture a little farther from home; and to my friends both in and outside of grad school, for the phone calls, hikes, and happy hours in between the hard work. Thank you for struggling and celebrating and learning alongside me – I’m thankful that I got to climb these mountains with you.

vii
Table of Contents
Abstract .............................................................................................................................. ii
General Audience Abstract ............................................................................................... iv
Acknowledgements ........................................................................................................... vi
Introduction ........................................................................................................................ 1
Recharge Mechanisms ........................................................................................... 1
Vadose Zone Processes and Properties .................................................................. 6
Fractured Rocks and Recharge .............................................................................. 9
Hydrogeologic Site Description ........................................................................... 11
Methods ............................................................................................................................ 16
Unsaturated Zone Flow Model Theory ................................................................ 16
Model Construction and Calibration .................................................................... 19
Statistical Analysis Using MATLAB .................................................................. 23
Results & Discussion ...................................................................................................... 29
Vadose Zone Thickness & Temporal Recharge Distribution .............................. 29
Spatial Distribution of Recharge .......................................................................... 33
Seasonal Recharge Quantification ....................................................................... 34
Uncertainty ........................................................................................................... 41
Conclusions ...................................................................................................................... 42
References ........................................................................................................................ 44

viii
List of Figures
Figure 1: Conceptual example of fractured flow in the context of the Ploemeur aquifer site ...................................................................................................................................... 5
Figure 2: Seasonal signals seen in precipitation (dark blue) and hydraulic head measurements at the Ploemeur site .................................................................................... 6
Figure 3: Location of the Ploemeur hydrogeological site ............................................. 12
Figure 4: Block diagram representing the details of the underlying structure and geology at the Ploemeur site .......................................................................................................... 13
Figure 5: A simple conceptual diagram of vertical unsaturated flow vs more dynamic saturated flow ................................................................................................................... 17
Figure 6: Plan view of model, showing gridded area and well locations geo-coded over a GoogleEarth satellite image of Ploemeur ...................................................................... 20
Figure 7: Displaying the average daily hydraulic head values at intervals during the
calendar year ................................................................................................................... 24
Figure 8: A mathematical conceptualization of the study site ...................................... 25
Figure 9: Distributions of the three tests run using the quantification model .............. 26
Figure 10: Highlighting the values from the model output used in calculating the monthly sums of infiltration, recharge, and ET ............................................................... 27
Figure 11: The effect of varying unsaturated zone thickness on recharge quantity ....... 30
Figure 12: Vadose thickness in January, April, August, and December (clockwise from upper left:) ....................................................................................................................... 32
Figure 13: The spatial distribution of recharge .............................................................. 34
Figure 14: Simulated measurements of infiltration, UZF recharge, and UZF ET quantities (blue, orange, and gray, respectively) ............................................................ 35
Figure 15: Plot showing the amount of simulated head change in 10 of the observation wells at Ploemeur ............................................................................................................. 36
Figure 16: Sensitivity of input parameters in relation to evapotranspiration simulation ........................................................................................................................................... 37
viii

ix
Figure 17: Locations of the wellsites used exclusively for this study (purple squares), the wellsites used exclusively in the investigation conducted by Jimenez et al., 2013 (yellow squares), and wellsites used in both studies (blue stars) ................................................. 40
ix

x
List of Tables
Table 1: Showing the input values for the Unsaturated Zone Flow package as they were entered for one year of run time ........................................................................................ 21
Table 2: Lengths of modeled time necessary for UZF recharge to attain a given cumulative quantity in cells with each of the plotted thicknesses .................................... 31
Table 3: Graph showing the total monthly simulated quantities for the indicated UZF parameters over the 36 months of simulation time .......................................................... 39
x

1
Introduction RECHARGE MECHANISMS
Groundwater recharge can be simply defined as the quantity of water
supplementing a groundwater reservoir. Recharge is the foremost constraint in qualifying
the accessibility and maintainability of groundwater resources; thus, it is crucial to
calculating sustainable yields (Ali et al., 2017). In conjunction with discharge and
groundwater flow velocities and directions, this data is used to establish groundwater
budgets in aquifer systems (Cook, 2003). Recharge can occur directly, as precipitation
infiltrates vertically through the system; or indirectly, as from runoff, preferential
accumulation in joints, ponding in topographically low areas, or leakage from surficial
water bodies (Lloyd, 1986).
While meteoric water is a common source of recharge, alternate origins include
surface water such as lakes and streams; irrigation flow; snowmelt; and urban recharge.
Lakes and streams can lose water to groundwater bodies through seepage when the water
table is lower than the surface water level; this outflow can occur throughout either the
entire bed or partial sections of bed depending on water table elevation (Winter et al.,
1998). Irrigation return flow has been observed to recharge groundwater, especially in
areas with dry seasons, as water relocated and utilized for farming re-enters the subsurface
(Mustafa et al., 2017). Shallow groundwater systems in areas with seasonal snowpack
experience a spike in recharge during spring melt times; indeed, this is the foremost
recharge stage for many catchment networks (Flerchinger et al., 1991; Sklash and
Farvolden, 1979; Rodhe, 1987). Buttle and Sami (1990) suggested that this source of
groundwater was most effective in areas with water tables as shallow as 1 meter or less
2
below the land surface. Urban recharge comprises leaks from infrastructure in place for
water supply and sewage networks, with the former responsible for the bulk of the
supplemental recharge (Lerner, 2002; H.B. Wakode et al., 2018).
Water that infiltrates at ground surface moves through the subsurface vertically as
potential recharge; it percolates towards the water table to become groundwater in the
saturated zone, where flow is both vertical and lateral (Winter et al., 1998). However,
movement specifically related to recharge can exhibit more variety, spanning from piston
flow and preferential flow paths to inter-aquifer flow and diffuse recharge. Piston flow
occurs as newer recharge from the surface downwardly displaces water that had been
formerly stored in the unsaturated zone (Hewlett and Hibbert, 1967; Zimmermann et al.,
1967; Buttle and Sami, 1990). The concept is that mass water movement is layered, with
recharge waters from different years/precipitation events stacked above one another; this
is more commonly observed in more homogenous soils (Zimmermann et al., 1967; Sukhija
et al., 2003). Preferential flow paths are often observed in aquifers set within faulted,
fractured or jointed media, resulting from interconnected fracture orientations that allow
water to flow through multiple linked channels within a lower-permeability matrix
(Gleeson et al., 2009; Pedretti et al., 2016; Roques et al., 2016; Schuite et al., 2017).
Recharge in such systems is influenced by a variety of factors, including the connectivity
and size of fracture openings (Gleeson et al., 2009; Cook, 2003). Interaquifer flow, also
described as groundwater underflow, occurs as leakage across a semi-permeable layer
separating two aquifers (Eko, 2013; Healy, 2010). This is not always strictly considered
recharge, but still falls under the umbrella term and must be taken into account as part of
the water balance of an aquifer (Lerner, 1990). Finally, diffuse recharge refers to

3
precipitation over a large spatial extent that infiltrates through the unsaturated zone to the
water table, a method that dominates humid regions (Healy, 2010).
Accurately estimating groundwater recharge is essential for proper management of
groundwater resources; however, a multitude of challenges face proper quantification of
this important process. The foremost issue is that recharge is almost impossible to directly
and completely measure, and the most precise methods for subsurface data collection are
expensive and complex (Lerner et al., 1990; Scanlon et al., 2002). Natural heterogeneity
in soil permeability, vegetation, and geologic material are overarching spatial
complications in recharge calculations, and temporal complications arise with seasonal,
decadal, or long-term climatic signals (Healy, 2010). Additionally, there are a variety of
occurrences that can influence water table fluctuations without representing true
groundwater recharge, such as air entrapment during recharge, bank-storage effects near
streams, tidal effects near oceans, pumping, and deep-well injections (Freeze and Cherry,
1979).
In an effort to combat these issues, a variety of approaches are used to quantify
groundwater recharge using more easily measured parameters, such as soil moisture
content, hydraulic head fluctuations, hydraulic conductivity, and evapotranspiration and
extinction depth (Lerner et al., 1990; Healy, 2010; Ali et al., 2017). The water table
fluctuation method is also an option, as successfully demonstrated by Lee et al. (2006).
This method involves the use of high-resolution (i.e. daily or hourly) groundwater level
data combined with numerical modelling of matric and fracture flow within the aquifer
material as a way of designing recharge models (Lee et al., 2006).

4
Errors commonly occur when estimates of precipitation and evapotranspiration
(ET) are erroneously high, a mistake that is generally noticed regarding arid and semi-arid
sites (Gee and Hillel, 1988; Sukhija, 2003). ET quantification presents a challenge because
the most frequently used methods calculate potential ET, which is the highest amount of
water that could be removed under the most favorable conditions if said amount of water
was available in the system. However, actual ET measurements are reliant on unsaturated
soil storage properties and vegetation, as opposed to the atmospheric properties that govern
potential ET, leading to higher and more common errors in ET measurement and
subsequently, recharge estimation (Freeze and Cherry, 1979). Recharge estimates based
solely on soil hydraulic conductivity and texture can also often be incorrect, as even small
changes in spatial variability of soil can produce large effects on infiltration (Freeze and
Banner, 1970; Freeze and Cherry 1979).
Fractured rock aquifer systems require particular attention, as many traditional
methods of calculating recharge do not apply due to the level of heterogeneity present.
Flow rates for aquifers in porous media are estimated by Darcy’s Law; while this method
is still technically available for fractured rock aquifers, a complication arises in the
excessive level of variability shown in the hydraulic conductivities and the anisotropy
caused by preferential fracture orientation (Cook, 2003; Farkas-Karay et al., 2015). These
preferential flow paths [Figure 1] that exist in fault-deformed fractured rock complicate the
study of recharge patterns. At the local scale, recharge in such systems is influenced by a
variety of factors, including the connectivity and size of fracture openings, topography, soil
attributes, vadose thickness, and hydraulic gradients (Harte and Winter, 1996; Gleeson et
al., 2009).

5
The aquifer system in Ploemeur, FR is unusually prolific for a crystalline aquifer,
producing exceptionally high yields (106 m3 /yr) while exhibiting remarkably small
drawdowns (~10 – 20 meters).
Figure 1.: Conceptual example of fractured flow in the context of the Ploemeur aquifer site; preferential flow paths are clustered around the contact zone (deeper flow, horizontal arrows) and the fractured fault zone (pumping area to the right, vertical arrows) Note that this image does not represent flow dynamics specific to the Ploemeur site (Modified from Jimenez et al., 2013).
These patterns occur in a structure that would normally have low storage and
permeability values, raising questions about the recharge signal that supplies the fractured
system.
We also observe a lag between precipitation events and water-table response, on
the scale of approximately two months [Figure 2]. Precisely constrained, the maximum
precipitation generally occurs on November 12th, while head values generally peak on

6
April 3rd of the year following, exhibiting a lag of 145 days. The primary objective of this
study is to evaluate the properties constraining recharge and the lag between hydraulic head
and precipitation by using numerical and statistical techniques to analyze groundwater
transport within the vadose zone and quantify seasonal recharge estimates.
Figure 2.: Seasonal signals seen in precipitation (dark blue) and hydraulic head measurements at the Ploemeur site. Wells were chosen due to similar head ranges, to best manage the scope of the y-axis scale and exhibit the lag time between maximum precipitation occurrence and subsequent reflection in the water column.
VADOSE ZONE PROPERTIES AND PROCESSES
The unsaturated zone is one of the least understood elements within the hydrologic
cycle (Gee and Hillel, 1988; Buttle and Sami, 1990). Sometimes called the vadose zone,
or the aerated zone, this expanse constitutes the zone of subsurface between land surface
and water table, which is the upper limit of the saturated zone (Haverkamp et al., 2006;

7
Bouwer, 1978; Freeze and Cherry, 1979). The variety in its natural components, ranging
from soil and rocks to air, plants, and water makes this zone highly complex, and
interactions among these various constituents must be taken into account in unsaturated
zone hydrology (Nimmo, 2005). The various scales at which vadose processes take place –
micro, macro, and megascale – add further complexity to the parameterization of
unsaturated dynamics (Haverkamp et al., 2006). The impact of vadose zone hydrology has
historically been passed off or greatly simplified, due to limited data availability or
difficulty. However, a conceptualization of unsaturated flow is essential to understanding
recharge dynamics, as the rates, timing, and patterns of aquifer recharge are controlled by
unsaturated processes and properties (Cassiani et al., 2007).
The unsaturated zone can be broken into three subsections: the upper root zone, the
intermediate zone, and the capillary fringe. The root zone tends to exist on the scale of a
few meters, and is defined by the depth reached by plant roots (Guymon, 1994;Hornberger
et al., 1998). The capillary fringe exists just above the water table, where capillary forces
draw water upward from the water table. The thickness of this zone is pore-size dependent,
with an inverse relationship existing between pore size and fringe breadth; fine-grained
materials exhibit capillary zones multiple meters in thickness, whereas coarse-grained soils
have only a centimeter or so of capillary fringe (Tolman, 1937; Guymon, 1994).
The vadose zone is the connection between surface water and groundwater, and
hosts a number of key exchanges between the subsurface, surface water, and the
atmosphere (Cassiani et al., 2007; Haverkamp et al., 2006). The unsaturated zone gains
water via infiltration of precipitation and surface water, and loses water through
evaporation, evapotranspiration, and drainage (Haverkamp et al., 2006). As water at the
8
surface infiltrates the ground, it has been shown to move at a rate that decreases with time;
any given soil has a limiting curve defining the maximum rate of infiltration vs. time. As
water accumulates, the capacity of the unsaturated zone to hold more moisture decreases,
and ultimately the rate of infiltration approaches a constant rate (Freeze and Cherry, 1979).
Evapotranspiration is a process of water removal that depends on soil moisture,
atmospheric conditions, and type of vegetation. When water is abundant, atmospheric
conditions are the limiting factor in the amount of water uptake, but rates decrease in drier
periods even if atmospheric conditions remain the same, in order to regulate the flow of
water to plant roots (Hornberger et al., 1998).
Traditional unsaturated flow theory examines two types of factors to determine
water movement: driving forces, such as gravity and matrix pressure; and material
properties, including storage and hydraulic conductivity (Nimmo, 2005; Cassiani et al.,
2007). Another essential property to vadose flow is the volumetric moisture content,
represented in equations as 𝜃 and defined as the decimal fraction "#$%&'(*+,'-)"#$%&'(,#,+$)
. In
unsaturated flow, 𝜃 is always less than the porosity. Total volume is the complete unit
volume of a soil or rock, and is comprised of the volume of the solids (Vs), water (Vw) and
air (Va) (Freeze and Cherry, 1979).
Water movement in unsaturated porous media is treated as one-dimensional vertical
flow, defined by the continuity equation
/0/,= /2
/3 (1)

9
where 𝜃 is volumetric soil water content; q is water flux, z is depth (positive downward),
and t is time. In combination with Darcy’s Law, which describes fluid flow through porous
media as:
q = -K(θ) 5657
(2)
the equation can be written as
/0/,= /
/3𝐾(𝜃)(/9
/3− 1) (3)
where h is soil water pressure head and K is hydraulic conductivity (Darcy, 1856;
Haverkamp et al., 2006). An alternative form of transient vadose flow that depends on
hydraulic soil diffusivity is based around a variation to Richards’ equation, yielding:
/0/,= /
/3𝐷(𝜃) /
/3(𝜃) (4)
This equation requires the assumption that flow is driven by water content gradients, as
opposed to potential. D(θ) is a material property dependent on soil water content, and can
be easier to measure and less variable than K(𝜃) (Childs and Collis-George, 1950; Nimmo,
2005).
FRACTURED ROCKS AND RECHARGE
Igneous and metamorphic rocks typically are not associated with high primary
porosity or permeability due to their close crystalline structure, and therefore are not ideal
10
candidates for reservoir formation. In spite of this reality, groundwater stored in crystalline
rock constitutes an essential resource, considering approximately one-third of continental
crust surface is comprised of igneous and metamorphic rock (Blatt and Jones, 1975;
Amiotte-Suchet et al., 2003; Gleeson et al., 2012). However, there is a dearth of knowledge
concerning sustainable yield from these aquifers due to the difficulty of estimation based
on the heterogeneous nature of crystalline basement. The ability of crystalline aquifers to
conduct a productive amount of water is dependent on the presence of fractures in the
system (Berkowitz, 2002; Stober and Bucher, 2006; Roques et al., 2016). Rocks
characterized by low primary porosity and permeability are more prone to brittle
deformation and therefore are better candidates for conductive fracturing. The network of
fractures must be dense and exhibit interconnectivity in order to be considered prolific; to
be classified as a ‘fractured rock aquifer’, a rock mass must demonstrate groundwater
flowing in usable quantities, a qualification which spans a range of discharge amounts
depending on the intended use of the resource (Pedretti et al., 2016; Lamur et al., 2017).
Alignment, length, spatial arrangements and density are used to geometrically classify such
fracture complexes (Pedretti et al., 2016).
Aquifers in plutonic and metamorphosed rock are typically limited to the upper ~50
m, where there is improved connectivity of fractures from jointing and weathering in
addition to increased permeability compared to lower depths affected by overburden stress
(Dewandel et al., 2012; Roques et al., 2016). Fracture connectivity is determined by
examining the ratios of the different types of fracture extinctions observed within the
system. These terminations include fractures termed ‘blind’, as they end within the rock
matrix; fractures that intersect additional fractures; and fractures that border others (Cook,
11
2003). The spatial configuration of the fractures, and thus of the flow paths, determines
the level of influence that scale exerts on the hydraulic properties. Flow in fractured media
is directed by head gradients, and is often localized within a small number of preferential
flow paths (Roques et al., 2016). Average bulk permeability values in crystalline bodies
are exceptionally small, ranging between 10-15 – 10-17 m2 (Le Borgne et al., 2007; Gleeson
et al., 2011; Schuite et al., 2017).
Greatly transmissive fractures in crystalline rock are frequently related to fault
zones, as fault movement elicits the formation of a higher-permeability fractured reservoir
within the low permeability basement (Roques et al., 2016). The term ‘fault zone’ is
considered to describe a body of rock in which permeability has been affected by fault-
driven deformation (Bense et al., 2013). The governing law of porous-media fluid flow,
Darcy’s Law, states that permeability and hydraulic gradient command subsurface flow.
Hydraulic gradients associated with fault zones are strongly influenced by recharge rates
that induce flow to follow topography, as well as anthropogenic processes such as pumping
(Bense et al., 2013). Structural components of fault zones, such as the dip of the feature,
also have a tangible impact on yield. Flat-lying or gently dipping faults and structures are
thought to be capable of providing more water resources, as they have a larger surficial
extent available for recharge (Reulleu et al., 2010).
HYDROGEOLOGIC SITE DESCRIPTION
The Ploemeur hydrogeological site is located in the southern area of the Brittany
province in France [Figure 3], a low-lying area within 15 km of the coast with no more
than 50 m of total elevation change. The site is situated within an oceanic climate, where

12
the mean precipitation is 900 mm/yr, the mean evapotranspiration demand is estimated at
750 mm/yr (Roques et al., 2018; Jimenez-Martinez et al., 2013). The region has been
shaped by a number of syntectonic granitic intrusions into the overlying micaschist
bedrock, and is located within the heavily faulted Armorican Massif. A quarter of the
Brittany region’s drinking water is supplied by groundwater sources, of which 40% is
obtained from crystalline rock aquifers (Roques et al., 2016). One such aquifer, the focus
of this study, is defined by a pair of structural features [Figure 4]; the first, a subvertical
eastward-dipping normal fault striking N20⁰, spans between 100-150m in width and is the
result of tectono-metamorphic events occurring in the Silurian and Devonian.
Figure 3.: Location of the Ploemeur hydrogeological site. Geographical context is shown to the left, while to the right lies a conceptual map of the underlying geology and structural components (Modified from Aquilina et al., 2018).
The micaschist exhibits ductile deformation, which increases in frequency towards the
contact zone due to the granitic emplacement. The contact zone itself is distinguished by

13
expanses of micaschist intruded by granite dykes (Le Borgne et al., 2006). Overlaying the
bedrock is a layer of lower permeability clayed and sandy regolith measuring from 10-30
m in thickness, with more developed weathering exhibited in the topographically low areas
near the fault zone.
Figure 4.: Block diagram representing the details of the underlying structure and geology at the Ploemeur site. The contact zone between the granite (gray + ) and overlying michaschist (blue ~ ) is shown in yellow; the subvertical normal fault and fractured fault zone is delineated between the two blocks to demonstrate tectonic movement (Modified from Schuite et al., 2015).
Localized flow is primarily restricted to this top layer due to the effective density and
connectivity of the fracture array; here, the groundwater movement is northwest-to-
southeast with a moderate hydraulic gradient of 5%. Deeper flow in the more permeable
contact zone and fractured fault zone exhibits a longer residence time (50+ years) and
preferential upward flow, as evidenced by higher hydraulic heads measured from boreholes
intersecting these structures (Aquilina et al., 2015; Roques et al., 2018). These upward
fluxes produced a natural discharge site prior to the exploitation of the aquifer (Jiminez-

14
Martinez et al., 2013). Upon installation, some wells were artesian due to these ambient
upflows from differing heads in various fractures (Le Borgne et al., 2004).
The site is uncharacteristically productive, providing for the town’s 20,000 residents
with annual withdrawal rates from pumping wells within the fault zone nearing 106 m3/yr,
or 2.88•106 L daily (Le Borgne et al., 2004). Despite the high well yield, drawdown remains
minimal at approximately 20 m (Leray et al., 2013). As part of the H+ hydrogeological
network, the area has been monitored closely since it’s discovery in 1991 via a system of
nearly fifty wells ranging from 30 m to 150 m in depth; three are pumping wells and the
remainder are observation boreholes, screened for their entire length save the first 20-40m
(Roques et al., 2018). Boreholes within a 600 m radius of the pumping wells consistently
react cursorily to deviations in pumping, even after significant lapses in time (Le Borgne
et al., 2006).
Wells at the site were preferentially drilled following the normal fault zone. Pumping
tests show that the hydraulic response of the majority of the piezometers is associated with
the normal fault zone, while the easternmost piezometers reflect properties of the contact
zone. In the contact zone, hydraulic head variations occur more quickly and exhibit less
drawdown than those in the fault zone. Calculations estimate that the generalized
transmissivity of the contact zone is likely double that of the fractured fault zone, and with
a corresponding storage coefficient that is between 2-7 times smaller.
These variations in hydraulic properties can be interpreted as differences in fracture
density or fracture aperture, such that the properties of the fault zone suggest densely
fractured area with relatively small apertures and the higher transmissivity of the contact
zone suggests a more sparsely fractured area with larger apertures (Le Borgne et al., 2004).

15
The overall transmissivity of the site is comparatively higher than similar rocks in the
province, on the scale of 86,400 L/day (Le Borgne et al., 2007). High transmissivity zones,
indicative of strong interconnectivity of fractures acting as preferential flow paths, connect
across distances of over 150 m at the Ploemeur site (Le Borgne et al., 2006).

16
Methods UNSATURATED ZONE FLOW MODEL THEORY
The purpose of applying a vadose zone model is to determine contribution of the
time lag between precipitation and the hydraulic head response attributed to percolation of
water through the unsaturated zone. The goal of this model is to examine the seasonal
recharge signal in relation to the thickness of the vadose zone by applying time-series
precipitation, ET, and head data from the Ploemeur site. We systematically work to
understand the impact of the hydromechanical properties within the Ploemeur system,
beginning with an analysis of groundwater transport within the vadose zone. Model
construction involved using the Unsaturated Zone Flow (UZF1) and the Time-Variant
Specified-Head (CHD) packages in MODFLOW-2005 with ModelMuse (Niswonger et
al., 2006; Winston, R.B., 2009; Niswonger et al., 2011). MODFLOW utilizes the finite-
difference method by which the aquifer system is divided into cells by a grid of user-
specified size; applied to those cells are user-designated hydraulic properties. This project
largely involved forward modeling, which implements field observations as input
parameters in order to model groundwater movement.
The UZF1 package was chosen for its ability to simulate water flow and storage in
the unsaturated zone, allowing for determination of the extent to which the unsaturated
zone influences water movement physically and temporally. This package works by using
a kinematic wave approximation to Richard’s equation as solved by the method of
characteristics to represent the vertical movement of unsaturated flow, shown in [Figure 5]
(Niswonger et al., 2006). Richard’s equation is simplified in this package to:
/0/,= /
/3𝐷 𝜃 /0
/3− 𝐾(𝜃) − 𝑖 , (5)
17
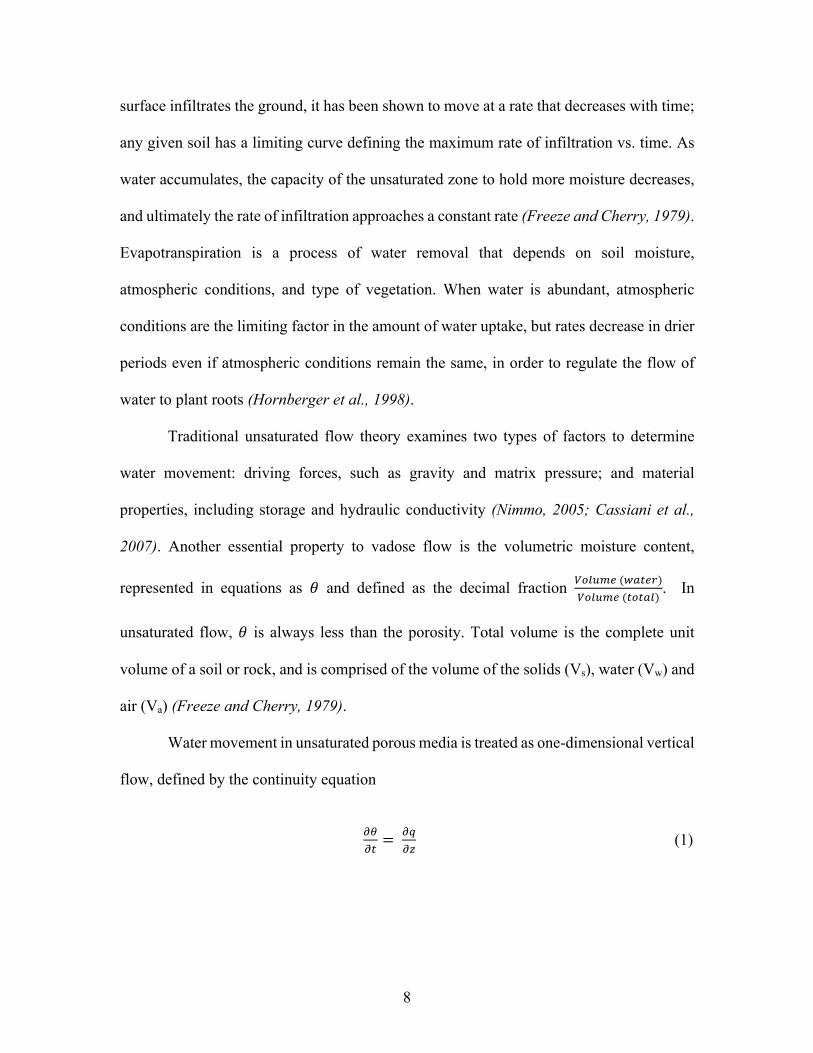
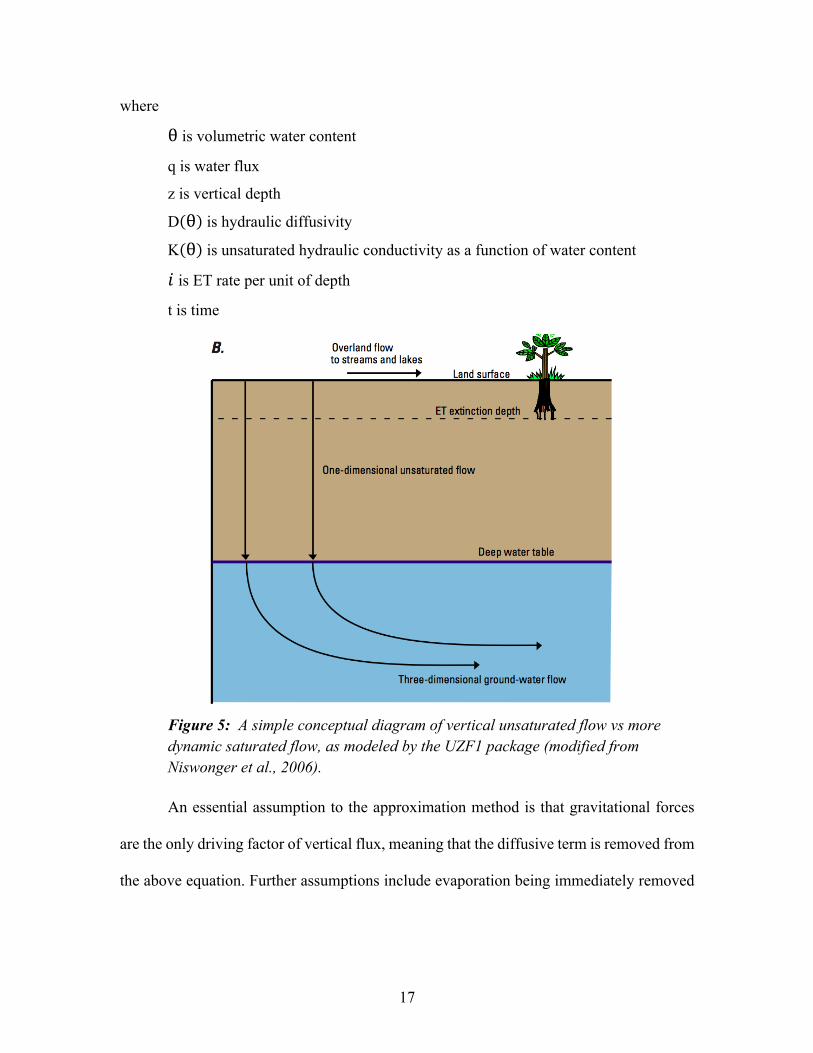
where
θ is volumetric water content
q is water flux
z is vertical depth
D θ is hydraulic diffusivity
K θ is unsaturated hydraulic conductivity as a function of water content
𝑖 is ET rate per unit of depth
t is time
Figure 5: A simple conceptual diagram of vertical unsaturated flow vs more dynamic saturated flow, as modeled by the UZF1 package (modified from Niswonger et al., 2006).
An essential assumption to the approximation method is that gravitational forces
are the only driving factor of vertical flux, meaning that the diffusive term is removed from
the above equation. Further assumptions include evaporation being immediately removed

18
from the soil column and all flow is moving vertically downward. Incorporating these
assumptions, the original equation is modified to:
/0/,+/?(0)
/3+ 𝑖 = 0 (6)
Water movement in the unsaturated zone occurs in waves designated as wetting
and drying fronts; increased infiltration prompts formation of a wetting front, while a
decrease prompts a drying front. To examine the wave of a wetting front, Eqn. 6 is rewritten
as a partial derivative of θwith respect to 𝑡 and 𝑧, yielding:
/0/,+/?(0)
/0/0/3= −𝑖 (7)
Combining Eqn. 7 with Abbott’s equation of variation (1966):
/0/,𝑑𝑡 +/0
/3𝑑𝑧 = 𝑑𝜃, (8)
the equation can be written in matrix form as
1 /?(0)/0
𝑑𝑡 𝑑𝑧
/0/,/0/3
= 𝑖𝑑𝜃 , (9)
whichisthenexpandedintoitsdeterminants
/3/,= /?(0)
/0= 𝑣(𝜃) (10a)
/0/,= −𝑖 (10b)
/0/3= UV
W(0) (10c)
where 10a represents the velocity of a wave in the unsaturated zone, 10b represents the
change in water content of that wave over time, and 10c represents the change in water
content with vertical distance following the wave.
19
The package simulates a one-dimensional plane over a three-dimensional saturated
zone model, applying an infiltration rate at the model’s land surface and removing
evapotranspiration first from the unsaturated zone, and then from the groundwater reservoir
if necessary. This diverges from the traditional ‘Recharge’ and ‘Evapotranspiration’
packages available in MODFLOW, which apply recharge directly to the water table and
calculate the head-dependent evapotranspiration flux by removing ET from above the
extinction depth first before moving to the reservoir if demand is not met, respectively
(Harbaugh, A.W., 2005; Niswonger et al., 2006). UZF1 examines the difference between
land elevation data values and hydraulic head values to approximate the unsaturated zone
thickness at each cell. Mass balance is calculated via estimation of the residual water
content, with specific retention calculated as specific yield subtracted from the saturated
water content. The surface discharge is able be routed to streams or lakes; in the absence
of a specified body of water, the discharge is removed from the model.
MODEL CONSTRUCTION AND CALIBRATION
The model represents a conceptualization of the study area, encompassing a ~1 km2
area divided into 30m square grid cells. F6, an outlying wellsite in the study area, is
excluded from the model to avoid extrapolating head and land surface elevation data over
hundreds of meters and consequently increasing the likelihood of high error [Figure 6a].
Variable unsaturated thickness is modeled using DEM surface elevation data and water
table data interpolated over the entire model area [Figure 6b].

20
(a) (b)
Figure 6: (a) Plan view of model, showing gridded area and well locations geo-coded over a GoogleEarth satellite image of Ploemeur; model is oriented north, with purple squares indicating wells used in this study (b) 3-D render of model, colored to show thickness of vadose zone Hydraulic head averages for each of ten wells are calculated from daily
measurements made at the H+ hydogeologic site; the oldest wells have been monitored
since 1991, whereas the newest well’s measurements date back to 2006. Head averages are
calculated and modeled for each month in order for entry into the CHD package in
MODFLOW. Entries are made for each of 12 stress periods, and are repeated for
subsequent modeled ‘years’. The Preconditioned Conjugate Gradient (PCG) solver is used
when running the models, with head and residual closures of 0.001 and a relaxation
parameter of 1.
The infiltration rate and evapotranspiration demand data are averages calculated
from over 25 years of daily measurements (Table 1). Infiltration is the downward rate of
Shallow Deep
Depth (m)

21
water movement expressed as units of length per time at the modeled land surface for each
cell column; the rates must be less than the vertical hydraulic conductivity to avoid being
set equal to the latter variable (Winston, R.B.., 2009).
Table 1.: Showing the input values for the Unsaturated Zone Flow package as they were entered for one year of run time; this is just a sample, considering that these values were re-entered for each subsequent year of run time.
Infiltration is applied in relation to the specified water content of the model when
the flux is assumed to be equal to the unsaturated hydraulic conductivity; this process is to
apply the characteristic solution method for unsaturated flow, and is outlined in
Charbeneau’s equation (1984; Niswonger et al., 2006):
𝜃 = 2XY?Z
[\ 𝑆^ + 𝜃-0 < 𝑞Va ≤ 𝐾c (11a)
𝜃 = 𝜃c𝐾c < 𝑞Va (11b)
where
Starting Time (d) Ending Time (d) Infiltration Rate (m/d) ET Demand (m/d)
0 31 0.00346 0.00065
31 59 0.00268 0.00092
59 90 0.00206 0.00152
90 120 0.00226 0.00228
120 151 0.00209 0.00296
151 181 0.00164 0.00362
181 212 0.00183 0.00367
212 243 0.00171 0.00323
243 273 0.00187 0.00244
273 304 0.00314 0.00136
304 334 0.00343 0.00084
334 365 0.00332 0.00071

22
θ is the water content of an infiltration wave
qin is the infiltration rate
ε is the Brooks-Corey exponent
Ks is the saturated hydraulic conductivity
Sy is specific yield
𝜃r is residual water content
𝜃s is saturated water content
The evapotranspiration demand is the rate of ET in each column of cells that falls
within the extinction depth interval, which is the depth below the surface elevation beyond
which ET does not occur. Related to these processes is the ET extinction water content, a
value of water content below which ET is unable to be removed from the unsaturated zone
(Niswonger et al., 2006; Winston, 2009). Both extinction depth and water content have
been established in previous studies, and are listed as 3 m below land surface and 0.13,
respectively (Leray et al., 2012; Jimenez et al., 2013).
A series of parameter adjustments was designed to recreate reasonably similar
recharge estimates compared to those published in Jimenez et al. (2013) as a baseline.
Jimenez-Martinez and his team calculated an estimated aquifer recharge of 169-282 mm at
the Ploemeur site by using soil storage volume, estimated from soil thickness and field
capacity, for the years 2003-2010; however, they specifically excluded unsaturated zone
processes in their calculations, hence the reason their results were utilized in this project as
a preliminary baseline for an investigation into the effect of vadose thickness and not as an
explicit calibration value.
The UZF1 package uses the difference between the land surface and the water-level
elevation as the unsaturated zone thickness. The bottom of the model is designated 40 m

23
below the land surface, as this is generally the extent of the regolith thickness at the study
site (Leray et al., 2012). General head boundaries are implemented in the northwest and
southeast sections of the model, consistent with flow direction at the site. The model is
represented as containing 12 monthly stress periods and a total of 365 daily time steps,
running for one year at a time under transient conditions and repeating until steady state is
achieved in order to allow the user to observe the seasonal trends present at the site and
examine the factors contributing to those changes in recharge. Input values for infiltration
and evapotranspiration demand are allowed to vary for different tests of the model, and
include individual monthly averages for the last several years (2009 - 2015), individual
monthly averages for the years that Jimenez and his team completed their calculations
(2003 – 2010), and finally running the repeating monthly values averaged over the entire
25-year dataset.
STATISTICAL ANALYSIS USING MATLAB
A statistical analysis of the hydrogeologic data is conducted and involves writing a
variety of MATLAB scripts that performed complex functions on twenty-five years of data.
Initial data manipulation involves calculating the average daily precipitation, ET, and head
values for each month of the year using records provided by the Ploemeur H+ hydrologic
observatory (Jimenez et al., 2013). While precipitation and evapotranspiration have been
consistently measured at daily intervals from 1991-present, head measurements from the
ten observation wells used in this study were primarily taken at daily intervals but have
varied start dates. Contour maps of the averaged head values from the sample of

24
observation wells are generated to provide a comprehensive visual of the water table
elevation over the extent of the study area [Figure 7].
Figure 7: Displaying the average daily hydraulic head values at intervals during the calendar year. Plots were created using the contour function for gridded data in MATLAB R2018b. Negative values indicate areas where head has fallen below sea level. Wellsites are depicted as filled circles with colors corresponding to the nearest head level contour, and contour values are in meters.
In the contouring process, p-chip interpolation is used to estimate the water level
measurements at daily intervals, in order to create data sets of consistent size that can be
Ploemeur Hydraulic Head - Jan Ploemeur Hydraulic Head - Apr
Ploemeur Hydraulic Head - Aug Ploemeur Hydraulic Head - Dec

25
used in time-saving bulk commands. The p-chip interpolated data sets display a mean-
squared error of only 0.3427 compared to the raw data.
Further analysis involves constructing a three-dimensional rendering of the site
[Figure 8] showing the spatial variability in the vadose thickness.
Figure 8: A mathematical conceptualization of the study site, with the top plane showing the changes in topography and the bottom showing the changes in water table elevation interpolated from hydraulic head measurements; a slight cone of depression can be observed surrounding the pumping location. For orientation purposes, the fault location is roughly represented in gray. Wellsites used in this study are depicted in red. Note: y-axis is inverted.
The plane of the land surface elevation data is plotted atop a plane of the water table
data in a 3-dimensional scatter plot with a 101-node grid, created using the ‘mesh’ and
NORTH
Land Surface Elevation in Relation to Water Table

26
‘griddata’ commands in MATLAB; the vadose zone is represented by the negative space
between the two planes. All coordinate points were originally recorded in Lambert II
Centre, as this coordinate system is more common in France where the data are recorded;
they are converted to decimal latitude and longitude degrees for ease of understanding in
this study.
Post-model analysis examines the different distributions of the UZF model outputs
[Figure 9] for the various dataset tests using the cumulative volumetric budget values from
the MODFLOW list file. Cumulative values for infiltration, UZF ET, and UZF recharge
from the end of each monthly stress period are used and shown in [Figure 10].
Figure 9: Distributions of the three tests run using the quantification model, showing differences in mean and spread between the datasets.

27
Figure 10: Highlighting the values from the model output used in calculating the monthly sums of infiltration, recharge, and ET.
The budget values for a particular month are subtracted from each subsequent stress
period and divided by the total study area, shown in Eq. 12a & 12b, to determine the
monthly quantities of infiltration, UZF ET, and UZF recharge in meters:
(12a)
(719,700m3–699,474m3)/859,871m2=0.0235m (12b)
(RCH at final time step in stress period N)
(RCH at final time step in stress period N-1)
Area of model = Monthly RCH

28
A sensitivity analysis of the UZF input parameters involves using the 25-year
averages model outputs. Each of six parameters are altered between -15% and +15% from
baseline value to determine the perturbation effects on the UZF outputs. These parameters
are: initial unsaturated water content, saturated water content, maximum unsaturated
vertical conductivity, residual water content, extinction content, and extinction depth. The
cumulative values produced from the model runs with altered parameters are examined at
each of 12 stress periods during a modeled year and compared to the baseline values from
the original model. Independence between model inputs is assumed.
29
Results & Discussion
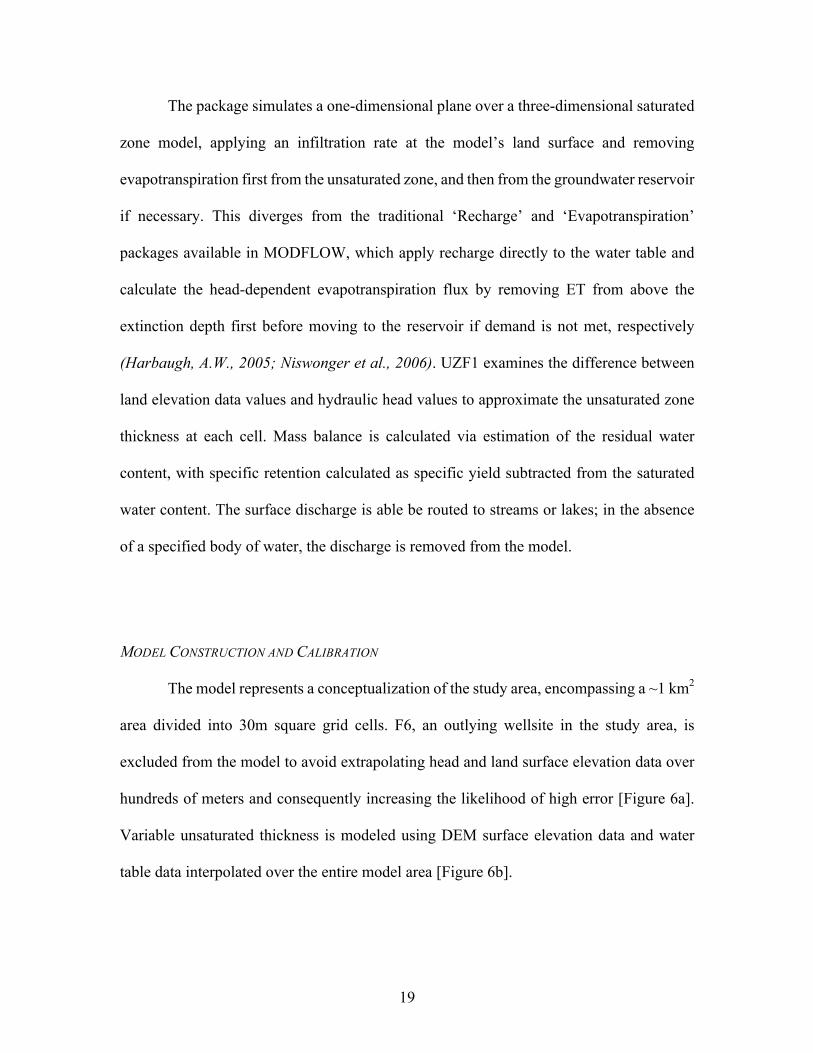
VADOSE ZONE THICKNESS & TEMPORAL RECHARGE DISTRIBUTION
Model results show that variations in vadose zone thickness do have a measurable
effect on the lag time observed between precipitation events and the subsequent observed
changes in the water levels at the Ploemeur site. Figure 11 shows the simulated temporal
distribution of cumulative volumetric recharge in model cells of varying thickness, in
comparison to the cumulative volumetric infiltration. If the vadose zone had no effect on
travel time, the infiltration and recharge data would be indistinguishable. However, the
plotted results from the UZF simulations clearly show the effect that vadose thickness has
on recharge arrival time, and therefore the influence that vadose thickness exerts over the
lag time at this site.
A positive linear relationship between vadose thickness and lag time appears to
exist until the thickness of the unsaturated zone exceeds 20 m. At unsaturated depths > 20
m the direct relationship appears to reverse, as cells modeled with increasingly thick vadose
zones appear to receive recharge more rapidly than some of their thinner counterparts
(Table 2). The lag time between infiltration and recharge during one year as determined
from this model is 104 days, as calculated based a spatially averaged vadose thickness from
cell-by-cell water table results [Figure 12] and temporally averaged cumulative volumetric
recharge quantity. The lag from the empirical precipitation and hydraulic head data shows
an average 142-day lag, meaning that 73% of the observed lag can be explained by vadose
zone processes.

30
Figure 11.: The effect of varying unsaturated zone thickness on recharge quantity. The baseline, infiltration, is analogous to zero vadose thickness and is represented as the top line in blue. Subsequent thicknesses, varying in ~5m intervals before showing the maximum thickness, are symbolized by the designated lines below and show that Vadose thickness affects the time it takes for a given amount of infiltration to be reflected in the groundwater reservoir as recharge. The model simulates one year of data, in daily time steps.
A similar linear trend between unsaturated zone thickness and delay in water-level
response time is observed in the Chalk aquifer in England, where the time lag appears to
correlate strongly to the thickness of the vadose zone. Four sites at this English aquifer that
had the largest unsaturated zone thicknesses showed a significant increase in lag time at
and below a critical vadose thickness. Another likeness is observed in the changes in slope
0
200
400
600
800
1000
1200
1400
1600
0 25 50 75 100 125 150 175 200 225 250 275 300 325 350
Cum
ulat
ive
Vol
umet
ric
Rec
harg
e (m
3 )
Model Time Step (Day)
Effect of Variable Vadose Thickness on Recharge Time
Infiltration 5m 11m 15m 20m 25m 27m
31
of the response time vs. thickness plotlines, indicatative of potential changes in dominant
flow pathways (i.e. matric flow to fracture/fissure flow) (Lee et al., 2006).
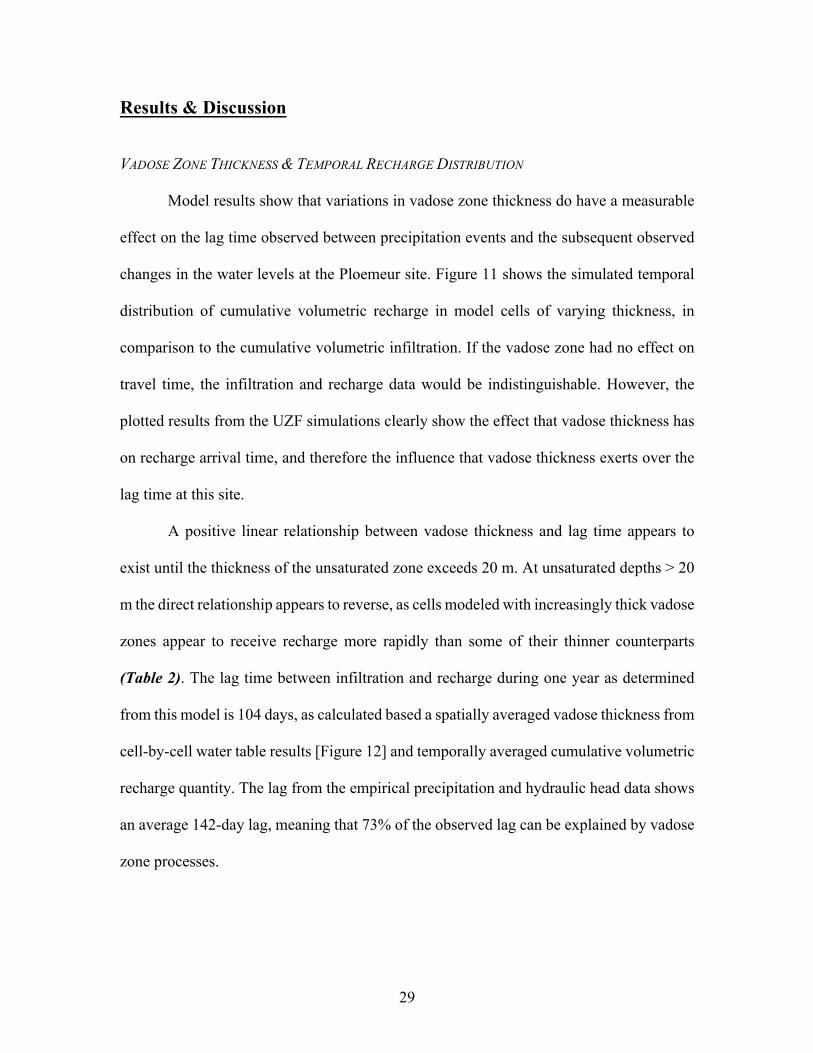
Table 2: Lengths of modeled time necessary for UZF recharge to attain a given cumulative quantity in cells with each of the plotted thicknesses, compared to the amount of time steps necessary for cumulative infiltration to reach that same quantity.
This non-linear trend is likely influenced by the changing monthly head values that
are used in the modeling procedure and shown in Figure 7; certain head levels are tied to
each stress period, necessitating a certain sum of recharge to move through the system and
influence those head levels. The non-linearity observed in the thicker vadose sections is
therefore influenced by the amount of hydraulic head change that occurs in those wells
located in a thicker part of the vadose zone. Wells with hydraulic heads that exhibit larger
fluctuations throughout the year necessitate larger influxes of recharge, despite the depth
at which they are located.
Infiltration Timestep at 500 m3: 120
Vadose Thickness Timestep at 500m3 Vadose Thickness Timestep at 500m3
5 m 181 20 m 751
11 m 274 25 m 236
15 m 291 27 m 225

32
Figure 12.: Vadose thickness in January, April, August, and December (clockwise from upper left:). Deepest blue values represent the small cluster of negative thickness values. The thickest portions of the unsaturated zone consistently remain clustered at the pumping site within the fractured fault zone, where a cone of depression has formed after nearly three decades of highly productive withdrawals. Black squares represent wellsites; white squares lined in purple are pumping wells.
The fact that this non-linear relationship exists suggests that while a significant
portion of the lag time observed at the site can be attributed to the vadose zone thickness,
this is not the only parameter affecting the downward movement of water through the
-10 27
Vadose Thickness (m)
33
unsaturated zone, and further investigation into the nuances of the fractures and structures
at the site is necessary to fully account for the entire observed lag. This is further
corroborated by the simulated vadose thickness. The negative vadose thickness modeled
in these few cells is not explained by the properties of the vadose zone, but rather points
to preferential flow paths in areas that allow meteoric water to move more quickly
through the unsaturated zone and provide recharge to the groundwater system.
SPATIAL DISTRIBUTION OF RECHARGE
Simulated monthly recharge is the greatest [Figure 13] in the western part of the
region--west of the fault zone, and lowest within the fault zone and regions to the east
where the drawdown is generally the greatest. Enhanced recharge is also observed along
the western and northern boundaries of the model where elevations reach upwards of 40m
above sea level compared to the ~20m towards the fault zone and center of the model, and
where hydraulic heads have historically been significantly higher than those recorded in
wells near the pumping zone. The recharge patterns below reflect the combination of head
contours entered during model construction, the modeled topography, and the simulated
vadose thickness. Areas with the greatest depth between the model surface and the
calculated water table display minimal recharge, while areas with shallower unsaturated
zones tend to exhibit higher rates per month.

34
Figure 13.: The spatial distribution of recharge, showing that topographically higher areas and cells with thinner unsaturated zones tend to be simulated with more UZF recharge. (a) January recharge (peak infiltration); (b) March recharge (peak recharge); (c) June recharge (minimum infiltration); (d) September recharge (minimum recharge). Rectangles show locations of wells.
SEASONAL RECHARGE QUANTIFICATION
Simulated temporal recharge reveals that much of the lag in recharge response can
be attributed to vadose zone properties and processes. A similar trend, akin to a sinusoidal
~ 0.0 5.15
Volumetric Recharge (m3)
a ba
c d
35
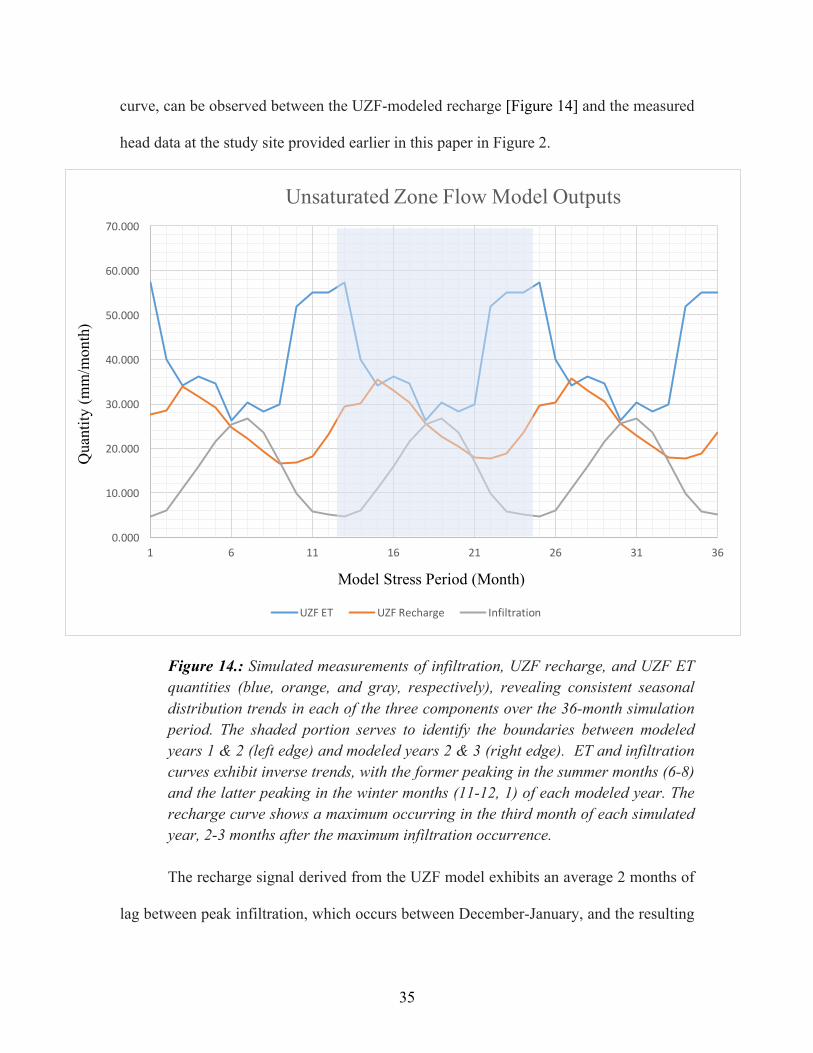
curve, can be observed between the UZF-modeled recharge [Figure 14] and the measured
head data at the study site provided earlier in this paper in Figure 2.
Figure 14.: Simulated measurements of infiltration, UZF recharge, and UZF ET quantities (blue, orange, and gray, respectively), revealing consistent seasonal distribution trends in each of the three components over the 36-month simulation period. The shaded portion serves to identify the boundaries between modeled years 1 & 2 (left edge) and modeled years 2 & 3 (right edge). ET and infiltration curves exhibit inverse trends, with the former peaking in the summer months (6-8) and the latter peaking in the winter months (11-12, 1) of each modeled year. The recharge curve shows a maximum occurring in the third month of each simulated year, 2-3 months after the maximum infiltration occurrence. The recharge signal derived from the UZF model exhibits an average 2 months of
lag between peak infiltration, which occurs between December-January, and the resulting
0.000
10.000
20.000
30.000
40.000
50.000
60.000
70.000
1 6 11 16 21 26 31 36
Quantity
(m)
ModelStressPeriod
Unsaturated Zone Flow Model Outputs
UZFET UZFRecharge Infiltration
Qua
ntity
(mm
/mon
th)
Model Stress Period (Month)

36
peak recharge that typically occurs between March and April. This temporal recharge
pattern is nearly identical to the 2-3 month average lag observed in the empirical
precipitation and hydraulic head data. This provides compelling evidence for the results
from the first part of this investigation stating that the vadose zone is an essential factor in
the delay observed between the precipitation event (infiltration) and the water levels
measured in the wells at the site.
It is worth noting that recharge is simulated to occur during each month of the year,
despite the increase in evapotranspiration demand that occurs in the area during the summer
months when ET can exceed total precipitation. Water loss by ET is greater than infiltration
between April and September, leading to a decrease in the average hydraulic heads between
May and October/November [Figure 15].
Figure 15.: Plot showing the amount of simulated head change in 10 of the observation wells at Ploemeur. Most wells exhibit a decrease in head during the summer and autumn months; well 20 is notably contrary to this pattern, exhibiting an increase in head during June, July, and September.
-1.5
-1
-0.5
0
0.5
1
1.5
2
1 2 3 4 5 6 7 8 9 10 11 12
Dev
iatio
n fr
om P
revi
ous M
onth
(m)
Month
Quantifying Monthly Head Fluctuations Over One Year
F7 F9 F11 F17 F19 F20 F30 F31 F34 F35

37
The relationship between infiltration and evapotranspiration in the UZF package is
calculated using empirically derived values from prior studies for the extinction depth,
extinction content, and vertical hydraulic conductivity, and the amount of ET simulated
depends heavily on the initial water content derived through parameter estimation and
model calibration [Figure 16]. The calculation of distributed recharge occurring throughout
the calendar year is novel for this site. Previous investigations, based on the simplified
conceptualization of Infiltration – Evapotranspiration = Recharge, led to the assumption
that no recharge could occur at the water table without water actively entering the
subsurface as infiltration; however, the overwhelming majority of preceding studies did
not explicitly model vadose zone properties and processes, much less areas with more
robust unsaturated zones within fractured crystalline rock spanning tens of meters.
Figure 16.: Sensitivity of input parameters in relation to evapotranspiration simulation, supporting that initial unsaturated water content, extinction depth, and residual water content are the strongest constraints specifically related to evapotranspiration quantity.
0
0.1
0.2
0.3
0.4
0.5
0.6
0.7
0.8
VKS InitialUnsat.WC
ResidualWC SaturatedWC
ExtinctionCont.
ExtinctionDepth
Dimen
sionlessS
caledSensitivity
SensitivityAnalysisAgainstET

38
Conversely, we are showing that under certain conditions it is possible for a system to
continue to receive recharge even when evapotranspiration demand exceeds the
precipitation within a given time period. Typically, water would be removed from the
simulated water table in a model when ET demand exceeds infiltration; however, this site
contains a relatively deep water table coupled with a comparatively shallow extinction
depth, and a relatively large vertical saturated conductivity (VKS) that allows water to
travel through the subsurface more quickly than can be utilized by plants, adding to the
unique recharge distribution observed at the site.
A similar recharge signal was recorded during a study by Rodhe et al. (2004),
conducted on a fractured crystalline rock aquifer in Sweden. In this instance, results
showed recharge occurring during each month of the year and supported the initial
hypothesis that the aquifer was supplemented by vertical recharge from groundwater in the
overlying soil layer. While the recharge at this site was significantly less than that of
Ploemeur, estimated at only ~20mm yr-1, the similarity in the signals lends support to our
model results.
Table 3 summarizes the monthly quantity of infiltration, UZF recharge, and UZF
ET. All values are converted to millimeters for ease of comparison to previous studies. The
results of this investigation indicate that the simulated annual quantity of recharge ranges
from 304-307 mm. In comparison, calculations by Jimenez et al. in 2013 predicted recharge
between 169 mm – 282 mm per year, a range significantly lower than that produced by
model simulations in this investigation. It should be noted too that the entire annual
recharge in the Jimenez et al. (2013) investigation typically occurs over a three- to four-
month period during the winter months.

39
The differences between the results of this study and those published in Jimenez et
al. (2013) stem from a number of factors, including consideration of heterogeneity and
vertical flow representation. Jimenez and his team used recharge at the bottom of the soil
layer as input in their calculations specifically to reduce non-linearity from the vadose
zone, whereas our model examines vadose zone processes such as wetting plane mobility
and the subsequent influence on the infiltration quantities.
Table 3.: Graph showing the total monthly simulated quantities for the indicated UZF parameters over the 36 months of simulation time, which is equivalent to 36 stress periods containing 365 time steps each.
Transit time between infiltration and recharge was previously considered to be
instantaneous and lag time was attributed to slow-moving water percolation through the
low-permeability mica-schist into the contact zone, thus leading to the calculated
differences in recharge between these two studies. Additionally, the 2013 investigation
employed water level datasets from different wells at the site than those used in this study
40
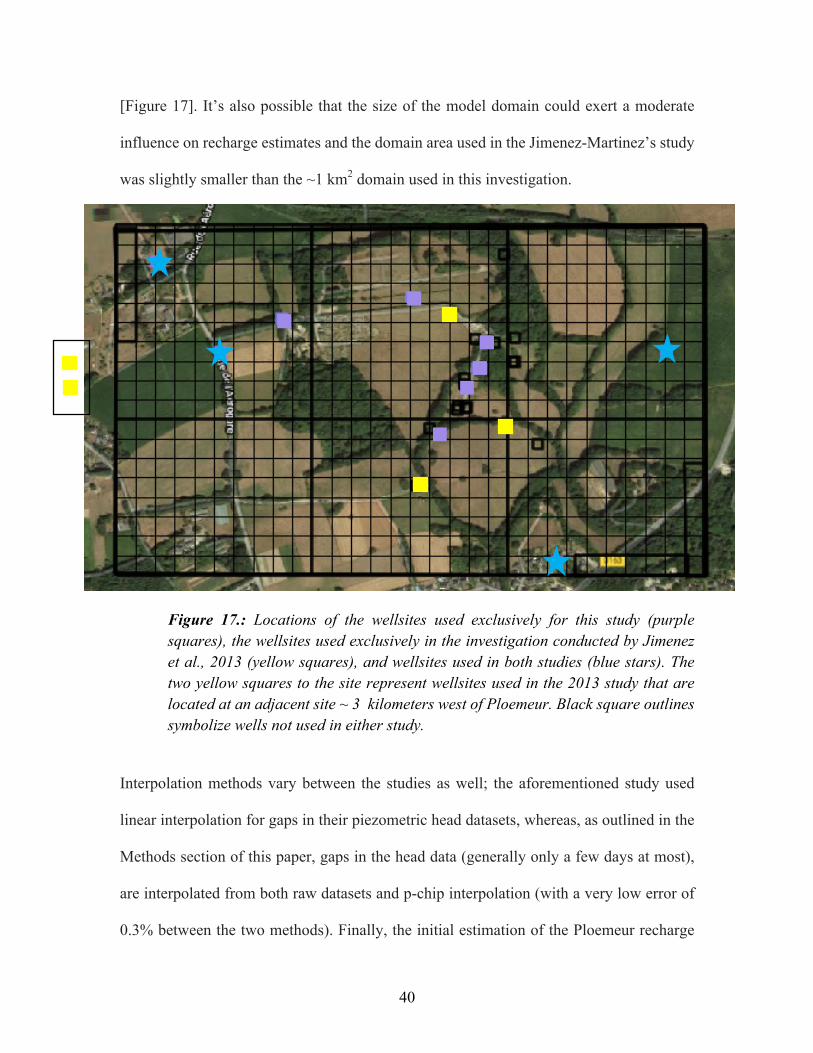
[Figure 17]. It’s also possible that the size of the model domain could exert a moderate
influence on recharge estimates and the domain area used in the Jimenez-Martinez’s study
was slightly smaller than the ~1 km2 domain used in this investigation.
Figure 17.: Locations of the wellsites used exclusively for this study (purple squares), the wellsites used exclusively in the investigation conducted by Jimenez et al., 2013 (yellow squares), and wellsites used in both studies (blue stars). The two yellow squares to the site represent wellsites used in the 2013 study that are located at an adjacent site ~ 3 kilometers west of Ploemeur. Black square outlines symbolize wells not used in either study.
Interpolation methods vary between the studies as well; the aforementioned study used
linear interpolation for gaps in their piezometric head datasets, whereas, as outlined in the
Methods section of this paper, gaps in the head data (generally only a few days at most),
are interpolated from both raw datasets and p-chip interpolation (with a very low error of
0.3% between the two methods). Finally, the initial estimation of the Ploemeur recharge

41
signal in the previous investigation was calculated using hydraulic head values from years
2003-2010, whereas this study uses a more extensive hydraulic head dataset dating back to
1991 and extending to 2015.
UNCERTAINTY
Sources of uncertainty in the model stem from various sources, including parameter
value approximations and inherent assumptions. Parameters at the Ploemeur site such as
vertical hydraulic conductivity, Brooks-Corey coefficient, and residual water content were
approximated with some initial, shallow investigations but were not examined thoroughly
within the fractured rock. The UZF modeling package relies on some inherent assumptions,
including uniform hydraulic properties within the vadose zone and unsaturated flow that is
driven solely by gravimetric potentials. Additionally, uncertainty arises from the lack of
structure specified in this model, as fracture flow and preferential flow paths are not
specifically accounted for in the hydraulic head gradients and recharge distribution.

42
Conclusions
Characterizing fractured rock aquifers remains a challenging issue for groundwater
modelers, as heterogeneous materials and subsurface structures add complexity to the
system. Understanding such systems is crucial to the effective and sustainable
management of groundwater resources as these reservoirs continue to be exploited.
The fractured rock aquifer system in Ploemeur, France, is investigated to better
understand the properties and processes constraining a unique recharge signal within a
highly productive groundwater reservoir that shows a lag of approximately two months
between seasonal precipitation trends and subsequent effect on measured water levels in
the crystalline rock aquifer. A model was constructed using MODFLOW-2005 with
ModelMuse as the GUI; the Unsaturated Zone Flow and Time-Variant Specified Head
packages were used, alongside the Pre-conditioned Conjugate Gradient solver, to simulate
the movement of water through the unsaturated zone within this crystalline aquifer
complex. The goals of this model were to determine the extent to which vadose zone
thickness and vertical hydraulic conductivity of the vadose zone affected the timing of
recharge to the underlying crystalline-rock aquifer, and to quantify the average seasonal
recharge trends at the site.
Twelve stress periods totaling 365 time steps were used to represent the days of the
year. These stress periods were repeated for successive years to ensure consistency in
results and mimic yearly variations in precipitation and ET. Constant input parameters for
the unsaturated zone included the Brooks-Corey epsilon value, residual water content,
initial unsaturated water content, saturated water content, VKS, extinction depth and

43
extinction water content. MATLAB was used to calculate average infiltration rates,
evapotranspiration demands, and head values over each stress period.
Results show that vadose thickness does have a tangible effect on recharge lag time,
albeit a non-linear one. Once vadose zone thickness exceeds 20m recharge lag time begins
to decrease, which suggests that further investigation into the subsurface structure and
preferential flow paths therein is necessary to fully explain the groundwater movement at
Ploemeur beyond the 73% of lag time accounted for by the vadose zone. Seasonal trends
in recharge show a very similar trend to head values at the site, which exhibit peak values
occurring in March and minimum values occurring in September. Most notable is the fact
that this model simulates recharge to the underlying aquifer during each month of the year,
which is vastly different than previous investigations what suggest recharge occurs only
during the winter months when ET is low.

44
References
Abbott, M.B. (1966). An Introduction to the Method of Characteristics. American Elseviers, New York.
Ali, M. (2017). Quantifying Natural Groundwater Recharge Using Tracer and Other
Techniques. Asian Journal of Environment & Ecology. 5. 1-12. 10.9734/AJEE/2017/36811.
Amiotte-Suchet, P., Probst, J.L., & Ludwig, W.(2003). Worldwide distribution of
continental rock lithology: implications for the atmospheric/soil CO2 uptake by continental weathering and alkalinity river transport to the oceans. Global Biogeochemical Cycles 17, 1038.
Aquilina, L., Roques, C., Boisson, A., Vergnaud-Ayraud, V., Labasque, T., Pauwels, H.,
Bour, O. (2018). Autotrophic denitrification supported by biotite dissolution in crystalline aquifers (1): New insights from short-term batch experiments. Science of the Total Environment, 619–620, 842–853.
Aquilina, L., Vergnaud-Ayraud, V., Les Landes, A.A., Pauwels, H., Davy, P., Pételet-
Giraud, E.,Labasque, T., Roques, C., Chatton, E., Bour, O., BenMaamar, S., Dufresne, A., Khaska,M., La Salle, C.L.G., Barbecot, F. (2015). Impact of climate changes during the last 5 million years on groundwater in basement aquifers. Scientific Reports 5, 14132.
Baalousha, H. (2009). Fundamentals of Groundwater Modelling. Groundwater:
Modelling, Management and Contamination, (January 2011), 113–130.
Bense, V. F., Gleeson, T., Loveless, S. E., Bour, O., & Scibek, J. (2013). Earth-Science Reviews Fault zone hydrogeology. Earth Science Reviews, 127, 171–192. https://doi.org/10.1016/j.earscirev.2013.09.008
Berkowitz, Brian. (2002). Characterizing flow and transport in fractured geological media:
A review. Advances in Water Resources. 25. 861-884. Blatt, H. and Jones, R.L (1975). Proportions of exposed igneous, metamorphic, and
sedimentary rocks. Geol. Soc. Am. Bul. 86, 1085-1088. Bouwer, H. (1978) Groundwater Hydrology. McGraw-Hill, New York

45
Buttle, J.M. & Sami, K. (1990). Recharge Processes During Snowmelt: An Isotopic and Hydrometric Investigation. Hydrological Processes. 4. 343 - 360.
Charbeneau, R.J., 1984, Kinematic models for soil moisture and solute transport: Water
Resources Research, v. 20, no. 6, p. 699-706.
Cassiani, M., Radicchi, A., Albertson, J.D., Giostra, U., 2007. An efficient algorithm for scalar PDF modelling in incompressible turbulent flow; numerical analysis with evaluation of IEM and IECM micro-mixing models. Journal of Computational Physics, 223, 519-550.
Childs, E.C. & Collis-George, N. (1950). The Permeability of Porous Materials. Proceedings of the Royal Society of London. Series A, Mathematical and Physical Sciences. 201. 392-405.
Crosbie, R. S., Binning, P., & Kalma, J. D. (2005). A time series approach to inferring
groundwater recharge using the water table fluctuation method, 41, 1–9. https://doi.org/10.1029/2004WR003077
Darcy, H. (1856). Les Fontaines Publiques de la Ville de Dijon. Dalmont, Paris. 647 p Dewandel, Benoit & Maréchal, Jean-Christophe & Bour, Olivier & Ladouche, Bernard &
Ahmed, Shakeel & Chandra, Subash & Pauwels, Hélène. (2012). Upscaling and regionalizing hydraulic conductivity and effective porosity at watershed scale in deeply weathered crystalline aquifers. Journal of Hydrology. 416. 83-97.
Farkas-Karay, Gyöngyi & Hajnal, Géza. (2015). Modelling of Groundwater Flow in
Fractured Rocks. Procedia Environmental Sciences. 25. Flerchinger, G.N., Pierson, F.B., 1991. Modeling plant canopy effects on variability of
soil temperature and water. Agricultural and Forest Meteorology 56, 227–246.
Freeze, F.A. and Banner, J. (1970). The mechanism of natural ground-water recharge and discharge. Laboratory Column Experiments and Field Measurements. Water Resources Research. 6(1):138-155.
Freeze, R., and J. Cherry. (1979). Groundwater. Old Tappan, New Jersey: Prentice-Hall. G Cook, Peter. (2003). A Guide to Regional Groundwater Flow in Fractured Rock
Aquifers.

46
Gee, G.W. and Hillel, D. (1988) Groundwater Recharge in Arid Regions: Review and Critique of Estimation Methods. Hydrological Processes, 2, 255-266.
Gleeson, T., Novakowski, K., & Kurt Kyser, T. (2009). Extremely rapid and localized recharge to a fractured rock aquifer. Journal of Hydrology, 376(3–4), 496–509.
Gleeson T, Smith L, Moosdorf N, Hartmann J, Du€rr HH, Manning AH, van Beek LPH,
Jellinek AM (2011) Mapping permeability over the surface of the Earth. Geophysical Research Letters, 38, L02401.
Gleeson, T., Wada. Y., Bierkens, M.F.P., van Beek, L.P.H. (2012). Water balance of global aquifers revealed by groundwater footprint. Nature, 488 (7410), pp. 197-200.
Guymon, G.L., 1994. Unsaturated zone hydrology, Prentice Hall, Englewood Cliffs, New
Jersey, 210 pp.
Harbaugh, A.W.. (2005). MODFLOW-2005, the U.S. Geological survey modular ground-water model - The ground-water flow process. U.S. Geol. Surv. Tech. Methods.
Harte, P.T., and Winter, T.C., 1996, Factors affecting recharge to crystalline rock in the
Mirror Lake area, Grafton County, New Hampshire, in Morganwalp, D.W., ed., U.S. Geological Survey Toxics Substances Program: Proceedings of the technical meeting, Colorado Springs, Colorado, September 1993: U.S. Geological Survey Water Resources Investigations Report 94-4015, 12p.
Haverkamp, R., Debionne, S., Viallet, P., Angulo-Jaramillo, R. & de Condappa, D. (2006). Soil properties and moisture movement in the unsaturated zone: 6.1-6.59. In J.W. Delleur (ed.), The handbook of Ground-water Engineering. CRC: Boca Raton.
Healy RW (2010) Estimating groundwater recharge, Cambridge University Press,
Cambridge Hewlett, J.D. and Hibbert, A.R. 1967: Factors affecting the response of small watersheds
to precipitation in humid areas. In Sopper, W.E. and Lull, H.W., editors, Forest hydrology, New York: Pergamon Press, 275—90.
Hornberger, G. M., J. P. Raffensperger, P. L. Wiberg, and K. N. Eshleman, 1998:
Elements of Physical Hydrology. The Johns Hopkins University Press, 302 pp.
47
Jiménez-Martínez, J., Longuevergne, L., Le Borgne, T., Davy, P., Russian, A., & Bour, O. (2013). Temporal and spatial scaling of hydraulic response to recharge in fractured aquifers: Insights from a frequency domain analysis. Water Resources Research, 49(5), 3007–3023.
Lamur, Anthony & Kendrick, Jackie & Eggertsson, Guðjón & J. Wall, R & D. Ashworth,
J & Lavallée, Yan. (2017). The permeability of fractured rocks in pressurised volcanic and geothermal systems. Scientific Reports. 7.
Le Borgne, T., Bour, O., de Dreuzy, J. R., Davy, P., and Touchard, F. (2004), Equivalent
mean flow models for fractured aquifers: Insights from a pumping tests scaling interpretation, Water Resour. Res., 40, W03512.
Le Borgne, T., Bour, O., Paillet, F. L., & Caudal, J. P. (2006). Assessment of preferential
flow path connectivity and hydraulic properties at single-borehole and cross-borehole scales in a fractured aquifer. Journal of Hydrology, 328(1–2), 347–359.
Le Borgne, T., Paillet, F., Bour, O., & Caudal, J. P. (2006). Cross-borehole flowmeter tests
for transient heads in heterogeneous aquifers. Ground Water, 44(3), 444–452. Le Borgne, T, Bour, O, Riley, M, Gouze, P, Belgouhl, A, Lods, G, Le Provost, R, Greswell,
R, Ellis, PA, Isakov, E, Last, B & Pezard, PJ. (2007). Comparison of alternative methodologies for identifying and characterizing preferential flow paths in heterogeneous aquifers. Journal of Hydrology, 345(3-4), pp. 134-148.
Le Druillennec, Thomas & Ielsch, Geraldine & Bour, Olivier & Tarits, Corinne & Tymen,
Georges & Alcalde, G & Aquilina, Luc. (2010). Hydrogeological and geochemical control of the variations of 222Rn concentrations in a hard rock aquifer: Insights into the possible role of fracture-matrix exchanges. Applied Geochemistry. 25. 345-356.
Lee, L.J.E., Lawrence, D.S.L., & Price, M. (2006). Analysis of water-level response to
rainfall and implications for recharge pathways in the Chalk aquifer, SE England. J. Hydrol. 330. 604–20
Leray, S., de Dreuzy, J. R., Bour, O., Labasque, T., & Aquilina, L. (2012). Contribution of
age data to the characterization of complex aquifers. Journal of Hydrology, 464–465(December 2017), 54–68.

48
Leray, S., de Dreuzy, J. R., Bour, O., & Bresciani, E. (2013). Numerical modeling of the productivity of vertical to shallowly dipping fractured zones in crystalline rocks. Journal of Hydrology, 481, 64–75.
Lerner, D.N., Issar, S.A., & Simmers, I. (1990). Groundwater recharge – a guide to
understanding and estimating natural recharge. Heise, Hannover, 345 pp. Lerner, D.N. (2002). Identifying and quantifying urban recharge: A review. Hydrogeology
Journal, 10, pp. 143-152. Lloyd, J. W. (1986). A review of aridity and groundwater. Hydrol. Process., 1: 63-78. Mustafa, S.M.T., Abdollahi, K., Verbeiren, B., Huysmans, M. (2017a). Identification of
the influencing factors on groundwater drought and depletion in northwestern Bangladesh. Hydrogeol. J. 1–19.
Nimmo, J.R. (2005). Unsaturated Zone Flow Processes, in Anderson, M.G., and Bear, J., eds., Encyclopedia of Hydrological Sciences: Part 13--Groundwater: Chichester, UK, Wiley, v. 4, p. 2299-2322.
Niswonger, R.G., D.E. Prudic, and R.S. Regan. 2006. Documentation of the Unsaturated-Zone Flow (UZF1) Package for modeling unsaturated flow between the land surface and the water table with MODFLOW-2005. USGS Techniques and Methods 6-A19. Reston, Virginia: USGS.
Niswonger, R.G., Panday, S., Ibaraki, M. (2011). MODFLOW-NWT, A Newton formulation for MODFLOW-2005: U.S. Geological Survey Techniques and Methods 6–A37, 44 p
Pedretti, D., Russian, A., Sanchez-Vila, X., and Dentz, M. (2016), Scale dependence of the hydraulic properties of a fractured aquifer estimated using transfer functions, Water Resour. Res., 52, 5008– 5024.
Rodhe, A., 1987. The origin of streamwater traced by oxygen-18, Ph.D. thesis, Report
Series A No. 41. Division of Hydrology. Department of Physical Geography. Uppsala University, Sweden, 260 pp.
Roques, C & Bour, Olivier & Aquilina, Luc & Dewandel, Benoit. (2016). High-yielding
aquifers in crystalline basement: insights about the role of fault zones, exemplified by Armorican Massif, France. Hydrogeology Journal.

49
Roques, C & Aquilina, Luc & Boisson, Alexandre & Vergnaud-Ayraud, Virginie & Labasque, T & Longuevergne, Laurent & Laurencelle, Marc & Dufresne, Alexis & de Dreuzy, Jean-Raynald & Pauwels, Hélène & Bour, Olivier. (2018). Autotrophic denitrification supported by biotite dissolution in crystalline aquifers: (2) transient mixing and denitrification dynamic during long-term pumping. The Science of the total environment. 619-620. 491-503.
Ruelleu, S., Moreau, F., Bour, O., Gapais, D., & Martelet, G. (2010). Impact of gently dipping discontinuities on basement aquifer recharge: An example from Ploemeur (Brittany, France). Journal of Applied Geophysics, 70(2), 161–168.
Scanlon, Bridget & Healy, Richard & G. Cook, Peter. (2002). Choosing Appropriate
Techniques for Quantifying Groundwater Recharge. Hydrogeology Journal. 10. 18-39.
Schuite, J., Longuevergne, L., Bour, O., Burbey, T. J., Boudin, F., Lavenant, N., & Davy,
P. (2017). Understanding the hydromechanical behavior of a fault zone from transient surface tilt and fluid pressure observations at hourly time scales. Water Resources Research, 53,10,558– 10,582.
Schuite, Jonathan & Longuevergne, Laurent & Bour, Olivier & Boudin, F & Durand,
Stéphane & Lavenant, Nicolas. (2015). Inferring field-scale properties of a fractured aquifer from ground surface deformation during a well test. Geophysical Research Letters. 42.
Sklash, Michael G. & Farvolden, Robert N. (1979). The Role of Groundwater in Storm
Runoff. Journal of Hydrology. 43. 45-65. Stober I, Bucher K (2006) Hydraulic properties of the crystalline basement.
Hydrogeology Journal, 15, 213–24. Sukhija BS, Reddy DV, Nagabhushanam P, Hussain S. (2003). Recharge processes:
piston flow vs. preferential flow in semi-arid aquifers of India. Hydrogeol J 11(3): 387–395
Tolman, C.F., Ground Water, McGraw-Hill, New York, 1937, 593 pp., 175. Vergnaud-Ayraud, Virginie & Aquilina, Luc & Labasque, T & Pauwels, Hélène &
Molenat, Jérôme & Pierson-Wickmann, Anne-Catherine & Durand, Véronique & Bour, Olivier & Tarits, Corinne & Le Corre, Pierre & Fourré, Elise & Merot, Philippe & Davy, Philippe. (2008). Compartmentalization of physical and chemical properties in hard-rock aquifers deduced from chemical and groundwater age analyses. Applied

50
Geochemistry, 23, 2686-2707. Wakode, H.B., Baier, K., Jha, R., & Azzam, R. (2018). Impact of urbanization on
groundwater recharge and urban water balance for the city of Hyderabad, India. International Soil and Water Conservation Research, 6, 1.
Widodo, Lilik Eko. (2013). Estimation of Natural Recharge and Groundwater Build up in
the Bandung Groundwater Basin Contributed from Rain Water Infiltration and Inter-aquifer Transfer. Procedia Earth and Planetary Science, 6, 187-194.
Winston, R.B., 2009, ModelMuse—A graphical user interface for MODFLOW–2005 and
PHAST: U.S. Geological Survey Techniques and Methods 6–A29, 52 p
Winter, T.C. & Harvey, J.W. & Lehn Franke, O & Alley, William. (1998). Ground water and surface water a single resource: U. U.S. Geol. Surv. Circ.. 1139
. Zimmermann, U & Ehhalt, D & Muennich, K.O.. (1967). Soil-water movement and
evapotranspiration: changes in the isotopic composition of the water. Isotopes in Hydrology, pp 567-85. Vienna, International Atomic Energy Agency, 14–18.


![[M. Goyal] Computer-Based Numerical Statistical (BookFi.org)](https://img.pdfslide.net/doc/110x75/55cf9d3a550346d033acc1df/m-goyal-computer-based-numerical-statistical-bookfiorg.jpg)