Embed Size (px)
Citation preview

of June 19, 2018.This information is current as
Partial TCRB Gene RearrangementLeads to Expansion of Thymocytes withDifferentiation of B and T Lymphocytes and
Fusion Gene ImpairsNUP98-HOXD13A
Peter D. AplanChul Won Choi, Yang Jo Chung, Christopher Slape and
http://www.jimmunol.org/content/183/10/6227doi: 10.4049/jimmunol.0901121October 2009;
2009; 183:6227-6235; Prepublished online 19J Immunol
MaterialSupplementary
1.DC1http://www.jimmunol.org/content/suppl/2009/10/20/jimmunol.090112
Referenceshttp://www.jimmunol.org/content/183/10/6227.full#ref-list-1
, 20 of which you can access for free at: cites 30 articlesThis article
average*
4 weeks from acceptance to publicationFast Publication! •
Every submission reviewed by practicing scientistsNo Triage! •
from submission to initial decisionRapid Reviews! 30 days* •
Submit online. ?The JIWhy
Subscriptionhttp://jimmunol.org/subscription
is online at: The Journal of ImmunologyInformation about subscribing to
Permissionshttp://www.aai.org/About/Publications/JI/copyright.htmlSubmit copyright permission requests at:
Email Alertshttp://jimmunol.org/alertsReceive free email-alerts when new articles cite this article. Sign up at:
Print ISSN: 0022-1767 Online ISSN: 1550-6606. Immunologists, Inc. All rights reserved.Copyright © 2009 by The American Association of1451 Rockville Pike, Suite 650, Rockville, MD 20852The American Association of Immunologists, Inc.,
is published twice each month byThe Journal of Immunology
by guest on June 19, 2018http://w
ww
.jimm
unol.org/D
ownloaded from
by guest on June 19, 2018
http://ww
w.jim
munol.org/
Dow
nloaded from
A NUP98-HOXD13 Fusion Gene Impairs Differentiation of Band T Lymphocytes and Leads to Expansion of Thymocyteswith Partial TCRB Gene Rearrangement1
Chul Won Choi,2,3 Yang Jo Chung,2 Christopher Slape,4 and Peter D. Aplan5
Expression of a NUP98-HOXD13 (NHD13) fusion gene leads to myelodysplastic syndrome in mice. In addition to ineffective hemato-poiesis, we observed that NHD13 mice were lymphopenic; the lymphopenia was due to a decrease in both T and B lymphocytes.Although the pro-B cell (B220�/CD43�) populations from the NHD13 and wild-type mice were similar, the NHD13 mice showeddecreased pre-B cells (B220�/CD43�), indicating impaired differentiation at the pro-B to pre-B stage. Thymi from NHD13 mice weresmaller and overexpressed Hoxa cluster genes, including Hoxa7, Hoxa9, and Hoxa10. In addition, the NHD13 thymi contained fewerthymocytes, with an increased percentage of CD4�/CD8� (double-negative (DN)) cells and a decreased percentage of CD4�/CD8�
(double-positive) cells; the DN1/DN2 population was increased and the DN3/DN4 population was decreased, suggesting a partial blockat the DN2 to DN3 transition. To determine clonality of the thymocytes, we used degenerate RT-PCR to identify clonal Tcrb generearrangements. Five of six NHD13 thymi showed an unusual Tcrb gene rearrangement pattern with common, clonal DJ rearrange-ments, but distinct V-D junctions, suggesting a marked clonal expansion of thymocytes that had undergone a DJ rearrangement, butnot completed a VDJ rearrangement. Taken together, these findings demonstrate that expression of the NHD13 transgene inhibitslymphoid as well as myeloid and erythroid differentiation, results in overexpression of Hoxa cluster genes, and leads to a precursor Tcell lymphoblastic leukemia/lymphoma. The Journal of Immunology, 2009, 183: 6227–6235.
T he myelodysplastic syndromes (MDS)6 represent a heter-ogeneous group of clonal disorders of hematopoiesis,characterized by peripheral blood (PB) cytopenias, hyper-
cellular, dysplastic bone marrow (BM), and a predilection fortransformation to acute myelogenous leukemia. The assertion thatMDS is a clonal disease is supported by observations that dem-onstrate over 50% of patients with MDS have one or more clonalcytogenetic abnormalities (1), as well as studies demonstratingclonal X inactivation in informative female MDS patients (2).
The involvement of the lymphoid compartment as a part of theMDS clone has been the topic of some debate. Patients with MDSoften have a mild degree of lymphopenia, especially involving Tlymphocytes (3). In addition, although rare, there are numerouscase reports of acute lymphoblastic leukemia evolving from MDS(4), suggesting the potential for the MDS clone to produce lym-phoid cells. However, lymphocytes from patients with trisomy 8 or
monosomy 7, two common cytogenetic abnormalities associatedwith MDS, typically do not contain the cytogenetic abnormalitywhen analyzed by fluorescence in situ hybridization (5, 6), al-though xenotransplant experiments with trisomy 8 cells have doc-umented trisomy 8 in engrafted B cells (7). Using a 5q deletion(5q�) as a clonal marker, only one of nine cases showed clearevidence of peripheral B lymphocyte involvement in the MDSclone (8). Intriguingly, the same authors found that almost all ofthe CD34�CD38� cells, and a large fraction (25–90%) of pro-Bcells contained the 5q aberration (8). These results demonstratethat the 5q aberration is present in the hematopoietic stem cellcompartment, and suggest that impaired B cell differentiationmight account for the difficulty in detecting the 5q aberration inperipheral B lymphocytes.
Using a NUP98-HOXD13 (NHD13) fusion gene initially iden-tified in patients with MDS (9), we developed a mouse model thatrecapitulates all of the critical features of MDS, including PB cy-topenias, dysplasia, and transformation to acute leukemia. In ad-dition to anemia and neutropenia, we noted that these mice wereconsistently lymphopenic, and that 10–30% of the NHD13 micedeveloped a precursor T cell lymphoblastic leukemia/lymphoma(pre-T LBL) with clonal TCR� gene rearrangements (10). To bet-ter understand the lymphopenia and T cell malignancies in thesemice, we characterized lymphoid differentiation abnormalities andclonal evolution of T cells in the NHD13 mice.
Materials and MethodsEvaluation of clinically healthy mice
NHD13 transgenic (line G2 (10)) and wild-type (WT) littermate controlmice were maintained on a C57BL/6 background and were 6 to 9 mo old.In some experiments, an independent line of NHD13 mice (line C1 (10)),generated on an FVB/N background, was used to verify results obtainedwith the NHD13 line G2 mice. However, unless otherwise stated, allexperiments were performed with the NHD13 line G2 mice. PB was ob-tained from the tail vein using dipotassium EDTA salt as an anticoagulant.Complete blood counts were determined using a HEMAVET Multispecies
Genetics Branch, Center for Cancer Research, National Cancer Institute, NationalInstitutes of Health, Bethesda, MD 20889
Received for publication April 7, 2009. Accepted for publication August 16, 2009.
The costs of publication of this article were defrayed in part by the payment of pagecharges. This article must therefore be hereby marked advertisement in accordancewith 18 U.S.C. Section 1734 solely to indicate this fact.1 This work was supported by the Intramural Research Program of the National In-stitutes of Health, National Cancer Institute.2 C.W.C. and Y.J.C. contributed equally to this work.3 Current address: Section of Oncology-Hematology, Department of Internal Medi-cine, Korea University Guro Hospital, Seoul, Korea.4 Current address: Bone Marrow Research Laboratories, Royal Melbourne Hospital,Melbourne, Australia.5 Address correspondence and reprint requests to Dr. Peter D. Aplan, Navy 8, Room5101, 8901 Wisconsin Avenue, Bethesda, MD 20889-5105. E-mail address: [email protected] Abbreviations used in this paper: MDS, myelodysplastic syndrome; BM, bone mar-row; DN, double negative; DP, double positive; PB, peripheral blood; PI, propidiumiodide; pre-T LBL, precursor T cell lymphoblastic leukemia/lymphoma; RQ, real-time quantification; SP, single positive; WT, wild type.
The Journal of Immunology
www.jimmunol.org/cgi/doi/10.4049/jimmunol.0901121
by guest on June 19, 2018http://w
ww
.jimm
unol.org/D
ownloaded from

Hematology Analyzer (CDC Technologies). Serum IgM and IgG levelswere evaluated by ELISA at Ani Lytics. BM nucleated cells were obtainedby flushing the femur and tibia of euthanized mice. All studies were ap-proved by the National Cancer Institute intramural animal care and usecommittee.
Flow cytometry and cell sorting
Single-cell suspensions from the thymus, spleen, PB, and BM were stainedwith conjugated Abs purchased from either BD Pharmingen or eBio-science. The cells were resuspended with HBSS (Ca2�, Mg2� free; In-vitrogen) containing 2% FBS (HF2) and incubated for 30 min on ice withthe following Abs: CD4-PE (BD Pharmingen), CD8-FITC (BD Pharmin-gen), B220-FITC (BD Pharmingen), IgM-PE (BD Pharmingen), CD25-PE(BD Pharmingen), CD44-FITC (BD Pharmingen), B220-allophycocyanin(eBioscience), CD43-FITC (eBioscience), CD24-PECy5 (eBioscience),BP1-PE (eBioscience), IgD-PE (eBioscience), and IgM-PECy5 (eBio-science). Cells were washed twice with PBS and resuspended with HF2containing 1 �g/ml propidium iodide (PI; Sigma-Aldrich). Flow cytometrywas performed using a dual laser FACScan (BD Biosciences), and datawere analyzed using the CellQuest Pro software (BD Biosciences). For cellsorting, the FACSAria (BD Biosciences) was used.
Thymocyte viability and apoptosis assay
Thymocyte viability test was performed, as described (11). One millionthymocytes were resuspended in RPMI 1640 supplemented with 10% FBS,25 mM HEPES, 2 mM glutamine, penicillin (100 U/ml), streptomycin (100�g/ml), and 50 �M 2-ME, and incubated at 37°C in an atmosphere of 5%CO2. Aliquots were removed daily, and viable cell counts were performedusing trypan blue dye exclusion. For the apoptosis assay, fresh thymocyteswere stained with annexin V-FITC (BD Biosciences) and PI (Sigma-Aldrich) using the manufacturer’s recommended protocol, and analyzedwith a dual laser FACScan (BD Biosciences). Thymocyte viable cellcounts and apoptosis assays were performed in triplicate.
In vivo proliferation assay using BrdU
NHD13 and WT mice were injected i.p. with 1 mg of BrdU in a volume of 0.5ml (BrdU Flow kit; BD Pharmingen) and euthanized 24 h later. A single-cellthymocyte suspension was prepared, and 2 � 106 cells were stained for CD4,CD8, CD44, CD25, and BrdU (anti-BrdU-allophycocyanin), using the man-ufacturer’s reagents and recommended protocols (BrdU Flow kit; BDPharmingen).
Histologic analysis
Thymi were fixed in 10% neutral buffered formalin, embedded in paraffin,sectioned, and stained with H&E for histological examination. Photomi-crographs were taken with a Fuji FinePix 6800Z camera (Fuji) with a CarlZeiss Standard 25 ICS microscope and a custom eyepiece adaptor (Accu-scope). All original magnifications were either �100 or �400.
TCR� gene rearrangements
TCR� gene rearrangements were amplified for sequence analysis usingdegenerate RT-PCR (12, 13). First strand cDNA was synthesized from 1�g of total RNA using SuperScript II reverse transcriptase (Invitrogen),and the cDNA quality was assessed by amplification of �-actin (5�-GTGGGCCGCTCTAGGCAACCAA-3� and 5�-CTCTTTGATGTCACGCACGATTTC-3�) primers. TCR� mRNA was amplified using a degenerateV� region primer (5�-TAAGCGGCCGCATGSLYTGGTAYWXXCAG-3�; S � G or T; L � A, G, or T; Y � C or T; W � A or C; X � A or G)and a C� primer (5�-CCCACCAGCTCAGCTCCACGTGG-3�). The cy-cling parameters were 94°C for 2 min; 3 cycles of 94°C for 1 min, 37°C for1 min, and 72°C for 1 min; and 27 cycles of 94°C for 30 s, 55°C for 30 s,and 72°C for 1 min, followed by a terminal extension of 10 min at 72°C.The PCR products were gel purified and subcloned into pGEM-T Easy(Promega). Individual plasmid clones were isolated for sequence analysis.For analysis of genomic DJ rearrangements, primers 5TCRBD1.2 (5�-CTTATCTGGTGGTTTCTTCCAGC-3�) and 3TCRBJ1S4.2 (5�-TTTACATACCCAGGACAGACAGC-3�) were used with genomic DNA templates.
Real-time quantitative RT-PCR analysis of gene expression
RNA was isolated from thymus and/or thymic tumor tissue using TRIzol(Invitogen) reagent and the manufacturer’s recommended protocol. Forsome experiments, double-negative (DN) thymocytes were purified by thedepletion of CD4�CD8� double positive (DP), CD4 single positive (SP),and CD8 SP using the MACS system (Miltenyi Biotec). Thymoctyes werestained for 15 min at 4°C with the micromagnetic bead-conjugated Abs,
anti-CD4 and anti-CD8. After washing, the cells were magnetically sepa-rated using a MACS LS columns (Miltenyi Biotec). The purity was 94–99%. cDNA was synthesized from 1 �g of RNA template, again using themanufacturer’s recommended protocol (Superscript II; Invitrogen). Taq-Man probes for the following mouse genes were purchased from AppliedBiosystems: HoxA10 (Mm00433966_m1), HoxA9 (Mm00439364_m1),and HoxA7 (Mm00657963_m1). Relative expression levels of target tran-scripts were analyzed on an Applied Biosystems 7500 Fast real-time PCRsystem and normalized to the 18S ribosomal RNA using relative cycle timevalue. For Tcrb real-time quantification (RQ), PCR was performed usingSYBR Green (Fast 7500 real-time PCR system; Applied Biosystems). Rel-ative quantification used the Tcrb and primers described above and nor-malized to actin (also described above). Thermal cycling parameters were50°C for 2 min, 95°C for 10 min, and cycle steps of 95°C for 15 s and 60°Cfor 1 min for 40 cycles.
Statistical analysis
Data are expressed as the mean � SEM or SD, where applicable. Differ-ences between groups were analyzed by Student’s t test. Values of p lessthan 0.05 were considered to be significant.
ResultsBoth T and B lymphocyte numbers are decreased in PB fromNHD13 mice
Similar to our prior observations, complete blood counts obtainedfrom clinically healthy 6- to 9-mo-old NHD13 mice (line G2, gen-erated on a C57BL/6 background) showed macrocytic anemia andleukopenia (10). In this cohort of mice, the lymphopenia seen inthe NHD13 mice was quite marked (2.21 vs 8.72 K/�l; p � 0.01)compared with WT littermate controls (supplemental Table S1).7
This lymphopenia was due to a decrease in both T and B cells.FACS analysis of PB and splenocytes from NHD13 mice revealeddecreased numbers of CD4� T lymphocytes compared with WTcontrols (Fig. 1, A and B). In both the PB and spleen, there was atrend toward decreased numbers of CD8� cells as well; however,this trend did not reach statistical significance (Fig. 1, A and B).Interestingly, although the absolute numbers of PB and spleenB220� cells were similar between the NHD13 mice and WT con-trols, close inspection of the FACS plots (Fig. 1D) demonstratedthat the NHD13 B220� cells were dim, suggesting that these werenot normal, mature B cells. Moreover, although many of the WTB220� cells in the PB or spleen were also positive for IgM, theNHD13 mice showed a dramatic decrease in the number of matureB220�/IgM� B cells (Fig. 1, A and B). As expected given thedecreased numbers of B220�/IgM� cells, the NHD13 mice showed asignificant decrease in circulating levels of IgG and IgM Abs (Fig.1C). In addition, a small, but detectable population of immatureCD4�/CD8� cells could now be detected in the NHD13 spleen (datanot shown).
To exclude the possibility that the decreased numbers of maturelymphocytes were due to the integration site of the NHD13 trans-gene, we analyzed the lymphoid compartment in an independentline of transgenic mice (line C1) that were generated on an FVB/Nbackground (10). As shown in supplemental Fig. S1, NHD13 micegenerated on an FVB/N background also showed decreased num-bers of circulating B and T cells. Similar to results obtained withthe NHD13 line G2, the number of B220�/IgM� cells in thespleen was decreased, and the spleen contained an increased pro-portion of B220 dim cells (Fig. S1). These findings demonstratethat the impaired lymphoid development was not dependent on theintegration site.
Impaired B cell differentiation at the pro-B to pre-B stage
To better characterize the B cell lymphopenia, we determined thedevelopmental stages (Hardy fractions) of BM B cells (14). The
7 The online version of this article contains supplemental material.
6228 NHD13 IMPAIRS T AND B CELL DIFFERENTIATION
by guest on June 19, 2018http://w
ww
.jimm
unol.org/D
ownloaded from

mean total numbers of BM cells were similar between WT andNHD13 mice (n � 5 each; median age � 6 mo; 7.49 � 107 cellsfor WT and 6.39 � 107 cells for NHD13). Although the pro-B cell(B220�/CD43�) populations showed no clear differences betweenthe NHD13 and WT BM (Fig. 2), the NHD13 BM showed signif-icantly decreased pre-B cell (B220�/CD43�) populations, sug-gesting impaired differentiation at the pro-B to pre-B stage of dif-ferentiation (Fig. 2). A finer analysis showed an increase in thepercentage of Hardy B fraction and a decrease in the Hardy C andC� fractions, suggesting a partial block in differentiation at theHardy B to Hardy C fraction stage of differentiation. Also, al-though there was a 6-fold reduction in the percentage of pre-Bcells in the BM (3.22 vs 0.55%; Fig. 2B), the proportion of Hardyfractions D–F was similar between the NHD13 and WT mice (Fig.2A), suggesting that the pro-B cells that escaped the differentiationblock were then able to mature normally.
NHD13 mice have small thymi, absent cortex, and decreasedCD4�CD8� thymocytes
We consistently observed a decrease in the size of the thymus fromNHD13 mice compared with WT mice; representative gross mor-phology of a NHD13 mouse (7 mo old) is shown in Fig. 3A. Asexpected, the total number of thymocytes from NHD13 mice wasalso decreased compared with the WT thymi (1.75 � 107 vs9.21 � 107; p � 0.01; Fig. 3B). Histologic examination showedthat the NHD13 mice have no discernible medulla (Fig. 3D), con-sistent with the observation that the NHD13 mice had decreasednumbers of circulating mature T lymphocytes (Fig. 1, A and B).Analysis of cell surface markers demonstrated a marked increasein the CD4�CD8� (DN) population ( p � 0.001) and a markeddecrease in the CD4�CD8� (DP) population ( p � 0.001) in theNHD13 mice compared with WT mice (Fig. 3E). Further analysisof the DN population revealed a more variable increase in the DN1(which may include a small number of lineage-positive cells) andDN2 population, as well as a decrease in the DN3 and DN4 pop-ulation in thymi from the NHD13 thymus, suggesting a partialblock at the DN1 to DN2 or DN2 to DN3 transition (Fig. 3, F andG). Given that the absolute numbers of mature SP CD4 and CD8cells were reduced in the NHD13 thymi, it was not surprising thatmicroscopic examination of the NHD13 thymi revealed a mark-edly atretic medulla (Fig. 3D). Again, to rule out a transgene in-tegration effect, we analyzed an independent line of NHD13 mice(line C1 (10)). As shown in Fig. S1, the proportion of DP thymo-cytes was markedly reduced in the NHD13 mice, and the propor-tion of DN thymocytes markedly increased.
We investigated the stage(s) of differentiation that is mostprominently inhibited by the NHD13 transgene, using in vivoproliferation assays with BrdU. As shown in Fig. S2, the ma-jority of BrdU-positive NHD13 thymocytes were in the DNpopulation, more specifically in the DN1 population. However,it should also be noted that a subset of thymocytes escapes thispartial block, and continues to proliferate, as evidenced by re-sidual BrdU-positive DN2, DN3, DN4, and DP thymocytes(Fig. S2). These findings are most consistent with a partialblock at the DN1 to DN2 transition.
To determine whether an increased rate of apoptosis could ac-count for the decreased total thymocyte number, we stained freshthymocytes with annexin V and PI to identify apoptotic cells. Al-though thymocytes from the NHD13 mice showed an increasedannexin V�/PI� population (late apoptosis (15, 16); p � 0.05),this difference was only marginally significant (Fig. 4A). Reason-ing that many of the apoptotic thymocytes might not be detecteddue to efficient clearance by tissue macrophages, we assayed thy-mocytes cultured in vitro for apoptosis. Thymocytes from the
FIGURE 1. NHD13 mice show decreased B and T lymphocytes in PB.A, FACS analysis of CD4/CD8- and IgM/B220-positive cells in PB fromNHD13 mice (n � 5) and WT littermate controls (n � 6). PB from NHD13mice revealed a marked decrease in CD4 SP and B220�/IgM� cells com-pared with WT controls (��, p � 0.01). The decrease in CD8 SP cells wasnot statistically significant (p � 0.05). B, FACS analysis of CD4/CD8- andIgM/B220-positive splenocytes. Splenocytes from NHD13 mice (n � 5)showed a marked decrease in CD4 SP and B220�/IgM� cells compared withWT controls (n � 6; ��, p � 0.01). The decrease in CD8 SP cells was notstatistically significant (p � 0.05). C, NHD13 mice showed markedly de-creased serum IgM and IgG (n � 4; median age � 7 mo; �, p � 0.05; ��, p �0.01). D, Representative FACS plots of B220/IgM expression from WT andNHD13 mice (upper panel, PB; lower panel, spleen). NHD13 mice showedincreased numbers of B220 dim (solid box) cells and decreased numbers ofB220 bright (dotted box) cells compared with WT controls.
6229The Journal of Immunology
by guest on June 19, 2018http://w
ww
.jimm
unol.org/D
ownloaded from

NHD13 mice died much more rapidly than did WT thymocytes;after 3 days of culture, there were 100-fold fewer viable thymo-cytes from the NHD13 mice (Fig. 4B). The cells died due to anapoptotic process, as evidenced by increased annexin V and PIpositivity (Fig. 4C). As expected from the cell survival curve (Fig.4B), there were dramatically more apoptotic thymocytes in theNHD13 wells compared with the WT wells, and almost 100% ofthymocytes had undergone apoptosis by day 3 (Fig. 4, B and C).
Clonality of NHD13 thymocytes
Functional Tcrb transcripts result from the rearrangement of germ-line V, D, and J region segments in the genomic DNA of thedeveloping T lymphocyte (17, 18). This physical reconfigurationof genomic DNA can then serve as a marker for clonality of thy-mocytes that have undergone VDJ recombination. Therefore, todetermine clonality of the NHD13 thymocyte population, we useddegenerate RT-PCR to identify clonal Tcrb gene rearrangements(supplemental Fig. S3). As expected, the WT thymi showed poly-clonal Tcrb gene rearrangements; of 40 clones analyzed, no twowere identical (supplemental Table S2). Because SCL/LMO1 dou-ble-transgenic mice, which also showed a partial differentiationblock at the DN to DP stage and developed pre-T LBL, showedevidence of oligoclonal thymocyte expansion before the onset of a
frank malignancy (11), we anticipated that we might find evidencefor clonal or oligoclonal VDJ rearrangements in the NHD13 thy-mocytes harvested from clinically healthy (nonleukemic) mice.However, in the initial NHD13 thymus we analyzed (mouse 1079),only 2 of 34 clones (79-1 and 79-113) had an identical VDJ rear-rangement, suggesting that there was no significant clonal expan-sion of thymocytes that had completed VDJ rearrangement of theTcrb locus (Table I). Interestingly, close inspection of the VDJjunctions revealed a novel, surprising finding. Subclones 79-3, 79-15, 79-60, 79-109, 79-132, 79-137, and 79-138 had an identicalD-J junction, with precisely the same N region nucleotide addition(TATCTCCAATA), but distinct, nonclonal V-D junctions (TableI). Moreover, a second group of 11 clones from mouse 1079 (sub-clones 79-2, 5, 8, 65, 84, 24, 108, 123, 124, 125, and 134) dem-onstrated a similar finding: identical D-J junctions, but distinctV-D junctions (Table I). The most likely explanation for this clonalDJ, distinct VD pattern was that a thymocyte had undergone amarked clonal expansion following DJ rearrangement, but beforeV-D rearrangement.
This novel and characteristic clonal DJ, distinct VD pattern wasreproduced in four of five additional NHD13 mice (1080, 1084,5078, and 5091); one mouse (5051) showed only a clonal VDJrearrangement (Table I and supplemental Table S3). If the above
FIGURE 2. Decreased number ofpre-B cells in NHD13 BM. A, Repre-sentative FACS plots of pro-B andpre-B cells from NHD13 mice andWT controls. The percentage ofpro-B cells (B220�/CD43�) is simi-lar in the NHD13 and WT BM.NHD13 BM showed a decreasedproportion of pre-B cells (B220�/CD43�). Hardy fractions A, B, C, C�,D, E, and F are indicated. B, Statisti-cal analysis of pooled data (n � 5NHD13 and 5 WT mice); pre-B cells(B220�/CD43�) were significantly de-creased in NHD13 BM (��, p � 0.01).
6230 NHD13 IMPAIRS T AND B CELL DIFFERENTIATION
by guest on June 19, 2018http://w
ww
.jimm
unol.org/D
ownloaded from

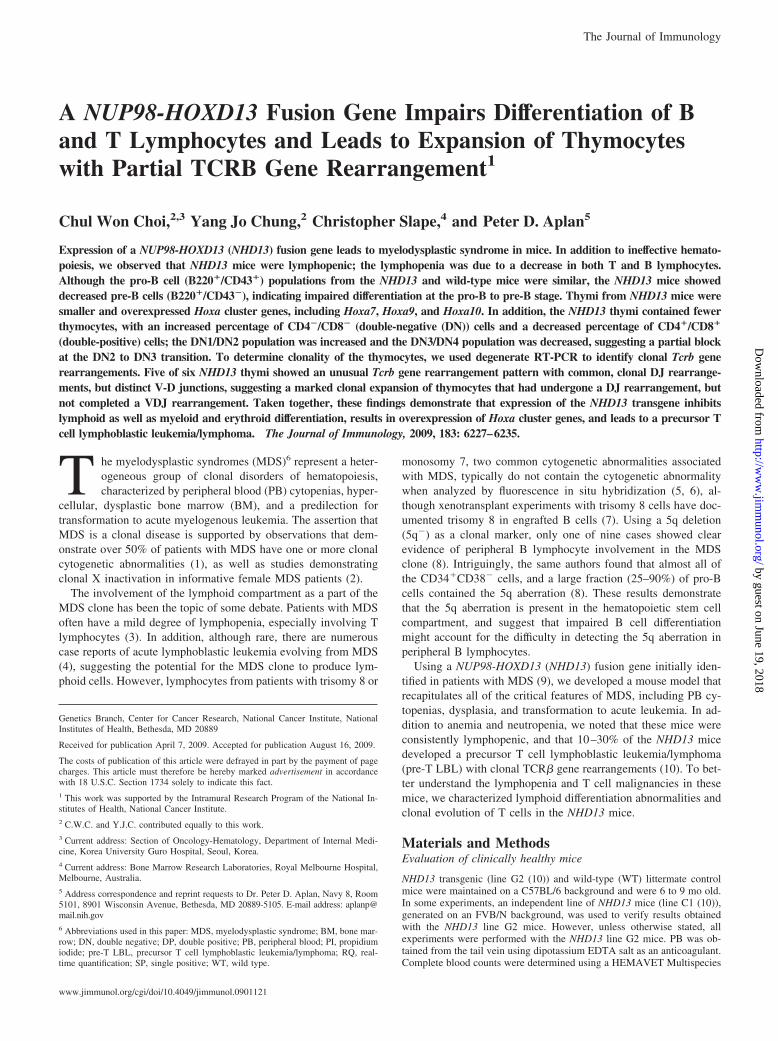
hypothesis is correct (a thymocyte with a clonal DJ rearrangementexpanded and divided numerous times before the subsequent V-Drearrangement), then it should be possible to detect a thymocyteclone that had the unique, clonal DJ rearrangement, but had not yetundergone V-D rearrangement, and therefore had a germline V-Dconfiguration. To address this question, we performed PCR anal-ysis on genomic DNA from two NHD13 thymi that showed theclonal DJ, distinct VD pattern (1079 and 1080), using primers 5�of D1 (and thus deleted during V-D rearrangement) and 3� of J1S4,as shown in Fig. 5A. Based on the two predominant DJ rearrange-ments recovered in the subclones from mouse 1079 (Table I), wewould expect fragments of 648 bp, representing the D1-J1S3 fu-sion, and 1096 bp, representing the D1-J1S1 fusion, depicted sche-matically in Fig. 5B. Using a similar analysis, we would expect afragment of 146 bp (representing a D1-J1S4 fusion) in thymusDNA from mouse 1080. We would not expect any clonal rear-rangements in the WT control thymus, but might recover poly-clonal D1-J1S4 rearrangements. Clonal fragments as predictedwere recovered from 1079 and 1080 thymic DNA (Fig. 5C); thesewere sequenced and shown to contain the clonal D-J junctionsshown in Table I. The 145-bp PCR product from the WT mouse(Fig. 5C) was subcloned, and four independent clones were se-quenced; all contained different D1-J1S4 junctions, with unique Nregions, indicating that these represented polyclonal D1-J1S4 Tcrbgene rearrangements (supplemental Table S4).
To determine whether thymocytes with the clonal DJ, distinctVD rearrangements could be detected in PB, we studied spleensfrom mice 1079, 1084, and 5051, all of which displayed the clonalDJ, distinct VD pattern in the thymus. Surprisingly, of 47 Tcrb
FIGURE 4. Increased apoptosis of NHD13 thymocytes. A, Apoptosisassay of fresh thymocytes using annexin V and PI; late apoptotic (annexinV�/PI�) cells were increased in NHD13 thymi (n � 5 NHD13 and 5 WTmice; �, p � 0.05). B, In vitro culture of thymocytes demonstrates rapiddeath of NHD13 thymocytes (��, p � 0.01). C, Percentage of apoptoticcells following in vitro culture (��, p � 0.01).
FIGURE 3. Impaired differentiation and decreased thymocyte number in NHD13 mice. A, Gross morphology of thymi from WT and NHD13 mice (age7 mo). B, Decreased total number of thymocytes in NHD13 thymus (n � 7 NHD13 and 7 WT mice; median age � 7 mo old; ��, p � 0.01). C, WT thymus(upper panel, original �50; lower panel, original �400). D, NHD13 thymus (upper panel, original �50; lower panel, original �400). Note absent medullain NHD13 thymus. E, Representative FACS plots of thymocytes from WT and NHD13 mice stained with CD4, CD8, CD44, and CD25. Upper panel, ShowsCD4 and CD8 distribution; lower panel, shows CD44 and CD25 staining of DN cells. DN1, DN2, DN3, and DN4 populations are indicated. F, IncreasedDN and decreased DP thymocytes from NHD13 mice (n � 7) compared with WT (n � 9) mice aged 7–9 mo; ��, p � 0.01. G, Analysis of DNsubpopulations. Note the variable increase in the DN1 and DN2 population, as well as a decrease in the DN3 and DN4 population in thymi from the NHD13thymi (n � 7) compared with WT thymi (n � 9); �, p � 0.05.
6231The Journal of Immunology
by guest on June 19, 2018http://w
ww
.jimm
unol.org/D
ownloaded from

clones analyzed, none were derived from the known clonal DJ,distinct VD classes identified in the thymi of these mice (supple-mental Table S5), suggesting that the thymocytes with clonal DJrearrangements did not mature and migrate from the thymus.
To evaluate which thymocyte population (i.e., DN, DP, CD4SP,CD8SP) contains the clonal DJ, distinct VD thymocytes, we sortedthymocytes from NHD13 mouse (5200) and assayed Tcrb generearrangements, as described above (supplemental Fig. S2 and
Table I. Tcrb gene rearrangements from NHD13 thymi (mice 1079 and 1080)
Sub-clone V N D N J IFa
79-2b V8S3 AGCAGTGATgc CTTG CAGGG caAACACAGA J1S1 Y79-5 V8S3 GTGCCAGCAgtgatg CAGTAG CAGGG caAACACAGA J1S1 Y79-8 V8S3 GTGCCAGCAgtgatg GTGAGGG AGGG caAACACAGA J1S1 Y79-65 V8S3 GTGCCAGCAGtgatg GG GGGACAGGG caAACACAGA J1S1 N79-84 V8S3 GTGCCAGCAGtgatg GGGACAGGG caAACACAGA J1S1 Y79-24 V6S1 GTGCCAGCAgtatag CAGGG caAACACAGA J1S1 Y79-108 V8S3 GTGCCAGCAGTGATG GCTCC GGGACAGGG caAACACAGA J1S1 Y79-123 V8S3 TGCCAGCagtgatg CCC GGGACAGGG caAACACAGA J1S1 Y79-124 V8S3 TGCCAGCAGTGATG GCGTG GGGACAGGG caAACACAGA J1S1 Y79-125 V8S2 GTGCCAGCGGTGATG CTGAAA ACAGGG caAACACAGA J1S1 N79-134 V5S2 TGTGCCAGCTCtctc GACAGGG caAACACAGA J1S1 Y79-3 V8S3 CAGTGATG CGAGA CAGGGG TATCTCCAATA TTCTGGAAATACGCT J1S3 Y79-15 V8S2 TGCCAGCGGtgatg GGTGCC GGGACAGGGG TATCTCCAATA TTCTGGAAATACGCT J1S3 Y79-60 V8S2 TGCCAGCGGTGATG G GGGACAGGGG TATCTCCAATA TTCTGGAAATACGCT J1S3 Y79-109 V8S3 TGCCAGCAGTGATG CGA GACAGGGG TATCTCCAATA TTCTGGAAATACGCT J1S3 Y79-132 V2S1 ACCTGCAGTGCaga T GGACAGGGG TATCTCCAATA TTCTGGAAATACGCT J1S3 Y79-137 V8S2 GTGCCAGCGGTGATG GACAGGGG TATCTCCAATA TTCTGGAAATACGCT J1S3 Y79-138 V8S3 GTGCCAGCAGTGATG A GGGACAGGGG TATCTCCAATA TTCTGGAAATACGCT J1S3 Y79-1 V8S2 GTGCCAGCGGTGATG C GACTGGGGG ctcCTATGAACAGTA J2S7 Y79-113 V8S2 GTGCCAGCGGTGATG C GACTGGGGG ctcCTATGAACAGTA J2S7 Y79-99 V8S3 CAGCAGTGAtg CCC GGGACAGGGG caAACTCCGACTAC J1S2 Y79-119 V5S1 TGTGCCAGCTCtctc GC GGACAG CAAACTCCGACTAC J1S2 Y79-6 V8S2 TGCCAGCGGTGAtg AG CTGGGGGG AGA ctcctatGAACAGTA J2S7 Y79-117 V5S1 TGTGCCAGCTCtctc CT TT ctccTATGAACAGTA J2S7 Y79-127 V8S3 GTGCCAGCAGTGATG GGACTGGGGG T ctccTATGAACAGTA J2S7 Y79-136 V5S2 TGTGCCAGCTCTCtc CC GGAC AGGGGGCA ctccTATGAACAGTA J2S7 Y79-149 V5S1 TGTGCCAGCTCTCTc TGGGGGGG T ctcctaTGAACAGTA J2S7 Y79-130 V8S2 GTGCCAGCGGTgatg ACA AATTT ttcTGGAAATACGCT J1S3 Y79-133 V8S3 TGCCAGCAgtgatg TC GACAGGGGGC ttCTGGAAATACGCT J1S3 Y79-143 V8S3 CAGCagtgatg TCAG GGGAC ttctGGAAATACGCT J1S3 Y79-100 V6S1 TGTGCCAGCagtatag CCT CT AGGGGGGGGGGGA TAACTATGCTGAGC J2S1 N79-120 V8S3 TGCCAGCAGTGATg TGGGGG TCT AGTGCAGAAAC J2S3 Y79-85 V8S3 GCCAGCAGTgatg TAC GGAC AGGGGAGG agtCAAAACAC J2S4 Y79-148 V8S3 CAGCAGTGATg CC GC CG AACCAAGACACCCAGT J2S5 Y80-3-31 V8S3 GTGCCAGCTGTGATG CC GGGACA CTCTT tttcCAACGAAAG J1S4 Y80-3-47 V8S3 CCAGCAGTGatg GGACA CTCTT tttcCAACGAAAG J1S4 Y80-3-2 V8S3 GTGCCAGCAGTGATg ACCG CA CTCTT tttcCAACGAAAG J1S4 Y80-1 V8S3 GTGCCAGCAGTGatg GACC GGGACA CTCTT tttcCAACGAAAG J1S4 Y80-6 V8S3 GTGCCAGCagtgatg GGGACA CTCTT tttcCAACGAAAG J1S4 Y80-7 V8S3 GTGCCAGCAGTgatg AGGC GACA CTCTT tttcCAACGAAAG J1S4 Y80-3-94 V8S3 GTGCCAGCAGTGATG AAGG A CTCTT tttcCAACGAAAG J1S4 Y80-3-56 V8S3 GTGCCAGCAGTGATG TGATAAGGA GGACA CTCTT tttcCAACGAAAG J1S4 Y80-3-63 V8S3 TGTGCCAGCagtgatg GGG GGGACA CTCTT tttcCAACGAAAG J1S4 Y80-97 V6S1 GTGCCAGCAGTATAG GGACA CTCTT tttcCAACGAAAG J1S4 Y80-107 V8S3 TGCCAGCAGTGATG CCCCCG CA CTCTT tttcCAACGAAAG J1S4 Y80-108 V6S1 GCCAGCAGTATAG GACA CTCTT tttcCAACGAAAG J1S4 Y80-109 V8S3 TGCCAGCAGTGATG CGGAC GGGACA CTCTT tttcCAACGAAAG J1S4 Y80-113 V8S2 GTGCCAGCGGTGatg GGACA CTCTT tttcCAACGAAAG J1S4 Y80-112 V8S3 GTGCCAGCAGTGatg CG GGGACA CTCTT tttcCAACGAAAG J1S4 Y80-128 V8S2 TGCCAGCGGTGATG GGAA GGACA CTCTT tttcCAACGAAAG J1S4 Y80-131 V8S3 GTGCCAGCAGtgatg ACAGAACC GGGACA CTCTT tttcCAACGAAAG J1S4 Y80-3-21 V14S1 CTGGAGTCT taacaacCAGGCTCCG J1S5 Y80-3-67 V14S1 CTGGAGTCT taacaacCAGGCTCCG J1S5 Y80-3-85 V8S2 TGCCAGCGGtgatg GATCA GACTGGGG A agtgCAGAAACGC J2S3 Y80-3-93 V8S2 TGCCAGCGGtgatg GATCA GACTGGGG A agtgCAGAAACGC J2S3 Y80-99 V8S2 TGCCAGCGGTgatg CCA GAC AGGGT ctcctaTGAACAGT J2S7 Y80-123 V8S2 TGCCAGCGGTgatg CCA GAC AGGGT ctcctaTGAACAGT J2S7 Y80-17 V8S3 CAGCAGTGAtg CAGGG ATG caaaCACAGAAG J1S1 Y80-98 V8S3 CAGCAGTgatg AAAGGCCGGA GACAG C CAAACTCCGACTAC J1S2 Y80-3-91 V8S2 GCCAGCGGTgatg C GGACA A TTTCCAACGAAAG J1S4 Y80-32 V8S3 CAGCAGTGAtg GGA AGAA tTCCTATAAT J1S6 Y80-127 V8S3 GTGCCAGCAGTGatg G TG ttcctATAATTCGC J1S6 Y80-3-34 V8S3 CCCTGATGG�(98)�� CA GGGACTGGGG CCCTCC TAACTATGCT J2S1 Y80-103 V5S1 CCAGCTCTCTC CCACA GGGGGC G taacTATGCTGAGC J2S1 Y80-121 V8S3 GTGCCAGCAGTGatg G TT CAAACACCGGGCAG J2S2 Y80-3-40 V8S3 CAGCAGTGAtg CTGGGGG AGTCAAAACAC J2S4 Y80-105 V8S2 TGCCAGCGGTGATG CAAA GGACTGGGGGG TCAG agtcaAAACACCTTGT J2S4 Y80-124 V8S3 GTGCCAGCAGTGATG GGAC ACT T AGTCAAAACACCTTGT J2S4 Y80-111 V8S3 TGTGCCAGCAGTGatg GC GGGGC aaccaAGACACCCAG J2S5 Y80-5 V8S2 CAGCGGTGAtg CTCA GGGGGC C CTCCTATGAACAG J2S7 Y80-12 V8S3 GTGCCAGCAGTGATG C CTGGGGGGG A ctccTATGAACAG J2S7 Y80-116 V8S3 GTGCCAGCAGTgatg CCT GACTGGGG CCT ctcCTATGAACAGT J2S7 Y80-118 V8S3 GTGCCAGCAGTGATG C GGGAC AA ctccTATGAACAGT J2S7 Y80-126 V8S3 GTGCCAGCAGTGatg GGGACTGGGGGGG T ctccTATGAACAGT J2S7 Y
a IF, in-frame.b Clones outlined in grey display the clonal D-J, distinct V-D pattern.c Bold lowercase letters indicate nucleotides deleted from germline V, J segments. V, D, and J segments are underlined.
6232 NHD13 IMPAIRS T AND B CELL DIFFERENTIATION
by guest on June 19, 2018http://w
ww
.jimm
unol.org/D
ownloaded from
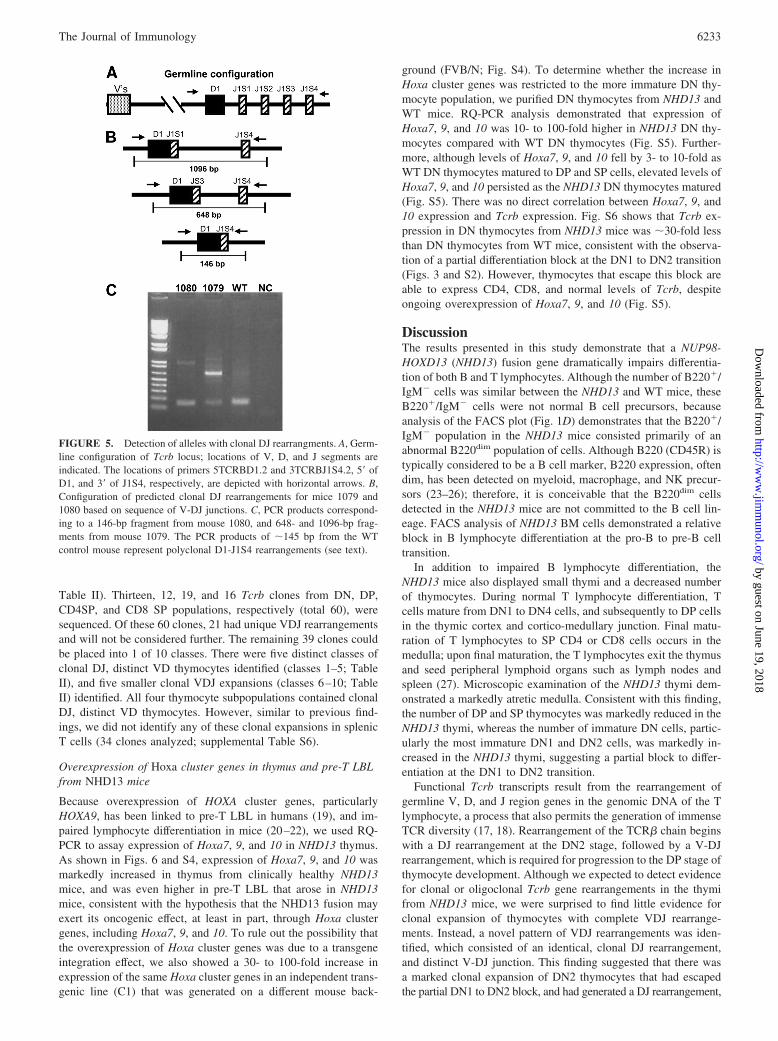
Table II). Thirteen, 12, 19, and 16 Tcrb clones from DN, DP,CD4SP, and CD8 SP populations, respectively (total 60), weresequenced. Of these 60 clones, 21 had unique VDJ rearrangementsand will not be considered further. The remaining 39 clones couldbe placed into 1 of 10 classes. There were five distinct classes ofclonal DJ, distinct VD thymocytes identified (classes 1–5; TableII), and five smaller clonal VDJ expansions (classes 6–10; TableII) identified. All four thymocyte subpopulations contained clonalDJ, distinct VD thymocytes. However, similar to previous find-ings, we did not identify any of these clonal expansions in splenicT cells (34 clones analyzed; supplemental Table S6).
Overexpression of Hoxa cluster genes in thymus and pre-T LBLfrom NHD13 mice
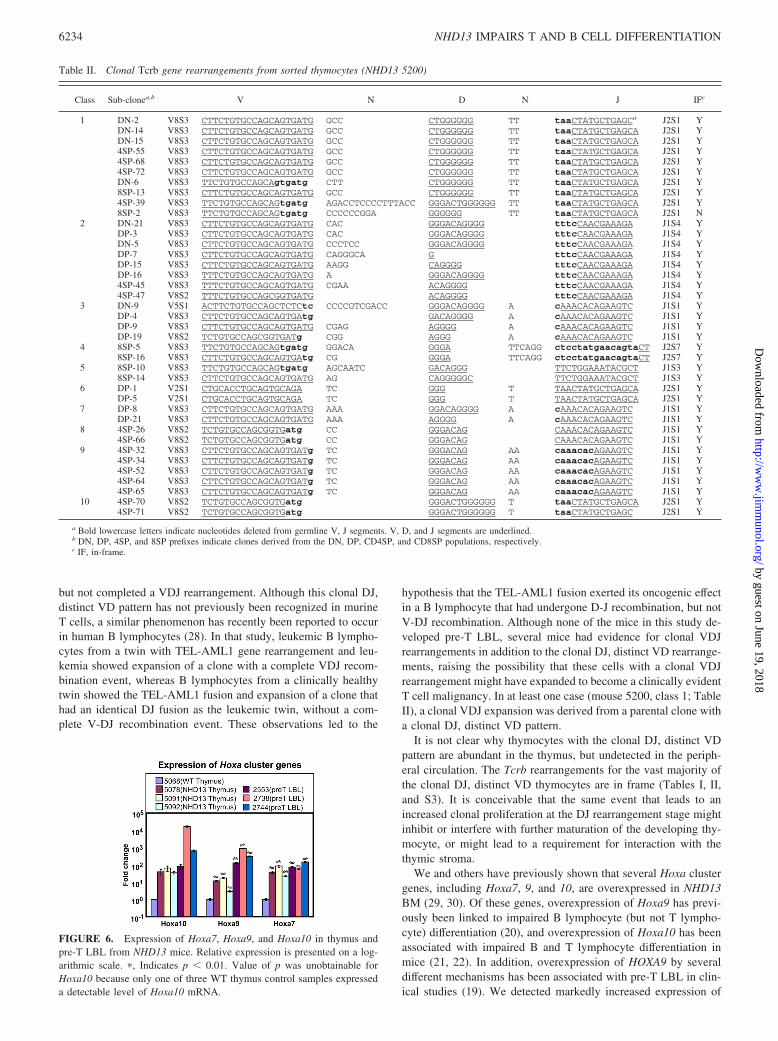
Because overexpression of HOXA cluster genes, particularlyHOXA9, has been linked to pre-T LBL in humans (19), and im-paired lymphocyte differentiation in mice (20–22), we used RQ-PCR to assay expression of Hoxa7, 9, and 10 in NHD13 thymus.As shown in Figs. 6 and S4, expression of Hoxa7, 9, and 10 wasmarkedly increased in thymus from clinically healthy NHD13mice, and was even higher in pre-T LBL that arose in NHD13mice, consistent with the hypothesis that the NHD13 fusion mayexert its oncogenic effect, at least in part, through Hoxa clustergenes, including Hoxa7, 9, and 10. To rule out the possibility thatthe overexpression of Hoxa cluster genes was due to a transgeneintegration effect, we also showed a 30- to 100-fold increase inexpression of the same Hoxa cluster genes in an independent trans-genic line (C1) that was generated on a different mouse back-
ground (FVB/N; Fig. S4). To determine whether the increase inHoxa cluster genes was restricted to the more immature DN thy-mocyte population, we purified DN thymocytes from NHD13 andWT mice. RQ-PCR analysis demonstrated that expression ofHoxa7, 9, and 10 was 10- to 100-fold higher in NHD13 DN thy-mocytes compared with WT DN thymocytes (Fig. S5). Further-more, although levels of Hoxa7, 9, and 10 fell by 3- to 10-fold asWT DN thymocytes matured to DP and SP cells, elevated levels ofHoxa7, 9, and 10 persisted as the NHD13 DN thymocytes matured(Fig. S5). There was no direct correlation between Hoxa7, 9, and10 expression and Tcrb expression. Fig. S6 shows that Tcrb ex-pression in DN thymocytes from NHD13 mice was 30-fold lessthan DN thymocytes from WT mice, consistent with the observa-tion of a partial differentiation block at the DN1 to DN2 transition(Figs. 3 and S2). However, thymocytes that escape this block areable to express CD4, CD8, and normal levels of Tcrb, despiteongoing overexpression of Hoxa7, 9, and 10 (Fig. S5).
DiscussionThe results presented in this study demonstrate that a NUP98-HOXD13 (NHD13) fusion gene dramatically impairs differentia-tion of both B and T lymphocytes. Although the number of B220�/IgM� cells was similar between the NHD13 and WT mice, theseB220�/IgM� cells were not normal B cell precursors, becauseanalysis of the FACS plot (Fig. 1D) demonstrates that the B220�/IgM� population in the NHD13 mice consisted primarily of anabnormal B220dim population of cells. Although B220 (CD45R) istypically considered to be a B cell marker, B220 expression, oftendim, has been detected on myeloid, macrophage, and NK precur-sors (23–26); therefore, it is conceivable that the B220dim cellsdetected in the NHD13 mice are not committed to the B cell lin-eage. FACS analysis of NHD13 BM cells demonstrated a relativeblock in B lymphocyte differentiation at the pro-B to pre-B celltransition.
In addition to impaired B lymphocyte differentiation, theNHD13 mice also displayed small thymi and a decreased numberof thymocytes. During normal T lymphocyte differentiation, Tcells mature from DN1 to DN4 cells, and subsequently to DP cellsin the thymic cortex and cortico-medullary junction. Final matu-ration of T lymphocytes to SP CD4 or CD8 cells occurs in themedulla; upon final maturation, the T lymphocytes exit the thymusand seed peripheral lymphoid organs such as lymph nodes andspleen (27). Microscopic examination of the NHD13 thymi dem-onstrated a markedly atretic medulla. Consistent with this finding,the number of DP and SP thymocytes was markedly reduced in theNHD13 thymi, whereas the number of immature DN cells, partic-ularly the most immature DN1 and DN2 cells, was markedly in-creased in the NHD13 thymi, suggesting a partial block to differ-entiation at the DN1 to DN2 transition.
Functional Tcrb transcripts result from the rearrangement ofgermline V, D, and J region genes in the genomic DNA of the Tlymphocyte, a process that also permits the generation of immenseTCR diversity (17, 18). Rearrangement of the TCR� chain beginswith a DJ rearrangement at the DN2 stage, followed by a V-DJrearrangement, which is required for progression to the DP stage ofthymocyte development. Although we expected to detect evidencefor clonal or oligoclonal Tcrb gene rearrangements in the thymifrom NHD13 mice, we were surprised to find little evidence forclonal expansion of thymocytes with complete VDJ rearrange-ments. Instead, a novel pattern of VDJ rearrangements was iden-tified, which consisted of an identical, clonal DJ rearrangement,and distinct V-DJ junction. This finding suggested that there wasa marked clonal expansion of DN2 thymocytes that had escapedthe partial DN1 to DN2 block, and had generated a DJ rearrangement,
FIGURE 5. Detection of alleles with clonal DJ rearrangments. A, Germ-line configuration of Tcrb locus; locations of V, D, and J segments areindicated. The locations of primers 5TCRBD1.2 and 3TCRBJ1S4.2, 5� ofD1, and 3� of J1S4, respectively, are depicted with horizontal arrows. B,Configuration of predicted clonal DJ rearrangements for mice 1079 and1080 based on sequence of V-DJ junctions. C, PCR products correspond-ing to a 146-bp fragment from mouse 1080, and 648- and 1096-bp frag-ments from mouse 1079. The PCR products of 145 bp from the WTcontrol mouse represent polyclonal D1-J1S4 rearrangements (see text).
6233The Journal of Immunology
by guest on June 19, 2018http://w
ww
.jimm
unol.org/D
ownloaded from
but not completed a VDJ rearrangement. Although this clonal DJ,distinct VD pattern has not previously been recognized in murineT cells, a similar phenomenon has recently been reported to occurin human B lymphocytes (28). In that study, leukemic B lympho-cytes from a twin with TEL-AML1 gene rearrangement and leu-kemia showed expansion of a clone with a complete VDJ recom-bination event, whereas B lymphocytes from a clinically healthytwin showed the TEL-AML1 fusion and expansion of a clone thathad an identical DJ fusion as the leukemic twin, without a com-plete V-DJ recombination event. These observations led to the
hypothesis that the TEL-AML1 fusion exerted its oncogenic effectin a B lymphocyte that had undergone D-J recombination, but notV-DJ recombination. Although none of the mice in this study de-veloped pre-T LBL, several mice had evidence for clonal VDJrearrangements in addition to the clonal DJ, distinct VD rearrange-ments, raising the possibility that these cells with a clonal VDJrearrangement might have expanded to become a clinically evidentT cell malignancy. In at least one case (mouse 5200, class 1; TableII), a clonal VDJ expansion was derived from a parental clone witha clonal DJ, distinct VD pattern.
It is not clear why thymocytes with the clonal DJ, distinct VDpattern are abundant in the thymus, but undetected in the periph-eral circulation. The Tcrb rearrangements for the vast majority ofthe clonal DJ, distinct VD thymocytes are in frame (Tables I, II,and S3). It is conceivable that the same event that leads to anincreased clonal proliferation at the DJ rearrangement stage mightinhibit or interfere with further maturation of the developing thy-mocyte, or might lead to a requirement for interaction with thethymic stroma.
We and others have previously shown that several Hoxa clustergenes, including Hoxa7, 9, and 10, are overexpressed in NHD13BM (29, 30). Of these genes, overexpression of Hoxa9 has previ-ously been linked to impaired B lymphocyte (but not T lympho-cyte) differentiation (20), and overexpression of Hoxa10 has beenassociated with impaired B and T lymphocyte differentiation inmice (21, 22). In addition, overexpression of HOXA9 by severaldifferent mechanisms has been associated with pre-T LBL in clin-ical studies (19). We detected markedly increased expression of
FIGURE 6. Expression of Hoxa7, Hoxa9, and Hoxa10 in thymus andpre-T LBL from NHD13 mice. Relative expression is presented on a log-arithmic scale. �, Indicates p � 0.01. Value of p was unobtainable forHoxa10 because only one of three WT thymus control samples expresseda detectable level of Hoxa10 mRNA.
Table II. Clonal Tcrb gene rearrangements from sorted thymocytes (NHD13 5200)
Class Sub-clonea,b V N D N J IFc
1 DN-2 V8S3 CTTCTGTGCCAGCAGTGATG GCC CTGGGGGG TT taaCTATGCTGAGCa J2S1 YDN-14 V8S3 CTTCTGTGCCAGCAGTGATG GCC CTGGGGGG TT taaCTATGCTGAGCA J2S1 YDN-15 V8S3 CTTCTGTGCCAGCAGTGATG GCC CTGGGGGG TT taaCTATGCTGAGCA J2S1 Y4SP-55 V8S3 CTTCTGTGCCAGCAGTGATG GCC CTGGGGGG TT taaCTATGCTGAGCA J2S1 Y4SP-68 V8S3 CTTCTGTGCCAGCAGTGATG GCC CTGGGGGG TT taaCTATGCTGAGCA J2S1 Y4SP-72 V8S3 CTTCTGTGCCAGCAGTGATG GCC CTGGGGGG TT taaCTATGCTGAGCA J2S1 YDN-6 V8S3 TTCTGTGCCAGCAgtgatg CTT CTGGGGGG TT taaCTATGCTGAGCA J2S1 Y8SP-13 V8S3 CTTCTGTGCCAGCAGTGATG GCC CTGGGGGG TT taaCTATGCTGAGCA J2S1 Y4SP-39 V8S3 TTCTGTGCCAGCAGtgatg AGACCTCCCCTTTACC GGGACTGGGGGG TT taaCTATGCTGAGCA J2S1 Y8SP-2 V8S3 TTCTGTGCCAGCAGtgatg CCCCCCGGA GGGGGG TT taaCTATGCTGAGCA J2S1 N
2 DN-21 V8S3 CTTCTGTGCCAGCAGTGATG CAC GGGACAGGGG tttcCAACGAAAGA J1S4 YDP-3 V8S3 CTTCTGTGCCAGCAGTGATG CAC GGGACAGGGG tttcCAACGAAAGA J1S4 YDN-5 V8S3 CTTCTGTGCCAGCAGTGATG CCCTCC GGGACAGGGG tttcCAACGAAAGA J1S4 YDP-7 V8S3 CTTCTGTGCCAGCAGTGATG CAGGGCA G tttcCAACGAAAGA J1S4 YDP-15 V8S3 CTTCTGTGCCAGCAGTGATG AAGG CAGGGG tttcCAACGAAAGA J1S4 YDP-16 V8S3 TTTCTGTGCCAGCAGTGATG A GGGACAGGGG tttcCAACGAAAGA J1S4 Y4SP-45 V8S3 TTTCTGTGCCAGCAGTGATG CGAA ACAGGGG tttcCAACGAAAGA J1S4 Y4SP-47 V8S2 TTTCTGTGCCAGCGGTGATG ACAGGGG tttcCAACGAAAGA J1S4 Y
3 DN-9 V5S1 ACTTCTGTGCCAGCTCTCtc CCCCGTCGACC GGGACAGGGG A cAAACACAGAAGTC J1S1 YDP-4 V8S3 CTTCTGTGCCAGCAGTGAtg GACAGGGG A cAAACACAGAAGTC J1S1 YDP-9 V8S3 CTTCTGTGCCAGCAGTGATG CGAG AGGGG A cAAACACAGAAGTC J1S1 YDP-19 V8S2 TCTGTGCCAGCGGTGATg CGG AGGG A cAAACACAGAAGTC J1S1 Y
4 8SP-5 V8S3 TTCTGTGCCAGCAGtgatg GGACA GGGA TTCAGG ctcctatgaacagtaCT J2S7 Y8SP-16 V8S3 CTTCTGTGCCAGCAGTGAtg CG GGGA TTCAGG ctcctatgaacagtaCT J2S7 Y
5 8SP-10 V8S3 TTCTGTGCCAGCAGtgatg AGCAATC GACAGGG TTCTGGAAATACGCT J1S3 Y8SP-14 V8S3 CTTCTGTGCCAGCAGTGATG AG CAGGGGGC TTCTGGAAATACGCT J1S3 Y
6 DP-1 V2S1 CTGCACCTGCAGTGCAGA TC GGG T TAACTATGCTGAGCA J2S1 YDP-5 V2S1 CTGCACCTGCAGTGCAGA TC GGG T TAACTATGCTGAGCA J2S1 Y
7 DP-8 V8S3 CTTCTGTGCCAGCAGTGATG AAA GGACAGGGG A cAAACACAGAAGTC J1S1 YDP-21 V8S3 CTTCTGTGCCAGCAGTGATG AAA AGGGG A cAAACACAGAAGTC J1S1 Y
8 4SP-26 V8S2 TCTGTGCCAGCGGTGatg CC GGGACAG CAAACACAGAAGTC J1S1 Y4SP-66 V8S2 TCTGTGCCAGCGGTGatg CC GGGACAG CAAACACAGAAGTC J1S1 Y
9 4SP-32 V8S3 CTTCTGTGCCAGCAGTGATg TC GGGACAG AA caaacacAGAAGTC J1S1 Y4SP-34 V8S3 CTTCTGTGCCAGCAGTGATg TC GGGACAG AA caaacacAGAAGTC J1S1 Y4SP-52 V8S3 CTTCTGTGCCAGCAGTGATg TC GGGACAG AA caaacacAGAAGTC J1S1 Y4SP-64 V8S3 CTTCTGTGCCAGCAGTGATg TC GGGACAG AA caaacacAGAAGTC J1S1 Y4SP-65 V8S3 CTTCTGTGCCAGCAGTGATg TC GGGACAG AA caaacacAGAAGTC J1S1 Y
10 4SP-70 V8S2 TCTGTGCCAGCGGTGatg GGGACTGGGGGG T taaCTATGCTGAGCA J2S1 Y4SP-71 V8S2 TCTGTGCCAGCGGTGatg GGGACTGGGGGG T taaCTATGCTGAGC J2S1 Y
a Bold lowercase letters indicate nucleotides deleted from germline V, J segments. V, D, and J segments are underlined.b DN, DP, 4SP, and 8SP prefixes indicate clones derived from the DN, DP, CD4SP, and CD8SP populations, respectively.c IF, in-frame.
6234 NHD13 IMPAIRS T AND B CELL DIFFERENTIATION
by guest on June 19, 2018http://w
ww
.jimm
unol.org/D
ownloaded from

Hoxa7, 9, and 10 in thymus from clinically healthy NHD13 micethat was further increased in pre-T LBL that arose in the NHD13mice, suggesting a role for Hoxa cluster gene overexpression inthese malignancies. Although it is difficult to directly compare theaforementioned animal models of Hoxa overexpression, becauseonly one of the mouse studies used a Hoxa transgene targetedspecifically to the hematopoietic compartment (20), it seems thatthe degree of B and T lymphocyte inhibition was more severe inthe NHD13 mice than in mice that overexpress only Hoxa9 orHoxa10 (20–22). This may be due to an additive effect caused byNHD13-induced overexpression of several Hoxa cluster genessimultaneously.
Although it is not clear why the NHD13 mice have a moredramatic decrease in T and B lymphocytes than is typically seen inpatients with MDS, one plausible explanation is outlined below.Spontaneously occurring MDS is thought to be largely due to ac-quired, not inherited mutations. Thus, patients with MDS generallyhave some level of residual, normal lymphohematopoiesis, includ-ing long-lived T and B memory cells, which does not involve theMDS clone. However, because the NHD13 mice are generated byinsertion of a transgene in the germline, they have no residualnormal cells to provide normal lymphohematopoiesis, and the onlylymphoid cells that develop are relatively rare cells that escape thedifferentiation inhibition caused by the NHD13 transgene.
In summary, we demonstrated that NHD13 transgene inhibitslymphoid as well as myeloid and erythroid differentiation. In the Bcell lineage, this inhibition results from a block at the pro-B topre-B stage, and leads to a �5-fold decrease in circulating B cellsand Ig levels. In the T cell lineage, the inhibition occurs at theDN2-DN3 transition, and is associated with a marked overex-pression of Hoxa7, Hoxa9, and Hoxa10. Similar to the situationseen in patients with pre-T LBL, overexpression of Hoxa7,Hoxa9, and Hoxa10 is associated with impaired thymocyte dif-ferentiation and leads to pre-T LBL. Finally, detailed analysisof NHD13 thymocytes revealed a marked expansion of thymo-cytes that had a D-J rearrangement, and generation of a largepopulation of thymocytes with a common clonal D-J rearrange-ment, but distinct V-D rearrangements.
AcknowledgmentsWe thank Dave Caudell, Helge Hartung, Sarah Beachy, R. Keith Humphries,and Warren Pear for insightful discussions.Contribution: C.W.C. designed and performed research, analyzed data, andwrote the first draft of the manuscript. Y.J.C. designed and performedresearch and analyzed data. C.S. designed and performed research andanalyzed data. P.D.A. designed research, analyzed data, and wrote the finaldraft of the manuscript.
DisclosuresThe authors have no financial conflict of interest.
References1. Haase, D., U. Germing, J. Schanz, M. Pfeilstocker, T. Nosslinger, B. Hildebrandt,
A. Kundgen, M. Lubbert, R. Kunzmann, A. A. Giagounidis, et al. 2007. Newinsights into the prognostic impact of the karyotype in MDS and correlation withsubtypes: evidence from a core dataset of 2124 patients. Blood 110: 4385–4395.
2. Gale, R. E. 1999. Evaluation of clonality in myeloid stem-cell disorders. Semin.Hematol. 36: 361–372.
3. Hamblin, T. 1992. Immunologic abnormalities in myelodysplastic syndromes.Hematol. Oncol. Clin. North Am. 6: 571–586.
4. Disperati, P., C. V. Ichim, D. Tkachuk, K. Chun, A. C. Schuh, and R. A. Wells.2006. Progression of myelodysplasia to acute lymphoblastic leukemia: implica-tions for disease biology. Leuk. Res. 30: 233–239.
5. Gerritsen, W. R., J. Donohue, J. Bauman, S. C. Jhanwar, N. A. Kernan,H. Castro-Malaspina, R. J. O’Reilly, and J. H. Bourhis. 1992. Clonal analysis ofmyelodysplastic syndrome: monosomy 7 is expressed in the myeloid lineage, but
not in the lymphoid lineage as detected by fluorescent in situ hybridization. Blood80: 217–224.
6. Saitoh, K., I. Miura, N. Takahashi, and A. B. Miura. 1998. Fluorescence in situhybridization of progenitor cells obtained by fluorescence-activated cell sortingfor the detection of cells affected by chromosome abnormality trisomy 8 in pa-tients with myelodysplastic syndromes. Blood 92: 2886–2892.
7. Kerbauy, D. M., V. Lesnikov, B. Torok-Storb, E. Bryant, and H. J. Deeg. 2004.Engraftment of distinct clonal MDS-derived hematopoietic precursors in NOD/SCID-�2-microglobulin-deficient mice after intramedullary transplantation of he-matopoietic and stromal cells. Blood 104: 2202–2203.
8. Nilsson, L., I. Astrand-Grundstrom, I. Arvidsson, B. Jacobsson, E. Hellstrom-Lindberg,R. Hast, and S. E. Jacobsen. 2000. Isolation and characterization of hematopoietic pro-genitor/stem cells in 5q-deleted myelodysplastic syndromes: evidence for involvement atthe hematopoietic stem cell level. Blood 96: 2012–2021.
9. Raza-Egilmez, S. Z., S. N. Jani-Sait, M. Grossi, M. J. Higgins, T. B. Shows, andP. D. Aplan. 1998. NUP98-HOXD13 gene fusion in therapy-related acute my-elogenous leukemia. Cancer Res. 58: 4269–4273.
10. Lin, Y. W., C. Slape, Z. Zhang, and P. D. Aplan. 2005. NUP98-HOXD13 trans-genic mice develop a highly penetrant, severe myelodysplastic syndrome thatprogresses to acute leukemia. Blood 106: 287–295.
11. Chervinsky, D. S., X. F. Zhao, D. H. Lam, M. Ellsworth, K. W. Gross, andP. D. Aplan. 1999. Disordered T-cell development and T-cell malignancies inSCL LMO1 double-transgenic mice: parallels with E2A-deficient mice. Mol.Cell. Biol. 19: 5025–5035.
12. Chervinsky, D. S., D. H. Lam, M. P. Melman, K. W. Gross, and P. D. Aplan.2001. scid Thymocytes with TCR� gene rearrangements are targets for the on-cogenic effect of SCL and LMO1 transgenes. Cancer Res. 61: 6382–6387.
13. Danska, J. S., F. Pflumio, C. J. Williams, O. Huner, J. E. Dick, and C. J. Guidos.1994. Rescue of T cell-specific V(D)J recombination in SCID mice by DNA-damaging agents. Science 266: 450–455.
14. Hardy, R. R., C. E. Carmack, S. A. Shinton, J. D. Kemp, and K. Hayakawa. 1991.Resolution and characterization of pro-B and pre-pro-B cell stages in normalmouse bone marrow. J. Exp. Med. 173: 1213–1225.
15. Mirakian, R., K. Nye, F. F. Palazzo, A. W. Goode, and L. J. Hammond. 2002.Methods for detecting apoptosis in thyroid diseases. J. Immunol. Methods 265:161–175.
16. Van Engeland, M., L. J. Nieland, F. C. Ramaekers, B. Schutte, andC. P. Reutelingsperger. 1998. Annexin V-affinity assay: a review on an apoptosisdetection system based on phosphatidylserine exposure. Cytometry 31: 1–9.
17. Chien, Y. H., N. R. Gascoigne, J. Kavaler, N. E. Lee, and M. M. Davis. 1984.Somatic recombination in a murine T-cell receptor gene. Nature 309: 322–326.
18. Nikolich-Zugich, J., M. K. Slifka, and I. Messaoudi. 2004. The many importantfacets of T-cell repertoire diversity. Nat. Rev. Immunol. 4: 123–132.
19. Van Vlierberghe, P., M. van Grotel, J. Tchinda, C. Lee, H. B. Beverloo,P. J. van der Spek, A. Stubbs, J. Cools, K. Nagata, M. Fornerod, et al. 2008. Therecurrent SET-NUP214 fusion as a new HOXA activation mechanism in pediatricT-cell acute lymphoblastic leukemia. Blood 111: 4668–4680.
20. Thorsteinsdottir, U., A. Mamo, E. Kroon, L. Jerome, J. Bijl, H. J. Lawrence,K. Humphries, and G. Sauvageau. 2002. Overexpression of the myeloid leuke-mia-associated Hoxa9 gene in bone marrow cells induces stem cell expansion.Blood 99: 121–129.
21. Taghon, T., F. Stolz, M. De Smedt, M. Cnockaert, B. Verhasselt, J. Plum, andG. Leclercq. 2002. HOX-A10 regulates hematopoietic lineage commitment: ev-idence for a monocyte-specific transcription factor. Blood 99: 1197–1204.
22. Thorsteinsdottir, U., G. Sauvageau, M. R. Hough, W. Dragowska, P. M. Lansdorp,H. J. Lawrence, C. Largman, and R. K. Humphries. 1997. Overexpression ofHOXA10 in murine hematopoietic cells perturbs both myeloid and lymphoid differ-entiation and leads to acute myeloid leukemia. Mol. Cell. Biol. 17: 495–505.
23. Balciunaite, G., R. Ceredig, S. Massa, and A. G. Rolink. 2005. A B220� CD117�
CD19� hematopoietic progenitor with potent lymphoid and myeloid develop-mental potential. Eur. J. Immunol. 35: 2019–2030.
24. Anderson, K., C. Rusterholz, R. Mansson, C. T. Jensen, K. Bacos, S. Zandi,Y. Sasaki, C. Nerlov, M. Sigvardsson, and S. E. Jacobsen. 2007. Ectopic expres-sion of PAX5 promotes maintenance of biphenotypic myeloid progenitors coex-pressing myeloid and B-cell lineage-associated genes. Blood 109: 3697–3705.
25. Rolink, A., E. ten Boekel, F. Melchers, D. T. Fearon, I. Krop, and J. Andersson.1996. A subpopulation of B220� cells in murine bone marrow does not expressCD19 and contains natural killer cell progenitors. J. Exp. Med. 183: 187–194.
26. Dannaeus, K., A. Johannisson, K. Nilsson, and J. I. Jonsson. 1999. Flt3 ligandinduces the outgrowth of Mac-1�B220� mouse bone marrow progenitor cellsrestricted to macrophage differentiation that coexpress early B cell-associatedgenes. Exp. Hematol. 27: 1646–1654.
27. Scollay, R., and D. I. Godfrey. 1995. Thymic emigration: conveyor belts or luckydips? Immunol. Today 16: 268–273, discussion 273–264.
28. Hong, D., R. Gupta, P. Ancliff, A. Atzberger, J. Brown, S. Soneji, J. Green,S. Colman, W. Piacibello, V. Buckle, et al. 2008. Initiating and cancer-propa-gating cells in TEL-AML1-associated childhood leukemia. Science 319:336–339.
29. Chung, Y. J., C. W. Choi, C. Slape, T. Fry, and P. D. Aplan. 2008. Transplan-tation of a myelodysplastic syndrome by a long-term repopulating hematopoieticcell. Proc. Natl. Acad. Sci. USA 105: 14088–14093.
30. Pineault, N., C. Buske, M. Feuring-Buske, C. Abramovich, P. Rosten,D. E. Hogge, P. D. Aplan, and R. K. Humphries. 2003. Induction of acute my-eloid leukemia in mice by the human leukemia-specific fusion gene NUP98-HOXD13 in concert with Meis1. Blood 101: 4529–4538.
6235The Journal of Immunology
by guest on June 19, 2018http://w
ww
.jimm
unol.org/D
ownloaded from