Embed Size (px)
Citation preview

A PERFORMANCE COMPARISON OF ZFS AND BTRFS ON LINUX
Bachelor Degree Project in Information Technology with a Specialization in Network and Systems AdministrationLevel ECTSSpring term 2015
Anders Lundholm
Supervisor: Thomas FischerExaminer: Jonas Mellin
Date: 2015-06-14

Abstract
In this thesis, the average throughput of Btrfs and ZFS on Linux is compared by conducting a set of experiments. Btrfs and ZFS are two enterprise-grade file systems that are designed with data integrity and scalability in mind and they bring numerous of other useful features as well. Btrfs is a relatively young file system whereas ZFS is more mature. However, the implementation of ZFS on the Linux platform was released only recently. The main conclusions that can be drawn from the analysis of the gathered data is that Btrfs has improved greatly in recent years and is today showing great throughput whereas ZFS on Linux is performing considerably worse than Btrfs.
Keywords: linux, zfs, btrfs, file system, performance, average throughput.

Table of Contents1 Introduction.......................................................................................................................................1
1.1 Thesis Structure.........................................................................................................................1
2 Background........................................................................................................................................2
2.1 File Systems...............................................................................................................................2
2.1.1 Linux File Systems.............................................................................................................3
2.2 ZFS.............................................................................................................................................3
2.2.1 OpenZFS and ZFS on Linux..............................................................................................3
2.2.2 ZFS Design........................................................................................................................4
2.3 Btrfs...........................................................................................................................................5
2.3.1 Btrfs Design.......................................................................................................................5
2.4 File System Experiments...........................................................................................................6
2.5 Related Experiments..................................................................................................................7
3 Problem Formulation.........................................................................................................................8
3.1 Research Question.....................................................................................................................8
3.2 Motivation..................................................................................................................................8
3.3 Objectives and Scope.................................................................................................................9
4 Methodology....................................................................................................................................10
4.1 Experiment...............................................................................................................................10
4.1.1 Alternative Methods and Discussion................................................................................11
4.2 Experimental Setup..................................................................................................................12
4.2.1 Disk Setup........................................................................................................................12
4.3 Experimental Tools and Setup.................................................................................................13
4.3.1 Filebench Setup................................................................................................................14
4.3.2 IOzone Setup....................................................................................................................15
4.4 Validity Threats........................................................................................................................15
4.4.1 Conclusion Validity..........................................................................................................15
4.4.2 Internal Validity................................................................................................................16
4.4.3 Construct Validity.............................................................................................................17
4.4.4 External Validity...............................................................................................................17
5 Results.............................................................................................................................................18
5.1 Filebench Results.....................................................................................................................18
5.1.1 Single Disk.......................................................................................................................18
5.1.2 RAID 10...........................................................................................................................18

5.1.3 RAID 5.............................................................................................................................21
5.2 IOzone Results.........................................................................................................................22
5.2.1 Single Disk.......................................................................................................................22
5.2.2 RAID 10...........................................................................................................................24
5.2.3 RAID 5.............................................................................................................................26
6 Analysis...........................................................................................................................................29
6.1 Analysis of Features.................................................................................................................31
6.2 Comparison to Related Work...................................................................................................32
7 Conclusion.......................................................................................................................................34
7.1 Ethical Aspects and Social Impact...........................................................................................34
7.2 Reflection.................................................................................................................................34
7.3 Future Work.............................................................................................................................35
8 Non-Technical Summary.................................................................................................................36
Appendix A – File system setup
Appendix B – Filebench configurations
Appendix C – Filebench experiment script
Appendix D – IOzone experiment script
Appendix E – Validity threat list
Appendix F – Filebench single disk results
Appendix G – Filebench RAID 10 results
Appendix H – Filebench RAID 5 results
Appendix I – IOzone single disk results
Appendix J – IOzone RAID 10 results
Appendix K – IOzone RAID 5 results

1 Introduction
This thesis presents a comparison between Btrfs and ZFS on the Linux platform. This is done by first introducing some background information about the two file systems, including the current stability status and what organizations are backing them. Further, the average throughput is compared by performing experiments on the two file systems. In addition to this, a qualitative analysis of important features, other than the average throughput is done.
The main purpose of a file system is to control how data is stored and how it is retrieved. Traditional Linux file systems, such as XFS and ext4, have problems with data integrity, for instance, they have no defense against silent data corruption. Btrfs (often pronounced as “Butter F S”) and ZFS are two file systems that are, among other things, aiming to address this issue. Both file systems are designed with data integrity in mind but they also bring many other useful features. For enterprise-grade file systems, which are file systems that are used for business critical applications, scalability is an important aspect. Although some traditional Linux file systems, for example XFS, have proven to scale well, Btrfs and ZFS are designed specifically with scalability in mind.
Heger (2009) have shown that Btrfs has the potential to be the de facto Linux file system, showing similar performance as ext4 and ZFS in experiments using a single disk. However the study also showed that at the time the performance for the RAID setup was not able to compete with ext4 and ZFS. Four years later, Rodeh et al. (2013) compared the performance of Btrfs against XFS and ext4. In some areas Btrfs was showing great improvements in performance, especially for the RAID setup, but it still lacked in some other areas.
1.1 Thesis Structure
The structure of this thesis is as follows: Chapter 1 introduces the reader to the subject for the thesis. Chapter 2 gives the reader some background information about file systems in general, Linux file systems, and the design of ZFS and Btrfs. Also included in Chapter 2 is some information about file system experiments and what is important to consider when doing such experiments. Chapter 2 is then be concluded with some information about previous work. Chapter 3 introduces the problem formulation with the motivation, the objectives, and the scope for the thesis. Chapter 4 presents the methodology that is used in this thesis, including a specification of the setup of the entire experiment. Chapter 4 also presents alternative methods that could be used and some discussion around this and what validity threats that might exist for the chosen method and how they have been handled. Chapter 5 presents the results from the experiments and Chapter 6 presents an analysis of the results and explains how this could impact the reader. Chapter 6 also includes a qualitative analysis of important features, other than the average throughput. Chapter 7 presents a conclusion of the finding in this thesis with suggestions for future work. Finally Chapter 8 offers a summary of the project, written in such a way that it is understandable for people that are not specialized in IT.
1

2 Background
This chapter covers the basics of file systems with focus on Linux file systems followed by some background of ZFS and Btrfs and how they are designed.
2.1 File Systems
A file system is used to control how data is stored and retrieved. Silberschatz et al. (2005, p. 412-413) describes how the file system is usually composed of several layers (see Figure 1). Each layer uses the features of lower layers to create new features for use by the higher layers. The lowest layer, the I/O control, consists of device drivers and interrupt handlers. At this layer, information is transferred between the main memory and the disk system. The purpose of the device drivers is to translate high-level commands, such as retrieving a certain disk block, to low-level hardware specific instructions. The basic file system issues generic commands to the appropriate device driver to read and write physical blocks on the disk. The file-organization module translates logical block addresses to physical block addresses for the basic file system to transfer. Finally, the logical file system manages the metadata information, this includes the directory structure.
2
Figure 1: Layered file system (Based on Silberschatz et al. 2005, p. 412, Fig. 11.1)
Application Programs
File-Organization Module
Device
Basic File System
I/O Control
Logical File System

2.1.1 Linux File Systems
As defined by Silberschatz et al. (2005, p. 764-765), Linux is modeled after the classical UNIX file system model. In Linux, a file does not have to be an object stored on a disk, instead it can be anything capable of handling the input or output of a stream of data. For instance, device drivers, interprocess-communication channels or network connections can appear as files to the user. The Linux kernel handles all these types by handling the implementation details of the files behind a layer of software called the Virtual File System (VFS).
2.2 ZFS
The development of ZFS began in 2001 and it was originally developed by Sun Microsystems for the Solaris operating system. According to one of the original developers of ZFS, Jeff Bonwick (2006), ZFS originally stood for “Zettabyte File System”. Bonwick (2006) came up with the name because ZFS was to be a 128-bit file system, and the next unit after exabyte (the 64-bit limit is 16EB) is zettabyte. However Bonwick (2006) and his team later changed the name to not mean anything. The source code for ZFS was released as open source in 2005 as part of the OpenSolaris operating system and has since been ported to several other platforms. The illumos project was founded as an open source fork of OpenSolaris in 2010 and many new features and performance improvements have been added to ZFS by the project since then (Siden, 2014).
The source code for ZFS was released under the Common Development and Distribution License (CDDL) (Siden, 2014), which is an Open Source Initiative (OSI) approved open source license. The Linux kernel is released under the GNU General Public License Version 2 (GPL-2.0) (Linux Kernel Organization, 2014), which also is an OSI approved open source license. However, the two licenses are incompatible in such a way that it prevents using pieces of code exclusively available under one license with pieces of code exclusively available under the other in the same binary. This means that ZFS may not be included in the Linux kernel, instead the users must install it and load it in to the kernel themselves (ZFS on Linux, 2013).
2.2.1 OpenZFS and ZFS on Linux
The native Linux kernel port of the ZFS file system is called “ZFS on Linux”. The first stable release of ZFS on Linux was released in March 2013 (Siden, 2014). In September 2013, the OpenZFS project was announced as the “truly open source successor to the ZFS project” (Siden, 2014). The OpenZFS community brings together developers from the illumos, FreeBSD, Linux, and OS X platforms, and a wide range of companies that build products on top of OpenZFS (Siden, 2013).
Siden (2013) specifies, on the OpenZFS projects main page, that the high-level goals of OpenZFS is to raise awareness of open source implementations of ZFS and to encourage open communication to improve ZFS. He also specifies that the main technical goal of OpenZFS is to make it easier to share code between the platforms.
3
2.2.2 ZFS Design
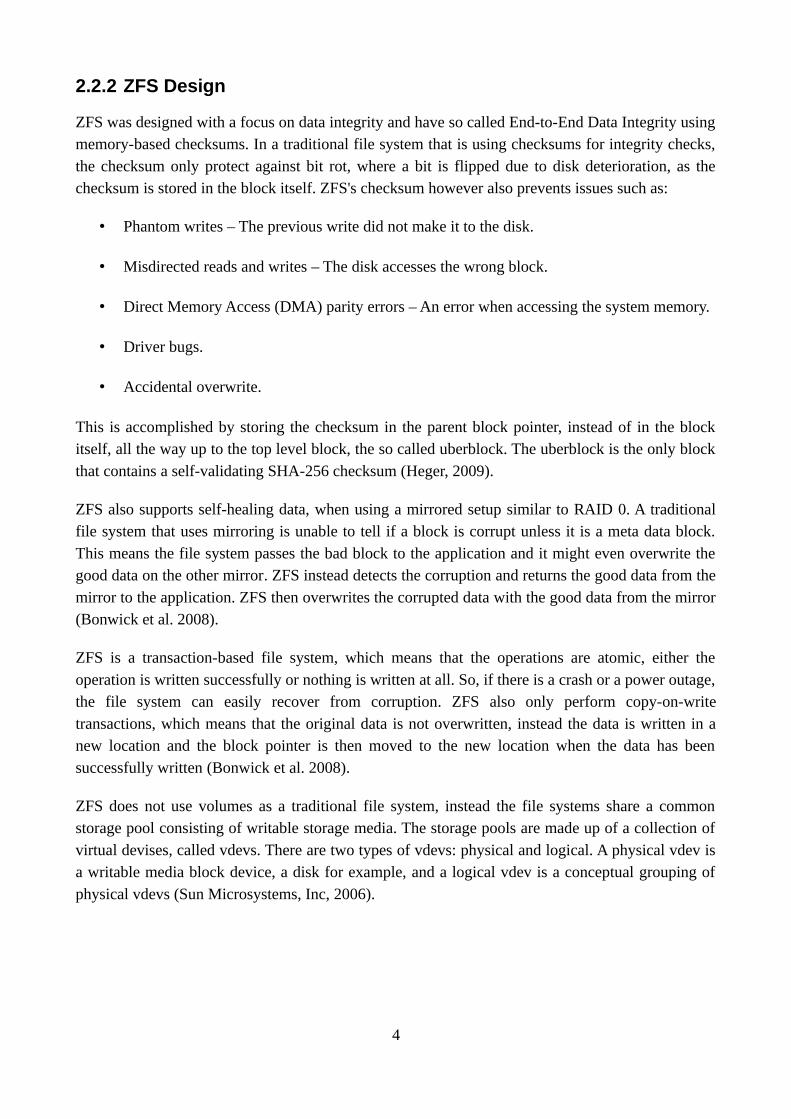
ZFS was designed with a focus on data integrity and have so called End-to-End Data Integrity using memory-based checksums. In a traditional file system that is using checksums for integrity checks, the checksum only protect against bit rot, where a bit is flipped due to disk deterioration, as the checksum is stored in the block itself. ZFS's checksum however also prevents issues such as:
• Phantom writes – The previous write did not make it to the disk.
• Misdirected reads and writes – The disk accesses the wrong block.
• Direct Memory Access (DMA) parity errors – An error when accessing the system memory.
• Driver bugs.
• Accidental overwrite.
This is accomplished by storing the checksum in the parent block pointer, instead of in the block itself, all the way up to the top level block, the so called uberblock. The uberblock is the only block that contains a self-validating SHA-256 checksum (Heger, 2009).
ZFS also supports self-healing data, when using a mirrored setup similar to RAID 0. A traditional file system that uses mirroring is unable to tell if a block is corrupt unless it is a meta data block. This means the file system passes the bad block to the application and it might even overwrite the good data on the other mirror. ZFS instead detects the corruption and returns the good data from the mirror to the application. ZFS then overwrites the corrupted data with the good data from the mirror (Bonwick et al. 2008).
ZFS is a transaction-based file system, which means that the operations are atomic, either the operation is written successfully or nothing is written at all. So, if there is a crash or a power outage, the file system can easily recover from corruption. ZFS also only perform copy-on-write transactions, which means that the original data is not overwritten, instead the data is written in a new location and the block pointer is then moved to the new location when the data has been successfully written (Bonwick et al. 2008).
ZFS does not use volumes as a traditional file system, instead the file systems share a common storage pool consisting of writable storage media. The storage pools are made up of a collection of virtual devises, called vdevs. There are two types of vdevs: physical and logical. A physical vdev is a writable media block device, a disk for example, and a logical vdev is a conceptual grouping of physical vdevs (Sun Microsystems, Inc, 2006).
4

2.3 Btrfs
Btrfs, just as ZFS, is a copy-on-write file system that implements advanced features while focusing on fault tolerance, repair and easy administration. Btrfs is designed from the ground up for Linux and it aims to solve scalability problems for larger and faster storage, while also adding features that existing Linux file systems lack. Btrfs is licensed under the GNU GPL license and it is open for contributions from anyone (Mason, 2008a; McPherson, 2009).
The project started its development at Oracle by Chris Mason and it was first announced in 2007 (Mason, 2007). Developers from Red Hat, SUSE, Intel, Facebook, Fujitsu, Netgear among others have contributed to the development (Merlin, 2014a).
The stability of Btrfs at the time of writing this thesis is debatable. The file system on-disk format is considered stable and is not expected to change. However, the Btrfs code base is still under “heavy development” (Sterba, 2014). The frequently asked questions section of the Btrfs wiki gives the following advise regarding the stability: “If you are concerned about stability in commercial production use, you should test btrfs on a testbed system under production workloads to see if it will do what you want of it.” (Mills, 2012)
Since 2014, Chris Mason and a number of other Btrfs developers are working for Facebook and they are continuing to work on the upstream Btrfs file system support. Facebook is one of few larger companies (Merlin, 2014b) that are currently running Btrfs in a production environment. They are testing Btrfs within their “web tier”, which is the tier that's easiest to recover from in case of any issues with their initial roll-out (Larabel, 2014).
In addition, one of the largest Linux enterprise distributions, SUSE has indicated that they consider Btrfs to be ready for use in production by setting Btrfs as the default file system for SUSE Linux Enterprise Server 12 (SUSE 2015).
2.3.1 Btrfs Design
Btrfs uses B-trees as its main on-disk data structure. A B-tree is a data structure where each node can contain a key and a value. In a B-tree, in comparison to a binary tree, a node can have more than two children. Btrfs is based on a variant of B-tree called B+-tree which contains all the keys at the bottom of the tree, also known as the leaves. The upper levels, which are organized as a B-tree, consist only of an index to enable rapid location of the index and key parts (Comer, 1979).
One aspect that differentiates Btrfs from other file systems is that the data-structure approach uses a copy-on-write friendly B-tree. B-trees in their native form is otherwise not compatible with copy-on-write since the leaves of the tree are linked together (Aurora, 2009). This means that when the location of one leaf changes, such as when new data is written, the information is copied to a new block which in turn changes the link to the adjacent leaf, which then triggers another copy-on-write and that location changes, and so on. The result of this is that the entire B-tree has to be rewritten every time one leaf is changed. The main idea of Btrfs however is to use a standard B+-tree
5

construction with some modifications that among other improvements removes leaf-chaining to make the updates of the tree more efficient (Rodeh et al. 2013).
2.4 File System Experiments
Many factors must be taken into account when performing performance tests on a file system. The state of the system during the experiments runs can have a significant effect on the results. Traeger et al. (2008) identifies that a major factor that can effect the result is nonessential processes running during the experiment. Another major factor that can effect the result is the system's cache state. Systems generally do not run with completely “cold” caches but if caches where to be used in an experiment, requests could be served from memory, and the file system might not be adequately exercised. If a warm-cache is to be used in an experiment, this could be accomplished by simply running the test N+1 times and discarding the data from the first run.
As defined by Tarasov et al. (2011), file system performance, and how to measuring it, can be defined differently depending on what is specifically tested. For instance, tests of accessing small or large files. A single number or a single experiment is not sufficient to tell how well a file system performs. Not only is it important to conduct multiple experiments but also to analyze the different results to help the reader apply them to their own situation.
There are four important guidelines for running experiments properly (Traeger et al. 2008):
1. Every repetition of the experiment must be identical.
2. Each test should be run several times to ensure accuracy, and standard deviations or confidence level should be computed to determine the appropriate number of runs.
3. Tests should be run for a period of time sufficient for the system to reach steady state for the majority of the run.
4. The process should preferably be automated using scripts or available tools to minimize the mistakes associated with manual repetitive tasks.
Traeger et al. (2008) also identifies that there are three main types of experiments that can be used:
1. Macrobenchmarks – Exercise multiple file system operations. These are usually good for an overall view of the system's performance.
2. Trace-Based – Exercise the system with a representative real-world workload. These can help give a better understanding how a system would behave under normal use.
3. Microbenchmarks – Exercise few (usually one or two) operations. These are useful for measuring a very small change to better understand the result of a macrobenchmark, to isolate the effects of specific parts of the system, or to show worst-case behavior.
6

2.5 Related Experiments
Heger (2009) compares ZFS on OpenSolaris and Nexenta Core Platform 2 against Btrfs and ext4 on Linux. ZFS and Btrfs both used the default mount options. The method Heger used was a set of microbenchmarks, testing sequential read and write, random read and write, and a mix of read, write and delete operations. The disk setup used are both a single disk and a RAID 10 setup.
Rodeh et al. (2013) compares Btrfs with XFS and ext4 in a single disk test with both micro- and macrobenchmarks. They also compare Btrfs with XFS in a RAID 10 setup with a set of microbenchmarks. The software used for the macrobenchmark was Filebench with some of the same profiles that was used in this thesis.
A comparison of the results from the cited papers, to the results gathered in this thesis is done in Section 6.2.
7
3 Problem Formulation
This chapter covers the research question this thesis aims to answer and the motivation for the thesis as well as the objectives and the scope.
3.1 Research Question
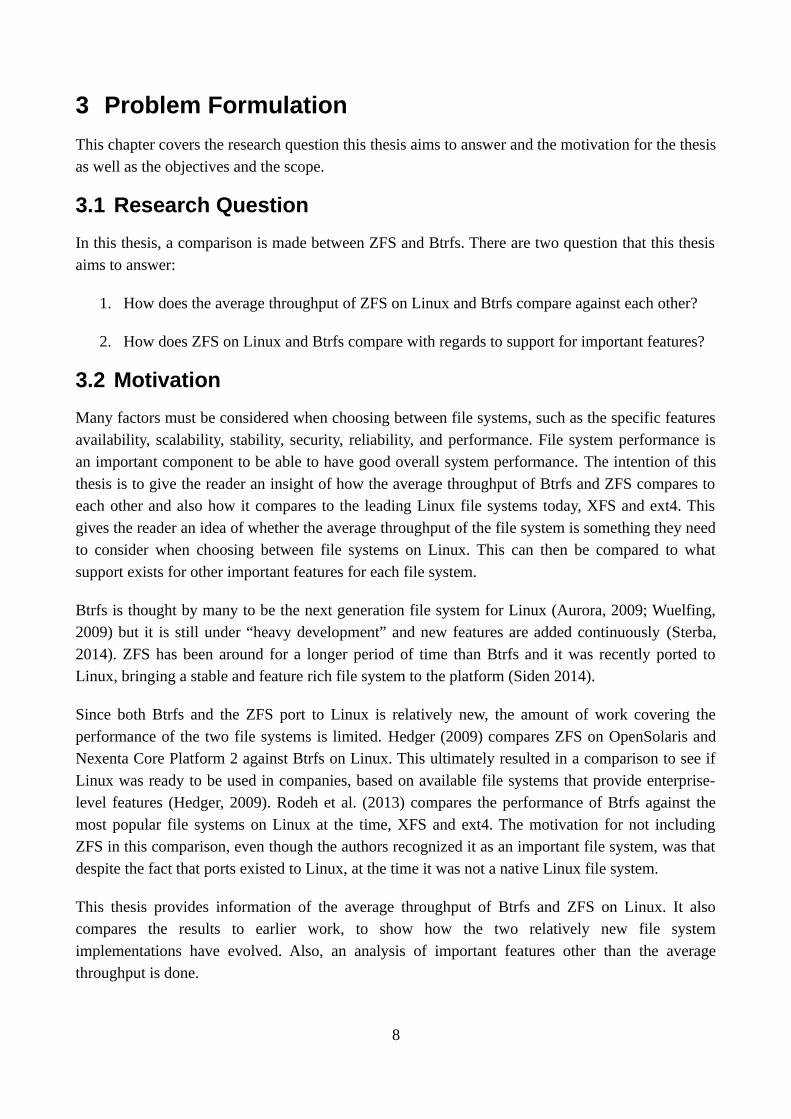
In this thesis, a comparison is made between ZFS and Btrfs. There are two question that this thesis aims to answer:
1. How does the average throughput of ZFS on Linux and Btrfs compare against each other?
2. How does ZFS on Linux and Btrfs compare with regards to support for important features?
3.2 Motivation
Many factors must be considered when choosing between file systems, such as the specific features availability, scalability, stability, security, reliability, and performance. File system performance is an important component to be able to have good overall system performance. The intention of this thesis is to give the reader an insight of how the average throughput of Btrfs and ZFS compares to each other and also how it compares to the leading Linux file systems today, XFS and ext4. This gives the reader an idea of whether the average throughput of the file system is something they need to consider when choosing between file systems on Linux. This can then be compared to what support exists for other important features for each file system.
Btrfs is thought by many to be the next generation file system for Linux (Aurora, 2009; Wuelfing, 2009) but it is still under “heavy development” and new features are added continuously (Sterba, 2014). ZFS has been around for a longer period of time than Btrfs and it was recently ported to Linux, bringing a stable and feature rich file system to the platform (Siden 2014).
Since both Btrfs and the ZFS port to Linux is relatively new, the amount of work covering the performance of the two file systems is limited. Hedger (2009) compares ZFS on OpenSolaris and Nexenta Core Platform 2 against Btrfs on Linux. This ultimately resulted in a comparison to see if Linux was ready to be used in companies, based on available file systems that provide enterprise-level features (Hedger, 2009). Rodeh et al. (2013) compares the performance of Btrfs against the most popular file systems on Linux at the time, XFS and ext4. The motivation for not including ZFS in this comparison, even though the authors recognized it as an important file system, was that despite the fact that ports existed to Linux, at the time it was not a native Linux file system.
This thesis provides information of the average throughput of Btrfs and ZFS on Linux. It also compares the results to earlier work, to show how the two relatively new file system implementations have evolved. Also, an analysis of important features other than the average throughput is done.
8

3.3 Objectives and Scope
To be able to compare the average throughput for the file systems against each other, the following objectives are followed:
1. An experiments is constructed in such a way that it shows the average throughput for both common use cases as well as single I/O operations.
2. An isolated experimental environment is set up to eliminate any interference that might otherwise skew the result.
3. An evaluation of possible validity threats, how they are countered, and how they might effect the results, is conducted.
4. The results is analyzed and based on that, the reader gets a recommendation regarding the impact of the average throughput.
5. The analysis is also used to compare and contrast the results in this thesis to previous similar work.
6. A qualitative analysis of important features supported by the file systems is performed.
The experiments are using default settings for each file system. No specific tuning is performed to make the file systems perform better for a specific workload or application. This is to be able to make a fair comparison of the average throughput for a various of different set of workloads and applications. Also no extra hardware, such as extra caches in the form of SSD's, is used. The amount of RAM is limited to an amount that can sustain each file system but not allow the file systems to be able to fit the whole test file into RAM, the test file could otherwise be served from memory instead of being served from disk. This is discussed further in Section 4.2.
9

4 Methodology
This chapter covers the chosen method and how it is implemented. In the chapter, alternative methods that could have been chosen are also discussed. The chapter also includes possible validity threats for the chosen method.
4.1 Experiment
The chosen method for performance measurements of file systems used in this thesis is to perform an experiment that will be constructed in such a way that it meets the first objective covered in Section 3.3. The experiment consists of a series of tests, measuring the average throughput of Btrfs and ZFS using a set of different parameters. As a reference, the two major Linux file systems, XFS and ext4, are also tested. The default settings for each file system is used to get a general view of the average throughput without tweaking the settings for a specific application (see Appendix A for complete file system setup). Changing the settings could give an unfair advantage or disadvantage to the file systems depending on how the specific setting or feature might affect the throughput. The default settings also reflects how the developers of the file systems intended them to function.
The experiment follows the guidelines explained in Section 2.4 with the exception made for the second guideline since it can not be assumed that the variation in the measured data is parametric, that is centered around a mean.
The experiment is executed by conducting macrobenchmarks, previously described in Section 2.4, with a variety of different workloads to simulate real usage. This gives the reader a general idea of how the file systems perform under load for some common use cases. To further investigate the results from the macrobenchmarks, a number of microbenchmarks (see Section 2.4) which records the average throughput for specific I/O operations, is performed. The operations selected for the microbenchmarks are: write, re-write, read, random read, random write and strided read. The results from the microbenchmarks, combined with the results from the macrobenchmarks, gives the reader a broad view of the average throughput of the file systems. The operations used in the microbenchmarks are explained below (Norcott, 2012):
• Write – This test measures the average throughput when writing a new file. This operation is
typically used for regular file usage.
• Re-write – This test measures the average throughput when writing a file that already exists.
This means that the re-write does not have the overhead of writing the meta data compared to writing a new file. This operation is typically used for regular file usage.
• Read – This test measures the average throughput when reading an existing file. This
operation is typically used for regular file usage.
• Random Read – This test measures the average throughput when reading from random
10

locations from within a file. This operation is typically used for database usage.
• Random Write – This test measures the average throughput when writing to random
locations within a file. This operation is typically used for database usage.
• Strided Read – This test measures the average throughput when reading a file with a strided
access behavior. For example: read at offset zero for a specific length, then seek for a specific length, and then read for the initial length again, seek and so on. This is a typical application behavior for applications that have data structures contained within a file and is accessing a particular region of the data structure, for example a database.
The experiments presented in this thesis are using warm-cache but the test files are large enough so it can not fit into RAM, for details about this see Section 4.3. This is done to minimize optimization strategies that relies on caching in main memory and forcing the operating system to do the I/O operations. The experiment is repeated 20 times, discarding the data from the first run of each experiment, allowing the system to reach a steady state as explained in section 2.4.
To simulate a real-world usage there would be a plethora of other services running at the same time, however, this would bring too many extra variables to the experiment. Therefore a more isolated environment is used without any nonessential processes running.
An alternative to the micro- and macrobenchmarks could be to use a trace-based benchmark to recreate a real-world workload. This however comes with a number of challenges. According to Traeger et al. (2008) it is important that the trace used is representative of the workload, that is the trace captures a large enough sample, and the method of replaying the trace preserves the characteristics of the workload. It may also be difficult to find a workload that is up to date. This is important to be able to represent a general workload of data as characteristics such as file sizes, access patterns, file system size, file types, and directory size distribution have changed over the years. Using a trace-based method would also give a result that is more dependent on the specific workload being used, as opposed to the more generally applicable result from the suggested method.
4.1.1 Alternative Methods and Discussion
To make a comparison of the average throughput of ZFS and Btrfs the method chosen in this thesis is an experiment, but there are alternatives to this method. One method could be to make a case study of companies with existing implementations of ZFS and Btrfs. The advantage of this would be that this would be a real scenario with real workloads that is used in a production environment. The drawbacks however would be that the results would be very specific for the type of application or workloads used at the company. It also might not be possible to isolate the impact the file systems have on the performance as many other factors would be involved in the performance of a production system.
Another method could be to make a literature study. A literature study could have several different
11

focuses. One focus could be on papers that conducts experiments and compare the results. Another focus could be to review the actual source code for the file systems to try to get an idea of how efficient they might be for different operations depending on the design and structure of the code. The difficulties with this method would be to get enough material to study to be able to draw any conclusions. As mentioned in Section 3.2 there is not much related work that covers this. Also, it might not be possible to draw any conclusions of the performance from studying the source code.
4.2 Experimental Setup
This section covers how the experiment is set up to meet the second objective in Section 3.3. To be able to take advantage of recent features and fixes, a Linux distribution that supports a modern kernel is used. For Btrfs in particular it is recommended to use the latest stable Linux version (Sterba, 2014). Also a fixed release distribution, as opposed to a rolling release distribution, is chosen for more stability. A Linux distribution that satisfy these requirement and is therefore used for the experiments is Ubuntu Sever 14.04.2 LTS with kernel 3.19.4 (2015-04-13).
The hardware setup for all the experiments is a server with the following specifications:
• 2 × Intel Xeon L5520 @ 2.27GHz with 4 cores each.
• 60GB, 1333 MHz ECC RAM.
• HP Smart Array P410i Controller.
• 4 × 300GB 10 000 RPM SAS drives for the file system experiment.
• 2 × 72GB 15 000 RPM SAS drives in a RAID 1 setup for the operating system.
As Heger (2009) suggests, the RAM of the machines should be limited to avoid excessive caching. The RAM is therefore limited to 2GB, if it where to be limited any lower than this, the file systems might not be able to perform as intended. The test file is then set to twice the size of the RAM (4 GB). This ensures the test file can not fit in to memory. Also no swap space is set up to ensure swapping to another file system on the disk is not possible.
Since there is no JBOD (Just A Bunch Of Disks) or pass-through option for the P410i Controller, each disk is set up as a single separate RAID 0 device. This is not an ideal setup for a production environment as the hot-swap capabilities are lost but it should not impact the performance. For this experiment, since circumstances are equal for all file systems and as the system is running for a limited time without the need for hot-swap, it is a sufficient solution.
4.2.1 Disk Setup
The disk setup for the experiments in this thesis is separated into three different test setups. Fist a single disk setup is used to set a baseline by testing the file system performance on a single disk. This is followed by a four disk setup with RAID 10 (see Figure 2), this is a common RAID level
12

that provides both performance and redundancy. The ZFS equivalence of RAID 10 is a stripe of two vdevs containing two mirrored disks each (Wojslaw, 2014). The RAID configurations for XFS and ext4 is created with the md (Multiple Device) driver which is used to set up software RAID in Linux. The RAID 5 (see Figure 3) and RAID 6 features of Btrfs has long been considered incomplete with significant problems with recovery from the loss of a device (Mills, 2014a). However, in the latest kernel at the time of writing this thesis, version 3.19, a new update was issued that should solve these issues. Therefore RAID 5 is used for the last test and it is compared against the ZFS equivalence, RAID-Z (Wojslaw, 2014).
The same disks are used for each file system to ensure hardware consistency. That means for the single disk test only one disk is used. For the RAID 5 and RAID 10 setups, four disks are used. The disks are reformatted with a new file system for each experiment.
Figure 2: RAID 10 (Burnett 2011)
4.3 Experimental Tools and Setup
The software that are used for the experiments in this thesis are Filebench1 and IOzone2. They can both be used to generate and measure a variety of workloads. Filebench is chosen because of the possibility to select a predefined profile that can emulate common use cases and it is used for the macrobenchmark. Filebench is originally developed by Sun Microsystems and is now maintained by developers from Oracle which gives validity to the database emulation that emulates an Oracle database. IOzone is chosen because of its flexibility and many configuration options, and is used for the microbenchmark (see Section 4.1). The versions that are used in the experiment are the latest stable version for both frameworks, which is Filebench version 1.4.9.1 and IOzone version 3.420.
1 http://filebench.sourceforge.net2 http://www.iozone.org/
13
Figure 3: RAID 5 (Burnett 2006)
RAID 5
D p
C1B1A1
Disk 0
D1C p
B2A2
Disk 1
D2C2B p
A3
Disk 2
D3C3B3A p
Disk 3
A7A5A3A1
A8A6A4A2
RAID 1+0
Disk 0 Disk 1
A7A5A3A1
A8A6A4A2
Disk 2 Disk 3
RAID 1 RAID 1
RAID 0

Other evaluated tools include Bonnie++3, Postmark4 and DBENCH5 but these are not selected due to limited features and lack of customization of the experiments compared to IOzone and Filebench. Also the Linux copying tool dd was considered for a custom script for part of the microbenchmark but this was also not selected due to similar features existed in IOzone in addition to other features that was desirable for the microbenchmark.
Filebench allocates a small part of the RAM and can therefore use a range of different size files for the experiment without reading everything from the memory. For the IOzone experiments, only one file size is used which is set to 4 GB to exceeds the size of the RAM, which is limited to 2 GB. This is to ensure that the read tests are not performed from memory. Instead of many different file sizes, different record sizes is used to read and write to the file. The tests starts at 64KB record size and every subsequent test uses a record size twice as large as the last one, up to the final record size of 16MB, which is the largest supported record size for IOzone. These record sizes has been selected to be higher than the default block size for all the tested file systems and to give a broad range of tests.
4.3.1 Filebench Setup
To install Filebench, the source code is downloaded, and compiled with default options. To setup the tests for Filebench, the predefined workload configuration files are edited to reflect the mount point for the different file systems and to run non-interactively. Each test runs for 60 seconds and the experiment is run 20 times.
Filebench offers a set of predefined personalities that is constructed to emulate real usage for specific types of servers. For this experiment the profiles Fileserver, OLTP and Webserver are used. The Fileserver profile and Webserver profile is chosen to represent normal file operations whereas the OLTP profile is selected to represent database operations such as small random read and writes and synchronous writes. The profiles are described below (Tarasov 2011), see Appendix B to see complete list of operations.
• Fileserver: This profile emulates a simple file servers I/O activity by starting 50 threads that
produces a sequence of creates, deletes, appends, reads, writes and attribute operations on a directory tree.
• OLTP: This profile emulates a database server by performing operations using the Oracle 9i
database I/O model. This includes small random reads and writes, and synchronous writes to a log file. For the read operations, 200 processes are used and 10 processes are used for the asynchronous writes and synchronous writes.
• Webserver: This profile emulates a simple web servers I/O activity by starting 100 threads
that produces a sequence of open, read, and close operations on multiple files in a directory plus a log file append.
3 http://www.coker.com.au/bonnie++/4 https://www.freshports.org/benchmarks/postmark/5 https://dbench.samba.org
14
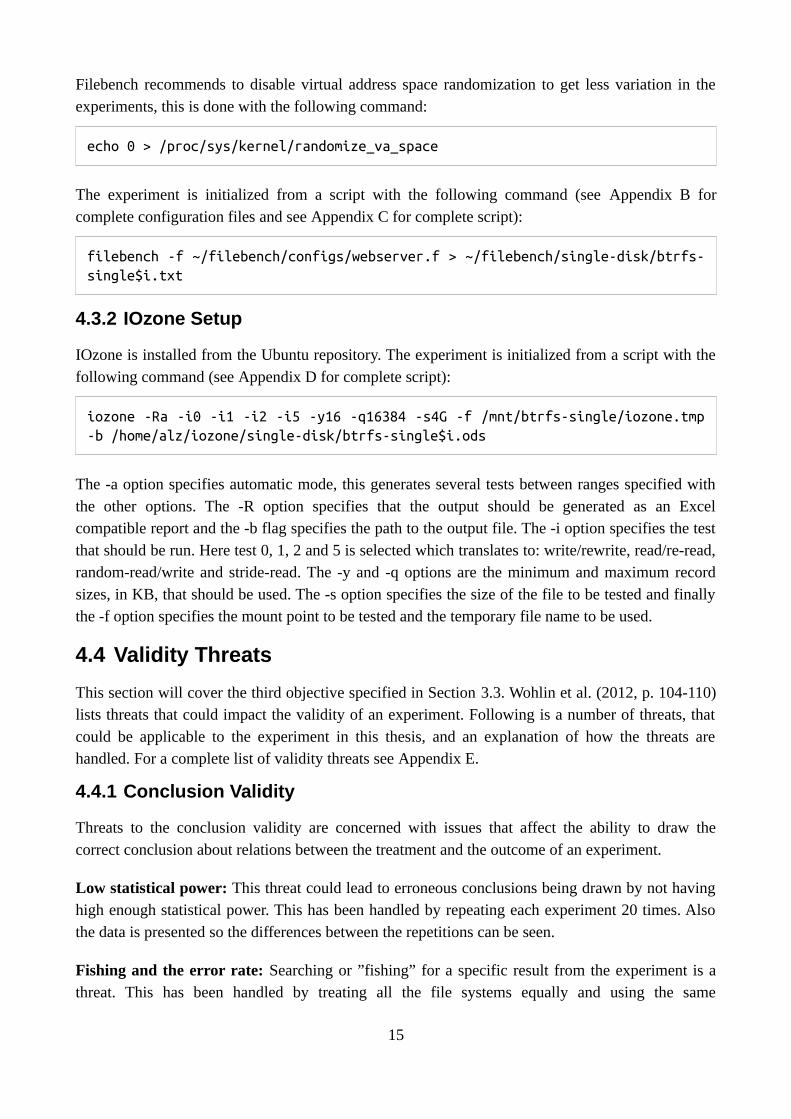
Filebench recommends to disable virtual address space randomization to get less variation in the experiments, this is done with the following command:
echo 0 > /proc/sys/kernel/randomize_va_space
The experiment is initialized from a script with the following command (see Appendix B for complete configuration files and see Appendix C for complete script):
filebench -f ~/filebench/configs/webserver.f > ~/filebench/single-disk/btrfs-single$i.txt
4.3.2 IOzone Setup
IOzone is installed from the Ubuntu repository. The experiment is initialized from a script with the following command (see Appendix D for complete script):
iozone -Ra -i0 -i1 -i2 -i5 -y16 -q16384 -s4G -f /mnt/btrfs-single/iozone.tmp -b /home/alz/iozone/single-disk/btrfs-single$i.ods
The -a option specifies automatic mode, this generates several tests between ranges specified with the other options. The -R option specifies that the output should be generated as an Excel compatible report and the -b flag specifies the path to the output file. The -i option specifies the test that should be run. Here test 0, 1, 2 and 5 is selected which translates to: write/rewrite, read/re-read, random-read/write and stride-read. The -y and -q options are the minimum and maximum record sizes, in KB, that should be used. The -s option specifies the size of the file to be tested and finally the -f option specifies the mount point to be tested and the temporary file name to be used.
4.4 Validity Threats
This section will cover the third objective specified in Section 3.3. Wohlin et al. (2012, p. 104-110) lists threats that could impact the validity of an experiment. Following is a number of threats, that could be applicable to the experiment in this thesis, and an explanation of how the threats are handled. For a complete list of validity threats see Appendix E.
4.4.1 Conclusion Validity
Threats to the conclusion validity are concerned with issues that affect the ability to draw the correct conclusion about relations between the treatment and the outcome of an experiment.
Low statistical power: This threat could lead to erroneous conclusions being drawn by not having high enough statistical power. This has been handled by repeating each experiment 20 times. Also the data is presented so the differences between the repetitions can be seen.
Fishing and the error rate: Searching or ”fishing” for a specific result from the experiment is a threat. This has been handled by treating all the file systems equally and using the same
15

experimental setup for all experiments. The default settings have been used for all file systems so none of the file systems have an advantage for a specific test by optimizing the file systems for a specific workload or using a feature that might lower the average throughput. Also, a number of different tests have been used in the experiments. This minimizes the chance that the tests or workload is extra favorable for a specific file system.
Reliability of measures: The reliability of an experiment is highly dependent on the reliability of the measures. This may in turn depend on for instance bad instrumentation or bad instrument layout. This has been handled by using tools that are accepted by the industry instead of for example constructing custom scripts for the experiments. For the Filebench experiments, the predefined profiles is used without modification as they are created by experts in the field.
Reliability of treatment implementation: The implementation of the treatment means the application of treatments to subjects. The risk that the implementation is not similar between the different experiments or between the repetitions of an experiment is minimized in several ways. The experimental setup is the same for all the tested file systems and remains the same for all tests. The experiments that are performed are all set up the same way for all file systems. All non-essential services are shut down to prevent contamination of the experiments. For example, cron is shut down to prevent scheduled jobs to run while an experiment is running.
Random irrelevancies in experimental setting: Elements outside the experimental setting may disturb the results. This is somewhat tied to the previous threat in the aspect of non-essential services disturbing the results but also includes external elements. For example the server in the experiments is not connected to a network and all network services is shut down to ensure no external disturbances would affect the results.
4.4.2 Internal Validity
Threats to internal validity are influences that can affect the independent variable with respect to causality, without the researcher's knowledge.
Testing: If the test is repeated, the subjects may respond differently at different times since they know how the test is conducted. This threat can be applied on the experiment in this thesis as the test is repeated multiple times and the first run of the experiment might be different than the following due to caches and buffers being empty. The threat is minimized by discarding the data from the first run of each experiment, allowing the system to reach a steady state.
Mortality: This effect is due to the different kinds of persons who drop out from an experiment. This is usually applied to humans but can for this experiment also be applied to the hardware used. If for example one of the hard drives in the experiment would fail, parts of the experiment would have to be repeated to ensure the reliability of treatment implementation would not endanger the validity. To prepare for such an incident, redundant hardware was made available and since the experiments was divided into different categories based on the disk setup, only the tests for the specific setup would have to be repeated.
16

4.4.3 Construct Validity
Construct validity concerns generalizing the result of the experiment to the concept or theory behind the experiment.
Inadequate preoperational explication of constructs: This means that the constructs are not sufficiently defined before they are translated into measures or treatments. To minimize this threat the method is explained in detail and research papers on how to conduct file system experiments has been studied and important guidelines from the papers are applied on the method used for the experiment. However, this means that the level this threat is minimized largely depends on the quality of the studied papers.
Mono-operation bias: The experiment may under-represent the construct and not give the full picture of the theory if it only includes a single variable, case, subject or treatment. To minimize this threat, two different types of software has been used that measures the average throughput in different ways. The results from these are then cross-checked against each other.
Mono-method bias: If a single type of measures or observations are used, the experiment will be misleading if these gives a measurement bias. This is minimized by in addition to the experiment, also making a qualitative analysis of different features available for Btrfs and ZFS.
Restricted generalizability across constructs: The treatment may affect the studied construct positively, but unintentionally affect other constructs negatively. This could be applied on the experiment in this thesis as the focus is on the average throughput. The threat is minimized by conducting a qualitative analysis of important features. If for example a higher average throughput is achieved at the cost of an important feature not being available in the file system, the reader can weigh these factors against each other and decide what is most important for their specific situation.
4.4.4 External Validity
Threats to external validity are conditions that limit our ability to generalize the results of our experiment to industrial practice.
Interaction of setting and treatment: This is the effect of not having the experimental setting or material representative of, for example, industrial practice. This is minimized by using tools accepted by the industry. However, there is a risk that the synthetic tests are not going to be able to exactly reproduce the conditions and workloads of a real-life application. Also the environment the experiment is conducted in is assumed to be representative for an enterprise environment but there is a risk that it may not be able to emulate this exactly.
17

5 Results
This chapter presents the results from the experiments organized by the software that is used for the experiment and the disk setup. The values reported is the result of the throughput of the 19 repetitions of the experiments (20 repetitions with the first one excluded).
5.1 Filebench Results
The results from the Filebench tests are presented in the form of box plots. These show the throughput for each profile as explained in Section 4.3.1. The box plot help to depict the differences in the values from the different repetitions of the experiments. The lower part of the box represents the first quartile and the upper part of the box represents the third quartile. The line in the middle of the box is the median and the two lines that extends vertically from the box is called the whiskers, which represent the maximum and the minimum values (see Figure 4). Generally, when the throughput is discussed in this chapter, the median is the value implied.
5.1.1 Single Disk
For the Fileserver test with the single disk setup Btrfs is showing the highest throughput with a median of 108 MB/s, closely followed by ext4 and XFS. ZFS however only reached throughput of 33 MB/s. In the OLTP test, ZFS reached a throughput of 17 MB/s while Btrfs only reached 7 MB/s (see Figure 4). The median throughput for ext4 and XFS was 55 MB/s but the variation between the repetitions of the experiment where extremely large, especially for XFS (see Figure 5). The throughput of XFS seems to be very inconsistent with some very high values, up to 79 MB/s but an equal amount of values that is under 1 MB/s. The possible cause of this is discussed further in Chapter 6. For the Webserver profile, the file systems all performed very similarly with a throughput around 50 MB/s. For complete data from the single disk test, see Appendix F.
5.1.2 RAID 10
In the Fileserver test Btrfs is again showing the highest throughput of 197 MB/s followed by ext4 with 135 MB/s (see Figure 6). XFS has a median of 69 MB/s while ZFS is performing the worst with 47 MB/s. The OLTP test is showing similar performance from Btrfs, ext4, and XFS with a throughput of around 5 MB/s (see Figure 7). ZFS however is in this test more than twice as fast as the other file systems with a throughput of almost 14 MB/s. Just as for the single disk, the results of the Webserver test for the RAID 10 setup was very similar between the file systems with a throughput of around 50 MB/s. See Appendix G for all data from the RAID 10 experiment.
18

19
Figure 4: Filebench Fileserver experiment with single disk setup.
ZFS Btrfs ext4 XFS0
20
40
60
80
100
120
Single disk - Fileserver
File system
Th
rou
gh
pu
t (M
B/s
)
Figure 5: Filebench OLTP experiment with single disk setup.
ZFS Btrfs ext4 XFS0
10
20
30
40
50
60
70
80
90
Single disk - OLTP
File system
Th
rou
gh
pu
t (M
B/s
)

20
Figure 6: Filebench Fileserver experiment with RAID 10 setup.
ZFS Btrfs ext4 XFS0
50
100
150
200
250
RAID 10 - Fileserver
File system
Th
rou
gh
pu
t (M
B/s
)
Figure 7: Filebench OLTP experiment with RAID 10 setup.
ZFS Btrfs ext4 XFS0
2
4
6
8
10
12
14
16
18
RAID 10 - OLTP
File system
Th
rou
gh
pu
t (M
B/s
)

5.1.3 RAID 5
With the RAID 5 setup, the results for the Fileserver test is showing that Btrfs still has the highest performance by a large margin (see Figure 8). The throughput for Btrfs is 107 MB/s while the other file systems only averages between 21-33 MB/s. The OLTP test is showing similar results as with the RAID 10 setup, ZFS is showing the highest throughput of 10 MB/s followed by the other file systems with about 5 MB/s (see Figure 9). Finally, the results of the Webserver test shows that the throughput of all the file systems are again very similar, ranging between 50-55 MB/s. See Appendix H for all data from the RAID 5 experiment.
21
Figure 8: Filebench Fileserver experiment with RAID 5 setup.
ZFS Btrfs ext4 XFS0
20
40
60
80
100
120
RAID 5 - Fileserver
File system
Th
rou
gh
pu
t (M
B/s
)

5.2 IOzone Results
The results from the IOzone experiments show the average throughput from each tested disk operation (explained in Section 4.1) for all the tested record sizes, which is explained in Section 4.3.
5.2.1 Single Disk
The IOzone read and write tests for the single disk setup looked very similar with a consistent read/write rate for every record size. The throughput was also very similar for both the read and write as Btrfs and XFS both averaged about 140 MB/s and ZFS and ext4 with an average of about 120 MB/s. For complete data from the single disk test, see Appendix I.
The results from the random write and re-write tests are similar for ZFS. For record sizes below 128 KB there is a significant reduction in performance. At a record size of 128 KB the average throughput for both random write and re-write is about 120 MB/s, however when the record size is set to 64 KB the re-write throughput is reduced to 35 MB/s and the random write is reduced to about 7 MB/s (see Figure 10 and Figure 11). This seems to be a result of the default record size of ZFS being 128 KB and with the lack of cache it can have a significant impact of the performance. This is further analyzed in Chapter 6. The re-write results are almost identical to the write results for all the file systems, with the exception for the dip in performance for ZFS with a 64 KB record size. In the random write test Btrfs has the highest throughput and also performing quite consistent for all tested record sizes, going between 128 MB/s and 147 MB/s. XFS and ext4 both show a steady increase as the record size gets bigger, going from about 50 MB/s at a record size of 64 KB to 118 MB/s for ext4 and 140 MB/s for XFS at a record size of 16 MB.
22
Figure 9: Filebench OLTP experiment with RAID 5 setup.
ZFS Btrfs ext4 XFS0
2
4
6
8
10
12
RAID 5 - OLTP
File system
Th
rou
gh
pu
t (M
B/s
)
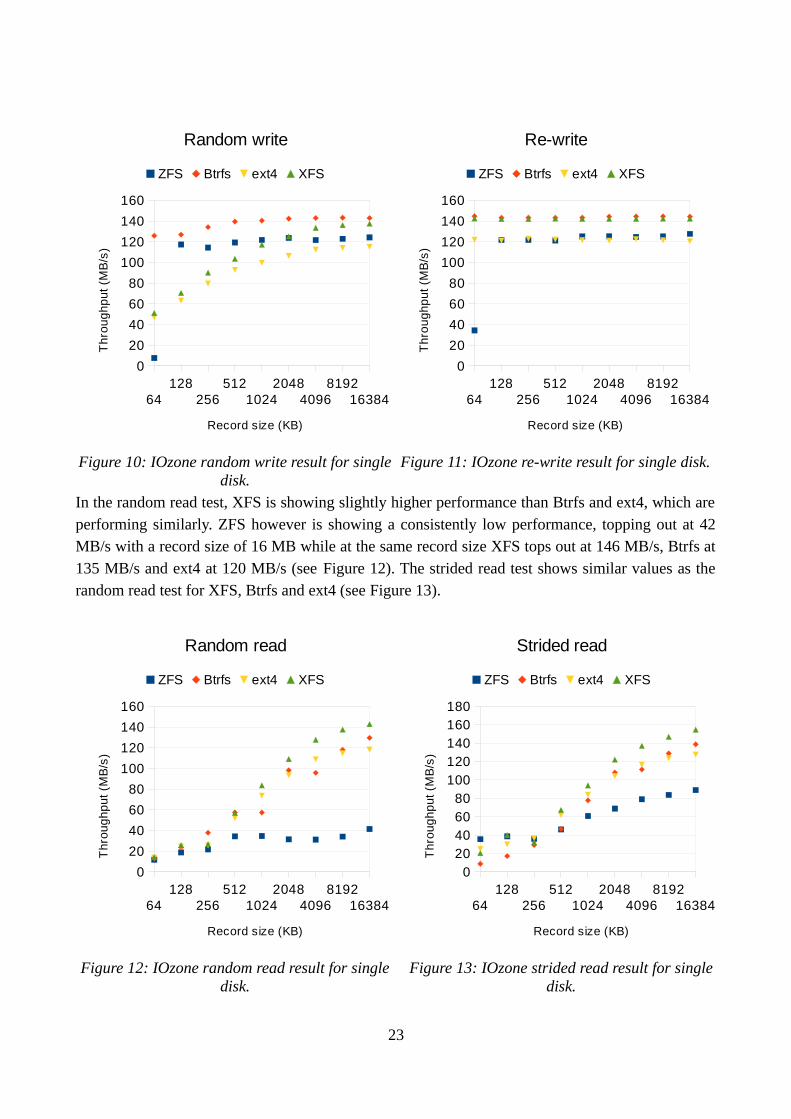
In the random read test, XFS is showing slightly higher performance than Btrfs and ext4, which are performing similarly. ZFS however is showing a consistently low performance, topping out at 42 MB/s with a record size of 16 MB while at the same record size XFS tops out at 146 MB/s, Btrfs at 135 MB/s and ext4 at 120 MB/s (see Figure 12). The strided read test shows similar values as the random read test for XFS, Btrfs and ext4 (see Figure 13).
23
Figure 11: IOzone re-write result for single disk.
64128
256512
10242048
40968192
16384
0
20
40
60
80
100
120
140
160
Re-write
ZFS Btrfs ext4 XFS
Record size (KB)T
hro
ug
hp
ut
(MB
/s)
Figure 10: IOzone random write result for single disk.
64128
256512
10242048
40968192
16384
0
20
40
60
80
100
120
140
160
Random write
ZFS Btrfs ext4 XFS
Record size (KB)
Th
rou
gh
pu
t (M
B/s
)
Figure 12: IOzone random read result for single disk.
64128
256512
10242048
40968192
16384
0
20
40
60
80
100
120
140
160
Random read
ZFS Btrfs ext4 XFS
Record size (KB)
Th
rou
gh
pu
t (M
B/s
)
Figure 13: IOzone strided read result for single disk.
64128
256512
10242048
40968192
16384
020406080
100120140160180
Strided read
ZFS Btrfs ext4 XFS
Record size (KB)
Th
rou
gh
pu
t (M
B/s
)
5.2.2 RAID 10
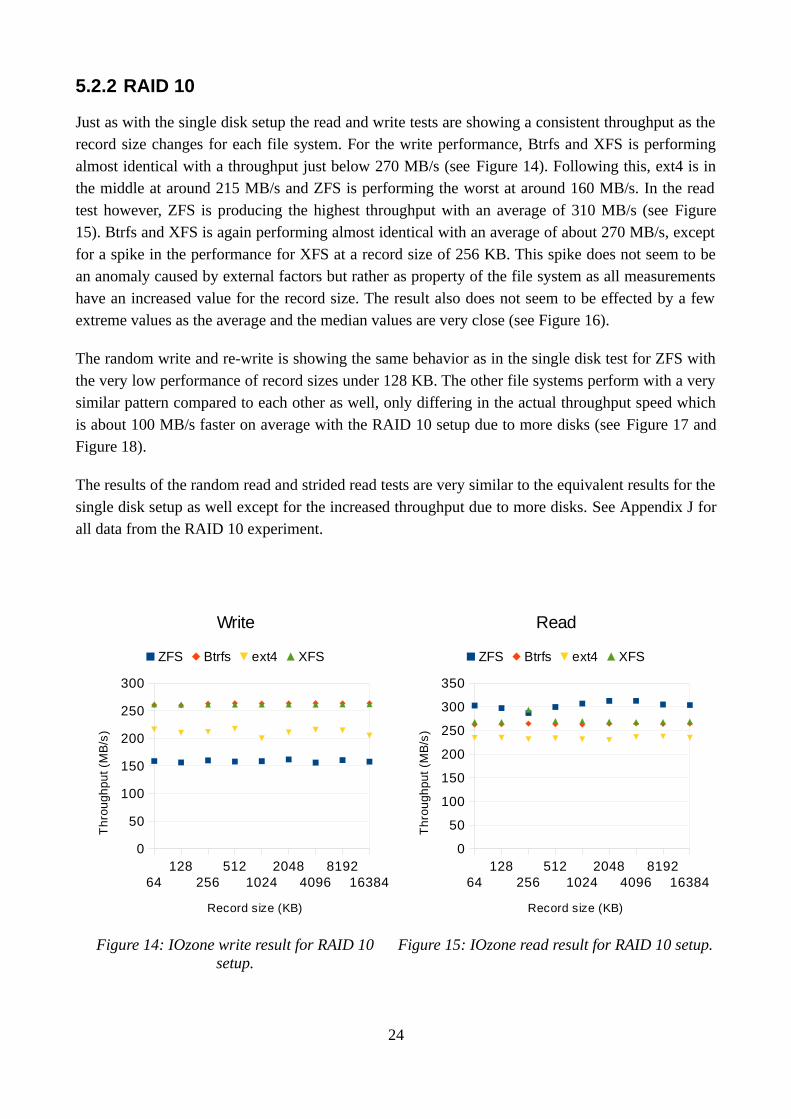
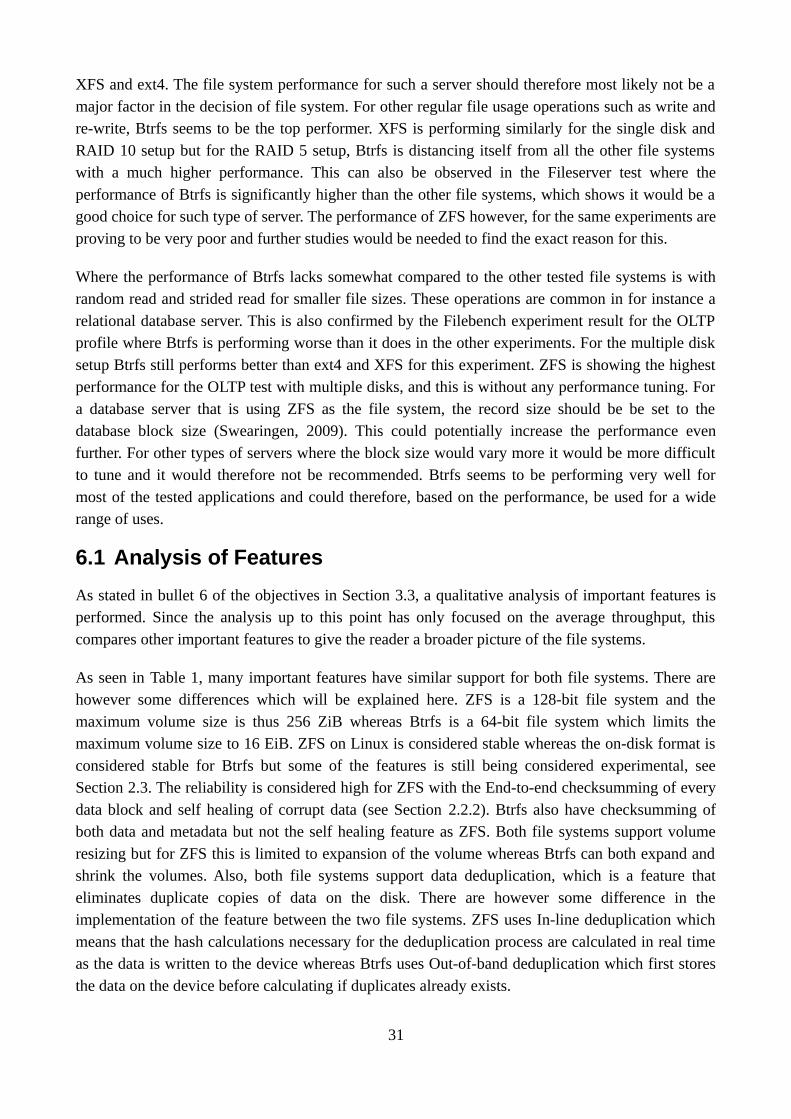
Just as with the single disk setup the read and write tests are showing a consistent throughput as the record size changes for each file system. For the write performance, Btrfs and XFS is performing almost identical with a throughput just below 270 MB/s (see Figure 14). Following this, ext4 is in the middle at around 215 MB/s and ZFS is performing the worst at around 160 MB/s. In the read test however, ZFS is producing the highest throughput with an average of 310 MB/s (see Figure15). Btrfs and XFS is again performing almost identical with an average of about 270 MB/s, except for a spike in the performance for XFS at a record size of 256 KB. This spike does not seem to be an anomaly caused by external factors but rather as property of the file system as all measurements have an increased value for the record size. The result also does not seem to be effected by a few extreme values as the average and the median values are very close (see Figure 16).
The random write and re-write is showing the same behavior as in the single disk test for ZFS with the very low performance of record sizes under 128 KB. The other file systems perform with a very similar pattern compared to each other as well, only differing in the actual throughput speed which is about 100 MB/s faster on average with the RAID 10 setup due to more disks (see Figure 17 and Figure 18).
The results of the random read and strided read tests are very similar to the equivalent results for the single disk setup as well except for the increased throughput due to more disks. See Appendix J for all data from the RAID 10 experiment.
24
Figure 14: IOzone write result for RAID 10 setup.
64128
256512
10242048
40968192
16384
0
50
100
150
200
250
300
Write
ZFS Btrfs ext4 XFS
Record size (KB)
Th
rou
gh
pu
t (M
B/s
)
Figure 15: IOzone read result for RAID 10 setup.
64128
256512
10242048
40968192
16384
0
50
100
150
200
250
300
350
Read
ZFS Btrfs ext4 XFS
Record size (KB)
Th
rou
gh
pu
t (M
B/s
)

25
Figure 16: IOzone XFS read result deviation for RAID 10 setup.
64 128 256 512 1024 2048 4096 8192 16384240
250
260
270
280
290
300
310
320
330
XFS RAID 10 read result deviation
Average
Min
Q1
Median
Q3
Max
Record size (KB)
Th
rou
gh
pu
t (M
B/s
)
Figure 17: IOzone random write result for RAID 10 setup.
64128
256512
10242048
40968192
16384
0
50
100
150
200
250
300
Random write
ZFS Btrfs ext4 XFS
Record size (KB)
Th
rou
gh
pu
t (M
B/s
)
Figure 18: IOzone re-write result for RAID 10 setup.
64128
256512
10242048
40968192
16384
0
50
100
150
200
250
300
Re-write
ZFS Btrfs ext4 XFS
Record size (KB)
Th
rou
gh
pu
t (M
B/s
)

5.2.3 RAID 5
All the file systems are showing a consistent throughput for all tested record sizes in the read test with the RAID 5 setup. ZFS, Btrfs and XFS are performing similarly with average throughputs of around 360 MB/s while ext4 is slightly below with an average of 300 MB/s. See Appendix K for all data from the RAID 5 experiment.
The write result is showing that Btrfs is performing significantly better than all the other file systems with an average throughput of 415 MB/s while ZFS has the second best performance of just under 220 MB/s (see Figure 19). ext4 and XFS has an average throughput of 142 MB/s and 127 MB/s.
The re-write performance looks almost identical for each file system as the write test except for ZFS that has the same issue with record sizes under 128 KB as with the other disk setups.
The file system performance order is staying the same in random write, as in the other write tests but throughput increase as the record size increases (see Figure 20). XFS and ext4 starts at a throughput of right under 30 MB/s for 64 KB record size and tops out at 114 MB/s and 130 MB/s. ZFS shows the same low throughput for smaller record sizes with 8 MB/s for the 64 KB record size and tops out at 231 MB/s with a record size of 16 MB. Btrfs gets a throughput of 160 MB/s for the smallest record size then goes down slightly at a record size of 265 KB, getting a lower throughput than ZFS, before rising to steadily to top out at 346 MB/s.
26
Figure 19: IOzone write result for RAID 5 setup.
64 128 256 512 1024 2048 4096 8192 163840
50
100
150
200
250
300
350
400
450
Write
ZFS
Btrfs
ext4
XFS
Record size (KB)
Th
rou
gh
pu
t (M
B/s
)

The random read and strided read are again similar to the same test for both previous disk configuration. In the random read test, all the file systems have a throughput of about 15 MB/s at the smallest record size (see Figure 21). The throughput for Btrfs, XFS, and ext4 then increases with a similar rate as the record size increases to finally top at 340 MB/s, 301 MB/s and 270 MB/s respectively at the largest record size. ZFS however increase at a much lower rate and tops out at 126 MB/s at the largest record size. The result of the strided read test is similar to the random read result except for the throughput of Btrfs is lower than XFS and ext4 for record sizes under 2 MB (see Figure 22). At a record size of 2 MB the throughput for Btrfs is catching up to XFS and ext4 and then rises above them both for record sizes of 4 MB and above. However, the throughput of ZFS is still significantly lower than the other file systems.
To assure that the pattern in the strided read result is not caused by extreme values, a new graph was created that also show the first and third quartiles (see Figure 23). This however shows that there is very little difference between the different repetitions of the experiment and only some overlap of quartiles can be seen from XFS and ext4.
27
Figure 20: IOzone random write result for RAID 5 setup.
64 128 256 512 1024 2048 4096 8192 163840
50
100
150
200
250
300
350
400
Random write
ZFS
Btrfs
ext4
XFS
Record size (KB)
Th
rou
gh
pu
t (M
B/s
)

28
Figure 21: IOzone random read result for RAID 5 setup.
64128
256512
10242048
40968192
16384
0
50
100
150
200
250
300
350
Random read
ZFS Btrfs ext4 XFS
Record size (KB)
Th
rou
gh
pu
t (M
B/s
)
Figure 22: IOzone strided read result for RAID 5 setup.
64128
256512
10242048
40968192
16384
0
50
100
150
200
250
300
350
400
Strided read
ZFS Btrfs ext4 XFS
Record size (KB)
Th
rou
gh
pu
t (M
B/s
)
Figure 23: IOzone strided read result deviation for RAID 5 setup with first and third quartiles marked).
64 128 256 512 1024 2048 4096 8192 163840
50
100
150
200
250
300
350
400
RAID 5 Strided read result deviation
ZFS Med
ZFS Min
ZFS Max
Btrfs Med
Btrfs Min
Btrfs Max
ext4 Med
ext4 Min
ext4 Max
XFS Med
XFS Min
XFS Max
Record size (KB/s)
Th
rou
gh
pu
t (M
B/s
)

6 Analysis
To be able to understand the results presented in Chapter 5 an analysis is done to summarize the most important findings. This is the fourth objective in Section 3.3. The results are also compared to previous works that have conducted similar experiments which is specified in the fifth objective in Section 3.3.
The results from the Fileserver profile in the Filebench experiment is showing that Btrfs has consistently the highest performance for all the disk setups whereas ZFS is showing the lowest performance. The profile is testing creating, reading, writing, deleting, appending and emulation of a stat of a file (system call that returns file attributes). For the setups with multiple disks, the performance of Btrfs is significantly higher than the other file systems. The second best throughput is seen from ext4 closely followed by XFS with both the single disk setup and the RAID 5 setup. For the RAID 10 setup the performance gap between XFS and ext4 are higher as the throughput of ext4 is almost twice as high as for XFS. This is interesting as the result can not be explained from the IOzone data but would appear to be caused either by the combination of operations or by some of the operations that is not tested in the IOzone experiment.
The OLTP profile is showing a big difference in the values between the repetitions of the same test for XFS and also some for ext4, in the single disk test (see Figure 5 on page 19). This is interesting as the results for ZFS and Btrfs are very consistent with very small differences between the repetitions. The OLTP profile is utilizing more advanced operations than the File- and Webserver profiles such as synchronous writes. It is possible that the synchronous operations in combination with how XFS handles multiple threads is causing the processes to lock. If this is caused by the specific way the OLTP profile is implemented or if this behavior would actually be representative for a real database is not possible to tell from the gathered data. One way to get more information could be to run the test for more repetitions and for a longer time for each repetition, however this is not investigated any further as XFS and ext4 is only studied in this thesis for the purpose of comparison.
Despite the large difference in the values on the OLTP test for the single disk setup, XFS and ext4 are showing a much higher median value than Btrfs and ZFS. Btrfs is showing the worst throughput for the single disk test which is surprising as it has performed in the top for most other tests. For the multiple disk setups however Btrfs is outperforming both XFS and ext4. ZFS has the best throughput for the OLTP profile with the multiple disk setups which is also surprising as ZFS has not performed very well in the other tests. ZFS does not seem to be effected with the same problem shown in the IOzone test of random write and re-writes with the smaller record sizes.
The final profile in the Filebench experiment is the Webserver profile which is showing a result with the same trend for all the file systems with all disk setups. The types of operations used in the test are simply opening, closing and reading files multiple times, and the performance of all the file systems are very similar. This result can be confirmed by comparing to the IOzone results for read
29

operations which is very similar for all the file systems. The only write operation used in the test is a random write to a single file at the end of the test which has a file size of 16 KB. Compared to the IOzone tests for random write there are large differences in the performance between the file systems for random write of smaller files. ZFS in particular has a significantly lower performance for the 64 KB record size. Since the random write is only a fraction of the experiment it does not seem to change the total result to any larger extent as the file systems perform at similar capacity. See Appendix B for complete Filebench configuration.
The poor performance of ZFS with smaller record sizes in the IOzone tests could be a result of the default record size of ZFS which is set to 128 KB. The record size of ZFS is used to govern the size of file system blocks for larger files. It is not an absolute number but an upper limit, where the file system is choosing the record size depending on the size of the block to be written which would mean that for instance a 64 KB write should be stored in a 64 KB block. However, it is possible that the synthetic tests are writing the files in such a way that makes ZFS use the largest possible block size instead. This would mean that for example when a 64 KB random write is performed the file system first has to read in a 128 KB block, then modify it, then write out the 128 KB block (Paetzel, 2014). If this behavior is caused by the software used in the experiment or if it is an existing problem that is just more easily observed through the specific experiment setup is not possible to determine from the gathered data.
The average throughput of ZFS has been lower than XFS and ext4 for many tests in this thesis which would be expected as it is using Copy on Write which adds some extra overhead. The performance of Btrfs however is quite surprising as it also is using Copy on Write but still outperforms the other file systems in most of the experiments. The most surprising results was from the RAID 5 setup since Btrfs have had many problems with the RAID 5 feature in the past and not until the kernel version used in the experiment has it been deemed stable. The results show that Btrfs performs significantly better than the other file systems on many of the experiments. To compare the general performance of Btrfs and ZFS on Linux, Btrfs seems to surpass ZFS. If this is due to the fact that Btrfs is designed for Linux and the implementation of ZFS on Linux is not quite as mature as implementations on other platforms is an interesting question. To find an answer, a test could be performed to compare ZFS on different platforms. This is discussed more in Section 7.3.
Another surprising result was the random write results. For a file system with Copy on Write, new data is written to any free block. This means that a random write is essentially becoming a sequential write, which logically would make Btrfs and ZFS significantly faster than XFS and ext4 for these tests. However, from the IOzone experiment results this is only observed in the RAID 5 setup. In the single disk test and the RAID 10 setup it would only appear to be true for the smaller record sizes (except for a record size below 128 KB for ZFS as discussed earlier), as the record size is increasing the difference between the throughput of the file systems is getting smaller.
Based on the results from the experiments a few general conclusion can be drawn. For more simpler operations such as opening, closing and reading files which would be the most common operations for instance for a web server, there is not much difference in the performance between ZFS, Btrfs,
30
XFS and ext4. The file system performance for such a server should therefore most likely not be a major factor in the decision of file system. For other regular file usage operations such as write and re-write, Btrfs seems to be the top performer. XFS is performing similarly for the single disk and RAID 10 setup but for the RAID 5 setup, Btrfs is distancing itself from all the other file systems with a much higher performance. This can also be observed in the Fileserver test where the performance of Btrfs is significantly higher than the other file systems, which shows it would be a good choice for such type of server. The performance of ZFS however, for the same experiments are proving to be very poor and further studies would be needed to find the exact reason for this.
Where the performance of Btrfs lacks somewhat compared to the other tested file systems is with random read and strided read for smaller file sizes. These operations are common in for instance a relational database server. This is also confirmed by the Filebench experiment result for the OLTP profile where Btrfs is performing worse than it does in the other experiments. For the multiple disk setup Btrfs still performs better than ext4 and XFS for this experiment. ZFS is showing the highest performance for the OLTP test with multiple disks, and this is without any performance tuning. For a database server that is using ZFS as the file system, the record size should be be set to the database block size (Swearingen, 2009). This could potentially increase the performance even further. For other types of servers where the block size would vary more it would be more difficult to tune and it would therefore not be recommended. Btrfs seems to be performing very well for most of the tested applications and could therefore, based on the performance, be used for a wide range of uses.
6.1 Analysis of Features
As stated in bullet 6 of the objectives in Section 3.3, a qualitative analysis of important features is performed. Since the analysis up to this point has only focused on the average throughput, this compares other important features to give the reader a broader picture of the file systems.
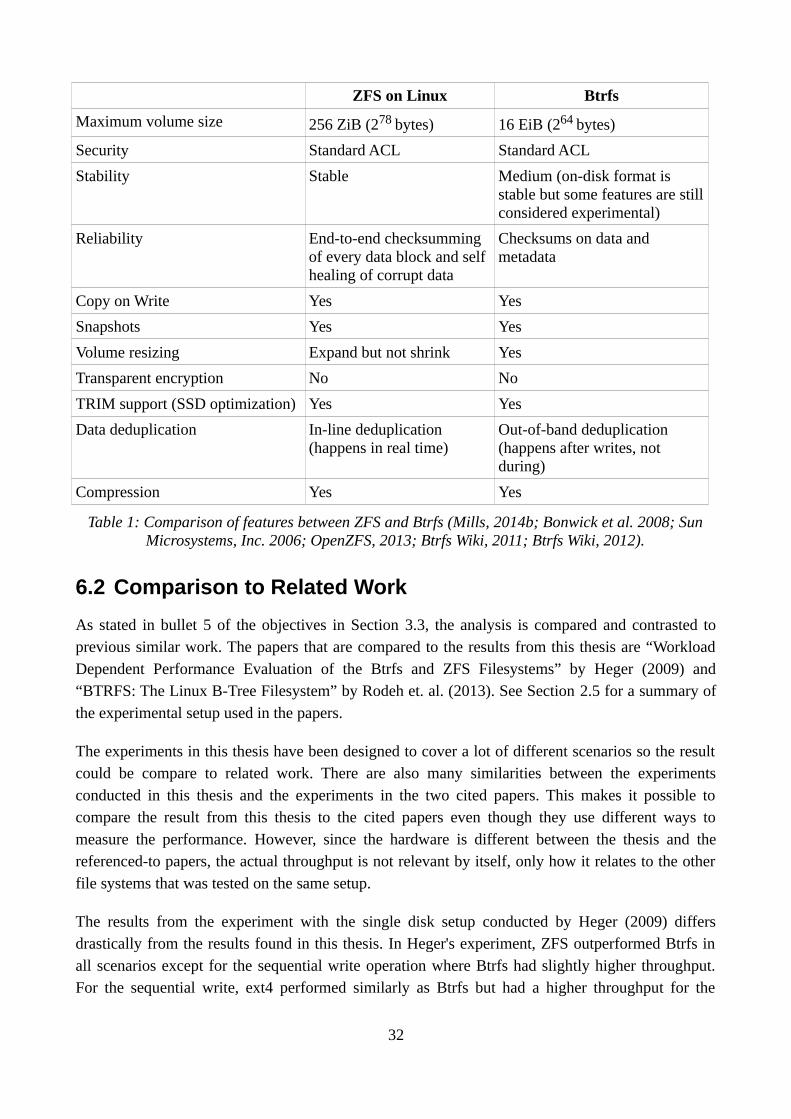
As seen in Table 1, many important features have similar support for both file systems. There are however some differences which will be explained here. ZFS is a 128-bit file system and the maximum volume size is thus 256 ZiB whereas Btrfs is a 64-bit file system which limits the maximum volume size to 16 EiB. ZFS on Linux is considered stable whereas the on-disk format is considered stable for Btrfs but some of the features is still being considered experimental, see Section 2.3. The reliability is considered high for ZFS with the End-to-end checksumming of every data block and self healing of corrupt data (see Section 2.2.2). Btrfs also have checksumming of both data and metadata but not the self healing feature as ZFS. Both file systems support volume resizing but for ZFS this is limited to expansion of the volume whereas Btrfs can both expand and shrink the volumes. Also, both file systems support data deduplication, which is a feature that eliminates duplicate copies of data on the disk. There are however some difference in the implementation of the feature between the two file systems. ZFS uses In-line deduplication which means that the hash calculations necessary for the deduplication process are calculated in real time as the data is written to the device whereas Btrfs uses Out-of-band deduplication which first stores the data on the device before calculating if duplicates already exists.
31
6.2 Comparison to Related Work
As stated in bullet 5 of the objectives in Section 3.3, the analysis is compared and contrasted to previous similar work. The papers that are compared to the results from this thesis are “Workload Dependent Performance Evaluation of the Btrfs and ZFS Filesystems” by Heger (2009) and “BTRFS: The Linux B-Tree Filesystem” by Rodeh et. al. (2013). See Section 2.5 for a summary of the experimental setup used in the papers.
The experiments in this thesis have been designed to cover a lot of different scenarios so the result could be compare to related work. There are also many similarities between the experiments conducted in this thesis and the experiments in the two cited papers. This makes it possible to compare the result from this thesis to the cited papers even though they use different ways to measure the performance. However, since the hardware is different between the thesis and the referenced-to papers, the actual throughput is not relevant by itself, only how it relates to the other file systems that was tested on the same setup.
The results from the experiment with the single disk setup conducted by Heger (2009) differs drastically from the results found in this thesis. In Heger's experiment, ZFS outperformed Btrfs in all scenarios except for the sequential write operation where Btrfs had slightly higher throughput. For the sequential write, ext4 performed similarly as Btrfs but had a higher throughput for the
32
ZFS on Linux Btrfs
Maximum volume size 256 ZiB (278 bytes) 16 EiB (264 bytes)
Security Standard ACL Standard ACL
Stability Stable Medium (on-disk format is stable but some features are still considered experimental)
Reliability End-to-end checksumming of every data block and self healing of corrupt data
Checksums on data and metadata
Copy on Write Yes Yes
Snapshots Yes Yes
Volume resizing Expand but not shrink Yes
Transparent encryption No No
TRIM support (SSD optimization) Yes Yes
Data deduplication In-line deduplication (happens in real time)
Out-of-band deduplication (happens after writes, not during)
Compression Yes Yes
Table 1: Comparison of features between ZFS and Btrfs (Mills, 2014b; Bonwick et al. 2008; Sun Microsystems, Inc. 2006; OpenZFS, 2013; Btrfs Wiki, 2011; Btrfs Wiki, 2012).

sequential read. For the random read and random write Btrfs was performing better than ext4 but ZFS outperformed them both. Compared to the results in this thesis, ZFS and ext4 performed equally in the sequential read and write tests while Btrfs had the highest throughput. For the random read in this thesis, ext4 was performing slightly better than Btrfs but ZFS was performing significantly worse than both the other file systems. The random write was more even between the file systems but Btrfs had the highest throughput followed by ZFS and ext4 had the lowest throughput. The results of Heger's experiment of sequential read and write with the RAID 10 setup showed that Btrfs had significantly lower average throughput than both ZFS and ext4, which had similar throughput. In the random read and write tests Btrfs performed slightly better than ext4. ZFS however far outperformed them both in this experiment.
Heger's conclusions from the experiments was that for the single disk test, Btrfs was able to provide a good throughput relative to ext4 whereas ZFS performed similarly or better than ext4. For the RAID 10 experiments, Btrfs was not able to provide throughput results comparable to ext4 or ZFS. The performance of ZFS, although better than Btrfs, still trailed ext4 in all workload scenarios except for the random read and random write tests. Comparing these conclusions to the results from this thesis, the biggest difference is the performance of Btrfs that seems to have improved substantially. The performance of ZFS however seems to be at best on the same performance level compared to the other file systems but in some aspects much worse. Possible reasons for this could be that it is the result of the other file systems performance having improved, the specific experimental setup effecting the results, or the Linux implementation of ZFS that is not as refined as for other platforms.
The results from the macrobenchmark with the single disk setup conducted by Rodeh et al. (2013) in many ways are similar to the equivalent experiment in this thesis. For the Fileserver profile, Btrfs showed the highest performance, fairly closely followed by ext4, and then XFS with the lowest performance. This is the same trend as can bee seen from the results of this thesis. The OLTP result shows that the three file systems are fairly equal in performance with a slight advantage to Btrfs. The OLTP results for the single disk setup in this thesis however shows that Btrfs has lower average throughput than the other file systems. The result in the compared paper is however very similar to the results of the multiple disk setups in this thesis. Finally in the Webserver profile experiment, Btrfs and XFS show similar throughput whereas ext4 shows a significantly higher performance. Compared to the results in this thesis the performance was very similar between all the file systems. The microbenchmarks with RAID 10 setup conducted by Rodeh et al. (2013) consisted of sequential read and write of large files. In the write test, Btrfs and XFS showed similar performance. The read test showed a bit of a difference between the file systems as Btrfs had slightly higher throughput than XFS. Compared to this thesis the result of the write test is the same as the performance is very similar for Btrfs and XFS.
The general results of the experiments conducted by Rodeh et al. seems to be that Btrfs performs as good as ext4 and XFS for most tests and for some tests even performing better. This seems to be the case for both single and multiple disk setups. Compared to the results in Heger (2009) this is a great improvement for Btrfs, especially for the RAID 10 setup.
33

7 Conclusion
In this thesis, a performance comparison between Btrfs and ZFS has been made by conducting a set of experiments. The file systems was also compared against the most common Linux file systems today, XFS and ext4. The experiments tested the average throughput for both single I/O operations and a combination of different workloads to emulate real usage. Further, different disk configurations was used. First a single disk setup was tested, then a RAID 10 setup and finally a RAID 5 setup. The result was then analyzed and compared to previous studies. In addition to this, a qualitative analysis of other important features was done.
The conclusion of the main findings is that Btrfs showed a high average throughput for most of the tests, compared to the other file systems. By comparing the results to the results from previous similar work it shows that the performance has improved greatly in recent years, especially the multiple disk performance. Btrfs has had big problems with the stability of RAID 5 and RAID 6 and only in the latest Linux kernel, at the time of writing, was it considered stable. Therefore a RAID 5 setup was also included in the experiments and the results surprisingly showed that Btrfs had significantly higher average throughput than the other file systems. ZFS however did not perform as well but the exact reason for this could not be established from the data gathered in the experiments, but is instead listed as in the future work section (see Section 7.3).
7.1 Ethical Aspects and Social Impact
The ethical aspect for this thesis, that could be reflected on is that best practices according to scientific standards has been followed. This can for instance be seen in Section 2.4 which covers best practices of file system experiments. An other aspect is that a critical attitude has been shown towards the thesis. This can be seen in Section 4.4 where a number of possible validity threats to the method used in the thesis are discussed and it can also be seen in Section 7.2 where the author reflects and evaluates the approach, method and result of the thesis.
The social impact this thesis might have is hard to assess as it mainly would depend on the reach it would get. In theory however the impact could be to help make data centers more efficient as the thesis is aiming to find out which of the tested file systems have the best performance. If the servers are more efficient, less hardware could be used and less energy would be consumed. This would lead to less pollution from the data centers which would have a reduced impact on the environment. Even a small change in the performance could lead to big differences in the energy consumption in a data center with thousands of servers.
7.2 Reflection
This section discusses what could have been done better in the thesis. There are already a few similar discussions in the thesis, for instance in Section 4.1.1 alternative methods are discussed and Section 4.4 brings up a few possible validity threats for the chosen method. Other issues that has become clearer as the work on the thesis has proceeded is for instance that the Filebench experiment
34

with the OLTP profile showed quite some difference in the results between the repetitions of the experiment. To get more reliable numbers from this test it should be run for more repetitions and each repetition should be run for a longer time.
The hardware setup used in the experiment could have been a bit different to give a more reliable result. A RAID controller with a pass through setting would have been better than the workaround presented in Section 4.2. This is to avoid any unnecessary meta data on the disks and instead give full access directly to the disk. This would better emulate how Btrfs and ZFS would be used in a real world scenario. Also SSD's could have been tested as well as mechanical disks as SSD's are getting more and more popular for server usage.
7.3 Future Work
The experiments in this thesis has shown that ZFS is in general not performing as well as the other tested file systems. If this is isolated to the Linux implementation of ZFS can not be determined from the thesis as it is the only tested platform. For future work a more detailed inspection could be conducted to find what the lower performance might be caused by. This could be done by using profiling, which is an analysis where among other things, the frequency and duration of function calls can be measured. This could show where in the code the most time is spent to help explain the difference in average throughput.
Another interesting point to examine is if the throughput performance of ZFS is an issue with the Linux implementation only. This cold be investigated by making a performance comparison of ZFS on different platforms. The results could then be compared to this thesis to estimate if the Linux implementation is the reason for the results or if other factors may be involved.
Due to lack of resources, a test of solid state drives (SSD) disks could not be performed in this thesis. All the tested file systems however do have support for SSD optimization such as TRIM. It would therefore be interesting to see a similar performance test as the one in this thesis, done on SSD's.
Since the experiments in this thesis only uses default settings for the file systems, and tests general performance, it would be interesting to compare those results to an experiment where the file systems have been optimized for a specific application or operation.
ZFS supports the use of an SSD as an extra cache to speed up read and writes to and from slower mechanical disks, which Btrfs does not have built in support for at this time. However, there is support for this in the Linux kernel, called bcache. An experiment where caches where to be used with an extra SSD as an additional cache would therefore be interesting.
35

8 Non-Technical Summary
To be able to store data on computers, a special software called a file system is used to control how the data is saved and retrieved. This thesis aims to compare two file systems, Btrfs and ZFS, on the Linux platform to see which one is able to handle the data faster. This is accomplished by setting up an experiment where a computer is testing different ways to save and retrieve data, using one file systems at the time. Then the results from the experiments are analyzed to see which file system is faster. The results are also compared against previous publications that have conducted similar experiments. The results from the experiment shows that Btrfs provides good performance in most tests whereas ZFS showed significantly worse performance.
36

References
Aurora, V. (2009) A short history of btrfs. Available on Internet: http://lwn.net/Articles/342892/ [Retrieved 2015-02-16]
Bonwick, J. (2006) You say zeta, I say zetta. Available on Internet: https://blogs.oracle.com/bonwick/en_US/entry/you_say_zeta_i_say [Retrieved 2015-02-16]
Bonwick, J., Moore, B. (2008) ZFS - The Last Word in File Systems. Available on Internet: http://www.snia.org/sites/default/files2/sdc_archives/2008_presentations/monday/JeffBonwick-BillMoore_ZFS.pdf [Retrieved 2015-02-18]
Btrfs Wiki (2011) SysadminGuide. Available on Internet: https://btrfs.wiki.kernel.org/index.php/SysadminGuide [Retrieved 2015-06-07]
Btrfs Wiki (2012) Mount options. Available on Internet: https://btrfs.wiki.kernel.org/index.php/Mount_options [Retrieved 2015-06-07]
Burnett, C. (2006) RAID 5.svg. Available on Internet: http://commons.wikimedia.org/wiki/File:RAID_5.svg [Retrieved 2015-05-22]
Burnett, C. (2011) RAID 10.svg. Available on Internet: http://commons.wikimedia.org/wiki/File:RAID_10.svg [Retrieved 2015-05-22]
Comer, D. (1979). The Ubiquitous B-Tree. ACM Computing Surveys. 11.
Heger, D. (2009). Workload Dependent Performance Evaluation of the Btrfs and ZFS Filesystems. Proceeding of the International Conference for Performance and Capacity Management - CMG2009, Dallas, TX.
Larabel, M. (2014) Facebook To Trial Btrfs Deployments. Available on Internet: http://www.phoronix.com/scan.php?page=news_item&px=MTY0NDk [Retrieved 2015-02-16]
Linux Kernel Organization. (2014) Is Linux Kernel Free Software? Available on Internet: https://www.kernel.org/category/faq.html [Retrieved 2015-02-16]
Mason, C. (2007) [ANNOUNCE] Btrfs: a copy on write, snapshotting FS. Available on Internet: https://lkml.org/lkml/2007/6/12/242 [Retrieved 2015-02-23]
Mason, C. (2008a) Btrfs wiki: Main page. Available on Internet: https://btrfs.wiki.kernel.org/index.php/Main_Page [Retrieved 2015-02-21]
Mason, C. (2008b) Btrfs wiki: Btrfs design. Available on Internet: https://btrfs.wiki.kernel.org/index.php/Btrfs_design [Retrieved 2015-02-21]
37

McPherson, A. (2009) A Conversation with Chris Mason on BTRfs: the next generation file system for Linux. Available on Internet: http://www.linuxfoundation.org/news-media/blogs/browse/2009/06/conversation-chris-mason-btrfs-next-generation-file-system-linux [Retrieved 2015-02-21]
Merlin, M. (2014a) Btrfs wiki: Contributors. Available on Internet: https://btrfs.wiki.kernel.org/index.php/Contributors [Retrieved 2015-02-21]
Merlin, M. (2014b) Btrfs wiki: Production Users. Available on Internet: https://btrfs.wiki.kernel.org/index.php/Production_Users [Retrieved 2015-02-21]
Mills, H. (2012) Btrfs wiki: FAQ - Is btrfs stable? Available on Internet: https://btrfs.wiki.kernel.org/index.php/FAQ#Is_btrfs_stable.3F [Retrieved 2015-02-21]
Mills, H. (2014a) Using Btrfs with Multiple Devices. Available on Internet: https://btrfs.wiki.kernel.org/index.php/Using_Btrfs_with_Multiple_Devices#Raid_5_and_Raid6 [Retrieved 2015-02-26]
Mills, H. (2014b) Deduplication. Available on Internet: https://btrfs.wiki.kernel.org/index.php/Deduplication [Retrieved 2015-06-07]
Mills, H. (2015) RAID56. Available on Internet: https://btrfs.wiki.kernel.org/index.php/RAID56 [Retrieved 2015-02-26]
Norcott, W. (2012) Iozone Filesystem Benchmark. Available on Internet: http://www.iozone.org/docs/IOzone_msword_98.pdf [Retrieved 2015-02-25]
OpenZFS (2013) Features. Available on Internet: http://open-zfs.org/wiki/Features [Retrieved 2015-06-07]
Paetzel, J. (2014) How you can trick ZFS unintentionally to get the block size wrong. Available on Internet: https://forums.freenas.org/index.php?threads/how-you-can-trick-zfs-unintentionally-to-get-the-block-size-wrong.20802/ [Retrieved 2015-05-18]
Rodeh, O., Bacik, J., & Mason, C. (2013). BTRFS: The Linux B-Tree Filesystem. ACM Transactions on Storage. 9, 1-32.
Siden, C. (2013) OpenZFS Documentation: Goals. Available on Internet: http://open-zfs.org/wiki/Main_Page [Retrieved 2015-02-23]
Siden, C. (2014) OpenZFS Documentation: History. Available on Internet: http://open-zfs.org/wiki/History [Retrieved 2015-02-16]
Silberschatz, A., Galvin, P. B., & Gagne, G. (2005). Operating system concepts. 7th ed. John Wiley & Sons, Inc, New York.
38

Sterba, D. (2014) Btrfs wiki: Main Page – Stability status. Available on Internet: https://btrfs.wiki.kernel.org/index.php/Main_Page#Stability [Retrieved 2015-02-21]
Sun Microsystems, Inc. (2006) ZFS On-Disk Specification. Available on Internet: http://maczfs.googlecode.com/files/ZFSOnDiskFormat.pdf [Retrieved 2015-02-23]
SUSE. (2015) SUSE Linux Enterprise Server 12 Release Notes. Available on Internet: https://www.suse.com/releasenotes/x86_64/SUSE-SLES/12/ [Retrieved 2015-05-06]
Swearingen, C. (2009) ZFS Evil Tuning Guide: Disabling Metadata Compression for Flash Accelerator Performance. Available on Internet: http://www.solarisinternals.com/wiki/index.php/ZFS_Evil_Tuning_Guide [Retrieved 2015-05-18]
Tarasov, V. (2011) Filebench wiki: Pre-defined personalities. Available on Internet: http://filebench.sourceforge.net/wiki/index.php/Pre-defined_personalities [Retrieved 2015-04-20]
Tarasov, V., Saumitra B., Erez Z. & Margo S.. (2011) Benchmarking file system benchmarking: It *IS* rocket science. In Proceedings of the 13th Workshop on Hot Topics in Operating Systems (HotOS XIII). May 9-11, 2011, Napa, California. Berkeley, CA: USENIX Association.
Traeger, A., Zadok E., Joukov N., & Wright C.P. (2008). A nine year study of file system and storage benchmarking. ACM Transactions on Storage. 4.
Wohlin, C., Runeson, P., Höst, M., Ohlsson, C., Regnell, B., Wesslén, A. (2012). Experimentation in software engineering. Springer, Berlin.
Wojslaw, D. (2014) Pool layouts Available on Internet: http://wiki.openindiana.org/oi/Pool+layouts [Retrieved 2015-02-26]
Wuelfing, B. (2009) Kernel 2.6.29: Corbet Says Btrfs Next Generation Filesystem. Available on Internet: http://www.linux-magazine.com/Online/News/Kernel-2.6.29-Corbet-Says-Btrfs-Next-Generation-Filesystem [Retrieved 2015-02-24]
ZFS on Linux. (2013) ZFS on Linux FAQ. Available on Internet: http://zfsonlinux.org/faq.html [Retrieved 2015-02-23]
39

Appendix A
ZFS setup
ZFS is installed from ZFS on Linux's Ubuntu repository followed by loading the module in to the kernel:
add-apt-repository ppa:zfs-native/stable
apt-get install ubuntu-zfs
modprobe zfs
The single disk setup is created and mounted in the following manner:
zpool create -f -m /mnt/zfs-single zfs-single /dev/sdb
The RAID 10 setup is created in the following manner:
zpool create -f -m /mnt/zfs-raid10 zfs-raid10 mirror /dev/sdb /dev/sdc mirror /dev/sdd /dev/sde
The RAID 5 setup is created in the following manner:
zpool create -f -m /mnt/zfs-raid5 zfs-raid5 raidz /dev/sdb /dev/sdc /dev/sdd /dev/sde
Btrfs setup
Btrfs management tools are installed from Ubuntu's official repository:
apt-get install btrfs-tools
The single disk setup is created and mounted in the following manner:
mkfs.btrfs -f -m single /dev/sdb
mount /dev/sdb /mnt/btrfs-single/
The RAID 10 setup is created in the following manner:
mkfs.btrfs -f -m raid10 -d raid10 /dev/sdb /dev/sdc /dev/sdd /dev/sde
The RAID 5 setup is created in the following manner:

mkfs.btrfs -f -m raid5 -d raid5 /dev/sdb /dev/sdc /dev/sdd /dev/sde
XFS setup
XFS management tools are installed from Ubuntu's official repository:
apt-get install xfsprogs
The single disk setup is created by first creating a partition in fdisk then formating the partition and mounting it:
mkfs.xfs -f /dev/sdb1
mount -t xfs /dev/sdb1 /mnt/xfs-single/
The RAID 10 setup is created with mdadm in the following manner:
mdadm --create --verbose /dev/md0 --level=10 --raid-devices=4 /dev/sdb1 /dev/sdc1 /dev/sdd1 /dev/sde1
mkfs.xfs -f /dev/md0
mount -t xfs /dev/md0 /mnt/xfs-raid10/
The RAID 5 setup is created with mdadm in the following manner:
mdadm --create --verbose /dev/md0 --level=5 --raid-devices=4 /dev/sdb1 /dev/sdc1 /dev/sdd1 /dev/sde1
mkfs.xfs -f /dev/md0
mount -t xfs /dev/md0 /mnt/xfs-raid5/
ext4 setup
The single disk setup is created by first creating a partition in fdisk then formating the partition and mounting it:
mkfs.ext4 /dev/sdb1
mount /dev/sdb1 /mnt/ext4-single/
The RAID 10 setup is created with mdadm in the following manner:
mdadm --create --verbose /dev/md0 --level=10 --raid-devices=4 /dev/sdb1 /dev/sdc1 /dev/sdd1 /dev/sde1

mkfs.ext4 /dev/md0
mount /dev/md0 /mnt/ext4-raid10/
The RAID 5 setup is created with mdadm in the following manner:
mdadm --create --verbose /dev/md0 --level=5 --raid-devices=4 /dev/sdb1 /dev/sdc1 /dev/sdd1 /dev/sde1
mkfs.ext4 -f /dev/md0
mount /dev/md0 /mnt/ext4-raid5/

Appendix B
Filebench configuration: fileserver.f.
#
# CDDL HEADER START
#
# The contents of this file are subject to the terms of the
# Common Development and Distribution License (the "License").
# You may not use this file except in compliance with the License.
#
# You can obtain a copy of the license at usr/src/OPENSOLARIS.LICENSE
# or http://www.opensolaris.org/os/licensing.
# See the License for the specific language governing permissions
# and limitations under the License.
#
# When distributing Covered Code, include this CDDL HEADER in each
# file and include the License file at usr/src/OPENSOLARIS.LICENSE.
# If applicable, add the following below this CDDL HEADER, with the
# fields enclosed by brackets "[]" replaced with your own identifying
# information: Portions Copyright [yyyy] [name of copyright owner]
#
# CDDL HEADER END
#
#
# Copyright 2008 Sun Microsystems, Inc. All rights reserved.
# Use is subject to license terms.
#
set $dir=/mnt/zfs-single
set $nfiles=10000
set $meandirwidth=20
set $meanfilesize=128k
set $nthreads=50
set $iosize=1m
set $meanappendsize=16k
define fileset name=bigfileset,path=$dir,size=$meanfilesize,entries=$nfiles,dirwidth=$meandirwidth,prealloc=80
define process name=filereader,instances=1
{
thread name=filereaderthread,memsize=10m,instances=$nthreads
{

flowop createfile name=createfile1,filesetname=bigfileset,fd=1
flowop writewholefile name=wrtfile1,srcfd=1,fd=1,iosize=$iosize
flowop closefile name=closefile1,fd=1
flowop openfile name=openfile1,filesetname=bigfileset,fd=1
flowop appendfilerand name=appendfilerand1,iosize=$meanappendsize,fd=1
flowop closefile name=closefile2,fd=1
flowop openfile name=openfile2,filesetname=bigfileset,fd=1
flowop readwholefile name=readfile1,fd=1,iosize=$iosize
flowop closefile name=closefile3,fd=1
flowop deletefile name=deletefile1,filesetname=bigfileset
flowop statfile name=statfile1,filesetname=bigfileset
}
}
run 60
Filebench configuration: oltp.f.
#
# CDDL HEADER START
#
# The contents of this file are subject to the terms of the
# Common Development and Distribution License (the "License").
# You may not use this file except in compliance with the License.
#
# You can obtain a copy of the license at usr/src/OPENSOLARIS.LICENSE
# or http://www.opensolaris.org/os/licensing.
# See the License for the specific language governing permissions
# and limitations under the License.
#
# When distributing Covered Code, include this CDDL HEADER in each
# file and include the License file at usr/src/OPENSOLARIS.LICENSE.
# If applicable, add the following below this CDDL HEADER, with the
# fields enclosed by brackets "[]" replaced with your own identifying
# information: Portions Copyright [yyyy] [name of copyright owner]
#
# CDDL HEADER END
#
#
# Copyright 2009 Sun Microsystems, Inc. All rights reserved.
# Use is subject to license terms.
#

set $dir=/mnt/zfs-single
set $eventrate=0
set $runtime=30
set $iosize=2k
set $nshadows=200
set $ndbwriters=10
set $usermode=200000
set $filesize=10m
set $memperthread=1m
set $workingset=0
set $cached=0
set $logfilesize=10m
set $nfiles=10
set $nlogfiles=1
set $directio=0
eventgen rate = $eventrate
# Define a datafile and logfile
define fileset name=datafiles,path=$dir,size=$filesize,filesizegamma=0,entries=$nfiles,dirwidth=1024,prealloc=100,cached=$cached,reuse
define fileset name=logfile,path=$dir,size=$logfilesize,filesizegamma=0,entries=$nlogfiles,dirwidth=1024,prealloc=100,cached=$cached,reuse
define process name=lgwr,instances=1
{
thread name=lgwr,memsize=$memperthread
{
flowop aiowrite name=lg-write,filesetname=logfile,
iosize=256k,random,directio=$directio,dsync
flowop aiowait name=lg-aiowait
flowop semblock name=lg-block,value=3200,highwater=1000
}
}
# Define database writer processes
define process name=dbwr,instances=$ndbwriters
{
thread name=dbwr,memsize=$memperthread
{
flowop aiowrite name=dbwrite-a,filesetname=datafiles,
iosize=$iosize,workingset=$workingset,random,iters=100,opennext,directio=$directio,dsync

flowop hog name=dbwr-hog,value=10000
flowop semblock name=dbwr-block,value=1000,highwater=2000
flowop aiowait name=dbwr-aiowait
}
}
define process name=shadow,instances=$nshadows
{
thread name=shadow,memsize=$memperthread
{
flowop read name=shadowread,filesetname=datafiles,
iosize=$iosize,workingset=$workingset,random,opennext,directio=$directio
flowop hog name=shadowhog,value=$usermode
flowop sempost name=shadow-post-lg,value=1,target=lg-block,blocking
flowop sempost name=shadow-post-dbwr,value=1,target=dbwr-block,blocking
flowop eventlimit name=random-rate
}
}
run 60
Filebench configuration: webserver.f.
#
# CDDL HEADER START
#
# The contents of this file are subject to the terms of the
# Common Development and Distribution License (the "License").
# You may not use this file except in compliance with the License.
#
# You can obtain a copy of the license at usr/src/OPENSOLARIS.LICENSE
# or http://www.opensolaris.org/os/licensing.
# See the License for the specific language governing permissions
# and limitations under the License.
#
# When distributing Covered Code, include this CDDL HEADER in each
# file and include the License file at usr/src/OPENSOLARIS.LICENSE.
# If applicable, add the following below this CDDL HEADER, with the
# fields enclosed by brackets "[]" replaced with your own identifying
# information: Portions Copyright [yyyy] [name of copyright owner]
#
# CDDL HEADER END
#
#

# Copyright 2007 Sun Microsystems, Inc. All rights reserved.
# Use is subject to license terms.
#
set $dir=/mnt/zfs-single
set $nfiles=1000
set $meandirwidth=20
set $meanfilesize=16k
set $nthreads=100
set $iosize=1m
set $meanappendsize=16k
define fileset name=bigfileset,path=$dir,size=$meanfilesize,entries=$nfiles,dirwidth=$meandirwidth,prealloc=100
define fileset name=logfiles,path=$dir,size=$meanfilesize,entries=1,dirwidth=$meandirwidth,prealloc
define process name=filereader,instances=1
{
thread name=filereaderthread,memsize=10m,instances=$nthreads
{
flowop openfile name=openfile1,filesetname=bigfileset,fd=1
flowop readwholefile name=readfile1,fd=1,iosize=$iosize
flowop closefile name=closefile1,fd=1
flowop openfile name=openfile2,filesetname=bigfileset,fd=1
flowop readwholefile name=readfile2,fd=1,iosize=$iosize
flowop closefile name=closefile2,fd=1
flowop openfile name=openfile3,filesetname=bigfileset,fd=1
flowop readwholefile name=readfile3,fd=1,iosize=$iosize
flowop closefile name=closefile3,fd=1
flowop openfile name=openfile4,filesetname=bigfileset,fd=1
flowop readwholefile name=readfile4,fd=1,iosize=$iosize
flowop closefile name=closefile4,fd=1
flowop openfile name=openfile5,filesetname=bigfileset,fd=1
flowop readwholefile name=readfile5,fd=1,iosize=$iosize
flowop closefile name=closefile5,fd=1
flowop openfile name=openfile6,filesetname=bigfileset,fd=1
flowop readwholefile name=readfile6,fd=1,iosize=$iosize
flowop closefile name=closefile6,fd=1
flowop openfile name=openfile7,filesetname=bigfileset,fd=1
flowop readwholefile name=readfile7,fd=1,iosize=$iosize
flowop closefile name=closefile7,fd=1
flowop openfile name=openfile8,filesetname=bigfileset,fd=1

flowop readwholefile name=readfile8,fd=1,iosize=$iosize
flowop closefile name=closefile8,fd=1
flowop openfile name=openfile9,filesetname=bigfileset,fd=1
flowop readwholefile name=readfile9,fd=1,iosize=$iosize
flowop closefile name=closefile9,fd=1
flowop openfile name=openfile10,filesetname=bigfileset,fd=1
flowop readwholefile name=readfile10,fd=1,iosize=$iosize
flowop closefile name=closefile10,fd=1
flowop appendfilerand name=appendlog,filesetname=logfiles,iosize=$meanappendsize,fd=2
}
}
run 60
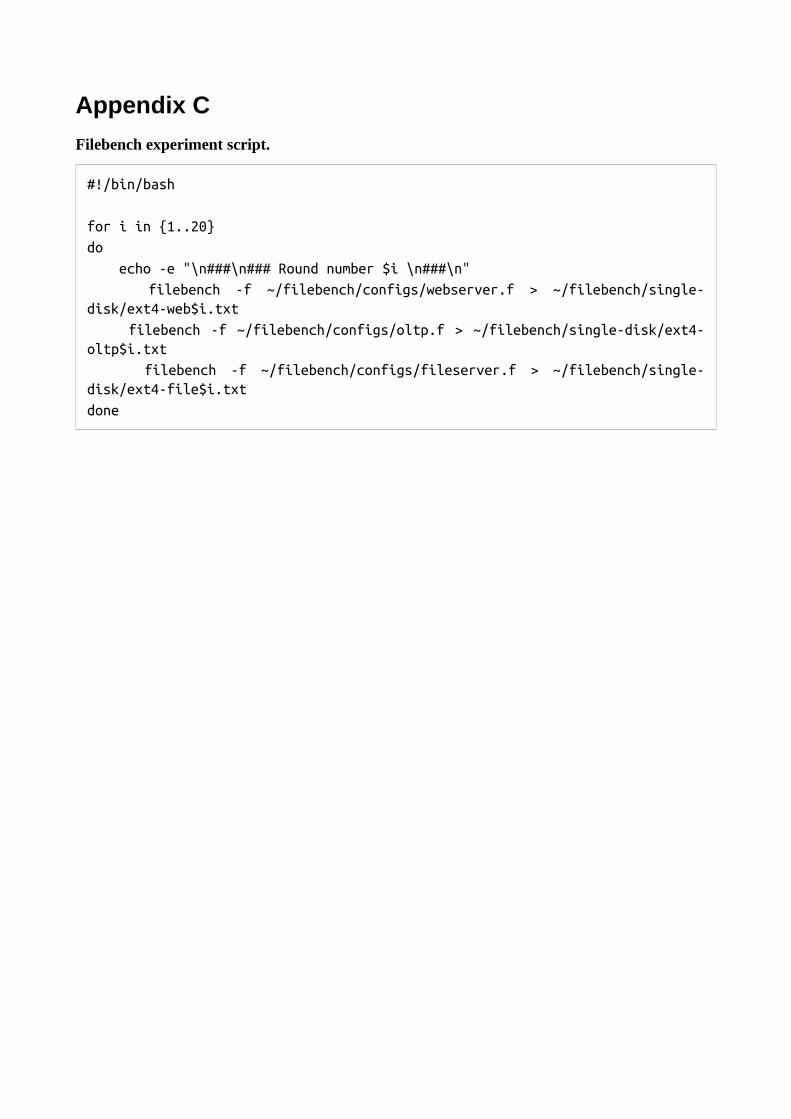
Appendix C
Filebench experiment script.
#!/bin/bash
for i in {1..20}
do
echo -e "\n###\n### Round number $i \n###\n"
filebench -f ~/filebench/configs/webserver.f > ~/filebench/single-disk/ext4-web$i.txt
filebench -f ~/filebench/configs/oltp.f > ~/filebench/single-disk/ext4-oltp$i.txt
filebench -f ~/filebench/configs/fileserver.f > ~/filebench/single-disk/ext4-file$i.txt
done
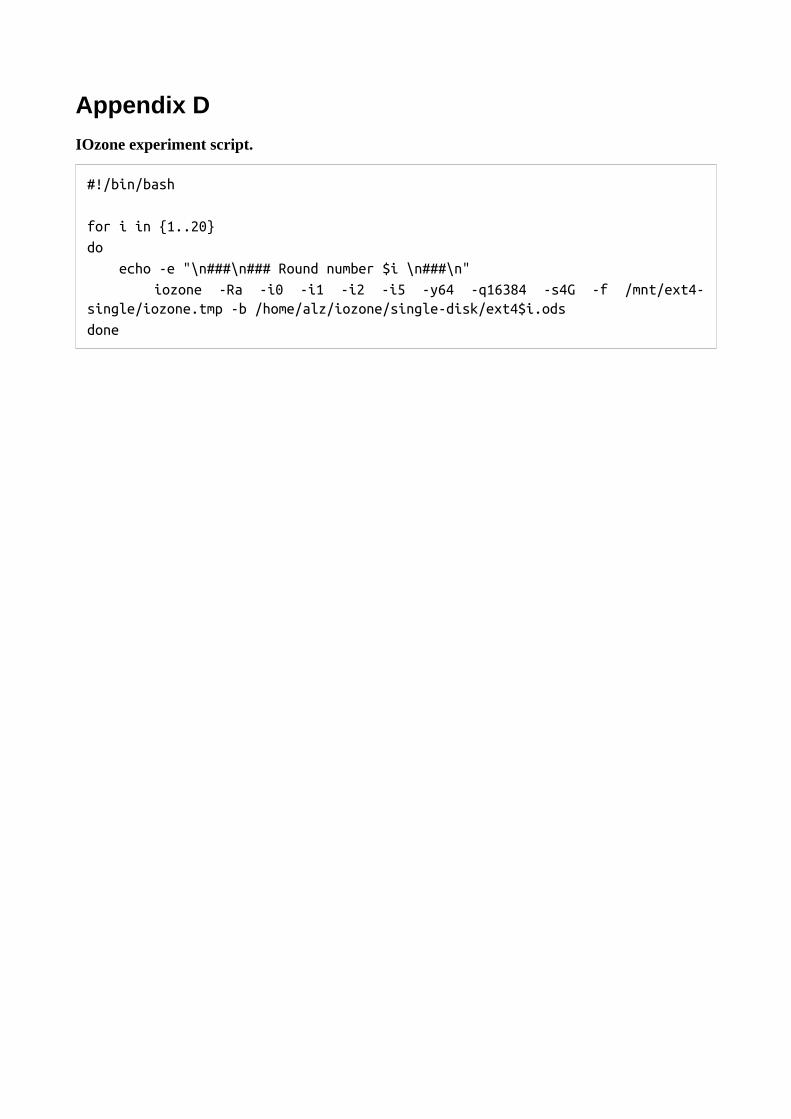
Appendix D
IOzone experiment script.
#!/bin/bash
for i in {1..20}
do
echo -e "\n###\n### Round number $i \n###\n"
iozone -Ra -i0 -i1 -i2 -i5 -y64 -q16384 -s4G -f /mnt/ext4-single/iozone.tmp -b /home/alz/iozone/single-disk/ext4$i.ods
done

Appendix E
Wohlin et al. (2012, p. 104-110) lists threats that could impact the validity of an experiment. Following is a complete list of these validity threats. If the threat is applicable to the experiment in this thesis, an explanation of how the threat is handled is given.
Conclusion Validity
Threats to the conclusion validity are concerned with issues that affect the ability to draw the correct conclusion about relations between the treatment and the outcome of an experiment.
Low statistical power: This threat could lead to erroneus conclusions being drawn by not having high enough statistical power. This has been handled by repeating each experiment 20 times. Also the data is presented so the differences between the repetitions can be seen.
Violated assumptions of statistical tests: Not applicable.
Fishing and the error rate: Searching or ”fishing” for a specific result from the experiment is a threat. This has been handled by treating all the file systems equally and using the same experimental setup for all experiments. The default settings have been used for all file systems so none of the file systems have an advantage for a specific test by optimizing the file systems for a specific workload. Also, a number of different tests have been used in the experiments. This minimizes the chanse that the tests or workload is extra favourable for a specific file system.
Reliability of measures: The reliability of an experiment is highly dependent on the reliability of the measures. This may in turn depend on for instance bad instrumentation or bad instrument layout. This has been handled by using tools that are accepted by the industry instead of for example constructing custom scripts for the experiments. For the Filebench experiments, the predefined profiles has been used without modification as they have been created by experts in the field.
Reliability of treatment implementation: The implementation of the treatment means the application of treatments to subjects. The risk that the implemenation is not similar between the different experiments or between the repetitions of an experiment is minimized in several ways. The experimental setup is the same for all the tested file systems and remains the same for all tests. The experiments that are performed are all set up the same way for all file systems. All non-essential services are shut down to prevent contamination of the experiments. For example, cron is shut down to prevent scheduled jobs to run while an experiment is running.
Random irrelevancies in experimental setting: Elements outside the experimental setting may disturb the results. This is somewhat tied to the previos threat in the aspect of non-essential services disturbing the results but also includes external elements. For example the server in the experiments was not connected to a network and all network services was shut down to ensure no external disturbances would affect the results.
Random heterogeneity of subjects: Not applicable.

Internal Validity
Threats to internal validity are influences that can affect the independent variable with respect to causality, without the researcher's knowledge. These threats can be sorted into three categories: Single group threats, Multiple group threats and Social threats.
Single group threats
These threats apply to experiments with single groups without a control group.
History: Not applicable.
Maturation: Not applicable.
Testing: If the test is repeated, the subjects may respond differently at different times since they know how the test is conducted. This threat can be applied on the experiment in this thesis as the test is repeded multiple times and the first run of the experiment might be different than the following due to caches and buffers being empty. The threat is minimized by discarding the data from the first run of each experiment, allowing the system to reach a steady state.
Instrumentation: This is the effect caused by the artifacts used for experiment execution. This is described in the ”Reliability of measures” validity threat.
Statistical regression: Not applicable.
Selection: Not applicable.
Mortality: This effect is due to the different kinds of persons who drop out from an experiment. This is usually applyed to humans but can for this experiment also be applied to the hardware used. If for example one of the hard drives in the experiment would fail, parts of the experiment would have to be repeated to ensure the reliability of treatment implementation would not endanger the validity. To prepare for such an incident, redundant hardware was made available and since the experiments was divided into different categories based on the disk setup, only the tests for the specific setup would have to be repeated.
Ambiguity about direction of causal influence: Not applicable.
Multiple group threats
The threat where different groups are studied is that the control group and the selected experiment groups may be affected differently by the single group threats.
Interactions with selection: Not applicable.
Social threats to internal validity
These threats are applicable to both single group and multiple group experiments.

Diffusion or imitation of treatments: Not applicable.
Compensatory equalization of treatments: Not applicable.
Compensatory rivalry: Not applicable.
Resentful demoralization: Not applicable.
Construct Validity
Construct validity concerns generalizing the result of the experiment to the concept or theory behind the experiment.
Design threats
These cover issues that are related to the design of the experiment.
Inadequate preoperational explication of constructs: This means that the constructs are not sufficiently defined before they are translated into measures or treatments. To minimize this threat the method is explained in detail and research papers on how to conduct file system experiments has been studied and important guidlines from the papers are applied on the method used for the experiment. However, this means that the level this threat is minimized largely depends on the quality of studied papers.
Mono-operation bias: The experiment may under-represent the construct and not give the full picture of the theory if it only includes a single variable, case, subject or treatment. To minimize this threat, two different types of software has been used that measures the average throughput in different ways. The results from these are then cross-checked against each other.
Mono-method bias: If a single type of measures or observations are used, the experiment will be misleading if these gives a measurement bias. This is minimized by in addition to the experiment, also making a qualitative analysis of different features available for Btrfs and ZFS.
Confounding constructs and levels of constructs: Not applicable.
Interaction of different treatments: Not applicable.
Interaction of testing and treatment: Not applicable.
Restricted generalizability across constructs: The treatment may affect the studied construct positively, but unintenionally affect other constructs negatively. This could be applied on the experiment in this thesis as the focus is on the average throughput. The threat is minimized by conducting a qualitative analysis of important features. If for example a higher average throughput is achieved at the cost of an important feature not being available in the file system, the reader can weigh these factors against each other and decide what is most important for their specific situation.
Social threats to construct validity

These threats are concerned with issues related to behavior of the subjects and the experimenters.
Hypothesis guessing: Not applicable.
Evaluation apprehension: Not applicable.
Experimenter expectancies: Not applicable.
External Validity
Threats to external validity are conditions that limit our ability to generalize the results of our experiment to industrial practice.
Interaction of selection and treatment: Not applicable.
Interaction of setting and treatment: This is the effect of not having the experimental setting or material representative of, for example, industrial practice. This is minimized by using tools accepted by the industy. However, there is a risk that the synthetic tests are not going to be able to exactly reproduce the conditions and workloads of a real-life application, but at best give a general view of how the system would behave under certain conditions. Also the environment the experiment is conducted in is assumed to be representative for an enterprise environment but there is a risk that it may not be able to emulate this exactly.
Interaction of history and treatment: Not applicable.

Appendix F
Filebench single disk results.
Figure 24: Filebench Fileserver experiment with single disk setup.
ZFS Btrfs ext4 XFS0
20
40
60
80
100
120
Single disk - Fileserver
File system
Th
rou
gh
pu
t (M
B/s
)
Figure 25: Filebench OLTP experiment with single disk setup.
ZFS Btrfs ext4 XFS0
10
20
30
40
50
60
70
80
90
Single disk - OLTP
File system
Th
rou
gh
pu
t (M
B/s
)

Figure 26: Filebench Webserver experiment with single disk setup.
ZFS Btrfs ext4 XFS0
10
20
30
40
50
60
Single disk - Webserver
File system
Th
rou
gh
pu
t (M
B/s
)

Appendix G
Filebench RAID 10 results.
Figure 27: Filebench Fileserver experiment with RAID 10 setup.
ZFS Btrfs ext4 XFS0
50
100
150
200
250
RAID 10 - Fileserver
File system
Th
rou
gh
pu
t (M
B/s
)
Figure 28: Filebench OLTP experiment with RAID 10 setup.
ZFS Btrfs ext4 XFS0
2
4
6
8
10
12
14
16
18
RAID 10 - OLTP
File system
Th
rou
gh
pu
t (M
B/s
)

Figure 29: Filebench Webserver experiment with RAID 10 setup.
ZFS Btrfs ext4 XFS0
10
20
30
40
50
60
RAID 10 - Webserver
File system
Th
rou
gh
pu
t (M
B/s
)

Appendix H
Filebench RAID 5 results.
Figure 30: Filebench Fileserver experiment with RAID 5 setup.
ZFS Btrfs ext4 XFS0
20
40
60
80
100
120
RAID 5 - Fileserver
File system
Th
rou
gh
pu
t (M
B/s
)
Figure 31: Filebench OLTP experiment with RAID 5 setup.
ZFS Btrfs ext4 XFS0
2
4
6
8
10
12
RAID 5 - OLTP
File system
Th
rou
gh
pu
t (M
B/s
)

Figure 32: Filebench Webserver experiment with RAID 5 setup.
ZFS Btrfs ext4 XFS0
10
20
30
40
50
60
RAID 5 - Webserver
File server
Th
rou
gh
pu
t (M
B/s
)

Appendix I
IOzone single disk results.
ZFS
Table 2: IOzone ZFS results for single disk.
Write64 128 256 512 1024 2048 4096 8192 16384
Average 118,5 119,1 120,7 118,4 119,0 120,8 121,6 127,6 120,6Min 100,4 103,9 106,3 93,7 99,5 106,3 99,7 112,2 100,0Q1 109,8 112,9 116,5 112,4 111,8 113,0 115,0 125,7 109,8Median 121,2 118,0 120,9 119,7 121,4 122,6 125,5 128,8 126,4Q3 125,6 125,2 125,3 124,0 125,7 128,7 128,5 130,5 129,2Max 131,0 134,1 133,2 135,8 137,3 133,9 132,4 135,1 140,6
Re-write64 128 256 512 1024 2048 4096 8192 16384
Average 34,4 121,7 121,6 121,2 125,2 125,4 124,6 125,2 127,6Min 31,5 108,4 104,7 98,9 104,5 111,6 113,6 112,3 118,3Q1 33,1 115,7 116,8 119,1 124,4 121,2 120,4 122,0 124,3Median 34,5 123,3 125,1 122,2 126,1 126,9 125,1 125,7 126,8Q3 35,5 126,5 128,1 126,9 128,9 131,8 127,8 128,1 128,2Max 38,1 132,1 131,8 132,6 132,6 133,2 138,0 138,4 139,2
Read64 128 256 512 1024 2048 4096 8192 16384
Average 124,0 112,7 113,4 112,5 117,0 116,9 116,9 117,8 120,2Min 114,6 100,8 95,8 88,0 99,2 101,7 108,2 103,7 108,1Q1 121,6 106,8 108,2 110,2 115,5 113,7 114,0 115,5 117,9Median 124,3 113,5 116,0 115,0 118,8 118,2 116,3 118,0 119,2Q3 126,4 118,4 120,4 117,4 121,3 121,7 120,2 121,1 121,2Max 133,4 124,0 122,9 122,5 124,2 124,1 127,0 131,2 129,6
Random read64 128 256 512 1024 2048 4096 8192 16384
Average 11,8 18,8 21,7 34,4 34,7 31,5 31,1 34,1 41,5Min 9,8 15,7 18,5 29,0 28,8 24,6 26,6 26,7 37,3Q1 11,1 17,4 20,3 33,6 33,6 29,1 28,3 33,0 40,0Median 11,7 18,9 21,4 34,6 35,3 32,3 31,0 34,2 40,8Q3 12,7 19,6 23,6 35,5 36,3 34,5 32,7 35,5 41,9Max 13,7 23,2 24,7 38,9 38,8 37,1 39,0 40,4 47,2
Random write64 128 256 512 1024 2048 4096 8192 16384
Average 7,7 117,4 114,3 119,3 121,7 123,7 121,6 122,8 124,2Min 6,6 82,2 87,2 79,5 85,3 106,3 105,8 109,2 107,3Q1 7,4 111,2 104,0 112,2 120,0 120,3 115,8 118,3 120,1Median 7,7 118,7 119,0 126,0 125,1 123,4 122,4 122,9 125,8Q3 8,1 129,8 124,1 132,1 131,1 130,5 129,1 128,8 129,5Max 8,9 135,7 133,5 139,1 135,7 135,7 135,7 136,3 134,7
Strided read64 128 256 512 1024 2048 4096 8192 16384
Average 35,6 38,7 35,9 46,1 60,8 68,8 79,0 83,6 88,9Min 32,8 35,9 33,3 38,6 50,5 59,7 65,7 75,0 79,9Q1 35,2 37,5 35,2 44,7 59,0 65,7 76,4 80,3 84,7Median 35,4 38,8 36,2 46,2 60,8 69,0 81,3 83,7 88,3Q3 36,3 40,1 36,7 47,9 64,1 72,6 82,6 85,7 91,7Max 37,2 41,2 37,4 52,5 67,9 74,9 89,5 94,9 100,5

Btrfs
Table 3: IOzone Btrfs results for single disk.
Write64 128 256 512 1024 2048 4096 8192 16384
Average 144,5 143,5 143,4 143,7 143,0 144,0 144,4 144,6 144,2Min 143,6 142,0 142,0 142,3 141,4 142,9 143,0 142,8 143,4Q1 144,2 143,1 143,0 143,5 142,7 143,7 144,0 144,4 143,8Median 144,5 143,5 143,5 143,7 143,1 144,1 144,4 144,7 144,1Q3 144,8 143,8 143,8 143,9 143,4 144,3 145,0 144,9 144,7Max 145,3 144,4 144,6 144,6 144,0 144,8 145,2 145,7 145,3
Re-write64 128 256 512 1024 2048 4096 8192 16384
Average 144,7 143,1 143,2 143,1 143,2 144,3 144,4 144,5 144,2Min 143,3 141,4 142,1 142,0 142,1 141,1 143,0 143,2 143,2Q1 144,6 142,9 143,1 142,6 143,0 143,9 144,1 144,0 143,9Median 144,8 143,2 143,2 143,3 143,2 144,6 144,5 144,7 144,3Q3 145,1 143,4 143,3 143,5 143,4 144,9 144,7 144,9 144,5Max 145,2 143,9 143,9 144,0 144,0 145,2 145,3 145,6 145,1
Read64 128 256 512 1024 2048 4096 8192 16384
Average 134,2 133,9 133,6 133,4 133,9 134,0 134,4 134,4 134,6Min 132,9 133,0 132,6 130,1 132,0 130,0 133,7 131,6 133,5Q1 134,0 133,8 133,4 133,4 133,7 133,7 134,1 134,3 134,0Median 134,2 134,0 133,6 133,6 133,9 134,2 134,3 134,5 134,6Q3 134,4 134,2 133,8 133,9 134,5 134,5 134,7 134,8 135,0Max 134,8 134,5 134,2 134,2 134,7 135,2 135,1 135,2 135,8
Random read64 128 256 512 1024 2048 4096 8192 16384
Average 13,1 23,6 37,7 57,5 57,4 98,2 95,7 117,9 129,5Min 12,9 23,0 36,7 55,7 56,5 93,4 94,2 115,4 121,5Q1 13,0 23,3 37,5 56,8 57,1 96,4 95,1 117,6 129,1Median 13,1 23,6 37,8 57,1 57,5 98,4 95,8 118,2 130,0Q3 13,2 23,9 38,1 58,3 57,7 99,8 96,3 118,5 130,5Max 13,8 24,1 38,6 59,1 58,0 101,2 97,5 118,9 133,1
Random write64 128 256 512 1024 2048 4096 8192 16384
Average 125,8 126,8 134,1 139,5 140,3 142,3 142,9 143,2 142,9Min 118,6 122,2 131,3 135,6 138,0 137,5 141,7 141,6 141,5Q1 125,6 125,2 133,7 139,3 140,0 142,0 142,7 143,0 142,3Median 126,4 126,7 134,3 139,8 140,5 142,5 143,0 143,2 143,0Q3 126,7 129,1 134,9 140,1 140,8 143,1 143,3 143,5 143,4Max 127,3 130,7 135,9 140,4 141,3 143,9 143,8 144,1 144,1
Strided read64 128 256 512 1024 2048 4096 8192 16384
Average 8,7 17,3 29,1 46,6 77,7 108,0 111,3 128,8 138,7Min 8,6 16,9 28,5 45,8 75,8 104,5 109,4 126,5 135,1Q1 8,6 17,2 29,0 46,2 77,0 107,4 110,4 128,3 137,0Median 8,7 17,2 29,1 46,7 78,0 107,9 111,6 129,0 138,9Q3 8,8 17,4 29,3 47,0 78,4 108,9 112,0 129,4 140,6Max 9,0 17,6 29,7 48,2 79,7 110,6 113,2 130,7 141,8

ext4
Table 4: IOzone ext4 results for single disk.
Write64 128 256 512 1024 2048 4096 8192 16384
Average 118,8 117,5 118,7 118,7 117,9 118,2 119,7 117,6 117,6Min 92,0 84,9 93,5 92,3 90,1 95,3 96,3 94,4 93,3Q1 110,0 109,9 109,5 110,8 109,7 108,6 109,8 108,3 107,7Median 121,0 121,3 121,4 121,3 117,6 121,5 121,6 118,0 120,1Q3 128,4 126,8 125,8 127,7 127,9 128,2 130,2 128,2 128,7Max 141,0 141,1 144,3 141,0 141,4 139,7 142,5 139,5 140,5
Re-write64 128 256 512 1024 2048 4096 8192 16384
Average 121,9 121,1 122,9 122,1 121,6 121,0 122,5 121,5 120,5Min 93,5 89,8 95,8 94,0 91,9 98,2 97,5 96,1 95,0Q1 112,8 112,1 112,4 112,7 111,6 109,9 112,5 112,8 110,9Median 124,5 124,1 124,4 124,6 124,2 124,1 124,3 124,3 120,0Q3 133,3 132,7 133,6 133,6 133,6 132,3 133,5 133,6 132,8Max 143,8 144,0 146,5 144,5 143,1 143,5 146,2 142,7 143,9
Read64 128 256 512 1024 2048 4096 8192 16384
Average 113,2 112,5 114,3 113,4 113,0 112,7 113,9 113,2 112,6Min 86,6 84,9 89,2 87,7 85,7 92,2 90,4 89,5 88,5Q1 104,3 103,7 104,5 104,4 103,2 102,2 104,8 104,4 103,3Median 115,7 115,3 115,9 114,8 115,6 115,5 115,7 115,6 112,6Q3 123,4 122,9 123,7 123,4 123,5 122,8 123,4 123,7 123,5Max 134,8 134,8 137,3 135,4 134,9 134,6 137,4 135,3 135,3
Random read64 128 256 512 1024 2048 4096 8192 16384
Average 13,8 24,5 25,5 52,0 73,6 93,3 108,8 114,7 118,2Min 13,2 21,7 23,7 45,7 61,0 74,0 88,8 92,6 93,5Q1 13,6 24,1 24,9 49,9 69,7 86,6 101,0 106,8 108,7Median 13,9 24,7 25,6 52,8 75,0 95,5 110,7 117,9 118,5Q3 14,0 25,1 26,1 54,3 78,0 100,5 117,0 125,0 129,3Max 14,2 25,6 26,8 56,5 82,6 107,4 127,9 135,0 141,6
Random write64 128 256 512 1024 2048 4096 8192 16384
Average 46,7 63,1 79,7 92,8 99,7 106,4 112,4 114,0 115,1Min 40,0 52,8 66,5 75,6 78,8 87,9 87,5 91,4 91,7Q1 45,0 60,2 74,8 89,2 92,6 97,1 103,9 106,1 105,9Median 47,4 64,2 80,8 93,6 100,7 109,6 114,9 113,4 115,2Q3 49,2 66,9 84,4 98,2 107,8 115,8 121,7 124,9 125,8Max 51,2 70,7 91,6 105,2 116,5 125,2 132,0 134,0 137,4
Strided read64 128 256 512 1024 2048 4096 8192 16384
Average 25,0 29,9 36,3 61,8 84,0 104,3 116,4 123,5 127,4Min 19,5 21,3 32,1 53,5 70,4 88,4 95,6 100,1 101,0Q1 23,3 25,1 33,1 59,0 79,5 96,7 108,5 114,3 117,7Median 25,0 29,0 35,7 62,6 86,2 105,5 118,2 127,1 128,2Q3 27,4 34,1 39,7 64,8 88,4 112,2 124,8 133,9 139,5Max 28,1 47,8 40,8 67,8 94,7 120,4 135,7 145,2 152,3

XFS
Table 5: IOzone XFS results for single disk.
Write64 128 256 512 1024 2048 4096 8192 16384
Average 142,5 141,6 142,2 142,2 142,3 142,2 142,3 142,3 142,3Min 141,4 140,1 141,2 140,3 140,6 141,4 141,0 141,4 140,9Q1 142,4 141,3 142,1 141,8 142,3 141,6 141,9 142,1 142,3Median 142,6 141,9 142,3 142,4 142,4 142,4 142,7 142,4 142,5Q3 142,7 142,0 142,4 142,6 142,6 142,6 142,7 142,6 142,6Max 143,0 142,1 142,8 143,1 142,8 143,0 142,9 142,8 142,9
Re-write64 128 256 512 1024 2048 4096 8192 16384
Average 142,5 142,0 142,1 142,4 142,1 142,2 142,2 142,4 142,3Min 140,8 140,9 140,5 141,5 141,0 137,6 141,0 141,5 141,6Q1 142,3 141,2 142,1 142,3 141,8 142,4 142,2 142,3 142,2Median 142,5 142,4 142,2 142,5 142,3 142,5 142,3 142,4 142,3Q3 142,8 142,5 142,4 142,6 142,4 142,6 142,5 142,5 142,5Max 143,2 142,7 142,7 142,7 142,7 142,9 142,9 142,8 142,7
Read64 128 256 512 1024 2048 4096 8192 16384
Average 137,7 137,5 137,7 137,8 137,8 137,9 137,8 138,1 138,2Min 137,5 136,8 137,5 137,6 137,6 137,6 137,7 138,0 138,0Q1 137,6 137,6 137,6 137,7 137,7 137,8 137,8 138,0 138,2Median 137,7 137,7 137,7 137,8 137,8 137,8 137,8 138,1 138,3Q3 137,8 137,7 137,7 137,8 137,8 137,9 137,9 138,1 138,3Max 137,8 137,9 137,8 137,9 137,9 138,2 137,9 138,5 138,4
Random read64 128 256 512 1024 2048 4096 8192 16384
Average 14,3 25,9 26,8 57,0 83,7 109,0 127,7 137,5 142,8Min 14,2 25,8 26,8 56,7 83,4 108,5 127,0 136,8 141,9Q1 14,3 25,9 26,8 56,9 83,5 108,9 127,4 137,2 142,7Median 14,3 25,9 26,9 56,9 83,7 109,0 127,6 137,4 142,7Q3 14,3 25,9 26,9 57,0 83,7 109,1 127,8 137,8 143,0Max 14,3 26,0 26,9 57,2 84,0 110,2 128,5 138,4 143,7
Random write64 128 256 512 1024 2048 4096 8192 16384
Average 51,2 70,6 90,1 103,5 117,2 125,2 133,4 136,1 137,5Min 50,6 70,2 89,7 102,9 115,5 124,4 132,7 134,8 136,3Q1 51,1 70,5 90,0 103,2 117,0 124,8 133,2 135,7 137,3Median 51,2 70,5 90,2 103,4 117,3 125,3 133,4 136,2 137,6Q3 51,4 70,8 90,2 103,6 117,6 125,4 133,7 136,4 137,8Max 51,5 71,0 90,6 104,5 117,9 125,8 134,4 136,8 138,0
Strided read64 128 256 512 1024 2048 4096 8192 16384
Average 20,4 39,9 32,3 67,4 94,0 122,0 137,1 146,8 154,6Min 19,9 39,7 30,7 66,9 93,5 121,4 135,8 145,8 153,4Q1 20,3 39,9 31,4 67,2 93,9 121,7 136,3 146,3 154,1Median 20,4 40,0 32,7 67,3 94,1 122,0 136,6 146,6 154,9Q3 20,5 40,0 33,0 67,5 94,2 122,2 138,3 146,8 155,0Max 20,8 40,1 33,7 68,2 94,8 122,7 138,7 149,5 155,8

Figure 33: IOzone write result for single disk.
Figure 34: IOzone re-write result for single disk.
64 128 256 512 1024 2048 4096 8192 163840
20
40
60
80
100
120
140
160
Re-write
ZFS
Btrfs
ext4
XFS
Record size (KB)
Th
rou
gh
pu
t (M
B/s
)
64 128 256 512 1024 2048 4096 8192 163840
20
40
60
80
100
120
140
160
Write
ZFS
Btrfs
ext4
XFS
Record size (KB)
Th
rou
gh
pu
t (M
B/s
)

Figure 35: IOzone read result for single disk.
Figure 36: IOzone random read result for single disk.
64 128 256 512 1024 2048 4096 8192 163840
20
40
60
80
100
120
140
160
Read
ZFS
Btrfs
ext4
XFS
Record size (KB)
Th
rou
gh
pu
t (M
B/s
)
64 128 256 512 1024 2048 4096 8192 163840
20
40
60
80
100
120
140
160
Random read
ZFS
Btrfs
ext4
XFS
Record size (KB)
Th
rou
gh
pu
t (M
B/s
)

Figure 37: IOzone random write result for single disk.
Figure 38: IOzone strided read result for single disk.
64 128 256 512 1024 2048 4096 8192 163840
20
40
60
80
100
120
140
160
Random write
ZFS
Btrfs
ext4
XFS
Record size (KB)
Th
rou
gh
pu
t (M
B/s
)
64 128 256 512 1024 2048 4096 8192 163840
20
40
60
80
100
120
140
160
180
Strided read
ZFS
Btrfs
ext4
XFS
Record size (KB)
Th
rou
gh
pu
t (M
B/s
)

Appendix J
IOzone RAID 10 results.
ZFS
Table 6: IOzone ZFS results for RAID 10 setup.
Write64 128 256 512 1024 2048 4096 8192 16384
Average 158,8 156,4 160,0 157,9 158,7 161,7 156,0 160,5 157,7Min 143,9 137,6 139,3 140,6 136,8 139,5 129,1 142,7 133,8Q1 155,2 145,7 154,9 153,7 152,2 156,5 144,4 152,7 148,6Median 159,4 151,9 160,0 156,9 158,7 162,0 156,8 160,4 159,9Q3 162,6 167,5 167,8 163,7 165,9 167,7 167,2 167,2 166,9Max 173,2 180,8 182,1 171,6 173,6 178,1 178,2 175,7 174,0
Re-write64 128 256 512 1024 2048 4096 8192 16384
Average 51,2 169,2 161,0 165,0 167,0 168,9 170,2 168,1 168,5Min 47,9 145,7 119,3 144,7 143,1 152,7 159,1 151,7 147,5Q1 49,9 165,6 151,1 157,5 159,3 158,1 164,9 162,1 164,3Median 50,8 170,1 160,3 163,3 166,7 171,3 170,7 169,4 171,5Q3 53,0 175,6 173,4 172,2 174,6 177,3 174,4 175,1 174,6Max 54,5 188,0 191,0 191,0 188,1 186,7 180,2 180,9 184,1
Read64 128 256 512 1024 2048 4096 8192 16384
Average 302,6 297,2 286,7 299,5 306,8 312,3 312,5 304,8 303,6Min 257,1 254,6 251,8 257,1 271,9 254,8 268,1 251,2 254,5Q1 293,0 283,1 256,4 280,2 292,1 283,9 297,2 279,9 291,0Median 299,1 299,3 287,7 306,1 297,9 324,9 315,9 309,6 304,7Q3 313,5 310,8 310,9 321,7 330,0 340,5 324,3 328,0 323,8Max 345,5 339,7 343,9 330,2 349,0 350,1 351,3 345,4 336,0
Random read64 128 256 512 1024 2048 4096 8192 16384
Average 12,4 22,8 38,3 52,7 70,3 80,2 89,6 96,0 107,3Min 10,8 20,1 33,3 48,0 64,2 70,1 81,1 85,4 94,3Q1 11,8 22,1 37,3 50,1 66,9 77,0 87,1 93,2 103,1Median 12,2 23,0 38,7 54,0 70,3 81,1 89,2 96,4 107,2Q3 12,8 24,1 39,7 55,1 72,3 84,1 91,7 100,1 111,9Max 14,1 24,5 40,3 57,6 77,3 87,6 96,0 109,2 117,7
Random write64 128 256 512 1024 2048 4096 8192 16384
Average 9,5 153,4 157,0 150,2 156,2 168,9 167,2 172,0 169,1Min 8,6 114,5 108,0 97,3 133,8 148,5 144,3 149,9 151,7Q1 9,2 141,1 148,5 137,0 148,1 164,6 162,3 167,3 162,6Median 9,5 155,1 164,8 157,7 155,2 170,3 168,4 175,7 171,9Q3 9,8 169,1 167,9 168,0 167,1 174,8 174,3 177,8 176,2Max 10,2 181,5 179,6 186,0 188,8 185,8 183,6 184,3 179,3
Strided read64 128 256 512 1024 2048 4096 8192 16384
Average 97,7 110,7 85,8 90,8 106,8 83,3 103,2 135,9 180,7Min 70,0 95,6 62,8 76,5 87,6 72,6 89,2 113,0 149,9Q1 97,7 107,7 79,1 84,0 99,6 77,5 93,5 128,7 170,2Median 100,0 110,5 83,5 90,2 106,5 80,5 98,3 135,9 186,8Q3 101,7 114,2 90,3 95,5 116,8 87,1 100,3 142,3 191,0Max 104,7 128,5 116,1 124,2 128,8 110,7 206,8 159,1 208,4

Btrfs
Table 7: IOzone Btrfs results for RAID 10 setup.
Write64 128 256 512 1024 2048 4096 8192 16384
Average 260,5 260,0 262,7 263,7 263,2 263,5 263,9 263,5 263,6Min 258,0 258,6 259,1 259,8 260,5 260,4 260,7 261,3 260,5Q1 259,1 259,3 261,1 262,6 262,2 262,1 263,2 262,1 262,6Median 260,4 260,2 262,6 264,2 263,0 264,0 263,8 263,6 263,9Q3 261,4 260,4 264,3 264,7 263,9 264,5 264,9 264,5 264,5Max 263,6 261,6 265,9 266,4 266,6 266,6 266,8 266,5 266,8
Re-write64 128 256 512 1024 2048 4096 8192 16384
Average 254,0 251,0 255,0 257,0 256,0 256,0 256,5 255,2 255,3Min 249,7 246,0 252,8 254,4 251,3 249,4 251,8 250,9 251,2Q1 252,2 250,1 254,0 255,5 253,7 253,2 253,4 252,9 253,0Median 253,0 250,8 254,9 256,3 255,9 254,5 256,1 254,3 254,8Q3 256,3 252,2 255,5 257,8 256,9 258,3 258,0 255,3 256,0Max 263,6 253,1 257,6 263,6 264,9 265,4 266,2 264,8 264,9
Read64 128 256 512 1024 2048 4096 8192 16384
Average 262,3 263,1 264,4 263,2 262,2 264,0 264,6 263,5 264,3Min 227,1 224,8 226,8 231,3 226,5 231,1 233,1 234,3 232,0Q1 268,9 268,9 270,5 269,8 269,3 270,3 269,7 258,1 270,4Median 271,0 270,2 271,8 270,4 270,6 271,6 271,6 271,9 271,7Q3 271,6 272,3 273,1 270,9 272,5 272,0 272,2 272,3 272,5Max 273,2 274,5 274,9 272,2 273,3 273,8 273,6 273,6 273,2
Random read64 128 256 512 1024 2048 4096 8192 16384
Average 14,8 24,0 43,0 70,9 106,9 113,5 169,2 216,3 243,0Min 13,6 23,4 41,9 69,3 102,1 108,3 165,8 213,3 230,4Q1 14,6 23,7 42,4 70,2 105,7 110,0 167,8 215,7 238,1Median 14,7 24,1 42,9 70,6 106,3 110,7 169,4 216,5 243,2Q3 14,8 24,3 43,5 71,3 106,8 111,3 170,6 217,3 249,9Max 15,7 24,6 45,0 73,1 111,5 126,0 171,9 219,2 251,6
Random write64 128 256 512 1024 2048 4096 8192 16384
Average 198,2 209,0 216,3 225,2 242,4 253,4 261,2 262,7 264,8Min 184,8 192,4 207,0 221,6 239,6 249,4 257,2 259,8 258,9Q1 186,3 207,5 216,9 224,2 241,5 251,3 260,3 261,4 263,6Median 203,9 209,6 217,8 225,2 242,1 253,4 261,2 262,7 264,8Q3 207,4 211,7 218,4 226,0 243,5 254,6 262,2 263,7 266,5Max 210,7 216,0 220,2 229,1 246,4 258,6 263,6 266,6 270,5
Strided read64 128 256 512 1024 2048 4096 8192 16384
Average 11,8 18,4 32,7 60,5 104,8 125,0 163,4 221,1 247,8Min 10,3 17,4 31,6 58,6 89,1 120,4 158,2 210,0 228,6Q1 11,2 17,7 31,9 60,1 89,9 121,2 160,0 218,6 246,1Median 11,4 17,9 32,2 60,6 92,9 122,2 160,5 222,4 249,5Q3 11,7 18,1 32,8 60,9 120,4 123,6 163,2 225,3 252,8Max 14,1 21,2 35,2 62,6 123,1 136,9 178,1 226,7 257,5
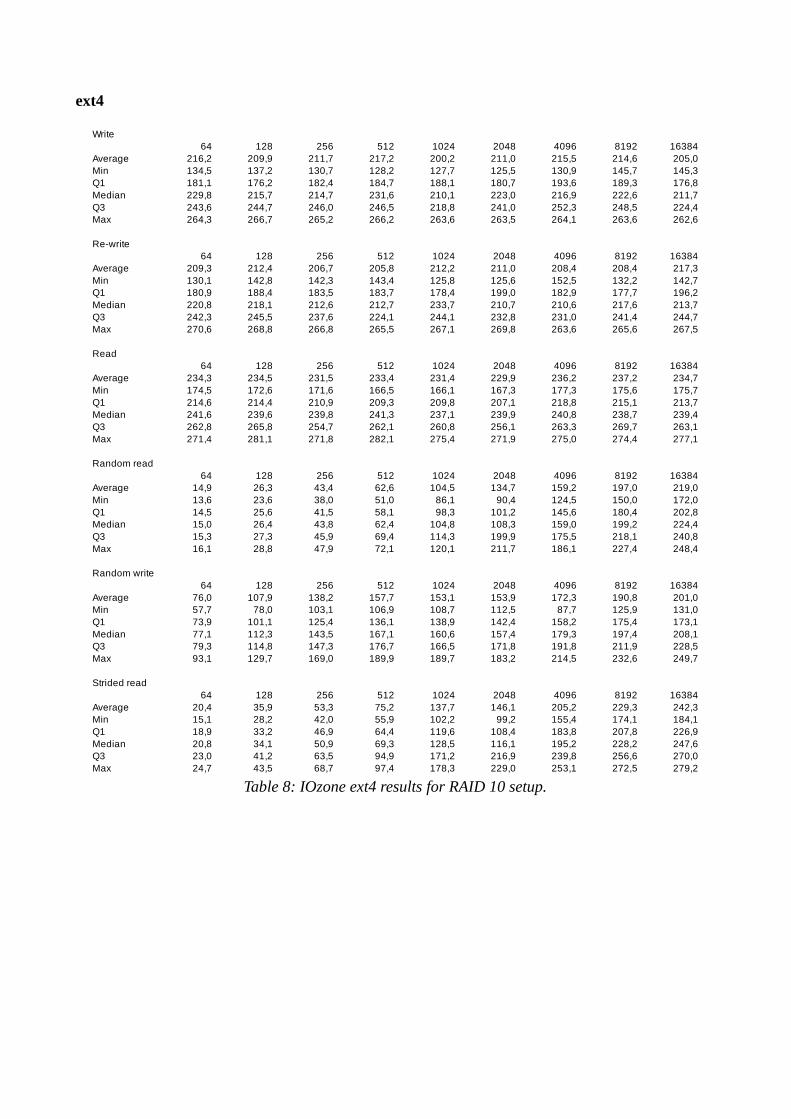
ext4
Table 8: IOzone ext4 results for RAID 10 setup.
Write64 128 256 512 1024 2048 4096 8192 16384
Average 216,2 209,9 211,7 217,2 200,2 211,0 215,5 214,6 205,0Min 134,5 137,2 130,7 128,2 127,7 125,5 130,9 145,7 145,3Q1 181,1 176,2 182,4 184,7 188,1 180,7 193,6 189,3 176,8Median 229,8 215,7 214,7 231,6 210,1 223,0 216,9 222,6 211,7Q3 243,6 244,7 246,0 246,5 218,8 241,0 252,3 248,5 224,4Max 264,3 266,7 265,2 266,2 263,6 263,5 264,1 263,6 262,6
Re-write64 128 256 512 1024 2048 4096 8192 16384
Average 209,3 212,4 206,7 205,8 212,2 211,0 208,4 208,4 217,3Min 130,1 142,8 142,3 143,4 125,8 125,6 152,5 132,2 142,7Q1 180,9 188,4 183,5 183,7 178,4 199,0 182,9 177,7 196,2Median 220,8 218,1 212,6 212,7 233,7 210,7 210,6 217,6 213,7Q3 242,3 245,5 237,6 224,1 244,1 232,8 231,0 241,4 244,7Max 270,6 268,8 266,8 265,5 267,1 269,8 263,6 265,6 267,5
Read64 128 256 512 1024 2048 4096 8192 16384
Average 234,3 234,5 231,5 233,4 231,4 229,9 236,2 237,2 234,7Min 174,5 172,6 171,6 166,5 166,1 167,3 177,3 175,6 175,7Q1 214,6 214,4 210,9 209,3 209,8 207,1 218,8 215,1 213,7Median 241,6 239,6 239,8 241,3 237,1 239,9 240,8 238,7 239,4Q3 262,8 265,8 254,7 262,1 260,8 256,1 263,3 269,7 263,1Max 271,4 281,1 271,8 282,1 275,4 271,9 275,0 274,4 277,1
Random read64 128 256 512 1024 2048 4096 8192 16384
Average 14,9 26,3 43,4 62,6 104,5 134,7 159,2 197,0 219,0Min 13,6 23,6 38,0 51,0 86,1 90,4 124,5 150,0 172,0Q1 14,5 25,6 41,5 58,1 98,3 101,2 145,6 180,4 202,8Median 15,0 26,4 43,8 62,4 104,8 108,3 159,0 199,2 224,4Q3 15,3 27,3 45,9 69,4 114,3 199,9 175,5 218,1 240,8Max 16,1 28,8 47,9 72,1 120,1 211,7 186,1 227,4 248,4
Random write64 128 256 512 1024 2048 4096 8192 16384
Average 76,0 107,9 138,2 157,7 153,1 153,9 172,3 190,8 201,0Min 57,7 78,0 103,1 106,9 108,7 112,5 87,7 125,9 131,0Q1 73,9 101,1 125,4 136,1 138,9 142,4 158,2 175,4 173,1Median 77,1 112,3 143,5 167,1 160,6 157,4 179,3 197,4 208,1Q3 79,3 114,8 147,3 176,7 166,5 171,8 191,8 211,9 228,5Max 93,1 129,7 169,0 189,9 189,7 183,2 214,5 232,6 249,7
Strided read64 128 256 512 1024 2048 4096 8192 16384
Average 20,4 35,9 53,3 75,2 137,7 146,1 205,2 229,3 242,3Min 15,1 28,2 42,0 55,9 102,2 99,2 155,4 174,1 184,1Q1 18,9 33,2 46,9 64,4 119,6 108,4 183,8 207,8 226,9Median 20,8 34,1 50,9 69,3 128,5 116,1 195,2 228,2 247,6Q3 23,0 41,2 63,5 94,9 171,2 216,9 239,8 256,6 270,0Max 24,7 43,5 68,7 97,4 178,3 229,0 253,1 272,5 279,2

XFS
Table 9: IOzone XFS results for RAID 10 setup.
Write64 128 256 512 1024 2048 4096 8192 16384
Average 261,6 260,8 261,0 261,0 261,1 261,2 261,1 261,4 261,8Min 260,9 260,0 259,9 260,3 260,6 260,6 260,7 260,4 261,1Q1 261,4 260,6 260,8 260,9 260,9 260,9 260,8 261,2 261,5Median 261,7 260,8 261,0 261,0 261,1 261,2 261,1 261,5 261,7Q3 261,8 261,0 261,2 261,3 261,2 261,5 261,3 261,7 262,1Max 262,1 261,3 261,7 261,5 261,5 261,9 261,6 262,2 262,4
Re-write64 128 256 512 1024 2048 4096 8192 16384
Average 262,1 261,1 261,3 261,5 261,5 261,5 261,4 261,8 261,9Min 261,4 260,5 260,5 260,9 260,5 260,7 260,4 260,7 261,1Q1 262,0 260,8 261,2 261,3 261,5 261,3 261,2 261,7 261,6Median 262,1 261,2 261,3 261,5 261,6 261,5 261,5 261,8 262,0Q3 262,3 261,4 261,5 261,7 261,7 261,8 261,8 261,9 262,2Max 262,7 261,8 262,1 262,1 262,1 262,2 262,0 262,8 262,5
Read64 128 256 512 1024 2048 4096 8192 16384
Average 268,1 268,2 293,7 269,9 269,8 268,7 267,8 268,2 268,7Min 260,9 265,0 273,5 264,9 265,0 256,3 263,3 264,3 262,7Q1 266,1 266,3 282,0 267,0 267,4 266,7 265,7 266,6 266,7Median 267,6 267,3 296,0 270,0 268,5 268,7 267,0 268,1 268,0Q3 269,5 268,8 303,4 272,1 271,1 271,5 269,5 269,8 269,3Max 274,1 275,9 312,7 277,6 281,8 272,7 276,7 274,3 280,7
Random read64 128 256 512 1024 2048 4096 8192 16384
Average 15,8 28,0 47,6 75,0 121,7 152,5 185,4 229,1 253,7Min 15,7 28,0 47,5 74,5 120,5 151,2 184,6 227,1 248,8Q1 15,8 28,0 47,6 74,9 121,5 152,2 185,2 228,2 252,7Median 15,8 28,0 47,7 75,0 121,7 152,6 185,3 229,4 253,8Q3 15,8 28,1 47,7 75,1 121,8 152,8 185,7 230,2 254,6Max 15,8 28,2 47,8 75,2 122,4 153,2 187,1 230,8 259,6
Random write64 128 256 512 1024 2048 4096 8192 16384
Average 85,8 121,4 148,7 163,2 194,0 181,8 214,4 236,0 245,1Min 84,9 120,4 147,8 161,8 190,8 177,4 212,2 234,0 236,0Q1 85,6 121,0 148,1 162,6 193,1 180,4 213,6 235,1 245,2Median 85,7 121,4 148,6 163,1 194,6 181,5 214,7 236,4 245,5Q3 86,0 121,8 149,3 164,1 194,9 183,2 215,1 236,8 246,2Max 86,5 122,2 149,6 164,5 195,7 185,8 216,2 237,4 247,5
Strided read64 128 256 512 1024 2048 4096 8192 16384
Average 24,6 43,8 66,3 97,0 161,9 155,8 233,5 268,3 288,3Min 24,4 43,6 65,9 96,0 160,1 148,2 224,0 265,7 282,5Q1 24,6 43,7 66,2 96,7 161,1 153,5 231,7 266,9 287,0Median 24,6 43,8 66,3 97,1 162,2 155,2 234,0 267,9 289,1Q3 24,7 43,9 66,5 97,2 162,5 157,1 235,8 269,9 289,9Max 24,7 44,0 66,9 97,5 164,4 166,1 239,2 272,0 291,3

Figure 39: IOzone write result for RAID 10 setup.
Figure 40: IOzone re-write result for RAID 10 setup.
64 128 256 512 1024 2048 4096 8192 163840
50
100
150
200
250
300
Re-write
ZFS
Btrfs
ext4
XFS
Record size (KB)
Th
rou
gh
pu
t (M
B/s
)
64 128 256 512 1024 2048 4096 8192 163840
50
100
150
200
250
300
Write
ZFS
Btrfs
ext4
XFS
Record size (KB)
Th
rou
gh
pu
t (M
B/s
)

Figure 41: IOzone read result for RAID 10 setup.
Figure 42: IOzone random read result for RAID 10 setup.
64 128 256 512 1024 2048 4096 8192 163840
50
100
150
200
250
300
350
Read
ZFS
Btrfs
ext4
XFS
Record size (KB)
Th
rou
gh
pu
t (M
B/s
)
64 128 256 512 1024 2048 4096 8192 163840
50
100
150
200
250
300
Random read
ZFS
Btrfs
ext4
XFS
Record size (KB)
Th
rou
gh
pu
t (M
B/s
)

Figure 43: IOzone random write result for RAID 10 setup.
Figure 44: IOzone strided read result for RAID 10 setup.
64 128 256 512 1024 2048 4096 8192 163840
50
100
150
200
250
300
Random write
ZFS
Btrfs
ext4
XFS
Record size (KB)
Th
rou
gh
pu
t (M
B/s
)
64 128 256 512 1024 2048 4096 8192 163840
50
100
150
200
250
300
350
Strided read
ZFS
Btrfs
ext4
XFS
Record size (KB)
Th
rou
gh
pu
t (M
B/s
)

Appendix K
IOzone RAID 5 results.
ZFS
Table 10: IOzone ZFS results for RAID 5 setup.
Write64 128 256 512 1024 2048 4096 8192 16384
Average 213,7 202,8 212,1 215,2 216,4 212,6 216,9 215,7 218,2Min 201,5 151,7 193,3 201,7 205,2 202,7 207,6 205,9 203,0Q1 208,0 198,6 202,4 207,1 208,5 204,9 212,6 210,2 211,3Median 212,0 205,7 207,1 214,4 217,7 211,2 215,1 213,8 218,8Q3 216,8 213,2 222,0 222,6 220,2 220,1 223,0 218,9 224,6Max 232,7 218,1 233,0 232,6 239,7 229,3 224,8 232,1 234,9
Re-write64 128 256 512 1024 2048 4096 8192 16384
Average 30,8 223,0 237,8 238,8 238,4 237,4 238,3 238,4 238,9Min 30,2 148,6 231,3 233,9 230,9 221,7 230,7 231,5 231,2Q1 30,6 231,5 234,2 234,9 235,5 233,3 236,5 234,2 235,8Median 30,8 236,7 237,3 237,7 238,6 236,8 237,8 237,0 240,1Q3 31,0 239,7 240,5 242,0 239,6 240,6 240,3 240,5 242,7Max 31,4 247,0 245,4 248,9 252,4 248,8 247,9 251,4 245,7
Read64 128 256 512 1024 2048 4096 8192 16384
Average 359,8 358,2 361,2 361,2 365,6 364,7 368,5 366,1 366,2Min 350,6 295,2 320,4 321,9 319,9 316,5 313,5 319,6 329,7Q1 353,4 349,8 351,2 350,3 357,2 356,0 366,2 357,5 357,4Median 358,8 357,4 368,4 367,5 371,0 363,8 378,7 377,3 374,0Q3 365,8 374,3 377,5 376,0 379,2 379,7 381,2 379,9 378,5Max 373,0 379,3 380,1 381,6 382,6 384,7 382,4 382,5 381,4
Random read64 128 256 512 1024 2048 4096 8192 16384
Average 12,0 21,1 27,1 46,3 68,4 82,6 95,9 107,6 122,6Min 11,1 20,6 26,6 45,1 66,0 78,5 88,4 100,4 113,2Q1 12,0 20,8 26,8 45,9 67,5 81,1 92,2 104,8 121,5Median 12,1 20,9 27,0 46,4 67,9 82,7 95,8 107,0 123,2Q3 12,2 21,0 27,2 46,8 69,2 84,3 99,9 111,0 125,1Max 12,3 24,0 28,9 47,4 72,2 86,6 102,9 117,3 128,6
Random write64 128 256 512 1024 2048 4096 8192 16384
Average 8,2 148,0 160,6 172,4 183,1 193,2 202,3 222,5 225,9Min 8,0 109,4 149,9 165,0 179,6 157,9 141,4 212,4 137,1Q1 8,1 145,1 154,0 166,7 182,1 193,8 206,8 217,8 231,3Median 8,2 151,1 156,6 169,5 183,5 195,3 209,0 220,8 233,6Q3 8,2 153,5 160,4 170,4 184,7 196,8 212,5 224,9 234,6Max 8,2 159,5 233,1 230,4 186,0 201,8 215,5 239,6 244,1
Strided read64 128 256 512 1024 2048 4096 8192 16384
Average 62,3 67,5 64,5 74,3 97,6 88,9 107,5 146,8 193,8Min 58,0 62,9 59,7 68,1 81,2 76,0 93,1 134,9 178,0Q1 59,0 65,4 62,5 73,0 92,0 81,3 99,4 139,0 191,4Median 62,2 67,4 63,9 75,0 96,1 85,7 102,9 143,5 193,8Q3 63,8 69,3 65,7 75,9 103,6 95,5 113,8 152,3 198,6Max 70,4 75,1 73,8 77,4 115,0 119,7 146,3 179,1 208,3

Btrfs
Table 11: IOzone Btrfs results for RAID 5 setup.
Write64 128 256 512 1024 2048 4096 8192 16384
Average 414,2 397,6 397,9 402,8 405,3 405,8 403,3 407,2 410,3Min 404,4 385,3 387,7 393,3 394,8 397,0 395,9 399,2 403,0Q1 411,3 394,6 394,8 399,7 404,4 404,0 400,8 402,1 407,3Median 414,9 397,9 399,1 402,3 405,5 406,2 404,3 407,4 409,5Q3 417,5 402,0 402,1 405,9 407,6 408,5 405,1 411,1 413,0Max 422,4 410,9 404,6 410,7 413,6 411,7 410,2 419,4 420,0
Re-write64 128 256 512 1024 2048 4096 8192 16384
Average 408,8 402,7 401,5 403,6 405,3 402,6 402,6 402,3 404,2Min 396,4 392,1 394,3 393,6 396,5 393,9 396,9 393,6 395,5Q1 406,5 401,0 398,1 401,0 402,3 401,5 400,6 398,6 400,5Median 409,1 402,7 401,8 404,0 405,6 402,5 401,8 400,8 403,6Q3 411,5 405,1 404,8 407,8 409,2 405,0 404,0 405,4 407,7Max 415,7 410,7 409,4 411,5 412,2 407,3 411,4 411,2 416,1
Read64 128 256 512 1024 2048 4096 8192 16384
Average 357,4 352,1 351,9 362,8 363,0 359,6 350,3 359,1 360,2Min 343,4 339,9 342,2 352,9 355,9 349,1 341,0 344,7 348,9Q1 350,5 347,4 348,9 357,0 358,2 358,2 343,7 354,5 356,8Median 356,7 348,6 350,9 365,5 362,9 361,3 348,5 360,3 359,8Q3 365,0 357,6 354,0 367,9 365,7 361,9 355,4 362,7 363,2Max 371,8 363,8 363,5 370,6 373,1 365,6 366,3 370,9 373,6
Random read64 128 256 512 1024 2048 4096 8192 16384
Average 15,1 23,8 42,6 74,7 119,3 180,2 222,6 286,0 332,0Min 14,8 23,4 41,7 73,4 117,0 178,9 219,6 281,8 325,8Q1 14,9 23,6 42,5 74,6 118,8 179,5 220,5 284,2 330,3Median 15,1 23,8 42,6 74,7 119,6 180,2 221,7 286,0 333,0Q3 15,1 23,9 42,7 74,9 119,8 180,7 223,1 287,4 334,1Max 15,5 24,3 43,3 75,2 120,3 182,9 230,2 292,2 336,9
Random write64 128 256 512 1024 2048 4096 8192 16384
Average 156,1 152,6 120,1 180,4 213,6 276,5 296,8 338,3 333,2Min 150,6 146,9 111,7 167,7 204,5 263,1 284,5 321,8 309,2Q1 153,8 151,2 118,2 177,3 210,0 269,1 291,4 330,5 326,2Median 155,1 152,3 119,7 181,3 213,1 273,6 295,3 335,8 330,2Q3 156,4 153,3 122,4 183,8 216,8 280,2 297,2 343,0 336,7Max 173,9 158,4 126,4 187,0 222,4 302,7 319,2 364,5 360,4
Strided read64 128 256 512 1024 2048 4096 8192 16384
Average 16,8 24,4 38,6 62,6 81,9 189,2 230,4 298,8 349,4Min 16,5 23,6 37,8 61,4 80,1 185,9 222,5 291,6 340,8Q1 16,6 24,2 38,2 62,5 81,4 188,4 228,7 295,6 346,8Median 16,8 24,3 38,5 62,8 82,1 189,3 230,2 299,9 349,0Q3 16,9 24,5 39,1 63,0 82,6 190,2 233,2 301,6 351,0Max 17,2 24,8 39,5 63,7 83,2 191,3 235,0 305,0 358,9

ext4
Table 12: IOzone ext4 results for RAID 5 setup.
Write64 128 256 512 1024 2048 4096 8192 16384
Average 135,6 140,4 140,2 139,5 139,0 138,9 137,7 139,3 138,0Min 96,1 116,5 114,7 112,4 110,0 112,9 109,0 112,7 79,0Q1 119,0 123,0 120,5 119,7 119,6 118,7 117,4 119,7 119,6Median 122,1 128,7 123,7 123,7 122,8 122,2 120,8 121,0 123,6Q3 158,9 159,3 161,9 161,1 161,5 161,1 160,2 160,4 162,8Max 165,8 163,5 170,6 169,8 166,4 168,9 167,5 169,1 166,7
Re-write64 128 256 512 1024 2048 4096 8192 16384
Average 137,8 144,2 142,5 142,5 141,8 140,0 139,0 141,2 141,1Min 113,5 111,9 115,5 113,7 113,6 112,1 112,6 111,4 95,9Q1 119,3 123,2 120,2 120,1 119,5 117,7 118,1 119,2 119,6Median 122,5 133,6 124,0 123,6 122,8 122,5 123,1 121,1 123,9Q3 158,9 166,5 165,6 167,4 166,1 165,3 163,2 165,7 165,8Max 169,2 174,3 175,0 176,1 176,5 173,4 169,4 172,8 171,7
Read64 128 256 512 1024 2048 4096 8192 16384
Average 299,2 299,8 291,4 289,3 293,1 292,2 292,1 288,4 297,7Min 224,1 233,2 223,3 218,0 221,6 220,1 220,1 157,5 226,4Q1 250,7 250,3 248,0 243,5 243,1 242,3 243,3 243,8 253,2Median 285,5 281,7 280,7 269,6 277,7 279,5 277,2 277,5 325,2Q3 349,2 352,7 337,1 339,5 342,7 342,2 341,2 342,5 342,7Max 363,5 364,2 348,9 350,5 360,7 358,5 355,9 357,0 359,3
Random read64 128 256 512 1024 2048 4096 8192 16384
Average 15,6 27,6 45,5 66,8 111,2 191,8 199,7 235,3 263,6Min 14,6 25,3 40,5 56,8 94,5 164,3 175,6 156,4 217,4Q1 15,0 26,3 42,9 61,9 102,7 177,2 185,6 214,8 237,9Median 15,3 27,0 44,8 65,5 109,5 188,1 195,2 233,2 280,8Q3 16,1 29,0 48,3 71,7 119,7 207,4 213,3 261,3 290,0Max 16,4 29,6 49,3 74,2 123,3 212,8 218,6 272,6 304,1
Random write64 128 256 512 1024 2048 4096 8192 16384
Average 27,8 34,6 37,5 39,8 54,8 69,5 92,5 114,8 126,8Min 24,0 29,0 32,4 33,0 43,7 53,8 70,0 89,3 73,8Q1 25,3 30,0 33,3 34,5 46,2 56,2 76,4 97,5 108,4Median 26,1 31,3 34,4 35,5 47,2 58,3 78,5 103,2 116,5Q3 30,9 39,6 41,8 45,5 64,3 84,2 111,7 134,2 149,0Max 31,3 40,0 43,2 46,7 66,1 87,0 113,9 139,5 159,6
Strided read64 128 256 512 1024 2048 4096 8192 16384
Average 31,5 52,2 85,0 153,9 192,5 210,8 209,2 255,9 284,3Min 28,0 45,6 74,7 128,4 162,4 180,1 182,5 186,7 229,6Q1 29,7 48,7 78,8 142,6 178,7 194,5 195,5 232,4 249,5Median 31,0 51,5 84,4 149,7 189,9 204,6 202,9 250,4 302,0Q3 33,4 56,1 90,0 166,0 207,7 227,8 221,6 283,3 313,9Max 33,8 56,9 94,3 172,4 213,8 234,9 233,4 294,6 338,9

XFS
Table 13: IOzone XFS results for RAID 5 setup.
Write64 128 256 512 1024 2048 4096 8192 16384
Average 127,5 121,6 124,6 124,3 123,5 122,1 123,6 124,1 124,0Min 120,5 117,3 121,4 119,8 118,0 118,6 119,5 119,2 119,9Q1 123,4 119,9 122,5 122,6 122,1 120,3 121,3 122,3 122,8Median 127,2 121,5 124,1 123,9 123,4 122,4 123,0 123,4 123,6Q3 130,0 123,8 126,4 126,7 124,1 124,0 125,9 125,7 125,0Max 140,7 125,0 130,5 131,0 131,7 125,3 128,1 129,2 130,5
Re-write64 128 256 512 1024 2048 4096 8192 16384
Average 128,0 125,0 128,3 125,1 124,7 125,1 123,2 125,0 124,6Min 120,0 118,7 120,1 117,9 121,4 118,7 117,4 117,4 116,2Q1 125,2 124,1 125,9 123,4 123,1 122,6 120,5 123,8 122,4Median 127,7 124,7 128,7 125,9 124,1 124,6 121,8 125,3 125,5Q3 131,6 126,1 130,1 127,2 126,1 126,8 126,0 127,3 127,6Max 137,5 131,3 137,6 130,6 130,5 133,1 128,8 129,0 131,9
Read64 128 256 512 1024 2048 4096 8192 16384
Average 348,7 347,5 330,1 337,1 344,5 348,7 348,4 349,2 348,8Min 340,2 341,5 322,5 328,4 326,6 342,2 340,9 343,3 341,9Q1 346,3 345,8 327,2 335,2 342,6 346,8 345,4 347,1 346,8Median 349,5 347,6 329,7 338,2 344,8 348,8 348,6 350,3 349,3Q3 351,2 349,4 332,6 338,9 346,8 350,6 352,1 351,6 351,6Max 355,5 352,4 346,7 347,7 351,4 353,9 356,4 353,7 352,6
Random read64 128 256 512 1024 2048 4096 8192 16384
Average 15,5 27,6 46,6 79,1 123,6 190,7 215,7 262,1 294,4Min 15,4 27,1 46,4 78,6 122,5 188,6 212,6 258,1 280,0Q1 15,5 27,6 46,5 78,9 123,5 189,9 215,4 260,0 292,7Median 15,5 27,6 46,6 79,2 123,7 190,9 216,2 262,7 294,5Q3 15,5 27,7 46,7 79,3 124,0 191,3 216,8 263,1 296,2Max 15,6 27,8 46,8 79,7 124,2 192,4 217,2 266,8 305,2
Random write64 128 256 512 1024 2048 4096 8192 16384
Average 25,9 30,7 33,1 34,9 46,0 59,0 76,5 97,2 111,6Min 25,6 30,1 32,4 34,2 44,9 57,4 73,7 92,8 106,6Q1 25,7 30,3 32,8 34,6 45,6 58,2 75,6 95,6 109,9Median 25,8 30,7 33,1 34,7 45,9 58,9 76,4 97,2 111,6Q3 26,1 30,9 33,4 35,1 46,3 59,5 77,7 98,8 112,8Max 26,4 31,5 33,6 35,9 47,1 61,2 78,7 101,8 118,8
Strided read64 128 256 512 1024 2048 4096 8192 16384
Average 32,1 53,5 86,8 163,2 196,2 204,1 227,8 277,5 320,2Min 31,9 53,3 85,9 160,9 193,9 202,1 222,1 272,6 313,3Q1 32,0 53,4 86,6 162,7 195,4 203,6 227,2 276,5 317,6Median 32,1 53,5 86,9 163,2 196,5 204,1 227,9 277,8 320,9Q3 32,2 53,6 87,1 163,9 197,1 204,8 229,0 278,9 322,1Max 32,3 53,8 87,8 165,8 197,6 205,8 230,5 281,4 329,9

Figure 45: IOzone write result for RAID 5 setup.
Figure 46: IOzone re-write result for RAID 5 setup.
64 128 256 512 1024 2048 4096 8192 163840
50
100
150
200
250
300
350
400
450
Re-write
ZFS
Btrfs
ext4
XFS
Record size (KB)
Th
rou
gh
pu
t (M
B/s
)
64 128 256 512 1024 2048 4096 8192 163840
50
100
150
200
250
300
350
400
450
Write
ZFS
Btrfs
ext4
XFS
Record size (KB)
Th
rou
gh
pu
t (M
B/s
)

Figure 47: IOzone read result for RAID 5 setup.
Figure 48: IOzone random read result for RAID 5 setup.
64 128 256 512 1024 2048 4096 8192 163840
50
100
150
200
250
300
350
400
Read
ZFS
Btrfs
ext4
XFS
Record size (KB)
Th
rou
gh
pu
t (M
B/s
)
64 128 256 512 1024 2048 4096 8192 163840
50
100
150
200
250
300
350
Random read
ZFS
Btrfs
ext4
XFS
Record size (KB)
Th
rou
gh
pu
t (M
B/s
)
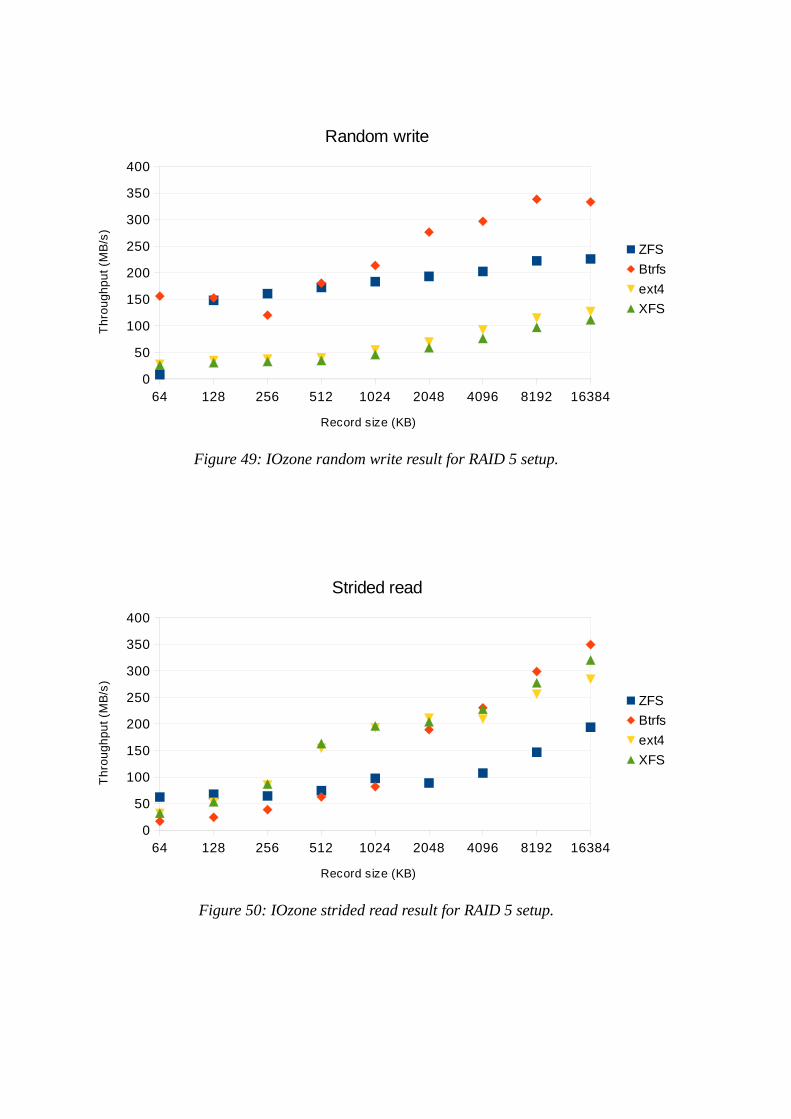
Figure 49: IOzone random write result for RAID 5 setup.
Figure 50: IOzone strided read result for RAID 5 setup.
64 128 256 512 1024 2048 4096 8192 163840
50
100
150
200
250
300
350
400
Random write
ZFS
Btrfs
ext4
XFS
Record size (KB)
Th
rou
gh
pu
t (M
B/s
)
64 128 256 512 1024 2048 4096 8192 163840
50
100
150
200
250
300
350
400
Strided read
ZFS
Btrfs
ext4
XFS
Record size (KB)
Th
rou
gh
pu
t (M
B/s
)


![ABLEFS: Enhancing Metadata Efficiency in the Local File …kair/papers/tablefs.pdfof XFS, NetApp’s WAFL and Sun’s ZFS[3, 18], Btrfs copies any B-tree node to an unallocated location](https://img.pdfslide.net/doc/110x75/5e8c47ee69bb5d44c9426c51/ablefs-enhancing-metadata-eficiency-in-the-local-file-kairpapers-of-xfs-netappas.jpg)