Embed Size (px)
Citation preview
A physiological model of glucose-insulin interaction in type 1 diabetes mellitus
E.D. Lehmann” and T. Deutsch+
*Diabetic Research Laboratory, Medical Unit (4NW), Department of Endocrinology and Chemical Pathology, United Medical and Dental Schools, St Thomas’ Hospital, Lambeth Palace Road, London SE1 7EH, UK; and ‘Computer Centre, Semmelweis University of Medicine, Budapest, Hungary and Department of Systems Science, Centre for Measure- ment and Information in Medicine, City University, London EClV OHB, UK
ABSTRACT
A clinical model ofglucose-insulin interaction in insulin-dependent diabetes mellitus has been developedforpatient and medical staff education. The model attempts to reflect the underlying (pathojphysiology of insulin action and carbohydrate absorption in quantitative terms such as insulin sensitivity, volume ofglucose and insulin distribution and maximal rate ofgastric emptying. The model's predictions also allow a 24 h simulation ofpatient bloodglucoseprofiles to be generated. A description of the model is provided and its operation illustrated by clinical case studies of insulin- treated diabetic patients. The possible use of the model as a tool for automated insulin dosage adjustment is explored.
Keywords: Computer simulation, physiological model, type 1 diabetes mellitus, insulin dosage adjustment
INTRODUCTION
Diabetes mellitus is a major chronic disease in industrialized countries. It affects 3% of the popula- tion of Europe and approximately 100 million people worldwide’. While the incidence of the disease is currently on the increase in western society, the incidence and severity of the later life complications which accompany it can be considerably reduced if the diabetic patient receives effective treatment leading to good glycaemic control’. In general such treatment attempts to achieve normoglycaemia by maintaining a careful balance between diet, physical activity and insulin therapy. However, education of the diabetic patient to achieve this balance requires a level of clinical expertise which, although
P resent in
specialized diabetes units and some genera l!
ractices with an interest in diabetes, is not always to e found in other sectors of the health service3. One way of making this clinical ex ertise more widely available is to use information tee R nology*.
A number of computer-based approaches to aid in the treatment or long-term management of diabetic patients have been previously reported in the litera- ture. These include knowledge-based systems to advise on patient management in out-patient clinics5, computer algorithms for insulin dosage adjustment” and mathematical models for predicting or simulating patient blood glucose levels7.
Berger and Rodbard’ have developed a computer
Correspondence and reprint requests to: E.D. Lehmann, Diabetic Research Laboratory, Medical Unit (4NW), Department of Endocri- nology and Chemical Pathology, United Medical and Dental Schools, St Thomas’ Hospital, Lambeth Palace Road, London SE1 7EH, UK
0 1992 Butterworth-Heinemann for BES 0141-5425/92/030235-08
program for the simulation of insulin and glucose dynamics following the subcutaneous injection of insulin. Their program incorporates a pharmaco- kinetic model of insulin action to calculate the time course of plasma and ‘active’ insulin for various combinations of popular insulin preparations. With the use of a harmacodynamic glucose model to describe the ependence of glucose dynamics on B plasma insulin and glucose levels, their program can also predict the expected time course of plasma glucose in response to a change in insulin dose, timing or regimen. However, their system has not been designed for individual patient parameteriza- tion and simulation.
Numerous other stand-alone mathematical models of the (type B
lucoregulato 1 diabetes me litus exist%15. We have, how- 7
system in insulin-dependent
ever, developed a physiological model of glucose- insulin interaction for
x atient and medical staff
education about insulin- ependent diabetes as part of a more complex diabetes data management system . 1G20 The integration of the model into this complex system is described elsewhere in this journal in a separate paper by Lehmann and Deutsch.
The model developed, in part, draws on Berger and Rodbard’s pharmacokinetic model of insulin action’ which has been implemented in conjunction with a new model of glucose phannacodynamics based on experimental data from the literature*‘. The model can provide a suitable framework to charac- terize individual diabetic patients quantitatively and predict the blood glucose profile which is expected to be produced by an adjustment in the diet and/or insulin dosage regimen. This new model attempts to provide an anatomically explicit basis for patient
J. Biomed. Eng. 1992, Vol. 14, May 235
A m&l of type 1 diabetes: ED. Lehmann and T. Dertsch
simulations, with different functions for different organs within the bod
r . The model potentially has
application as a tool or automated insulin dosage adjustment based on home blood glucose monitoring data. Clinical case studies will be presented and the possible use of the model as a vehicle for automated insulin dosage adjustment will be explored.
MODEL DESCRIPTION
The glycaemic response of an insulin-treated diabetic patient goes through transitory steady-state gl
bases leading to a
either the insu r caemic profile P fo lowing a change in
in regimen or diet. The purpose of our model is to simulate these steady-state glycaemic and plasma insulin responses independently of the initial values from which the simulation is started.
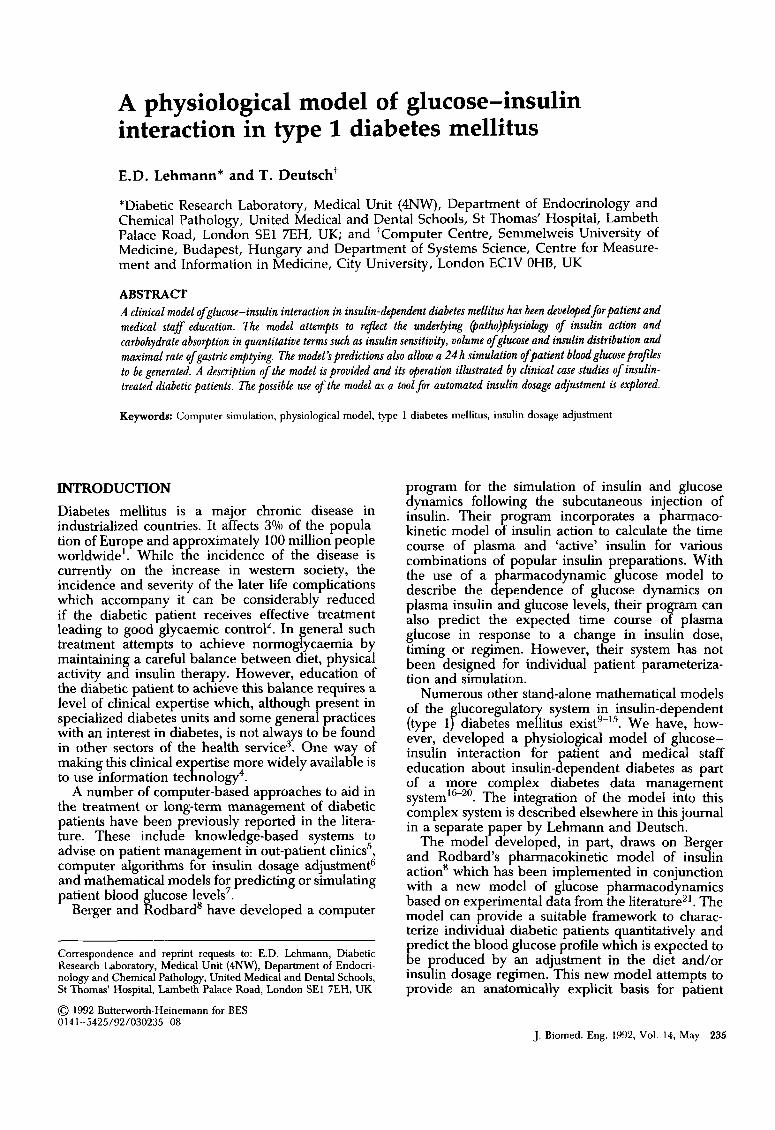
F@M 7 shows the anatomical basis of the model which assumes a patient completely lacking endoge- nous insulin secretion. It contains a single glucose
E P 001 re resenting extracellular glucose (including lood g ucose) into which glucose enters via both
intestinal absorption and hepatic glucose production.
Glucose is removed from this space by insulin- inde endent glucose utilization in red blood cells (RB8s) and the central nervous system (CNS) as well as by insulin-dependent glucose utilization in the liver and
P eriphery; the latter taking place mostly in
must e and adipose tissue. Hepatic and peripheral handling of glucose in the model are dealt with separately. Glucose excretion takes place above the renal threshold of lucose as a function of the creatinine clearance g lomerular filtration) rate.
By separating the hepatic and peripheral handling of glucose in the model it is possible to assign different patient-specific insulin sensitivity para- meters to glucose-insulin interactions in the liver and periphery. As shown schematically in Figure 1,
E eripheral glucose uptake takes place as a function of 0th insulin and plasma glucose levels; the former
enhancing glucose utilization according to the peripheral insulin sensitivity parameter, S,, which has a normalized value between 0 and 1. SP multi-
P lied by the insulin level gives the effective insulin
eve1 responsible for the control action. As the liver both produces and utilizes glucose
CNS + RBCs
lcarbohvdrate mealp degradation
Periphery
Peripheral glucose uptake
I f
Renal threshold of glucose
Subcutaneous insulin in’ection
;.~~~~
u Time
(2) Renal threshold of glucose: 9.ammolll
(31 Creafinineclearance rate: 100 mllmin
(4) “epaiic insulin sensilivity IShI: 0.5
(5) Peripheral insulin
-I
Figure 1 Schematic summarizing the anatomical basis of the model
236 J. Biomed. Eng. 1992, Vol. 14, May
A model of qpe 7 diabetes: E.D. Lehmann and T. Deutsch
described by either a trapezoidal or a triangular function depending on the quantity of carbohydrate in the meal.
The function of the kidneys to excrete glucose has been modelled in terms of two patient-specific model parameters: the renal threshold of glucose and the creatinine clearance @omen&r filtration) rate.
The model contains separate compartments for plasma and ‘active’ insulin. Insulin is removed from the former by hepatic degradation while the latter is responsible for glycaemic control. The activation and deactivation of insulin are assumed to obey first-order kinetics. The only insulin input into the model comes from the absorption site following subcutaneous injection.
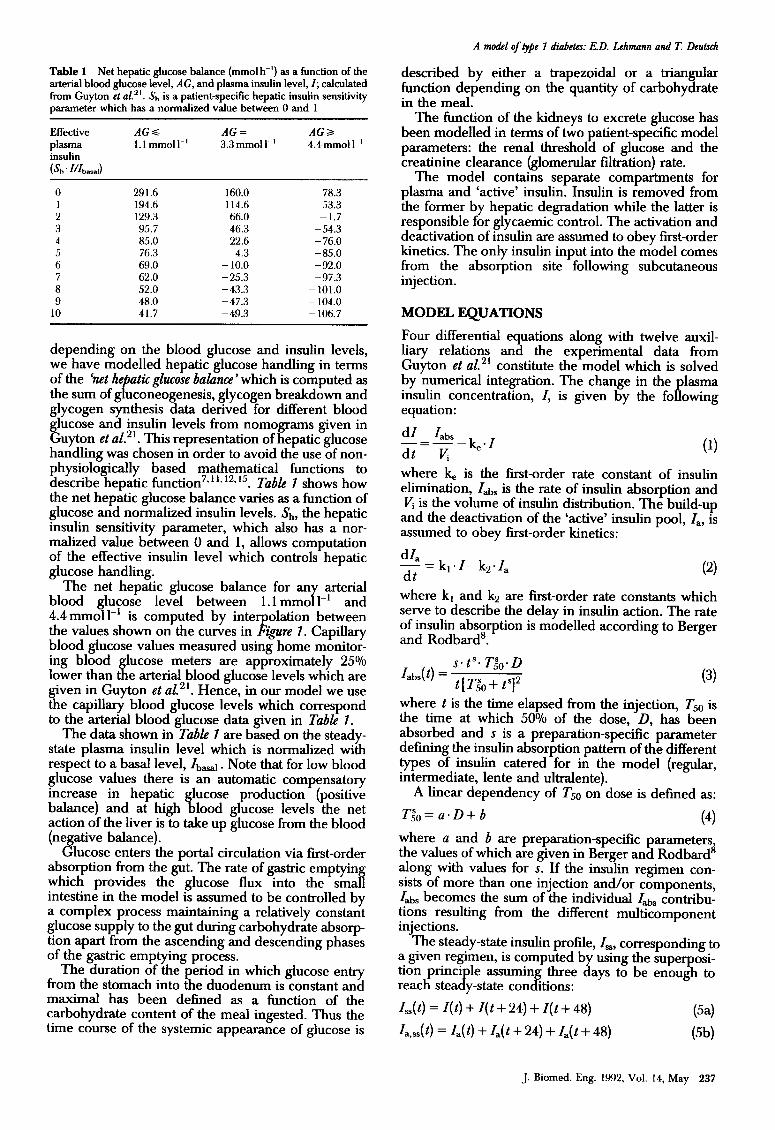
Table 1 Net hepatic glucose balance (mmol h-‘) as a function of the arterial blood glucose level, AG, and plasma insulin level, I; calculated from Guyton et al. “. & is a patient-specific hepatic insulin sensitivity parameter which has a normalized value between 0 and 1
Effective plasma insulin
(&. m&d)
AGs AG= AGa I.lmmoll-’ 3.3 mm01 I-’ 4.4 mm01 IF’
0
2 3 4
6
8 9
10
291.6 160.0 78.3 194.6 114.6 53.3 129.3 66.0 - 1.7 95.7 46.3 -54.3 85.0 22.6 - 76.0 76.3 4.3 -85.0 69.0 - 10.0 -92.0 62.0 -25.3 -97.3 52.0 -43.3 -101.0 48.0 -47.3 - 104.0 41.7 -49.3 - 106.7
depending on the blood glucose and insulin levels, we have modelled hepatic glucose handling in terms of the ‘net hepatic glucose balance which is computed as the sum of gluconeogenesis, glycogen breakdown and glycogen synthesis data derived for different blood glucose and insulin levels from nomograms given in Guyton et al. 2 ‘. This represe ntation of hepatic glucose handling was chosen in order to avoid the use of non- physiologically based mathematical functions to describe hepatic timction7”‘~‘2”5. Table 1 shows how the net hepatic glucose balance varies as a function of glucose and normalized insulin levels. &, the hepatic insulin sensitivity parameter, which also has a nor- malized value between 0 and 1, allows computation of the effective insulin level which controls hepatic glucose handling.
The net hepatic glucose balance for any arterial blood glucose level between 1.1 mmol 1-l and 4.4 mmoll-’ is computed by interpolation between the values shown on the curves in Figure 1. Capillary blood glucose values measured using home monitor- ing blood glucose meters are approximately 25% lower than the arterial blood glucose levels which are given in Guyton et al. 2’ Hence, in our model we use . the capillary blood glucose levels which correspond to the arterial blood glucose data given in Table 1.
The data shown in Tabb 7 are based on the steady- state plasma insulin level which is normalized with respect to a basal level, Ibasal. Note that for low blood glucose values there is an automatic compensatory increase in hepatic glucose production (positive balance) and at high blood glucose levels the net action of the liver is to take up glucose from the blood (negative balance).
Glucose enters the portal circulation via first-order absorption from the gut. The rate of gastric emptying which provides the glucose flux into the small intestine in the model is assumed to be controlled by a complex process maintaining a relatively constant glucose supply to the gut during carbohydrate absorp- tion apart from the ascending and descending phases of the gastric emptying process.
The duration of the period in which glucose entry from the stomach into the duodenum is constant and maximal has been defined as a function of the carbohydrate content of the meal ingested. Thus the time course of the systemic appearance of glucose is
MODEL EQUATIONS
Four differential equations along with twelve auxil- liary relations and the experimental data from Guyton et aL2’ constitute the model which is solved by numerical integration. The change in the lasma insulin concentration, Z, is given by the P equation:
fo lowing
dZ labs
dt=Ir: -b-Z
where k is the first-order rate constant of insulin elimination, Z& is the rate of insulin absorption and F is the volume of insulin distribution. The build-up
and the deactivation of the ‘active’ insulin pool, la, is assumed to obey first-order kinetics:
dZa - = kreZ-k2.Z, dt
where kr and kz are first-order rate constants which serve to describe the delay in insulin action. The rate of insulin absorption is modelled according to Berger and Rodbard’.
labs(t) = s. tS. T&. D
t[T;,+ t’]’ (3)
where t is the time elapsed from the injection, T50 is the time at which 50% of the dose, D, has been absorbed and s is a preparation-specific parameter defining the insulin absorption pattern of the different types of insulin catered for in the model (regular, intermediate, lente and ultralente).
A linear dependency of T50 on dose is defined as:
T&=a.D+b (4) where a and b are preparation-specific parameters the values of which are given in Berger and Rodbard’ along with values for s. If the insulin regimen con- sists of more than one injection and/or components, Zabs becomes the sum of the individual ZAs contribu- tions resulting from the different multicomponent injections.
The steady-state insulin profile, Zss, corresponding to a given regimen, is computed by using the superposi- tion princi reach stea B
le assuming three days to be enough to y-state conditions:
ZJ t) = Z(t) + Z( t + 24) + Z( t + 48) (5a)
Z,+(t) = Z,(t) + Za( t + 24) + Za( t + 48) (W
J. Biomed. Eng. 1992, Vol. 14, May 237
A model of lyPe 1 diabetes: E.D. Lehmann and T. Deutxh
i.e. the steady-state response results from the compo- site effect of injections given for three subsequent days. It is evident that this summation is not needed for re lar insulin preparations (e.g. actrapid) but it shoul LY be used for other, longer acting, insulin preparations whose half time of absorption is higher, especially when larger doses are given.
Since the experimental data provided by Guyton et aLzl refer to equilibrium conditions, the insulin level equilibrated with the steady-state active insulin is considered when computing the net hepatic glucose balance and peripheral glucose uptake. In other words, at any time durin the simulation, we have steady-state I,,(t) and I,,,, $ t) values, but use:
l&(t) = k&,,,(Wk~ (6)
as the insulin level responsible for the hepatic and eri
P P heral control action, where l&(t) is the insulin
eve in equilibrium with l&t). Assuming a single corn artment for extracellular
glucose, the change in g ucose concentration with P time is given by the differential equation:
d G Gi,( t) + N.GB( t) - G,“,(t) - G,,,(t) -= dt
-_ VG
(7)
where G is the plasma glucose level, Gin is the systemic a
tK pearance of glucose via glucose absorp-
tion from e gut, Gout is the overall rate of peripheral and insulin-independent glucose utilization, NHGB is the net hepatic glucose balance, G,& is the rate of renal gh.KOSe excretion and VG is the volume of distribution for glucose.
Assuming a classical Michaelis-Menten relation- ship between glucose utilization and the plasma glucose concentration, with a constant K, such that insulin concentration is reflected in different values of the maximal rate of the transport process, we can writes:
G&G, I&) = G(cx!$/Z,*,+ GI)(K,,,+ Gx)
Gx.(K,+ G) (8)
where c is the slope of the peripheral glucose utiliza- tion versus insulin level relationship, GI is the insulin- independent glucose utilization and Gx is a reference glucose level. The NHGB value at any combination of G and I,* has been derived from the data summa- rized in Ta 8 Ze 1 using &, * l& as the effective insulin level. The amount of glucose in the gut, G,,, follow- ing the ingestion of a meal containing Ch millimoles of glucose equivalent carbohydrate is defined as:
W&t) _ G
~ - dt
empt - kgabs’ G,t
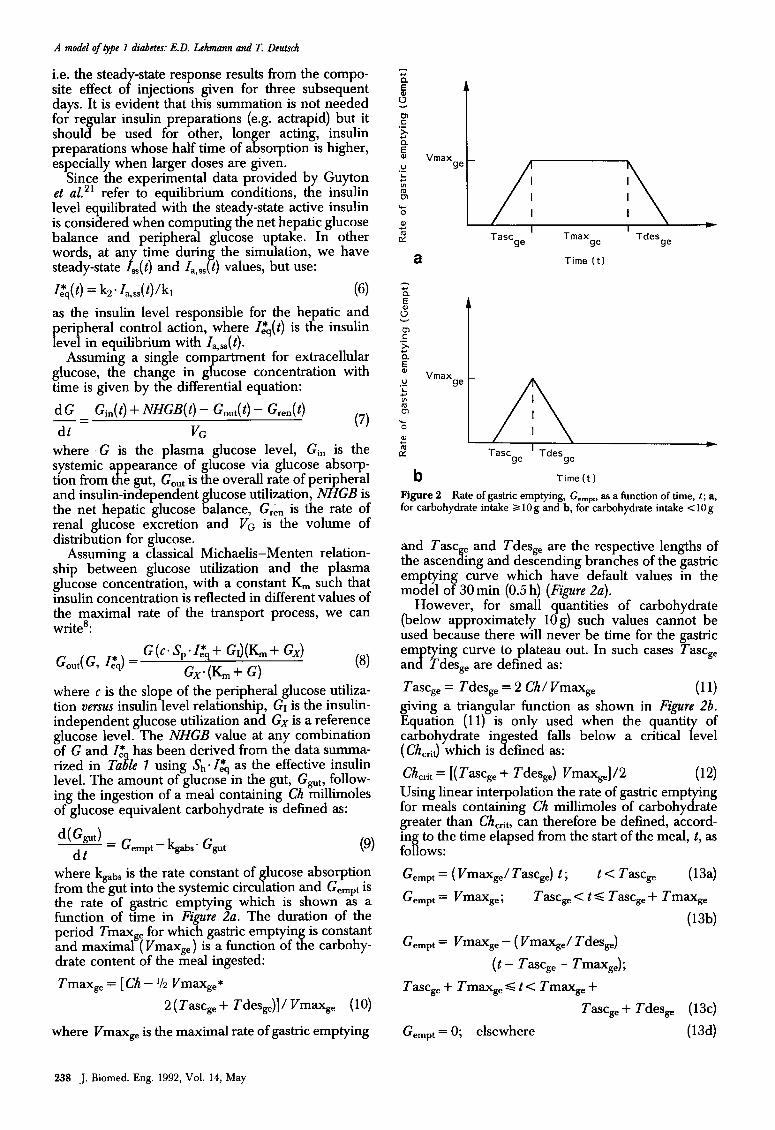
where kgabS is the rate constant of glucose absorption from the gut into the systemic circulation and Gempt is the rate of gastric emptying which is shown as a function of time in Figure 2a. The duration of the period Tmax, for which gastric emptyin is constant and maximal (Vmax,) is a function of tB e carbohy- drate content of the meal ingested:
Tmaxs, = [ Ch - l/2 Vmax,,*
2(Tascs,+ Tdes&]/Vmaxs, (10)
where Vmax, is the maximal rate of gastric emptying
a Time (t)
Vmax ge
Tasc ’ Tdes 9e 9e
b Time(t)
Figure 2 Rate of gastric emptying, Gempt, as a function of time, t ; a, for carbohydrate intake 3 10 g and b, for carbohydrate intake < 10 g
and Tax e and Tdess, are the respective lengths of the ascen 8. mg and descending branches of the gastric emptying curve which have default values in the model of 30 min (0.5 h) (Figure 2a).
However, for small quantities of carbohydrate (below approximately log) such values cannot be used because there will never be time for the gastric em tying curve to plateau out. In such cases Tascs, an B Tdes, are defined as:
Tascs, = Tdess, = 2 Ch/ Vmax, (11) giving a triangular function as shown in Figure 2b. Equation (11) is only used when the quanti
7 of
carbohydrate ingested falls below a critical eve1 (Ch,-,iJ which is defined a~:
Chcrit = [(Tax, + Tdess,) Vmaxs,]/2 (12) Using linear interpolation the rate of gastric emp for meals containing Ch millimoles of carbohy rr
‘ng rate
greater than Chcrib can therefore be defined, accord- ing to the time elapsed from the start of the meal, t, as follows:
G empt = ( ~m=,/T=ge) t ; t < Tax, (134
G empt = vmage ; Tax, < t s Tax,, + Tmax,
(13b)
G empt = Vmax, - ( VmaxsJ Tdes,)
(t - Tascs, - Tmaxs,);
Tascs, + Tmaxs, S t < Tmaxs, +
Tascs, + Tdes, (13~)
G empt = 0; elsewhere (13d)
238 J. Biomed. Eng. 1992, Vol. 14, May
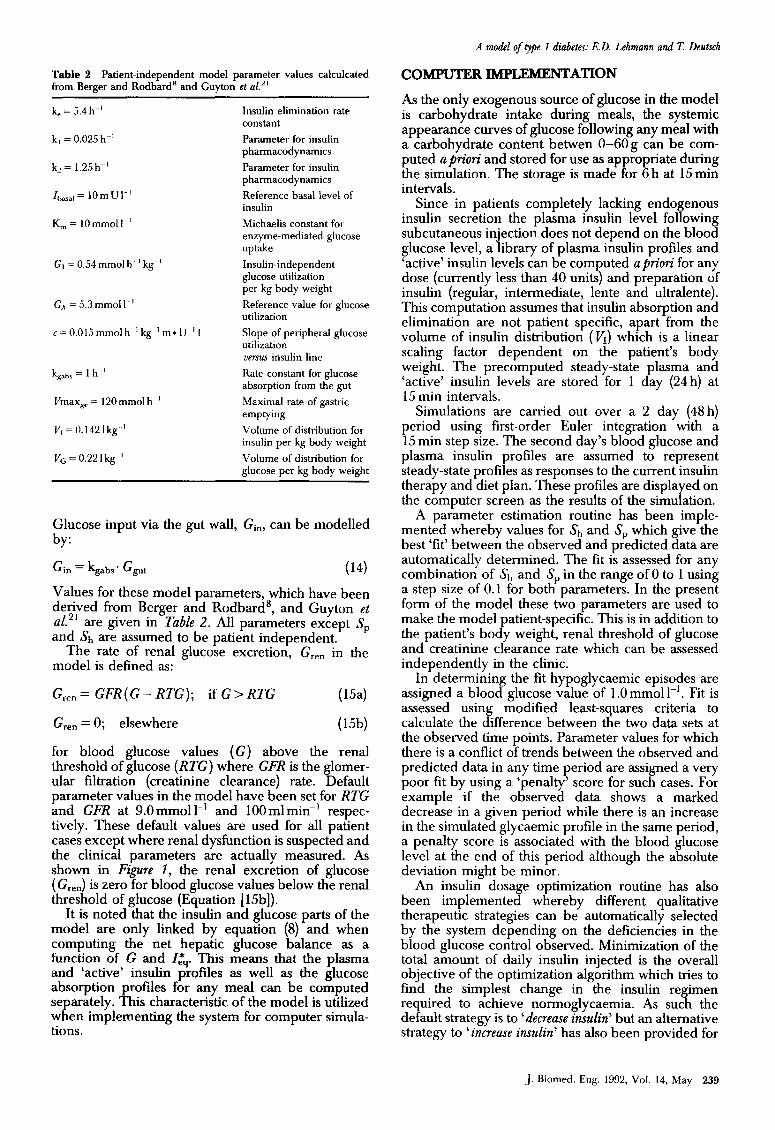
Table 2 Patient-independent model parameter values calculcated from Berger and Rodbard” and Guyton et al.”
k, = 5.4 h-’
k, = 0.025 h-’
k, = 1.25h-’
I basal= IOmUI-’
K, = 10mmoll ’
G, =0.54mmolh ‘kg-’
Gx=5.3mmoll~’
c=O.O15mmolh ‘kg’m*U~‘I
k +r = 1 h ’
Vmax,, = 120 mmol h ’
V, = 0.142 1 kg ’
Vo=O.22lkg ’
Insulin elimination rate constant
Parameter for insulin pharmacodynamics
Parameter for insulin pharmacodynamics
Reference basal level of insulin
Michaelis constant for enzyme-mediated glucose uptake
Insulin-independent glucose utilization per kg body weight
Reference value for glucose utilization
Slope of peripheral glucose utilization uenur insulin line
Rate constant for glucose absorption from the gut
Maximal rate of gastric emptying
Volume of distribution for insulin per kg body weight
Volume of distribution for glucose per kg body weight
Glucose input via the gut wall, Gin, can be modelled by:
Gin = kgabs. G,, (14)
Values for these model parameters, which have been derived from Berger and Rodbard’, and Guyton et ~1.~~ are given in Table 2. All parameters except S, and Sh are assumed to be patient independent.
The rate of renal glucose excretion, G,,, in the model is defined as:
G,,, = GFR(G- RTG); if G> RTG ( 1W
Grm = 0; elsewhere (15b)
for blood glucose values (G) above the renal threshold of glucose (RTG) where GFR is the glomer- ular filtration (creatinine clearance) rate. Default parameter values in the model have been set for RTG and GFR at 9.0 mmol 1-r and 100 ml min-’ respec- tively. These default values are used for all patient cases except where renal dysfunction is suspected and the clinical parameters are actually measured. As shown in Figure 7, the renal excretion of glucose ( Gren) is zero for blood glucose values below the renal threshold of glucose (Equation [ 15b]).
It is noted that the insulin and glucose parts of the model are only linked by equation (8) and when computing the net hepatic glucose balance as a function of G and I&. This means that the plasma and ‘active’ insulin profiles as well as the glucose absorption profiles for any meal can be computed separately. This characteristic of the model is utilized when implementing the system for computer simula- tions.
A model of type 1 diabetes: E.D. Lehmann and T. Deutxh
COMPUTER IMPLEMENTATION
As the only exogenous source of glucose in the model is carbohydrate intake during meals, the systemic appearance curves of glucose following any meal with a carbohydrate content betwen 0-60g can be com- puted apriori and stored for use as appropriate during the simulation. The storage is made for 6 h at 15min intervals.
Since in patients completely lacking endogenous insulin secretion the plasma insulin level following subcutaneous injection does not depend on the blood glucose level, a library of plasma insulin profiles and ‘active’ insulin levels can be corn
7
uted apriori for any dose (currently less than 40 units and preparation of insulin (regular, intermediate, lente and ultralente). This computation assumes that insulin absorption and elimination are not patient specific, apart from the volume of insulin distribution (VI) which is a linear scaling factor dependent on the patient’s body weight. The precomputed steady-state lasma and ‘active’ insulin levels are stored for 1 B ay (24 h) at 15 min intervals.
Simulations are carried out over a 2 day (48 h) period using first-order Euler integration with a 15 min step size. The second day’s blood glucose and plasma insulin
P refiles
steady-state are assumed to represent
profi es as responses to the current insulin therapy and diet plan. These profiles are displayed on the computer screen as the results of the simulation.
A parameter estimation routine has been imple- mented whereby values for Sh and S, which give the best ‘fit’ between the observed and predicted data are automatically determined. The fit is assessed for any combination of &, and S, in the range of 0 to 1 using a step size of 0.1 for both parameters. In the present form of the model these two parameters are used to make the model the patient’s bo B
atient-specific. This is in addition to y weight, renal threshold of glucose
and creatinine clearance rate which can be assessed independently in the clinic.
In determining the fit hypoglycaemic episodes are assigned a blood glucose value of 1 .O mmol 1-l. Fit is assessed using modified least-squares criteria to calculate the difference between the two data sets at the observed time points. Parameter values for which there is a conflict of trends between the observed and predicted data in any time period are assigned a very poor fit by using a ‘penalty’ score for such cases. For example if the observed data shows a marked decrease in a given period while there is an increase in the simulated glycaemic profile in the same period, a penalty score is associated with the blood glucose level at the end of this period although the absolute deviation might be minor.
An insulin dosage optimization routine has also been implemented whereby different qualitative therapeutic strategies can be automatically selected by the system depending on the deficiencies in the blood glucose control observed. Minimization of the total amount of daily insulin injected is the overall objective of the optimization algorithm which tries to find the simplest change in the insulin regimen required to achieve normoglycaemia. As such the default strategy is to ‘decrease insulin’ but an alternative strategy to ‘increase insulin’ has also been provided for
J. Biomed. Eng. 1992, Vol. 14, May 239
A model of typt 1 dkbetcs: E.D. Lxhmann and T. Deutsch
cases of persistent hype+ caemia. Strategies to ‘decrease regular insulin’ an d ‘&crease logger acting insulin’ have also been implemented to cater for cases when h
r: oglycaemic episodes occur - the exact
strategy c osen being dependent on the timing of the ‘hypo’ in relation to the preceding insulin in’ection.
The current system runs under DOS on an T/ BM PC or compatible. A multitasking version is also available for 80386 based machines running WINDOWS 3.0. This allows the displa
r of multiple windows showing
different parts o the system in operation. For example, the data entry screens can be displayed in one window with the results of a simulation in a second and patient-specific model parameters in a third. The number of windows displayed at any one time is wholly dependent on the memory capabilities of the machine being used.
All code for the model and connected data
P
recessing has been implemented in TURBO PASCAL Borland International, v.5.5). The current implemen-
tation, running on an IBM PS/2 Model 70 386 at 25 MHz with an Intel 80387 numerical co-processor, takes less than 1 s to perform a simulation, less than 25s to perform parameter estimation and less than 20s to perform insulin dosage optimization. On a 25MHz IBM PS/2 Model 95 486 insulin dosage optimization and parameter estimation both take less than 10 s to perform. This speed is, to a great extent, achieved b
U recomputing and storing the plasma
insulin leve s ollowing subcutaneous insulin injection and the systemic appearance curves for glucose following a meal.
CLINICALEXAMPLES
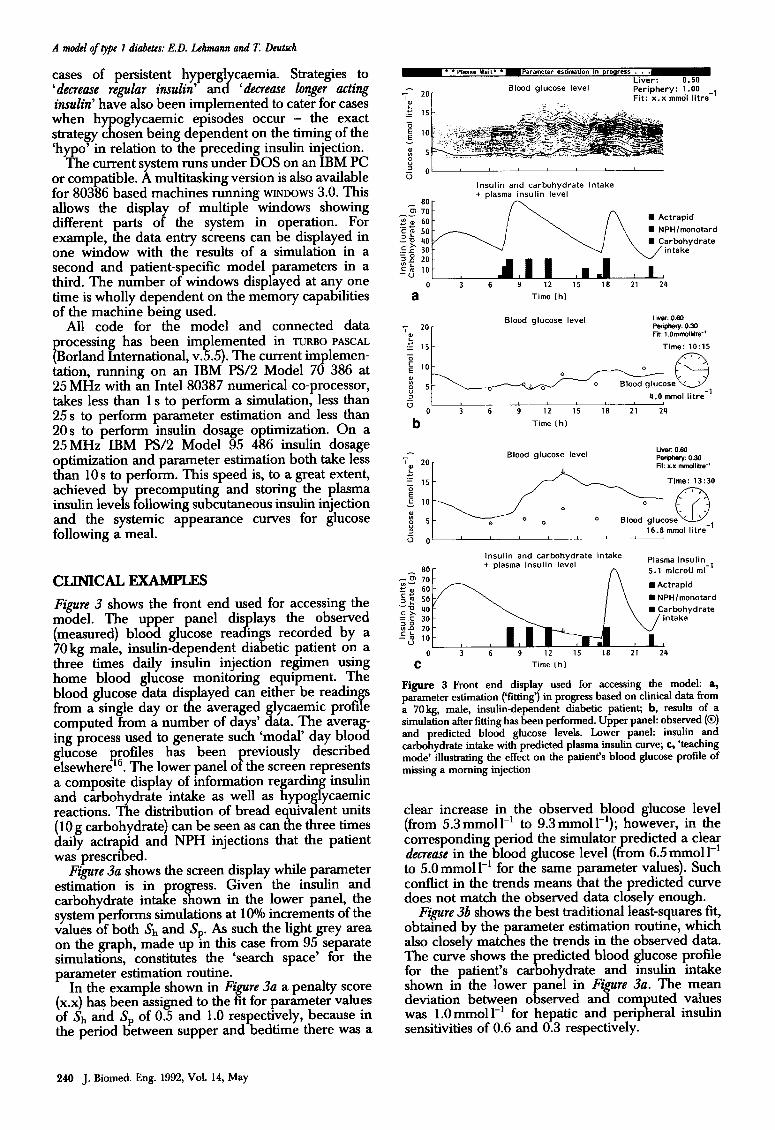
Figure 3 shows the front end used for accessing the model. The upper panel dis lays the observed (measured) blood glucose dp rea in
%s recorded by a
70 kg male, insulin-dependent dia etic patient on a three times daily insulin injection regimen using home blood glucose monitoring equipment. The blood glucose data displayed can either be readings from a single day or the averaged glycaemic profile computed from a number of days’ data. The averag- ing process used to generate such ‘modal’ day blood glucose profiles has been previously described elsewhere 16. The lower p anel of the screen represents a composite display of information regarding insulin and carbohydrate intake as well as hypoglycaemic reactions. The distribution of bread equivalent units (10 g carbohydrate) can be seen as can the three times daily actrapid and NPH injections that the patient was prescribed.
Figure 3a shows the screen display while parameter estimation is in
tal! regress. Given the insulin and
carbohydrate in e shown in the lower panel, the system performs simulations at 10% increments of the values of both &., and Sp. As such the light grey area on the graph, made up m this case from 95 separate simulations, constitutes the ‘search space’ for the parameter estimation routine.
In the example shown in Figure 3a a penalty score (x.x) has been assigned to the fit for parameter values of & and S, of 0.5 and 1.0 respectively, because in the period between supper and bedtime there was a
alood glucose level
_ -_
Liver: 0.50 Periphery: 1.00 Fit: x.x mmol litre
_,
y 0 I
u Insulin and carbohydrate intake
a Time (h)
Blood glucose level Liver: 0.60 l%n@wy: 0.30 Fit: 1 .Ommollotm-
Time: 1O:lS /7-x
4.0 mm01 litre -1
0 b” 3 6 9 12 15 18 21 24
Time Ch)
LNW 0.60 7 Blood glucose level
L 20
Pwiphq: 0.30 VP: x.x Mldliie-
.e ; 15 Time: 13:30
Insulin and carbohydrate intake
~~~~~
0 3 6 9 12 15 18 21 24
C Time (h)
Figure 3 Front end display used for accessing the model: a, parameter estimation (‘Wing’) in progress based on clinical data from a 7Okg, male, insulin-dependent diabetic patient; b, results of a simulation after fitting has been performed. Upper panel: observed (0) and predicted blood glucose levels. Lower panel: insulin and carbohydrate intake with predicted plasma insulin curve; c, ‘teaching mode’ illustrating the effect on the patient’s blood glucose profile of missing a morning injection
clear increase in the observed blood glucose level (from 5.3 mmoll-’ to 9.3 mmoll-‘); however, in the corresponding period the simulator predicted a clear decreme in the blood glucose level (from 6.5 mmoll-’ to 5.0mmoll’ for the same parameter values). Such conflict in the trends means that the predicted curve does not match the observed data closely enough.
Figure 3b shows the best traditional least-squares fit, obtained by the parameter estimation routine, which also closely matches the trends in the observed data. The curve shows the redicted blood glucose profile for the patient’s car ohydrate g and insulin intake shown in the lower anel in Figure 3a. The mean deviation between o E served and computed values was l.Ommoll-’ for hepatic and peripheral insulin sensitivities of 0.6 and 0.3 respectively.
240 J. Biomed. Eng. 1992, Vol. 14, May
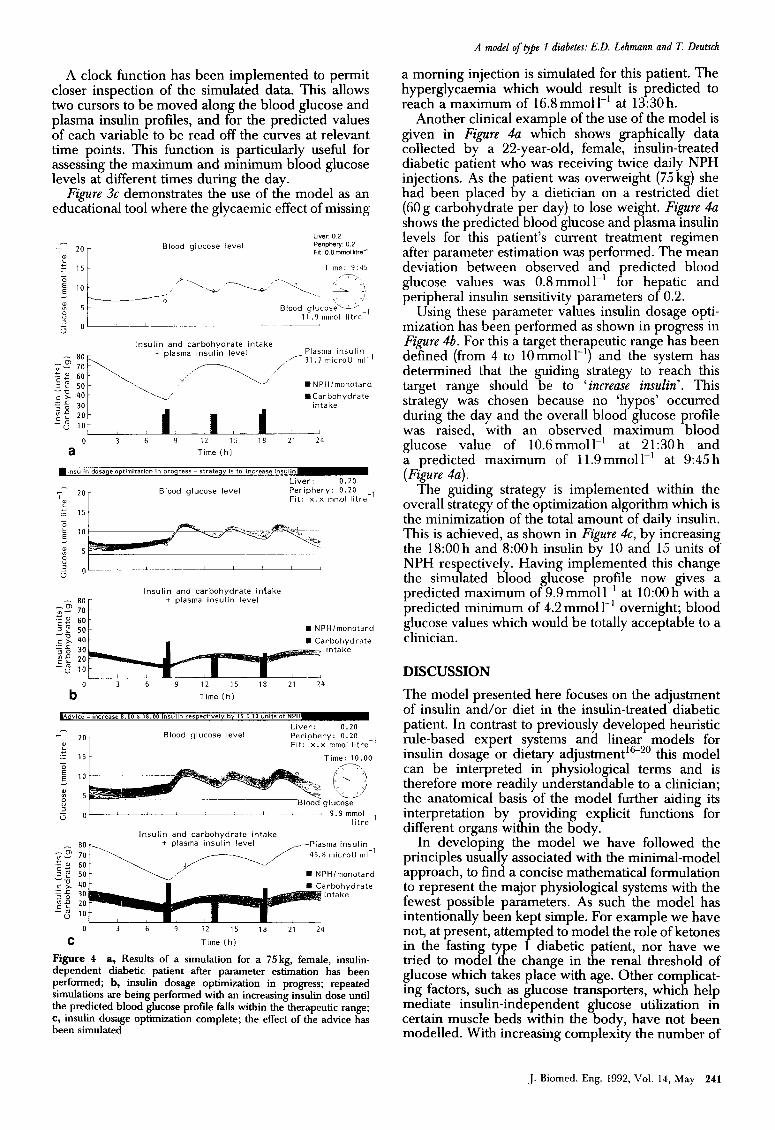
A clock function has been implemented to permit closer inspection of the simulated data. This allows two cursors to be moved along the blood glucose and plasma insulin profiles, and for the predicted values of each variable to be read off the curves at relevant time points. This function is particularly useful for assessing the maximum and minimum blood glucose levels at different times during the day.
Figure 3c demonstrates the use of the model as an educational tool where the glycaemic effect of missing
Liver 0 2 -
; 20 Blood glucose level Penphery. 0.2
-I E 0 : 15 5 ----<
F,, 0 8 mm0 IltfeC t
Time: 9:45
a Time (h)
Liver: 0.20 Periphery: 0.20 Fit: x.x mmol litre
_,
Insulin and carbohydrate infake + plasma insulin level
n NPH/monotard
rbohydrate intake
b 0 3 6 9 12 15 18 21 24
Time [h)
Blood glucose level Liver: 0.20 Periphery: 0.20 Fit: x.x mmol litre
_,
Time: 10.00
0' 9.9mmol lit&’
Insulin and carbohydrate intake
- EOt=_ + plasma insulin level __-Plasma insulin
c:: 40 $5
arbohydrate 30 intake
;f 20
--; 10
0 3 6 9 12 15 18 21 24
C Time (h)
Figure 4 a, Results of a simulation for a 75 kg, female, insulin- dependent diabetic patient after parameter estimation has been performed; b, insulin dosage optimization in progress; repeated simulations are being performed with an increasing insulin dose until the predicted blood glucose profile falls within the therapeutic range; c, insulin dosage optimization complete; the effect of the advice has been simulated
A model of type 7 diabetes: E.D. Lehmann and T. Deutsch
a morning injection is simulated for this patient. The hyperglycaemia which would result is predicted to reach a maximum of 16.8mmoll-’ at 13:30h.
Another clinical example of the use of the model is given in Figure 4-a which shows graphically data collected by a 22-year-old, female, insulin-treated diabetic patient who was receiving twice daily NPH injections. As the patient was overweight (75 kg) she had been placed by a dietitian on a restricted diet (60g carbohydrate per day) to lose weight. Figure 4a shows the predicted blood glucose and plasma insulin levels for this patient’s current treatment regimen after parameter estimation was performed. The mean deviation between observed and predicted blood glucose values was 0.8mmolll’ for hepatic and peripheral insulin sensitivity parameters of 0.2.
Using these parameter values insulin dosage opti- mization has been performed as shown in progress in Figure 4b. For this a target therapeutic range has been defined (from 4 to lOmmoll_‘) and the system has determined that the guiding strategy to reach this target range should be to ‘increase insulin’. This strategy was chosen because no ‘hypos’ occurred during the day and the overall blood glucose profile was raised, with an observed maximum blood glucose value of 10.6 mmolll’ at 21:30 h and a predicted maximum of 11.9mmolll’ at 9:45 h (Figure 4~).
The guiding strategy is implemented within the overall strategy of the optimization algorithm which is the minimization of the total amount of daily insulin. This is achieved, as shown in Figure 4c, b increasing the 18:00 h and 8:00 h insulin by 10 an dy 15 units of NPH respectively. Having implemented this change the simulated blood glucose profile now gives a predicted maximum of 9.9 mmol 1-l at 10:00 h with a predicted minimum of 4.2 mmol 1-r overnight; blood glucose values which would be totally acceptable to a clinician.
DISCUSSION
The model presented here focuses on the adjustment of insulin and/or diet in the insulin-treated diabetic patient. In contrast to previously developed heuristic rule-based expert systems and linear models for insulin dosage or dietary adjustment’~20 this model can be interpreted in physiological terms and is therefore more readily understandable to a clinician; the anatomical basis of the model further aiding its interpretation by providing explicit functions for different organs within the body.
In developing the model we have followed the principles usually associated with the minimal-model approach, to find a concise mathematical formulation to represent the major physiological systems with the fewest possible parameters. As such the model has intentionally been kept simple. For example we have not, at present, attempted to model the role of ketones in the fasting t e tried to model )3:
1 diabetic patient, nor have we e change in the renal threshold of
glucose which takes place with age. Other complicat- ing factors, such as glucose transporters, which help mediate insulin-independent glucose utilization in certain muscle beds within the body, have not been modelled. With increasing complexity the number of
J. Biomed. Eng. 1992, Vol. 14, May 241
A model of type 1 diabetes: E.D. Lehmann and T. Deutsch
parameters for the model increases and so do the difficulties of determining their values for individual patients.
We do not believe that a set of differential equations with individually tailored parameters can be used to model all patients in any conditions. However, as we have shown, such an approach does appear to work in a strictly defined domain for some patients. The proportion of patients for which this approach can be applied has not, as yet, been evaluated. However, we feel that it is important for the computer to be able to recognize those patients for whom model fitting cannot be performed with sufficient precision and by implication those patients for whom the model cannot be used. If this is not possible we believe that the model will lose credi- bility with clinicians and only be useful as an educational tool.
Determination of clinical parameters is a key requirement for the use of the system with individual patient data. We have developed a parameter estima- tion approach which not on1 minimizes the least- squares difference between o g served and predicted data sets but also assesses the direction of change in the data. In this way it is possible for the computer to reject parameter values for which there is a good ‘traditional fit’ as assessed by least-squares criteria, but clearly contradictory trends in the observed and simulated data. If no parameter values satisfy both criteria then the computer informs the clinician that the model cannot be fitted to the patient’s data. Such a situation might occur, for example, if an attempt is made to fit the model to data where rebound hyperglycaemia follows a hy
Further testing of the oglycaemic episode.
mo B el is required to deter- mine whether it is suitable for individual patient parameterization which is a key requirement for clinical use. Depending on the proportion of patients for which the model can be used further refinements might be appropriate. However, the system in its current form clearly has a role as an educational tool separate from its potential role as a patient simulator. In this respect it provides both a pharmacodynamic and physiological basis with which to plan thera- peutic strategies for insulin-dependent diabetic patients. The model is currently undergoing testing at St Thomas’ Hospital, London.
ACKNOWTXDGEMENTS
This work was supported by a grant from the EEC AIM (Advanced Informatics in Medicine) Explora- tory Action [EURODIABETA Project NO. A10191 and by the loan of computer equipment from IBM (UK) Ltd and IBM Europe. The authors thank . Wagner for programming the clock function and CI . Stanka for help with drawings for the manuscript.
REFERENCES
1.
242
EURODIABETA. Information technology for diabetes care in Europe: the EURODIABETA initiative. Dial Med 1990; 7: 639-50.
J. Biomed. Eng. 1992, Vol. 14, May
6.
7.
8.
9.
10.
11.
12.
13.
14.
15.
16.
17.
18.
19.
20.
21.
Young CW. Rationale for glycaemic control. Am JMed 1979; 79 (Suppl3B): 8-l 1. Harrison J, Harvey F. Improving chronic healthcare in Europe. Br JHealthcare Camp 1990; 5: 9-16. Editorial. Diabetes and the number revolution. Diab Med 1991; 8: 400-l. Carson ER, Carey S, Harvey FE, Sonksen PH, Till S, Williams CD. Information technology and computer- based decision support in diabetic management. Camp Meth Prog Biomed 1990; 32: 179-88. Skyler, J, Skyler D, Seigler D, Sullivan MO. Algorithms for adjustment of insulin dosage by patients who monitor blood glucose. Diabetes Care 1981; 4: 311-18. Boroujerdi MA, Williams CD, Carson ER, Piwernetz JK, Hepp KD, Sonksen PH. A simulation approach for planning insulin regimes. In: Brunetti P,Waldhaust WK, eds. International Symposium on Advanced Models for lherapy of Insulin-Dependent Diabetes. Serona Symp No. 37. New York: Raven Press, 1987; 41-6. Berger M, Rodbard D. Computer simulation of plasma insulin and glucose dynamics after subcutaneous insulin injection. Diabetes Care 1989; 12: 725-36. Albisser AM, Schulz M. Simulating human intermediary metabolism: OMNI et al. In: Marks V, Alberti KGMM, eds. Clinical Biochemistry Nearer the Patient II. London: Bailliere Tindall, 1986; 59-67. Carson ER, Cobelli C, Finkelstein L. Mathematical Model- ling of Metabolic and Endocrine Systems. New York: Wiley, 1983. Cobelli C, Ruggeri A. Evaluation of portal/peripheral route and of algorithms for insulin delivery in the closed- loop control of glucose in diabetes. A modelling study. IEEE t-BME 1989; 30: 93-103. Cramp DG, Carson ER. The dynamics of short-term blood glucose regulation. In: Cobelli C, Bergman RN, eds. Carbohydrate Metabolism: Quantitative Physiology and Mathematical Modelling. Chichester: Wiley, 1981; 349-67. Bergman RN, Ider YZ, Bowden CR,Cobelli C. Quantita- tive estimation of insulin sensitivity. Am J Physiol 1979; 236: E667-77. Rizza RA, Mandarin0 LJ, Gerich JE. Dose-response characteristics for effects of insulin on production and utilization of glucose in man. Am J Physiol 1980; 240: E630-8. Leaning MS, Boroujerdi MA. A system for compartmental modelling and simulation. Camp Meth Frog Biomed 1991; 35: 71-92. Deutsch T, Carson ER, Harvey FE, Lehmann ED, Sonksen PH, Tamas G, Whitney G, Williams CD. Computer-assisted diabetic management: a complex approach. Camp Meth Prog Biomed 1990; 32: 195-214. Lehmann ED, Roudsari AV, Deutsch T, Carson ER, Benn
JJ, Sonksen PH. Clinical assessment of a computer system for insulin dosage adjustment. In: Adlassnig K-P, Grabner G, Bengtsson S, Hansen R, eds. Lecture Notes in Medical Informatics. Berlin: Springer-Verlag, 1991; 45: 376-81. Deutsch T, Lehmann ED, Carson ER, So&en PH. Rules and models for insulin dosage adjustment. Diab Nutr Metab 1991; 4 (Suppl. 1): 159-62. Lehmann ED, Deutsch T, Roudsari AV, Carson ER, Benn
JJ, Sonksen PH. A metabolic prototype to aid in the management of insulin-treated diabetic patients. Diab Nutr Metab 1991; 4 (Suppl. 1): 163-7. Lehmann ED, Deutsch T, Roudsari AV, Carson ER, Sonksen PH. A computer system to aid in the treatment of diabetic patients. In: Computer Modelling. Amsterdam: North Holland, 1991, 90-100. Guyton JR, Foster RO, Soeldner JS, Tan MH, Kahn CB, Koncz L, Gleason RE. A model of glucose-insulin homeostasis in man that incorporates the heterogenous fast pool theory of pancreatic insulin release. Diabetes 1978; 27: 1027-42.