Embed Size (px)
Citation preview
JOURNAL OF RESEARCH of the National Bureau of StandardsVol. 88, No. 6, November-December 1983
A Polystyrene-Water Calorimeter
Steve R. DomenNational Bureau of Standards, Washington, DC 20234
Accepted: July 15, 1983
The paper describes a new type of calorimeter that can be quickly put into operation for determiningabsorbed dose at a point in polystyrene. It also describes a unique method of decreasing drifts in electricalsignals caused by temperature gradients. Two calibrated thermistors were placed close together betweensandwiched polystyrene discs that were immersed in water. The assembly was irradiated with gamma raysfrom a cobalt.60 source. The dose rate was about 14 mGy/s and exposure times were about 100 s. Thestandard deviation for a daily set of measurements was about 0.7%. A zero heat defect for polystyrene wasassumed. A calculation converted the measurements to absorbed dose in water. The dose in water determinedin this way, and with a graphite calorimeter, is 3-4% lower than that measured in an all-water calorimeterpreviously reported. Drifts in electrical signals are eliminated by a resistance-capacitance circuit placed acrossa Wheatstone bridge. The rate of potential change across the bridge (caused by the circuit) is adjusted tohave an opposite effect to the drifts in electrical signals produced by temperature gradients within thecalorimeter. The method can be applied to other calorimeters.
Key words: absorbed dose; calorimeter; heat defect; polystyrene; temperature drifts; thermistor; water.
1. Introduction
One purpose of this paper is to report on aninvestigation of a calorimeter for measuring absorbeddose' at a point in polystyrene and converting theresults to also give absorbed dose in water. Anotherpurpose is to describe a method of balancing drifts inelectrical signals caused by temperature gradients. Ingeneral, the method can be applied to othercalorimeters.
The calorimeter and the method of drift balancehave been briefly described in previous publications[1,2].2 In the present paper, the calorimeter(particularly) is described in detail.
Because the standard absorbing material is water [3],recent investigative studies of a calorimeter for
About the Author: Steve R. Domen is a physicist inNBS' Radiation Physics Division.
' Absorbed dose is the mean energy per unit mass imparted tomatter by ionizing radiation. The SI unit of absorbed dose is thegray (symbol Gy). I Gy = I J/kg (= 100 rad).
2 Figures in brackets indicate literature references at the end ofthis paper.
measuring absorbed dose at a point in water wereundertaken and reported [4,5]. It was pointed out [5]that the first major effort in the development of thistype of calorimeter (in overcoming the physicalproblems of accurately and efficiently measuring atemperature rise at a point in water) was successful-but that the second major effort still remained, that is,to determine the existence of and corrections for heatdefects in irradiated water (heat defect is the energyabsorbed or released in induced radiation chemicalreactions, being positive or negative depending,respectively, on whether an endothermic orexothermic reaction takes place). Under cobalt-60irradiation, the apparently measured absorbed doserate in distilled water is 3.5% higher [5] than resultsobtained with a graphite calorimeter [6], the resultsbeing converted to apply to water [7]. Nearly the sameresult, 3.8% (derived from comparisons withionization measurements), was reported [8] as a resultof measurements made in a copy of the watercalorimeter irradiated with cobalt-60 gamma rays andwith photon beams up to a maximum energy of 25MeV; but for the case with electrons from 13 to 20MeV, the results with the water calorimeter were 1%lower than those derived from ionization measure-
373
ments. This lower result does not appear to be in have to encourage its construction and use. In theagreement with measurements in another copy of thecalorimeter irradiated with 17 and 22 MeV electrons[9], nor with what would be expected from theoreticalcalculations [10,11]. Reference [11] indicates that calo-rimetric results should be the same for photons aswell as for electrons, assuming that the initial condi-tions of the water are effectively the same.
Comparison of results with other types ofcalorimeters would aid in the possible realization of anaccurate and efficient instrument for use under widelydifferent irradiation conditions. Such calorimetersshould be constructed of materials having absorptionproperties close to that of water and having anegligible or known heat defect. Polystyrene is such apossible material. By using the techniques described inthis paper, other materials can be used to comparetheir heat defects as a function of accumulated dose-to investigate them for potential calorimetric use.
Reported results [12] indicate a 0.0±0.8% heatdefect in a polystyrene sample irradiated with cobalt-60 gamma rays, after a pre-irradiation of about 2 kGy.Within experimental error, no heat defect wasobserved with fast neutrons [13]. Other reportedresults [14] indicate that a polystyrene sample (from adifferent manufacturer) irradiated with 30-kV x-raysgave only borderline evidence of a heat defect,(0.67_0.94)% standard deviation, a constant result asa function of accumulated absorbed dose. A heatdefect of 0. 1% was reported for polystyrene irradiatedwith 1.7 MeV protons ([3], p. 14). Although these arelimited irradiation conditions, the results suggested theconstruction and investigation of an absorbed dosecalorimeter in which measurements are made directlyin polystyrene and the comparison of this calorimeterwith the water and graphite calorimeters under a widerange of conditions.
The present paper describes and reports results ofinvestigations with a polystyrene-water calorimeterirradiated with gamma rays from a cobalt-60 source.This combination of solid and liquid materials makespossible an efficient instrument that can be broughtquickly into operation and balanced (in contrast to onewith a large solid polystyrene cylinder and no meansof controlling temperature drifts [15]). Advantage istaken of the mobility of water in quickly bringing itand a relatively thin polystyrene disc close to auniform operating temperature.
Rapid control of objectionably large drifts (caused,for example, by small remaining temperaturedifferences between the discs and water, or bysuccessive runs with collimated beams of low-energyelectrons) is a vital feature that a calorimeter must
water calorimeter previously reported, the drifts wereessentially instantly controlled by making a smallchange in electrical power dissipated in the water [5].In the presently described calorimeter, the drifts arealso rapidly decreased by changing the internaltemperature gradients in addition to applying anothersimple technique. This technique consists of merelychanging a charging potential applied to a resistance-capacitance (RC) circuit placed across a Wheatstonebridge, to produce a changing potential across thebridge that has an effect opposite to that caused byremaining small temperature gradients.
This paper describes the new features and operationof the polystyrene-water calorimeter in detail.However, many details are not described or are onlybriefly described because the only physical differencebetween the present calorimeter and the watercalorimeter is the detector that is used. Constructionfeatures, the bridge circuit, calorimeter setup,thermistor sensitivity measurements, and correctionsfor thermistor power dissipations have been detailed[5]. The present paper, too, is written in detail to aidthose in particular who may want to construct thecalorimeter and understand its design and behavior.
2. Measurement Theory
Advantage was taken of the low thermal diffusivityof polystyrene and water, which retard a temperaturechange at a point of measurement. Two beadthermistors were positioned close together betweensandwiched polystyrene discs immersed in water. Thethermistors formed opposite arms of a Wheatstonebridge to double the sensitivity in comparison witha one-thermistor bridge.3 The absorbed dose is
D=(l/2)(AR/R)(k')(c), (1)
where D is the absorbed dose,(1/2) is the result of using two thermistors. to
measure a temperature,AR/R is the fractional change in the
Wheatstone bridge balancing resistor,S is the mean fractional change in resistance of
the thermistors per unit temperature rise, andc is the specific heat capacity of polystyrene.
3The sensitivity could be doubled with a one-thermistor bridge,by doubling the potential applied across the bridge. This wouldquadruple the thermistor power dissipation. Reference [51 points outreasons for maintaining as low a power level as possible.
374

If c is in J/(g-K), D is in kGy. The product(1/2)(AR/R)(S ') is the temperature rise. Thesensitivity, S, was determined to an uncertainty ofabout 0.1%.
The sensitivity is nominally 4% per degree anddecreases by seven parts per thousand per degreeincrease at room temperature. The value of c increasesby four parts per thousand per degree at roomtemperature. Calculated changes in S and c weredetermined by use of a probe mounted inside thecalorimeter and connected to an instrument thatdisplayed temperature with a resolution of 0.01 K.
The value of c used in this investigation, at anoperating temperature of 22.5 'C, was 1.203 J/(g-K).This value was calculated from an equation [16]:
c=(104.15)-'(7.7551-10 5 T-2 +0.53447T-41.58)
J/(g.K), (2)
where T is the absolute temperature. One mole ofpolystyrene= 104.15 g.
Equation (2) was fitted to results of specific heatcapacity measurements (of various samples ofamorphous polystyrene which had a density of 1.05g/cm 3) determined by various investigators, from 200K to 360 K. The reported rms deviation is 0.5%. Onlyselective results were used which were judged tomeet satisfactory standards based on experimentaltechnique, error limits, and accuracy of representationof the data.
Although a calculated value appears to be areasonable result to use in this investigation, attemptsare being made to determine the specific heat ofsamples (from which the detector was made) to anaccuracy and precision within a few tenths of 1%.Any further results or changes will be reported in afuture publication.
3. The Calorimeter
Figure I shows some features of the calorimeter.Two 0.25 mm diameter bead thermistors areembedded near the central plane of two sandwicheddiscs of clear polystyrene. The central plane is near a5/cm2 depth in once-distilled water that is partiallyelectrically conductive. The discs are fastened to threeacrylic rods secured to the bottom of a 30 cm cubewater container constructed of acrylic material(mounting the rods on a vertical wall, and providingan entrance window, permits measurements with
THERMISTORS IN BEAMPOLYSTYRENE I ALUK
EXPANDEDPOLYSTYRENE
IINUM FOIL
WATER LEVEL
-30cn CUBEACRYLICCONTAINER
30 cm SDUAREELECTRODE
LABAT ICSo ~~POWER
CONTROLLER
Figure 1-Essential features of the absorbed dose polystyrene-watercalorimeter. The "adiabatic" power controller permits a potentialto be applied across the electrodes so that in the vicinity of thediscs the rate of temperature rise of the water, as a result ofelectrical power and beam irradiation, is as nearly as possible thesame as that of the discs.
horizontal beams). Two electrodes (30 cm squarestainless steel) for "adiabatic" operation are securedagainst opposite walls inside the container (in thewater calorimeter they were the drift controlelectrodes [5]). The potential supply consists of aseries-parallel arrangement of four 67.5 V drycellbatteries which provide 135 V across a 10-turn 50-kQhelipot. Closing switch S. causes heating of the water.Measurements of potential across the electrodes andcurrent through the stagnant water permit thedetermination of the rate of temperature rise of theentire water bath. The potential, V, is predeterminedso that the rate of temperature rise of the water in thevicinity of the discs (as a result of electrical power andbeam irradiation) produces as nearly as possible thesame rate of temperature rise as do the polystyrenediscs heated directly with broad beam irradiation. Theelectrical resistance of the water, usually in the rangeof 10-25 kQ, decreased during a daily set ofmeasurements by about a factor of 2. This increasedthe drifts but these could be reduced by making smallchanges in the adiabatic power controller.
The approximate potential across the electrodes ispre-determined as follows: The rate of temperaturerise of the polystyrene can be calculated from theabsorbed dose rate and the specific heat ofpolystyrene, or it can be determined from themeasured rate of fractional resistance change of theknown thermistor sensitivities. Considering that thespecific heat of water is 3.5 times greater than that ofpolystyrene, and that the absorbed dose rate and heat
375
L
_-I
I
J
II-I
I UL ... jj_��, , 1,, -

defect in water are each approximately 3% greater,the rate of temperature rise in polystyrene irradiatedwith cobalt-60 gamma rays is approximately 3.3 timesgreater than that of water. The purpose of theelectrical heating of the water is to make up thedifference. Before an irradiation run (and particularlybefore the first run), an arbitrary potential, V,produced a current I,. These measured valuespermitted a calculation of the electrical resistance ofthe water. The values V, and 1, also permitted (as afirst approximation) the calculation of the approximatepotential, V, to accomplish adiabatic operation.Observations of the afterdrifts showed, however, thatthis value was too high by approximately 10%. Thereason for this is that the derivation of V assumed auniform current density throughout the water wherein reality the current lines must necessarily be forcedto flow around the discs.4 This causes a greatercurrent density and thus a greater heating effect in thevicinity of their flat surfaces. A reasonably accurateformula was found to be
V=OS9VD v,/ 1, (3)
where b is the absorbed dose rate in Gy/min. Inpractice, observations of the drifts will indicate whenthe potential, V, needs to be adjusted.
4. The Detector
Figure 2 shows some details of the detector. Eachthermistor, positioned I mm from the disc axis, isembedded just underneath each inner surface. Eachdisc is 10 mm thick and 152 mm in diameter. Mainlyto avoid damage to the wiring during assembly (andbecause of heat transfer considerations), the discs areseparated by three 0.3 mm thick paper spacers (6 mmin diameter) equally spaced near the disc cir-cumference. Silicone rubber is applied around thediscs' central plane to provide a watertight seal. Thesignal leads are connected to a waterproofed electricalsocket fastened near the circumference of the lowerdisc. A small hole drilled along the axis of the socketpermits enclosed air between the discs to vary withchanges in atmospheric pressure.
It will be pointed out later that good mechanicaland thermal anchoring (other than through air)
If the chosen discs are electrically conductive (such as A-150plastic [17] or graphite which has a reported heat defect near zero),then they must be electrically insulated from the water. Reference[181 reports an endothermic heat defect of about 4% for A-150plastic irradiated under different conditions.
0.3 mm SPACER
BEAM
2mm-. 1.
SILICONERUBBER
/DRAWING NOT\\ TO SCALE J
0.25 mm BEADTHERMISTORS
RUBBERSLEEVE
ELECTRICSOCKET
WATERPROOFSPAGHETTI
Figure 2-Constructional details of the detector. Each of the twopolystyrene discs is 10 mm thick and 152 mm in diameter.
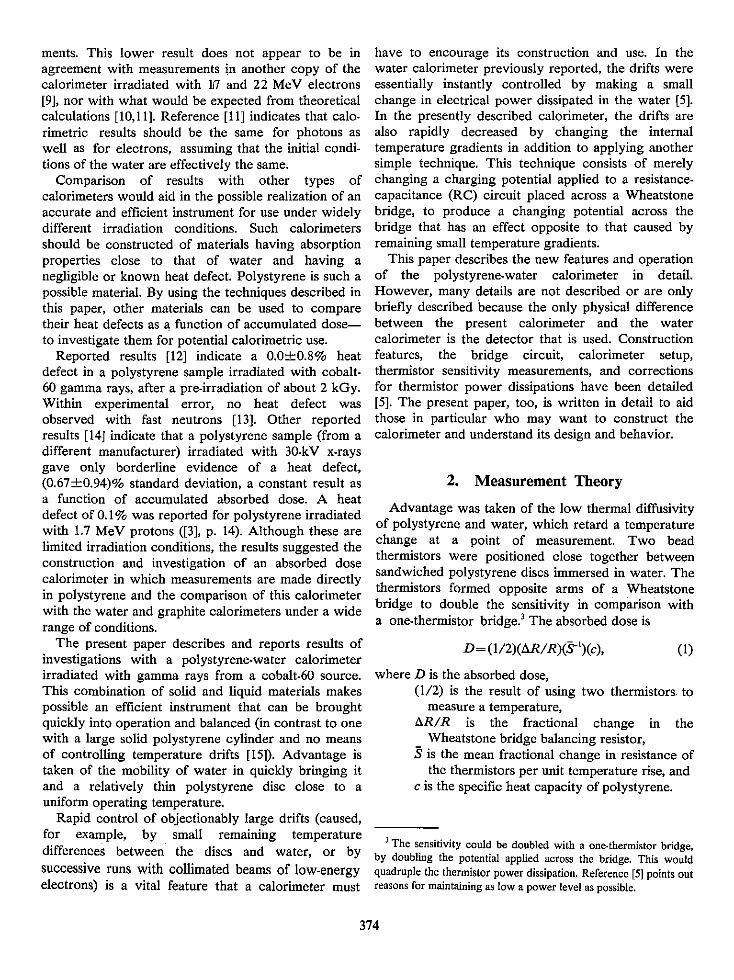
between the discs and thermistors (including the wiresleading from them, for a length of at least I cm) seemsto result in important and desirable detector behaviors.Figure 3 shows the wiring configuration. A compasswas used to scribe grooves slightly larger than theembedded wires. Each thermistor bead wascommercially fused around two 25 gm diameter wires(90% platinum, 10% iridium) which are soldered to 25gm diameter copper wires (the copper wires have ahigher thermal conductivity by a factor of 12). Thethermistors and the I cm lengths of Pt-Jr wires are totallyembedded in epoxy resin. The copper wires arepartially embedded in silicone rubber (which aidedin the initial layout), and the remainder is entirelyembedded in epoxy resin. The embedments were donewith the aid of a microscope which also aided inremoving minute amounts of embedding materialoutside the grooves. This precaution (and consideringthat their specific heat capacities are not largelydifferent from that of polystyrene) made theirradiation thermal effects of those remaining materialsnegligible. The thermal effect of irradiating the smallamounts of different materials (other than polystyrene)composing the wires and thermistors is negligible,<0.01 % within a few seconds after irradiation [5].
The purpose of the shown configuration (inpreference to directing the wires directly to thesocket) is to decrease possible conductive effects alongthe wires (caused by variations in radial dose rates)
376
I
PFHIl
R
Figure 3-Wiring configuration of the detector,
which would tend to affect a temperaturemeasurement. Because the longer lengths increase theresistance of the wires, their resistances are calculatedto correct for their effects.
The measured density of the polystyrene discs was1.050 g/cm3 . The discs' electron density (electrons perunit volume) is only 2% greater than that of water.
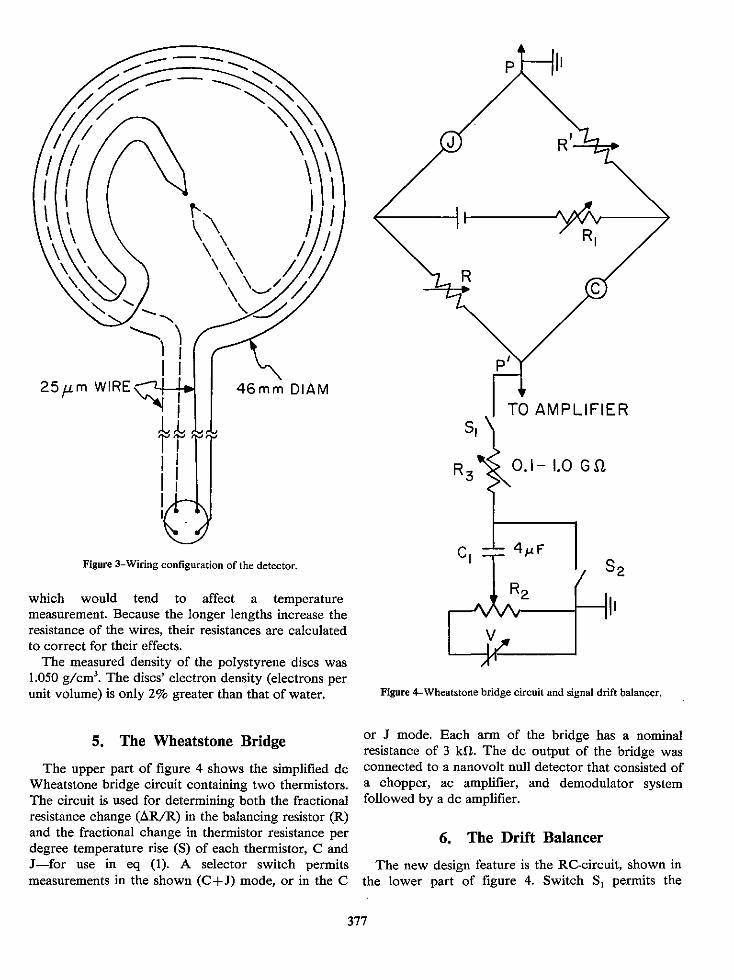
5. The Wheatstone Bridge
The upper part of figure 4 shows the simplified dcWheatstone bridge circuit containing two thermistors.The circuit is used for determining both the fractionalresistance change (AR/R) in the balancing resistor (R)and the fractional change in thermistor resistance perdegree temperature rise (S) of each thermistor, C andJ-for use in eq (1). A selector switch permitsmeasurements in the shown (C+J) mode, or in the C
SI
CI
AMPLIFIER
I- 1.0 GQ
iLF
S2
'1
Figure 4-Wheatstone bridge circuit and signal drift balancer.
or J mode. Each arm of the bridge has a nominalresistance of 3 kfl. The dc output of the bridge wasconnected to a nanovolt null detector that consisted ofa chopper, ac amplifier, and demodulator systemfollowed by a dc amplifier.
6. The Drift Balancer
The new design feature is the RC-circuit, shown inthe lower part of figure 4. Switch S. permits the
377
circuit to be either connected across or disconnected lC T I I I Ifrom the bridge and amplifier. The amplifier normallyhas a small input resistance of about 300 kil compared
to at least 0.1 Gfl of the RC-circuit. Its use and furtherdetails of the electrical signal drift balancer aredescribed below.
7. Thermistor Sensitivity Measurements
The thermistor resistance value (r) at a givenabsolute temperature (T) is given by the well-knownempirical expression:
r roef(1/k-11ro) (4)
where rP is the resistance at temperature T. and /3 isthe "material constant."
The sensitivity of a thermistor (S) is defined as(l/r)(dr/dT), which gives
Ld
z
LU
I-
LUJa-
(5)
Equation (4) can be reduced to linear form:
y=13x+O, (6)
where y= in r, x=1/T, and O= in r0 -,//T0, a constant.Least-squares fits of the data are applied to eq (6).
Resistance measurements were made in atemperature range of 16-28 'C, in steps of 2 degrees.A crystal thermc meter (1 mK resolution) measuredthe temperature of the surrounding agitated water.When necessary, the temperatures were maintainedwithin several millikelvin by adding ice water or bymomentarily supplying 400 W of electrical power toimmersion heaters (not shown in fig. 1).
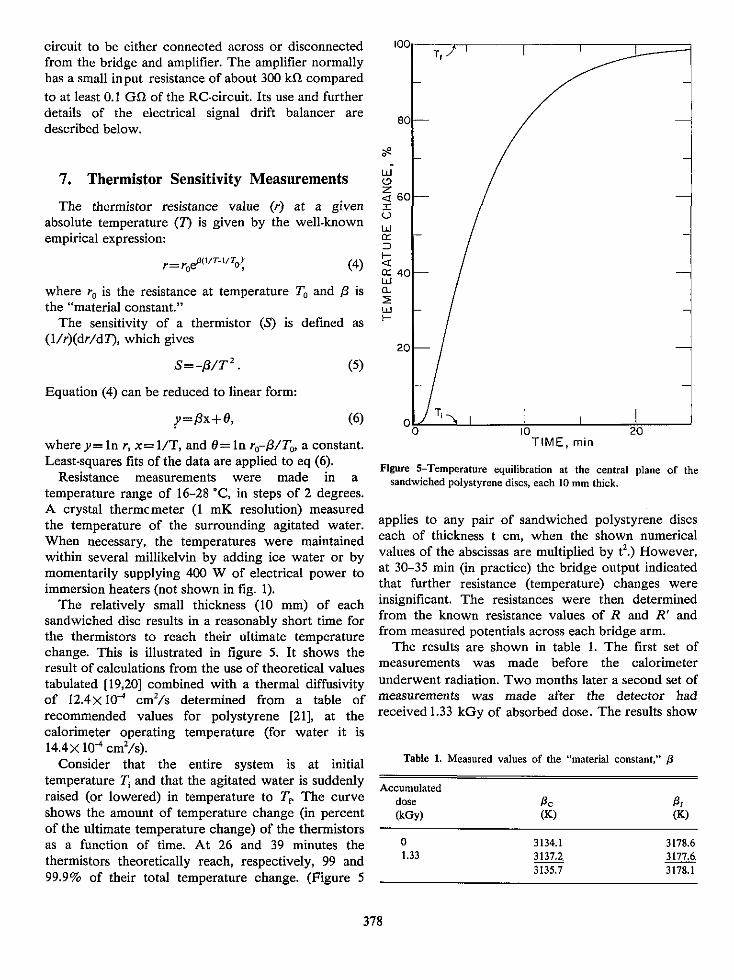
The relatively small thickness (10 mm) of eachsandwiched disc results in a reasonably short time forthe thermistors to reach their ultimate temperaturechange. This is illustrated in figure 5. It shows theresult of calculations from the use of theoretical valuestabulated [19,20] combined with a thermal diffusivityof 12.4X 10' cm2 /s determined from a table ofrecommended values for polystyrene [21], at thecalorimeter operating temperature (for water it is14.4X 1i4 cm2 /s).
Consider that the entire system is at initialtemperature T, and that the agitated water is suddenlyraised (or lowered) in temperature to T, The curveshows the amount of temperature change (in percentof the ultimate temperature change) of the thermistorsas a function of time. At 26 and 39 minutes thethermistors theoretically reach, respectively, 99 and99.9% of their total temperature change. (Figure 5
TIME, min
Figure 5-Temperature equilibration at the central plane of thesandwiched polystyrene discs, each 10 mm thick.
applies to any pair of sandwiched polystyrene discseach of thickness t cm, when the shown numericalvalues of the abscissas are multiplied by t2 .) However,at 30-35 min (in practice) the bridge output indicatedthat further resistance (temperature) changes wereinsignificant. The resistances were then determinedfrom the known resistance values of R and R' andfrom measured potentials across each bridge arm.
The results are shown in table 1. The first set ofmeasurements was made before the calorimeterunderwent radiation. Two months later a second set ofmeasurements was made after the detector hadreceived 1.33 kGy of absorbed dose. The results show
Table 1. Measured values of the "material constant," ,5
Accumulateddose /ic O,8(kGy) (K) (K)
0 3134.1 3178.61.33 3137.2 3177.6
3135.7 3178.1
378

insignificant changes. A mean value, A, of 3157 K wasused for the (C+J) mode indicated in figure 4.
8. Calorimeter Setup
In order to compare results, the polystyrene-watercalorimeter was irradiated under conditions essentiallyidentical to those of the graphite and watercalorimeters. Irradiations were made with the samecobalt-60 unit collimated to give the same-sized broadbeam. Optical sighting and micrometer measurementswere used to accurately position the central planes ofthe sensing units near I m from the source and at amass depth near 5 g/cm2 .
9. Drift Balance
Reduction of temperature gradients which causedrifts first requires elimination of large drifts (afterwater is introduced in the calorimeter) and thenreduction and stabilization of subsequent small driftsobserved at high amplification.
The calorimeter was most stable when it was madeuniform in temperature at the room temperatureregulated near 22.5 'C. The introduced water wasabout I degree cooler. This caused cooling of thepolystyrene discs during the calorimeter setup. Thewater was then agitated with a gas and raised to roomtemperature by use of the immersion heaters. Theheaters were then turned off, but the agitationcontinued. The output of the Wheatstone bridgeindicated the general thermistor response shown infigure 5. At about 30-35 minutes the agitation wasturned off. Irradiation measurements were made whdnthe water was stagnant (tests showed that thiscondition permitted much better reduction and controlof drifts than when the water was agitated and raisedin temperature during a measurement).
In theory, it would seem that prolonged agitationwould result in insignificant temperature drifts. Inpractice, subsequent drifts observed at highamplification should not be expected to be zero, toremain constant, or to be small because they canchange as a result of a number of internal and/orexternal causes. Significant drifts were usuallyobserved after prolonged agitation. This could havebeen caused by the temperature of the incomingagitating gas and/or as a result of heat exchange withthe outside of the container which may have resultedin a small temperature difference between the waterand discs. As a result, significant cooling drift rates (attimes) were observed even though theoretical
calculations showed that a significant heating drift rateof 150 MK/min (0.18 Gy/min) would be present at theend of 40 min of agitation.
Some causes of the behavior of subsequent driftsresult from imperfect "adiabatic" operation. Changesin drifts can also be caused by changes in temperaturegradients that result from variations in axial and radialdose rates, effects which will increase as successiveruns are made. Therefore, rapid reduction and controlof drifts is a vital and time-saving operation.
The effect of non-adiabatic operation is illustratedby the recording shown in figure 6. The small initialdrift indicated near equilibrium conditions, switch S.open (fig. 4). A broad cobalt-60 beam was turned onfor 90 s, switch S. open (fig. 1). Figure 6 indicates thatthe polystyrene discs rose higher in temperature, ATP,compared to the surrounding water that rose less intemperature, AT.. This caused rapid and non- linearcooling after irradiation, as shown by the recording.
BEAM OFF
AT,
-TIME
I - 15 min
TATw
BEAM ON
L
Figure 6-Recording of a non-adiabatic run of 90 s irradiation. Thetemperature rises of the polystyrene discs and surrounding waterare indicated by AT, and AT., respectively.
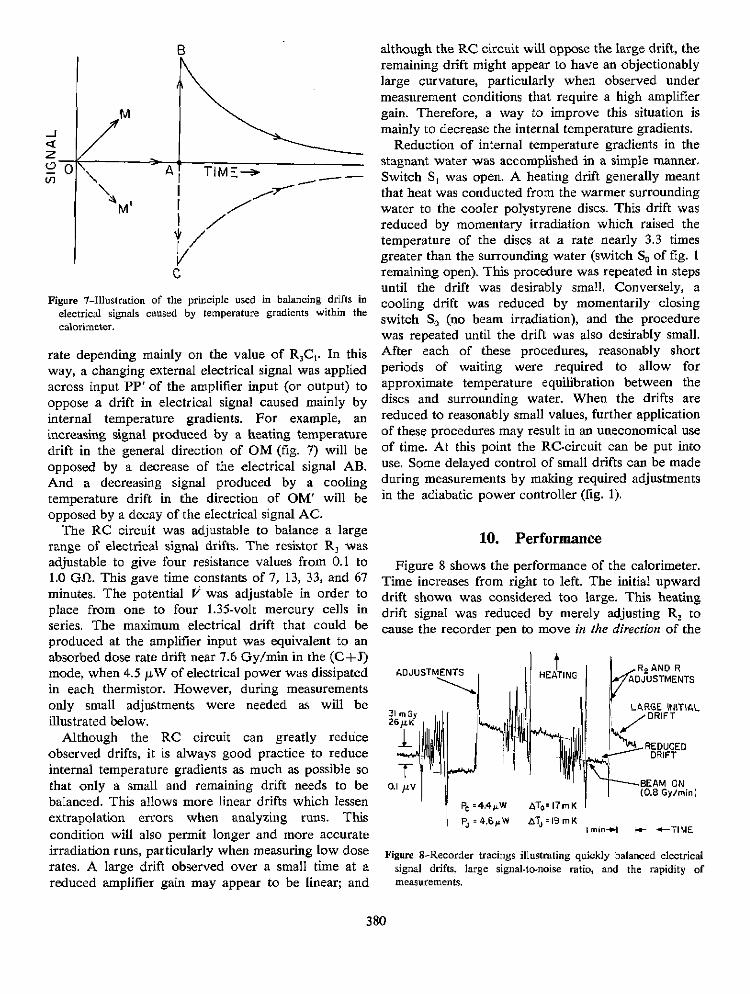
Figure 7 illustrates the basic idea of rapidlydecreasing and balancing drifts by use of the RCcircuit shown in figure 4. Consider switches S, and S2initially open. The 10-turn, 10-kfQ potentiometer, R2,was adjusted to about mid-scale and then S, wasmomentarily closed across the 4- iuF polystyrenecapacitor. The circuit was then connected to thebridge by closing S. Assuming that there are notemperature drifts, the bridge output signal willindicate a zero signal as illustrated by the baselinesegment OA in figure 7. If R2 is adjusted to give signalAB or AC, the signal will decay to the baseline at a
379
B
M'
TIME-- -
I-,4/V
C
Figure 7-Illustration of the principle used in balancing drifts inelectrical signals caused by temperature gradients within thecalorimeter.
rate depending mainly on the value of R 3C1. In thisway, a changing external electrical signal was appliedacross input PP' of the amplifier input (or output) tooppose a drift in electrical signal caused mainly byinternal temperature gradients. For example, anincreasing signal produced by a heating temperaturedrift in the general direction of OM (fig. 7) will beopposed by a decrease of the electrical signal AB.And a decreasing signal produced by a coolingtemperature drift in the direction of OM' will beopposed by a decay of the electrical signal AC.
The RC circuit was adjustable to balance a largerange of electrical signal drifts. The resistor R. wasadjustable to give four resistance values from 0.1 to1.0 Gfl. This gave time constants of 7, 13, 33, and 67minutes. The potential V was adjustable in order toplace from one to four 1.35-volt mercury cells inseries, The maximum electrical drift that could beproduced at the amplifier input was equivalent to anabsorbed dose rate drift near 7.6 Gy/min in the (C+J)mode, when 4.5 tAW of electrical power was dissipatedin each thermistor. However, during measurementsonly small adjustments were needed as will beillustrated below.
Although the RC circuit can greatly reduceobserved drifts, it is always good practice to reduceinternal temperature gradients as much as possible sothat only a small and remaining drift needs to bebalanced. This allows more linear drifts which lessenextrapolation errors when analyzing runs. Thiscondition will also permit longer and more accurateirradiation runs, particularly when measuring low doserates. A large drift observed over a small time at areduced amplifier gain may appear to be linear; and
although the RC circuit will oppose the large drift, theremaining drift might appear to have an objectionablylarge curvature, particularly when observed undermeasurement conditions that require a high amplifiergain. Therefore, a way to improve this situation ismainly to decrease the internal temperature gradients.
Reduction of internal temperature gradients in thestagnant water was accomplished in a simple manner.Switch S. was open. A heating drift generally meantthat heat was conducted from the warmer surroundingwater to the cooler polystyrene discs. This drift wasreduced by momentary irradiation which raised thetemperature of the discs at a rate nearly 3.3 timesgreater than the surrounding water (switch S. of fig. Iremaining open). This procedure was repeated in stepsuntil the drift was desirably small, Conversely, acooling drift was reduced by momentarily closingswitch S. (no beam irradiation), and the procedurewas repeated until the drift was also desirably small.After each of these procedures, reasonably shortperiods of waiting were required to allow forapproximate temperature equilibration between thediscs and surrounding water. When the drifts arereduced to reasonably small values, further applicationof these procedures may result in an uneconomical useof time. At this point the RC-circuit can be put intouse. Some delayed control of small drifts can be madeduring measurements by making required adjustmentsin the adiabatic power controller (fig. 1).
10. Performance
Figure 8 shows the performance of the calorimeter.Time increases from right to left. The initial upwarddrift shown was considered too large. This heatingdrift signal was reduced by merely adjusting R2 tocause the recorder pen to move in the direction of the
Figure 8-Recorder tracings illustrating quickly balanced electricalsignal drifts, large signal-to-noise ratio, and the rapidity ofmeasurements.
380
-J
Z _4 0VI
I Mir-- Z ~TIUAE
drift (upward). 5 Then an adjustment was made by small compared to the noise level which can bechanging the Wheatstone bridge balancing resistor, R,causing the pen to move approximately to the chartmid-scale (the null position). The result shows a muchreduced drift signal; and although it could easily havebeen reduced further, it was considered negligiblecompared to the beam response. Then switch S. (fig.1) was closed and the beam was immediately turnedon. R was adjusted around the null (mid-scale) until S.was opened and the beam turned off after 90 s. Theabrupt spikes shown are the result of this manualchange in R. Two runs were made before furtheradjustments were made in R, and R.
The beam dose rate was near 0.8 Gy/min whichproduced a 1.0 mK temperature rise in 90 s. This issmall compared to the average 18 mK temperaturerise of the thermistors as a result of an averageelectrical power dissipation of 4.5 juW.6 The total pendeflection during a run was 41 times greater than theindicated distance for 31 may. The electrical noisewas small.
Figure 8 illustrates control of only smalltemperature drift signals, up to 17 4K/min. Tests (notshown) indicated that much larger temperature driftswere also reduced and balanced by the RC circuit.The simplicity of the circuit and its ease of use aredesirable features for applying it to other calorimeters,in general. (A complicated circuit could be designedto reduce drifts during runs by generating feedbackramp signals predicted by curve fits to backgrounddrifts.)
Experience with the calorimeter has shown itsutility. Positioning the empty calorimeter, filling itwith water to an accurate depth, getting it intooperation, and making 30 runs of 100 s duration foreach irradiation required about 4 hours.
Insignificant temperature effects were caused in thethermistors as a result of adjusting R2 in the driftbalancer. In figure 8, the first shown adjustment in R2produced an initial potential change across PP' (in fig.4) of about 0.4 gV. This caused a power change of15>X 10- RW in each thermistor. The temperaturechange was (4.1)(15X 106) mK=0.06 ILK. This is
'The effect of superimposing the exponentially decaying signals(RJCJ = 13 minutes) on the linear drifts resulted in a theoretical errorof <0.01%-for the runs shown in figure 8.
'Within 3%, each thermistor rose in temperature by 4.1P mK,where P is the thermistor power dissipation in MW, Tests showedthat when either thermistor changed in temperature by 81, as aresult of a change in P, it produced a temperature change of 0.0448T in the other thermistor-as determined by the rebalance of the
Wheatstone bridge.
estimated as an equivalent temperature change ofseveral microkelvin by use of the illustratedtemperature scale shown at the left in figure 8.Furthermore, about 95 percent of the additional 0.06giK temperature change, caused by that suddenchange in R2, occurred in about 5 s-thereafter aslowly changing drift (theoretically) remained (thebehavior would closely resemble that shown in fig. 14in [5]). Therefore (as a result of adjusting the driftbalancer) the effects of the temperature perturbationsin the thermistors were essentially non-existent,<0.001% of the temperature rise caused byirradiation.
11. Results
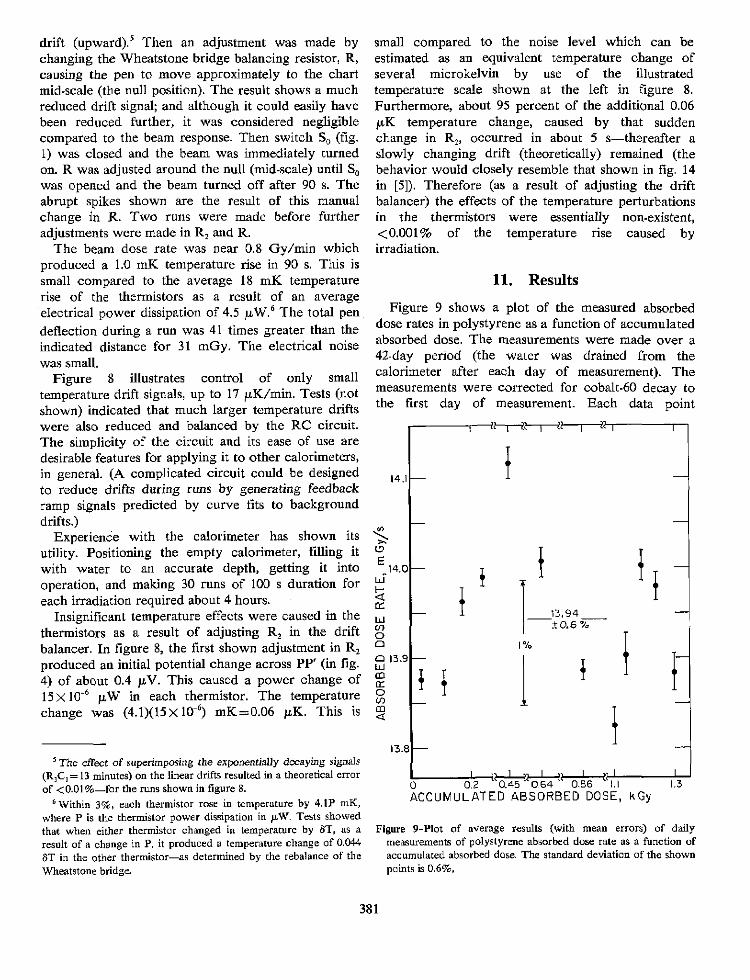
Figure 9 shows a plot of the measured absorbeddose rates in polystyrene as a function of accumulatedabsorbed dose. The measurements were made over a42-day period (the water was drained from thecalorimeter after each day of measurement). Themeasurements were corrected for cobalt-60 decay tothe first day of measurement. Each data point
14.1
EDE
14.0
I-t
LJInCo0c 13.LLco
co
13.6
I
--T-;- - - -
I
T 13.94 -±0.6 %T-
1%
4 *1I I
i
4
0 02 1O45-08 0.86 11 1.3ACCUMULATED ABSORBED DOSE, kGy
Figure 9-Plot of average results (with mean errors) of dailymeasurements of polystyrene absorbed dose rate as a function ofaccumulated absorbed dose. The standard deviation of the shownpoints is 0.6%,
381
I
- I
_
represents an average result of 30 to 63 runs (each 90 heat defect). An equal weight was assigned for theto 120 s of irradiation), which resulted in anaccumulated absorbed dose of 40 to 79 Gy for eachgroup of runs. Each data point is shown plottedagainst the total absorbed dose the detector received-the sum it received on previous days plus the averageit received on the day of measurement. The breaksshown in the abscissa indicate from 150 to 200 Gy ofcontinuously delivered but unmeasured absorbed dose.The total absorbed dose was 1.33 kGy.
The individual runs (not shown) were plotted in allthe groups. They showed increases or decreases, ofquestionable significance, with accumulated dose. Theextremes of the changes varied from about a 1.5%increase on the first day to about a 2% decrease onanother day. The detector received no irradiationprior to the first day of measurement. The 1.5%increase on the first day occurred up to anaccumulated dose of about (30-40) Gy where aplateau was reached. The plateau extended to anaccumulated dose of 70 Gy, at the end of the first dayof measurement.
There was no consistent evidence of significanteffects on measurements of absorbed dose when, on 3days, measurements were made with six differentdissipations of thermistor electrical power (Pc and PI)that ranged from 4.5 to 320 juW.' Measurements in theC-mode (P,=9 ptW while P, was 0, 9, or 160 lLW)gave the same result as measurements in the J-mode(P,= 9 taW while Pc was 0, 9, or 160 MW).
Because there appeared to be no effect due to thevarious measurement conditions described, and eventhough the data on some days showed smallvariations, all the shown plotted data indicate anaverage of all measurements on a particular day. Theuncertainties shown in figure 9 are standard errors ofthe mean that varied from 0.08 to 0.18%. Thecomputed standard deviation of each group of runsranged from 0.5 to 1.0% with an average of 0.7%.The plotted results shown in figure 9 were assumed tobe random fluctuations about a constant value (noevidence of a continuous and significant change in
7 This contrasts with a nearly 4% change in the measuredabsorbed dose in the water calorimeter when powers were changedfrom 9 to 200 IzW (fig. 13 in [51). Also, even at the 320 pWpresently used, no change in response was noted as a result of smallcharges in room air pressure-previously observed, Perhaps thespeculative reasons given there (in section 1i in [5D were correct,concerning the existing conditions and suggested changes (appliedto the present detector) of the thermistor and lead embedmentsdescribed in section 4 of the present paper. Further investigationswill be made.
average result of each group. Averaging the 12 groupsgives 13.94 mGy/s with a standard error of the meanof 0. 17%. The 12 average daily values (shown by thepoints) give a standard deviation of 0.6%. Differentaverages of nine daily groups of measurements madewith the water calorimeter give a standard deviationof 0.2% (fig. 20 in [5]) for the average dailyreproducibility.
12. Absorbed Dose to Water
The absorbed dose rate in polystyrene, 4b,produced by gamma rays from a cobalt-60 source, isconverted to absorbed dose rate in water, Db, byevaluating the equation [22]:
_ =(A-P)8 - P, , D(Ae.lP)p P (7)
The first term is the ratio of the weighted mean, massenergy-absorption coefficients in water to that ofpolystyrene (weighted with the photon energyfluence) and the second term (P,,p,) is the replacementfactor, to be discussed later.
Table 2 shows values used in determining the firstterm. Column I shows the energy intervals andcolumn 2 shows values of the photon fluence perprimary photon at a depth of 5 g/cm2 [23]. Thescattered fluence is shown to be 45% of the primaryfluence. Column 3 shows values of the energy perprimary photon, which has a mean energy of 1.252MeV. The total scattered energy is shown to be 0.22MeV, which is 15% of the total radiation energy atthe point of measurement. Columns 4 and 5 showvalues of the mass energy-absorption coefficients forwater and polystyrene, respectively. Their ratios areshown in column 6. Column 7 shows ratios of themass attenuation coefficients of water to polystyrene.Values of all the coefficients were obtained from [24].The last column shows values (in percent) of thescattered photon energy contributions to the totalabsorbed dose in polystyrene. The scattered energycontributes 16% to the measured absorbed dose.
The first term in eq (7) is
(g1/p)w = =v = 1.033,(Ae.i/P)p ZP
(8)
where Z= tsr(IAe,/P)vr + E Respective-ly, Efi and Esraxt are the mean energies of the primaryphoton and of the scattered photons for the intervalsshown in column 1. The contribution of the scatteredradiation to absorbed dose shown in column 8 is
382
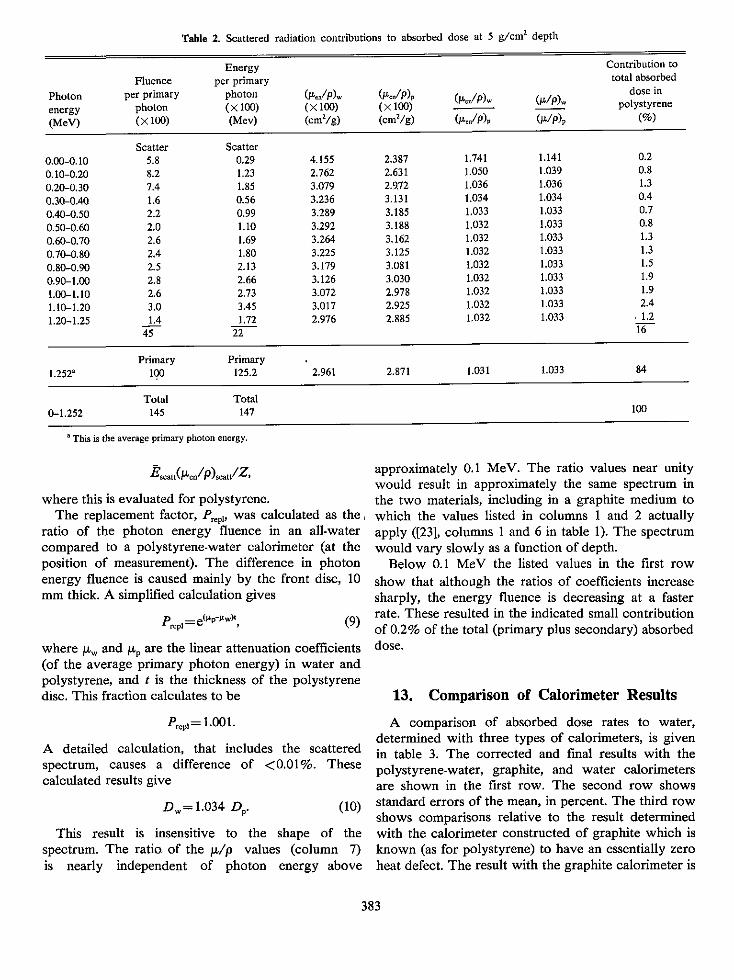
Table 2. Scattered radiation contributions to absorbed dose at 5 g/cm' depth
Energy Contribution to
Fluence per primary total absorbed
Photon per primary photon (g,_/Pp)w (04./p)P (. /) dose inenergy photon (X 100) (X 100) (XlO) (p)w potystyrene(MeV) (X 100) (Mev) (cm2/g) (cmn/g) (k,-/P\ (u/p)p (%)
Scatter Scatter0.00-0.10 5.8 0.29 4.155 2.387 1.741 1.141 0.2
0.10-0.20 8.2 1.23 2.762 2.631 1.050 1.039 0.8
0.20-0.30 7.4 1.85 3.079 2.972 1.036 1.036 1.3
0.30-0.40 1.6 0.56 3.236 3.131 1.034 1.034 0.4
0.40-0.50 2.2 0.99 3.289 3.185 1.033 1.033 0.7
0.50-0.60 2.0 1.10 3.292 3.188 1.032 1.033 0.8
0.60-0.70 2.6 1.69 3.264 3.162 1.032 1.033 1.3
0.70-0.80 2.4 1.80 3.225 3.125 1.032 1.033 1.3
0.80-0.90 2.5 2.13 3.179 3.081 1.032 1.033 1.5
0.90-1.00 2.8 2.66 3.126 3.030 1.032 1.033 1.9
1.00-1.10 2.6 2.73 3.072 2.978 1,032 1.033 1.9
1.10-1.20 3.0 3.45 3.017 2.925 1.032 1.033 2.4
1.20-1.25 1.4 1.72 2.976 2.885 1.032 1.033 1.2
45 22 16
Primary Primary
1.252' 100 125.2 2.961 2.871 1.031 1.033 84
Total Total0-1.252 145 147 100
*This is the average primary photon energy.
where this is evaluated for polystyrene.The replacement factor, PnP, was calculated as the
ratio of the photon energy fluence in an all-watercompared to a polystyrene-water calorimeter (at theposition of measurement). The difference in photonenergy fluence is caused mainly by the front disc, 10mm thick. A simplified calculation gives
Prep, =e4"-t' (9)
where g, and gp are the linear attenuation coefficients(of the average primary photon energy) in water andpolystyrene, and t is the thickness of the polystyrenedisc. This fraction calculates to be
Prep, = 1.00 1.
A detailed calculation, that includes the scatteredspectrum, causes a difference of <0.01%. Thesecalculated results give
Dw= 1.034 DP. (10)
This result is insensitive to the shape of thespectrum. The ratio, of the g/p values (column 7)is nearly independent of photon energy above
approximately 0.1 MeV. The ratio values near unitywould result in approximately the same spectrum inthe two materials, including in a graphite medium towhich the values listed in columns I and 2 actuallyapply ([23], columns 1 and 6 in table 1). The spectrumwould vary slowly as a function of depth.
Below 0.1 MeV the listed values in the first rowshow that although the ratios of coefficients increasesharply, the energy fluence is decreasing at a fasterrate. These resulted in the indicated small contributionof 0.2% of the total (primary plus secondary) absorbeddose.
13. Comparison of Calorimeter Results
A comparison of absorbed dose rates to water,determined with three types of calorimeters, is givenin table 3. The corrected and final results with thepolystyrene-water, graphite, and water calorimetersare shown in the first row. The second row showsstandard errors of the mean, in percent. The third rowshows comparisons relative to the result determinedwith the calorimeter constructed of graphite which isknown (as for polystyrene) to have an essentially zeroheat defect. The result with the graphite calorimeter is
383
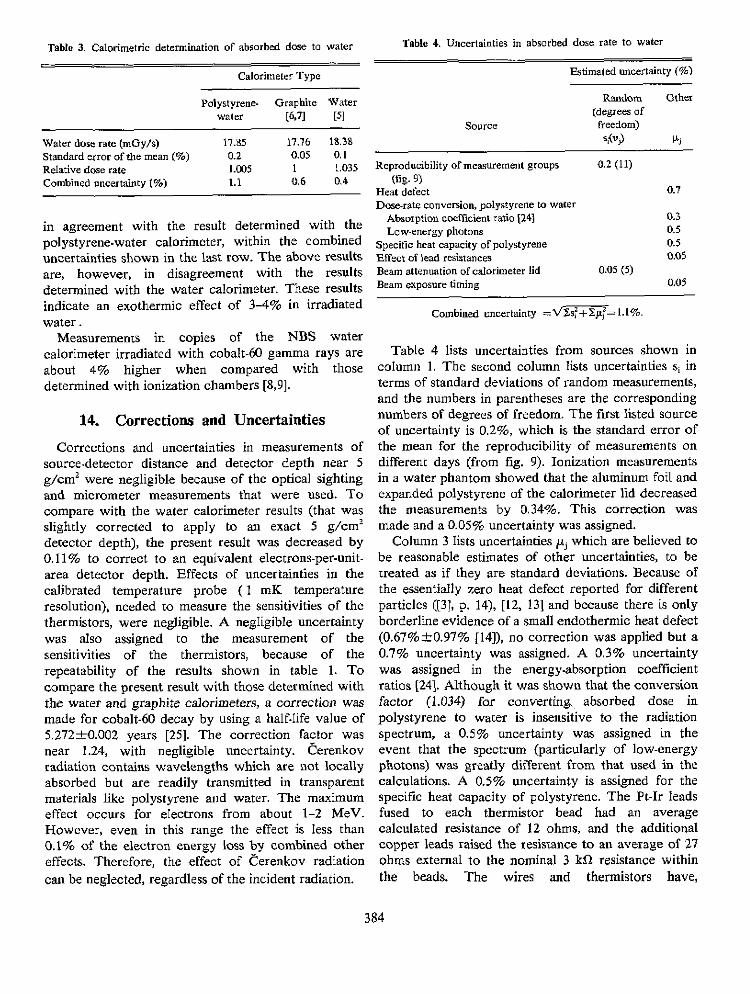
Table 3. Calorimetric determination of absorbed dose to water Table 4. Uncertainties in absorbed dose rate to water
Calorimeter Type
Polystyrene- Graphite Waterwater [6,71 [5]
Water dose rate (mOy/s) 17.85 17.76 18.3aStandard error of the mean (%0) 0.2 0.05 0 I
Relative dose rate 1.005 1 L.035
Combined uncertainty (90) 1.1 0.6 0.4
in agreement with the result determined with thepolystyrene-water calorimeter, within the combineduncertainties shown in the last row. The above resultsare, however, in disagreement with the resultsdetermined with the water calorimeter. These resultsindicate an exothermic effect of 3-4% in irradiatedwater.
Measurements in copies of the NBS watercalorimeter irradiated with cobalt-60 gamma rays areabout 4% higher when compared with thosedetermined with ionization chambers [8,9].
14. Corrections and Uncertainties
Corrections and uncertainties in measurements ofsource-detector distance and detector depth near 5g/cm2 were negligible because of the optical sightingand micrometer measurements that were used. Tocompare with the water calorimeter results (that wasslightly corrected to apply to an exact 5 g/cm 2
detector depth), the present result was decreased by0.11% to correct to an equivalent electrons-per-unit-area detector depth. Effects of uncertainties in thecalibrated temperature probe ( 1 mK temperatureresolution), needed to measure the sensitivities of thethermistors, were negligible. A negligible uncertaintywas also assigned to the measurement of thesensitivities of the thermistors, because of therepeatability of the results shown in table 1. Tocompare the present result with those determined withthe water and graphite calorimeters, a correction wasmade for cobalt-60 decay by using a half-life value of5,272±0.002 years [25]. The correction factor wasnear 1.24, with negligible uncertainty. Cerenkovradiation contains wavelengths which are not locallyabsorbed but are readily transmitted in transparentmaterials like polystyrene and water. The maximumeffect occurs for electrons from about 1-2 MeV.However, even in this range the effect is less than0.1% of the electron energy loss by combined othereffects. Therefore, the effect of Cerenkov radiationcan be neglected, regardless of the incident radiation.
Estimated uncertainty (%)
Random Other(degrees of
Source freedom)Sty Wi
Reproducibility of measurement groups 0.2 (11)
(fig 9)Heat defect 0.7Dose-rate conversion, polystyrene to water
Absorption coefficient ratio 1241 0.3Low-energy photons 0.5
Specific heat capacity of polystyrene 0.5Effect of lead resistances 0.05Beam attenuation of calorimeter lid 0.05 (5)Beam exposure timing 0.05
Combined uzncertainty =V ,= l1%
Table 4 lists uncertainties from sources shown incolumn 1. The second column lists uncertainties si interms of standard deviations of random measurements,and the numbers in parentheses are the correspondingnumbers of degrees of freedom. The first listed sourceof uncertainty is 0.2%, which is the standard error ofthe mean for the reproducibility of measurements ondifferent days (from fig. 9). Ionization measurementsin a water phantom showed that the aluminum foil andexpanded polystyrene of the calorimeter lid decreasedthe measurements by 0.34%. This correction wasmade and a 0.05% uncertainty was assigned.
Column 3 lists uncertainties pi which are believed tobe reasonable estimates of other uncertainties, to betreated as if they are standard deviations. Because ofthe essentially zero heat defect reported for differentparticles ([31, p. 14), [12, 13] and because there is onlyborderline evidence of a small endothermic heat defect(0.67%±0.97% [14]), no correction was applied but a0.7% uncertainty was assigned, A 0.3% uncertaintywas assigned in the energy-absorption coefficientratios [24]. Although it was shown that the conversionfactor (1.034) for converting, absorbed dose inpolystyrene to water is insensitive to the radiationspectrum, a 0.5% uncertainty was assigned in theevent that the spectrum (particularly of low-energyphotons) was greatly different from that used in thecalculations. A 0.5% uncertainty is assigned for thespecific heat capacity of polystyrene. The Pt-fr leadsfused to each thermistor bead had an averagecalculated resistance of 12 ohms, and the additionalcopper leads raised the resistance to an average of 27ohms external to the nominal 3 kMI resistance withinthe beads. The wires and thermistors have,
384

respectively, a positive and negative temperature _WATERcoefficient of resistance. A calculation showed that the LEVEL
results of measurements had to be increased by 0.98% YlI I i3because of the 27 ohm external resistance-and n Z Z Xincreased further by 0.07% because that resistance DET
increased slightly during irradiation. A 0.05% _____________ PLANEuncertainty was assigned. A 0.05% uncertainty wasassigned to the beam exposure timing. w l
The combined uncertainty was calculated by using a Erecently recommended procedure [26]. That uncertain- cty was obtained by combining in quadrature the uncer-tainties shown in table 3. The result is 1.1%. Treatingthe combined uncertainty as if it were a mean errorand multiplying it by 2 gives an overall uncertainty of [01
2.2%.WATERFLOW
GAP 15 cm DIAMETER(ORAWING NOT\, TO SOAZE /
15. Further Investigations
Some other thermal effects were investigated in thecalorimeter both as described and in modified form.When the calorimeter was irradiated with cobalt-60gamma rays, the 10-mm thick discs were sufficient tostop the most energetic electrons emanating from thewater. The electron spectrum at the sensors, therefore,was that emanating from polystyrene. From thesurface to a depth of about 5 mm the electronspectrum is only slightly changed because of thedifference in properties of the two materials. Theeffect is negligible, based on an approximate thermaldiffusion calculation.
Similar effects at higher beam energies can be keptnegligible by an easily made modification of securingadditional discs to the detector assembly. This isshown in figure 10. Modification (a) shows thedetector sandwiched by any necessary array ofpolystyrene discs separated by narrow gaps. Thisarrangement reduces the contributions of scatteredradiation from the water. It also permits water to bemade to flow between the gaps during agitation.Placement or removal of the discs would have little orno effect on the thermistor response shown in figure 5;but the solid-bodied calorimeter (b), with the sameexternal dimensions and detector depth, would requirea considerably longer time for the temperaturegradients to subside [15]. Also, drift-producingtemperature profiles (particularly those caused bysuccessive runs with collimated beams of electrons)can be relatively easily erased in calorimeter (a); but incalorimeter (b) the time required for comparableequilibration would be prohibitively long (anunregulated surrounding temperature would result indelayed and oscillating drifts).
Figure 10-llustrative modification cesigns of the polystyrene-watercalorimeter.
It is interesting to compare the theoreticallycalculated changes in drift rates-along the axis at the5 cm depth, from the top of the uppermost surface tothe detector plane (of each calorimeter). It is alsoconvenient to present temperature drift rates asequivalent absorbed dose rates, which is a moremeaningful quantity to the operator.
Consider that the entire system (shown in fig. 10) isuniform in temperature. The water is agitated andsuddenly raised in temperature by I K. Figure 11shows the changes in drift rates as a function of time.
100
cio
Li
Lt 0
z64
-j .
4> .
0.01
X I i I 7T I I I 111 I II
~~~ \~~~~ /(S) \'
_ ~ ~~~~~~~~~~~~~~~~~~~~~~~ I
I X
, , ,' ,, 1 ,
I~~I I I I . I/
ciD I 0.TIME, h
.0
\\ _-l
,, II10
Figure 11-Calculated drift rates caused by thermal diffusion.
385
Curves (a') and (b) show, respectively, the drift essentially zero heat defect). A previous resultbehaviors of calorimeters (a) and (b). Curve (a')indicates that within 1 hour the drift rates would below enough, <0.01 Gy/min, for calorimeter (a) tooperate-verifying what was experienced. In contrast,curve (b') indicates that calorimeter (U) would havelarge and prolonged drift rates, 1-8 Gy/min from0.3-S h.
Section 9 describes the reduction of relatively smallbut still troublesome internal temperature drifts (in thecalorirreter mn stagnant water, shown in fig. 1, by useof the immersed electrodes to heat the entire waterbath. The use of those electrodes may be ineffectivewith calorimeter (a). However, effectiveness can beachieved by connecting the electrode leads to otherleads that extend into the two gaps adjacent to thedetector (along diameters). Varying the electricalpower dissipated in those water gaps will clmange hetemperature gradients and will result in a reductionand control of observed temperature drifts. Such asystem of heating sections of water (or conductiveplastic material) is described in [27].
16. Summary
As with the water [5] and graphite [6] calorimeters,the polystyrene-water calorimeter proved that it canbe placed quickly into operation. The mobility of theagitated water quickly brings the calorimeter close toa uniform operating temperature. Remaining tempera-ture drifts were decreased and balanced mainly by useof an RC-circuit placed across a Wheatstone bridge.The charging potential was adjusted in such a mannerthat the changing electrical signal produced across thebridge was in a direction opposite to that produced bytemperature gradients in the calorimeter. Reduction ofarge iterta' :emperature gradients is impnrtant to
reducing drifts. MNetions for re.actimon are descrined.Posidoning the empty calorimeter, finling it with
water co an accurate depth, getting it into operation,and making 30 runs of IN0 s duration for eachirradiation required about 4 hours. A cobal:-50absorbed dose rate near 14 mGy/s was measured withan uncertaintv of about 3.7% standard deviationduring a daily set of measurements. Comparison ofdaily sets of measurements in polystyrene indicated noconsistent evidence of a change in heat defect. Theaccumulated absorbed dose was 1.33 kGy.
The result with the presently described polystyrene-water calorimeter agrees to 0.5% with a resultpreviously determined with a graphite calorimeter(graphite, as for polystyrene, is known to have an
determined with a water calorimeter is higher by3-49%o, indicating this magnitude of an exothermiceffect in water irradiated with cobalt-60 gamma rays.
The study described is part of a second phase of apreviously mentioned investigation: the investigationof irradiation effects produced by different beams,absorbed dose rates, and accumul-aated absorbed dosethat may cause significant positive or negative heatdefects at a point of measurement-particularly inwater which is the standard reference material f3j. Thepolystyrene-water calorimeter now provides anefficient investigative tool for comparison of thecalorimeters under widely different irradiationconditions-conditions where it is uncertain ifevidence of am essentially zero heat defect will stillexist in polystyrene. To aid in alleviating this concern,and to provide other comparative investigative tools,plans are to design and investigate an A-150 plastic-water and a graphite-water calorimeter. Differentmodels of this general latter design are described in[28] and 129].
In general, the techniques described in this papercan be applied to any material-water calorimeter, tocompare the heat defects of those materials forpotential calorimetric use, such as a recentlydeveloped "solid water" plastic material [30].Comparison of figure 1 in the present paper withfigure 3 in [5] shows that the only differences are thedetectors (that are readily interchangeable) and thedifferent roles played by the shown immersedelectrodes. The interchangeability provides aconvenient feature for comparison of absorbed dosemeasurements in different materials by making use of asingle calorimetric structure and the same measuringequipment. Elimination of a vacuum system, oftenused with absorbed dose caLorimeters. further adds tothe sirnicily of t-e basic repc-te_ zesu_ n.
References
[I] Domen. S. R. A polystyrene-waler calorimneter IrtL J. AppJ.Radiat. Isot 34{31 643-644; 1983 March.
[2] Do[De. S. R. A :ernper.ture-drzft r 1ancer for calzrire:r9.I[tt J. A4ppl Radidt. sor. S4(f): 927-92:; 1933 June.
[31 ICRU Rep. No, 14, Radiation dosimetry: X rays and gammarays with mazimumn photon energies between 0.6 and 50MeV. Appendix B. ICRU Publications, WashingLon, DC,19/9.
[41 Domen, S. R. Absorbed dose water calorimeter. Med. Phys7(2): 157-159; 1980 March-April.
151 Domen, S. R. An absorbed dose water calornimeter: Theory,design, and performance, J. Res. Nad. Bur. Stand. (U.S,)t7(3): 211235; 1982 Mfay-June.
356
[6] Domen, S. R.; Lamperti, P. J. A heat-loss-compensatedcalorimeter: Theory, design, and performance. J. Res. Nati.Bur. Stand. (U.S.) 78A(5): 595-610; 1974 Septem-ber-October.
[7] Pruitt, J. S.; Domen, S. R.; Loevinger, R. The graphitecalorimeter as a standard of absorbed dose for cobalt-60gamma radiation. J. Res. Nati. Bur. Stand. (U.S.) 86(5):495-502; 1981 September-October.
[81 Marles, A. Comparison of measurements of absorbed dose towater using a water calorimeter and ionization chambersfor clinical radiotherapy photon and electron beams. Ph.D.Thesis (1981), Univ. of Texas (Houston).
[91 Kubo, H. Absorbed dose determination with a watercalorimeter in comparison with an ionisation chamber.Phys. Med. Biol. (in press).
[101 Boyd, A. W. Private communication, 1981.[111 Fletcher, J. W. Radiation chemistry of water at low dose rates
with emphasis on the energy balance; a computer study.AECL -7834 (Chalk River Nuclear Laboratories, Ontario,Canada); 1982.
[12] Weimer, G. Energiedosisabhangigkeit des kalorischen defektsin kunststoffen. Atomkernenergie 20(4): 327-328; 1972.
[131 Weimer, G. Kalorimetrische dosimetrie schneller neutronenunter bericksichtigung des kalorischen defekts. Disserta-tion. Giessen: 1. Physikalisches Institut der Universitat;1973.
[14] Sabel, M.; Schmidt, Th.; Pauly, H. Heat defect of low energyx-rays in some materials of interest in absorbed dosecalorimetry. Rad. and Environm. Biophys. 11: 259-264;1974,
[15] Zeitz, L.; Laughlin, J. S. "Nonisolated-sensor" solidpolystyrene absorbed dose measurements. Med. Phys. 9(5):763-768; 1982 September-October.
[16] Gaur, U.; Wunderlich, B. Heat capacity and otherthermodynamic properties of linear macromolecules. V.Polystyrene. J. Phys. Chem. Ref. Data, 11(2): 313-325;1982.
[17] Smathers, J. B.; et al. Composition of A-150 tissue-equivalentplastic. Med. Phys. 4(1): 74-77; 1977 January-February.
[18] McDonald, J. C.; Goodman, L. J. Measurements of the
thermal defect for A-150 plastic. Phys. Med. Biol. 27(2):229-333; 1982 February.
[19] Olson, F. C. W.; Schultz, 0. T. Temperatures in solids duringheating or cooling. Ind. Eng. Chem. 34(7): 874-877; 1942July.
[20] Ingersoll, L. R.; Zobel, 0. J.; Ingersoll, A. C. Heatconduction. Madison, WI, The University of WisconsinPress, 299-300 (1954).
[21] Ho, C. Y.; et al. Thermophysical properties of polystyrene andpoly (vinyl chloride). Cezairliyan, A., ed. Proceedings ofthe seventh symposium on thermophysical properties; 1977May 10-12; Gaithersburg, MD (ASME); 198-218.
[22] Loevinger, R. A formalism for calculation of absorbed dose toa medium from photon and electron beams. Med. Phys.
8(1): 1-12; 1981 January-February.1231 Comite consultatif pour les etalons de mesure des
rayonnements ionisants, Section I-Rayons x et y,electrons; 2' Reunion, 1972 May 3-5, Sevres, France,BIPM.
[24] Hubbell, J. H. Photon mass attenuation and energy-absorptioncoefficients from 1 keV to 20 MeV. Int. J. Appl. Radiat.Isot. 33: 1269-1290; 1982 November.
[25] Hanson, H. H.; Legrand, J. Cobalt-60 decay. At. Energy Rev.11: 576-641; 1973.
[26] Knarls, R. Report of the BIPM Working Group on thestatement of uncertainties. 1980.
[27] Domen, S. R. Absorbed dose water calorimeter. U.S. PatentNumber 4,312,224; 1982 January.
[28] Hohlfeld, K.; Reich, H. Calibration of dose meters in terms ofabsorbed dose in water for wCo y-radiation. Proceedings ofan International Symposium on National and InternationalStandardization of Radiation Dosimetry; 1977 December5-9; Atlanta, GA, Vol. 2: 81-89.
[29] Sundara Rao, 1. S.; Naik, S. B. Graphite calorimeter in waterphantom and calibration of ionization chambers in dose towater for uCo gamma radiation. Med. Phys. 7(3): 196-201;1980 May-June.
[30] Constantinou, C.; Attix, F. H.; Paliwal, B. R. A solid waterphantom material for radiotherapy x-ray and y-ray beamcalibrations. Med. Phys. 9(3): 436-441; 1982 May-June.
387