Embed Size (px)
Citation preview

University of Nebraska - Lincoln University of Nebraska - Lincoln
DigitalCommons@University of Nebraska - Lincoln DigitalCommons@University of Nebraska - Lincoln
Agronomy & Horticulture -- Faculty Publications Agronomy and Horticulture Department
11-6-2015
A Population Structure and Genome-Wide Association Analysis A Population Structure and Genome-Wide Association Analysis
on the USDA Soybean Germplasm Collection on the USDA Soybean Germplasm Collection
Nonoy Bandillo University of Nebraska-Lincoln, [email protected]
Diego Jarquin University of Nebraska-Lincoln, [email protected]
Qijian Song USDA Beltsville Agricultural Research Center, [email protected]
Randall L. Nelson USDA–ARS, Soybean/Maize Germplasm, Pathology, and Genetics Research Unit, [email protected]
Perry Cregan USDA Beltsville Agricultural Research Center
See next page for additional authors
Follow this and additional works at: https://digitalcommons.unl.edu/agronomyfacpub
Part of the Agricultural Science Commons, Agriculture Commons, Agronomy and Crop Sciences
Commons, Botany Commons, Horticulture Commons, Other Plant Sciences Commons, and the Plant
Biology Commons
Bandillo, Nonoy; Jarquin, Diego; Song, Qijian; Nelson, Randall L.; Cregan, Perry; Specht, James; and Lorenz, Aaron, "A Population Structure and Genome-Wide Association Analysis on the USDA Soybean Germplasm Collection" (2015). Agronomy & Horticulture -- Faculty Publications. 832. https://digitalcommons.unl.edu/agronomyfacpub/832
This Article is brought to you for free and open access by the Agronomy and Horticulture Department at DigitalCommons@University of Nebraska - Lincoln. It has been accepted for inclusion in Agronomy & Horticulture -- Faculty Publications by an authorized administrator of DigitalCommons@University of Nebraska - Lincoln.
Authors Authors Nonoy Bandillo, Diego Jarquin, Qijian Song, Randall L. Nelson, Perry Cregan, James Specht, and Aaron Lorenz
This article is available at DigitalCommons@University of Nebraska - Lincoln: https://digitalcommons.unl.edu/agronomyfacpub/832

the plant genome november 2015 vol. 8, no. 3 1 of 13
original research
A Population Structure and Genome-Wide Association Analysis on the USDA Soybean Germplasm Collection
Nonoy Bandillo, Diego Jarquin, Qijian Song, Randall Nelson, Perry Cregan, Jim Specht, and Aaron Lorenz*
AbstractPopulation structure analyses and genome-wide association stud-ies (GWAS) conducted on crop germplasm collections provide valuable information on the frequency and distribution of alleles governing economically important traits. The value of these analy-ses is substantially enhanced when the accession numbers can be increased from ~1,000 to ~10,000 or more. In this research, we conducted the first comprehensive analysis of population structure on the collection of 14,000 soybean accessions [Gly-cine max (L.) Merr. and G. soja Siebold & Zucc.] using a 50K-SNP chip. Accessions originating from Japan were relatively ho-mogenous and distinct from the Korean accessions. As a whole, both Japanese and Korean accessions diverged from the Chinese accessions. The ancestry of founders of the American acces-sions derived mostly from two Chinese subpopulations, which reflects the composition of the American accessions as a whole. A 12,000 accession GWAS conducted on seed protein and oil is the largest reported to date in plants and identified single nucleotide polymorphisms (SNPs) with strong signals on chromo-somes 20 and 15. A chromosome 20 region previously reported to be important for protein and oil content was further narrowed and now contains only three plausible candidate genes. The haplotype effects show a strong negative relationship between oil and protein at this locus, indicating negative pleiotropic effects or multiple closely linked loci in repulsion phase linkage. The vast majority of accessions carry the haplotype allele conferring lower protein and higher oil. Our results provide a fuller understanding of the distribution of genetic variation contained within the USDA soybean collection and how it relates to phenotypic variation for economically important traits.
Soybean is an important crop worldwide and a major source of protein and oil for human food, animal
feed, and industrial products (Wilson, 2008). The per-centages of protein and oil content, while influenced by both genotype and environment, typically average ~40 and ~20%, respectively. Increasing the relative oil content in soybean seed is complicated by its high negative cor-relation to protein content (Brummer et al., 1997; Burton, 1987; Clemente and Cahoon, 2009; Cober and Voldeng, 2000; Wilcox, 1998) caused by either pleiotropic effects or linkage (Chung et al., 2003). Moreover, total seed yield is often negatively correlated with seed protein, although the correlation is weaker than that between protein and oil (Chung et al., 2003). Dissecting the genetic bases underlying seed oil and protein content, and eventually recombining them in desired genetic backgrounds, con-tinues to be a challenge to soybean breeders.
Given the importance of oil and protein content, the genes or quantitative trait loci (QTL) underlying these traits have undergone intensive investigations (Bolon et al., 2010; Chung et al., 2003; Hwang et al., 2014; Vaughn et al., 2014). However, most of what we know about the
Published in The Plant Genome 8 doi: 10.3835/plantgenome2015.04.0024 © Crop Science Society of America 5585 Guilford Rd., Madison, WI 53711 USA An open-access publication
All rights reserved.
N. Bandillo, D. Jarquin, J. Specht, and A. Lorenz, Dep. of Agronomy & Horticulture, Keim Hall, Univ. of Nebraska–Lincoln, Lincoln, NE 68583-0915; Q. Song and P. Cregan, Soybean Genomics and Improvement Lab., Beltsville Agricultural Research Center, Beltsville, MD 20705; R. Nelson, USDA–ARS, Soybean/Maize Germplasm, Pathology, and Genetics Research Unit, 1101 W. Peabody Dr., Ur-bana, IL 61801-0000. Received 19 Apr. 2015. Accepted 23 June 2015. *Corresponding author ([email protected]).
Abbreviations: CV, cross-validation; FaST-LMM, Factored Spectrally Transformed Linear Mixed Model; GRIN, Germplasm Resources Information Network; GWA, genome-wide association; GWAS, genome-wide association studies; kb, kilobase; LD, linkage disequi-librium; LG, linkage group; MAF, minor allele frequency; Mb, mega-base; MG, maturity group; QTL, quantitative trait loci; SNP, single nucleotide polymorphism; SP, subpopulation.
Published November 6, 2015
2 of 13 the plant genome november 2015 vol. 8, no. 3
genetic architecture of seed protein and oil content is based on traditional QTL linkage analysis of populations derived from crosses of two parents with contrasting phenotypes. More than 50 QTL have been reported as controlling seed oil and protein content in a number of QTL mapping studies (www.soybase.org). Among these QTL, a region mapped to soybean linkage group I (LG-I) has consistently shown the strongest association with per-centage protein composition (Diers et al., 1992; Chung et al., 2003; Nichols et al., 2006). The LG-I QTL is of partic-ular interest because of its large additive effect detected in many mapping populations (Csanadi et al., 2001; Diers et al., 1992; Sebolt et al., 2000) and across multiple environ-ments (Brummer et al., 1997). Nichols et al. (2006) nar-rowed down this region to a 3-cM interval using BC5F5–derived near isogenic lines. This genetic map interval has a corresponding physical distance of 8.4 megabase (Mb), from 24.54 to 32.92 Mb on chromosome 20 (Bolon et al., 2010). Hwang et al. (2014) further narrowed down the candidate region to a 3-Mb region located between 27.6 to 30.0 Mb on the same chromosome. Vaughn et al. (2014), however, mapped this same QTL approximately 1 Mb downstream of the region that Hwang et al. (2014) identi-fied. The size of the narrowed region defined by Hwang et al. (2014) and Vaughn et al. (2104) is still too large for targeting candidate genes for cloning.
Mapping resolution can be greatly enhanced when accession numbers are increased from ~1,000 to ~10,000 or more (Korte and Farlow, 2013). Remarkably, the USDA Agricultural Research Service Soybean Genomics Group has genotyped the entire USDA Soybean Germplasm Col-lection with the Illumina Infinium SoySNP50K iSelect Beadchip (http://www.soybase.org/dlpages/#snp50k). The availability of this information will provide soybean researchers with a deeper understanding of the genetic variation contained in the germplasm collection, and holds potential to pinpoint important loci controlling traits of interest through genome-wide association (GWA) analysis. Compared to traditional linkage mapping, GWA analysis provides much greater mapping resolution and evaluates greater allelic diversity simultaneously (Myles et al., 2009; Yu and Buckler, 2006; Zhu et al., 2008). Harness-ing the genetic variation contained in crop germplasm collections for mapping QTL through GWA has been found successfully conducted in several crop species, including barley (Hordeum vulgare L.) (Munoz-Amatriain et al., 2014), maize (Zea mays L.) (Romay et al., 2013), rice (Oryza sativa L.) (Huang et al., 2010), and wheat (Triticum aestivum L.) (Cavanagh et al., 2013). To date, only a small fraction of the soybean germplasm repositories around the world has been explored through GWAS and such studies have typically included relatively small (i.e., <1000) num-bers of accessions in any given population (Hwang et al., 2014; Sonah et al., 2015; Vaughn et al., 2014).
Here, we report results from the first analysis of population structure on the entire collection of 14,000 unique soybean accessions, which included G. max and G. soja accessions. A GWAS for seed protein and oil
content on over 12,000 unique G. max accessions was performed, which is the largest GWAS conducted in plants reported to date. We determined the distribu-tion of favorable alleles among subpopulations defined by world region and maturity group (MG) of the 12,000 accessions. The results reported herein provide a fuller understanding of the distribution of genetic variation contained within the collection and how it relates to phe-notypic variation for economically important traits.
Materials and Methods
Plant MaterialsThe accessions used in this study are from the USDA Soybean Germplasm Collection. The entire collection consists of nearly 22,000 accessions, including modern and land race cultivars (G. max), wild relatives of soy-bean (G. soja), and perennial Glycine (www.soybase.org). From the whole set, we selected only the annual acces-sions and dropped accessions determined to be genotypic duplicates (e.g., near-isogenic lines, non-US duplicates). This filtering left 14,430 unique accessions (Supplemen-tal Fig. S1) collected from 85 countries (Supplemental Table S1; Supplemental Fig. S2a) representing the range of photoperiod and temperature latitudinal adapta-tion as defined by a MG Roman numeral designation (Supplemental Table S2; Supplemental Fig. S2b). Further information for each accession (accession name, acces-sion number, country of origin, etc.) can be found in the USDA Germplasm Resources Information Network (GRIN) database (www.ars-grin.gov).
Genotype and Phenotype DataGenotype data consisted of 52,041 SNPs scored on 14,430 germplasm accessions using the Illumina Infinium SoyS-NP50K BeadChip as described by Song et al. (2013). Sin-gle nucleotide polymorphism genotyping was conducted on the Illumina platform by following the InfiniumH HD Assay Ultra Protocol (Illumina, Inc.). The SNPs were scored using the GenomeStudio Genotyping Module v1.8.4 (Illumina, Inc.). The SNP data is publicly available at http://www.soybase.org/dlpages/index.php. Markers with minor allele frequency (MAF) <0.05 were removed from the genotype dataset, leaving 36,513 SNPs for the population structure analysis.
Existing oil and protein content data made available by the USDA GRIN was used for the analysis. The phe-notype data were originally obtained from field evalua-tions conducted by USDA–ARS germplasm curation staff and their collaborators. The field evaluations were con-ducted at various locations at which accessions from one or more MG classes had adaptation, and such field tri-als often spanned several years. Details and publication references relative to the methods used to quantify soy-bean seed protein and oil content are provided in GRIN (http://www.ars-grin.gov/cgi-bin/npgs/html/desc_form.pl?51; scroll down to oil and protein in list of descrip-tors). In brief, since 1990, accessions with yellow seed
bandillo et al.: usda soybean germplasm collection 3 of 13
coats have been evaluated for protein and oil concentra-tions using the near-infrared reflectance method on a whole-seed sample. For those accessions with entirely pigmented or exceptionally mottled seed coats, seed pro-tein was quantified with the Kjeldahl method and seed oil with the Butt extraction method. The Kjeldahl and Butt methods were also used in all pre-1990 evaluations. Using this existing phenotypic information, a total of 12,116 G. max accessions were identified that had seed oil and protein data (Supplemental Fig. S1). The phenotypic data used for the GWAS is summarized by accession number in Supplemental Table S3.
Population StructureThe model-based clustering algorithm of ADMIXTURE v1.22 was used (Alexander et al., 2009) to investigate sub-population structure of the 14,430 soybean accessions. ADMIXTURE identifies K genetic clusters, where K is specified by the user, from the provided SNP data. For each individual, the ADMIXTURE method estimates the probability of membership to each cluster. A preliminary analysis was performed in multiple runs by inputting successive values of K from 3 to 20. This tested range of K-inputs was based on the results of several studies that estimated the number of subpopulations (Hwang et al., 2014; Hyten et al., 2007; Sonah et al., 2015). A 10-fold CV procedure was performed with 30 different fixed initial seeds for each K-value. The most likely K-value was deter-mined using ADMIXTURE’s CV values. The software CLUMPP (Jakobsson and Rosenberg, 2007) was used to obtain the optimal alignments of 30 replicates for each K-value. Individual genotype membership proportions were averaged across runs according to the permutation with the greatest symmetric similarity coefficient. The output from CLUMPP for the optimal K was used to make plots using the cluster visualization program in R. To ver-ify the proportion of correct and incorrect classifications, we performed a linear discriminant analysis using the ancestry estimates for each accession with K = 5. Principal component analysis was also conducted to summarize the genetic structure and variation present in the collection. The hierarchical F statistics were used to estimate propor-tion of genetic variance explained by world region and MG class using ancestry estimates for K = 5 and calculated using the hierfstat R package (Goudet, 2005).
Genome-Wide Association AnalysisMarker–trait associations were tested using a linear mixed model:
y = X + C + Zu + e
where y is a vector of phenotypes, is a vector of fixed marker effects, is a vector of subpopulation effects, u is a vector of polygenic effects caused by relatedness where ( )s
20, uu MVN K , e is a vector of residuals where ( )s
20, ee MVN I , X is a marker matrix, C is an incidence matrix containing membership proportions to each of
the five genetic clusters identified by the ADMIXTURE analysis, and Z is the corresponding design matrix for u. The matrix K is the realized relationship matrix esti-mated internally in the Factored Spectrally Transformed Linear Mixed Models (FaST-LMM) using the SNP data (Lippert et al., 2011).
The above model was implemented using the FaST-LMM algorithm (Lippert et al., 2011). This program is designed to accommodate large datasets with reduced computational time (Lippert et al., 2011). The FaST-LMM uses either maximum likelihood or restricted maxi-mum likelihood. Maximum likelihood was used for this study because it has been found to be more reliable (Eu-ahsunthornwattana et al., 2014). The FaST-LMM uses an exact method in which the additive genetic and residual variance components are re-estimated for each SNP in a model, including the marker effect, rather than being estimated under the null hypothesis.
Association analyses were conducted both across and within groups of accessions classified by either MG or world region class (Supplemental Tables S1, S2). Genome-wide association mapping across all groups was conducted using SNP with MAF > 0.01, and population structure was accounted for using both and u. Genome-wide association mapping within groups was performed using SNP with MAF > 0.05; was ignored and only u was fitted as a random effect as described above.
The method of Li and Ji (2005) was used to calculate a comparison-wise error rate to control the experiment-wise error rate. Briefly, the correlation matrix and eigen-value decomposition among 36,513 SNPs were calculated to determine effective number of independent tests (Meff). The test criteria was then adjusted using the Meff with the following correction (Sidak, 1967):
a = - -a eff1/p e1 (1 ) M ,
where p is the comparison-wise error rate and e is the experiment-wise error rate. An e = 0.05 was used in this study.
Multiple-linear regression was used to estimate the proportion of phenotypic variance accounted for by signifi-cant SNPs after accounting for population structure effects. Windows of 500 kilobase (kb) were used to define SNPs tagging a locus. Only the most significant SNPs present within a 500-kb window was used to tag that locus.
Haplotype AnalysisHaplotype blocks were constructed using the four-gamete method (Wang et al., 2002) implemented in the software Haploview (Barrett et al., 2005). The four-gamete method creates block boundaries where there is evidence of recombination between adjacent SNPs based on the presence of all four gametic types. A cutoff of 1% was used, meaning that if addition of a SNP to a block resulted in a recombinant allele at a frequency exceeding 1%, then that SNP was not included in the block.
4 of 13 the plant genome november 2015 vol. 8, no. 3
The frequencies of identified haplotype alleles were estimated in all accessions and within each subpopula-tion. At each haplotype block, a Fisher’s exact test was used to test the null hypothesis that the frequency of the haplotype alleles for seed oil and protein content was the same across all subpopulations.
Results and Discussion
The USDA Soybean Germplasm CollectionOf the 19,652 genotyped accessions in the publicly avail-able SNP data set, 659 near-isogenic lines of multiple G. max cultivars were removed, but the recurrent and donor parents of those near-isogenic lines were retained. An additional 4207 G. max and 362 G. soja accessions were SNP genotype duplicates (i.e., 24%) and thus were removed. The high rate of redundant and highly similar accessions detected in the USDA Soybean Germplasm Collection is not surprising because genetic redundancy is a common problem in germplasm collections (Food and Agriculture Organization of the United Nations, 2010; McCouch et al., 2012). It is estimated that in world-wide collections, only one-third of the total number of accessions conserved ex situ are distinct and duplica-tions occur within and between genebanks of the same crop (Food and Agriculture Organization of the United Nations, 2010; McCouch et al., 2012). The major cause is the unwitting submission of the same accession with dif-ferent names and designation. Based on phenotype alone, it is not possible to identify redundant accessions, yet the maintenance of duplicated materials invokes unneces-sary and costly efforts. After eliminating all genotypic duplicates (one accession per set of duplicates was retained), a final set of 14,430 genotyped accessions (i.e., 13,624 G. max and 806 G. soja accessions) was available for population structure analysis (Supplemental Fig. S1).
Geographic origin and MG were the principal deter-minants of population structure within the soybean germplasm collection. Accessions collected from China (36%), North and South Korea (19%), Japan (17%), North and South America (9%), South and Southeast Asia (8%), Europe (5%), and Russia (5%) make up the vast majority of the collection (Supplemental Fig. S2a). Soybeans are clas-sified into 13 unique MG Roman numeral groups from very early to very late (000, 00, 0, I, II, III, IV, V, VI, VII, VIII, IX, and X) based on temperature and photoperiod response to latitude. Maturity Group numbers of 000, 00, and 0 were combined, as were MG numbers VII, VIII, IX, and X to reduce the 13 numbered MGs to just eight more manageable MG classes for use in the population structure analysis (Supplemental Fig. S2b). Maturity Groups II, III, IV, and V represent over 50% of the entire collection.
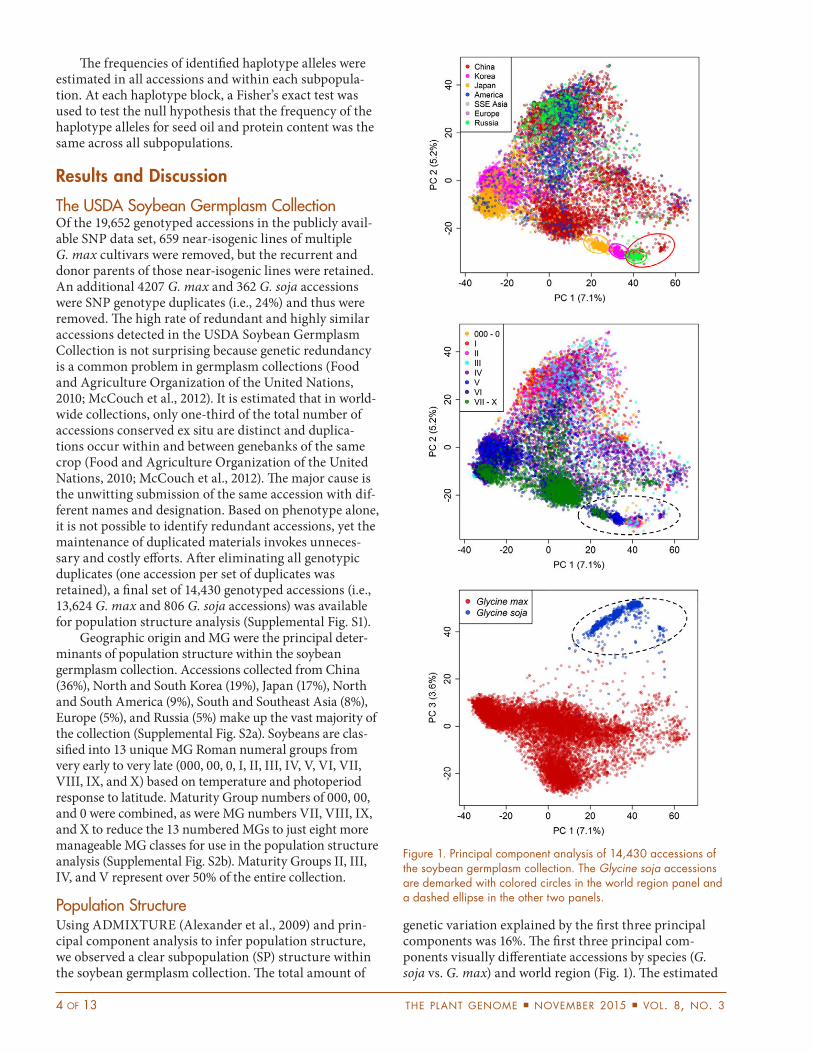
Population StructureUsing ADMIXTURE (Alexander et al., 2009) and prin-cipal component analysis to infer population structure, we observed a clear subpopulation (SP) structure within the soybean germplasm collection. The total amount of
genetic variation explained by the first three principal components was 16%. The first three principal com-ponents visually differentiate accessions by species (G. soja vs. G. max) and world region (Fig. 1). The estimated
Figure 1. Principal component analysis of 14,430 accessions of the soybean germplasm collection. The Glycine soja accessions are demarked with colored circles in the world region panel and a dashed ellipse in the other two panels.

bandillo et al.: usda soybean germplasm collection 5 of 13
cross-validation (CV) error from ADMIXTURE and cor-respondent CV values suggested the presence of four to eight natural SPs (K = 4–8) within the collection (Supple-mental Fig. S3). A K-value of 5 was ultimately chosen because higher K-values resulted in SPs in which no accessions belonged (based on an 80% membership cut-off). Accessions within a subpopulation with member-ship coefficients of <0.8 were considered admixed. The graphs of ancestry estimate for each accession for five SPs was plotted by world region and MG class (Fig. 2).
Subpopulation 1 represents the G. soja accessions that can be traced from China, Japan, Korea, and Russia (Fig. 1, 2a; Supplemental Table S4, S5). Subpopulation 1 is well represented in the MG classes. Notably, a single G. max accession with GRIN ID of PI 549045A falls into the G. soja SP. Although this accession has many wild soy-bean characteristics, it has a plant type very atypical of wild soybean, which caused it to be classified as G. max. Subpopulations 2 to 5 represent the G. max accessions (Fig. 2a, 2b; Supplemental Table S4), which consisted of a mixture of accessions from different world regions and MG classes (Supplemental Table S5, S6). Subpopulation
3 is composed predominantly of accessions of the late MG class (i.e., V, VI, and VII-X), which are mostly from China and South and Southeast Asia, whereas SP5 con-tains a significant proportion of early MG accessions (i.e., 000–0, I, and II), mainly originating from China and Far East Russia. Subpopulation 4 forms a unique SP comprised primarily of accessions from Japan (61%) and Korea (34%). Subpopulation 2 contains only 12 acces-sions from China and Europe, mainly from MG II plus a single accession from MG III. Subpopulation 2 had the highest mean ancestry shared to accessions from America (31%) and Europe (30%) (Supplemental Table S7). Nearly two-thirds of the accessions in the soybean germplasm collection are admixed (Supplemental Tables S5, S6). A large portion of admixed accessions generally traced to China, Korea, America, and Europe. Notably, more than 90% of accessions from America and Europe are admixed. The proportion of individuals for each world region and MG within each of the five subpopula-tions was not equal, indicating different degrees of allelic diversity across subpopulations. Japanese accessions were more homogenous and mostly belonged to SP4.
Figure 2. Population structure in the soybean germplasm collection inferred by ADMIXTURE. The number of clusters (K) present in the entire population of 14,430 accessions was judged to be K = 5. Each colored vertical line in the (a) world region or (b) MG class rep-resents an individual accession that was assigned proportionally to the one of the five clusters.
6 of 13 the plant genome november 2015 vol. 8, no. 3
Similarly, the overrepresentation of accessions from some MG classes in SP3 and SP5 was due to the sensitivity of soybean to photoperiod and temperature, which restricts adaptability to compatible regions of latitude.
Another interesting result from the population struc-ture analysis is the relationship between China, SSE Asia, Japan, and Korea accessions. Accessions from Japan and Korea were more closely related to each other than with accessions from China. Accessions from Japan form a unique subpopulation (SP4), whereas those from Korea consist of mostly an admixture between SP4 and SP5 (Fig. 2a), possibly reflecting the migration of soybean from northeast China to Korea. The homogeneous subpopula-tion structure among the Japan accessions could be due to the isolation of Japan by sea from China and Korea and the fact that Japan was never conquered by China (Hall, 1988). The earlier MG classes appear to contain more SP5 ancestry (Fig. 2b), reflecting the latitude of where North Korea is connected to China relative to ancient soybean trade routes. Subpopulation 3 is clearly a significant frac-tion in China and SSE Asia, suggesting a substantial move-ment of G. max accessions into nearby Asian countries.
Based on population structure results, we then evaluated the genetic relationships of the major ancestors of American soybean (Gizlice et al., 1994; Li and Nelson, 2001; Ude et al., 2003) to accessions within the collection. Two of 34 US soybean ancestors, the well-known ances-tors A.K. Harrow and Illini, were found to be completely SNP identical. The majority of American accession ancestry belong to SP2 and SP5 (59%), whereas only 44% of China accessions ancestry belong to these SPs (Supple-mental Table S7). As expected, the ancestors of American soybean, which originated from China, mostly share ancestry with SP2 and SP5 (49%) (Fig. 3; Supplemental Table S7), reflecting the ancestry of American germplasm as a whole. This analysis is complicated by the fact that ancestors of American soybean germplasm contributed at different pedigree levels (Fig. 3) (Gizlice et al., 1994; Li and Nelson, 2001; Ude et al., 2003), coupled with the fact that the American soybean germplasm resulted from a severe population bottleneck when soybeans were intro-duced to North America (Hyten et al., 2006).
Hierarchical F-statistics, calculated using ancestry estimates for K = 5, showed that genetic differentiation explained by world region (~5%) was higher than that explained by MG (~2%). The results of discriminant analysis supports this finding with the overall correct classification being greater for geographic origin (53%) than for MG class (35%) based on the GRIN classifica-tions. Although the amount of total variation explained is small, these results suggest that population structure in the USDA Germplasm Collection is driven more by world region than MG.
Genome-Wide Association Study for Protein and OilA GWAS was conducted solely on the G. max accessions to avoid confounding effects of strong subpopulation
structure that would arise by combining the G. max and the G. soja accessions. Genotype data and seed oil and pro-tein content data were available for 12,116 G. max acces-sions (Supplemental Fig. S1). Phenotype data were obtained from the GRIN soybean database (Supplemental Table S3). As expected, protein had significant negative correlation to oil (r = −0.62; p < 0.0001) across world region and MG. The same negative relationship was observed for oil vs. protein within world region or MG classes.
A GWAS was performed using all 12,116 G. max accessions (Fig. 4) and then for subsets of accessions based on world region and MG class (Supplemental Fig. S4a,b, S5a,b). A total of 19 significant associations (−logP > 5. 17) were identified for protein (Fig. 4; Table 1). Clusters of highly significant markers were present on chromo-somes 15 (3.82–3.96 Mb) and 20 (29.59–31.97 Mb), which collectively explained 7% of the phenotypic variance for protein. The GWAS for oil detected 18 significantly associated SNP markers (−logP > 5. 17), with the stron-gest association detected at 3.82 Mb on chromosome 15 (Fig. 4; Table 1). Collectively, the three QTL identified for oil explained 6% of the phenotypic variance. The major associations detected on chromosomes 15 (LG-E) and 20 (LG-I) were highly significant for both protein and oil and had map positions close to those identified for the corresponding LGs identified in the very first soybean QTL mapping experiment (Diers et al., 1992). These two QTL have been detected repeatedly in linkage mapping studies since then (http://www.soybase.org/search/qtllist_by_symbol.php). Allelic effect estimates of SNP markers showed negative genic relationship between protein and oil content (Table 1), that is, the SNP allele associated with increased protein content was also always associated with decreased oil content and vice versa.
A GWAS within the world region identified at least one or both of the strongest regions on chromosomes 15 and 20 for protein and oil, except within the America and SSE Asia accession subsets (Supplemental Fig. S4a,b, S5a,b). The strongest associations for protein (−logP = 14.52) and oil (−logP = 14.22) among world region classes were in Korea (Supplemental Fig. S4a,b). Similarly, GWAS results based on different MG classes detected the same genomic regions for protein and oil on either chro-mosomes 15 and 20, except in the cases of the MG I class or MG II class for protein and for the MG IV class for oil (Supplemental Fig. S5a,b). The strongest associations for both traits were identified in the late MG classes of V (−logP for oil = 13.95) and VII through X (−logP for protein = 19.83). The chromosomal bp resolution of the identified QTL on chromosomes 15 and 20 varied among world region and MG classes. For example, on chromosome 20, the resolution of associated SNPs for protein and oil spanned only 8 Mb region between 26 and 32 Mb, which corresponds to the narrowed region defined by Bolon et al. (2010). The highest resolution was achieved when all 12,000 accessions were combined for GWAS, demon-strating the advantage of exploiting diversity and thus greater historical recombination for increased resolution.

bandillo et al.: usda soybean germplasm collection 7 of 13
In the recent GWA analysis, Vaughn et al. (2014) used accessions almost exclusively from Korea and which were mostly of MG V. The GWA results in this study using accessions from Korea and MG V had the associ-ated SNPs for protein identified between 29.20 and 31.97 Mb, with the strongest associated SNP similar to the one identified by Vaughn et al. (2014) at 31,972,955 bp on
chromosome 20. However, the association at 31,972,955 bp is entirely not detected when the GWA analysis was limited to other world region and MG classes. Rather, an association was detected at an even higher level of significance for protein using late MG class VII through X at 31.24 Mb (−logP = 19.83) on chromosome 20, which is consistent to the most significant SNP detected using
Figure 3. Plot of ancestry estimates inferred by ADMIXTURE for 34 US soybean ancestors. Each colored vertical bar represents an ancestral accession that was assigned proportionally to the K clusters (K = 5) with the proportions represented by the relative lengths of the K colors. The bar width reflects the percentage (>2%) contribution of the major ancestors according to Gizlice et al. (1994), Li and Nelson (2001), and Ude et al. (2003).

8 of 13 the plant genome november 2015 vol. 8, no. 3
Figu
re 4
. Gen
ome-
wid
e as
soci
atio
n sc
ans
for 1
2,11
6 G
lyci
ne m
ax a
cces
sion
s fo
r see
d pr
otei
n an
d oi
l con
tent
. Man
hatta
n pl
ots
show
the
asso
ciat
ions
for s
eed
prot
ein
and
oil w
ith s
ingl
e nu
cleo
tide
poly
mor
phis
m m
arke
rs th
at a
re p
lotte
d on
the
x-ax
is a
ccor
ding
to th
eir p
hysi
cal p
ositi
on o
n ea
ch c
hrom
osom
e. T
he s
olid
hor
izon
tal l
ine
deno
tes
the
calc
ulat
ed th
resh
old
valu
e fo
r dec
larin
g si
gnifi
cant
ass
ocia
tion.
The
das
hed
verti
cal l
ines
indi
cate
a s
igni
fican
t ass
ocia
tion
for b
oth
seed
pro
tein
and
oil
cont
ent h
ad a
col
ocal
ized
chr
omos
omal
pos
ition
.
bandillo et al.: usda soybean germplasm collection 9 of 13
all 12,116 G. max accessions. Similarly, the significant SNP reported by Hwang et al. (2014) between 29.39 and 29.98 Mb on chromosome 20 was missed among MGs, but that SNP was identified in MG classes I, III, and IV if −logP threshold was lowered to 4.0. Although the associations were detected when the threshold stringency was reduced, the association threshold of −logP = 4 is still more stringent than the −logP = 3 that Hwang et al. (2014) used in GWA analysis using 298 G. max acces-sions from MGs II, III, and IV. The varying results of GWAS within SP classes can be due to differing levels of recombination, diversity, as well as rate of linkage disequilibrium (LD) decay across the assembled panels. Notably, as mentioned above, the highest resolution was achieved when the GWA analysis was conducted using all G. max accessions.
Refining the Candidate Region for Protein and OilThe levels of significance for protein and oil QTL were quite high in this study and thus could be used to delin-eate a narrower base pair region for the identification of candidate genes. This was clearly illustrated in the region detected on chromosome 20 for both protein and oil content, which colocated with a previously reported QTL
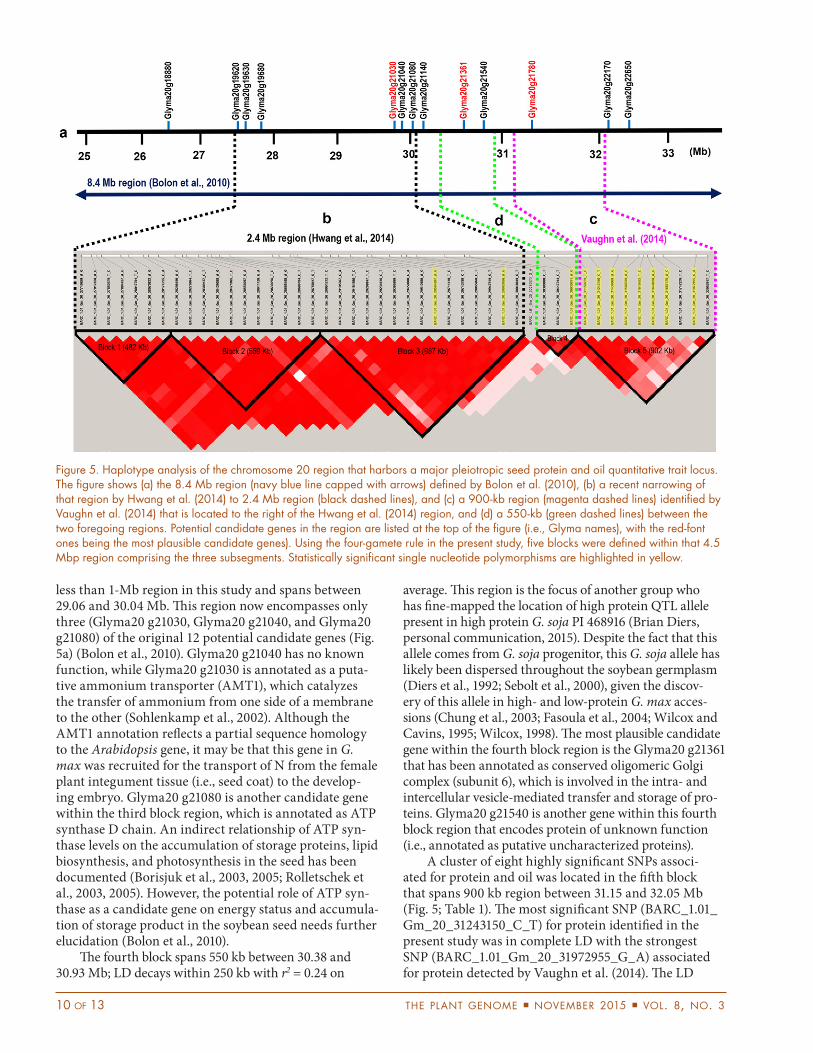
responsible for major pleiotropic effects on protein and oil content (Bolon et al., 2010; Hwang et al., 2014; Nichols et al., 2006). A previous study showed that the QTL resides in an 8.4-Mb region located between 24.5 and 32.9 Mb on chromosome 20 (Bolon et al., 2010). Subsequently, that region was narrowed further to a 2.4-Mb region located between 27.6 and 30.0 Mb (Hwang et al., 2014). Vaughn et al. (2014), however, mapped this same QTL approximately 1 Mb downstream of the region that Hwang et al. (2014) identified, with the most significant SNP identified at 31,972,955 bp. To further refine this candidate region, a haplotype analysis was performed in this study covering the genomic regions identified by Hwang et al. (2014) and Vaughn et al. (2014) that spans a ~4.5-Mb region. Within the entire collection, LD in that 4.5-Mb region decays from r2 = 0.50 to r2 = 0.40 within 250 kb, then decays more slowly to r2 = 0.20 from 500 to 1000 kb. A haplotype block analysis of this 4.5-Mb region identified five haplo-type blocks (Fig. 5), with highly significant SNPs located in the third, fourth, and fifth blocks. The fourth and fifth blocks contain significant SNPs associated for both oil and protein, while the third block includes the SNP asso-ciated with protein only (Fig. 5; Table 1).
The third block contains the region defined by Hwang et al. (2014), which is further narrowed down to
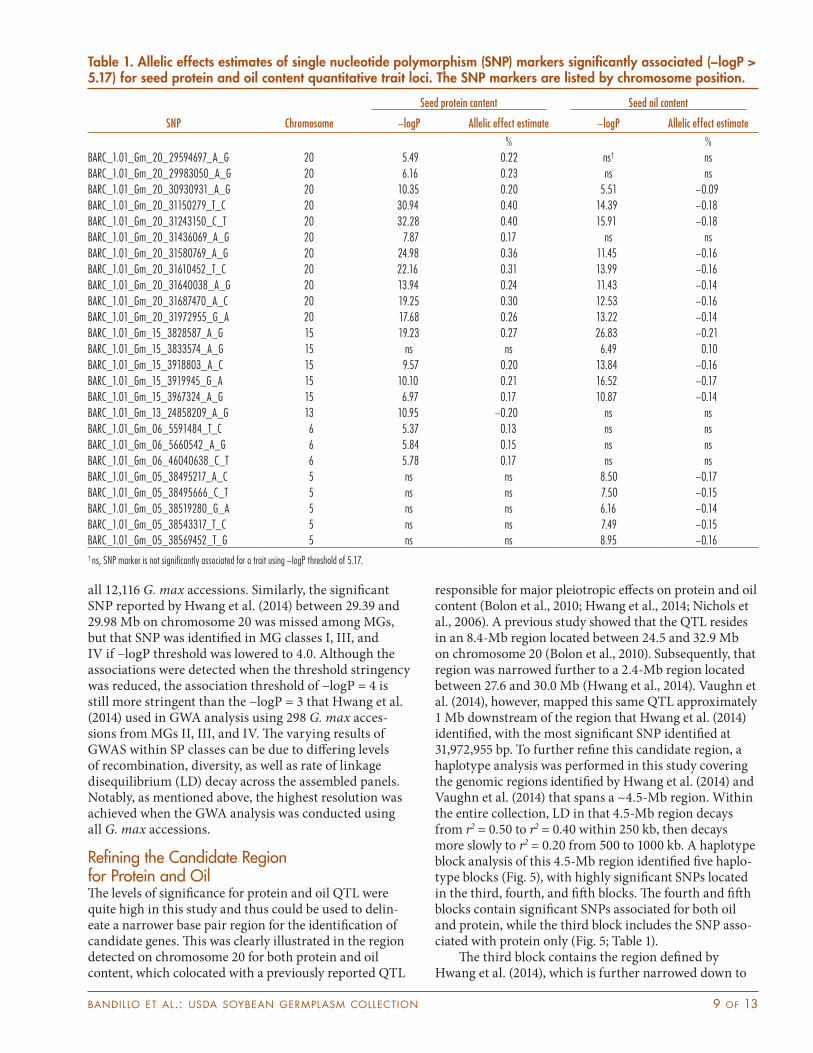
Table 1. Allelic effects estimates of single nucleotide polymorphism (SNP) markers significantly associated (−logP > 5.17) for seed protein and oil content quantitative trait loci. The SNP markers are listed by chromosome position.
SNP Chromosome
Seed protein content Seed oil content
−logP Allelic effect estimate −logP Allelic effect estimate
% %BARC_1.01_Gm_20_29594697_A_G 20 5.49 0.22 ns† nsBARC_1.01_Gm_20_29983050_A_G 20 6.16 0.23 ns nsBARC_1.01_Gm_20_30930931_A_G 20 10.35 0.20 5.51 −0.09BARC_1.01_Gm_20_31150279_T_C 20 30.94 0.40 14.39 −0.18BARC_1.01_Gm_20_31243150_C_T 20 32.28 0.40 15.91 −0.18BARC_1.01_Gm_20_31436069_A_G 20 7.87 0.17 ns nsBARC_1.01_Gm_20_31580769_A_G 20 24.98 0.36 11.45 −0.16BARC_1.01_Gm_20_31610452_T_C 20 22.16 0.31 13.99 −0.16BARC_1.01_Gm_20_31640038_A_G 20 13.94 0.24 11.43 −0.14BARC_1.01_Gm_20_31687470_A_C 20 19.25 0.30 12.53 −0.16BARC_1.01_Gm_20_31972955_G_A 20 17.68 0.26 13.22 −0.14BARC_1.01_Gm_15_3828587_A_G 15 19.23 0.27 26.83 −0.21BARC_1.01_Gm_15_3833574_A_G 15 ns ns 6.49 0.10BARC_1.01_Gm_15_3918803_A_C 15 9.57 0.20 13.84 −0.16BARC_1.01_Gm_15_3919945_G_A 15 10.10 0.21 16.52 −0.17BARC_1.01_Gm_15_3967324_A_G 15 6.97 0.17 10.87 −0.14BARC_1.01_Gm_13_24858209_A_G 13 10.95 −0.20 ns nsBARC_1.01_Gm_06_5591484_T_C 6 5.37 0.13 ns nsBARC_1.01_Gm_06_5660542_A_G 6 5.84 0.15 ns nsBARC_1.01_Gm_06_46040638_C_T 6 5.78 0.17 ns nsBARC_1.01_Gm_05_38495217_A_C 5 ns ns 8.50 −0.17BARC_1.01_Gm_05_38495666_C_T 5 ns ns 7.50 −0.15BARC_1.01_Gm_05_38519280_G_A 5 ns ns 6.16 −0.14BARC_1.01_Gm_05_38543317_T_C 5 ns ns 7.49 −0.15BARC_1.01_Gm_05_38569452_T_G 5 ns ns 8.95 −0.16† ns, SNP marker is not significantly associated for a trait using −logP threshold of 5.17.
10 of 13 the plant genome november 2015 vol. 8, no. 3
less than 1-Mb region in this study and spans between 29.06 and 30.04 Mb. This region now encompasses only three (Glyma20 g21030, Glyma20 g21040, and Glyma20 g21080) of the original 12 potential candidate genes (Fig. 5a) (Bolon et al., 2010). Glyma20 g21040 has no known function, while Glyma20 g21030 is annotated as a puta-tive ammonium transporter (AMT1), which catalyzes the transfer of ammonium from one side of a membrane to the other (Sohlenkamp et al., 2002). Although the AMT1 annotation reflects a partial sequence homology to the Arabidopsis gene, it may be that this gene in G. max was recruited for the transport of N from the female plant integument tissue (i.e., seed coat) to the develop-ing embryo. Glyma20 g21080 is another candidate gene within the third block region, which is annotated as ATP synthase D chain. An indirect relationship of ATP syn-thase levels on the accumulation of storage proteins, lipid biosynthesis, and photosynthesis in the seed has been documented (Borisjuk et al., 2003, 2005; Rolletschek et al., 2003, 2005). However, the potential role of ATP syn-thase as a candidate gene on energy status and accumula-tion of storage product in the soybean seed needs further elucidation (Bolon et al., 2010).
The fourth block spans 550 kb between 30.38 and 30.93 Mb; LD decays within 250 kb with r2 = 0.24 on
average. This region is the focus of another group who has fine-mapped the location of high protein QTL allele present in high protein G. soja PI 468916 (Brian Diers, personal communication, 2015). Despite the fact that this allele comes from G. soja progenitor, this G. soja allele has likely been dispersed throughout the soybean germplasm (Diers et al., 1992; Sebolt et al., 2000), given the discov-ery of this allele in high- and low-protein G. max acces-sions (Chung et al., 2003; Fasoula et al., 2004; Wilcox and Cavins, 1995; Wilcox, 1998). The most plausible candidate gene within the fourth block region is the Glyma20 g21361 that has been annotated as conserved oligomeric Golgi complex (subunit 6), which is involved in the intra- and intercellular vesicle-mediated transfer and storage of pro-teins. Glyma20 g21540 is another gene within this fourth block region that encodes protein of unknown function (i.e., annotated as putative uncharacterized proteins).
A cluster of eight highly significant SNPs associ-ated for protein and oil was located in the fifth block that spans 900 kb region between 31.15 and 32.05 Mb (Fig. 5; Table 1). The most significant SNP (BARC_1.01_Gm_20_31243150_C_T) for protein identified in the present study was in complete LD with the strongest SNP (BARC_1.01_Gm_20_31972955_G_A) associated for protein detected by Vaughn et al. (2014). The LD
Figure 5. Haplotype analysis of the chromosome 20 region that harbors a major pleiotropic seed protein and oil quantitative trait locus. The figure shows (a) the 8.4 Mb region (navy blue line capped with arrows) defined by Bolon et al. (2010), (b) a recent narrowing of that region by Hwang et al. (2014) to 2.4 Mb region (black dashed lines), and (c) a 900-kb region (magenta dashed lines) identified by Vaughn et al. (2014) that is located to the right of the Hwang et al. (2014) region, and (d) a 550-kb (green dashed lines) between the two foregoing regions. Potential candidate genes in the region are listed at the top of the figure (i.e., Glyma names), with the red-font ones being the most plausible candidate genes). Using the four-gamete rule in the present study, five blocks were defined within that 4.5 Mbp region comprising the three subsegments. Statistically significant single nucleotide polymorphisms are highlighted in yellow.
bandillo et al.: usda soybean germplasm collection 11 of 13
decay within this region was calculated to be 400 kb on average with r2 = 0.32 and a candidate gene was identi-fied within the target region. Only one of the annotated genes (Glyma20 g21780) identified by Bolon et al. (2010) was located within the 900 kb defined region in the fifth block. The gene Glyma20 g21780 located at 31.38 Mb encodes an ethylene receptor and was demonstrated to be involved in signal transduction and protein histidine kinase activity (Bolon et al., 2010; www.soybase.org).
On chromosome 15, a significant region was detected for protein and oil across all accessions with a high resolution of less than 150 kb between 3.82 and 3.96 Mb. The LD decay within this region was estimated at 165 kb with r2 = 0.23, on average. This detected QTL colocalizes with the three candidate genes (Glyma15 g05470, Glyma15 g05760, and Glyma15 g05770), which could be related to seed protein and oil levels. Glyma15 g05470 encodes a RAG1-activating protein, which is a soybean ortholog of the Arabidopsis Nodulin MtN3 family protein involved in sucrose transmembrane transporter activity. Glyma15 g05760 encodes for sulfate transporter, where, in soybean, sulfate accumulates in pods and decreases with the onset of grain enlargement (Sunarpi, 1996; Tabe and Droux, 2001). Glyma15 g05770 has a protease inhibitor activity and is involved in lipid transfer for seed storage protein (Wang et al., 2007). The synthesis of storage products during seed development is coordinated with carbohydrate and N metabolic pro-cesses involving many transporters, including ammo-nium and sulfate transporters (Weber et al., 1998).
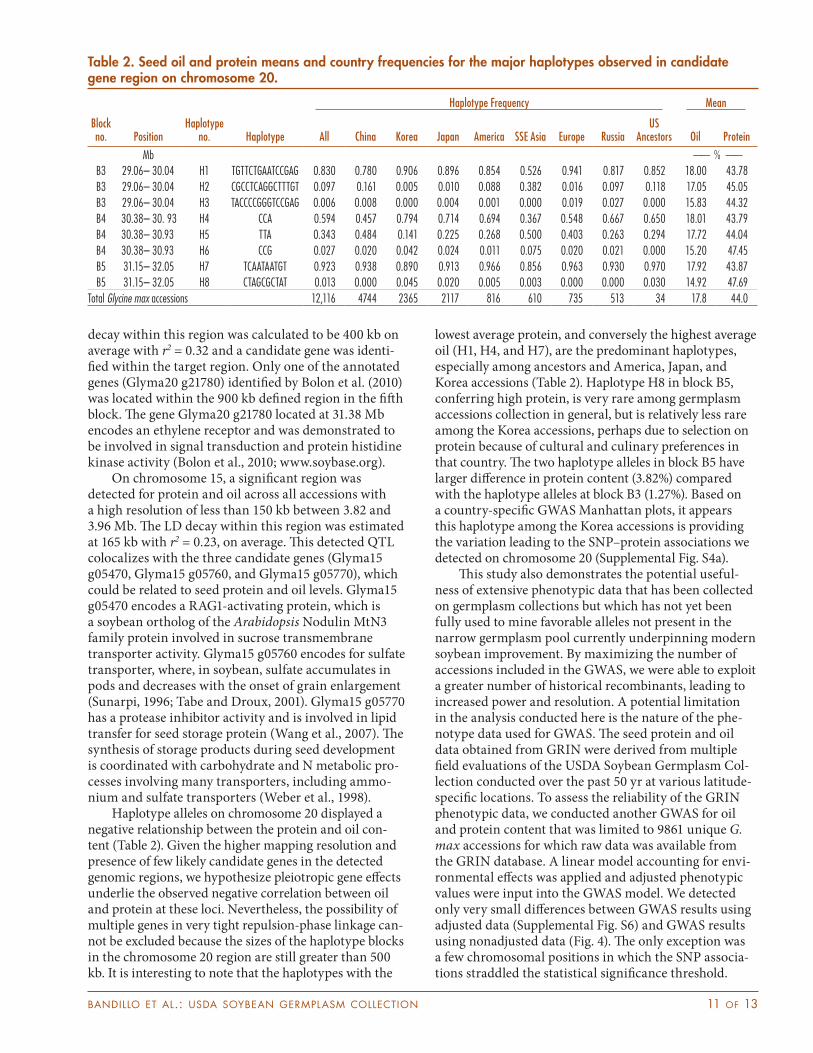
Haplotype alleles on chromosome 20 displayed a negative relationship between the protein and oil con-tent (Table 2). Given the higher mapping resolution and presence of few likely candidate genes in the detected genomic regions, we hypothesize pleiotropic gene effects underlie the observed negative correlation between oil and protein at these loci. Nevertheless, the possibility of multiple genes in very tight repulsion-phase linkage can-not be excluded because the sizes of the haplotype blocks in the chromosome 20 region are still greater than 500 kb. It is interesting to note that the haplotypes with the
lowest average protein, and conversely the highest average oil (H1, H4, and H7), are the predominant haplotypes, especially among ancestors and America, Japan, and Korea accessions (Table 2). Haplotype H8 in block B5, conferring high protein, is very rare among germplasm accessions collection in general, but is relatively less rare among the Korea accessions, perhaps due to selection on protein because of cultural and culinary preferences in that country. The two haplotype alleles in block B5 have larger difference in protein content (3.82%) compared with the haplotype alleles at block B3 (1.27%). Based on a country-specific GWAS Manhattan plots, it appears this haplotype among the Korea accessions is providing the variation leading to the SNP–protein associations we detected on chromosome 20 (Supplemental Fig. S4a).
This study also demonstrates the potential useful-ness of extensive phenotypic data that has been collected on germplasm collections but which has not yet been fully used to mine favorable alleles not present in the narrow germplasm pool currently underpinning modern soybean improvement. By maximizing the number of accessions included in the GWAS, we were able to exploit a greater number of historical recombinants, leading to increased power and resolution. A potential limitation in the analysis conducted here is the nature of the phe-notype data used for GWAS. The seed protein and oil data obtained from GRIN were derived from multiple field evaluations of the USDA Soybean Germplasm Col-lection conducted over the past 50 yr at various latitude-specific locations. To assess the reliability of the GRIN phenotypic data, we conducted another GWAS for oil and protein content that was limited to 9861 unique G. max accessions for which raw data was available from the GRIN database. A linear model accounting for envi-ronmental effects was applied and adjusted phenotypic values were input into the GWAS model. We detected only very small differences between GWAS results using adjusted data (Supplemental Fig. S6) and GWAS results using nonadjusted data (Fig. 4). The only exception was a few chromosomal positions in which the SNP associa-tions straddled the statistical significance threshold.
Table 2. Seed oil and protein means and country frequencies for the major haplotypes observed in candidate gene region on chromosome 20.
Block no. Position
Haplotype no. Haplotype
Haplotype Frequency Mean
All China Korea Japan America SSE Asia Europe RussiaUS
Ancestors Oil Protein
Mb —— % ——B3 29.06– 30.04 H1 TGTTCTGAATCCGAG 0.830 0.780 0.906 0.896 0.854 0.526 0.941 0.817 0.852 18.00 43.78B3 29.06– 30.04 H2 CGCCTCAGGCTTTGT 0.097 0.161 0.005 0.010 0.088 0.382 0.016 0.097 0.118 17.05 45.05B3 29.06– 30.04 H3 TACCCCGGGTCCGAG 0.006 0.008 0.000 0.004 0.001 0.000 0.019 0.027 0.000 15.83 44.32B4 30.38– 30. 93 H4 CCA 0.594 0.457 0.794 0.714 0.694 0.367 0.548 0.667 0.650 18.01 43.79B4 30.38– 30.93 H5 TTA 0.343 0.484 0.141 0.225 0.268 0.500 0.403 0.263 0.294 17.72 44.04B4 30.38– 30.93 H6 CCG 0.027 0.020 0.042 0.024 0.011 0.075 0.020 0.021 0.000 15.20 47.45B5 31.15– 32.05 H7 TCAATAATGT 0.923 0.938 0.890 0.913 0.966 0.856 0.963 0.930 0.970 17.92 43.87B5 31.15– 32.05 H8 CTAGCGCTAT 0.013 0.000 0.045 0.020 0.005 0.003 0.000 0.000 0.030 14.92 47.69
Total Glycine max accessions 12,116 4744 2365 2117 816 610 735 513 34 17.8 44.0
12 of 13 the plant genome november 2015 vol. 8, no. 3
Despite the success of the 12,000 GWAS in narrow-ing down the major candidate region, it was surprising how few genomic regions were found to be associated with protein and oil given the large number of QTL reported for these traits using biparental linkage map-ping populations (www.soybase.org). Only six regions were identified for both protein and oil, collectively explaining only 6 to 7% of the phenotypic variation. Many more associations were expected given the size of the panel used for the GWAS. These results agree with Vaughn et al. (2014) who used a similar population and phenotypic dataset, albeit it smaller and less genetically diverse. Hwang et al. (2014), using a much smaller panel size, identified many more associations using a more relaxed significance threshold. If we relaxed the thresh-old to that used by Hwang et al. (2014) the number of associations for protein and oil would be increased by four fold, with associations on 14 chromosomes. The lack of associations passing the more stringent statisti-cal threshold used in this study might be related to the distribution of allelic effects and frequencies in the col-lection. It is entirely possible that the genetic variation for these traits is controlled by a multitude of rare or low-frequency alleles, which are difficult to identify in GWAS. The QTL on chromosome 20 may be an indica-tion of such a genetic architecture. It can be seen that the haplotype alleles at blocks 4 and 5 that increase protein (and lower oil) are of very low frequency in the collec-tion (Table 2). It is unlikely this QTL would be detected were it not for its relatively large effect. Another possible reason for the lack of QTL detection is the confound-ing of QTL allele frequencies with population structure (Rincent et al., 2014). If frequency of alleles affecting pro-tein and oil are confounded with population structure, then correcting for population structure using the mixed linear model would reduce detection power. Haplotype allele frequencies do differ between world regions at the chromosome 20 QTL. Finally, epistasis is always a pos-sible cause. Determining the relative contribution of all possible causes to this missing heritability problem of soybean oil and protein was outside the scope of this research, but it certainly deserves further study.
The wealth of phenotypic diversity available in the soybean germplasm collection should be mined to help meet the demands of food production in the face of cli-mate change and ever-evolving pathogens. The results reported herein, and others surely to flow from this valuable resource, provide a fuller understanding of the distribution of genetic variation contained within the collection and its relation to phenotypic variation for economically important traits. Further characterization of the phenotypic diversity and its relationship to the genomic diversity will ultimately facilitate a more effi-cient and effective introgression of this diversity into elite varieties for continued genetic improvement.
ReferencesAlexander, D.H., J. Novembre, and K. Lange. 2009. Fast model-based
estimation of ancestry in unrelated individuals. Genome Res. 19:1655–1664. doi:10.1101/gr.094052.109
Barrett, J.C., B. Fry, J. Maller, and M.J. Daly. 2005. Haploview: Analysis and visualization of LD and haplotype maps. Bioinformatics 21:263–265. doi:10.1093/bioinformatics/bth457
Bolon, Y.T., B. Joseph, S.B. Cannon, M.A. Graham, B.W. Diers, A.D. Farmer, G.D. May, G.J. Muehlbauer, J.E. Specht, Z.J. Tu, N. Weeks, W.W. Xu, R.C. Shoemaker, and C.P. Vance. 2010. Complementary genetic and genomic approaches help characterize the linkage group I seed protein QTL in soybean. BMC Plant. Biol. 10:41. doi:10.1186/1471-2229-10-41
Borisjuk, L., T.H. Nguyen, T. Neuberger, T. Rutten, H. Tschiersch, B. Claus, I. Feussner, A.G. Webb, P. Jakob, H. Weber, U. Wobus, and H. Rol-letschek. 2005. Gradients of lipid storage, photosynthesis and plastid differentiation in developing soybean seeds. New Phytol. 167:761–776. doi:10.1111/j.1469-8137.2005.01474.x
Borisjuk, L., H. Rolletschek, S. Walenta, R. Panitz, U. Wobus, and H. Weber. 2003. Energy status and its control on embryogenesis of legumes: ATP distribution within Vicia faba embryos is developmen-tally regulated and correlated with photosynthetic capacity. Plant J. 36:318–329. doi:10.1046/j.1365-313X.2003.01879.x
Brummer, E.C., G.L. Graef, J. Orf, J.R. Wilcox, and R.C. Shoemaker. 1997. Mapping QTL for seed protein and oil content in eight soybean popula-tions. Crop Sci. 37:370–378. doi:10.2135/cropsci1997.0011183X003700020011x
Burton, J.W. 1987. Quantitative genetics results relevant to soybean breed-ing. In: J.R.Wilcox, editor, Soybeans: Improvement, production, and uses, Second ed. Agron. Monogr. 16. ASA, CSSA, SSSA, Madison, WI. p. 211–248.
Cavanagh, C.R., S. Chao, S. Wang, B.E. Huang, S. Stephen, S. Kiani, K. For-rest, C. Saintenac, G.L. Brown-Guedira, A. Akhunova, D. See, G. Bai, M. Pumphrey, L. Tomar, D. Wong, S. Kong, M. Reynolds, M.L. da Silva, H. Bockelman, L. Talbert, J.A. Anderson, S. Dreisigacker, S. Baenziger, A. Carter, V. Korzun, P.L. Morrell, J. Dubcovsky, M.K. Morell, M.E. Sorrells, M.J. Hayden, and E. Akhunov. 2013. Genome-wide compara-tive diversity uncovers multiple targets of selection for improvement in hexaploid wheat landraces and cultivars. Proc. Natl. Acad. Sci. USA 110:8057–8062. doi:10.1073/pnas.1217133110
Chung, J., H.L. Babka, G.L. Graef, P.E. Staswick, D.J. Lee, P.B. Cregan, R.C. Shoemaker, and J.E. Specht. 2003. The seed protein, oil, and yield QTL on soybean linkage group I. Crop Sci. 43:1053–1067. doi:10.2135/crop-sci2003.1053
Clemente, T.E., and E.B. Cahoon. 2009. Soybean oil: Genetic approaches for modification of functionality and total content. Plant Physiol. 151:1030–1040. doi:10.1104/pp.109.146282
Cober, E.R., and H.D. Voldeng. 2000. Developing high-protein, high-yield soybean populations and lines. Crop Sci. 40:39–42. doi:10.2135/cropsci2000.40139x
Csanadi, G., J. Vollmann, G. Stift, and T. Lelley. 2001. Seed quality QTLs identified in a molecular map of early maturing soybean. Theor. Appl. Genet. 103:912–919. doi:10.1007/s001220100621
Diers, B.W., P. Keim, W.R. Fehr, and R.C. Shoemaker. 1992. RFPL analysis of soybean seed protein and oil content. Theor. Appl. Genet. 83:608–612. doi:10.1007/BF00226905
Eu-ahsunthornwattana, J., E.N. Miller, M. Fakiola, S.M.B. Jeronimo, J.M. Blackwell, H.J. Cordell, and Wellcome Trust Case Control. 2014. Comparison of methods to account for relatedness in genome-wide association studies with family-based data. PLoS Genet. 10:e1004445. doi:10.1371/journal.pgen.1004445
Fasoula, V.A., D.K. Harris, and H.R. Boerma. 2004. Validation and designa-tion of quantitative trait loci for seed protein, seed oil, and seed weight from two soybean populations. Crop Sci. 44:1218–1225. doi:10.2135/cropsci2004.1218
Food and Agriculture Organization of the United Nations. 2010. The sec-ond report on the state of the world’s plant genetic resources for food and agriculture. FAO, Rome. http://www.fao.org/agriculture/crops/the-matic-sitemap/theme/seeds-pgr/sow/sow2/en/ (accessed 30 July 2015).
bandillo et al.: usda soybean germplasm collection 13 of 13
Gizlice, Z., T.E. Carter, and J.W. Burton. 1994. Genetic base for North Ameri-can public soybean cultivars released between 1947 and 1988. Crop Sci. 34:1143–1151. doi:10.2135/cropsci1994.0011183X003400050001x
Goudet, J. 2005. HIERFSTAT, a package for R to compute and test hier-archical F-statistics. Mol. Ecol. Notes 5:184–186. doi:10.1111/j.1471-8286.2004.00828.x
Hall, J.W. 1988. The Cambridge history of Japan. Cambridge Univ. Press, Cambridge, UK and New York.
Huang, X., X. Wei, T. Sang, Q. Zhao, Q. Feng, Y. Zhao, C. Li, C. Zhu, T. Lu, Z. Zhang, M. Li, D. Fan, Y. Guo, A. Wang, L. Wang, L. Deng, W. Li, Y. Lu, Q. Weng, K. Liu, T. Huang, T. Zhou, Y. Jing, W. Li, Z. Lin, E.S. Buckler, Q. Qian, Q.F. Zhang, J. Li, and B. Han. 2010. Genome-wide association studies of 14 agronomic traits in rice landraces. Nat. Genet. 42:961–967. doi:10.1038/ng.695
Hwang, E.Y., Q. Song, G. Jia, J.E. Specht, D.L. Hyten, J. Costa, and P.B. Cregan. 2014. A genome-wide association study of seed protein and oil content in soybean. BMC Genomics 15:1. doi:10.1186/1471-2164-15-1
Hyten, D.L., I.Y. Choi, Q. Song, R.C. Shoemaker, R.L. Nelson, J.M. Costa, J.E. Specht, and P.B. Cregan. 2007. Highly variable patterns of linkage disequilibrium in multiple soybean populations. Genetics 175:1937–1944. doi:10.1534/genetics.106.069740
Hyten, D.L., Q. Song, Y. Zhu, I. Choi, R.L. Nelson, J.M. Costa, J.E. Specht, R.C. Shoemaker, and P.B. Cregan. 2006. Impacts of genetic bottlenecks on soybean genome diversity. Proc. Natl. Acad. Sci. USA 103:16666–16671. doi:10.1073/pnas.0604379103
Jakobsson, M., and N.A. Rosenberg. 2007. CLUMPP: A cluster matching and permutation program for dealing with label switching and multi-modality in analysis of population structure. Bioinformatics 23:1801–1806. doi:10.1093/bioinformatics/btm233
Korte, A., and A. Farlow. 2013. The advantages and limitations of trait analy-sis with GWAS: A review. Plant Methods 9:29. doi:10.1186/1746-4811-9-29
Li, J., and L. Ji. 2005. Adjusting multiple testing in multilocus analyses using the eigenvalues of a correlation matrix. Heredity (Edinb.) 95:221–227. doi:10.1038/sj.hdy.6800717
Li, Z.L., and R.L. Nelson. 2001. Genetic diversity among soybean acces-sions from three countries measured by RAPDs. Crop Sci. 41:1337–1347. doi:10.2135/cropsci2001.4141337x
Lippert, C., J. Listgarten, Y. Liu, C.M. Kadie, R.I. Davidson, and D. Heck-erman. 2011. FaST linear mixed models for genome-wide association studies. Nat. Methods 8:833–835. doi:10.1038/nmeth.1681
McCouch, S.R., K.L. McNally, W. Wang, and R.S. Hamilton. 2012. Genomics of gene banks: A case study in rice. Am. J. Bot. 99:407–423. doi:10.3732/ajb.1100385
Munoz-Amatriain, M., A. Cuesta-Marcos, J.B. Endelman, J. Comadran, J.M. Bonman, H.E. Bockelman, S. Chao, J. Russell, R. Waugh, P.M. Hayes, and G.J. Muehlbauer. 2014. The USDA barley core collection: Genetic diver-sity, population structure, and potential for genome-wide association studies. PLoS ONE 9:e94688. doi:10.1371/journal.pone.0094688
Myles, S., J. Peiffer, P.J. Brown, E.S. Ersoz, Z. Zhang, D.E. Costich, and E.S. Buckler. 2009. Association mapping: Critical considerations shift from genotyping to experimental design. Plant Cell 21:2194–2202. doi:10.1105/tpc.109.068437
Nichols, D.M., K.D. Glover, S.R. Carlson, J.E. Specht, and B.W. Diers. 2006. Fine mapping of a seed protein QTL on soybean linkage group I and its correlated effects on agronomic traits. Crop Sci. 46:834–839. doi:10.2135/cropsci2005.05-0168
Rincent, R., L. Moreau, H. Monod, E. Kuhn, A. Melchinger, R.A. Malvar, J. Moreno-Gonzalez, S. Nicolas, D. Madur, V. Combes, F. Dumas, T. Alt-mann, D. Brunel, M. Ouzunova, P. Flament, P. Dubreuil, A. Charcosset, and T. Mary-Huard. 2014. Recovering power in association mapping panels with variable levels of linkage disequilibrium. Genetics 197:375–387. doi:10.1534/genetics.113.159731
Rolletschek, H., R. Radchuk, C. Klukas, F. Schreiber, U. Wobus, and L. Borisjuk. 2005. Evidence of a key role for photosynthetic oxygen release in oil storage in developing soybean seeds. New Phytol. 167:777–786. doi:10.1111/j.1469-8137.2005.01473.x
Rolletschek, H., H. Weber, and L. Borisjuk. 2003. Energy status and its con-trol on embryogenesis of legumes: Embryo photosynthesis contributes to oxygen supply and is coupled to biosynthetic fluxes. Plant Physiol. 132:1196–1206. doi:10.1104/pp.102.017376
Romay, M.C., M.J. Millard, J.C. Glaubitz, J.A. Peiffer, K.L. Swarts, T.M. Casstevens, R.J. Elshire, C.B. Acharya, S.E. Mitchell, S.A. Flint-Garcia, M.D. McMullen, J.B. Holland, E.S. Buckler, and C.A. Gardner. 2013. Comprehensive genotyping of the USA national maize inbred seed bank. Genome Biol. 14:R55. doi:10.1186/gb-2013-14-6-r55
Sebolt, A.M., R.C. Shoemaker, and B.W. Diers. 2000. Analysis of a quan-titative trait locus allele from wild soybean that increases seed pro-tein concentration in soybean. Crop Sci. 40:1438–1444. doi:10.2135/cropsci2000.4051438x
Sidak, Z. 1967. Rectangular confidence regions for the means of multivari-ate normal distributions. J. Am. Stat. Assoc. 62:626–633.
Sohlenkamp, C., C.C. Wood, G.W. Roeb, and M.K. Udvardi. 2002. Char-acterization of Arabidopsis AtAMT2, a high-affinity ammonium transporter of the plasma membrane. Plant Physiol. 130:1788–1796. doi:10.1104/pp.008599
Sonah, H., L. O’Donoughue, E. Cober, I. Rajcan, and F. Belzile. 2015. Iden-tification of loci governing eight agronomic traits using a GBS-GWAS approach and validation by QTL mapping in soya bean. Plant Biotech-nol. J. 13:211–221. doi:10.1111/pbi.12249
Song, Q., D.L. Hyten, G. Jia, C.V. Quigley, E.W. Fickus, R.L. Nelson, and P.B. Cregan. 2013. Development and evaluation of SoySNP50K, a high-density genotyping array for soybean. PLoS ONE 8:e54985. doi:10.1371/journal.pone.0054985
Sunarpi, J.W.A. 1996. Effect of sulfur nutrition on the redistribution of sulfur in vegetative soybean plants. Plant Physiology (Rockville) 112:623–631.
Tabe, L.M., and M. Droux. 2001. Sulfur assimilation in developing lupin cotyledons could contribute significantly to the accumulation of organic sulfur reserves in the seed. Plant Physiol. 126:176–187. doi:10.1104/pp.126.1.176
Ude, G.N., W.J. Kenworthy, J.M. Costa, P.B. Cregan, and J. Alvernaz. 2003. Genetic diversity of soybean cultivars from China, Japan, North America, and North American ancestral lines determined by amplified fragment length polymorphism. Crop Sci. 43:1858–1867. doi:10.2135/cropsci2003.1858
Vaughn, J.N., R.L. Nelson, Q. Song, P.B. Cregan, and Z. Li. 2014. The genetic architecture of seed composition in soybean is refined by genome-wide association scans across multiple populations. G3 4:2283–2294. doi:10.1534/g3.114.013433
Wang, H., B. Zhang, Y. Hao, J. Huang, A. Tian, Y. Liao, J. Zhang, and S. Chen. 2007. The soybean dof-type transcription factor genes, GmDof4 and GmDof11, enhance lipid content in the seeds of transgenic Arabi-dopsis plants. Plant J. 52:716–729. doi:10.1111/j.1365-313X.2007.03268.x
Wang, N., J.M. Akey, K. Zhang, R. Chakraborty, and L. Jin. 2002. Distribu-tion of recombination crossovers and the origin of haplotype blocks: The interplay of population history, recombination, and mutation. Am. J. Hum. Genet. 71:1227–1234. doi:10.1086/344398
Weber, H., S. Golombek, U. Heim, L. Borisjuk, R. Panitz, R. Manteuffel, and U. Wobus. 1998. Integration of carbohydrate and nitrogen metabolism during legume seed development: Implications for storage product syn-thesis. J. Plant Physiol. 152:641–648. doi:10.1016/S0176-1617(98)80024-2
Wilcox, J.R. 1998. Increasing seed protein in soybean with eight cycles of recurrent selection. Crop Sci. 38:1536–1540. doi:10.2135/cropsci1998.0011183X003800060021x
Wilcox, J.R., and J.F. Cavins. 1995. Backcrossing high seed protein to a soy-bean cultivar. Crop Sci. 35:1036–1041. doi:10.2135/cropsci1995.0011183X003500040019x
Wilson, R.F. 2008. Soybean: Market driven research needs. In: G. Stacey, editor, Genetics and genomics of soybean. Springer Science+Business Media, New York. p. 3–15.
Yu, J.M., and E.S. Buckler. 2006. Genetic association mapping and genome organization of maize. Curr. Opin. Biotechnol. 17:155–160. doi:10.1016/j.copbio.2006.02.003
Zhu, C., M. Gore, E.S. Buckler, and J. Yu. 2008. Status and prospects of association mapping in plants. Plant Gen. 1:5–20. doi:10.3835/plantgen-ome2008.02.0089