Embed Size (px)
Citation preview

A population study of binocular function
J.M. Bosten a,b,⇑, P.T. Goodbourn a,c, A.J. Lawrance-Owen a, G. Bargary a,d, R.E. Hogg a,e, J.D. Mollon a
aDepartment of Psychology, University of Cambridge, UKb School of Psychology, University of Sussex, Brighton, UKc School of Psychology, University of Sydney, AustraliadDivision of Optometry and Visual Science, City University, London, UKeCentre for Experimental Medicine, Queen’s University Belfast, UK
a r t i c l e i n f o
Article history:Received 9 December 2014Received in revised form 4 February 2015Available online 12 March 2015
Keywords:Stereo acuityStereopsisDichoptic maskingBinocular rivalryGWASIndividual differences
a b s t r a c t
As part of a genome-wide association study (GWAS) of perceptual traits in healthy adults, we measuredstereo acuity, the duration of alternative percepts in binocular rivalry and the extent of dichoptic maskingin 1060 participants. We present the distributions of the measures, the correlations between measures,and their relationships to other psychophysical traits. We report sex differences, and correlations withage, interpupillary distance, eye dominance, phorias, visual acuity and personality. The GWAS, using datafrom 988 participants, yielded one genetic association that passed a permutation test for significance:The variant rs1022907 in the gene VTI1A was associated with self-reported ability to see autostere-ograms. We list a number of other suggestive genetic associations (p < 10!5).
! 2015 Elsevier Ltd. All rights reserved.
1. Introduction
Human binocular function shows large individual variation. Forexample, stereopsis – the ability to detect binocular disparities –varies from a ‘‘hyper acuity’’ of few seconds of arc to completestereo blindness. The characterization of individual differences inbinocular function has the potential to yield insights into theunderlying biological mechanisms (Wilmer, 2008). With the pro-liferation of 3D technologies, there is also practical interest inindividual differences in binocular function, to ensure that the fullrange of binocular abilities is catered for.
As part of the PERGENIC study into the genetic basis of individ-ual differences in perception, we measured crossed and uncrossedstereo acuity, dichoptic masking and binocular rivalry in a pop-ulation of 1060 normal healthy adults. Here we present populationdistributions for each measure, and the correlations between themeasures. We also report correlations between these binocularmeasures, and demographic and other psychophysical measures.Genome-wide association analysis of our data has yielded a num-ber of ‘‘suggestive’’ associations between the binocular measuresand single nucleotide polymorphisms (p < 10!5); and one gen-ome-wide significant association with self-reported ability to see
autostereograms (p = 1.7 " 10!8). The latter association passes apermutation test.
1.1. Stereo acuity
Stereo acuity is often considered a ‘‘hyper acuity’’, since underoptimal conditions some people are able to detect differences inbinocular disparity of a few seconds of arc, differences smaller thanthe diameter of individual photoreceptors (Westheimer, 1975).However, there is a large range of performance across individuals.Population studies have reported estimates of median stereo acuityranging from 12.4 to 37.2 s of arc (Bohr & Read, 2013; Coutant &Westheimer, 1993; Zaroff, Knutelska, & Frumkes, 2003), butbetween 1 and 14% of people are stereo blind (Bohr & Read,2013; Coutant & Westheimer, 1993; Rahi, Cumberland, &Peckham, 2009; Richards, 1970; Zaroff, Knutelska, & Frumkes,2003). Population estimates of stereo acuity and of the prevalenceof deficits may be affected by the method of measurement, by theretinal location, size and duration of the targets, by differences inpopulation sampling and by differences in exclusion criteriabetween studies (Heron & Lages, 2012).
Poor stereopsis has a variety of known causes including strabis-mus, anisometropia, convergence insufficiency, early unilateralcataract, and unilateral retinal damage. It may also in some casesbe caused by direct disruption of the specialist neural machinerythat underlies stereopsis. Relative to other visual functions, stereo
http://dx.doi.org/10.1016/j.visres.2015.02.0170042-6989/! 2015 Elsevier Ltd. All rights reserved.
⇑ Corresponding author at: School of Psychology, University of Sussex, BrightonBN1 9QH, UK.
E-mail address: [email protected] (J.M. Bosten).
Vision Research 110 (2015) 34–50
Contents lists available at ScienceDirect
Vision Research
journal homepage: www.elsevier .com/locate /v isres
acuity seems to be disproportionately affected by aging (Wright &Wormald, 1992; Zaroff, Knutelska, & Frumkes, 2003); and poorstereo acuity has been noted in vascular dementia (Mittenberg,Choi, & Apple, 2000).
Electrophysiological results show that binocular visual neuronscan be tuned to retinal disparities (Barlow, Blakemore, & Pettigrew,1967). Different neural populations are tuned to crossed anduncrossed disparities, and the tuning is finest for stimuli fallingclose to the horopter (e.g. Poggio, 1995). Several authors have sug-gested that stereo acuity may be heritable, and Richards (1970)proposed an autosomal model on the basis of psychophysical datafrom parents and offspring.
The evidence suggests that stereopsis develops in infancybetween the second and sixth months of life, with crossed stereoacuity developing significantly earlier than uncrossed (Birch,Gwiazda, & Held, 1982). The development of stereopsis requiresappropriate stimulation from the environment and can be dis-rupted by occlusion or misalignment of one eye (Blakemore,1979; Hubel & Wiesel, 1965). However, there is some evidenceto suggest that stereopsis can be acquired in adulthood (Barry,2012).
1.2. Binocular rivalry
Binocular rivalry arises when incompatible images are pre-sented to the right and left eyes. Observers experience an alterna-tion of percepts between the image presented to the left eye andthat presented to the right. There are large individual differencesin the rate of alternation, with a range spanning at least an orderof magnitude (Pettigrew & Carter, 2004). Test–retest reliabilitiesfor average percept duration are moderate to high, with past stud-ies reporting rs = 0.69 (Whittle, 1963), rp = 0.7 (Miller et al., 2010)and rp = 0.8 (Pettigrew & Miller, 1998, in bipolar patients andcontrols).
Variability in rate of rivalry has been found to correlate withpatterns of saccadic eye movements (Hancock et al., 2012), withlevel of dichoptic masking (Baker & Graf, 2009), with retinotopicactivity in extrastriate visual cortex triggered by the suppressedimage (Yamashiro et al., 2014), and with variability in the structureof parietal cortex (Kanai, Bahrami, & Rees, 2010). Rate of rivalry isfaster in children than adults (Hudak et al., 2011; Kovacs &Eisenberg, 2004) and declines with increasing age in adulthood(Jalavisto, 1964; Ukai, Ando, & Kuze, 2003). Rate of rivalry has beenfound to be reduced in bipolar disorder (Miller et al., 2003;Pettigrew & Miller, 1998; Vierck et al., 2013) and in autism(Robertson et al., 2013).
Recently, Miller et al. (2010) have inferred from twin data thatrate of binocular rivalry is heritable, with 52% of the variance inrivalry rate attributable to additive genetic factors. Consistent witha reduced rate of rivalry in bipolar disorder, a candidate gene studyby Schmack et al. (2013) suggested that the bipolar risk allele (2R)of the D4 dopamine receptor gene DRD4 is associated with slowperceptual switching.
1.3. Dichoptic masking
In binocular or dichoptic masking, a stimulus presented to oneeye is made harder to detect by a mask presented to the other.Individual differences in dichoptic masking have been noted(Baker & Meese, 2007), though to date no figure for test–retestreliability has been reported.
Baker and Graf (2009) have found that individual difference indichoptic masking are correlated with individual differences inbinocular rivalry: Both within and between individuals, strongermasking is associated with longer percept durations in binocular
rivalry. This association suggests the two phenomena may arisefrom a common suppressive process.
2. Methods
Our measurements of binocular function were made as part ofthe PERGENIC genome-wide association study of individual differ-ences in perceptual traits (Goodbourn et al., 2012; Lawrance-Owenet al., 2013). The PERGENIC battery consisted of about 80 percep-tual measures and took about 2.5 h for participants to complete.In the first forty minutes of the session participants were optome-trically assessed, were optically corrected if necessary, and wereasked to perform some standard clinical tests of vision, includingthe TNO test.
2.1. Participants
One thousand and sixty participants (647 female) took part inthe PERGENIC study. They were recruited from the Cambridge area,andmany were students at the University of Cambridge. They werepaid £25 for taking part. A subset of 105 participants, selected atrandom, returned for testing in a second session at least one weekafter the first session, allowing us to measure test–retest reliabili-ties. Participants were corrected to best optical acuity at the begin-ning of the session, and were given lenses to wear if acuityimproved by at least 0.1 logMAR with the correction. Two hundredand thirty-four participants were given lenses for both eyes, and110 participants were given lenses for one eye only. As a prelimi-nary measure to guard against population stratification, all partici-pants in our sample were of self-reported European origin.
The study was approved by the Cambridge Psychology ResearchEthics Committee, and was carried out in accordance with thetenants of the Declaration of Helsinki. All participants gave writteninformed consent before taking part.
2.2. Visual acuity, sighting dominant eye, pupil size, inter-pupillarydistance and phoria
Monocular and binocular logMAR visual acuity was measuredusing an EDTRS chart before and after a refraction using a stan-dardized protocol.
We measured sighting dominant eye by a variant of the Milestest (Miles, 1929). Participants were seated facing a Snellen chartfor measuring acuity, and asked to stretch out both arms, creatinga small aperture with the thumbs and index fingers of both hands.They were asked to fixate on a letter on the chart through the aper-ture and then, keeping both eyes open, to bring their hands slowlytoward their face. The experimenter noted the eye that the handswere drawn toward, and assigned this eye as the sighting domi-nant eye.
Pupil size and interpupillary distance were measured by takinga photograph of participants’ eyes using a digital camera(DS126191; Canon, Tokyo, Japan) mounted at a distance of105 cm. Photographs were flash-illuminated, and were taken whileparticipants were adapted to a blank gray field (27" " 31" wide)with a luminance of 30 cd/m2.
We measured near (equivalent to 40 cm) and far (equivalent to6 m) horizontal and vertical phorias using the Keystonetelebinocular (Mast Concepts, Reno, NV). Methods and results havebeen published elsewhere (Bosten et al., 2014).
2.3. TNO test
We used the sixteenth edition of the TNO test (Laméris Ootech,Nieuwegein, The Netherlands) presented at a distance of 40 cm,
J.M. Bosten et al. / Vision Research 110 (2015) 34–50 35
orthogonally to the participant’s line of sight. The red–green TNOglasses were placed over the participant’s usual glasses, or overtrial frames containing lenses if the participant was optically cor-rected following refraction.
For practice, we first presented Plate III, which contains fourshapes defined by binocular disparities. Participants were thenpresented with Plates V–VII. Each plate contains four figures, eacha disc defined by stereo disparities with one sector missing fromthe top, bottom, left or right. Six pairs of figures are defined by dis-parities of 480, 240, 120, 60, 30 and 15 s of arc, respectively. A dis-parity level was passed if participants correctly identified thelocation of the missing sector in both figures. Since for each dispar-ity there are two figures, with four alternatives for each figure, theguess rate for each disparity is 6.25%.
2.4. Measurement of stereo acuity, binocular rivalry and dichopticmasking
Stimuli were generated using a VSG2/5 graphics card(Cambridge Research Systems (CRS), Rochester, UK) and were pre-sented on a Monoray CRT monitor (Clinton Electronics, Loves Park,Illinois) running at 150 Hz. The gamma function of the monitorwas linearized using a CRS ColorCal2. Monocular presentationwas achieved using CRS ferro-electric FE-01 shutter goggles syn-chronized to the monitor’s frames. Alternate frames were pre-sented to opposite eyes. The viewing distance was 2.36 m. TheClinton Monoray has a single (lime green) phosphor with a veryshort decay time, and was used to prevent the image presentedon one frame from persisting in the following frame.Experiments were run in Matlab using the CRS toolbox for
Matlab and Psychtoolbox-3 (Brainard, 1997; Pelli, 1997).Participants responded by means of a CRS CT3 response box.
Measurements of binocular rivalry, dichoptic masking andstereo acuity were made in that order, beginning about ninetyminutes into the battery. Since preceding components of the bat-tery were conducted monocularly with the dominant eye, partici-pants removed an eye patch before completing the binoculartasks. The room in which the measurements were made was dark.
We include a short summary of the methods for each taskbelow. Stimulus and task parameters are listed in Table 1.
2.5. Crossed and uncrossed stereo acuity
A representation of the stimulus for measuring stereo acuity isgiven in Fig. 1(a). Four Gaussian rings were presented around acentral fixation cross, on a square black surround embedded in asquare field of pixelated binary random noise, included to aidbinocular fusion. The stimuli were identical in the two eyes, exceptfor the position of one of the four Gaussian rings. The separationbetween the two rings (the binocular disparity) was decided oneach trial by a staircase procedure. There was random jitter inthe horizontal position of each ring, to prevent the participantcompleting the task by selecting the ring that had an eccentricitydifferent from the others. The jitter for each ring was randomlyassigned on each trial. It was uniformly distributed with a maxi-mum of ±175 s of arc.
The participant was given the following instructions on thescreen: ‘‘The goggles you are looking through are 3D goggles. Youwill see four rings on each trial, and one of the rings should appearto be at a different depth to the others. Your task is to press the
Table 1Stimulus and task parameters for crossed and uncrossed stereo acuity, binocular rivalry and dichoptically masked and unmasked contrast sensitivity.
Crossed and uncrossed stereo acuity Binocular rivalry Dichoptically masked and unmasked contrast sensitivity
Stimulus geometry(deg)
Ring eccentricity: 0.7Ring diameter: 0.2SD of Gaussian: 0.02Fixation cross: 0.15 " 0.15Fixation cross stroke: 0.02Black surround: 2.7 " 2.7Noise field: 5.8 " 5.8Noise pixels: 0.06 " 0.06
Grating size: 2 " 2Grating spatial frequency: 2 c.p.dFixation cross: 0.08 " 0.08Fixation cross stroke: 0.01
Grating size: 1.26 " 1.26Grating spatial frequency: 3 c.p.d.Grating eccentricity: 2Fixation cross: 0.08 " 0.08Fixation cross stroke: 0.01
Stimulus luminance(cd/m2)
Mean of noise field: 48Ring (peak): 48Fixation cross: 97
Mean of grating: 39Background: 39
Contrast of masking gratings: 0.25Mean of masking gratings: 39Mean of test and distractor gratings: 39Background: 19Blank squares in inter-trial-interval: 39
Stimulus contrast Noise field: #1 Grating: 0.75 Masking gratings: 0.25
Presentation time Until response had been received 2 min 200 ms
Auditory feedback: Correct: Two 100-ms high tonesIncorrect: One 100-ms low tone
A short tone of medium pitchindicated response reception
Correct: Two 100-ms high tonesIncorrect: One 100-ms low tone
Training Constant disparity of 140 s of arc.Terminated after 8 consecutive correctresponses or 60 trials
Unmasked contrast sensitivity: Target gratings at closeto full contrast. Terminated after 3 consecutive correctresponsesMasked contrast sensitivity: Target gratings at 0.25.Presentation time decreased from 1500 ms, to 750 msand then to 200 ms, each after 3 consecutive correctresponses. Terminated after 5 consecutive correctresponses at 200 ms
Test blocks 4: Two for crossed disparities, two foruncrossed disparities. Order: ABBA orBAAB
1 1
Staircases Starting disparity: 245 s of arcMaximum disparity: 250 s of arcTrials per staircase: 25
N/A Starting contrast: 0.63Trials per staircase: 25 (unmasked); 30 (masked)
Analysis Data were combined from the 2 staircasesfor each disparity type. Threshold wasdefined as the 67% point on thepsychometric function
Data were combined from the 2 staircases for each eye.Threshold was defined as the 70% point on thepsychometric function
36 J.M. Bosten et al. / Vision Research 110 (2015) 34–50

button corresponding to the ring that is at a different depth fromthe others.’’ Two examples were then shown, in which one of therings had either a crossed or an uncrossed binocular disparity of245 s of arc. The participant was instructed to alert the experi-menter (by pressing a buzzer) if one ring in each example didnot clearly look to be at a different depth from the others. If theexperimenter was alerted, he or she entered the experimentalroom and identified the ring that should appear to be in depth,encouraging the participant to perceive the disparity signal.Whether or not depth was subsequently perceived, the participantthen progressed to the main part of the experiment.
Following the examples there was a training phase, first forcrossed disparities, and then for uncrossed disparities. In the test-ing phase, thresholds for crossed and uncrossed binocular dispari-ties were measured in separate blocks. According to the block, theparticipant was instructed to identify on each trial the ring thatwas either nearer or further than the others. The stimulus remainedon screen until the participant had made a response. The disparityon each trial was decided by a ZEST staircase (King-Smith et al.,1994; Watson & Pelli, 1983) according to the participant’sresponses. The Gaussian luminance profile of the ring stimuliallowed antialiasing, so that disparities smaller than one pixelcould be presented.
2.6. Binocular rivalry
Binocular rivalry was measured at the beginning of the batteryof tests of binocular function, but after rivalry for ambiguous fig-ures had already been measured in the previous testing room.The stimuli were centrally presented sinusoidal gratings insidesquares. The grating presented to the left eye was oriented alongthe negative diagonal, and the grating presented to the right eyewas oriented along the positive diagonal. There was a central blackfixation cross presented to both eyes.
Participants were instructed that diagonal gratings of differentorientations would be presented to the two eyes. They were toldthat at some times they would see a grating tilted to the left andat other times they would see the grating tilted to the right. Theywere instructed to press the left button if they perceived a gratingoriented along the negative diagonal and the right button if theyperceived a grating oriented along the positive diagonal. They wereinstructed that in the case of mixed percepts, they should judge thegrating that covered most of the square. They were instructed to
maintain fixation on the central cross at all times. Both gratingswere presented for a period of 2 min.
2.7. Dichoptic masking
A representation of the stimulus for dichoptic masking is givenin Fig. 1(b). The stimulus for measuring unmasked contrast thresh-olds was the same as for dichoptic masking, but without the maskand the distractor gratings.
Stimuli were four sinusoidal gratings oriented along the posi-tive diagonal, presented around a central black fixation cross. Themasking gratings were presented to one eye. The test gratingwas presented to the other eye, at one of the four positions ofthe masking gratings. It was identical to the masking gratings,except it was oriented along the negative diagonal. Distractor grat-ings oriented along the positive diagonal were presented at theremaining three positions. The contrast of the test and distractorgratings was decided on each trial by a ZEST staircase.
On each trial, prior to and following the presentation of the testand masking gratings there were four blank squares presented atthe same locations. Both eyes were tested: Thresholds were mea-sured for contrast in the left eye masked by a stimulus presentedto the right eye and vice versa.
Unmasked contrast thresholds were measured first.Participants were told that they would see a grating flashed insideone of four squares, and were instructed to press the button thatcorresponded to the position of the grating. There was a shorttraining period (Table 1). Immediately following training, fourinterleaved ZEST staircases (two for each eye) tracked the partici-pant’s threshold contrast. On each trial, following presentation ofthe test stimulus, the participant had up to 5 s to respond. The nexttrial began after 5 s or following the participant’s response.
For measurement of dichoptically masked contrast thresholds,unmasked contrast threshold was not used to adjust the contrastof the mask, as we wanted all participants to receive the samephysical stimulus. During a period of training (Table 1), the eyeof presentation of the test and masking gratings was decided atrandom on each trial.
Following training, four interleaved ZEST staircases (two foreach eye) converged on a participant’s dichoptically maskedthresholds.
Fig. 1. Stimuli. Panel (a) shows an example of a stimulus for stereo acuity. The target (the top ring here) has a stereo disparity, and two rings are visible in the figure as therings presented to the right and left eyes have been superimposed. The other three rings have no stereo disparity. Panel (b) shows the stimulus for dichoptic masking. Gratingswere presented for 200 ms. The target was oriented orthogonally to the three distractor gratings (presented to the same eye) and the four masking gratings (presented to theopposite eye). Here, the target is the left grating presented to the right eye.
J.M. Bosten et al. / Vision Research 110 (2015) 34–50 37
2.8. Other psychophysical measures
We correlated our binocular measures with other psychophysi-cal measures in the PERGENIC test battery, including
(1) Detection of gratings of low spatial frequency presented onpulsed and steady pedestals. Detection of gratings on steadypedestals is discussed in Goodbourn et al. (2012). Detectionon a pulsed pedestal used the same method but there was aluminance pedestal (DI) of 5.3 cd/m2 temporally coinciden-tal with the target grating.
(2) Detection of coherent motion (Goodbourn et al., 2012).(3) Detection of gratings of low spatial and high temporal fre-
quency (Goodbourn et al., 2012, 2014).(4) Performance on the Pelli–Robson test (Pelli, Robson, &
Wilkins, 1988).(5) Detection of S-cone increments and decrements (Bosten
et al., 2014; Goodbourn et al., 2012).(6) Detection of differences in the frequency, duration and order
of auditory stimuli (auditory order is discussed inGoodbourn et al., 2012).
(7) Detection of coherent form.
Methods for these measures have already been published,except for detection of differences in auditory frequency and dura-tion, and detection of coherent form. We include brief methods forthese below.
2.8.1. Detection of differences in auditory frequency and durationFor the auditory frequency task the stimuli were three consecu-
tive tones (peak intensity 65 dB sound pressure level (SPL)) withonsets 0.5 s apart: a reference tone (TR) and two test tones (T1and T2). TR was a pure sinusoid (440 Hz) of 250 ms duration, withintensity ramped on and off over 10 ms. On each trial, one of T1or T2 matched TR exactly, while the other had a higher frequency.The frequency of the oddball tone was varied adaptively betweentrials. The participant’s task was to identify which of T1 or T2 dif-fered from TR.
For the auditory duration task the stimuli were three consecu-tive tones with onsets 550 ms apart. On each trial, one of T1 or T2matched TR exactly, while the other had a longer duration. Theduration of the oddball tone was varied adaptively between trials.The participant’s task was to identify which of T1 or T2 differedfrom TR.
Both tasks were two-alternative forced-choice. Participantscompleted a set of practice trials to ensure they understood thetask. For experimental trials, test intensity was determined accord-ing to two independent interleaved ZEST staircases, terminatedafter 30 trials. Feedback was provided by colored lights.
Auditory stimuli were played binaurally via an M-Audio FastTrack USB sound card at a 48 kHz sample rate throughSennheiser HD205 circumaural stereo headphones.
2.8.2. Detection of coherent formStimuli comprised 0.04" white dots (10% density) within an
annulus of inner radius 1.0" and outer radius 10.0". Backgroundluminance was 30 cd/m2 and dot luminance was 60 cd/m2. Thefixation marker was positioned in the center of the annulus. Ineach block of trials, orientation information was introduced byone of two methods. In one task, streaks were formed by arrangingdots in a Glass pattern (Glass, 1969). Each seed dot in a randomarray was paired with a daughter dot located 0.5" away. A propor-tion of signal dots were displaced from the seed dot in the targetdirection (either upwards and to the left, or upwards and to theright), and remaining dots were displaced in random directions.The proportion of signal dots was varied adaptively between trials.
In the other task, stripes were created by modulating dot densityacross space according to a sine wave (fS = 1.0 c deg!1, u random-ized). The axis of modulation was either from the lower right to theupper left, or from the lower left to the upper right. The amplitudeof density modulation was varied adaptively between trials. Theparticipant’s task was to identify the direction in which the texturewas tilted (45" to the left or right from vertical).
The tasks were two-alternative forced-choice. Participants com-pleted a set of practice trials to ensure they understood the task.For experimental trials, test intensity was determined accordingto two independent ZEST staircases, blocked in ABBA order.Staircases terminated after 50 trials. Feedback in the form of audi-tory tones was provided throughout.
Experiments were conducted in a darkened room. All stimuliwere generated using Matlab R2007b software withPsychToolbox-3. Responses were collected using a two-buttonhand-held box. Stimuli were displayed via a specialized video pro-cessor (BITS++; Cambridge Research Systems, Rochester, UK) on agamma-corrected Sony Trinitron monitor operating at 100 Hz.Observers viewed stimuli monocularly using their preferred eye,or—if the difference in visual acuity between eyes was 0.10logMAR or greater—using the eye with better acuity. They used aheadrest to maintain a viewing distance of 0.5 m.
2.9. Questionnaires
Before coming to the lab for testing, participants completed a75-item online questionnaire. Included in the questionnaire wereitems to gather demographic information (age, sex, ancestry), themini IPIP to measure the ‘Big 5’ personality traits (Donnellanet al., 2006), and items about various visual and auditory attri-butes. Most relevant for binocular function was an item on abilityto see autostereograms: ‘‘I am good at seeing Magic Eye puzzles(stereograms).’’ Participants were required to rate their agreementwith the statement on a Likert scale ranging from 1 (strongly dis-agree) to 5 (strongly agree). We assessed handedness via two ques-tionnaire items, also using a Likert scale. One was ‘‘I always use myright hand when writing’’; the other, ‘‘I always throw a ball withmy right hand’’. Handedness was quantified as the average Likertscore for the two questions.
A subset of 555 participants completed a second online ques-tionnaire, about 6 months after completing the psychophysicaltests. The second questionnaire included a set of 50 items to mea-sure the Autism Quotient (Baron-Cohen et al., 2001).
2.10. GWAS methods
Each participant provided a saliva sample using Oragene OG-500 DNA kits (DNA Genotek Inc., Ottawa, Canada). After extractionof DNA, 1008 samples were genotyped using Illumina HumanOmniExpress arrays. The BeadChip allowed characterization of733,202 SNPs. Genotype calling was by custom clustering usingGenomeStudio software (Illumina Inc, San Diego, CA).
We excluded 20 individuals from the genetic data set followinggenotyping. For one there was a low call rate; three had sexanomalies; 15 were related individuals or duplicate samples; andone was a population outlier. Nine hundred and eighty-eightindividuals remained in the GWAS. We excluded 12.3% of geno-typed SNPs. These markers either had greater than 2% missinggenotypes (N = 12,706), or had a minor allele frequency below 1%(N = 77,738). After exclusions, 642,758 SNPs remained in theanalysis.
For each SNP we conducted a quantitative trait analysis usingPLINK (Purcell et al., 2007), using ranked data for each phenotype.To control for any residual population stratification in our sample,we used EIGENSOFT (Price et al., 2006) to extract the first three
38 J.M. Bosten et al. / Vision Research 110 (2015) 34–50

principal components (PCs) of genetic variation. The three PCswere entered, along with sex, as covariates in the regression modelfor each phenotype.
For each locus that the quantitative trait analysis found to besuggestively associated (p < 10!5), we ran a whole-genome per-mutation procedure using PLINK: The phenotype–genotypecorrespondences in our data were randomly shuffled, and geneticassociation analyses were run for all genotyped SNPs in each of10 000 permutations. To control for population stratification inthe permutation analysis we allowed shuffling only within geneticclusters of participants, identified by PLINK’s clustering facilitywith identity-by-state as the distance metric. The permuted p-value for each SNP is the proportion of permutations on whichthe test statistic for any SNP exceeds the test statistic found inthe original (unpermuted) association analysis for that particularSNP. The whole-genome permuted p-value is a conservativeempirical control for type 1 errors.
We imputed SNPs within a 2.5-Mbp region of interest centeredon each suggestively associated SNP (p < 10!5) using IMPUTE2(Howie, Marchini, & Stephens, 2011; Howie, Donnelly, &Marchini, 2009) with the 1000 genomes phased haplotypes(Abecasis et al., 2010). Association analyses of the imputed regionswere performed using PLINK, with sex and the three PCs as covari-ates, as for the analysis of genotyped SNPs.
Finally, we did a clustering analysis using PLINK’s clumpingfunction, with a significance threshold for index SNPs of p = 10!5,a significance threshold for clustered SNPs of p = 0.01, a linkagedisequilibrium (LD) threshold for clustering of r2 = 0.1, and a physi-cal distance threshold for clustering of 1250 kbp. Clustering definesa region that is in LD with the locus of interest, and which containsother SNPs (the ‘‘clustered’’ SNPs) that are associated with the traitwith a specified p-value. The clustered region therefore defines aregion in which the polymorphism causally associated with thephenotype is likely to lie.
3. Results
3.1. Exclusions
For our adaptive test of stereo acuity, we made no exclusions tothe data presented in Sections 3.2–3.5. For the TNO test two par-ticipants’ data were missing at the point of collection. For binocularrivalry, nine participants’ data were excluded because they madeonly one button press during the recording session.
For unmasked contrast detection, participants’ data wereexcluded if they did not achieve threshold even at a contrast of1. There were 17 exclusions for the right eye only and 16 exclu-sions for the left eye only; an additional 27 participants had dataexcluded for both eyes. Many participants who had data excludedonly for one eye had an identifiable binocular problem such asamblyopia, strabismus, retinal scarring or macular edema. We pre-sume that the participants who performed at the floor on both eyesdid not understand the task. A possible reason was that binocular
rivalry was run directly before unmasked contrast, and if partici-pants failed to read the instructions, they may have attempted tomap the responses required for binocular rivalry (left and rightjudgments of tilt) on to the unmasked contrast task (four alterna-tive spatial forced choice). For dichoptically masked contrastdetection, participants’ data were excluded if they did not achievethreshold even at a contrast of 1. There were 3 exclusions for theright eye only and 8 for the left only.
3.2. Test–retest reliabilities
One hundred and five participants were randomly selected toreturn for testing in a second session. Data from some participantswere missing or excluded (Section 3.1); the n in Table 2 indicates,for each measure, the number of participants on which test–retestreliabilities were based. Test–retest reliabilities were moderate tohigh, ranging from 0.57 (TNO) to 0.80 (dichoptically masked con-trast detection).
3.3. Distributions
Descriptive statistics for distributions of all our measures arelisted in Table 3, and histograms are shown in Fig. 2. There was asmall significant difference in mean crossed and uncrossed stereoacuity: crossed stereo acuity was better (z = !3.0, p = 0.003).
3.4. Correlations
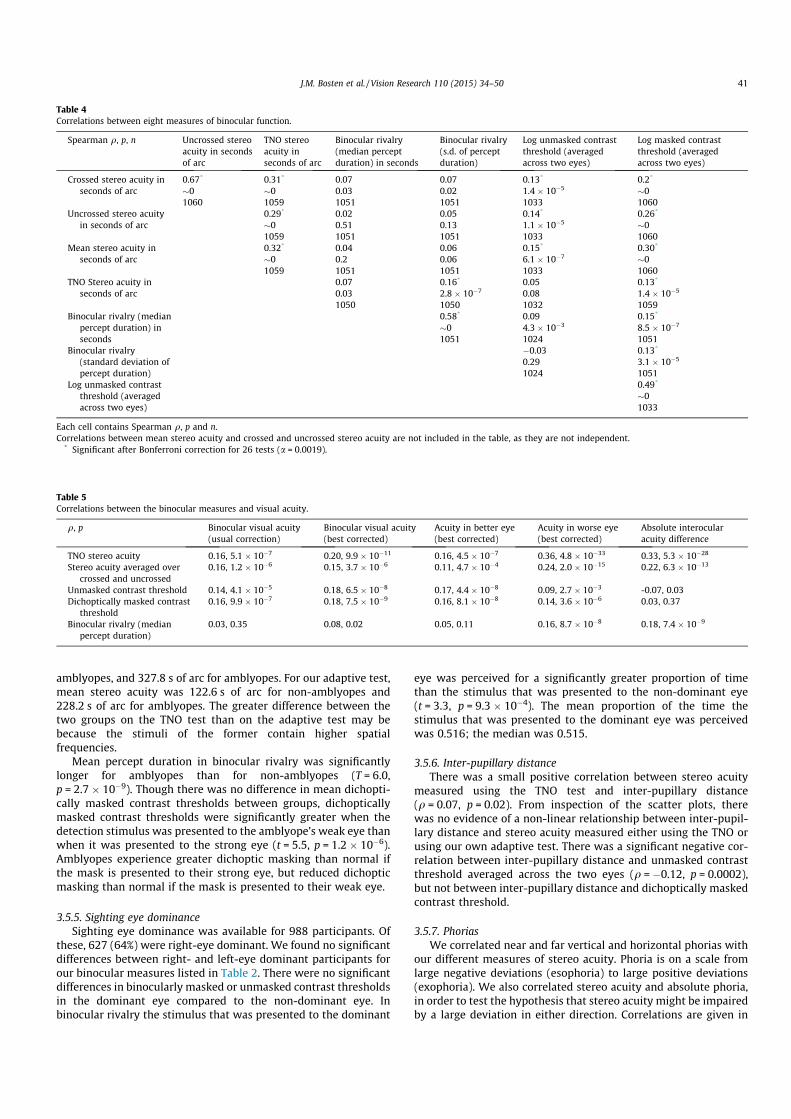
The correlations between our eight measures are listed inTable 4. Sixteen of twenty-six independent correlations were sig-nificant after Bonferroni correction.
3.4.1. Association between binocular rivalry and dichoptic maskingBaker and Graf (2009) found that the factor by which threshold
was elevated under dichoptic masking was correlated with meanpercept duration in binocular rivalry (r = 0.44). We calculated fac-tor of threshold elevation as the ratio of mean threshold formasked stimuli (across the two eyes) to mean threshold forunmasked stimuli. Like Baker and Graf, we found a significant cor-relation between this factor and mean percept duration in binocu-lar rivalry (q = 0.16, p = 6.6 " 10!7; r = 0.17, p = 7 " 10!8). Alsoreplicating Baker and Graf, we found a significant correlationbetween mean masked threshold and mean percept duration inbinocular rivalry (q = 0.21, p = 1.8 " 10!11; r = 0.14,p = 3.3 " 10!6), and a smaller correlation between unmasked con-trast threshold and mean percept duration in binocular rivalry(q = 0.11, p = 7.4 " 10!4; r = 0.08, p = 0.01).
3.5. Correlations with demographic and other measures
Correlations between our binocular measures and demographicmeasures must be interpreted with caution, because our samplewas self-selected. Nonetheless, in this section we report significant
Table 2Spearman test–retest reliabilities for the eight binocular measures.
Spearman q p n
Crossed stereo acuity 0.67 1.4 " 10!14 105Uncrossed stereo acuity 0.73 2.6 " 10!18 105Mean stereo acuity (of crossed and uncrossed) 0.78 2.7 " 10!22 105TNO 0.57 6.5 " 10!10 104Binocular rivalry (median percept duration) 0.74 4.9 " 10!19 105Binocular rivalry (standard deviation of percept duration) 0.60 3.3 " 10!11 105Unmasked contrast threshold (averaged across two eyes) 0.73 3.7 " 10!17 98Dichoptically masked contrast threshold (averaged across two eyes) 0.80 9.4 " 10!24 103
J.M. Bosten et al. / Vision Research 110 (2015) 34–50 39
sex differences, and significant correlations with age, visual acuity,and relevant questions from our questionnaire. We found no sig-nificant correlations between any binocular measure andhandedness.
3.5.1. Sex differencesFor the eight behavioral measures (Table 2) we conducted
unpaired t-tests comparing the scores of men with those ofwomen. There was one significant sex difference: Unmasked con-trast thresholds were significantly lower among men than women(t = 4.8, p = 1.6 " 10!6). The sex difference for dichoptically maskedcontrast threshold was non-significant when a Bonferroni correc-tion for multiple tests was applied (t = 2.1, p = 0.04, a = 0.006).
3.5.2. Age differencesMedian percept duration in binocular rivalry was significantly
correlated with age (q = 0.14, p = 2.6 " 10!6): Older individualshad longer median percept durations. This correlation wasobserved despite the age restriction on our sample of 16–40 years.
3.5.3. Visual acuityWhen vision was uncorrected or with usual optical correction,
the mean binocular acuity in our sample was !0.152 logMAR, witha standard deviation of 0.10 logMAR and a range !0.30 logMAR(the minimum the chart could measure) to 0.60 logMAR. Giving334 participants lenses (in addition to their usual correction, ifapplicable) improved mean acuity in the whole sample to !0.176logMAR, and the range to !0.3–0.06 logMAR. Table 5 shows thatour binocular measures, with the exception of median perceptduration in binocular rivalry, were significantly correlated withbinocular visual acuity (either uncorrected or with usualcorrection).
Stereo thresholds were significantly correlated with the abso-lute difference in visual acuity (with usual correction) betweenthe two eyes (mean: 0.046 logMAR, std: 0.081 logMAR), such thata greater interocular difference in acuity was associated withhigher stereo thresholds. Median percept duration in binocular riv-alry was also significantly correlated with the absolute differencein acuity between the two eyes. The stimulus presented to theeye with better acuity was perceived for a significantly greater pro-portion of the time than the stimulus presented to the eye withworse acuity (medians 0.529 vs. 0.471; t = 4.65, p = 3.8 " 10!6).
Unmasked contrast thresholds were significantly lower in theeye of best-corrected optical acuity than in the worse eye(t = 2.25, p = 0.025). Thresholds for masked stimuli were signifi-cantly lower if the target was presented to the strong eye andthe mask to the weak eye than vice versa (t = 3.05, p = 0.0024).
3.5.4. AmblyopiaIf the absolute difference in optimally corrected visual acuity
between the two eyes was greater than 0.2 logMAR, we definedthe participant as an amblyope. Twenty-eight participants met thiscriterion. Stereo acuity was significantly worse for amblyopes thanfor non-amblyopes (t = 5.9, p #0 for stereo acuity averaged overcrossed and uncrossed; t = 9.7, p #0 for TNO stereo acuity. Onthe TNO test, mean stereo acuity was 106.1 s of arc for non-
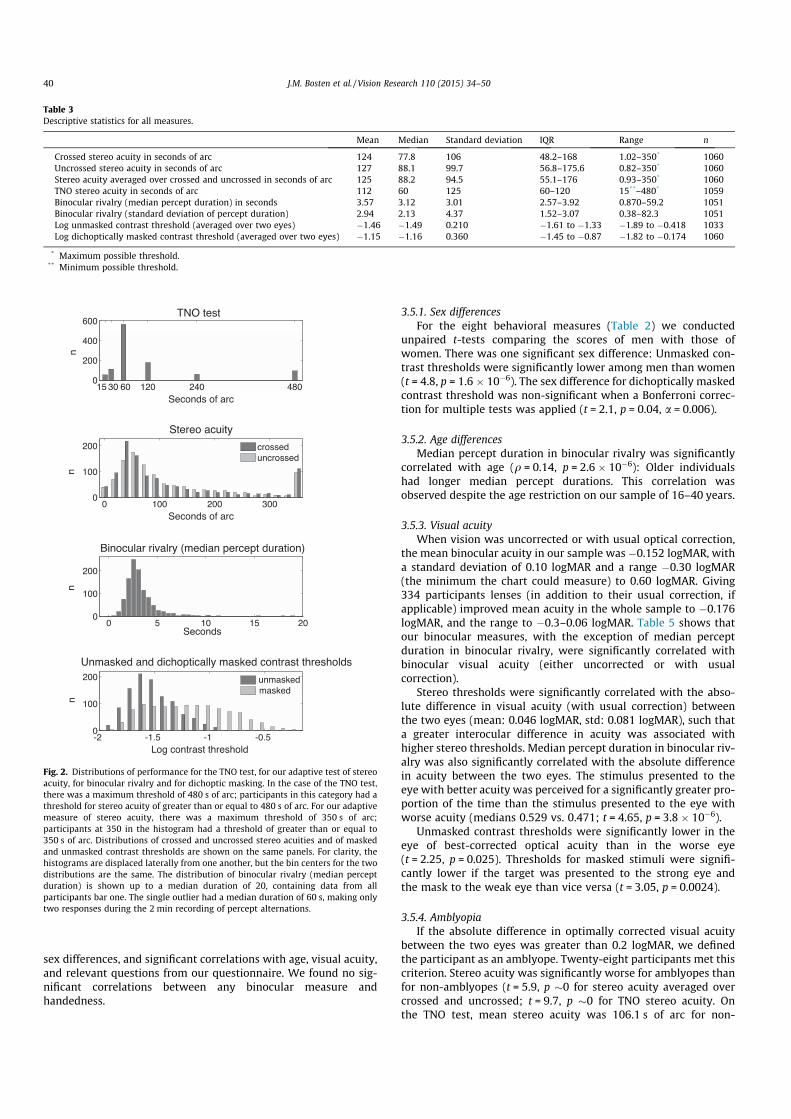
Table 3Descriptive statistics for all measures.
Mean Median Standard deviation IQR Range n
Crossed stereo acuity in seconds of arc 124 77.8 106 48.2–168 1.02–350* 1060Uncrossed stereo acuity in seconds of arc 127 88.1 99.7 56.8–175.6 0.82–350* 1060Stereo acuity averaged over crossed and uncrossed in seconds of arc 125 88.2 94.5 55.1–176 0.93–350* 1060TNO stereo acuity in seconds of arc 112 60 125 60–120 15**–480* 1059Binocular rivalry (median percept duration) in seconds 3.57 3.12 3.01 2.57–3.92 0.870–59.2 1051Binocular rivalry (standard deviation of percept duration) 2.94 2.13 4.37 1.52–3.07 0.38–82.3 1051Log unmasked contrast threshold (averaged over two eyes) !1.46 !1.49 0.210 !1.61 to !1.33 !1.89 to !0.418 1033Log dichoptically masked contrast threshold (averaged over two eyes) !1.15 !1.16 0.360 !1.45 to !0.87 !1.82 to !0.174 1060
* Maximum possible threshold.** Minimum possible threshold.
Fig. 2. Distributions of performance for the TNO test, for our adaptive test of stereoacuity, for binocular rivalry and for dichoptic masking. In the case of the TNO test,there was a maximum threshold of 480 s of arc; participants in this category had athreshold for stereo acuity of greater than or equal to 480 s of arc. For our adaptivemeasure of stereo acuity, there was a maximum threshold of 350 s of arc;participants at 350 in the histogram had a threshold of greater than or equal to350 s of arc. Distributions of crossed and uncrossed stereo acuities and of maskedand unmasked contrast thresholds are shown on the same panels. For clarity, thehistograms are displaced laterally from one another, but the bin centers for the twodistributions are the same. The distribution of binocular rivalry (median perceptduration) is shown up to a median duration of 20, containing data from allparticipants bar one. The single outlier had a median duration of 60 s, making onlytwo responses during the 2 min recording of percept alternations.
40 J.M. Bosten et al. / Vision Research 110 (2015) 34–50
amblyopes, and 327.8 s of arc for amblyopes. For our adaptive test,mean stereo acuity was 122.6 s of arc for non-amblyopes and228.2 s of arc for amblyopes. The greater difference between thetwo groups on the TNO test than on the adaptive test may bebecause the stimuli of the former contain higher spatialfrequencies.
Mean percept duration in binocular rivalry was significantlylonger for amblyopes than for non-amblyopes (T = 6.0,p = 2.7 " 10!9). Though there was no difference in mean dichopti-cally masked contrast thresholds between groups, dichopticallymasked contrast thresholds were significantly greater when thedetection stimulus was presented to the amblyope’s weak eye thanwhen it was presented to the strong eye (t = 5.5, p = 1.2 " 10!6).Amblyopes experience greater dichoptic masking than normal ifthe mask is presented to their strong eye, but reduced dichopticmasking than normal if the mask is presented to their weak eye.
3.5.5. Sighting eye dominanceSighting eye dominance was available for 988 participants. Of
these, 627 (64%) were right-eye dominant. We found no significantdifferences between right- and left-eye dominant participants forour binocular measures listed in Table 2. There were no significantdifferences in binocularly masked or unmasked contrast thresholdsin the dominant eye compared to the non-dominant eye. Inbinocular rivalry the stimulus that was presented to the dominant
eye was perceived for a significantly greater proportion of timethan the stimulus that was presented to the non-dominant eye(t = 3.3, p = 9.3 " 10!4). The mean proportion of the time thestimulus that was presented to the dominant eye was perceivedwas 0.516; the median was 0.515.
3.5.6. Inter-pupillary distanceThere was a small positive correlation between stereo acuity
measured using the TNO test and inter-pupillary distance(q = 0.07, p = 0.02). From inspection of the scatter plots, therewas no evidence of a non-linear relationship between inter-pupil-lary distance and stereo acuity measured either using the TNO orusing our own adaptive test. There was a significant negative cor-relation between inter-pupillary distance and unmasked contrastthreshold averaged across the two eyes (q = !0.12, p = 0.0002),but not between inter-pupillary distance and dichoptically maskedcontrast threshold.
3.5.7. PhoriasWe correlated near and far vertical and horizontal phorias with
our different measures of stereo acuity. Phoria is on a scale fromlarge negative deviations (esophoria) to large positive deviations(exophoria). We also correlated stereo acuity and absolute phoria,in order to test the hypothesis that stereo acuity might be impairedby a large deviation in either direction. Correlations are given in
Table 4Correlations between eight measures of binocular function.
Spearman q, p, n Uncrossed stereoacuity in secondsof arc
TNO stereoacuity inseconds of arc
Binocular rivalry(median perceptduration) in seconds
Binocular rivalry(s.d. of perceptduration)
Log unmasked contrastthreshold (averagedacross two eyes)
Log masked contrastthreshold (averagedacross two eyes)
Crossed stereo acuity inseconds of arc
0.67*
#01060
0.31*
#01059
0.070.031051
0.070.021051
0.13*
1.4 " 10!5
1033
0.2*
#01060
Uncrossed stereo acuityin seconds of arc
0.29*
#01059
0.020.511051
0.050.131051
0.14*
1.1 " 10!5
1033
0.26*
#01060
Mean stereo acuity inseconds of arc
0.32*
#01059
0.040.21051
0.060.061051
0.15*
6.1 " 10!7
1033
0.30*
#01060
TNO Stereo acuity inseconds of arc
0.070.031050
0.16*
2.8 " 10!7
1050
0.050.081032
0.13*
1.4 " 10!5
1059Binocular rivalry (median
percept duration) inseconds
0.58*
#01051
0.094.3 " 10!3
1024
0.15*
8.5 " 10!7
1051Binocular rivalry
(standard deviation ofpercept duration)
!0.030.291024
0.13*
3.1 " 10!5
1051Log unmasked contrast
threshold (averagedacross two eyes)
0.49*
#01033
Each cell contains Spearman q, p and n.Correlations between mean stereo acuity and crossed and uncrossed stereo acuity are not included in the table, as they are not independent.
* Significant after Bonferroni correction for 26 tests (a = 0.0019).
Table 5Correlations between the binocular measures and visual acuity.
q, p Binocular visual acuity(usual correction)
Binocular visual acuity(best corrected)
Acuity in better eye(best corrected)
Acuity in worse eye(best corrected)
Absolute interocularacuity difference
TNO stereo acuity 0.16, 5.1 " 10!7 0.20, 9.9 " 10!11 0.16, 4.5 " 10!7 0.36, 4.8 " 10!33 0.33, 5.3 " 10!28
Stereo acuity averaged overcrossed and uncrossed
0.16, 1.2 " 10!6 0.15, 3.7 " 10!6 0.11, 4.7 " 10!4 0.24, 2.0 " 10!15 0.22, 6.3 " 10!13
Unmasked contrast threshold 0.14, 4.1 " 10!5 0.18, 6.5 " 10!8 0.17, 4.4 " 10!8 0.09, 2.7 " 10!3 -0.07, 0.03Dichoptically masked contrast
threshold0.16, 9.9 " 10!7 0.18, 7.5 " 10!9 0.16, 8.1 " 10!8 0.14, 3.6 " 10!6 0.03, 0.37
Binocular rivalry (medianpercept duration)
0.03, 0.35 0.08, 0.02 0.05, 0.11 0.16, 8.7 " 10!8 0.18, 7.4 " 10!9
J.M. Bosten et al. / Vision Research 110 (2015) 34–50 41
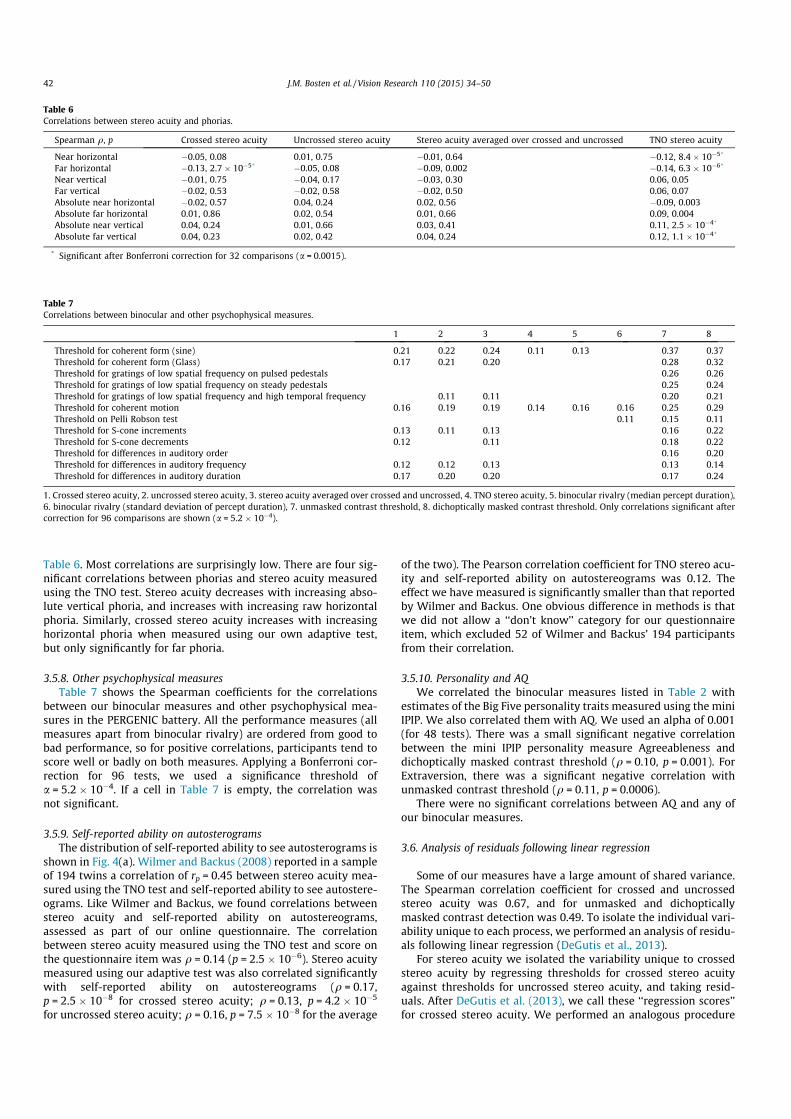
Table 6. Most correlations are surprisingly low. There are four sig-nificant correlations between phorias and stereo acuity measuredusing the TNO test. Stereo acuity decreases with increasing abso-lute vertical phoria, and increases with increasing raw horizontalphoria. Similarly, crossed stereo acuity increases with increasinghorizontal phoria when measured using our own adaptive test,but only significantly for far phoria.
3.5.8. Other psychophysical measuresTable 7 shows the Spearman coefficients for the correlations
between our binocular measures and other psychophysical mea-sures in the PERGENIC battery. All the performance measures (allmeasures apart from binocular rivalry) are ordered from good tobad performance, so for positive correlations, participants tend toscore well or badly on both measures. Applying a Bonferroni cor-rection for 96 tests, we used a significance threshold ofa = 5.2 " 10!4. If a cell in Table 7 is empty, the correlation wasnot significant.
3.5.9. Self-reported ability on autosterogramsThe distribution of self-reported ability to see autosterograms is
shown in Fig. 4(a). Wilmer and Backus (2008) reported in a sampleof 194 twins a correlation of rp = 0.45 between stereo acuity mea-sured using the TNO test and self-reported ability to see autostere-ograms. Like Wilmer and Backus, we found correlations betweenstereo acuity and self-reported ability on autostereograms,assessed as part of our online questionnaire. The correlationbetween stereo acuity measured using the TNO test and score onthe questionnaire item was q = 0.14 (p = 2.5 " 10!6). Stereo acuitymeasured using our adaptive test was also correlated significantlywith self-reported ability on autostereograms (q = 0.17,p = 2.5 " 10!8 for crossed stereo acuity; q = 0.13, p = 4.2 " 10!5
for uncrossed stereo acuity; q = 0.16, p = 7.5 " 10!8 for the average
of the two). The Pearson correlation coefficient for TNO stereo acu-ity and self-reported ability on autostereograms was 0.12. Theeffect we have measured is significantly smaller than that reportedby Wilmer and Backus. One obvious difference in methods is thatwe did not allow a ‘‘don’t know’’ category for our questionnaireitem, which excluded 52 of Wilmer and Backus’ 194 participantsfrom their correlation.
3.5.10. Personality and AQWe correlated the binocular measures listed in Table 2 with
estimates of the Big Five personality traits measured using the miniIPIP. We also correlated them with AQ. We used an alpha of 0.001(for 48 tests). There was a small significant negative correlationbetween the mini IPIP personality measure Agreeableness anddichoptically masked contrast threshold (q = 0.10, p = 0.001). ForExtraversion, there was a significant negative correlation withunmasked contrast threshold (q = 0.11, p = 0.0006).
There were no significant correlations between AQ and any ofour binocular measures.
3.6. Analysis of residuals following linear regression
Some of our measures have a large amount of shared variance.The Spearman correlation coefficient for crossed and uncrossedstereo acuity was 0.67, and for unmasked and dichopticallymasked contrast detection was 0.49. To isolate the individual vari-ability unique to each process, we performed an analysis of residu-als following linear regression (DeGutis et al., 2013).
For stereo acuity we isolated the variability unique to crossedstereo acuity by regressing thresholds for crossed stereo acuityagainst thresholds for uncrossed stereo acuity, and taking resid-uals. After DeGutis et al. (2013), we call these ‘‘regression scores’’for crossed stereo acuity. We performed an analogous procedure
Table 6Correlations between stereo acuity and phorias.
Spearman q, p Crossed stereo acuity Uncrossed stereo acuity Stereo acuity averaged over crossed and uncrossed TNO stereo acuity
Near horizontal !0.05, 0.08 0.01, 0.75 !0.01, 0.64 !0.12, 8.4 " 10!5*
Far horizontal !0.13, 2.7 " 10!5* !0.05, 0.08 !0.09, 0.002 !0.14, 6.3 " 10!6*
Near vertical !0.01, 0.75 !0.04, 0.17 !0.03, 0.30 0.06, 0.05Far vertical !0.02, 0.53 !0.02, 0.58 !0.02, 0.50 0.06, 0.07Absolute near horizontal !0.02, 0.57 0.04, 0.24 0.02, 0.56 !0.09, 0.003Absolute far horizontal 0.01, 0.86 0.02, 0.54 0.01, 0.66 0.09, 0.004Absolute near vertical 0.04, 0.24 0.01, 0.66 0.03, 0.41 0.11, 2.5 " 10!4*
Absolute far vertical 0.04, 0.23 0.02, 0.42 0.04, 0.24 0.12, 1.1 " 10!4*
* Significant after Bonferroni correction for 32 comparisons (a = 0.0015).
Table 7Correlations between binocular and other psychophysical measures.
1 2 3 4 5 6 7 8
Threshold for coherent form (sine) 0.21 0.22 0.24 0.11 0.13 0.37 0.37Threshold for coherent form (Glass) 0.17 0.21 0.20 0.28 0.32Threshold for gratings of low spatial frequency on pulsed pedestals 0.26 0.26Threshold for gratings of low spatial frequency on steady pedestals 0.25 0.24Threshold for gratings of low spatial frequency and high temporal frequency 0.11 0.11 0.20 0.21Threshold for coherent motion 0.16 0.19 0.19 0.14 0.16 0.16 0.25 0.29Threshold on Pelli Robson test 0.11 0.15 0.11Threshold for S-cone increments 0.13 0.11 0.13 0.16 0.22Threshold for S-cone decrements 0.12 0.11 0.18 0.22Threshold for differences in auditory order 0.16 0.20Threshold for differences in auditory frequency 0.12 0.12 0.13 0.13 0.14Threshold for differences in auditory duration 0.17 0.20 0.20 0.17 0.24
1. Crossed stereo acuity, 2. uncrossed stereo acuity, 3. stereo acuity averaged over crossed and uncrossed, 4. TNO stereo acuity, 5. binocular rivalry (median percept duration),6. binocular rivalry (standard deviation of percept duration), 7. unmasked contrast threshold, 8. dichoptically masked contrast threshold. Only correlations significant aftercorrection for 96 comparisons are shown (a = 5.2 " 10!4).
42 J.M. Bosten et al. / Vision Research 110 (2015) 34–50
to derive regression scores for uncrossed stereo acuity. The test–retest reliability for crossed stereo acuity regression scores wasq = 0.52 (p = 1.4 " 10!8), and for uncrossed stereo acuity regres-sion scores was 0.54 (p = 2.2 " 10!9).
For dichoptic masking we calculated regression scores fordichoptically masked contrast detection by taking the residualsof a regression of thresholds for dichoptically masked contrastdetection against thresholds for unmasked contrast detection.We did the opposite operation to calculate regression scores forunmasked contrast detection. The test–retest reliability of dichop-tically masked contrast detection regression scores (where a meanwas taken across the two eyes) was 0.48 (p = 9.3 " 10!7, n = 97).The test–retest reliability of regression scores for unmasked con-trast detection was 0.68 (p #0, n = 97).
3.7. Genetic results
In Table 8 we list SNPs that were associated with binocular phe-notypes at or below a threshold of p < 10!5. In some cases, therewas an imputed SNP in the region of interest with a strongerassociation than that of the lead genotyped SNP, and in those casesthe imputed SNP is listed in the table. For listed imputed SNPs,IMPUTE-info scores (Marchini & Howie, 2010) ranged from 0.69to 1.00, with a mean of 0.94. For all the phenotypes listed in thetable, the genomic inflation factor was either 1.00 or 1.01.
Our criterion for defining a significantly associated genetic locuswas that the permuted p-value for the associated SNP should belower than 0.05. Only one genotyped SNP met this criterion, foran association with self-reported ability to see autostereograms(p = 0.014). The lead genotyped SNP at this locus was rs1022907(p = 1.7 " 10!8). Three imputed SNPs, rs7894830, rs2007532 andrs2120930 were also significantly associated with the phenotype(p = 1.5 " 10!8, 1.7 " 10!8 and 1.1 " 10!7, respectively). We con-sider the other associations listed in Table 8 to be ‘‘suggestive’’rather than statistically significant: we record them for the guid-ance of future researchers.
4. Discussion
4.1. Stereo acuity
Median stereo acuity for our sample of 1060 participants was60 s of arc for the TNO test and 88.2 s of arc for our adaptive test(averaged over measurements for crossed and uncrossed stereoacuity). These median values are larger than those reported inthe few other population studies of stereo acuity in adults thatwe have found, where estimates range from 12.4 to 37.2 s of arc(Bohr & Read, 2013; Coutant & Westheimer, 1993; Zaroff,Knutelska, & Frumkes, 2003). These differences could be causedby variety of tasks, variety of population samples, or practiceeffects. In particular, in our adaptive test the stimuli were pre-sented at an eccentricity of 0.7".
We can assess the impact of perceptual learning on stereothresholds by comparing the performance of our 105 returningparticipants in the first and second sessions: There was in fact nosignificant difference between stereo thresholds measured in thefirst and second sessions (t = 0.4, p = 0.69 for crossed stereo acuity;t = !0.14, p = 0.89 for uncrossed stereo acuity; t = !1.5, p = 0.13 forthe TNO). Although differences in perceptual learning may con-tribute to the variability in median stereo thresholds found acrossstudies, but we have found no evidence that it affects performanceon our tasks.
We found that 8.9% of participants performed at ceiling on theTNO test (480 arc seconds), 10.4% performed at ceiling on ouradaptive test for crossed stereo acuity (350 arc seconds), 9.2%
performed at ceiling on our adaptive test for uncrossed stereo acu-ity (350 arc seconds). However, only 5.3% of participants per-formed at ceiling on both adaptive tests, and only 2.2% ofparticipants performed at ceiling on both adaptive tests and onthe TNO test. Thus, in 2.2% of our participants, we could find no evi-dence of stereopsis.
Our results may help to explain why estimates of stereo blind-ness from population studies have varied widely from 1% to 14%(Bohr & Read, 2013; Coutant & Westheimer, 1993; Rahi,Cumberland, & Peckham, 2009; Richards, 1970; Zaroff, Knutelska,& Frumkes, 2003). It may be that particular individuals have par-ticular difficulties with certain tests of stereo acuity. The TNO testwas personally administered by experimenters, and we found thatsome participants needed encouragement to ‘‘tune in’’ to the dis-parity information—but once they had, their thresholds could bequite low. (‘‘Tuning in’’ may be the process of learning to attendto the relevant signal, as proposed by Mollon and Danilova(1996).) For our adaptive test an example stimulus was presentedas part of the instructions, and participants called the experi-menter if they could not perceive the depth. Again, some partici-pants suddenly perceived depth once their attention was drawnto it. Naïve psychophysical subjects are unlikely to be practisedat perceiving disparity information in the absence of other depthcues. They may need time and encouragement to attend to therelevant signal; and, since we have found that individuals can per-form at ceiling on some stereo tasks and not others, learning toattend to the relevant signal may not transfer fully between differ-ent stereo tasks.
4.1.1. Crossed and uncrossed stereo acuityThere is divided opinion over whether crossed and uncrossed
stereopsis are subserved by different mechanisms. WhitmanRichards proposed not only that crossed and uncrossed stereopsisrely on different neural machinery (Richards, 1971; Richards &Regan, 1973), but that the inheritance of each ability can bedescribed by a simple genetic model (Richards, 1970).
In our population, crossed and uncrossed stereo acuities mea-sured using our adaptive test are highly correlated (q = 0.67).However, both crossed and uncrossed stereo acuity show signifi-cant test–retest reliability when the effect of the other is regressedout (q = 0.52 for crossed stereo acuity, and q = 0.54 for uncrossedstereo acuity). The correlation between crossed and uncrossedstereo acuity is greater than the reliabilities of the residuals foreach ability following regression on the other. But does this implythat the amount of variance shared between crossed and uncrossedstereo acuity is greater than the amount of variance unique toeach? The direct comparison neglects the fact that the correlationbetween measures (over the whole sample of 1060 participants) iswithin-session, while test–retest reliabilities use data gatheredover two independent sessions (from our 105 returning partici-pants). Using data gathered in different sessions will add additionalsources of variability. In order to make a fair comparison, we canuse inter-test reliabilities (Goodbourn et al., 2012), where perfor-mance on one measure gathered in session 1 is correlated withperformance on a different measure gathered in session 2, and viceversa. The inter-test reliabilities for crossed and uncrossed stereoacuity are q = 0.61 (p = 3.6 " 10!12) and q = 0.58 (p = 1.3 " 10!10).A comparison of inter-test reliabilities (0.61 and 0.58) and thereliabilities of the regression scores (0.52 and 0.54) shows thatthe proportion of variance shared between crossed and uncrossedstereo acuity tends to be somewhat greater than the proportion ofvariance unique to either measure. However, the differencebetween the correlation coefficients is not significant. The sharedvariance between thresholds for crossed and uncrossed stereo dis-parities implies that a common mechanism subserves part of theindividual variation in crossed and uncrossed stereo acuity.
J.M. Bosten et al. / Vision Research 110 (2015) 34–50 43
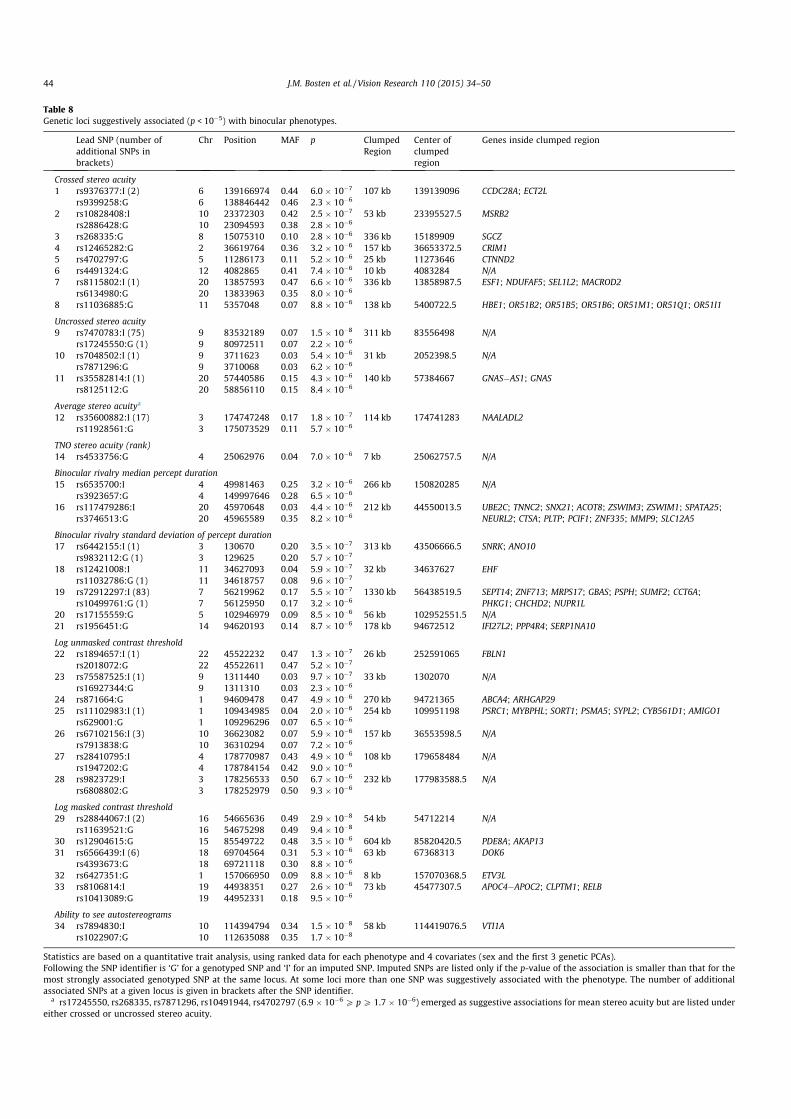
Table 8Genetic loci suggestively associated (p < 10!5) with binocular phenotypes.
Lead SNP (number ofadditional SNPs inbrackets)
Chr Position MAF p ClumpedRegion
Center ofclumpedregion
Genes inside clumped region
Crossed stereo acuity1 rs9376377:I (2) 6 139166974 0.44 6.0 " 10!7 107 kb 139139096 CCDC28A; ECT2L
rs9399258:G 6 138846442 0.46 2.3 " 10!6
2 rs10828408:I 10 23372303 0.42 2.5 " 10!7 53 kb 23395527.5 MSRB2rs2886428:G 10 23094593 0.38 2.8 " 10!6
3 rs268335:G 8 15075310 0.10 2.8 " 10!6 336 kb 15189909 SGCZ4 rs12465282:G 2 36619764 0.36 3.2 " 10!6 157 kb 36653372.5 CRIM15 rs4702797:G 5 11286173 0.11 5.2 " 10!6 25 kb 11273646 CTNND26 rs4491324:G 12 4082865 0.41 7.4 " 10!6 10 kb 4083284 N/A7 rs8115802:I (1) 20 13857593 0.47 6.6 " 10!6 336 kb 13858987.5 ESF1; NDUFAF5; SEL1L2; MACROD2
rs6134980:G 20 13833963 0.35 8.0 " 10!6
8 rs11036885:G 11 5357048 0.07 8.8 " 10!6 138 kb 5400722.5 HBE1; OR51B2; OR51B5; OR51B6; OR51M1; OR51Q1; OR51I1
Uncrossed stereo acuity9 rs7470783:I (75) 9 83532189 0.07 1.5 " 10!8 311 kb 83556498 N/A
rs17245550:G (1) 9 80972511 0.07 2.2 " 10!6
10 rs7048502:I (1) 9 3711623 0.03 5.4 " 10!6 31 kb 2052398.5 N/Ars7871296:G 9 3710068 0.03 6.2 " 10!6
11 rs35582814:I (1) 20 57440586 0.15 4.3 " 10!6 140 kb 57384667 GNAS!AS1; GNASrs8125112:G 20 58856110 0.15 8.4 " 10!6
Average stereo acuitya
12 rs35600882:I (17) 3 174747248 0.17 1.8 " 10!7 114 kb 174741283 NAALADL2rs11928561:G 3 175073529 0.11 5.7 " 10!6
TNO stereo acuity (rank)14 rs4533756:G 4 25062976 0.04 7.0 " 10!6 7 kb 25062757.5 N/A
Binocular rivalry median percept duration15 rs6535700:I 4 49981463 0.25 3.2 " 10!6 266 kb 150820285 N/A
rs3923657:G 4 149997646 0.28 6.5 " 10!6
16 rs117479286:I 20 45970648 0.03 4.4 " 10!6 212 kb 44550013.5 UBE2C; TNNC2; SNX21; ACOT8; ZSWIM3; ZSWIM1; SPATA25;NEURL2; CTSA; PLTP; PCIF1; ZNF335; MMP9; SLC12A5rs3746513:G 20 45965589 0.35 8.2 " 10!6
Binocular rivalry standard deviation of percept duration17 rs6442155:I (1) 3 130670 0.20 3.5 " 10!7 313 kb 43506666.5 SNRK; ANO10
rs9832112:G (1) 3 129625 0.20 5.7 " 10!7
18 rs12421008:I 11 34627093 0.04 5.9 " 10!7 32 kb 34637627 EHFrs11032786:G (1) 11 34618757 0.08 9.6 " 10!7
19 rs72912297:I (83) 7 56219962 0.17 5.5 " 10!7 1330 kb 56438519.5 SEPT14; ZNF713; MRPS17; GBAS; PSPH; SUMF2; CCT6A;PHKG1; CHCHD2; NUPR1Lrs10499761:G (1) 7 56125950 0.17 3.2 " 10!6
20 rs17155559:G 5 102946979 0.09 8.5 " 10!6 56 kb 102952551.5 N/A21 rs1956451:G 14 94620193 0.14 8.7 " 10!6 178 kb 94672512 IFI27L2; PPP4R4; SERP1NA10
Log unmasked contrast threshold22 rs1894657:I (1) 22 45522232 0.47 1.3 " 10!7 26 kb 252591065 FBLN1
rs2018072:G 22 45522611 0.47 5.2 " 10!7
23 rs75587525:I (1) 9 1311440 0.03 9.7 " 10!7 33 kb 1302070 N/Ars16927344:G 9 1311310 0.03 2.3 " 10!6
24 rs871664:G 1 94609478 0.47 4.9 " 10!6 270 kb 94721365 ABCA4; ARHGAP2925 rs11102983:I (1) 1 109434985 0.04 2.0 " 10!6 254 kb 109951198 PSRC1; MYBPHL; SORT1; PSMA5; SYPL2; CYB561D1; AMIGO1
rs629001:G 1 109296296 0.07 6.5 " 10!6
26 rs67102156:I (3) 10 36623082 0.07 5.9 " 10!6 157 kb 36553598.5 N/Ars7913838:G 10 36310294 0.07 7.2 " 10!6
27 rs28410795:I 4 178770987 0.43 4.9 " 10!6 108 kb 179658484 N/Ars1947202:G 4 178784154 0.42 9.0 " 10!6
28 rs9823729:I 3 178256533 0.50 6.7 " 10!6 232 kb 177983588.5 N/Ars6808802:G 3 178252979 0.50 9.3 " 10!6
Log masked contrast threshold29 rs28844067:I (2) 16 54665636 0.49 2.9 " 10!8 54 kb 54712214 N/A
rs11639521:G 16 54675298 0.49 9.4 " 10!8
30 rs12904615:G 15 85549722 0.48 3.5 " 10!6 604 kb 85820420.5 PDE8A; AKAP1331 rs6566439:I (6) 18 69704564 0.31 5.3 " 10!6 63 kb 67368313 DOK6
rs4393673:G 18 69721118 0.30 8.8 " 10!6
32 rs6427351:G 1 157066950 0.09 8.8 " 10!6 8 kb 157070368.5 ETV3L33 rs8106814:I 19 44938351 0.27 2.6 " 10!6 73 kb 45477307.5 APOC4!APOC2; CLPTM1; RELB
rs10413089:G 19 44952331 0.18 9.5 " 10!6
Ability to see autostereograms34 rs7894830:I 10 114394794 0.34 1.5 " 10!8 58 kb 114419076.5 VTI1A
rs1022907:G 10 112635088 0.35 1.7 " 10!8
Statistics are based on a quantitative trait analysis, using ranked data for each phenotype and 4 covariates (sex and the first 3 genetic PCAs).Following the SNP identifier is ‘G’ for a genotyped SNP and ‘I’ for an imputed SNP. Imputed SNPs are listed only if the p-value of the association is smaller than that for themost strongly associated genotyped SNP at the same locus. At some loci more than one SNP was suggestively associated with the phenotype. The number of additionalassociated SNPs at a given locus is given in brackets after the SNP identifier.
a rs17245550, rs268335, rs7871296, rs10491944, rs4702797 (6.9 " 10!6 P pP 1.7 " 10!6) emerged as suggestive associations for mean stereo acuity but are listed undereither crossed or uncrossed stereo acuity.
44 J.M. Bosten et al. / Vision Research 110 (2015) 34–50
Similarly, the significant test–retest reliabilities of the regressionscores shows that part of the individual variation in stereo acuityderives from mechanisms unique to crossed and to uncrosseddisparities.
4.2. Correlations between measures
We have found significant correlations within our set of binocu-lar measures, as well as between the binocular measures anddemographic and anatomical measures, and with other psy-chophysical measures. Some measures we included in the batteryto confirm associations already reported in the literature, and wehave replicated these findings in our large sample, though typicallywith a smaller effect size.
The correlation we might expect to be strongest is between thetwo measures of stereo acuity, our adaptive test and the TNO test.Yet this correlation is only moderate at q = 0.32. Noise in bothmeasures—suggested by the test–retest reliabilities—means thateven if the variables were truly perfectly correlated, we wouldexpect to observe a correlation coefficient of only 0.44. Takingthe test–retest reliabilities into account, we can estimate the cor-relation between the ‘‘universe scores’’ (the mean of an infinitenumber of measurements) as 0.72. The effect sizes of other signifi-cant correlations that we have found must also be interpreted withthe limits imposed by measurement noise in mind.
We have found that stereo acuity is significantly correlated withbinocular visual acuity. It is also separately significantly correlatedwith visual acuity in both the better and the worse eye, though thecorrelation is stronger with visual acuity in the worse eye. Stereoacuity correlates more strongly still with interocular difference invisual acuity. We found one correlational study for individual dif-ferences in visual acuity and individual differences in stereo acuity:Lam et al. (1996) report a negative correlation between interoculardifference in visual acuity and stereo acuity. Our results are in con-cordance with their finding. There are a number of reports thatstereo acuity worsens when visual acuity is disrupted using lenses(Costa et al., 2010; Goodwin & Romano, 1985; Odell et al., 2009), oranisometropia is artificially induced (Brooks, Johnson, & Fischer,1996; Oguz & Oguz, 2000).
Replicating Baker and Graf (2009), we find a significant relation-ship between the magnitude of dichoptic masking and the rate ofbinocular rivalry, with stronger masking associated with longerpercept durations. We also replicated Wilmer and Backus’ (2008)finding that stereo acuity is positively associated with self-re-ported ability to see autostereograms.
Our finding that rate of binocular rivalry decreases with agereplicates earlier reports by Jalavisto (1964) and Ukai, Ando, andKuze (2003). However, these earlier studies included older partici-pants (40–80+ for Jalavisto and 20–64 for Ukai et al.) than did thepresent study, where ages were restricted from 16 to 40. Our find-ing of the relationship in young subjects suggests that decliningrivalry rates are not caused by optical effects of aging. Indeed,when visual acuity with usual correction is entered as a covariateinto the correlation, its size barely changes (q = 0.14,p = 4.8 " 10!6).
In unmasked contrast detection, we found a significant sex dif-ference: Men, on average, were 0.3 standard deviations more sen-sitive than women. Where sex differences in contrast sensitivityhave been reported in the literature, they tend to be in the samedirection as in the present study (Abramov et al., 2012; Hashemiet al., 2012; Oen, Lim, & Chung, 1994). Brabyn and McGuinness(1979) report an interaction between sex and spatial frequencywith females superior at low spatial frequencies and males at high.In other cases no significant sex differences have been found(Owsley, Sekuler, & Siemsen, 1983; Solberg & Brown, 2002). Wenote that a sample size of 330 would be needed to detect with
80% power an effect of the size that we found in the present study,and that typical past sample sizes have been much smaller thanthis. However, we must interpret our sex difference with cautionbecause we have not randomly sampled total male and femalepopulations.
Surprisingly, we found only a small correlation (q = 0.07) ofinter-pupillary distance (IPD) with stereo acuity measured usingthe TNO test, and no significant correlation with stereo acuity mea-sured using our adaptive test. The correlation between IPD andTNO score was positive, meaning stereo acuity tends to be worsewith greater IPD. But what relationship should we expect? In thereal world, a greater IPD means greater binocular disparities, andpresumably superior ability to detect small differences in depth.But in tests of stereo acuity the binocular disparities are fixed. Agiven disparity would correspond to smaller differences in real-world depth for someone with a small IPD than for someone witha large IPD. We should therefore expect that performance on thesetests would not improve and might even worsen with increasingIPD. Our largely negative finding is supported by previous studies(e.g. Eom et al., 2013). Frisby, Davis, and Edgar (2003) report a posi-tive correlation between IPD and stereo acuity using the real-depthHoward-Dolman test, as would be expected.
We found no significant differences in unmasked or binocularlymasked contrast thresholds between the sighting dominant andthe non-dominant eyes. This may seem surprising, but is consis-tent with previous findings that there is no correlation betweensighting dominance and ‘‘sensory’’ dominance, defined by bestvisual performance, for example best acuity, or best contrastsensitivity (Mapp, Ono, & Barbeito, 2003; Porac & Coren, 1975;Suttle et al., 2009). We did find that for binocular rivalry, thestimulus presented to the dominant eye is perceived for a signifi-cantly greater proportion of the time than the stimulus presentedto the non-dominant eye. This is consistent with earlier results(Handa et al., 2004; Porac & Coren, 1978).
Perhaps surprisingly, we found no strong correlations betweenstereo acuity and phorias, whether phorias were scaled fromesophoria to exophoria or were expressed absolutely. The relation-ship between stereo acuity and phorias has also been investigatedin several earlier studies. Lam et al. (2002) also found no significantcorrelation between phoria and either crossed or uncrossed stereoacuity, but found that in exophores only, crossed stereo acuity wassuperior to uncrossed stereo acuity. Shippman and Cohen (1983)found that exophores have better crossed than uncrossed stereoacuity while esophores show the opposite pattern. When we breakdown the data from our adaptive test in the same way, definingexophoria and esophoria (following Lam et al.) as deviationsgreater than 2 diopters, we find the same pattern as Shippmanand Cohen. For near phoria, orthophores show no significant differ-ence between crossed and uncrossed stereo acuity (!xcrossed = 118.3,!xuncrossed = 118.8, t = 0.09, p = 0.92), exophores show significantlybetter crossed than uncrossed stereo acuity (!xcrossed = 121.7,!xuncrossed = 128.6, t = 2.29, p = 0.02) and esophores show signifi-cantly better uncrossed than crossed stereo acuity(!xcrossed = 152.7, !xuncrossed = 135.1, t = 2.25, p = 0.03). This small—though interesting—difference between the groups may result, asShippman and Cohen suggest, from different asymmetries inPanum’s area between groups.
Saladin (1995) found in a large population that stereo acuityworsened with increasing esophoria but was not significantlyaffected by exophoria. Though our correlations between stereoacuity and phoria are small, there may be non-linear relationshipslike those found by Saladin. Fig. 3 is the equivalent of Saladin’sFig. 1, except that we include crossed and uncrossed stereo acuity,and near and far horizontal phorias, separately. The figure shows anegative linear relationship between crossed stereo acuity and farphoria. For crossed stereo acuity, as Saladin found, esophores are
J.M. Bosten et al. / Vision Research 110 (2015) 34–50 45
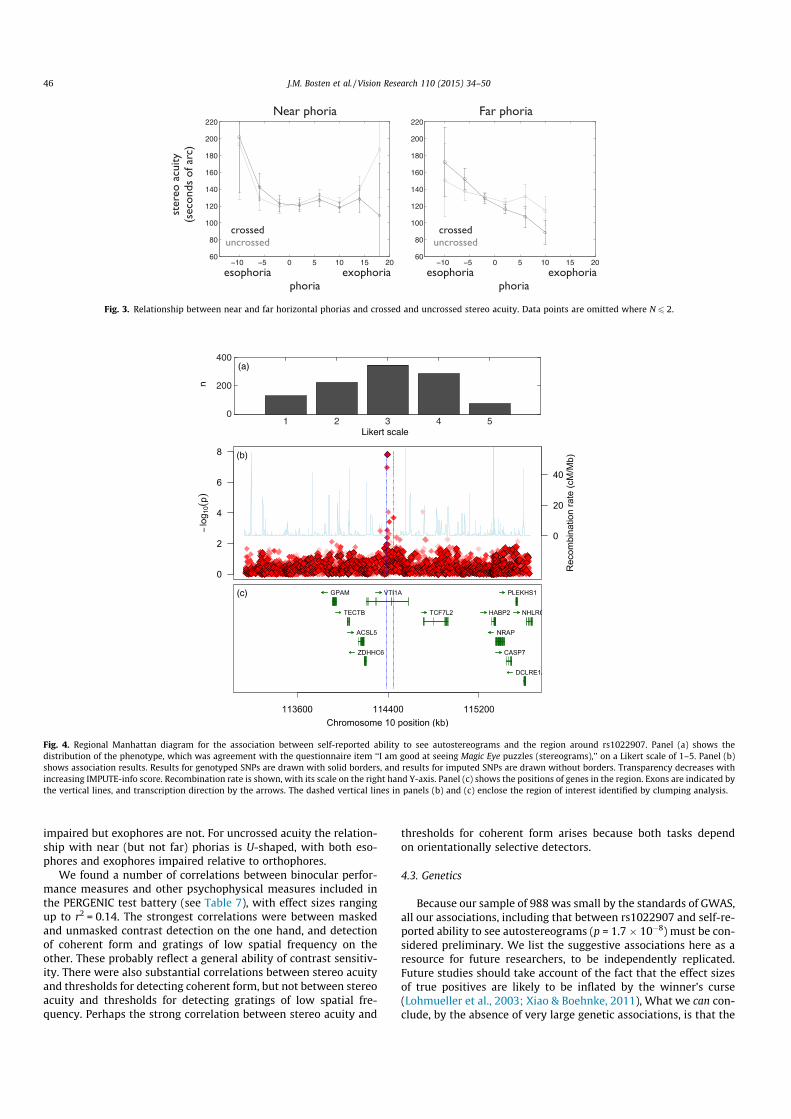
impaired but exophores are not. For uncrossed acuity the relation-ship with near (but not far) phorias is U-shaped, with both eso-phores and exophores impaired relative to orthophores.
We found a number of correlations between binocular perfor-mance measures and other psychophysical measures included inthe PERGENIC test battery (see Table 7), with effect sizes rangingup to r2 = 0.14. The strongest correlations were between maskedand unmasked contrast detection on the one hand, and detectionof coherent form and gratings of low spatial frequency on theother. These probably reflect a general ability of contrast sensitiv-ity. There were also substantial correlations between stereo acuityand thresholds for detecting coherent form, but not between stereoacuity and thresholds for detecting gratings of low spatial fre-quency. Perhaps the strong correlation between stereo acuity and
thresholds for coherent form arises because both tasks dependon orientationally selective detectors.
4.3. Genetics
Because our sample of 988 was small by the standards of GWAS,all our associations, including that between rs1022907 and self-re-ported ability to see autostereograms (p = 1.7 " 10!8) must be con-sidered preliminary. We list the suggestive associations here as aresource for future researchers, to be independently replicated.Future studies should take account of the fact that the effect sizesof true positives are likely to be inflated by the winner’s curse(Lohmueller et al., 2003; Xiao & Boehnke, 2011), What we can con-clude, by the absence of very large genetic associations, is that the
Fig. 3. Relationship between near and far horizontal phorias and crossed and uncrossed stereo acuity. Data points are omitted where N 6 2.
Fig. 4. Regional Manhattan diagram for the association between self-reported ability to see autostereograms and the region around rs1022907. Panel (a) shows thedistribution of the phenotype, which was agreement with the questionnaire item ‘‘I am good at seeing Magic Eye puzzles (stereograms),’’ on a Likert scale of 1–5. Panel (b)shows association results. Results for genotyped SNPs are drawn with solid borders, and results for imputed SNPs are drawn without borders. Transparency decreases withincreasing IMPUTE-info score. Recombination rate is shown, with its scale on the right hand Y-axis. Panel (c) shows the positions of genes in the region. Exons are indicated bythe vertical lines, and transcription direction by the arrows. The dashed vertical lines in panels (b) and (c) enclose the region of interest identified by clumping analysis.
46 J.M. Bosten et al. / Vision Research 110 (2015) 34–50

individual variability in binocular traits that we have measured inour sample is unlikely to be monogenic or oligogenic. Instead, theputative genetic determinants of performance on our binoculartasks may be many and varied, with a large number of loci eachcontributing a small effect.
The association between rs1022907 and self-reported ability tosee autostereograms was the only association to pass the stringentpermutation test (p = 0.014). Since the correlations between self-reported ability to see autostereograms and our psychophysicalmeasures of stereo acuity are fairly low (q = 0.14 for TNO andq = 0.16 for our adaptive test), the association may not be due toindividual differences in stereo acuity. Indeed, when TNO scoreand score on our adaptive measure of stereo acuity are introducedinto the association as covariates, the p-value of the associationincreases only slightly to 8.8 " 10!8.
A Manhattan diagram for the region around rs1022907 isshown in Fig. 4. The associated SNP, rs1022907, lies in an intronicregion of the gene VTI1A, which encodes the v-SNARE proteinVTI1A. The associated region of interest surrounding rs1022907also contains the 6th and 7th exons of VTI1A, and the microRNAMIR4295. Two functions of VTI1A may be relevant to the geneticassociation we find here: It selectively maintains spontaneous(rather than evoked) neurotransmitter release (Ramirez et al.,2012), and it is involved in the development of neurons and axontracts (Kunwar et al., 2011). Specifically relevant to binocularvision is the finding that in mice double knockout for VTI1A andVTI1B, the optic tract and optic chiasm are diminished.
If the association between rs1022907 and self-reported abilityto see autostereograms is not driven by individual differences instereo acuity, what might be driving it? We correlated responseon the autostereogram questionnaire item with performance onmany other psychophysical and questionnaire measures gatheredfor PERGENIC. Apart from correlations with stereo acuity, therewere significant positive correlations (a = 0.0003, after correction
for 169 comparisons) with other self-reported abilities includingaptitude for sport and ball sports, and self-reported synesthesia;and there were negative correlations with several measures ofmean response time and variability of response times in psy-chophysical tasks. However, none of these measures was associ-ated with rs1022907, even at p < 0.05.
There are 33 additional loci, containing 68 genes, suggestivelyassociated with binocular traits (see Table 8). Of these, genes thathave been implicated previously in brain or eye development,brain function in adults, or brain and eye pathologies may be themost plausible candidates. We summarise existing findings aboutthese candidates in Table 9.
An interesting pair are ETV3L and EHF: ETV3L is a retinoic acidtarget gene that inhibits the action of ETS genes (of which EHF isa member) in mediating primary neurogenesis (Janesick et al.,2013).
Two genes (CLPTM1 and ARHGAP29) are associated with cleft lipand palette (Beaty et al., 2010; Leslie et al., 2013; Yoshiura et al.,1998); it may be relevant that there are ocular abnormalities insome patients (Anchlia et al., 2011).
ABCA4 is a very plausible candidate for contrast sensitivity: Thisgene encodes an ATP-binding cassette transporter that is expressedexclusively in retinal photoreceptor cells and that clears all-trans-retinal aldehyde. It is associated with rod-cone dystrophy(Kitiratschky et al., 2008; Maugeri et al., 2000), fundus flavimac-ulatus (Allikmets et al., 1997; Azarian & Travis, 1997; Illing,Molday, & Molday, 1997) and age-related macular degeneration(Fritsche et al., 2012).
Acknowledgments
This work was supported by the Gatsby Charitable Foundation(GAT2903). J.B. was supported by a fellowship from Gonville andCaius College. The authors are grateful to Horace Barlow, Roger
Table 9Genes in suggestively associated regions that have been associated with brain or eye development and function.
Brain or eye developmentCRIM1 Neural morphogenesis Kolle et al. (2000) and Ponferrada et al. (2012)
Retinal vascular stability during development Fan et al. (2014)CTNND2 Regulation of spine and synapse morphogenesis Arikkath et al. (2009)SEPT14 Cortical neuronal migration Shinoda et al. (2010)AMIGO1 Promotes growth and fasciculation of neurites Chen, Hor, and Tang (2012) and Kuja-Panula et al. (2003)DOK6 Promotes RET-mediated neurite growth Crowder et al. (2004)SLC12A5 Terminates GABA-mediated cortical migration of Interneurons in the developing brain Bortone and Polleux (2009)ETV3L Inhibits the action of ETS genes in mediating primary neurogenesis Janesick et al. (2013)
Brain or eye functionCTNND2 Activity dependent synaptic plasticity Brigidi et al. (2014)
Maintenance of dendrites in mature cortex Matter et al. (2009)SLC12A5 Encodes KCC2, the main K-Cl transporter to extrude choride for promotion of fast
hyperpolarising postsynaptic inhibition in the brainRivera et al. (1999)
CRIM1 Candidate gene for plasticity in ocular dominance columns Rietman et al. (2012)ABCA4 Encodes an ATP-binding cassette transporter that clears all-trans-retinal aldehyde from
photoreceptorsSun, Molday, and Nathans (1999)
Brain or eye pathologiesNDUFAF5 Leigh syndrome Bénit et al. (2004) and Finsterer (2008)CTNND2 Pathological myopia Li et al. (2011), Liu and Zhang (2014), Lu et al. (2011), Yu
et al. (2012)Cri du chat syndrome Medina et al. (2000)Age-related cataract Jun et al. (2012)
MACROD2 Autism Anney et al. (2010)ADHD Lionel et al. (2011)
SLC12A5 Schizophrenia Tao et al. (2012)ANO10 Spinocerebellar ataxia Chamova et al. (2012), Vermeer et al. (2010)FBLN1 In a chromosomal section, containing four genes, that has been associated with vitreoretinal
dystrophyWeigell-Weber et al. (2003)
ABCA4 Rod-cone dystrophy Kitiratschky et al. (2008), Maugeri et al. (2000)Fundus flavimaculatus Allikmets et al. (1997), Azarian and Travis (1997) and Illing,
Molday, and Molday (1997)Age-related macular degeneration Fritsche et al. (2012)
J.M. Bosten et al. / Vision Research 110 (2015) 34–50 47
Freedman, Graeme Mitchison and Richard Durbin for their role inthe initiation of the PERGENIC project, and to Emily Clemente,Julien Bauer, and Kerry Cliffe of Cambridge Genomic Services fortheir valuable help.
References
Abecasis, G. R., Altshuler, D., Auton, A., Brooks, L. D., Durbin, R. M., Gibbs, R. A., et al.(2010). A map of human genome variation from population-scale sequencing.Nature, 467(7319), 1061–1073. http://dx.doi.org/10.1038/nature09534.
Abramov, I., Gordon, J., Feldman, O., & Chavarga, A. (2012). Sex & vision I: Spatio-temporal resolution. Biology of Sex Differences, 3. 20.
Allikmets, R., Singh, N., Sun, H., Shroyer, N., Hutchinson, A., Chidambaram, A., et al.(1997). A photoreceptor cell-specific ATP-binding transporter gene (ABCR) ismutated in recessive Stargardt macular dystrophy. Nature Genetics, 15,236–246.
Anchlia, S., Rao, K. S., Bonanthaya, K., Anupama, B., & Nayak, I. V. (2011). Ophthalmicconsiderations in cleft lip and palate patients. Journal of Maxillofacial and OralSurgery, 10(1), 14–19.
Anney, R., Klei, L., Pinto, D., Regan, R., Conroy, J., Magalhaes, T. R., et al. (2010). Agenome-wide scan for common alleles affecting risk for autism. HumanMolecular Genetics, 19(20), 4072–4082.
Arikkath, J., Peng, I.-F., Ng, Y. G., Israely, I., Liu, X., Ullian, E. M., et al. (2009). Delta-catenin regulates spine and synapse morphogenesis and function inhippocampal neurons during development. The Journal of Neuroscience,29(17), 5435–5442.
Azarian, S. M., & Travis, G. H. (1997). The photoreceptor rim protein is an ABCtransporter encoded by the gene for recessive Stargardt’s disease (ABCR). FEBSLetters, 409(2), 247–252.
Baker, D. H., & Graf, E. W. (2009). On the relation between dichoptic masking andbinocular rivalry. Vision Research, 49(4), 451–459.
Baker, D. H., & Meese, T. S. (2007). Binocular contrast interactions: Dichopticmasking is not a single process. Vision Research, 47(24), 3096–3107.
Barlow, H. B., Blakemore, C., & Pettigrew, J. D. (1967). The neural mechanism ofbinocular depth discrimination. The Journal of Physiology, 193, 327–342.
Baron-Cohen, S., Wheelwright, S., Skinner, R., Martin, J., & Clubley, E. (2001). Theautism-spectrum quotient (AQ): Evidence from Asperger syndrome/high-functioning autism, males and females, scientists and mathematicians. Journalof Autism and Developmental Disorders, 31(1), 5–17.
Barry, S. R. (2012). Beyond the critical period: Acquiring stereopsis in adulthood. InJ. K. E. Steeves & L. R. Harris (Eds.), Plasticity in sensory systems (pp. 175–195).Cambridge, UK: Cambridge University Press.
Beaty, T. H., Murray, J. C., Marazita, M. L., Munger, R. G., Ruczinski, I., Hetmanski, J. B.,et al. (2010). A genome-wide association study of cleft lip with and withoutcleft palate identifies risk variants near MAFB and ABCA4. Nature Genetics, 42(6),525–529.
Bénit, P., Slama, A., Cartault, F., Giurgea, I., Chretien, D., Lebon, S., et al. (2004).Mutant NDUFS3 subunit of mitochondrial complex I causes Leigh syndrome.Journal of Medical Genetics, 41(1), 14–17.
Birch, E. E., Gwiazda, J., & Held, R. (1982). Stereoacuity development for crossed anduncrossed disparities in human infants. Vision Research, 22, 507–513.
Blakemore, C. (1979). The development of stereoscopic mechanisms in the visualcortex of the cat. Proceedings of the Royal Society B: Biological Sciences, 204(1157),477–484.
Bohr, I., & Read, J. C. (2013). Stereoacuity with Frisby and revised FD2 stereo tests.PLoS One, 8(12), e82999.
Bortone, D., & Polleux, F. (2009). KCC2 expression promotes the termination ofcortical interneuron migration in a voltage-sensitive calcium-dependentmanner. Neuron, 62(1), 53–71.
Bosten, J. M., Bargary, G., Goodbourn, P. T., Hogg, R. E., Lawrance-Owen, A. J., &Mollon, J. D. (2014). Individual differences provide psychophysical evidence forseparate on- and off-pathways deriving from short-wave cones. Journal of theOptical Society of America, 31(4), A47–A54.
Bosten, J. M., Hogg, R. E., Bargary, G., Goodbourn, P. T., Lawrance-Owen, A. J., &Mollon, J. D. (2014). Suggestive association with ocular phoria at chromosome6p22. Investigative Ophthalmology & Visual Science, 55(1), 345–352.
Brabyn, L. B., & McGuinness, D. (1979). Gender differences in response to spatialfrequency and stimulus orientation. Perception & Psychophysics, 26(4), 319–324.
Brainard, D. H. (1997). The psychophysics toolbox. Spatial Vision, 10(4), 433–436.Brigidi, G. S., Sun, Y., Beccano-Kelly, D., Pitman, K., Mobasser, M., Borgland, S. L., et al.
(2014). Palmitoylation of d-catenin by DHHC5 mediates activity-inducedsynapse plasticity. Nature Neuroscience, 17(4), 522–532.
Brooks, S. E., Johnson, D., & Fischer, N. (1996). Anisometropia and binocularity.Ophthalmology, 103(7), 1139–1143.
Chamova, T., Florez, L., Guergueltcheva, V., Raycheva, M., Kaneva, R., Lochmüller, H.,et al. (2012). ANO10 c.1150_1151del is a founder mutation causing autosomalrecessive cerebellar ataxia in Roma/Gypsies. Journal of Neurology, 259(5),906–911.
Chen, Y., Hor, H. H., & Tang, B. L. (2012). AMIGO is expressed in multiple brain celltypes and may regulate dendritic growth and neuronal survival. Journal ofCellular Physiology, 227(5), 2217–2229.
Costa, M. F., Moreira, S. M., Hamer, R. D., & Ventura, D. F. (2010). Effects of age andoptical blur on real depth stereoacuity. Ophthalmic and Physiological Optics,30(5), 660–666.
Coutant, B. E., & Westheimer, G. (1993). Population distribution of stereoscopicability. Ophthalmic and Physiological Optics, 13(1), 3–7.
Crowder, R. J., Enomoto, H., Yang, M., Johnson, E. M., & Milbrandt, J. (2004). Dok-6, aNovel p62 Dok family member, promotes Ret-mediated neurite outgrowth. TheJournal of Biological Chemistry, 279(40), 42072–42081.
DeGutis, J., Wilmer, J., Mercado, R. J., & Cohan, S. (2013). Using regression tomeasure holistic face processing reveals a strong link with face recognitionability. Cognition, 126(1), 87–100.
Donnellan, M., Oswald, F. L., Baird, B. M., & Lucas, R. E. (2006). The mini-IPIP scales:Tiny-yet-effective measures of the Big Five factors of personality. PsychologicalAssessment, 18(2), 192–203.
Eom, Y., Song, J.-S., Ahn, S.-E., Kang, S.-Y., Suh, Y.-W., Oh, J., et al. (2013). Effects ofinterpupillary distance on stereoacuity: The Frisby Davis distance stereotestversus a 3-dimensional distance stereotest. Japanese Journal of Ophthalmology,57(5), 486–492.
Fan, J., Ponferrada, V. G., Sato, T., Vemaraju, S., Fruttiger, M., Gerhardt, H., et al.(2014). Crim1 maintains retinal vascular stability during development byregulating endothelial cell Vegfa autocrine signaling. Development, 141(2),448–459.
Finsterer, J. (2008). Leigh and Leigh-like syndrome in children and adults. PediatricNeurology, 39(4), 223–235.
Frisby, J., Davis, H., & Edgar, R. (2003). Does interpupillary distance predictstereoacuity for normal observers? Perception, 32 (ECVP Abstract Supplement),73–74.
Fritsche, L. G., Fleckenstein, M., Fiebig, B. S., Schmitz-Valckenberg, S., Bindewald-Wittich, A., Keilhauer, C. N., et al. (2012). A subgroup of age-related maculardegeneration is associated with mono-allelic sequence variants in the ABCA4gene. Investigative Ophthalmology & Visual Science, 53(4), 2112–2118.
Glass, L. (1969). Moiré effect from random dots. Nature, 223, 578–580.Goodbourn, P. T., Bosten, J. M., Bargary, G., Hogg, R. E., Lawrance-Owen, A. J., &
Mollon, J. D. (2014). Variants in the 1q21 risk region are associated with a visualendophenotype of autism and schizophrenia. Genes, Brain, and Behavior, 13(2),144–151.
Goodbourn, P. T., Bosten, J. M., Hogg, R. E., Bargary, G., Lawrance-Owen, A. J., &Mollon, J. D. (2012). Do different ‘‘magnocellular tasks’’ probe the same neuralsubstrate? Proceedings of the Royal Society B: Biological Sciences, 279, 4263–4271.
Goodwin, R. T., & Romano, P. E. (1985). Stereoacuity degradation by experimentaland real monocular and binocular amblyopia. Investigative Ophthalmology &Visual Science, 26(7), 917–923.
Hancock, S., Gareze, L., Findlay, J. M., & Andrews, T. J. (2012). Temporal patterns ofsaccadic eye movements predict individual variation in alternation rate duringbinocular rivalry. I-Perception, 3(1), 88–96.
Handa, T., Mukuno, K., Uozato, H., Niida, T., Shoji, N., & Shimizu, K. (2004). Effects ofdominant and nondominant eyes in binocular rivalry. Optometry and VisionScience, 81(5), 377–383.
Hashemi, H., Khabazkhoob, M., Jafarzadehpur, E., Emamian, M. H., Shariati, M., &Fotouhi, A. (2012). Contrast sensitivity evaluation in a population-based studyin Shahroud, Iran. Ophthalmology, 119(3), 541–546.
Heron, S., & Lages, M. (2012). Screening and sampling in studies of binocular vision.Vision Research, 62, 228–234.
Howie, B. N., Donnelly, P., & Marchini, J. (2009). A flexible and accurate genotypeimputation method for the next generation of genome-wide association studies.PLoS Genetics, 5(6), e1000529.
Howie, B., Marchini, J., & Stephens, M. (2011). Genotype imputation with thousandsof genomes. G3 (Bethesda), 1(6), 457–470.
Hubel, D. H., & Wiesel, T. N. (1965). Binocular interaction in striate cortext of kittensreared with artifical squint. Journal of Neurophysiology, 28(6), 1041–1059.
Hudak, M., Gervan, P., Friedrich, B., Pastukhov, A., Braun, J., & Kovacs, I. (2011).Increased readiness for adaptation and faster alternation rates under binocularrivalry in children. Frontiers in Human Neuroscience, 5, 128.
Illing, M., Molday, L. L., & Molday, R. S. (1997). The 220-kDa rim protein of retinalrod outer segments is a member of the ABC transporter superfamily. Journal ofBiological Chemistry, 272(15), 10303–10310.
Jalavisto, E. (1964). The phenomenon of retinal rivalry in the aged. Gerontology, 9,1–8.
Janesick, A., Abbey, R., Chung, C., Liu, S., Taketani, M., & Blumberg, B. (2013). ERF andETV3L are retinoic acid-inducible repressors required for primary neurogenesis.Development, 140(15), 3095–3106.
Jun, G., Moncaster, J. A., Koutras, C., Seshadri, S., Buros, J., McKee, A. C., et al. (2012).D-Catenin is genetically and biologically associated with cortical cataract andfuture Alzheimer-related structural and functional brain changes. PLoS One,7(9), e43728.
Kanai, R., Bahrami, B., & Rees, G. (2010). Human parietal cortex structure predictsindividual differences in perceptual rivalry. Current Biology, 20(18), 1626–1630.
King-Smith, P. E., Grigsby, S. S., Vingrys, A. J., Benes, S. C., & Supowit, A. (1994).Efficient and unbiased modifications of the QUEST threshold method: Theory,simulations, experimental evaluation and practical implementation. VisionResearch, 34(7), 885–912.
Kitiratschky, V. B., Grau, T., Bernd, A., Zrenner, E., Jägle, H., Renner, A. B., et al. (2008).ABCA4 gene analysis in patients with autosomal recessive cone and cone roddystrophies. European Journal of Human Genetics, 16(7), 812–819.
Kolle, G., Georgas, K., Holmes, G. P., Little, M. H., & Yamada, T. (2000). CRIM1, a novelgene encoding a cysteine-rich repeat protein, is developmentally regulated andimplicated in vertebrate CNS development and organogenesis. Mechanisms ofDevelopment, 90(2), 181–193.
48 J.M. Bosten et al. / Vision Research 110 (2015) 34–50

Kovacs, I., & Eisenberg, M. (2004). Human development of binocular rivlary. In D.Alais & R. Blake (Eds.), Binocular rivalry. Boston, MA: MIT Press.
Kuja-Panula, J., Kiiltomäki, M., Yamashiro, T., Rouhiainen, A., & Rauvala, H. (2003).AMIGO, a transmembrane protein implicated in axon tract development,defines a novel protein family with leucine-rich repeats. The Journal of CellBiology, 160(6), 963–973.
Kunwar, A. J., Rickmann, M., Backofen, B., Browski, S. M., Rosenbusch, J., Schöning, S.,et al. (2011). Lack of the endosomal SNAREs vti1a and vti1b led to significantimpairments in neuronal development. Proceedings of the National Academy ofSciences of the United States of America, 108(6), 2575–2580.
Lam, A. K., Chau, A. S., Lam, W. Y., Leung, G. Y., & Man, B. S. (1996). Effect of naturallyoccuring visual acuity differences between two eyes in stereoacuity. Ophthalmicand Physiological Optics, 16, 189–195.
Lam, A. K., Tse, P., Choy, E., & Chung, M. (2002). Crossed and uncrossed stereoacuityat distance and the effect from heterophoria. Ophthalmic and PhysiologicalOptics, 22(3), 189–193.
Lawrance-Owen, A. J., Bargary, G., Bosten, J. M., Goodbourn, P. T., Hogg, R. E., &Mollon, J. D. (2013). Genetic association suggests that SMOC1 mediatesbetween prenatal sex hormones and digit ratio. Human Genetics, 132(4),415–421.
Leslie, E. J., Mansilla, M. A., Biggs, L. C., Schuette, K., Bullard, S., Cooper, M., et al.(2013). Expression and mutation analyses implicate ARHGAP29 as the etiologicgene for the cleft lip with or without cleft palate locus identified by genomewide association on chromosome 1p22. Birth Defects Research Part A, 94(11),934–942.
Li, Y.-J., Goh, L., Khor, C.-C., Fan, Q., Yu, M., Han, S., et al. (2011). Genome-wideassociation studies reveal genetic variants in CTNND2 for high myopia inSingapore Chinese. Ophthalmology, 118(2), 368–375.
Lionel, A. C., Crosbie, J., Barbosa, N., Goodale, T., Thiruvahindrapuram, B., Rickaby, J.,et al. (2011). Rare copy number variation discovery and cross-disordercomparisons identify risk genes for ADHD. Science Translational Medicine,3(95). 95ra75.
Liu, J., & Zhang, H. (2014). Polymorphism in the 11q24.1 genomic region isassociated with myopia: A comprehensive genetic study in Chinese andJapanese populations. Molecular Vision, 20(197), 352–358.
Lohmueller, K. E., Pearce, C. L., Pike, M., Lander, E. S., & Hirschhorn, J. N. (2003).Meta-analysis of genetic association studies supports a contribution of commonvariants to susceptibility to common disease. Nature Genetics, 33, 177–182.
Lu, B., Jiang, D., Wang, P., Gao, Y., Sun, W., Xiao, X., et al. (2011). Replication studysupports CTNND2 as a susceptibility gene for high myopia. InvestigativeOphthalmology & Visual Science, 52(11), 8258–8261.
Mapp, A. P., Ono, H., & Barbeito, R. (2003). What does the dominant eye dominate? Abrief and somewhat contentious review. Perception & Psychophysics, 65(2),310–317.
Marchini, J., & Howie, B. (2010). Genoytpe imputation for genome-wide associationstudies. Nature Reviews Genetics, 11, 499–511.
Matter, C., Pribadi, M., Liu, X., & Trachtenberg, J. T. (2009). Delta-catenin is requiredfor the maintenance of neural structure and function in mature cortex in vivo.Neuron, 64(3), 320–327.
Maugeri, A., Klevering, B. J., Rohrschneider, K., Blankenagel, A., Brunner, H. G.,Deutman, A. F., et al. (2000). Mutations in the ABCA4 (ABCR) gene are the majorcause of autosomal recessive cone-rod dystrophy. American Journal of HumanGenetics, 67(4), 960–966.
Medina, M., Marinescu, R. C., Overhauser, J., & Kosik, K. S. (2000). Hemizygosity ofdelta-catenin (CTNND2) is associated with severe mental retardation in cri-du-chat syndrome. Genomics, 63(2), 157–164.
Miles, W. (1929). Ocular dominance demonstrated by unconscious sighting. Journalof Experimental Psychology, 12, 113–126.
Miller, S. M., Gunther, B. D., Heslop, K. R., Liu, G. B., Mitchell, P. B., Ngo, T. T., et al.(2003). Slow binocular rivalry in bipolar disorder. Psychological Medicine, 33,683–692.
Miller, S. M., Hansell, N. K., Ngo, T. T., Liu, G. B., Pettigrew, J. D., Martin, N. G., et al.(2010). Genetic contribution to individual variation in binocular rivalry rate.Proceedings of the National Academy of Sciences of the United States of America,107(6), 2664–2668.
Mittenberg, W., Choi, E. J., & Apple, C. C. (2000). Stereoscopic visual impairment invascular dementia. Archives of Clinical Neuropsychology, 15(7), 561–569.
Mollon, J. D., & Danilova, M. V. (1996). Three remarks on perceptual learning. SpatialVision, 10(1), 51–58.
Odell, N. V., Hatt, S. R., Leske, D. A., Adams, W. E., & Holmes, J. M. (2009). The effect ofinduced monocular blur on measures of stereoacuity. Journal of the AmericanAssociation for Pediatric Ophthalmology and Strabismus, 13(2), 136–141.
Oen, F., Lim, T., & Chung, M. P. (1994). Contrast sensitivity in a large adultpopulation. Annals of the Academy of Medicine, Singapore, 23, 322–326.
Oguz, H., & Oguz, V. (2000). The effects of experimentally induced anisometropia onstereopsis. Journal of Pediatric Ophthalmology and Strabismus, 37(4), 214–218.
Owsley, C., Sekuler, R., & Siemsen, D. (1983). Contrast sensitivity throughoutadulthood. Vision Research, 23(7), 689–699.
Pelli, D. (1997). The Video Toolbox software for visual psychophysics: Transformingnumbers into movies. Spatial Vision, 10, 437–442.
Pelli, D., Robson, J., & Wilkins, A. (1988). The design of a new letter chart formeasuring contrast sensitivity. Clinical Vision Sciences, 2(3), 187–199.
Pettigrew, J. D., & Carter, O. L. (2004). Perceptual rivalry as an ultradian oscillation.In D. Alais & R. Blake (Eds.), Binocular rivalry (pp. 283). Cambridge MA: MITPress.
Pettigrew, J. D., & Miller, S. M. (1998). A ‘‘sticky’’ interhemispheric switch in bipolardisorder? Proceedings of the Royal Society B: Biological Sciences, 265, 2141–2148.
Poggio, G. E. (1995). Mechanisms of stereopsis in monkey visual cortex. CerebralCortex, 5(3), 193–204.
Ponferrada, V. G., Fan, J., Vallance, J. E., Hu, S., Mamedova, A., Rankin, S. A., et al.(2012). CRIM1 complexes with ß-catenin and cadherins, stabilizes cell-celljunctions and is critical for neural morphogenesis. PLoS One, 7(3), e32635.
Porac, C., & Coren, S. (1975). Is eye dominance a part of generalized laterality?Perceptual and Motor Skills, 40, 763–769.
Porac, C., & Coren, S. (1978). Sighting dominance and binocular rivalry. AmericanJournal of Optometry and Physiological Optics, 55(3), 208–213.
Price, A. L., Patterson, N. J., Plenge, R. M., Weinblatt, M. E., Shadick, N. A., & Reich, D.(2006). Principal components analysis corrects for stratification in genome-wide association studies. Nature Genetics, 38(8), 904–909.
Purcell, S., Neale, B., Todd-Brown, K., Thomas, L., Ferreira, M. A. R., Bender, D., et al.(2007). PLINK: A tool set for whole-genome association and population-basedlinkage analyses. American Journal of Human Genetics, 81(3), 559–575.
Rahi, J. S., Cumberland, P. M., & Peckham, C. S. (2009). Visual impairment and vision-related quality of life in working-age adults: Findings in the 1958 British birthcohort. Ophthalmology, 116(2), 270–274.
Ramirez, D. M., Khvotchev, M., Trauterman, B., & Kavalali, E. T. (2012). Vti1aidentifies a vesicle pool that preferentially recycles at rest and maintainsspontaneous neurotransmission. Neuron, 73(1), 121–134.
Richards, W. (1970). Stereopsis and stereoblindness. Experimental Brain Research,10(4), 380–388.
Richards, W. (1971). Anomalous stereoscopic depth perception. Journal of theOptical Society of America, 61(3), 410–414.
Richards, W., & Regan, D. (1973). A stereo field map with implications for disparityprocessing. Investigative Ophthalmology, 12(12), 904–909.
Rietman, M. L., Sommeijer, J.-P., Levelt, C. N., & Heimel, J. A. (2012). Candidate genesin ocular dominance plasticity. Frontiers in Neuroscience, 6, 11.
Rivera, C., Voipio, J., Payne, J., Ruusuvuori, E., Lahtinen, H., Lamsa, K., et al. (1999).The K+/Cl! co-transporter KCC2 renders GABA hyperpolarizing during neuronalmaturation. Nature, 397(6716), 251–255.
Robertson, C. E., Kravitz, D. J., Freyberg, J., Baron-Cohen, S., & Baker, C. I. (2013).Slower rate of binocular rivalry in autism. The Journal of Neuroscience, 33(43),16983–16991.
Saladin, J. J. (1995). Effects of heterophoria on stereopsis. Optometry and VisionScience, 72(7), 487–492.
Schmack, K., Sekutowicz, M., Rössler, H., Brandl, E. J., Müller, D. J., & Sterzer, P.(2013). The influence of dopamine-related genes on perceptual stability. TheEuropean Journal of Neuroscience, 38(9), 3378–3383.
Shinoda, T., Ito, H., Sudo, K., Iwamoto, I., Morishita, R., & Nagata, K. (2010). Septin 14is involved in cortical neuronal migration via interaction with septin 4.Molecular Biology of the Cell, 21, 1324–1334.
Shippman, S., & Cohen, K. R. (1983). Relationship of heterophoria to stereopsis.Archives of Ophthalmology, 101(4), 609–610.
Solberg, J., & Brown, J. (2002). No sex difference in contrast sensitivity and reactiontime to spatial frequency. Perceptual and Motor Skills, 94(3), 1053–1055.
Sun, H., Molday, R., & Nathans, J. (1999). Retinal stimulates ATP hydrolysis bypurified and reconstituted ABCR, the photoreceptor-specific ATP-bindingcassette transporter responsible for Stargardt disease. The Journal of BiologicalChemistry, 274(12), 8269–8281.
Suttle, C., Alexander, J., Liu, M., Ng, S., Poon, J., & Tran, T. (2009). Sensory oculardominance based on resolution acuity, contrast sensitivity and alignmentsensitivity. Clinical & Experimental Optometry, 92(1), 2–8.
Tao, R., Li, C., Newburn, E. N., Ye, T., Lipska, B. K., Herman, M. M., et al. (2012).Transcript-specific associations of SLC12A5 (KCC2) in human prefrontal cortexwith development, schizophrenia, and affective disorders. The Journal ofNeuroscience, 32(15), 5216–5222.
Ukai, K., Ando, H., & Kuze, J. (2003). Binocular rivalry alternation rate declines withage. Perceptual and Motor Skills, 97, 393–397.
Vermeer, S., Hoischen, A., Meijer, R. P. P., Gilissen, C., Neveling, K., Wieskamp, N.,et al. (2010). Targeted next-generation sequencing of a 12.5 Mb homozygousregion reveals ANO10 mutations in patients with autosomal-recessivecerebellar ataxia. American Journal of Human Genetics, 87(6), 813–819.
Vierck, E., Porter, R. J., Luty, S. E., Moor, S., Crowe, M. T., Carter, J. D., et al. (2013).Further evidence for slow binocular rivalry rate as a trait marker for bipolardisorder. The Australian and New Zealand Journal of Psychiatry, 47(4),371–379.
Watson, A. B., & Pelli, D. G. (1983). QUEST: A Bayesian adaptive psychometricmethod. Perception & Psychophysics, 33(2), 113–120.
Weigell-Weber, M., Sarra, G.-M., Kotzot, D., Sandkuijl, L., Messmer, E., &Hergersberg, M. (2003). Genomewide homozygosity mapping and molecularanalysis of a candidate gene located on 22q13 (fibulin-1) in a previouslyundescribed vitreoretinal dystrophy. Archives of Ophthalmology, 121(8),1184–1188.
Westheimer, G. (1975). Visual acuity and hyperacuity. Investigative Ophthalmology,14(8), 570–572.
Whittle, P. (1963). Binocular Rivalry (Ph.D. thesis). University of Cambridge.Wilmer, J. B. (2008). How to use individual differences to isolate functional
organization, biology, and utility of visual functions; with illustrative proposalsfor stereopsis. Spatial Vision, 21(6), 561–579.
Wilmer, J. B., & Backus, B. T. (2008). Self-reported Magic Eye™ stereogram skillpredicts stereoacuity. Perception, 37(8), 1297–1300.
J.M. Bosten et al. / Vision Research 110 (2015) 34–50 49
Wright, L., & Wormald, R. (1992). Stereopsis and ageing. Eye, 6, 473–476.Xiao, R., & Boehnke, M. (2011). Quantifying and correcting for the winner’s curse in
quantitative-trait association studies. Genetic Epidemiology, 35, 133–138.Yamashiro, H., Yamamoto, H., Mano, H., Umeda, M., Higuchi, T., & Saiki, J. (2014).
Activity in early visual areas predicts interindividual differences in binocularrivalry dynamics. Journal of Neurophysiology, 111(6), 1190–1202.
Yoshiura, K., Machida, J., Daack-Hirsch, S., Patil, S. R., Ashworth, L. K., Hecht, J. T.,et al. (1998). Characterization of a novel gene disrupted by a balanced
chromosomal translocation t(2;19)(q11.2;q13.3) in a family with cleft lip andpalate. Genomics, 54, 231–240.
Yu, Z., Zhou, J., Chen, X., Zhou, X., Sun, X., & Chu, R. (2012). Polymorphisms in theCTNND2 Gene and 11q24.1 genomic region are associated with pathologicalmyopia in a chinese population. Ophthalmologica, 228, 123–129.
Zaroff, C. M., Knutelska, M., & Frumkes, T. E. (2003). Variation in stereoacuity:Normative description, fixation disparity, and the roles of aging and gender.Investigative Ophthalmology & Visual Science, 44(2), 891–900.
50 J.M. Bosten et al. / Vision Research 110 (2015) 34–50