Embed Size (px)
Citation preview
A ppendix F – Intersection Traffic Data
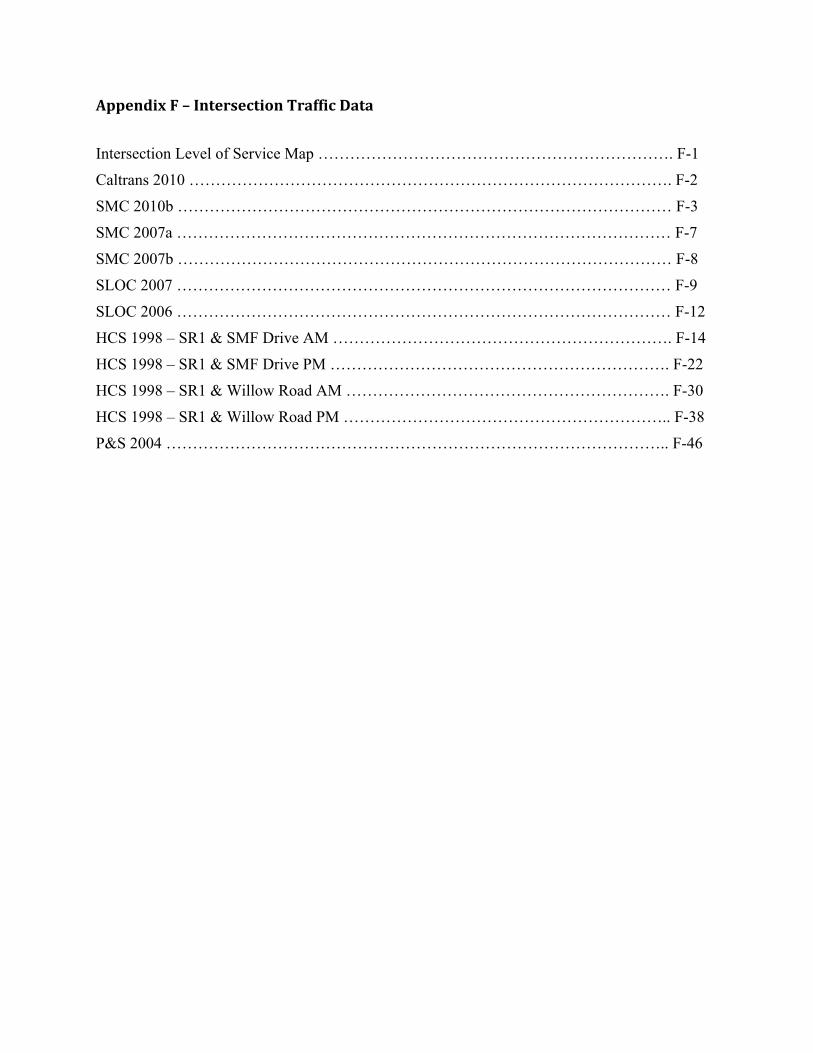
Intersection Level of Service Map …………………………………………………………. F-1
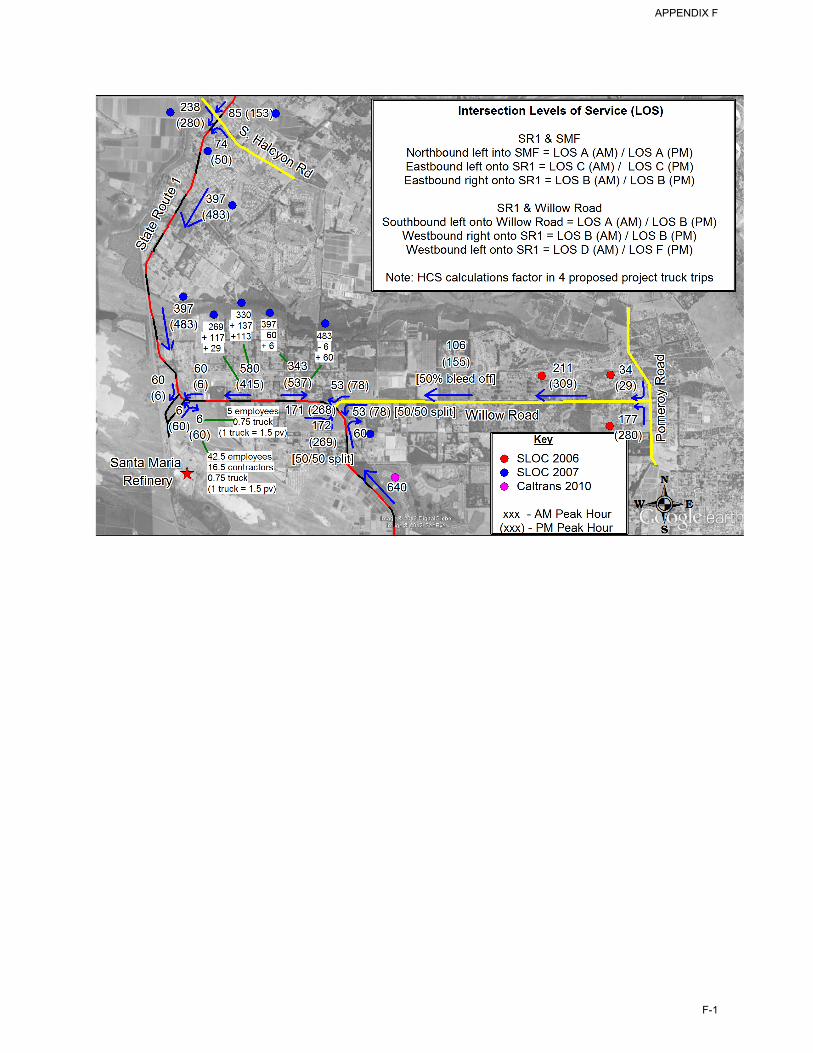
Caltrans 2010 ………………………………………………………………………………. F-2
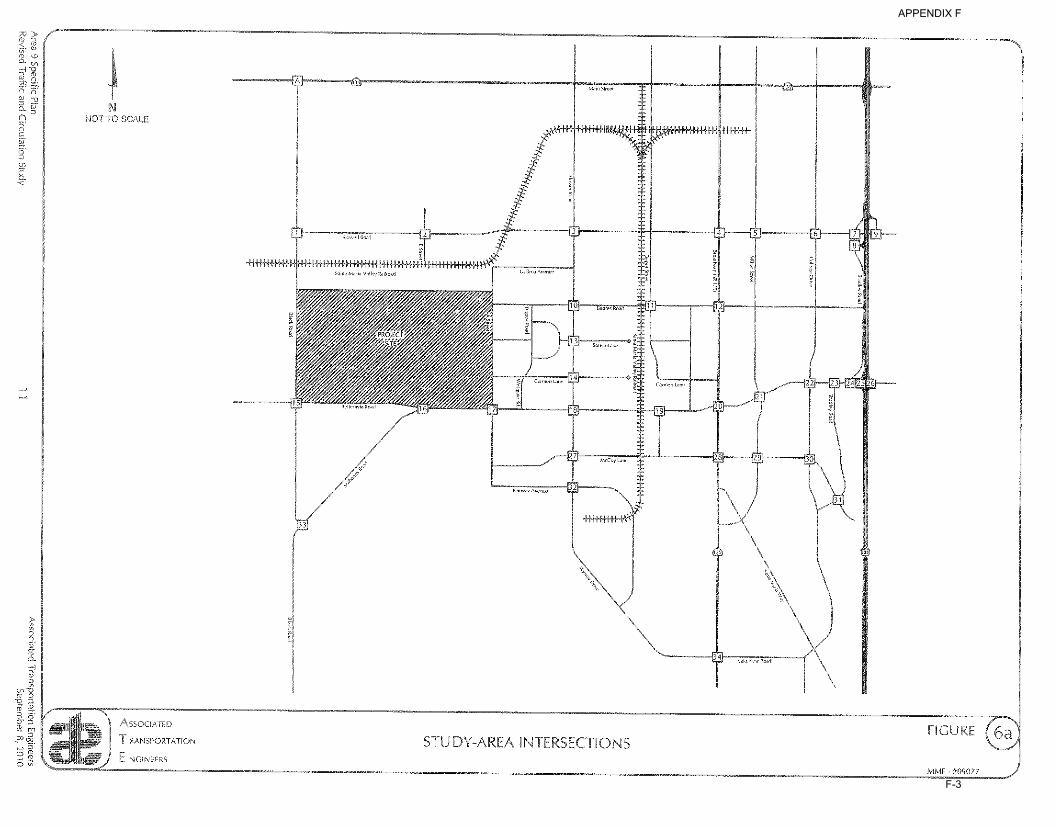
SMC 2010b ………………………………………………………………………………… F-3
SMC 2007a ………………………………………………………………………………… F-7
SMC 2007b ………………………………………………………………………………… F-8
SLOC 2007 ………………………………………………………………………………… F-9
SLOC 2006 ………………………………………………………………………………… F-12
HCS 1998 – SR1 & SMF Drive AM ………………………………………………………. F-14
HCS 1998 – SR1 & SMF Drive PM ………………………………………………………. F-22
HCS 1998 – SR1 & Willow Road AM ……………………………………………………. F-30
HCS 1998 – SR1 & Willow Road PM …………………………………………………….. F-38
P&S 2004 ………………………………………………………………………………….. F-46
APPENDIX F
F-1
APPENDIX F
F-2
APPENDIX F
F-3
APPENDIX F
F-4
APPENDIX F
F-5
APPENDIX F
F-6
Santa Maria Downtown Specific Plan EIR Section 4.10 Transportation and Circulation
City of Santa Maria 4.10-5
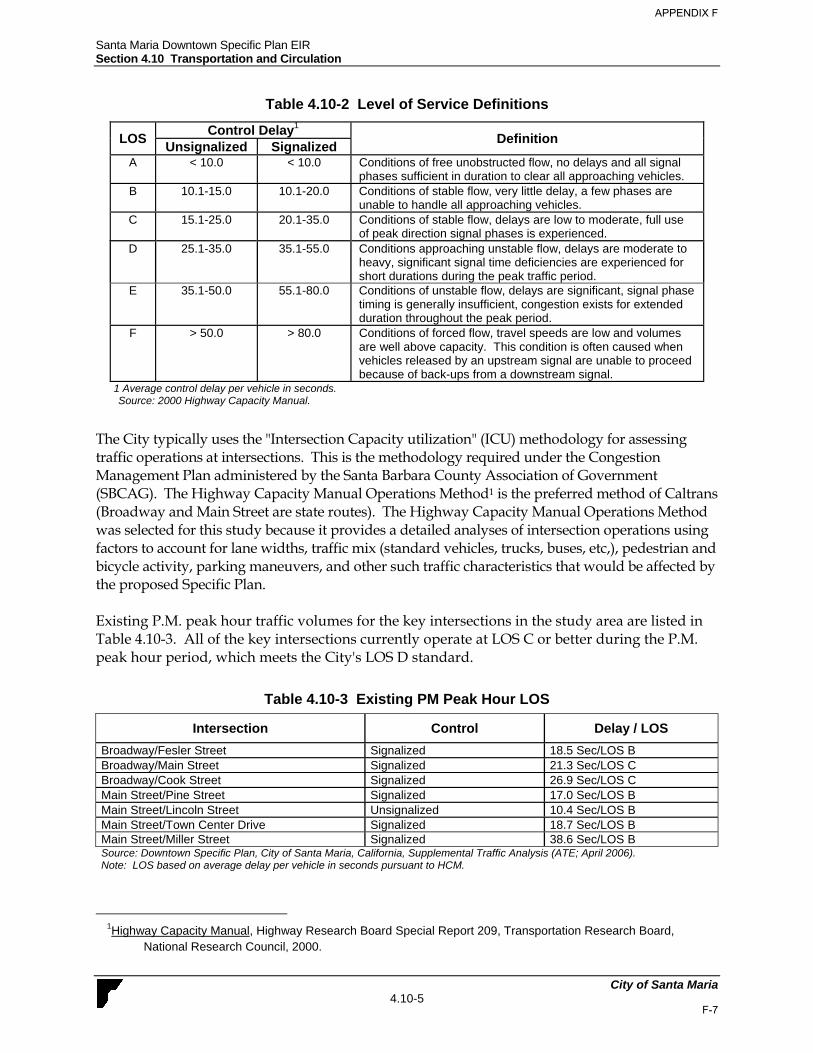
Table 4.10-2 Level of Service Definitions
LOS Control Delay1 Definition Unsignalized Signalized A < 10.0 < 10.0 Conditions of free unobstructed flow, no delays and all signal
phases sufficient in duration to clear all approaching vehicles. B 10.1-15.0 10.1-20.0 Conditions of stable flow, very little delay, a few phases are
unable to handle all approaching vehicles. C 15.1-25.0 20.1-35.0 Conditions of stable flow, delays are low to moderate, full use
of peak direction signal phases is experienced. D 25.1-35.0 35.1-55.0 Conditions approaching unstable flow, delays are moderate to
heavy, significant signal time deficiencies are experienced for short durations during the peak traffic period.
E 35.1-50.0 55.1-80.0 Conditions of unstable flow, delays are significant, signal phase timing is generally insufficient, congestion exists for extended duration throughout the peak period.
F > 50.0 > 80.0 Conditions of forced flow, travel speeds are low and volumes are well above capacity. This condition is often caused when vehicles released by an upstream signal are unable to proceed because of back-ups from a downstream signal.
1 Average control delay per vehicle in seconds. Source: 2000 Highway Capacity Manual.
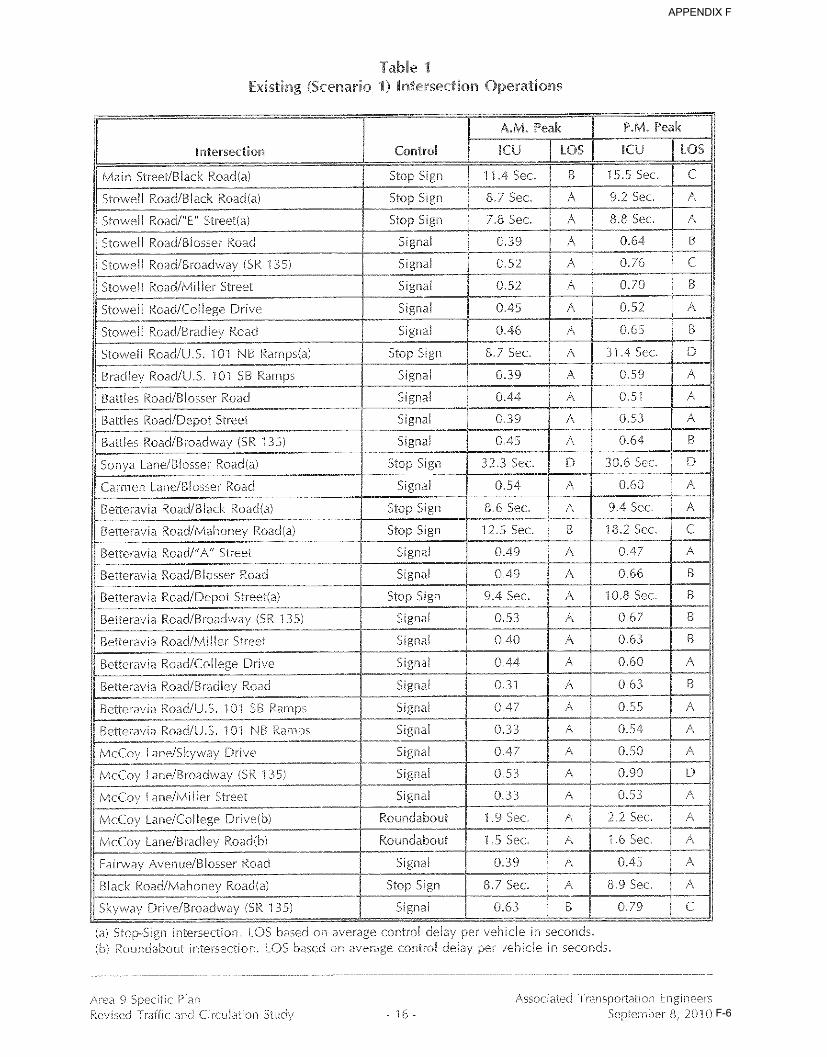
The City typically uses the "Intersection Capacity utilization" (ICU) methodology for assessing traffic operations at intersections. This is the methodology required under the Congestion Management Plan administered by the Santa Barbara County Association of Government (SBCAG). The Highway Capacity Manual Operations Method1 is the preferred method of Caltrans (Broadway and Main Street are state routes). The Highway Capacity Manual Operations Method was selected for this study because it provides a detailed analyses of intersection operations using factors to account for lane widths, traffic mix (standard vehicles, trucks, buses, etc,), pedestrian and bicycle activity, parking maneuvers, and other such traffic characteristics that would be affected by the proposed Specific Plan. Existing P.M. peak hour traffic volumes for the key intersections in the study area are listed in Table 4.10-3. All of the key intersections currently operate at LOS C or better during the P.M. peak hour period, which meets the City's LOS D standard.
Table 4.10-3 Existing PM Peak Hour LOS
Intersection Control Delay / LOS Broadway/Fesler Street Signalized 18.5 Sec/LOS B Broadway/Main Street Signalized 21.3 Sec/LOS C Broadway/Cook Street Signalized 26.9 Sec/LOS C Main Street/Pine Street Signalized 17.0 Sec/LOS B Main Street/Lincoln Street Unsignalized 10.4 Sec/LOS B Main Street/Town Center Drive Signalized 18.7 Sec/LOS B Main Street/Miller Street Signalized 38.6 Sec/LOS B Source: Downtown Specific Plan, City of Santa Maria, California, Supplemental Traffic Analysis (ATE; April 2006). Note: LOS based on average delay per vehicle in seconds pursuant to HCM.
1Highway Capacity Manual, Highway Research Board Special Report 209, Transportation Research Board,
National Research Council, 2000.
APPENDIX F
F-7
4.2 Transportation and Circulation
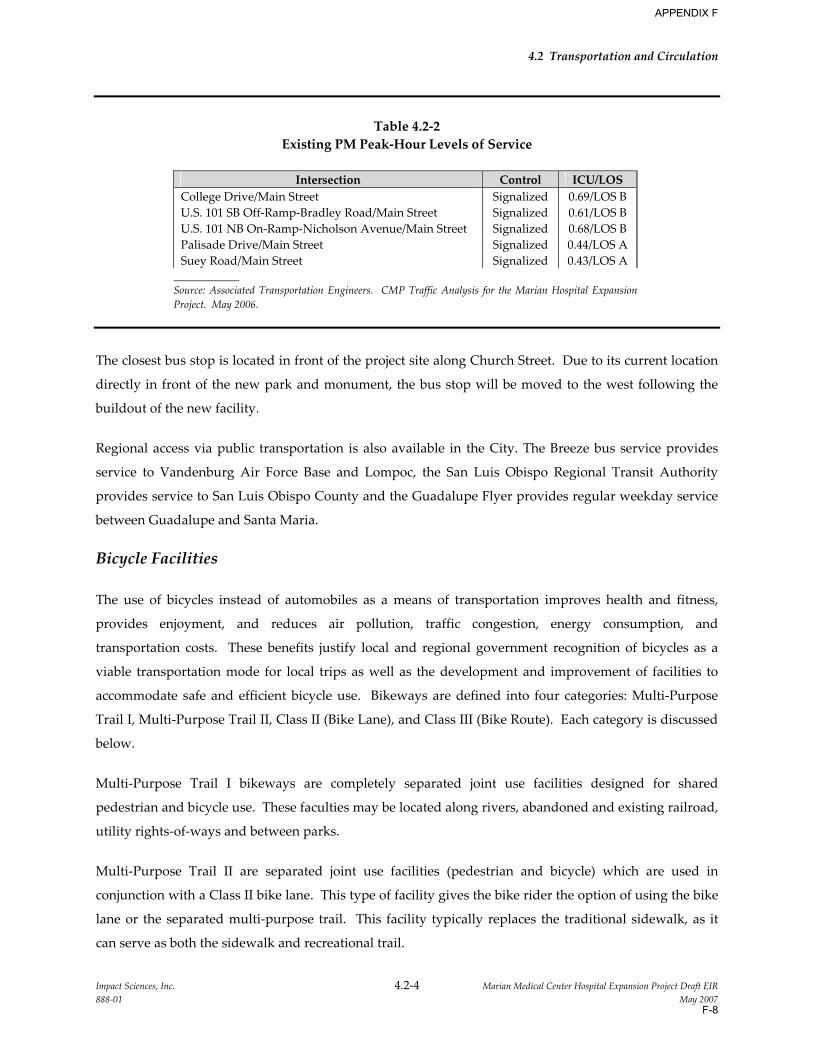
Table 4.2‐2
Existing PM Peak‐Hour Levels of Service
Intersection Control ICU/LOS
College Drive/Main Street Signalized 0.69/LOS B U.S. 101 SB Off‐Ramp‐Bradley Road/Main Street Signalized 0.61/LOS B U.S. 101 NB On‐Ramp‐Nicholson Avenue/Main Street Signalized 0.68/LOS B Palisade Drive/Main Street Signalized 0.44/LOS A Suey Road/Main Street Signalized 0.43/LOS A Source: Associated Transportation Engineers. CMP Traffic Analysis for the Marian Hospital Expansion Project. May 2006.
The closest bus stop is located in front of the project site along Church Street. Due to its current location
directly in front of the new park and monument, the bus stop will be moved to the west following the
buildout of the new facility.
Regional access via public transportation is also available in the City. The Breeze bus service provides
service to Vandenburg Air Force Base and Lompoc, the San Luis Obispo Regional Transit Authority
provides service to San Luis Obispo County and the Guadalupe Flyer provides regular weekday service
between Guadalupe and Santa Maria.
Bicycle Facilities
The use of bicycles instead of automobiles as a means of transportation improves health and fitness,
provides enjoyment, and reduces air pollution, traffic congestion, energy consumption, and
transportation costs. These benefits justify local and regional government recognition of bicycles as a
viable transportation mode for local trips as well as the development and improvement of facilities to
accommodate safe and efficient bicycle use. Bikeways are defined into four categories: Multi‐Purpose
Trail I, Multi‐Purpose Trail II, Class II (Bike Lane), and Class III (Bike Route). Each category is discussed
below.
Multi‐Purpose Trail I bikeways are completely separated joint use facilities designed for shared
pedestrian and bicycle use. These faculties may be located along rivers, abandoned and existing railroad,
utility rights‐of‐ways and between parks.
Multi‐Purpose Trail II are separated joint use facilities (pedestrian and bicycle) which are used in
conjunction with a Class II bike lane. This type of facility gives the bike rider the option of using the bike
lane or the separated multi‐purpose trail. This facility typically replaces the traditional sidewalk, as it
can serve as both the sidewalk and recreational trail.
Impact Sciences, Inc. 4.2‐4 Marian Medical Center Hospital Expansion Project Draft EIR 888‐01 May 2007
APPENDIX F
F-8
Halcyon Road Projects Master EIR Traffic and Circulation
Final MEIR TR-5
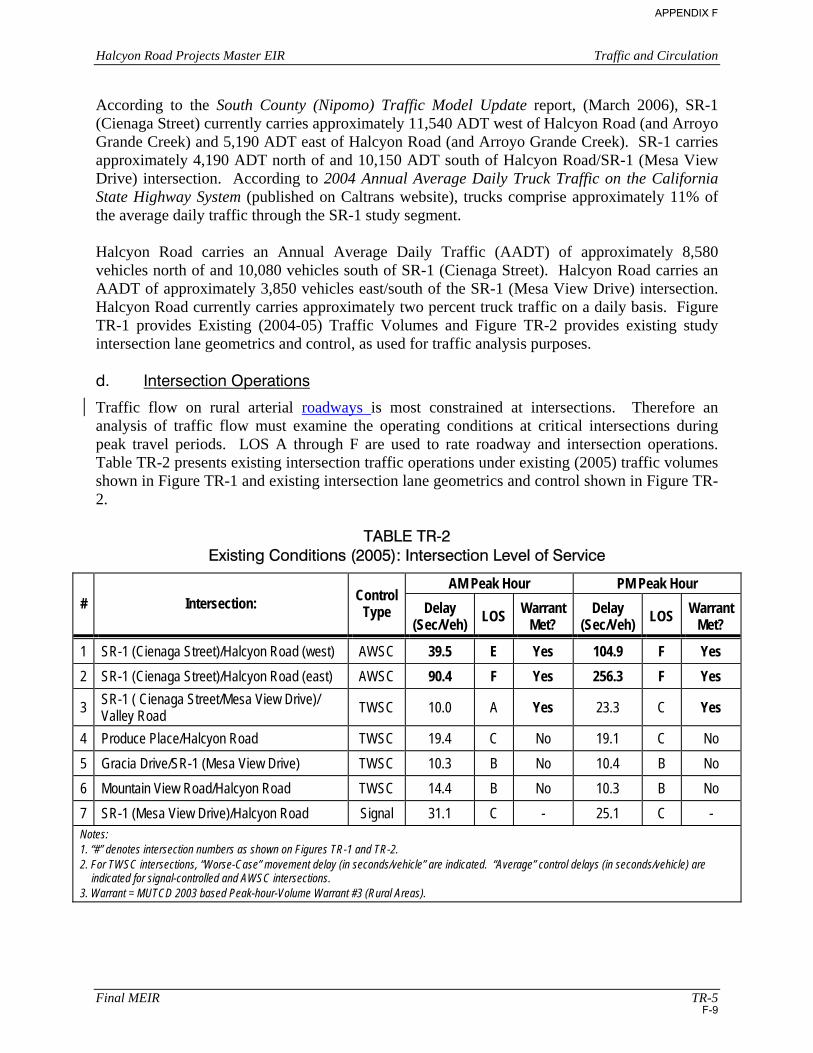
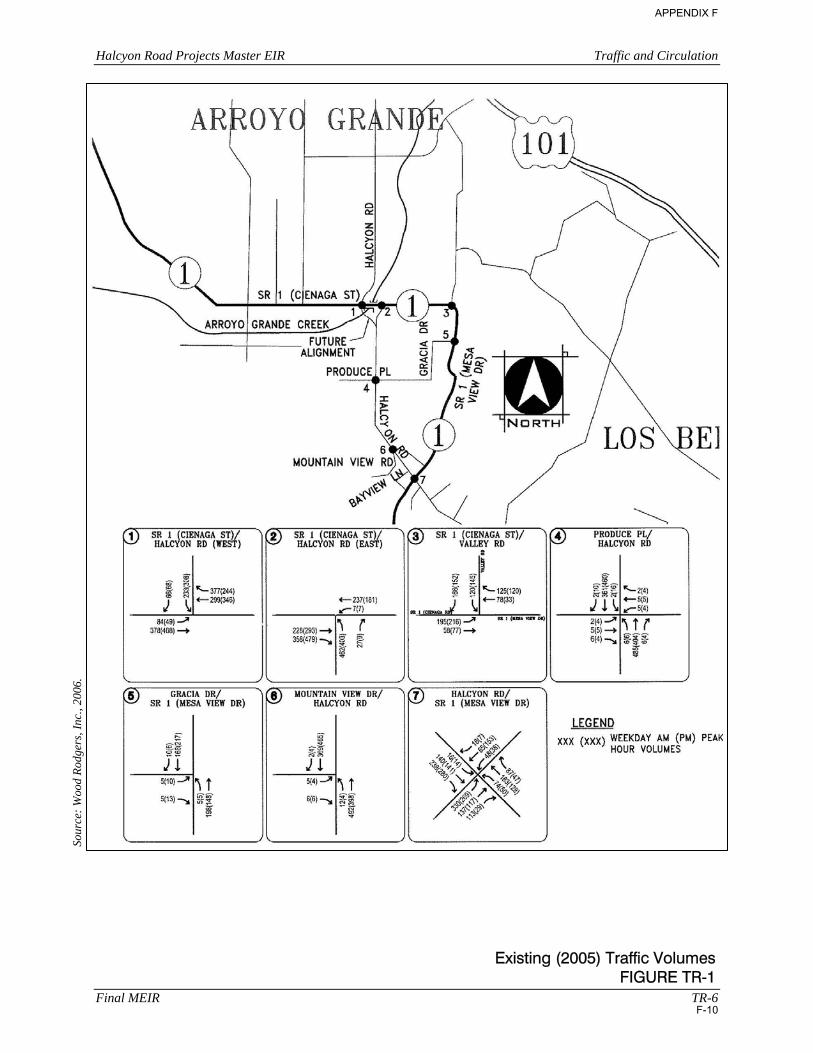
According to the South County (Nipomo) Traffic Model Update report, (March 2006), SR-1 (Cienaga Street) currently carries approximately 11,540 ADT west of Halcyon Road (and Arroyo Grande Creek) and 5,190 ADT east of Halcyon Road (and Arroyo Grande Creek). SR-1 carries approximately 4,190 ADT north of and 10,150 ADT south of Halcyon Road/SR-1 (Mesa View Drive) intersection. According to 2004 Annual Average Daily Truck Traffic on the California State Highway System (published on Caltrans website), trucks comprise approximately 11% of the average daily traffic through the SR-1 study segment. Halcyon Road carries an Annual Average Daily Traffic (AADT) of approximately 8,580 vehicles north of and 10,080 vehicles south of SR-1 (Cienaga Street). Halcyon Road carries an AADT of approximately 3,850 vehicles east/south of the SR-1 (Mesa View Drive) intersection. Halcyon Road currently carries approximately two percent truck traffic on a daily basis. Figure TR-1 provides Existing (2004-05) Traffic Volumes and Figure TR-2 provides existing study intersection lane geometrics and control, as used for traffic analysis purposes. d. Intersection Operations
Traffic flow on rural arterial roadways is most constrained at intersections. Therefore an analysis of traffic flow must examine the operating conditions at critical intersections during peak travel periods. LOS A through F are used to rate roadway and intersection operations. Table TR-2 presents existing intersection traffic operations under existing (2005) traffic volumes shown in Figure TR-1 and existing intersection lane geometrics and control shown in Figure TR-2.
TABLE TR-2 Existing Conditions (2005): Intersection Level of Service
AM Peak Hour PM Peak Hour # Intersection: Control
Type Delay (Sec/Veh) LOS Warrant
Met? Delay
(Sec/Veh) LOS Warrant Met?
1 SR-1 (Cienaga Street)/Halcyon Road (west) AWSC 39.5 E Yes 104.9 F Yes 2 SR-1 (Cienaga Street)/Halcyon Road (east) AWSC 90.4 F Yes 256.3 F Yes
3 SR-1 ( Cienaga Street/Mesa View Drive)/ Valley Road TWSC 10.0 A Yes 23.3 C Yes
4 Produce Place/Halcyon Road TWSC 19.4 C No 19.1 C No 5 Gracia Drive/SR-1 (Mesa View Drive) TWSC 10.3 B No 10.4 B No 6 Mountain View Road/Halcyon Road TWSC 14.4 B No 10.3 B No 7 SR-1 (Mesa View Drive)/Halcyon Road Signal 31.1 C - 25.1 C - Notes: 1. “#” denotes intersection numbers as shown on Figures TR-1 and TR-2. 2. For TWSC intersections, “Worse-Case” movement delay (in seconds/vehicle” are indicated. “Average” control delays (in seconds/vehicle) are
indicated for signal-controlled and AWSC intersections. 3. Warrant = MUTCD 2003 based Peak-hour-Volume Warrant #3 (Rural Areas).
APPENDIX F
F-9
Halcyon Road Projects Master EIR Traffic and Circulation
Final MEIR TR-6
Sour
ce: W
ood
Rodg
ers,
Inc.
, 200
6.
Existing (2005) Traffic Volumes FIGURE TR-1
APPENDIX F
F-10
Halcyon Road Projects Master EIR Traffic and Circulation
Final MEIR TR-8
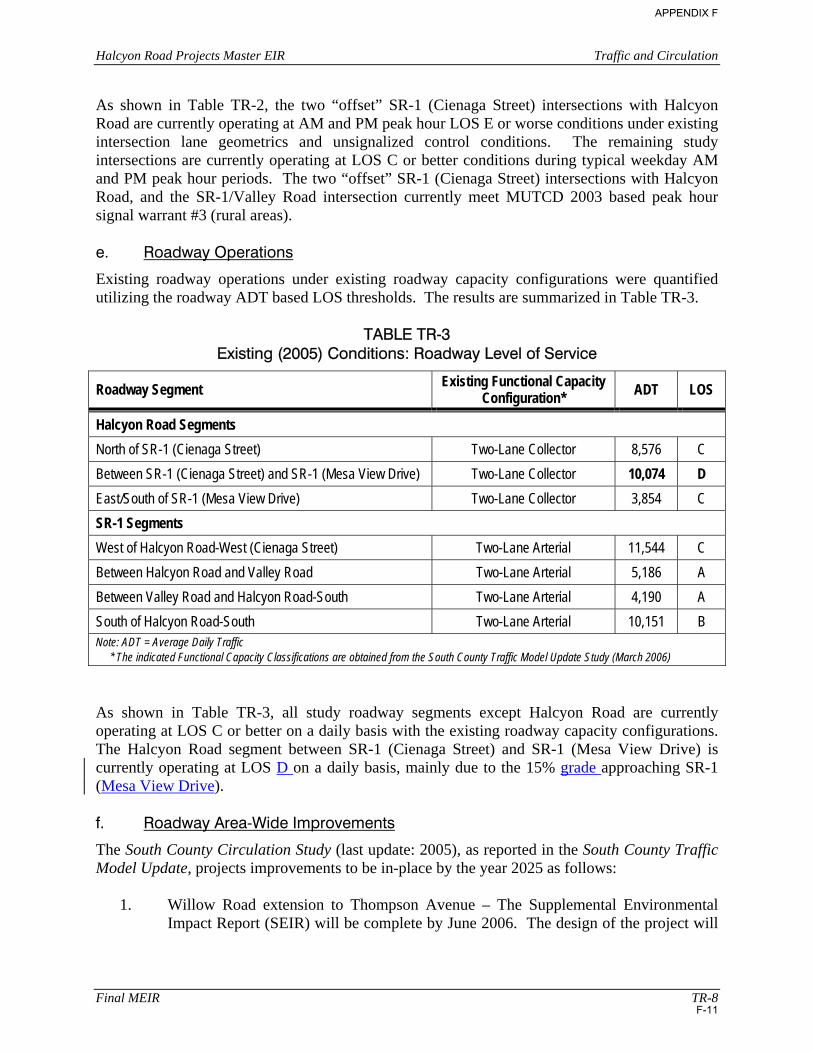
As shown in Table TR-2, the two “offset” SR-1 (Cienaga Street) intersections with Halcyon Road are currently operating at AM and PM peak hour LOS E or worse conditions under existing intersection lane geometrics and unsignalized control conditions. The remaining study intersections are currently operating at LOS C or better conditions during typical weekday AM and PM peak hour periods. The two “offset” SR-1 (Cienaga Street) intersections with Halcyon Road, and the SR-1/Valley Road intersection currently meet MUTCD 2003 based peak hour signal warrant #3 (rural areas). e. Roadway Operations
Existing roadway operations under existing roadway capacity configurations were quantified utilizing the roadway ADT based LOS thresholds. The results are summarized in Table TR-3.
TABLE TR-3 Existing (2005) Conditions: Roadway Level of Service
Roadway Segment Existing Functional Capacity Configuration* ADT LOS
Halcyon Road Segments North of SR-1 (Cienaga Street) Two-Lane Collector 8,576 C Between SR-1 (Cienaga Street) and SR-1 (Mesa View Drive) Two-Lane Collector 10,074 D East/South of SR-1 (Mesa View Drive) Two-Lane Collector 3,854 C SR-1 Segments West of Halcyon Road-West (Cienaga Street) Two-Lane Arterial 11,544 C Between Halcyon Road and Valley Road Two-Lane Arterial 5,186 A Between Valley Road and Halcyon Road-South Two-Lane Arterial 4,190 A South of Halcyon Road-South Two-Lane Arterial 10,151 B Note: ADT = Average Daily Traffic * The indicated Functional Capacity Classifications are obtained from the South County Traffic Model Update Study (March 2006) As shown in Table TR-3, all study roadway segments except Halcyon Road are currently operating at LOS C or better on a daily basis with the existing roadway capacity configurations. The Halcyon Road segment between SR-1 (Cienaga Street) and SR-1 (Mesa View Drive) is currently operating at LOS D on a daily basis, mainly due to the 15% grade approaching SR-1 (Mesa View Drive). f. Roadway Area-Wide Improvements
The South County Circulation Study (last update: 2005), as reported in the South County Traffic Model Update, projects improvements to be in-place by the year 2025 as follows:
1. Willow Road extension to Thompson Avenue – The Supplemental Environmental Impact Report (SEIR) will be complete by June 2006. The design of the project will
APPENDIX F
F-11
APPENDIX F
F-12
South County Traffic Model Update– Final Report Page 17 San Luis Obispo County 25-6462-05/R795TS008.doc
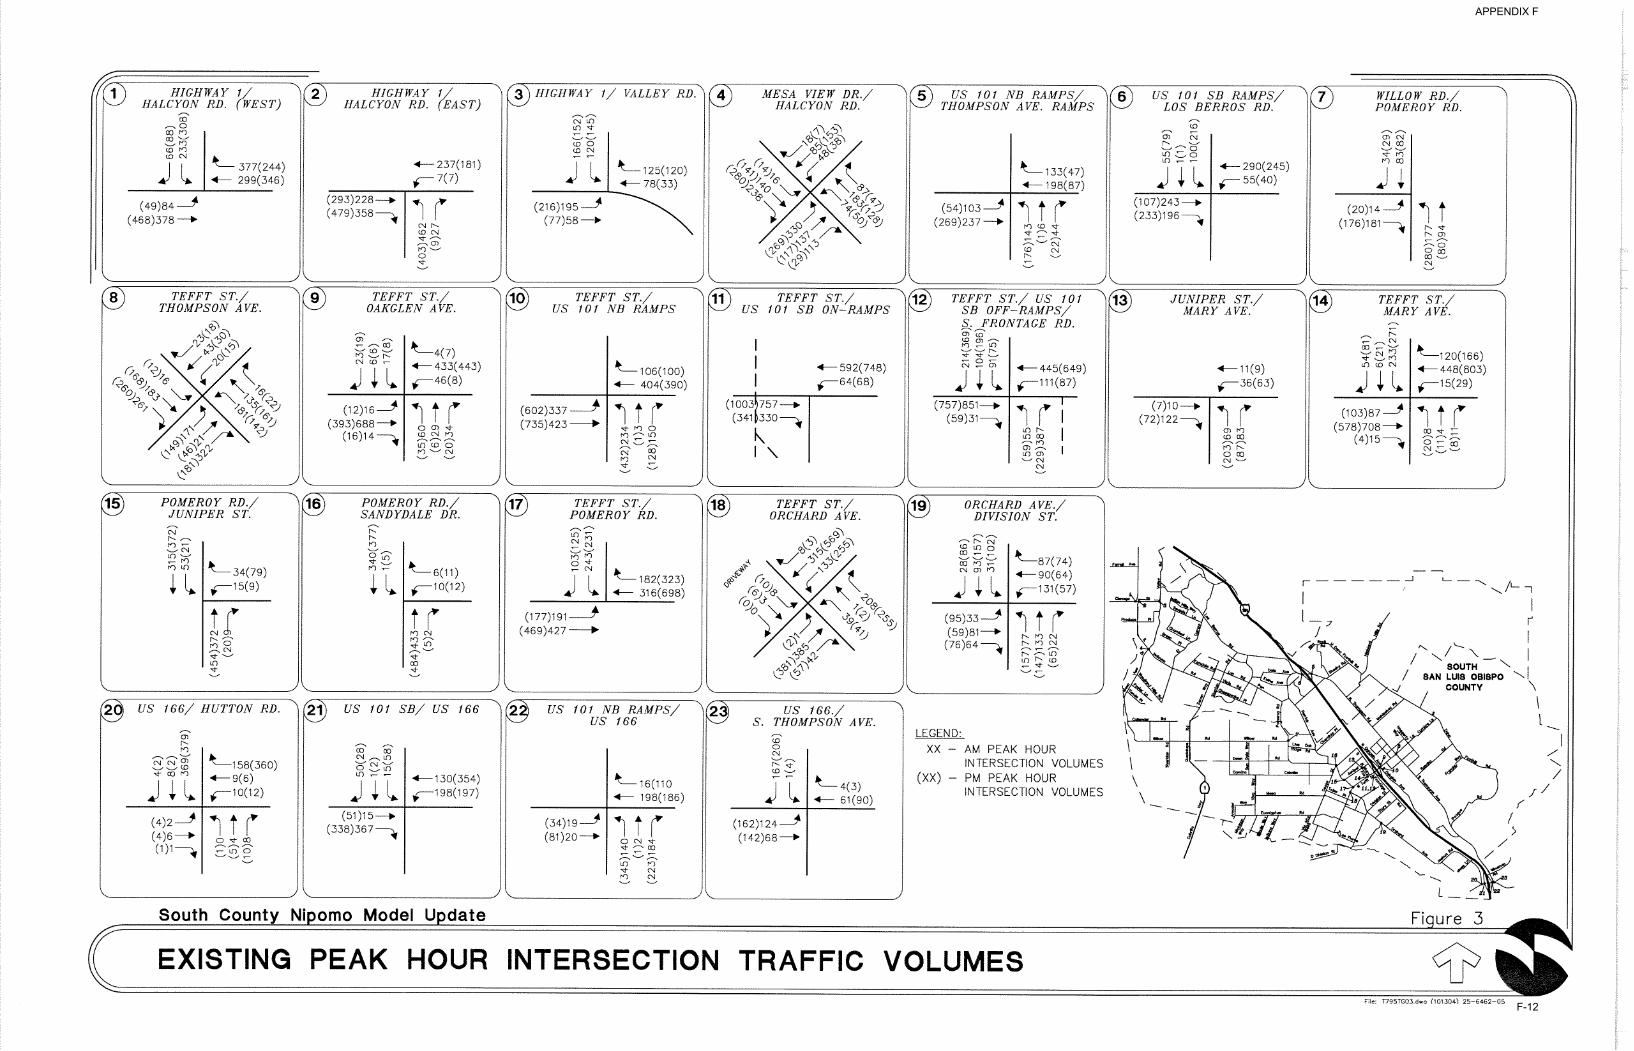
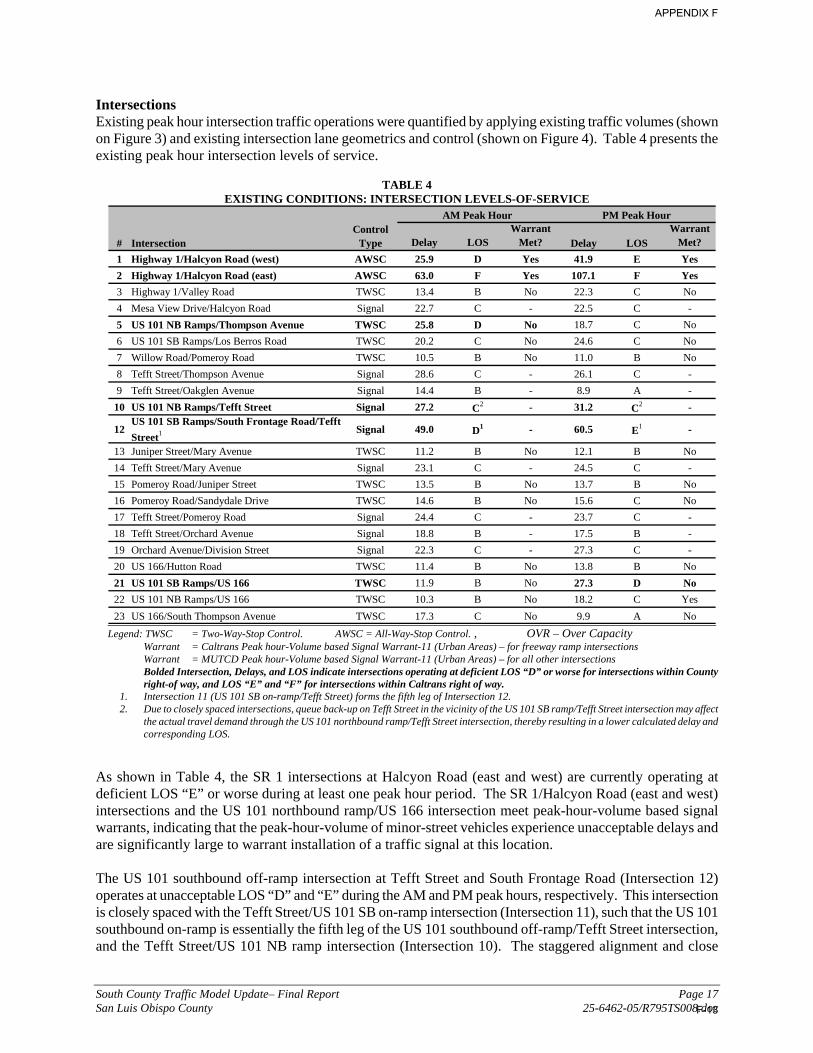
Intersections Existing peak hour intersection traffic operations were quantified by applying existing traffic volumes (shown on Figure 3) and existing intersection lane geometrics and control (shown on Figure 4). Table 4 presents the existing peak hour intersection levels of service.
TABLE 4
EXISTING CONDITIONS: INTERSECTION LEVELS-OF-SERVICE AM Peak Hour PM Peak Hour
# Delay LOSWarrant
Met? Delay LOSWarrant
Met?1 Highway 1/Halcyon Road (west) AWSC 25.9 D Yes 41.9 E Yes2 Highway 1/Halcyon Road (east) AWSC 63.0 F Yes 107.1 F Yes3 Highway 1/Valley Road TWSC 13.4 B No 22.3 C No4 Mesa View Drive/Halcyon Road Signal 22.7 C - 22.5 C -5 US 101 NB Ramps/Thompson Avenue TWSC 25.8 D No 18.7 C No6 US 101 SB Ramps/Los Berros Road TWSC 20.2 C No 24.6 C No7 Willow Road/Pomeroy Road TWSC 10.5 B No 11.0 B No8 Tefft Street/Thompson Avenue Signal 28.6 C - 26.1 C -9 Tefft Street/Oakglen Avenue Signal 14.4 B - 8.9 A -
10 US 101 NB Ramps/Tefft Street Signal 27.2 C2 - 31.2 C2 -
12US 101 SB Ramps/South Frontage Road/Tefft Street1 Signal 49.0 D1 - 60.5 E1 -
13 Juniper Street/Mary Avenue TWSC 11.2 B No 12.1 B No14 Tefft Street/Mary Avenue Signal 23.1 C - 24.5 C -15 Pomeroy Road/Juniper Street TWSC 13.5 B No 13.7 B No16 Pomeroy Road/Sandydale Drive TWSC 14.6 B No 15.6 C No17 Tefft Street/Pomeroy Road Signal 24.4 C - 23.7 C -18 Tefft Street/Orchard Avenue Signal 18.8 B - 17.5 B -19 Orchard Avenue/Division Street Signal 22.3 C - 27.3 C -20 US 166/Hutton Road TWSC 11.4 B No 13.8 B No21 US 101 SB Ramps/US 166 TWSC 11.9 B No 27.3 D No22 US 101 NB Ramps/US 166 TWSC 10.3 B No 18.2 C Yes23 US 166/South Thompson Avenue TWSC 17.3 C No 9.9 A No
IntersectionControl
Type
Legend: TWSC = Two-Way-Stop Control. AWSC = All-Way-Stop Control. , OVR – Over Capacity
Warrant = Caltrans Peak hour-Volume based Signal Warrant-11 (Urban Areas) – for freeway ramp intersections Warrant = MUTCD Peak hour-Volume based Signal Warrant-11 (Urban Areas) – for all other intersections Bolded Intersection, Delays, and LOS indicate intersections operating at deficient LOS “D” or worse for intersections within County right-of way, and LOS “E” and “F” for intersections within Caltrans right of way.
1. Intersection 11 (US 101 SB on-ramp/Tefft Street) forms the fifth leg of Intersection 12. 2. Due to closely spaced intersections, queue back-up on Tefft Street in the vicinity of the US 101 SB ramp/Tefft Street intersection may affect
the actual travel demand through the US 101 northbound ramp/Tefft Street intersection, thereby resulting in a lower calculated delay and corresponding LOS.
As shown in Table 4, the SR 1 intersections at Halcyon Road (east and west) are currently operating at deficient LOS “E” or worse during at least one peak hour period. The SR 1/Halcyon Road (east and west) intersections and the US 101 northbound ramp/US 166 intersection meet peak-hour-volume based signal warrants, indicating that the peak-hour-volume of minor-street vehicles experience unacceptable delays and are significantly large to warrant installation of a traffic signal at this location. The US 101 southbound off-ramp intersection at Tefft Street and South Frontage Road (Intersection 12) operates at unacceptable LOS “D” and “E” during the AM and PM peak hours, respectively. This intersection is closely spaced with the Tefft Street/US 101 SB on-ramp intersection (Intersection 11), such that the US 101 southbound on-ramp is essentially the fifth leg of the US 101 southbound off-ramp/Tefft Street intersection, and the Tefft Street/US 101 NB ramp intersection (Intersection 10). The staggered alignment and close
APPENDIX F
F-13
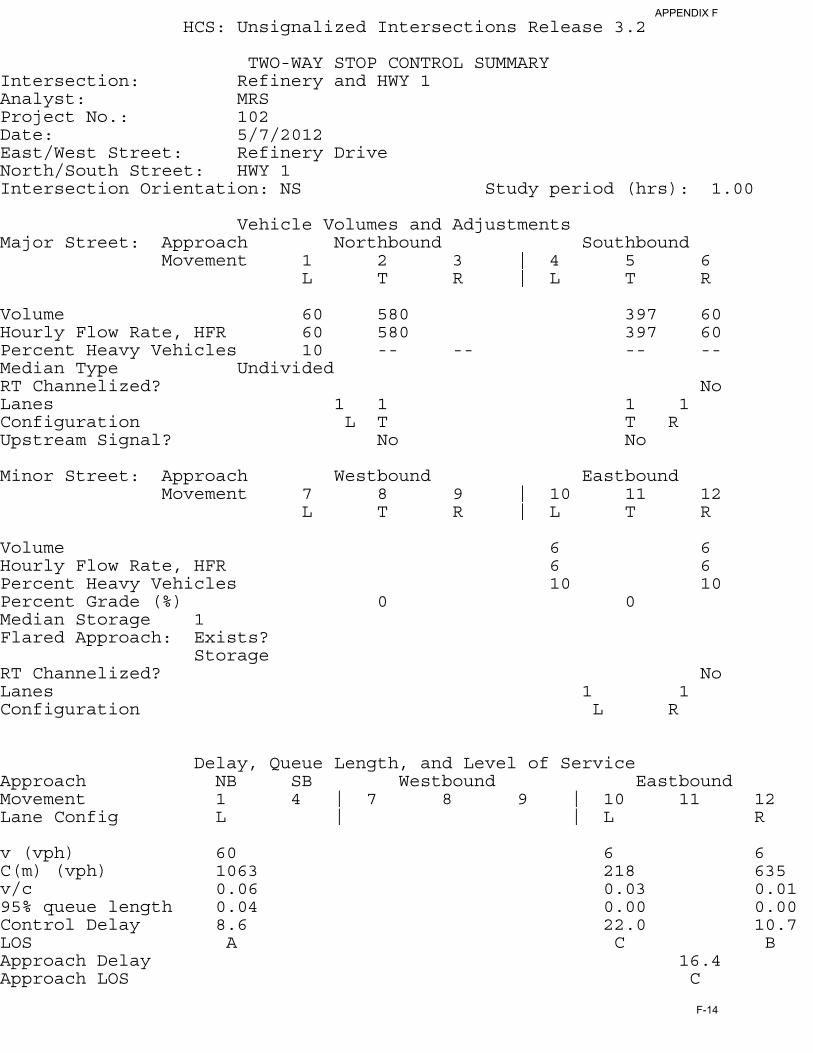
HCS: Unsignalized Intersections Release 3.2
TWO-WAY STOP CONTROL SUMMARYIntersection: Refinery and HWY 1 Analyst: MRS Project No.: 102 Date: 5/7/2012 East/West Street: Refinery Drive North/South Street: HWY 1 Intersection Orientation: NS Study period (hrs): 1.00
Vehicle Volumes and AdjustmentsMajor Street: Approach Northbound Southbound Movement 1 2 3 | 4 5 6 L T R | L T R
Volume 60 580 397 60 Hourly Flow Rate, HFR 60 580 397 60 Percent Heavy Vehicles 10 -- -- -- -- Median Type Undivided RT Channelized? No Lanes 1 1 1 1 Configuration L T T R Upstream Signal? No No
Minor Street: Approach Westbound Eastbound Movement 7 8 9 | 10 11 12 L T R | L T R
Volume 6 6 Hourly Flow Rate, HFR 6 6 Percent Heavy Vehicles 10 10 Percent Grade (%) 0 0 Median Storage 1 Flared Approach: Exists? Storage RT Channelized? No Lanes 1 1 Configuration L R
Delay, Queue Length, and Level of Service
Approach NB SB Westbound Eastbound Movement 1 4 | 7 8 9 | 10 11 12 Lane Config L | | L R
v (vph) 60 6 6 C(m) (vph) 1063 218 635 v/c 0.06 0.03 0.01 95% queue length 0.04 0.00 0.00 Control Delay 8.6 22.0 10.7 LOS A C B Approach Delay 16.4 Approach LOS C
APPENDIX F
F-14

HCS: Unsignalized Intersections Release 3.2 MRS 3140 Telegraph Road Ventura, CA Phone: 805-289-3929 Fax: E-Mail:
TWO-WAY STOP CONTROL(TWSC) ANALYSIS Intersection: Refinery and HWY 1 City/State: Analyst: MRS Project No.: 102 Time period Analyzed: Date: 5/7/2012 East/West Street: Refinery Drive North/South Street: HWY 1 Intersection Orientation: NS Study period (hrs): 1.00
Vehicle Volumes and AdjustmentsMajor Street Movements 1 2 3 4 5 6 L T R L T R
Volume 60 580 397 60 Peak-Hour Factor, PHF 1.00 1.00 1.00 1.00 Peak-15 Minute Volume 15 145 99 15 Hourly Flow Rate, HFR 60 580 397 60 Percent Heavy Vehicles 10 -- -- -- -- Median Type Undivided RT Channelized? No Lanes 1 1 1 1 Configuration L T T R Upstream Signal? No No
Minor Street Movements 7 8 9 10 11 12 L T R L T R
Volume 6 6 Peak Hour Factor, PHF 1.00 1.00 Peak-15 Minute Volume 2 2 Hourly Flow Rate, HFR 6 6 Percent Heavy Vehicles 10 10 Percent Grade (%) 0 0 Median Storage 1 Flared Approach: Exists? Storage RT Channelized? No Lanes 1 1 Configuration L R
Pedestrian Volumes and Adjustments
Movements 13 14 15 16
APPENDIX F
F-15
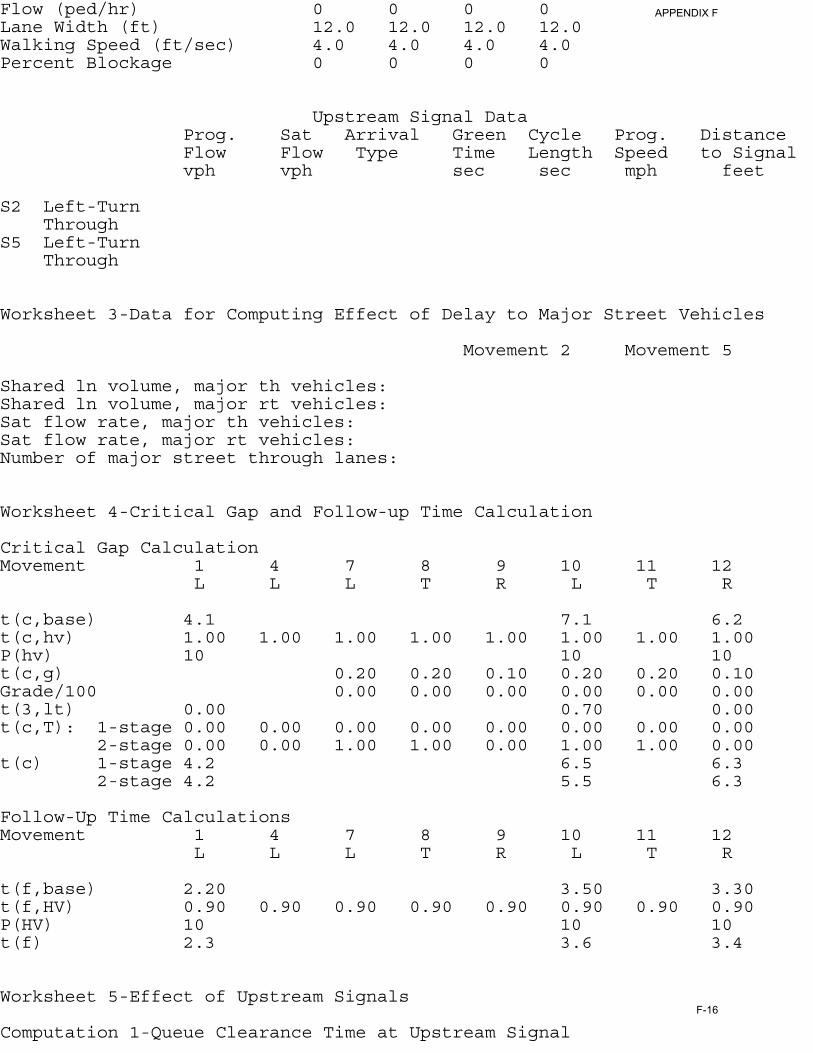
Flow (ped/hr) 0 0 0 0 Lane Width (ft) 12.0 12.0 12.0 12.0 Walking Speed (ft/sec) 4.0 4.0 4.0 4.0 Percent Blockage 0 0 0 0
Upstream Signal Data
Prog. Sat Arrival Green Cycle Prog. Distance Flow Flow Type Time Length Speed to Signal vph vph sec sec mph feet
S2 Left-Turn Through S5 Left-Turn Through
Worksheet 3-Data for Computing Effect of Delay to Major Street Vehicles
Movement 2 Movement 5
Shared ln volume, major th vehicles: Shared ln volume, major rt vehicles: Sat flow rate, major th vehicles: Sat flow rate, major rt vehicles: Number of major street through lanes:
Worksheet 4-Critical Gap and Follow-up Time Calculation
Critical Gap Calculation Movement 1 4 7 8 9 10 11 12 L L L T R L T R
t(c,base) 4.1 7.1 6.2 t(c,hv) 1.00 1.00 1.00 1.00 1.00 1.00 1.00 1.00 P(hv) 10 10 10 t(c,g) 0.20 0.20 0.10 0.20 0.20 0.10 Grade/100 0.00 0.00 0.00 0.00 0.00 0.00 t(3,lt) 0.00 0.70 0.00 t(c,T): 1-stage 0.00 0.00 0.00 0.00 0.00 0.00 0.00 0.00 2-stage 0.00 0.00 1.00 1.00 0.00 1.00 1.00 0.00 t(c) 1-stage 4.2 6.5 6.3 2-stage 4.2 5.5 6.3
Follow-Up Time Calculations Movement 1 4 7 8 9 10 11 12 L L L T R L T R
t(f,base) 2.20 3.50 3.30 t(f,HV) 0.90 0.90 0.90 0.90 0.90 0.90 0.90 0.90 P(HV) 10 10 10 t(f) 2.3 3.6 3.4
Worksheet 5-Effect of Upstream Signals
Computation 1-Queue Clearance Time at Upstream Signal
APPENDIX F
F-16
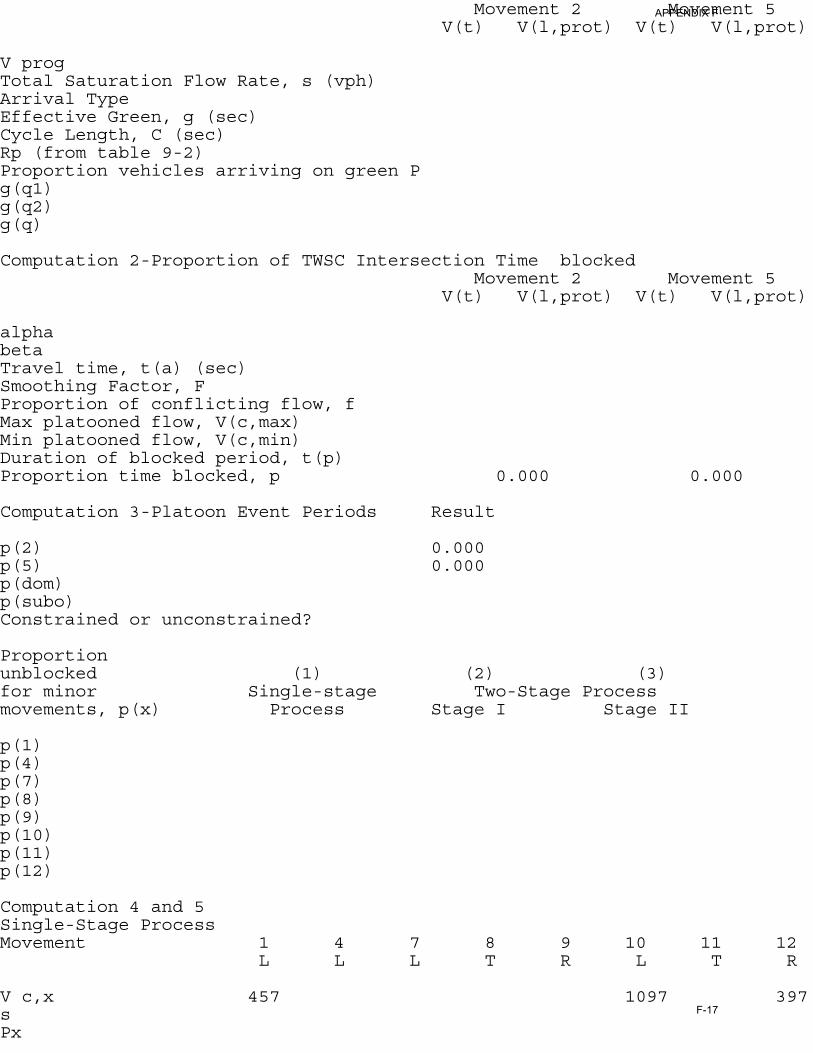
Movement 2 Movement 5 V(t) V(l,prot) V(t) V(l,prot)
V prog Total Saturation Flow Rate, s (vph) Arrival Type Effective Green, g (sec) Cycle Length, C (sec) Rp (from table 9-2) Proportion vehicles arriving on green P g(q1) g(q2) g(q)
Computation 2-Proportion of TWSC Intersection Time blocked Movement 2 Movement 5 V(t) V(l,prot) V(t) V(l,prot)
alpha beta Travel time, t(a) (sec) Smoothing Factor, F Proportion of conflicting flow, f Max platooned flow, V(c,max) Min platooned flow, V(c,min) Duration of blocked period, t(p) Proportion time blocked, p 0.000 0.000
Computation 3-Platoon Event Periods Result
p(2) 0.000 p(5) 0.000 p(dom) p(subo) Constrained or unconstrained?
Proportion unblocked (1) (2) (3) for minor Single-stage Two-Stage Process movements, p(x) Process Stage I Stage II
p(1) p(4) p(7) p(8) p(9) p(10) p(11) p(12)
Computation 4 and 5 Single-Stage Process Movement 1 4 7 8 9 10 11 12 L L L T R L T R
V c,x 457 1097 397 s Px
APPENDIX F
F-17

V c,u,x
C r,x C plat,x
Two-Stage Process 7 8 10 11 Stage1 Stage2 Stage1 Stage2 Stage1 Stage2 Stage1 Stage2
V(c,x) 397 700 s 1700 P(x) V(c,u,x)
C(r,x) C(plat,x)
Worksheet 6-Impedance and Capacity Equations
Step 1: RT from Minor St. 9 12
Conflicting Flows 397 Potential Capacity 635 Pedestrian Impedance Factor 1.00 1.00 Movement Capacity 635 Probability of Queue free St. 1.00 0.99
Step 2: LT from Major St. 4 1
Conflicting Flows 457 Potential Capacity 1063 Pedestrian Impedance Factor 1.00 1.00 Movement Capacity 1063 Probability of Queue free St. 1.00 0.94 Maj L-Shared Prob Q free St.
Step 3: TH from Minor St. 8 11
Conflicting Flows Potential Capacity Pedestrian Impedance Factor 1.00 1.00 Cap. Adj. factor due to Impeding mvmnt 0.94 0.94 Movement Capacity Probability of Queue free St. 1.00 1.00
Step 4: LT from Minor St. 7 10
Conflicting Flows 1097 Potential Capacity 228 Pedestrian Impedance Factor 1.00 1.00 Maj. L, Min T Impedance factor 0.94 0.94 Maj. L, Min T Adj. Imp Factor. 0.96 0.96 Cap. Adj. factor due to Impeding mvmnt 0.95 0.96 Movement Capacity 218
Worksheet 7-Computation of the Effect of Two-stage Gap Acceptance
APPENDIX F
F-18

Step 3: TH from Minor St. 8 11
Part 1 - First Stage Conflicting Flows Potential Capacity 444 607 Pedestrian Impedance Factor 1.00 1.00 Cap. Adj. factor due to Impeding mvmnt 0.94 1.00 Movement Capacity 419 607 Probability of Queue free St. 1.00 1.00
Part 2 - Second Stage Conflicting Flows Potential Capacity 571 444 Pedestrian Impedance Factor 1.00 1.00 Cap. Adj. factor due to Impeding mvmnt 1.00 0.94 Movement Capacity 571 419
Part 3 - Single Stage Conflicting Flows Potential Capacity Pedestrian Impedance Factor 1.00 1.00 Cap. Adj. factor due to Impeding mvmnt 0.94 0.94 Movement Capacity
Result for 2 stage process: a 0.00 0.00 y 0.00 0.00 C t Probability of Queue free St. 1.00 1.00
Step 4: LT from Minor St. 7 10
Part 1 - First Stage Conflicting Flows 397 Potential Capacity 496 662 Pedestrian Impedance Factor 1.00 1.00 Cap. Adj. factor due to Impeding mvmnt 0.94 1.00 Movement Capacity 468 662
Part 2 - Second Stage Conflicting Flows 700 Potential Capacity 660 478 Pedestrian Impedance Factor 1.00 1.00 Cap. Adj. factor due to Impeding mvmnt 0.99 0.94 Movement Capacity 654 451
Part 3 - Single Stage Conflicting Flows 1097 Potential Capacity 228 Pedestrian Impedance Factor 1.00 1.00 Maj. L, Min T Impedance factor 0.94 0.94 Maj. L, Min T Adj. Imp Factor. 0.96 0.96 Cap. Adj. factor due to Impeding mvmnt 0.95 0.96 Movement Capacity 218
Results for Two-stage process: a 0.00 0.00
APPENDIX F
F-19
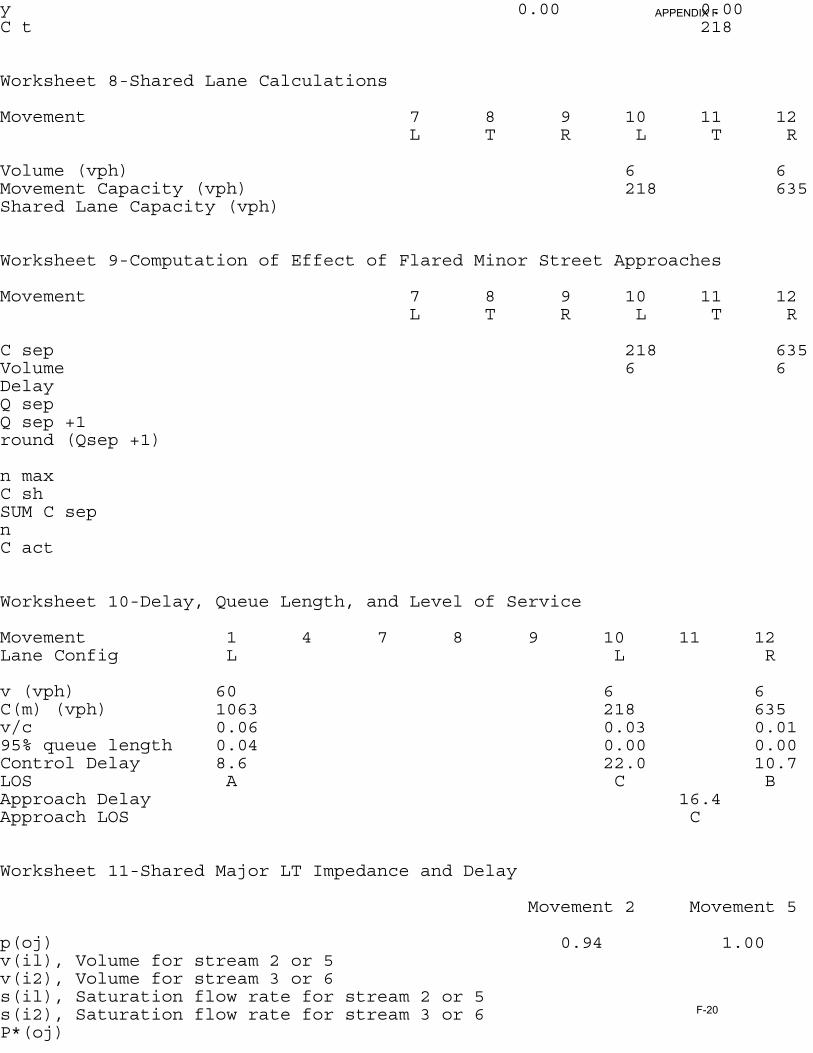
y 0.00 0.00 C t 218
Worksheet 8-Shared Lane Calculations
Movement 7 8 9 10 11 12 L T R L T R
Volume (vph) 6 6 Movement Capacity (vph) 218 635 Shared Lane Capacity (vph)
Worksheet 9-Computation of Effect of Flared Minor Street Approaches
Movement 7 8 9 10 11 12 L T R L T R
C sep 218 635 Volume 6 6 Delay Q sep Q sep +1 round (Qsep +1)
n max C sh SUM C sep n C act
Worksheet 10-Delay, Queue Length, and Level of Service
Movement 1 4 7 8 9 10 11 12 Lane Config L L R
v (vph) 60 6 6 C(m) (vph) 1063 218 635 v/c 0.06 0.03 0.01 95% queue length 0.04 0.00 0.00 Control Delay 8.6 22.0 10.7 LOS A C B Approach Delay 16.4 Approach LOS C
Worksheet 11-Shared Major LT Impedance and Delay
Movement 2 Movement 5
p(oj) 0.94 1.00 v(il), Volume for stream 2 or 5 v(i2), Volume for stream 3 or 6 s(il), Saturation flow rate for stream 2 or 5 s(i2), Saturation flow rate for stream 3 or 6 P*(oj)
APPENDIX F
F-20

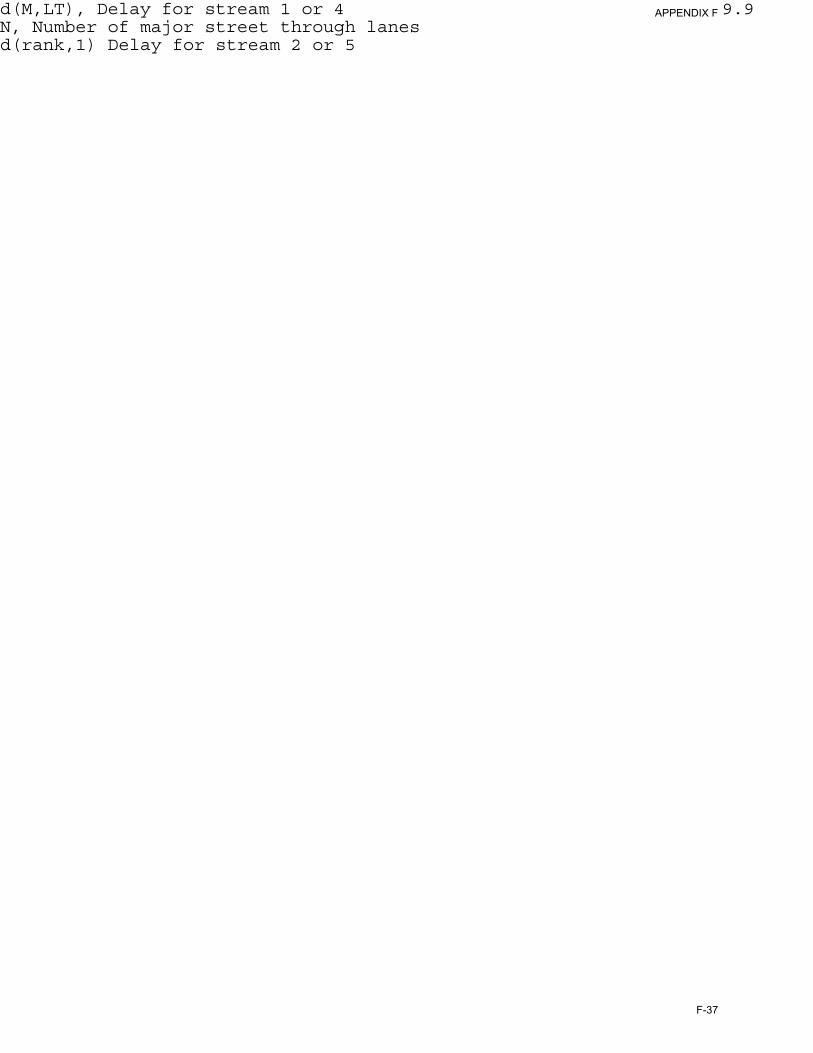
d(M,LT), Delay for stream 1 or 4 8.6 N, Number of major street through lanes d(rank,1) Delay for stream 2 or 5
APPENDIX F
F-21
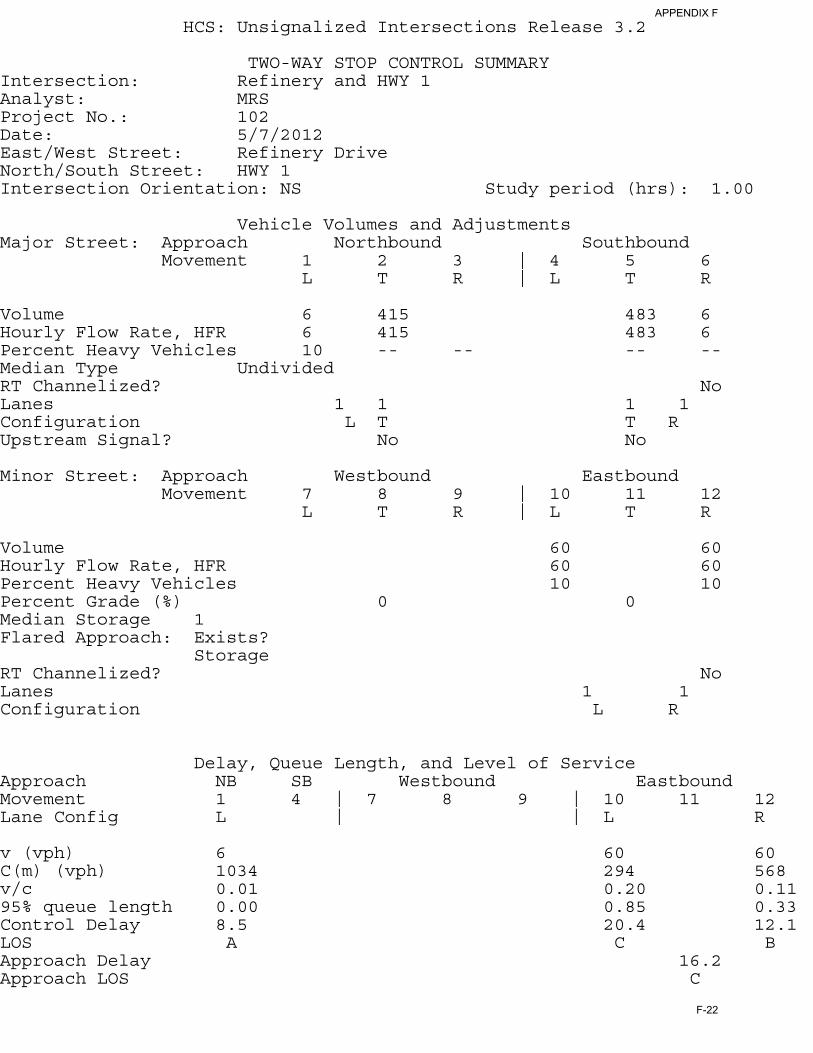
HCS: Unsignalized Intersections Release 3.2
TWO-WAY STOP CONTROL SUMMARYIntersection: Refinery and HWY 1 Analyst: MRS Project No.: 102 Date: 5/7/2012 East/West Street: Refinery Drive North/South Street: HWY 1 Intersection Orientation: NS Study period (hrs): 1.00
Vehicle Volumes and AdjustmentsMajor Street: Approach Northbound Southbound Movement 1 2 3 | 4 5 6 L T R | L T R
Volume 6 415 483 6 Hourly Flow Rate, HFR 6 415 483 6 Percent Heavy Vehicles 10 -- -- -- -- Median Type Undivided RT Channelized? No Lanes 1 1 1 1 Configuration L T T R Upstream Signal? No No
Minor Street: Approach Westbound Eastbound Movement 7 8 9 | 10 11 12 L T R | L T R
Volume 60 60 Hourly Flow Rate, HFR 60 60 Percent Heavy Vehicles 10 10 Percent Grade (%) 0 0 Median Storage 1 Flared Approach: Exists? Storage RT Channelized? No Lanes 1 1 Configuration L R
Delay, Queue Length, and Level of Service
Approach NB SB Westbound Eastbound Movement 1 4 | 7 8 9 | 10 11 12 Lane Config L | | L R
v (vph) 6 60 60 C(m) (vph) 1034 294 568 v/c 0.01 0.20 0.11 95% queue length 0.00 0.85 0.33 Control Delay 8.5 20.4 12.1 LOS A C B Approach Delay 16.2 Approach LOS C
APPENDIX F
F-22
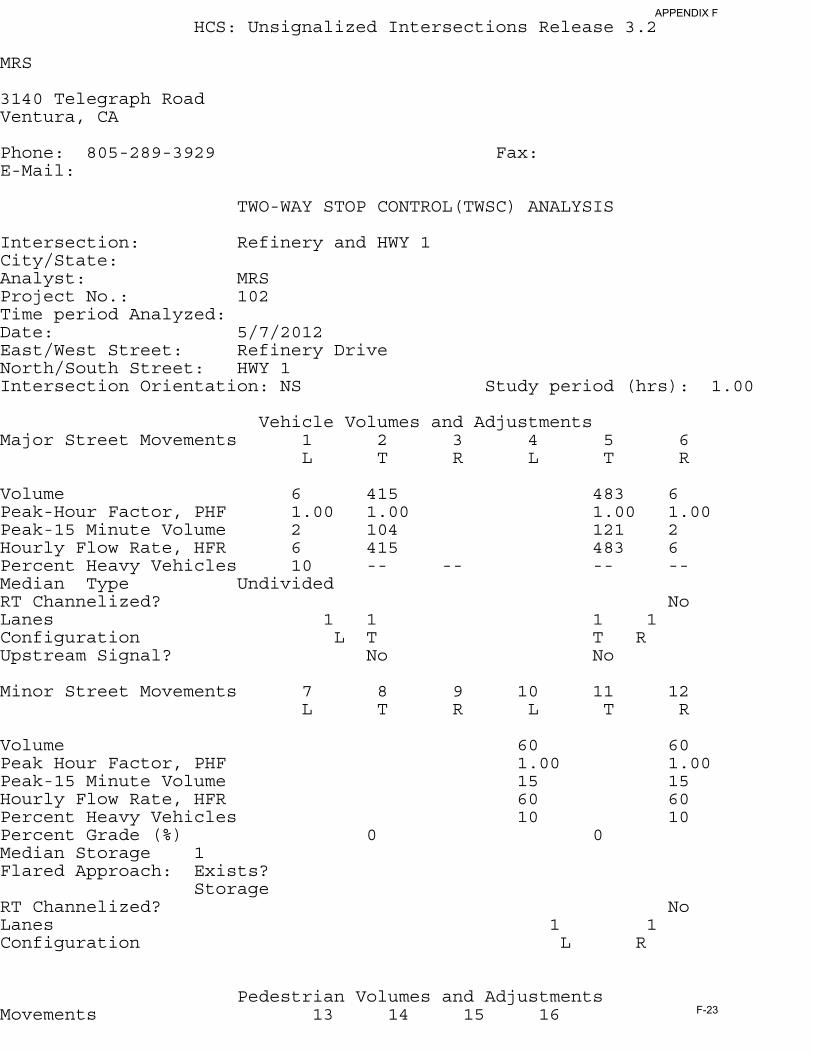
HCS: Unsignalized Intersections Release 3.2 MRS 3140 Telegraph Road Ventura, CA Phone: 805-289-3929 Fax: E-Mail:
TWO-WAY STOP CONTROL(TWSC) ANALYSIS Intersection: Refinery and HWY 1 City/State: Analyst: MRS Project No.: 102 Time period Analyzed: Date: 5/7/2012 East/West Street: Refinery Drive North/South Street: HWY 1 Intersection Orientation: NS Study period (hrs): 1.00
Vehicle Volumes and AdjustmentsMajor Street Movements 1 2 3 4 5 6 L T R L T R
Volume 6 415 483 6 Peak-Hour Factor, PHF 1.00 1.00 1.00 1.00 Peak-15 Minute Volume 2 104 121 2 Hourly Flow Rate, HFR 6 415 483 6 Percent Heavy Vehicles 10 -- -- -- -- Median Type Undivided RT Channelized? No Lanes 1 1 1 1 Configuration L T T R Upstream Signal? No No
Minor Street Movements 7 8 9 10 11 12 L T R L T R
Volume 60 60 Peak Hour Factor, PHF 1.00 1.00 Peak-15 Minute Volume 15 15 Hourly Flow Rate, HFR 60 60 Percent Heavy Vehicles 10 10 Percent Grade (%) 0 0 Median Storage 1 Flared Approach: Exists? Storage RT Channelized? No Lanes 1 1 Configuration L R
Pedestrian Volumes and Adjustments
Movements 13 14 15 16
APPENDIX F
F-23

Flow (ped/hr) 0 0 0 0 Lane Width (ft) 12.0 12.0 12.0 12.0 Walking Speed (ft/sec) 4.0 4.0 4.0 4.0 Percent Blockage 0 0 0 0
Upstream Signal Data
Prog. Sat Arrival Green Cycle Prog. Distance Flow Flow Type Time Length Speed to Signal vph vph sec sec mph feet
S2 Left-Turn Through S5 Left-Turn Through
Worksheet 3-Data for Computing Effect of Delay to Major Street Vehicles
Movement 2 Movement 5
Shared ln volume, major th vehicles: Shared ln volume, major rt vehicles: Sat flow rate, major th vehicles: Sat flow rate, major rt vehicles: Number of major street through lanes:
Worksheet 4-Critical Gap and Follow-up Time Calculation
Critical Gap Calculation Movement 1 4 7 8 9 10 11 12 L L L T R L T R
t(c,base) 4.1 7.1 6.2 t(c,hv) 1.00 1.00 1.00 1.00 1.00 1.00 1.00 1.00 P(hv) 10 10 10 t(c,g) 0.20 0.20 0.10 0.20 0.20 0.10 Grade/100 0.00 0.00 0.00 0.00 0.00 0.00 t(3,lt) 0.00 0.70 0.00 t(c,T): 1-stage 0.00 0.00 0.00 0.00 0.00 0.00 0.00 0.00 2-stage 0.00 0.00 1.00 1.00 0.00 1.00 1.00 0.00 t(c) 1-stage 4.2 6.5 6.3 2-stage 4.2 5.5 6.3
Follow-Up Time Calculations Movement 1 4 7 8 9 10 11 12 L L L T R L T R
t(f,base) 2.20 3.50 3.30 t(f,HV) 0.90 0.90 0.90 0.90 0.90 0.90 0.90 0.90 P(HV) 10 10 10 t(f) 2.3 3.6 3.4
Worksheet 5-Effect of Upstream Signals
Computation 1-Queue Clearance Time at Upstream Signal
APPENDIX F
F-24
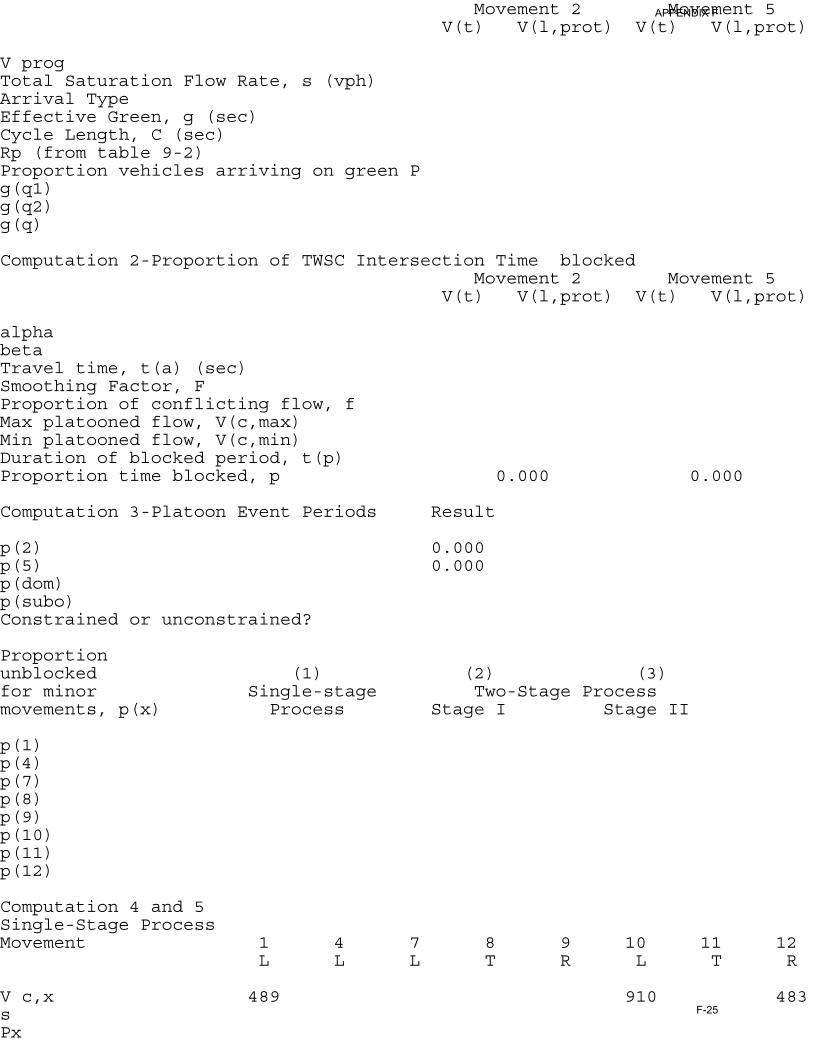
Movement 2 Movement 5 V(t) V(l,prot) V(t) V(l,prot)
V prog Total Saturation Flow Rate, s (vph) Arrival Type Effective Green, g (sec) Cycle Length, C (sec) Rp (from table 9-2) Proportion vehicles arriving on green P g(q1) g(q2) g(q)
Computation 2-Proportion of TWSC Intersection Time blocked Movement 2 Movement 5 V(t) V(l,prot) V(t) V(l,prot)
alpha beta Travel time, t(a) (sec) Smoothing Factor, F Proportion of conflicting flow, f Max platooned flow, V(c,max) Min platooned flow, V(c,min) Duration of blocked period, t(p) Proportion time blocked, p 0.000 0.000
Computation 3-Platoon Event Periods Result
p(2) 0.000 p(5) 0.000 p(dom) p(subo) Constrained or unconstrained?
Proportion unblocked (1) (2) (3) for minor Single-stage Two-Stage Process movements, p(x) Process Stage I Stage II
p(1) p(4) p(7) p(8) p(9) p(10) p(11) p(12)
Computation 4 and 5 Single-Stage Process Movement 1 4 7 8 9 10 11 12 L L L T R L T R
V c,x 489 910 483 s Px
APPENDIX F
F-25
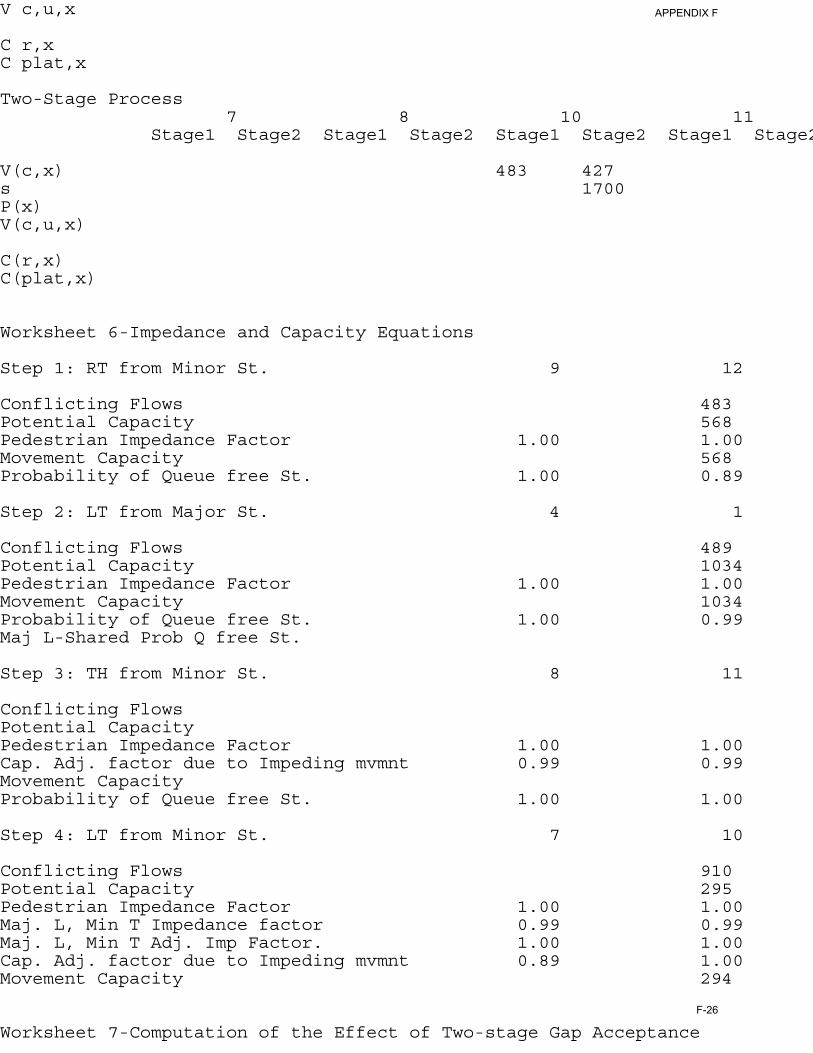
V c,u,x
C r,x C plat,x
Two-Stage Process 7 8 10 11 Stage1 Stage2 Stage1 Stage2 Stage1 Stage2 Stage1 Stage2
V(c,x) 483 427 s 1700 P(x) V(c,u,x)
C(r,x) C(plat,x)
Worksheet 6-Impedance and Capacity Equations
Step 1: RT from Minor St. 9 12
Conflicting Flows 483 Potential Capacity 568 Pedestrian Impedance Factor 1.00 1.00 Movement Capacity 568 Probability of Queue free St. 1.00 0.89
Step 2: LT from Major St. 4 1
Conflicting Flows 489 Potential Capacity 1034 Pedestrian Impedance Factor 1.00 1.00 Movement Capacity 1034 Probability of Queue free St. 1.00 0.99 Maj L-Shared Prob Q free St.
Step 3: TH from Minor St. 8 11
Conflicting Flows Potential Capacity Pedestrian Impedance Factor 1.00 1.00 Cap. Adj. factor due to Impeding mvmnt 0.99 0.99 Movement Capacity Probability of Queue free St. 1.00 1.00
Step 4: LT from Minor St. 7 10
Conflicting Flows 910 Potential Capacity 295 Pedestrian Impedance Factor 1.00 1.00 Maj. L, Min T Impedance factor 0.99 0.99 Maj. L, Min T Adj. Imp Factor. 1.00 1.00 Cap. Adj. factor due to Impeding mvmnt 0.89 1.00 Movement Capacity 294
Worksheet 7-Computation of the Effect of Two-stage Gap Acceptance
APPENDIX F
F-26
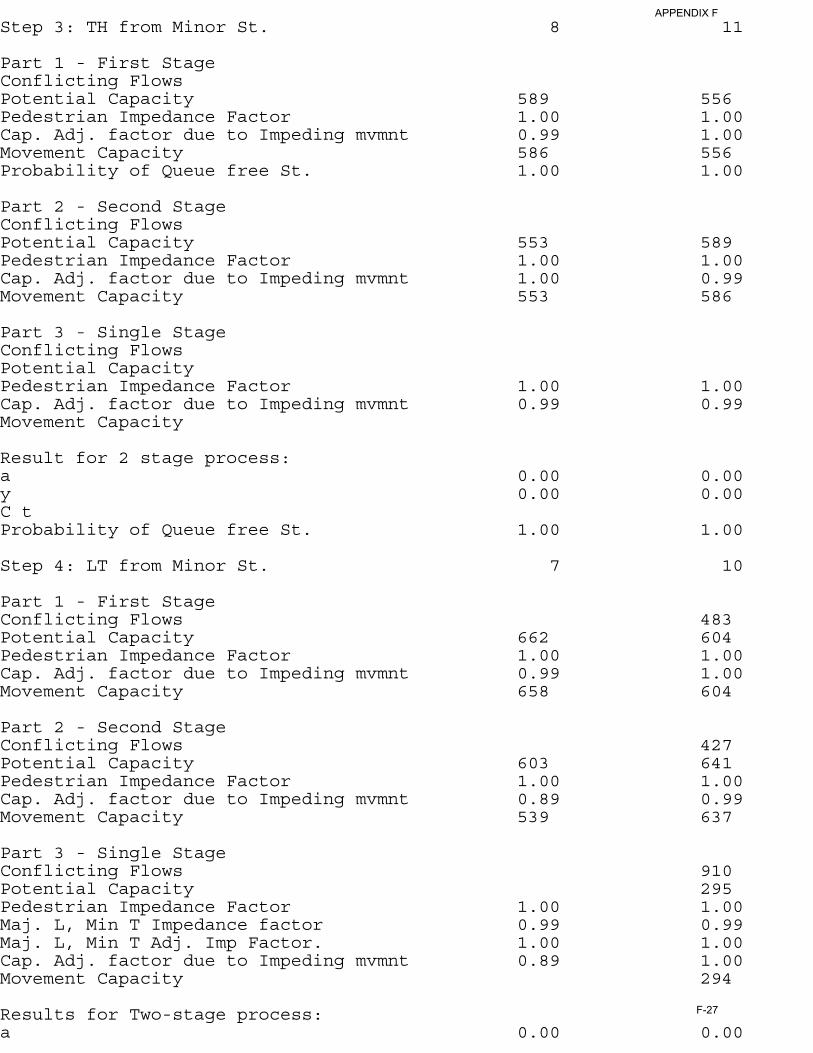
Step 3: TH from Minor St. 8 11
Part 1 - First Stage Conflicting Flows Potential Capacity 589 556 Pedestrian Impedance Factor 1.00 1.00 Cap. Adj. factor due to Impeding mvmnt 0.99 1.00 Movement Capacity 586 556 Probability of Queue free St. 1.00 1.00
Part 2 - Second Stage Conflicting Flows Potential Capacity 553 589 Pedestrian Impedance Factor 1.00 1.00 Cap. Adj. factor due to Impeding mvmnt 1.00 0.99 Movement Capacity 553 586
Part 3 - Single Stage Conflicting Flows Potential Capacity Pedestrian Impedance Factor 1.00 1.00 Cap. Adj. factor due to Impeding mvmnt 0.99 0.99 Movement Capacity
Result for 2 stage process: a 0.00 0.00 y 0.00 0.00 C t Probability of Queue free St. 1.00 1.00
Step 4: LT from Minor St. 7 10
Part 1 - First Stage Conflicting Flows 483 Potential Capacity 662 604 Pedestrian Impedance Factor 1.00 1.00 Cap. Adj. factor due to Impeding mvmnt 0.99 1.00 Movement Capacity 658 604
Part 2 - Second Stage Conflicting Flows 427 Potential Capacity 603 641 Pedestrian Impedance Factor 1.00 1.00 Cap. Adj. factor due to Impeding mvmnt 0.89 0.99 Movement Capacity 539 637
Part 3 - Single Stage Conflicting Flows 910 Potential Capacity 295 Pedestrian Impedance Factor 1.00 1.00 Maj. L, Min T Impedance factor 0.99 0.99 Maj. L, Min T Adj. Imp Factor. 1.00 1.00 Cap. Adj. factor due to Impeding mvmnt 0.89 1.00 Movement Capacity 294
Results for Two-stage process: a 0.00 0.00
APPENDIX F
F-27

y 0.00 0.00 C t 294
Worksheet 8-Shared Lane Calculations
Movement 7 8 9 10 11 12 L T R L T R
Volume (vph) 60 60 Movement Capacity (vph) 294 568 Shared Lane Capacity (vph)
Worksheet 9-Computation of Effect of Flared Minor Street Approaches
Movement 7 8 9 10 11 12 L T R L T R
C sep 294 568 Volume 60 60 Delay Q sep Q sep +1 round (Qsep +1)
n max C sh SUM C sep n C act
Worksheet 10-Delay, Queue Length, and Level of Service
Movement 1 4 7 8 9 10 11 12 Lane Config L L R
v (vph) 6 60 60 C(m) (vph) 1034 294 568 v/c 0.01 0.20 0.11 95% queue length 0.00 0.85 0.33 Control Delay 8.5 20.4 12.1 LOS A C B Approach Delay 16.2 Approach LOS C
Worksheet 11-Shared Major LT Impedance and Delay
Movement 2 Movement 5
p(oj) 0.99 1.00 v(il), Volume for stream 2 or 5 v(i2), Volume for stream 3 or 6 s(il), Saturation flow rate for stream 2 or 5 s(i2), Saturation flow rate for stream 3 or 6 P*(oj)
APPENDIX F
F-28

d(M,LT), Delay for stream 1 or 4 8.5 N, Number of major street through lanes d(rank,1) Delay for stream 2 or 5
APPENDIX F
F-29
HCS: Unsignalized Intersections Release 3.2
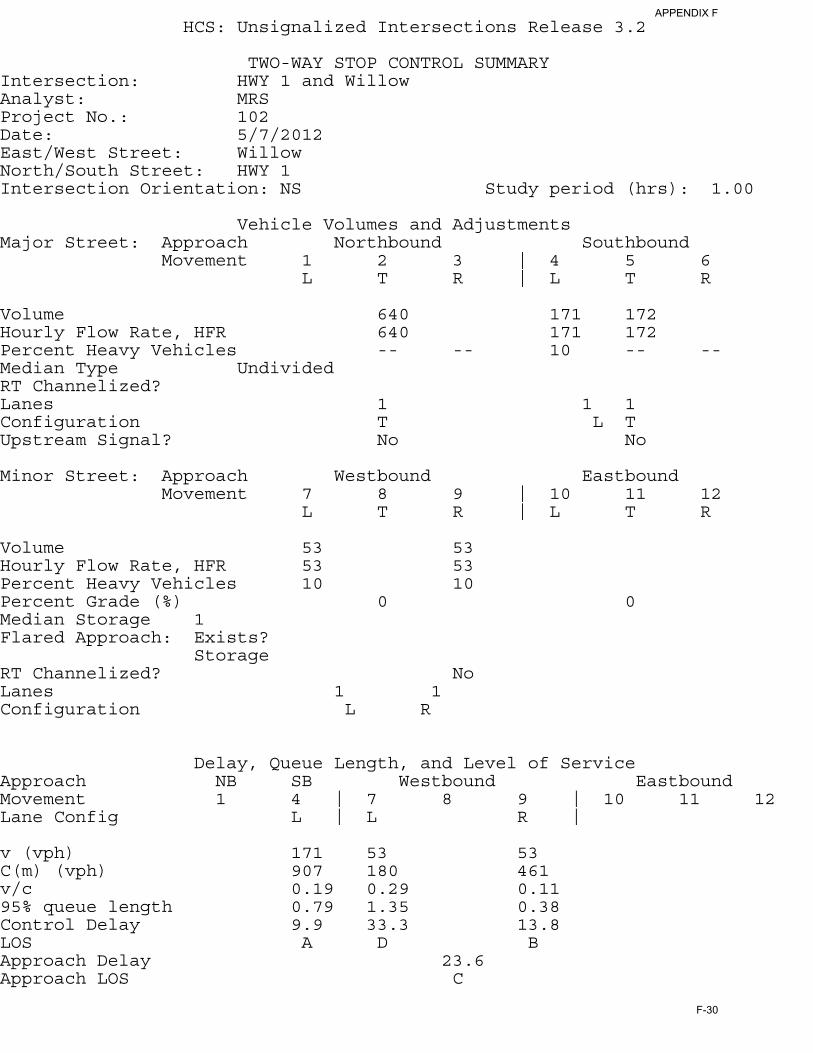
TWO-WAY STOP CONTROL SUMMARYIntersection: HWY 1 and Willow Analyst: MRS Project No.: 102 Date: 5/7/2012 East/West Street: Willow North/South Street: HWY 1 Intersection Orientation: NS Study period (hrs): 1.00
Vehicle Volumes and AdjustmentsMajor Street: Approach Northbound Southbound Movement 1 2 3 | 4 5 6 L T R | L T R
Volume 640 171 172 Hourly Flow Rate, HFR 640 171 172 Percent Heavy Vehicles -- -- 10 -- -- Median Type Undivided RT Channelized? Lanes 1 1 1 Configuration T L T Upstream Signal? No No
Minor Street: Approach Westbound Eastbound Movement 7 8 9 | 10 11 12 L T R | L T R
Volume 53 53 Hourly Flow Rate, HFR 53 53 Percent Heavy Vehicles 10 10 Percent Grade (%) 0 0 Median Storage 1 Flared Approach: Exists? Storage RT Channelized? No Lanes 1 1 Configuration L R
Delay, Queue Length, and Level of Service
Approach NB SB Westbound Eastbound Movement 1 4 | 7 8 9 | 10 11 12 Lane Config L | L R |
v (vph) 171 53 53 C(m) (vph) 907 180 461 v/c 0.19 0.29 0.11 95% queue length 0.79 1.35 0.38 Control Delay 9.9 33.3 13.8 LOS A D B Approach Delay 23.6 Approach LOS C
APPENDIX F
F-30
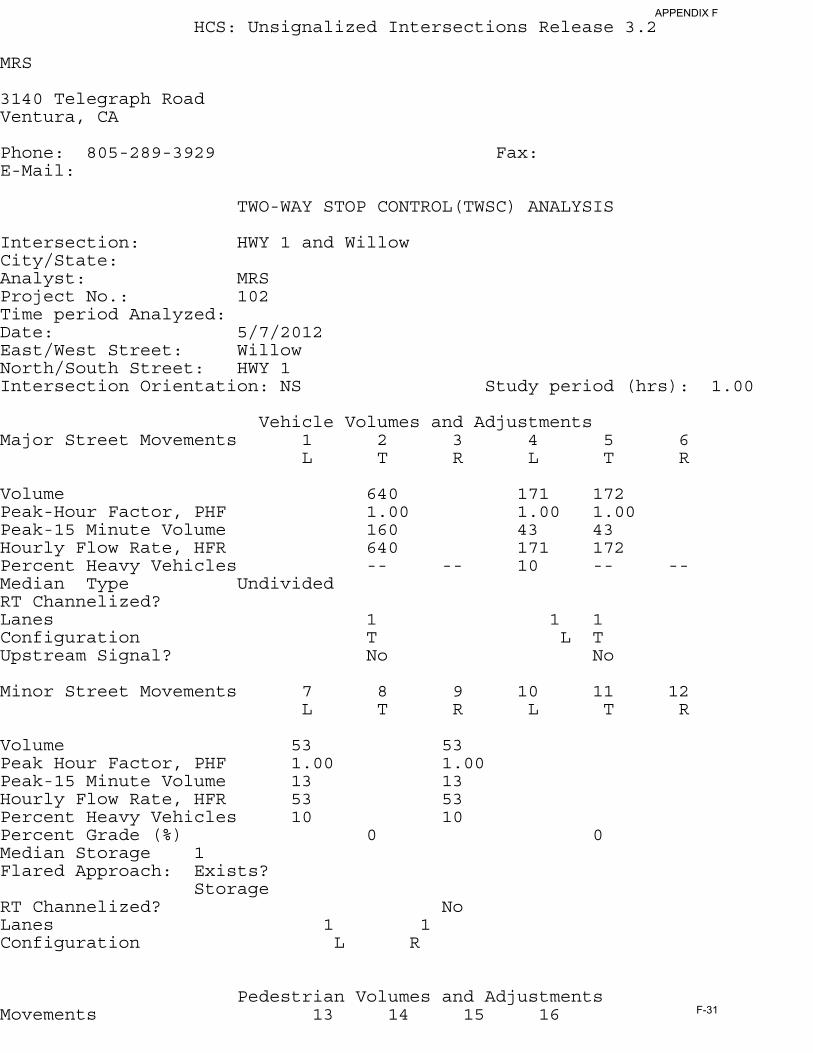
HCS: Unsignalized Intersections Release 3.2 MRS 3140 Telegraph Road Ventura, CA Phone: 805-289-3929 Fax: E-Mail:
TWO-WAY STOP CONTROL(TWSC) ANALYSIS Intersection: HWY 1 and Willow City/State: Analyst: MRS Project No.: 102 Time period Analyzed: Date: 5/7/2012 East/West Street: Willow North/South Street: HWY 1 Intersection Orientation: NS Study period (hrs): 1.00
Vehicle Volumes and AdjustmentsMajor Street Movements 1 2 3 4 5 6 L T R L T R
Volume 640 171 172 Peak-Hour Factor, PHF 1.00 1.00 1.00 Peak-15 Minute Volume 160 43 43 Hourly Flow Rate, HFR 640 171 172 Percent Heavy Vehicles -- -- 10 -- -- Median Type Undivided RT Channelized? Lanes 1 1 1 Configuration T L T Upstream Signal? No No
Minor Street Movements 7 8 9 10 11 12 L T R L T R
Volume 53 53 Peak Hour Factor, PHF 1.00 1.00 Peak-15 Minute Volume 13 13 Hourly Flow Rate, HFR 53 53 Percent Heavy Vehicles 10 10 Percent Grade (%) 0 0 Median Storage 1 Flared Approach: Exists? Storage RT Channelized? No Lanes 1 1 Configuration L R
Pedestrian Volumes and Adjustments
Movements 13 14 15 16
APPENDIX F
F-31
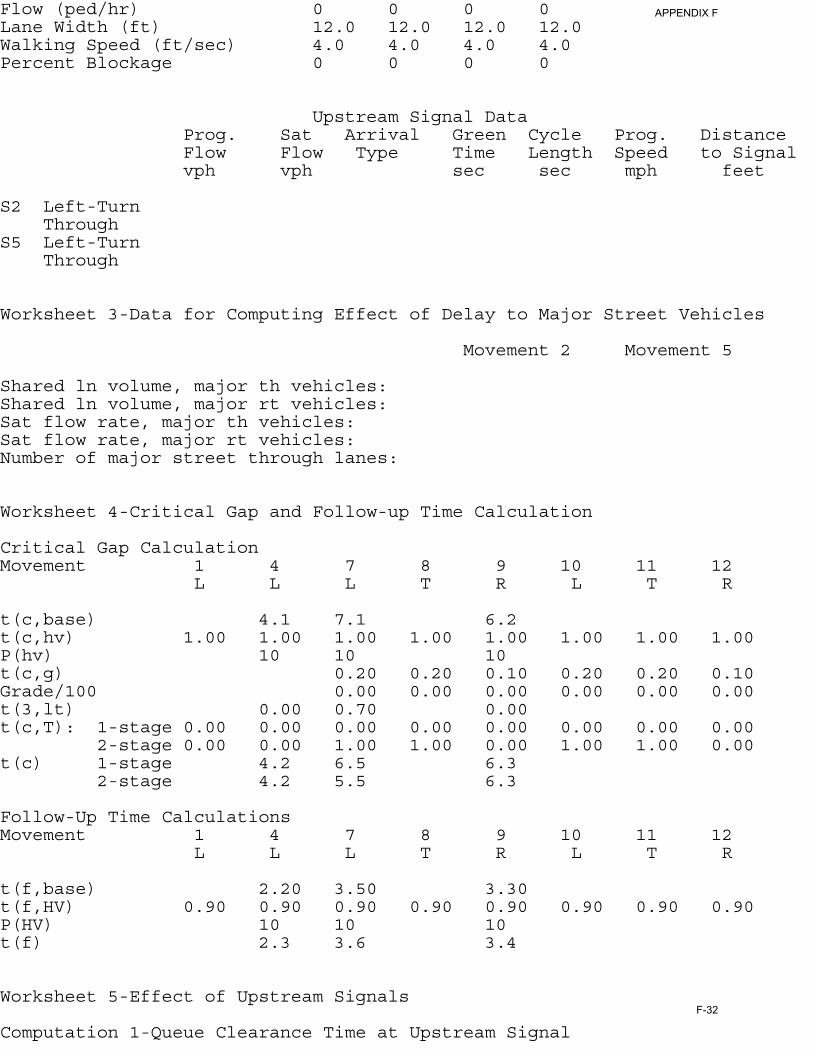
Flow (ped/hr) 0 0 0 0 Lane Width (ft) 12.0 12.0 12.0 12.0 Walking Speed (ft/sec) 4.0 4.0 4.0 4.0 Percent Blockage 0 0 0 0
Upstream Signal Data
Prog. Sat Arrival Green Cycle Prog. Distance Flow Flow Type Time Length Speed to Signal vph vph sec sec mph feet
S2 Left-Turn Through S5 Left-Turn Through
Worksheet 3-Data for Computing Effect of Delay to Major Street Vehicles
Movement 2 Movement 5
Shared ln volume, major th vehicles: Shared ln volume, major rt vehicles: Sat flow rate, major th vehicles: Sat flow rate, major rt vehicles: Number of major street through lanes:
Worksheet 4-Critical Gap and Follow-up Time Calculation
Critical Gap Calculation Movement 1 4 7 8 9 10 11 12 L L L T R L T R
t(c,base) 4.1 7.1 6.2 t(c,hv) 1.00 1.00 1.00 1.00 1.00 1.00 1.00 1.00 P(hv) 10 10 10 t(c,g) 0.20 0.20 0.10 0.20 0.20 0.10 Grade/100 0.00 0.00 0.00 0.00 0.00 0.00 t(3,lt) 0.00 0.70 0.00 t(c,T): 1-stage 0.00 0.00 0.00 0.00 0.00 0.00 0.00 0.00 2-stage 0.00 0.00 1.00 1.00 0.00 1.00 1.00 0.00 t(c) 1-stage 4.2 6.5 6.3 2-stage 4.2 5.5 6.3
Follow-Up Time Calculations Movement 1 4 7 8 9 10 11 12 L L L T R L T R
t(f,base) 2.20 3.50 3.30 t(f,HV) 0.90 0.90 0.90 0.90 0.90 0.90 0.90 0.90 P(HV) 10 10 10 t(f) 2.3 3.6 3.4
Worksheet 5-Effect of Upstream Signals
Computation 1-Queue Clearance Time at Upstream Signal
APPENDIX F
F-32

Movement 2 Movement 5 V(t) V(l,prot) V(t) V(l,prot)
V prog Total Saturation Flow Rate, s (vph) Arrival Type Effective Green, g (sec) Cycle Length, C (sec) Rp (from table 9-2) Proportion vehicles arriving on green P g(q1) g(q2) g(q)
Computation 2-Proportion of TWSC Intersection Time blocked Movement 2 Movement 5 V(t) V(l,prot) V(t) V(l,prot)
alpha beta Travel time, t(a) (sec) Smoothing Factor, F Proportion of conflicting flow, f Max platooned flow, V(c,max) Min platooned flow, V(c,min) Duration of blocked period, t(p) Proportion time blocked, p 0.000 0.000
Computation 3-Platoon Event Periods Result
p(2) 0.000 p(5) 0.000 p(dom) p(subo) Constrained or unconstrained?
Proportion unblocked (1) (2) (3) for minor Single-stage Two-Stage Process movements, p(x) Process Stage I Stage II
p(1) p(4) p(7) p(8) p(9) p(10) p(11) p(12)
Computation 4 and 5 Single-Stage Process Movement 1 4 7 8 9 10 11 12 L L L T R L T R
V c,x 640 1154 640 s Px
APPENDIX F
F-33
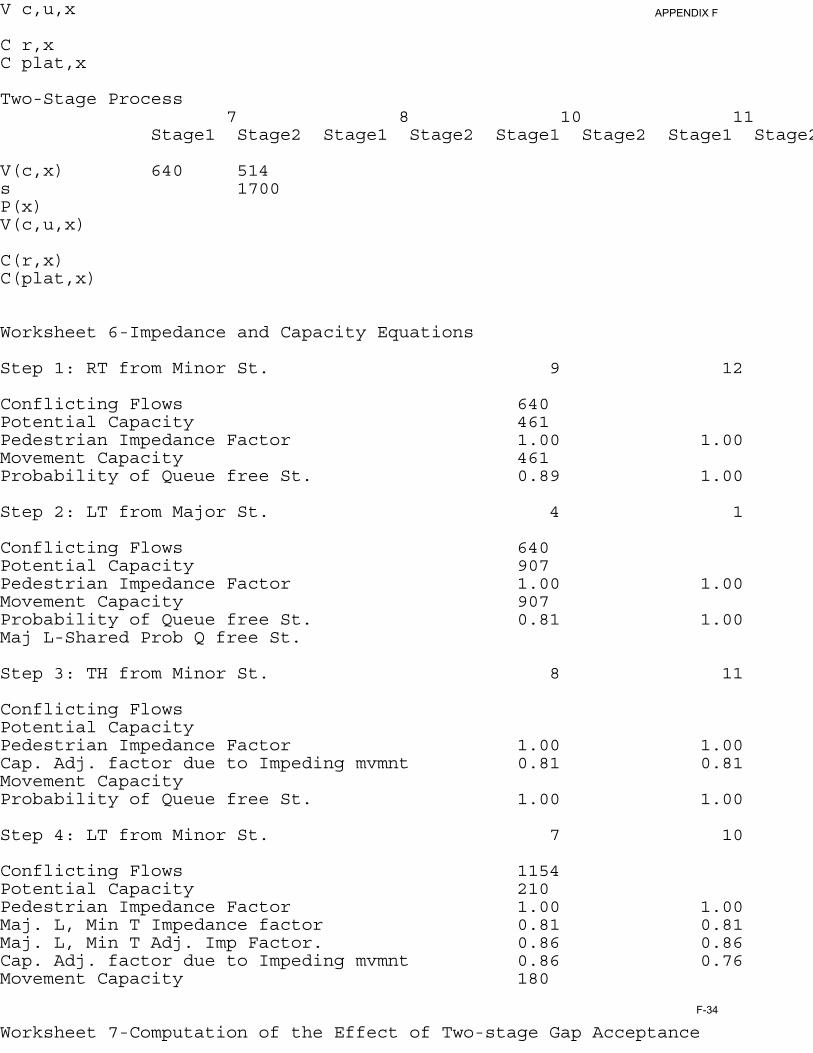
V c,u,x
C r,x C plat,x
Two-Stage Process 7 8 10 11 Stage1 Stage2 Stage1 Stage2 Stage1 Stage2 Stage1 Stage2
V(c,x) 640 514 s 1700 P(x) V(c,u,x)
C(r,x) C(plat,x)
Worksheet 6-Impedance and Capacity Equations
Step 1: RT from Minor St. 9 12
Conflicting Flows 640 Potential Capacity 461 Pedestrian Impedance Factor 1.00 1.00 Movement Capacity 461 Probability of Queue free St. 0.89 1.00
Step 2: LT from Major St. 4 1
Conflicting Flows 640 Potential Capacity 907 Pedestrian Impedance Factor 1.00 1.00 Movement Capacity 907 Probability of Queue free St. 0.81 1.00 Maj L-Shared Prob Q free St.
Step 3: TH from Minor St. 8 11
Conflicting Flows Potential Capacity Pedestrian Impedance Factor 1.00 1.00 Cap. Adj. factor due to Impeding mvmnt 0.81 0.81 Movement Capacity Probability of Queue free St. 1.00 1.00
Step 4: LT from Minor St. 7 10
Conflicting Flows 1154 Potential Capacity 210 Pedestrian Impedance Factor 1.00 1.00 Maj. L, Min T Impedance factor 0.81 0.81 Maj. L, Min T Adj. Imp Factor. 0.86 0.86 Cap. Adj. factor due to Impeding mvmnt 0.86 0.76 Movement Capacity 180
Worksheet 7-Computation of the Effect of Two-stage Gap Acceptance
APPENDIX F
F-34
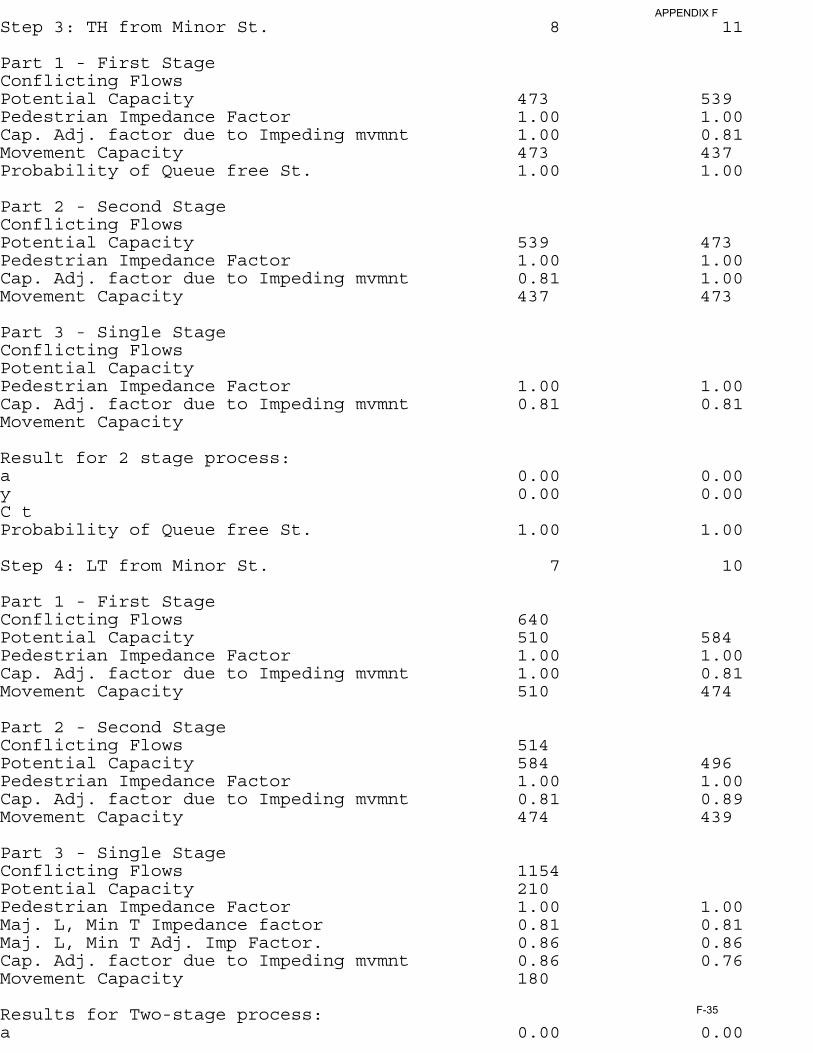
Step 3: TH from Minor St. 8 11
Part 1 - First Stage Conflicting Flows Potential Capacity 473 539 Pedestrian Impedance Factor 1.00 1.00 Cap. Adj. factor due to Impeding mvmnt 1.00 0.81 Movement Capacity 473 437 Probability of Queue free St. 1.00 1.00
Part 2 - Second Stage Conflicting Flows Potential Capacity 539 473 Pedestrian Impedance Factor 1.00 1.00 Cap. Adj. factor due to Impeding mvmnt 0.81 1.00 Movement Capacity 437 473
Part 3 - Single Stage Conflicting Flows Potential Capacity Pedestrian Impedance Factor 1.00 1.00 Cap. Adj. factor due to Impeding mvmnt 0.81 0.81 Movement Capacity
Result for 2 stage process: a 0.00 0.00 y 0.00 0.00 C t Probability of Queue free St. 1.00 1.00
Step 4: LT from Minor St. 7 10
Part 1 - First Stage Conflicting Flows 640 Potential Capacity 510 584 Pedestrian Impedance Factor 1.00 1.00 Cap. Adj. factor due to Impeding mvmnt 1.00 0.81 Movement Capacity 510 474
Part 2 - Second Stage Conflicting Flows 514 Potential Capacity 584 496 Pedestrian Impedance Factor 1.00 1.00 Cap. Adj. factor due to Impeding mvmnt 0.81 0.89 Movement Capacity 474 439
Part 3 - Single Stage Conflicting Flows 1154 Potential Capacity 210 Pedestrian Impedance Factor 1.00 1.00 Maj. L, Min T Impedance factor 0.81 0.81 Maj. L, Min T Adj. Imp Factor. 0.86 0.86 Cap. Adj. factor due to Impeding mvmnt 0.86 0.76 Movement Capacity 180
Results for Two-stage process: a 0.00 0.00
APPENDIX F
F-35

y 0.00 0.00 C t 180
Worksheet 8-Shared Lane Calculations
Movement 7 8 9 10 11 12 L T R L T R
Volume (vph) 53 53 Movement Capacity (vph) 180 461 Shared Lane Capacity (vph)
Worksheet 9-Computation of Effect of Flared Minor Street Approaches
Movement 7 8 9 10 11 12 L T R L T R
C sep 180 461 Volume 53 53 Delay Q sep Q sep +1 round (Qsep +1)
n max C sh SUM C sep n C act
Worksheet 10-Delay, Queue Length, and Level of Service
Movement 1 4 7 8 9 10 11 12 Lane Config L L R
v (vph) 171 53 53 C(m) (vph) 907 180 461 v/c 0.19 0.29 0.11 95% queue length 0.79 1.35 0.38 Control Delay 9.9 33.3 13.8 LOS A D B Approach Delay 23.6 Approach LOS C
Worksheet 11-Shared Major LT Impedance and Delay
Movement 2 Movement 5
p(oj) 1.00 0.81 v(il), Volume for stream 2 or 5 v(i2), Volume for stream 3 or 6 s(il), Saturation flow rate for stream 2 or 5 s(i2), Saturation flow rate for stream 3 or 6 P*(oj)
APPENDIX F
F-36
d(M,LT), Delay for stream 1 or 4 9.9 N, Number of major street through lanes d(rank,1) Delay for stream 2 or 5
APPENDIX F
F-37

HCS: Unsignalized Intersections Release 3.2
TWO-WAY STOP CONTROL SUMMARYIntersection: HWY 1 and Willow Analyst: MRS Project No.: 102 Date: 5/7/2012 East/West Street: Willow North/South Street: HWY 1 Intersection Orientation: NS Study period (hrs): 1.00
Vehicle Volumes and AdjustmentsMajor Street: Approach Northbound Southbound Movement 1 2 3 | 4 5 6 L T R | L T R
Volume 640 268 269 Hourly Flow Rate, HFR 640 268 269 Percent Heavy Vehicles -- -- 10 -- -- Median Type Undivided RT Channelized? Lanes 1 1 1 Configuration T L T Upstream Signal? No No
Minor Street: Approach Westbound Eastbound Movement 7 8 9 | 10 11 12 L T R | L T R
Volume 78 78 Hourly Flow Rate, HFR 78 78 Percent Heavy Vehicles 10 10 Percent Grade (%) 0 0 Median Storage 1 Flared Approach: Exists? Storage RT Channelized? No Lanes 1 1 Configuration L R
Delay, Queue Length, and Level of Service
Approach NB SB Westbound Eastbound Movement 1 4 | 7 8 9 | 10 11 12 Lane Config L | L R |
v (vph) 268 78 78 C(m) (vph) 907 107 461 v/c 0.30 0.73 0.17 95% queue length 1.44 5.43 0.67 Control Delay 10.6 116.7 14.4 LOS B F B Approach Delay 65.5 Approach LOS F
APPENDIX F
F-38

HCS: Unsignalized Intersections Release 3.2 MRS 3140 Telegraph Road Ventura, CA Phone: 805-289-3929 Fax: E-Mail:
TWO-WAY STOP CONTROL(TWSC) ANALYSIS Intersection: HWY 1 and Willow City/State: Analyst: MRS Project No.: 102 Time period Analyzed: Date: 5/7/2012 East/West Street: Willow North/South Street: HWY 1 Intersection Orientation: NS Study period (hrs): 1.00
Vehicle Volumes and AdjustmentsMajor Street Movements 1 2 3 4 5 6 L T R L T R
Volume 640 268 269 Peak-Hour Factor, PHF 1.00 1.00 1.00 Peak-15 Minute Volume 160 67 67 Hourly Flow Rate, HFR 640 268 269 Percent Heavy Vehicles -- -- 10 -- -- Median Type Undivided RT Channelized? Lanes 1 1 1 Configuration T L T Upstream Signal? No No
Minor Street Movements 7 8 9 10 11 12 L T R L T R
Volume 78 78 Peak Hour Factor, PHF 1.00 1.00 Peak-15 Minute Volume 20 20 Hourly Flow Rate, HFR 78 78 Percent Heavy Vehicles 10 10 Percent Grade (%) 0 0 Median Storage 1 Flared Approach: Exists? Storage RT Channelized? No Lanes 1 1 Configuration L R
Pedestrian Volumes and Adjustments
Movements 13 14 15 16
APPENDIX F
F-39

Flow (ped/hr) 0 0 0 0 Lane Width (ft) 12.0 12.0 12.0 12.0 Walking Speed (ft/sec) 4.0 4.0 4.0 4.0 Percent Blockage 0 0 0 0
Upstream Signal Data
Prog. Sat Arrival Green Cycle Prog. Distance Flow Flow Type Time Length Speed to Signal vph vph sec sec mph feet
S2 Left-Turn Through S5 Left-Turn Through
Worksheet 3-Data for Computing Effect of Delay to Major Street Vehicles
Movement 2 Movement 5
Shared ln volume, major th vehicles: Shared ln volume, major rt vehicles: Sat flow rate, major th vehicles: Sat flow rate, major rt vehicles: Number of major street through lanes:
Worksheet 4-Critical Gap and Follow-up Time Calculation
Critical Gap Calculation Movement 1 4 7 8 9 10 11 12 L L L T R L T R
t(c,base) 4.1 7.1 6.2 t(c,hv) 1.00 1.00 1.00 1.00 1.00 1.00 1.00 1.00 P(hv) 10 10 10 t(c,g) 0.20 0.20 0.10 0.20 0.20 0.10 Grade/100 0.00 0.00 0.00 0.00 0.00 0.00 t(3,lt) 0.00 0.70 0.00 t(c,T): 1-stage 0.00 0.00 0.00 0.00 0.00 0.00 0.00 0.00 2-stage 0.00 0.00 1.00 1.00 0.00 1.00 1.00 0.00 t(c) 1-stage 4.2 6.5 6.3 2-stage 4.2 5.5 6.3
Follow-Up Time Calculations Movement 1 4 7 8 9 10 11 12 L L L T R L T R
t(f,base) 2.20 3.50 3.30 t(f,HV) 0.90 0.90 0.90 0.90 0.90 0.90 0.90 0.90 P(HV) 10 10 10 t(f) 2.3 3.6 3.4
Worksheet 5-Effect of Upstream Signals
Computation 1-Queue Clearance Time at Upstream Signal
APPENDIX F
F-40
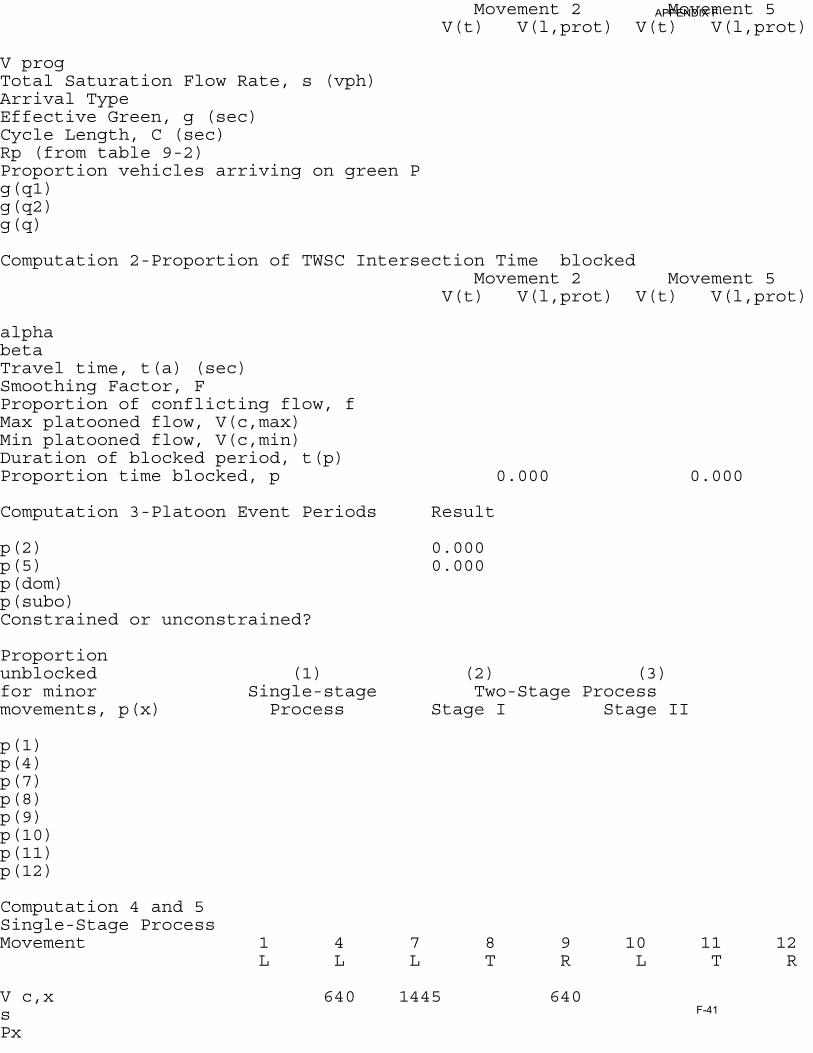
Movement 2 Movement 5 V(t) V(l,prot) V(t) V(l,prot)
V prog Total Saturation Flow Rate, s (vph) Arrival Type Effective Green, g (sec) Cycle Length, C (sec) Rp (from table 9-2) Proportion vehicles arriving on green P g(q1) g(q2) g(q)
Computation 2-Proportion of TWSC Intersection Time blocked Movement 2 Movement 5 V(t) V(l,prot) V(t) V(l,prot)
alpha beta Travel time, t(a) (sec) Smoothing Factor, F Proportion of conflicting flow, f Max platooned flow, V(c,max) Min platooned flow, V(c,min) Duration of blocked period, t(p) Proportion time blocked, p 0.000 0.000
Computation 3-Platoon Event Periods Result
p(2) 0.000 p(5) 0.000 p(dom) p(subo) Constrained or unconstrained?
Proportion unblocked (1) (2) (3) for minor Single-stage Two-Stage Process movements, p(x) Process Stage I Stage II
p(1) p(4) p(7) p(8) p(9) p(10) p(11) p(12)
Computation 4 and 5 Single-Stage Process Movement 1 4 7 8 9 10 11 12 L L L T R L T R
V c,x 640 1445 640 s Px
APPENDIX F
F-41
V c,u,x
C r,x C plat,x
Two-Stage Process 7 8 10 11 Stage1 Stage2 Stage1 Stage2 Stage1 Stage2 Stage1 Stage2
V(c,x) 640 805 s 1700 P(x) V(c,u,x)
C(r,x) C(plat,x)
Worksheet 6-Impedance and Capacity Equations
Step 1: RT from Minor St. 9 12
Conflicting Flows 640 Potential Capacity 461 Pedestrian Impedance Factor 1.00 1.00 Movement Capacity 461 Probability of Queue free St. 0.83 1.00
Step 2: LT from Major St. 4 1
Conflicting Flows 640 Potential Capacity 907 Pedestrian Impedance Factor 1.00 1.00 Movement Capacity 907 Probability of Queue free St. 0.70 1.00 Maj L-Shared Prob Q free St.
Step 3: TH from Minor St. 8 11
Conflicting Flows Potential Capacity Pedestrian Impedance Factor 1.00 1.00 Cap. Adj. factor due to Impeding mvmnt 0.70 0.70 Movement Capacity Probability of Queue free St. 1.00 1.00
Step 4: LT from Minor St. 7 10
Conflicting Flows 1445 Potential Capacity 139 Pedestrian Impedance Factor 1.00 1.00 Maj. L, Min T Impedance factor 0.70 0.70 Maj. L, Min T Adj. Imp Factor. 0.77 0.77 Cap. Adj. factor due to Impeding mvmnt 0.77 0.64 Movement Capacity 107
Worksheet 7-Computation of the Effect of Two-stage Gap Acceptance
APPENDIX F
F-42

Step 3: TH from Minor St. 8 11
Part 1 - First Stage Conflicting Flows Potential Capacity 473 398 Pedestrian Impedance Factor 1.00 1.00 Cap. Adj. factor due to Impeding mvmnt 1.00 0.70 Movement Capacity 473 280 Probability of Queue free St. 1.00 1.00
Part 2 - Second Stage Conflicting Flows Potential Capacity 398 473 Pedestrian Impedance Factor 1.00 1.00 Cap. Adj. factor due to Impeding mvmnt 0.70 1.00 Movement Capacity 280 473
Part 3 - Single Stage Conflicting Flows Potential Capacity Pedestrian Impedance Factor 1.00 1.00 Cap. Adj. factor due to Impeding mvmnt 0.70 0.70 Movement Capacity
Result for 2 stage process: a 0.00 0.00 y 0.00 0.00 C t Probability of Queue free St. 1.00 1.00
Step 4: LT from Minor St. 7 10
Part 1 - First Stage Conflicting Flows 640 Potential Capacity 510 426 Pedestrian Impedance Factor 1.00 1.00 Cap. Adj. factor due to Impeding mvmnt 1.00 0.70 Movement Capacity 510 300
Part 2 - Second Stage Conflicting Flows 805 Potential Capacity 426 489 Pedestrian Impedance Factor 1.00 1.00 Cap. Adj. factor due to Impeding mvmnt 0.70 0.83 Movement Capacity 300 406
Part 3 - Single Stage Conflicting Flows 1445 Potential Capacity 139 Pedestrian Impedance Factor 1.00 1.00 Maj. L, Min T Impedance factor 0.70 0.70 Maj. L, Min T Adj. Imp Factor. 0.77 0.77 Cap. Adj. factor due to Impeding mvmnt 0.77 0.64 Movement Capacity 107
Results for Two-stage process: a 0.00 0.00
APPENDIX F
F-43
y 0.00 0.00 C t 107
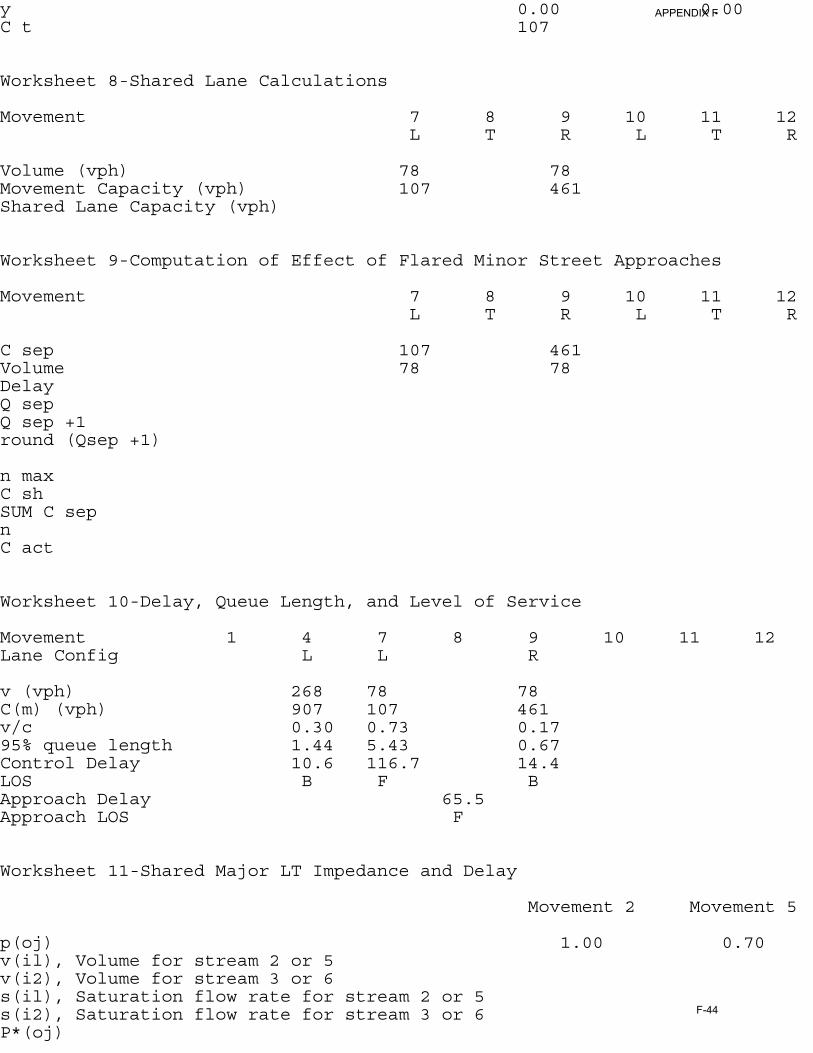
Worksheet 8-Shared Lane Calculations
Movement 7 8 9 10 11 12 L T R L T R
Volume (vph) 78 78 Movement Capacity (vph) 107 461 Shared Lane Capacity (vph)
Worksheet 9-Computation of Effect of Flared Minor Street Approaches
Movement 7 8 9 10 11 12 L T R L T R
C sep 107 461 Volume 78 78 Delay Q sep Q sep +1 round (Qsep +1)
n max C sh SUM C sep n C act
Worksheet 10-Delay, Queue Length, and Level of Service
Movement 1 4 7 8 9 10 11 12 Lane Config L L R
v (vph) 268 78 78 C(m) (vph) 907 107 461 v/c 0.30 0.73 0.17 95% queue length 1.44 5.43 0.67 Control Delay 10.6 116.7 14.4 LOS B F B Approach Delay 65.5 Approach LOS F
Worksheet 11-Shared Major LT Impedance and Delay
Movement 2 Movement 5
p(oj) 1.00 0.70 v(il), Volume for stream 2 or 5 v(i2), Volume for stream 3 or 6 s(il), Saturation flow rate for stream 2 or 5 s(i2), Saturation flow rate for stream 3 or 6 P*(oj)
APPENDIX F
F-44

d(M,LT), Delay for stream 1 or 4 10.6 N, Number of major street through lanes d(rank,1) Delay for stream 2 or 5
APPENDIX F
F-45
APPENDIX F
F-46