Embed Size (px)
DESCRIPTION
MEDUSA integrates mRNA expression, promoter sequence, and ChIP-chip occupancy data to learn a model that accurately predicts the differential expression of target genes in held-out data.
Citation preview
A Predictive Model of the Oxygen and Heme RegulatoryNetwork in YeastAnshul Kundaje1, Xiantong Xin2, Changgui Lan2, Steve Lianoglou3,4, Mei Zhou2, Li Zhang2*, Christina
Leslie4*
1 Department of Computer Science, Columbia University, New York, New York, United States of America, 2 Department of Molecular and Cell Biology, University of Texas
at Dallas, Richardson, Texas, United States of America, 3 Department of Physiology, Biophysics, and Systems Biology, Weill Medical College of Cornell University, New York,
New York, United States of America, 4 Computational Biology Program, Memorial Sloan-Kettering Cancer Center, New York, New York, United States of America
Abstract
Deciphering gene regulatory mechanisms through the analysis of high-throughput expression data is a challengingcomputational problem. Previous computational studies have used large expression datasets in order to resolve finepatterns of coexpression, producing clusters or modules of potentially coregulated genes. These methods typically examinepromoter sequence information, such as DNA motifs or transcription factor occupancy data, in a separate step afterclustering. We needed an alternative and more integrative approach to study the oxygen regulatory network inSaccharomyces cerevisiae using a small dataset of perturbation experiments. Mechanisms of oxygen sensing and regulationunderlie many physiological and pathological processes, and only a handful of oxygen regulators have been identified inprevious studies. We used a new machine learning algorithm called MEDUSA to uncover detailed information about theoxygen regulatory network using genome-wide expression changes in response to perturbations in the levels of oxygen,heme, Hap1, and Co2+. MEDUSA integrates mRNA expression, promoter sequence, and ChIP-chip occupancy data to learn amodel that accurately predicts the differential expression of target genes in held-out data. We used a novel margin-basedscore to extract significant condition-specific regulators and assemble a global map of the oxygen sensing and regulatorynetwork. This network includes both known oxygen and heme regulators, such as Hap1, Mga2, Hap4, and Upc2, as well asmany new candidate regulators. MEDUSA also identified many DNA motifs that are consistent with previous experimentallyidentified transcription factor binding sites. Because MEDUSA’s regulatory program associates regulators to target genesthrough their promoter sequences, we directly tested the predicted regulators for OLE1, a gene specifically induced underhypoxia, by experimental analysis of the activity of its promoter. In each case, deletion of the candidate regulator resulted inthe predicted effect on promoter activity, confirming that several novel regulators identified by MEDUSA are indeedinvolved in oxygen regulation. MEDUSA can reveal important information from a small dataset and generate testablehypotheses for further experimental analysis. Supplemental data are included.
Citation: Kundaje A, Xin X, Lan C, Lianoglou S, Zhou M, et al. (2008) A Predictive Model of the Oxygen and Heme Regulatory Network in Yeast. PLoS ComputBiol 4(11): e1000224. doi:10.1371/journal.pcbi.1000224
Editor: Herbert M. Sauro, University of Washington, United States of America
Received April 7, 2008; Accepted October 8, 2008; Published November 14, 2008
Copyright: � 2008 Kundaje et al. This is an open-access article distributed under the terms of the Creative Commons Attribution License, which permitsunrestricted use, distribution, and reproduction in any medium, provided the original author and source are credited.
Funding: This work was supported by funds from National Institutes of Health (NIH) Grant No. GM62246 (Li Zhang). Christina Leslie is supported in part by NIHGrant No. CA121852. Christina Leslie and Li Zhang are also supported in part by National Science Foundation Grant No. IIS-0835494.
Competing Interests: The authors have declared that no competing interests exist.
* E-mail: [email protected] (LZ); [email protected] (CL)
Introduction
Oxygen is critical for the survival and development of virtually
all living organisms. As such, living organisms ranging from yeast
to humans have developed sophisticated mechanisms to respond
to changes of oxygen level in the environment [1]. Several
microarray gene expression studies have been performed in the
yeast model eukaryote Saccharomyces cerevisiae to understand oxygen
sensing and regulation at a genome-wide level [2–6]. However,
most of these studies mainly identified genes responding to low
levels of oxygen [2–6] or determined the DNA-binding sites for
several known oxygen regulators, such as Rox1 [3]. Recently,
there has also been a cluster analysis of expression profiles under
hypoxia and reoxygenation in glucose versus galactose media
[6,7], where the authors looked for enrichment of functional
annotations and known transcription factor binding sites within
gene clusters and also applied existing motif discovery algorithms
to the clusters. These previous microarray studies have provided
further evidence of the role of known regulators such as Hap1,
Rox1, and Upc2, but they have had limited success in identifying
novel components of the oxygen and heme regulatory network.
In this study, we apply an integrative computational approach
to analyze genome-wide changes in expression in response to
perturbations of the oxygen regulatory network. Our approach is
based on a new machine learning algorithm called MEDUSA that
combines information from promoter sequences and gene
expression profiling to learn a quantitative and statistically robust
global model for the oxygen regulatory system. (A mathematical
description of MEDUSA has appeared as an extended abstract in
a conference proceedings [8]). Numerous computational ap-
proaches for inferring gene regulatory networks from gene
expression data have been developed to date [9–20]. We were
motivated by two recent computational approaches in particular:
one algorithm aimed at predicting a gene’s cluster membership
based on the motifs in its promoter [21], and another for
partitioning genes into regulatory modules, i.e., clusters of genes
PLoS Computational Biology | www.ploscompbiol.org 1 November 2008 | Volume 4 | Issue 11 | e1000224
with shared regulatory logic [22]. Both these previous methods
depend on clustering genes and describing regulatory logic at the
level of clusters. However, genes with similar expression patterns
are not necessarily regulated by the same regulators and
mechanisms. Thus, in our work, we do not assume that clusters
reflect the full complexity and condition-specific nature of gene
regulation. Indeed, given that virtually all yeast RNA polymerase
II promoters are distinct, it remains to be demonstrated that any
two promoters are regulated identically by the same regulators
across all possible experimental conditions.
In contrast to these previous approaches, the MEDUSA
algorithm aims to predict the condition-specific differential
expression of individual genes, not clusters of genes, by using a
single global model. It integrates promoter sequence, promoter
occupancy data from ChIP-chip experiments, and the expression
levels of potential regulators, including those that do not bind to
DNA, to learn a regulatory program controlling target genes.
Notably, MEDUSA identifies motifs directly from promoter
sequences; no prior knowledge of any DNA-binding motifs is
used. MEDUSA trains on differentially expressed target genes
from multiple experiments to discover both the motifs in
promoters and the condition-specific regulators that together
define a global regulatory control program. This regulatory
program predicts whether a gene will be up- or downregulated,
given its promoter sequence and the condition-specific expression
level of the regulators. MEDUSA uses a modern statistical
learning technique called boosting [23] to avoid over-fitting as it
searches through the large space of possible regulators and
sequence motifs [24]. As a result, it achieved high prediction
accuracy in cross-validation results using held out gene-experiment
examples for the oxygen regulation dataset, where we compare
up/down prediction to experimentally measured differential
expression, despite the fact that the number of gene expression
experiments (6 conditions with 3 replicates) was much smaller than
in previous computational approaches for learning regulatory
networks. We then used a novel margin-based score to extract the
condition-specific regulators and putative DNA binding site motifs
that are most significant for predicting the expression of particular
sets of target genes. We summarized this information with a global
map of the oxygen regulatory network, which includes both known
and novel regulators. Since MEDUSA associates regulators to
target genes via motifs in the promoter sequence, we directly tested
the predicted regulators for the OLE1 gene by experimental
analysis of its promoter activity under deletion of each of these
regulators. In each case, the change in OLE1’s promoter activity
under hypoxia was consistent with MEDUSA’s predictions. These
results confirm that several novel regulators are indeed involved in
oxygen regulation. Finally, we performed a comprehensive
comparison of the motif discovery results of MEDUSA with a
conventional cluster-first motif discovery algorithm, and we found
that MEDUSA identified many DNA binding site motifs that are
relevant to hypoxia and missed by the traditional approach.
Results
Perturbations of the Oxygen Regulatory Network RevealDiverse Expression Signatures
We used microarray gene expression profiling data from triplicate
RNA samples, prepared from cells grown under eight different
experimental conditions (see Methods) to observe perturbations of
the oxygen sensing and regulatory network and study its behavior.
We identified several classes of genes: Hap1-dependent or -
independent oxygen-regulated, heme-regulated, and Co2+-inducible
genes (see Figures S6 and S7). These results were consistent with
previous studies identifying differentially expressed target genes. For
example, we identified previously known oxygen- and heme-induced
genes, such as COXs, CYC7 and CYT1 [25–29]; and previously
known hypoxia-induced genes, such as ANB1, MGA2, OLE1, PAU2-
5, PAU7, DAN1-4 and HSPs genes [30–39].
Prior to performing more integrative computational analysis, we
also examined the broad patterns of gene expression in our
dataset. We identified 16 distinct discretized co-expression
signatures (see Methods) to which we assigned the differentially
expressed genes, including 5 pairs of antagonistic signatures whose
patterns of expression are nearly the same but opposite in direction
(Figure 1). For example, we found a pair of expression signatures
consisting of genes that are exclusively induced by heme deletion
(signature 11) or exclusively suppressed in this condition (signature
14). Signature 14 contains the ergosterol biosynthesis genes, which
are known to be heme regulated, while most of the genes in
signature 11 (354 out of 500) are functionally uncharacterized and
may include novel heme-regulated genes. While most of these
expression signatures contain several hundred genes, a few sets are
smaller and functionally more coherent. In particular, signature 16
consists of 34 Hap1-dependent genes that are strongly suppressed
in all conditions including the Dhap1 experiment. These genes
include the COX and QCR genes and are involved in aerobic
respiratory processes, electron transport, and heme-dependent
oxidoreducatase activity. In most cases, the expression signatures
could be assigned significant functional terms, though in general
only a smaller subset of the genes in a signature belong to the
enriched category (see Text S1 for details).
MEDUSA Deciphers Regulatory Networks withoutClustering Genes
While these signatures consist of genes that are coexpressed, for
the most part they are large and functionally heterogeneous gene
sets and do not represent true functional regulons. In general,
small expression datasets may not contain enough resolution to
decipher fine context-specific coexpression patterns, and analysis
of coexpressed gene sets can provide only limited insight into
Author Summary
The cell uses complex regulatory networks to modulatethe expression of genes in response to changes in cellularand environmental conditions. The transcript level of agene is directly affected by the binding of transcriptionalregulators to DNA motifs in its promoter sequence.Therefore, both expression levels of transcription factorsand other regulatory proteins as well as sequenceinformation in the promoters contribute to transcriptionalgene regulation. In this study, we describe a newcomputational strategy for learning gene regulatoryprograms from gene expression data based on theMEDUSA algorithm. We learn a model that predictsdifferential expression of target genes from the expressionlevels of regulators, the presence of DNA motifs inpromoter sequences, and binding data for transcriptionfactors. Unlike many previous approaches, we do notassume that genes are regulated in clusters, and we learnDNA motifs de novo from promoter sequences as anintegrated part of our algorithm. We use MEDUSA toproduce a global map of the yeast oxygen and hemeregulatory network. To demonstrate that MEDUSA canreveal detailed information about regulatory mechanisms,we perform biochemical experiments to confirm thepredicted regulators for an important hypoxia gene.
A Predictive Oxygen Network
PLoS Computational Biology | www.ploscompbiol.org 2 November 2008 | Volume 4 | Issue 11 | e1000224
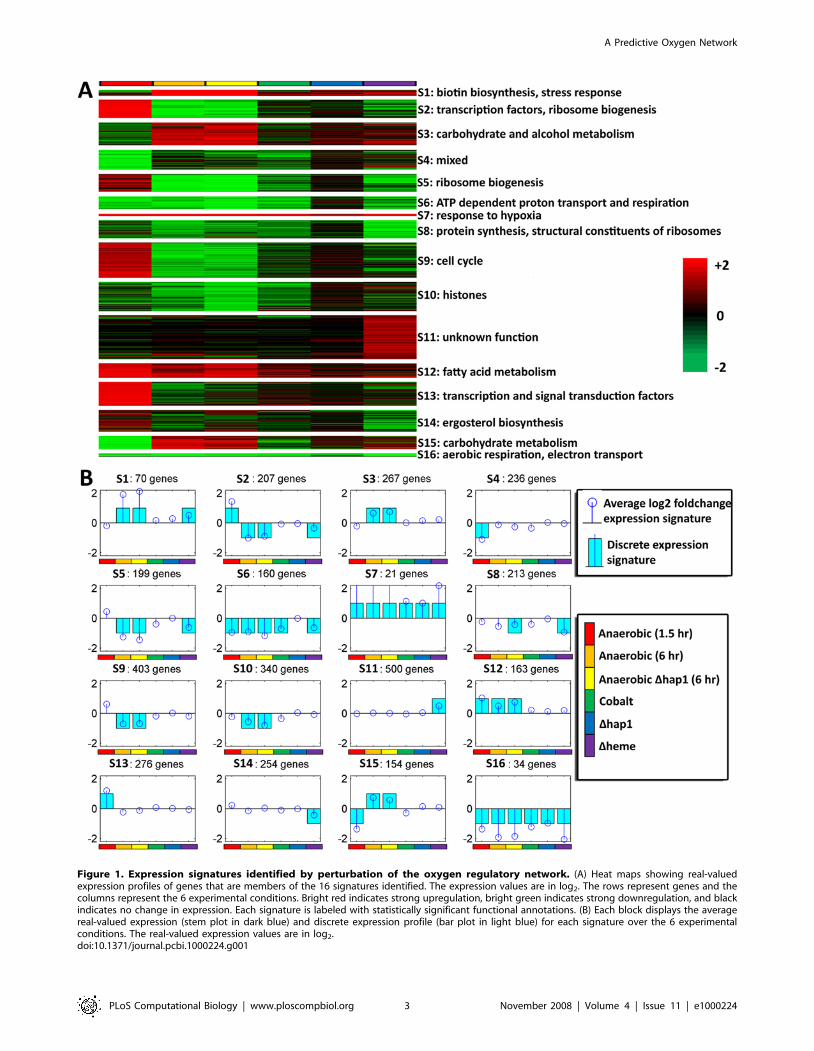
Figure 1. Expression signatures identified by perturbation of the oxygen regulatory network. (A) Heat maps showing real-valuedexpression profiles of genes that are members of the 16 signatures identified. The expression values are in log2. The rows represent genes and thecolumns represent the 6 experimental conditions. Bright red indicates strong upregulation, bright green indicates strong downregulation, and blackindicates no change in expression. Each signature is labeled with statistically significant functional annotations. (B) Each block displays the averagereal-valued expression (stem plot in dark blue) and discrete expression profile (bar plot in light blue) for each signature over the 6 experimentalconditions. The real-valued expression values are in log2.doi:10.1371/journal.pcbi.1000224.g001
A Predictive Oxygen Network
PLoS Computational Biology | www.ploscompbiol.org 3 November 2008 | Volume 4 | Issue 11 | e1000224
regulation in this case. Applying typical motif discovery algorithms
to broadly coexpressed gene sets also leads to problems (see results
below), since the gene ‘‘clusters’’ are in fact likely to be mixtures of
differently regulated gene sets. However, the strength of our
dataset is that it measures key perturbations related to oxygen and
heme regulation; it should contain rich information about the
commonalities and differences in regulation of the genes that
respond to these perturbations. Therefore, instead of using
coexpressed gene sets as independent inputs for subsequent
computational analysis, we used MEDUSA to learn a gene
regulatory program from the entirety of the perturbation data.
MEDUSA does not depend only on the correlation of the
mRNA level of regulators and targets to infer a regulatory
relationship. Instead, the algorithm requires that regulators control
their targets through the presence of shared sequence motifs in the
promoters of target genes, and it learns these motifs as it builds a
regulatory program. MEDUSA integrates a number of ideas that
have been used previously in computational modeling of
regulatory programs but also implements a conceptually different
approach. For example, like the module networks algorithm of
Segal et al. [22], we used the expression levels of a known set of
transcriptional regulators, which include both transcription factors
and signaling transducers, to learn a context-specific model of
regulation. However, while the module networks approach uses
only expression data, MEDUSA also incorporates promoter
sequence data to learn DNA motifs as part of the regulatory
program. As in recent work of Beer and Tavazoie [21], we wish to
predict expression from promoter sequences without reference to a
target gene’s identity. However, rather than predicting the cluster
membership of genes, our model predicts up and down regulation
of individual target genes, based on promoter sequence and
regulator expression, across multiple experimental conditions.
MEDUSA also differs from these previous studies and most
other work by implementing a number of key algorithmic features:
(1) it integrates promoter sequence, expression and ChIP-chip data
to predict a global regulatory program; (2) it avoids over-fitting
when training in a high dimensional feature space by use of a
machine learning technique called boosting; (3) it learns functional
contributions of both regulators and motifs; (4) it learns binding
site motifs directly from sequence without seeding the algorithm
with known motifs; (5) it automatically learns the threshold for
deciding the presence of motifs. We note that in our previous work
[40,41], we used boosting to learn regulatory models based on a
library of known motifs, while MEDUSA learns motifs de novo. In
an earlier work, Segal et al. [42] used a probabilistic relational
model framework to learn transcriptional modules, i.e., gene sets
whose shared expression patterns are supported by the shared
motifs in their promoter sequences. Unlike our approach, this
algorithm relies on assigning genes to static clusters and is seeded
with database motifs, though motifs are re-estimated over training
iterations. More recently, for the special case of time series
expression data, Ernst et al. [43] presented a probabilistic
approach that learns a temporally-organized hierarchical cluster-
ing of genes, where bifurcations of genes that go up or down at
specific time points are explained by shared motifs or ChIP chip
occupancy data. This algorithm uses static occupancy and
database motif data rather than learning motifs at the same time
as the regulation model.
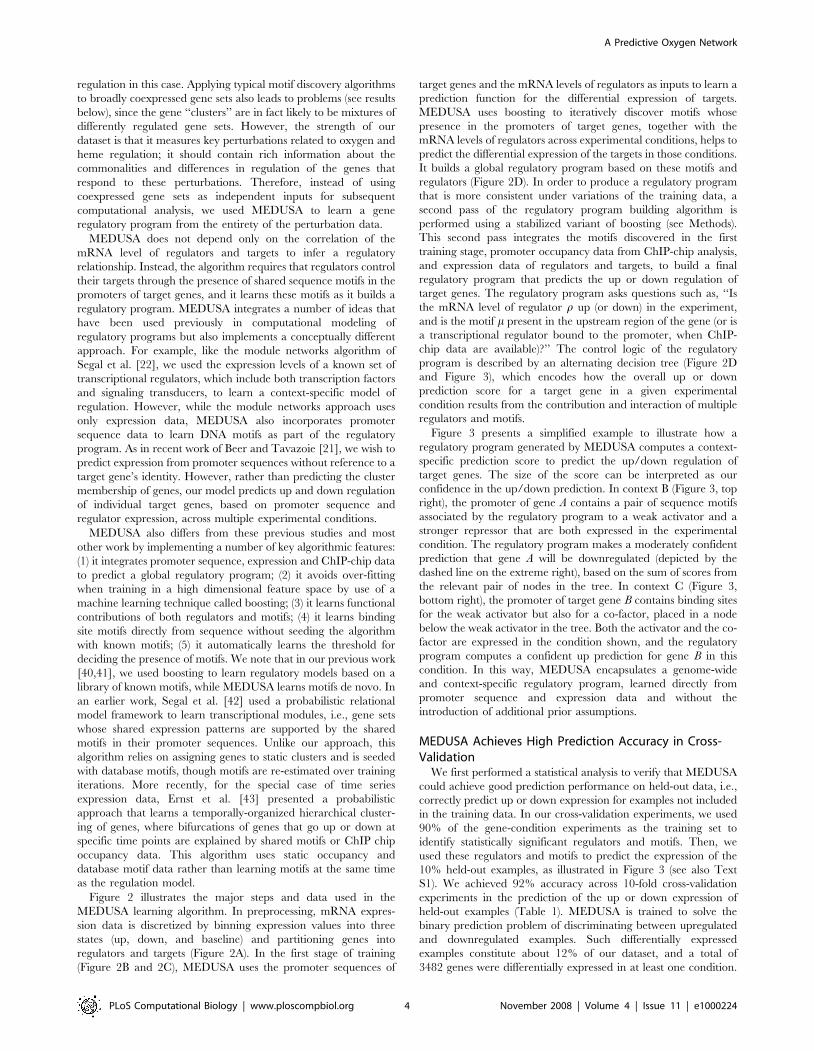
Figure 2 illustrates the major steps and data used in the
MEDUSA learning algorithm. In preprocessing, mRNA expres-
sion data is discretized by binning expression values into three
states (up, down, and baseline) and partitioning genes into
regulators and targets (Figure 2A). In the first stage of training
(Figure 2B and 2C), MEDUSA uses the promoter sequences of
target genes and the mRNA levels of regulators as inputs to learn a
prediction function for the differential expression of targets.
MEDUSA uses boosting to iteratively discover motifs whose
presence in the promoters of target genes, together with the
mRNA levels of regulators across experimental conditions, helps to
predict the differential expression of the targets in those conditions.
It builds a global regulatory program based on these motifs and
regulators (Figure 2D). In order to produce a regulatory program
that is more consistent under variations of the training data, a
second pass of the regulatory program building algorithm is
performed using a stabilized variant of boosting (see Methods).
This second pass integrates the motifs discovered in the first
training stage, promoter occupancy data from ChIP-chip analysis,
and expression data of regulators and targets, to build a final
regulatory program that predicts the up or down regulation of
target genes. The regulatory program asks questions such as, ‘‘Is
the mRNA level of regulator r up (or down) in the experiment,
and is the motif m present in the upstream region of the gene (or is
a transcriptional regulator bound to the promoter, when ChIP-
chip data are available)?’’ The control logic of the regulatory
program is described by an alternating decision tree (Figure 2D
and Figure 3), which encodes how the overall up or down
prediction score for a target gene in a given experimental
condition results from the contribution and interaction of multiple
regulators and motifs.
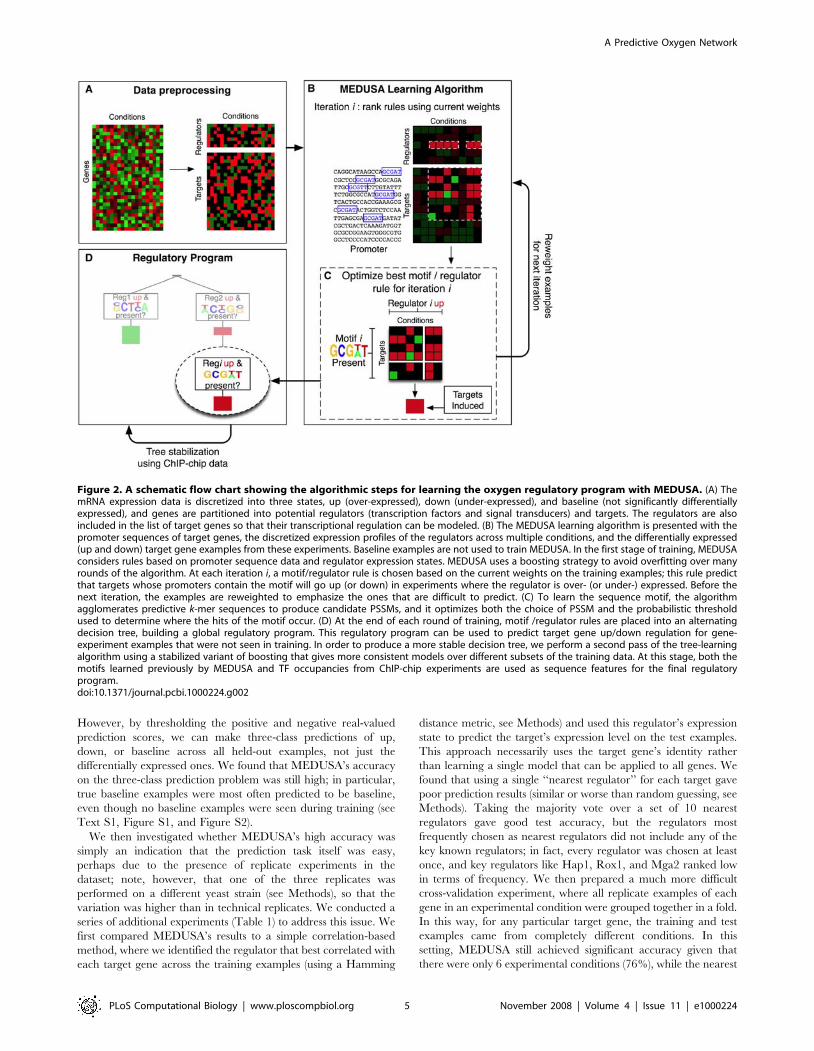
Figure 3 presents a simplified example to illustrate how a
regulatory program generated by MEDUSA computes a context-
specific prediction score to predict the up/down regulation of
target genes. The size of the score can be interpreted as our
confidence in the up/down prediction. In context B (Figure 3, top
right), the promoter of gene A contains a pair of sequence motifs
associated by the regulatory program to a weak activator and a
stronger repressor that are both expressed in the experimental
condition. The regulatory program makes a moderately confident
prediction that gene A will be downregulated (depicted by the
dashed line on the extreme right), based on the sum of scores from
the relevant pair of nodes in the tree. In context C (Figure 3,
bottom right), the promoter of target gene B contains binding sites
for the weak activator but also for a co-factor, placed in a node
below the weak activator in the tree. Both the activator and the co-
factor are expressed in the condition shown, and the regulatory
program computes a confident up prediction for gene B in this
condition. In this way, MEDUSA encapsulates a genome-wide
and context-specific regulatory program, learned directly from
promoter sequence and expression data and without the
introduction of additional prior assumptions.
MEDUSA Achieves High Prediction Accuracy in Cross-Validation
We first performed a statistical analysis to verify that MEDUSA
could achieve good prediction performance on held-out data, i.e.,
correctly predict up or down expression for examples not included
in the training data. In our cross-validation experiments, we used
90% of the gene-condition experiments as the training set to
identify statistically significant regulators and motifs. Then, we
used these regulators and motifs to predict the expression of the
10% held-out examples, as illustrated in Figure 3 (see also Text
S1). We achieved 92% accuracy across 10-fold cross-validation
experiments in the prediction of the up or down expression of
held-out examples (Table 1). MEDUSA is trained to solve the
binary prediction problem of discriminating between upregulated
and downregulated examples. Such differentially expressed
examples constitute about 12% of our dataset, and a total of
3482 genes were differentially expressed in at least one condition.
A Predictive Oxygen Network
PLoS Computational Biology | www.ploscompbiol.org 4 November 2008 | Volume 4 | Issue 11 | e1000224
However, by thresholding the positive and negative real-valued
prediction scores, we can make three-class predictions of up,
down, or baseline across all held-out examples, not just the
differentially expressed ones. We found that MEDUSA’s accuracy
on the three-class prediction problem was still high; in particular,
true baseline examples were most often predicted to be baseline,
even though no baseline examples were seen during training (see
Text S1, Figure S1, and Figure S2).
We then investigated whether MEDUSA’s high accuracy was
simply an indication that the prediction task itself was easy,
perhaps due to the presence of replicate experiments in the
dataset; note, however, that one of the three replicates was
performed on a different yeast strain (see Methods), so that the
variation was higher than in technical replicates. We conducted a
series of additional experiments (Table 1) to address this issue. We
first compared MEDUSA’s results to a simple correlation-based
method, where we identified the regulator that best correlated with
each target gene across the training examples (using a Hamming
distance metric, see Methods) and used this regulator’s expression
state to predict the target’s expression level on the test examples.
This approach necessarily uses the target gene’s identity rather
than learning a single model that can be applied to all genes. We
found that using a single ‘‘nearest regulator’’ for each target gave
poor prediction results (similar or worse than random guessing, see
Methods). Taking the majority vote over a set of 10 nearest
regulators gave good test accuracy, but the regulators most
frequently chosen as nearest regulators did not include any of the
key known regulators; in fact, every regulator was chosen at least
once, and key regulators like Hap1, Rox1, and Mga2 ranked low
in terms of frequency. We then prepared a much more difficult
cross-validation experiment, where all replicate examples of each
gene in an experimental condition were grouped together in a fold.
In this way, for any particular target gene, the training and test
examples came from completely different conditions. In this
setting, MEDUSA still achieved significant accuracy given that
there were only 6 experimental conditions (76%), while the nearest
Figure 2. A schematic flow chart showing the algorithmic steps for learning the oxygen regulatory program with MEDUSA. (A) ThemRNA expression data is discretized into three states, up (over-expressed), down (under-expressed), and baseline (not significantly differentiallyexpressed), and genes are partitioned into potential regulators (transcription factors and signal transducers) and targets. The regulators are alsoincluded in the list of target genes so that their transcriptional regulation can be modeled. (B) The MEDUSA learning algorithm is presented with thepromoter sequences of target genes, the discretized expression profiles of the regulators across multiple conditions, and the differentially expressed(up and down) target gene examples from these experiments. Baseline examples are not used to train MEDUSA. In the first stage of training, MEDUSAconsiders rules based on promoter sequence data and regulator expression states. MEDUSA uses a boosting strategy to avoid overfitting over manyrounds of the algorithm. At each iteration i, a motif/regulator rule is chosen based on the current weights on the training examples; this rule predictthat targets whose promoters contain the motif will go up (or down) in experiments where the regulator is over- (or under-) expressed. Before thenext iteration, the examples are reweighted to emphasize the ones that are difficult to predict. (C) To learn the sequence motif, the algorithmagglomerates predictive k-mer sequences to produce candidate PSSMs, and it optimizes both the choice of PSSM and the probabilistic thresholdused to determine where the hits of the motif occur. (D) At the end of each round of training, motif /regulator rules are placed into an alternatingdecision tree, building a global regulatory program. This regulatory program can be used to predict target gene up/down regulation for gene-experiment examples that were not seen in training. In order to produce a more stable decision tree, we perform a second pass of the tree-learningalgorithm using a stabilized variant of boosting that gives more consistent models over different subsets of the training data. At this stage, both themotifs learned previously by MEDUSA and TF occupancies from ChIP-chip experiments are used as sequence features for the final regulatoryprogram.doi:10.1371/journal.pcbi.1000224.g002
A Predictive Oxygen Network
PLoS Computational Biology | www.ploscompbiol.org 5 November 2008 | Volume 4 | Issue 11 | e1000224
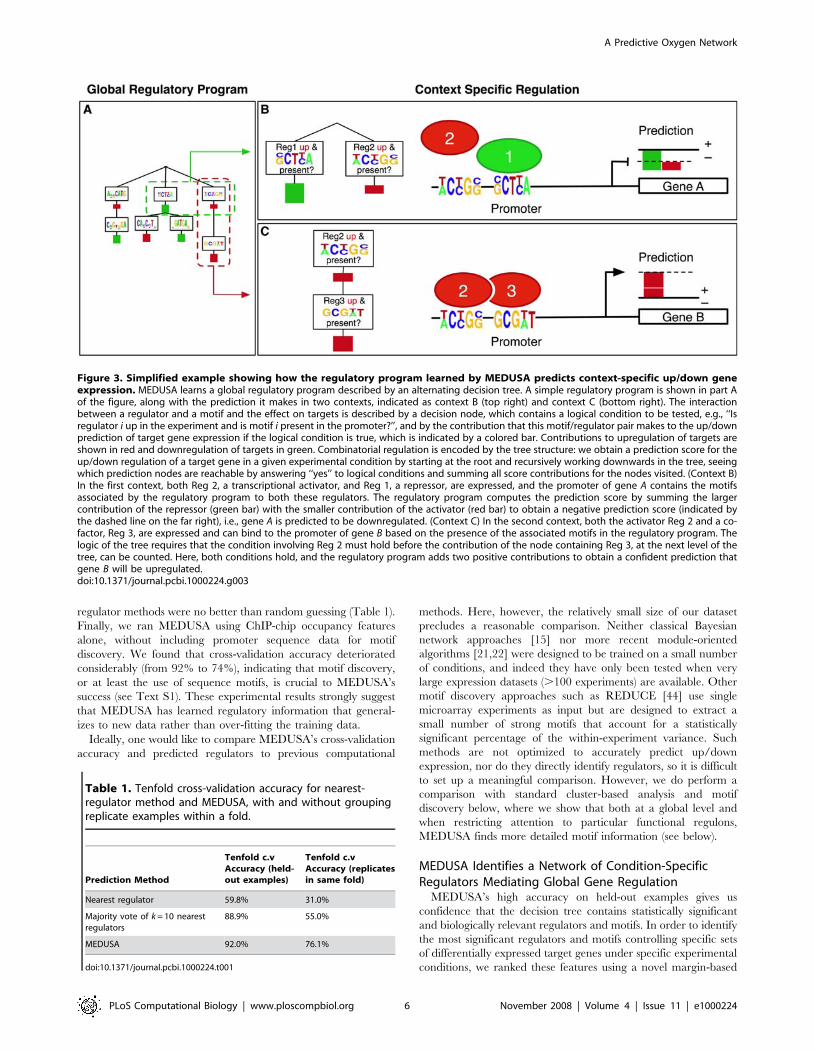
regulator methods were no better than random guessing (Table 1).
Finally, we ran MEDUSA using ChIP-chip occupancy features
alone, without including promoter sequence data for motif
discovery. We found that cross-validation accuracy deteriorated
considerably (from 92% to 74%), indicating that motif discovery,
or at least the use of sequence motifs, is crucial to MEDUSA’s
success (see Text S1). These experimental results strongly suggest
that MEDUSA has learned regulatory information that general-
izes to new data rather than over-fitting the training data.
Ideally, one would like to compare MEDUSA’s cross-validation
accuracy and predicted regulators to previous computational
methods. Here, however, the relatively small size of our dataset
precludes a reasonable comparison. Neither classical Bayesian
network approaches [15] nor more recent module-oriented
algorithms [21,22] were designed to be trained on a small number
of conditions, and indeed they have only been tested when very
large expression datasets (.100 experiments) are available. Other
motif discovery approaches such as REDUCE [44] use single
microarray experiments as input but are designed to extract a
small number of strong motifs that account for a statistically
significant percentage of the within-experiment variance. Such
methods are not optimized to accurately predict up/down
expression, nor do they directly identify regulators, so it is difficult
to set up a meaningful comparison. However, we do perform a
comparison with standard cluster-based analysis and motif
discovery below, where we show that both at a global level and
when restricting attention to particular functional regulons,
MEDUSA finds more detailed motif information (see below).
MEDUSA Identifies a Network of Condition-SpecificRegulators Mediating Global Gene Regulation
MEDUSA’s high accuracy on held-out examples gives us
confidence that the decision tree contains statistically significant
and biologically relevant regulators and motifs. In order to identify
the most significant regulators and motifs controlling specific sets
of differentially expressed target genes under specific experimental
conditions, we ranked these features using a novel margin-based
Figure 3. Simplified example showing how the regulatory program learned by MEDUSA predicts context-specific up/down geneexpression. MEDUSA learns a global regulatory program described by an alternating decision tree. A simple regulatory program is shown in part Aof the figure, along with the prediction it makes in two contexts, indicated as context B (top right) and context C (bottom right). The interactionbetween a regulator and a motif and the effect on targets is described by a decision node, which contains a logical condition to be tested, e.g., ‘‘Isregulator i up in the experiment and is motif i present in the promoter?’’, and by the contribution that this motif/regulator pair makes to the up/downprediction of target gene expression if the logical condition is true, which is indicated by a colored bar. Contributions to upregulation of targets areshown in red and downregulation of targets in green. Combinatorial regulation is encoded by the tree structure: we obtain a prediction score for theup/down regulation of a target gene in a given experimental condition by starting at the root and recursively working downwards in the tree, seeingwhich prediction nodes are reachable by answering ‘‘yes’’ to logical conditions and summing all score contributions for the nodes visited. (Context B)In the first context, both Reg 2, a transcriptional activator, and Reg 1, a repressor, are expressed, and the promoter of gene A contains the motifsassociated by the regulatory program to both these regulators. The regulatory program computes the prediction score by summing the largercontribution of the repressor (green bar) with the smaller contribution of the activator (red bar) to obtain a negative prediction score (indicated bythe dashed line on the far right), i.e., gene A is predicted to be downregulated. (Context C) In the second context, both the activator Reg 2 and a co-factor, Reg 3, are expressed and can bind to the promoter of gene B based on the presence of the associated motifs in the regulatory program. Thelogic of the tree requires that the condition involving Reg 2 must hold before the contribution of the node containing Reg 3, at the next level of thetree, can be counted. Here, both conditions hold, and the regulatory program adds two positive contributions to obtain a confident prediction thatgene B will be upregulated.doi:10.1371/journal.pcbi.1000224.g003
Table 1. Tenfold cross-validation accuracy for nearest-regulator method and MEDUSA, with and without groupingreplicate examples within a fold.
Prediction Method
Tenfold c.vAccuracy (held-out examples)
Tenfold c.vAccuracy (replicatesin same fold)
Nearest regulator 59.8% 31.0%
Majority vote of k = 10 nearestregulators
88.9% 55.0%
MEDUSA 92.0% 76.1%
doi:10.1371/journal.pcbi.1000224.t001
A Predictive Oxygen Network
PLoS Computational Biology | www.ploscompbiol.org 6 November 2008 | Volume 4 | Issue 11 | e1000224
score (see Methods). The score assesses how significantly an
individual feature contributes to the confidence of predictions over
the specific set of target genes and experiments.
We first used margin scoring to identify statistically significant
regulators that may mediate the regulation of various target genes
in the dataset. Figure 4 provides an example of the condition-
specific regulators and motifs identified by MEDUSA. To clarify
the roles of Hap1 and heme in oxygen regulation, we identified
and compared the potential regulators (Figure 4A) and motifs
(Figure 4B) that may mediate the regulation of hypoxically
suppressed (oxygen-induced) genes in wild type HAP1 or Dhap1
cells, and heme-induced (heme deficiency-suppressed) genes. Note
that intracellular heme levels are low under hypoxic growth
conditions [45], so hypoxically suppressed (oxygen-induced) genes
correlate with heme deficiency-suppressed (heme-induced) genes.
The expression levels of identified regulators and target genes are
indicated in Figure 4C and 4D, respectively.
MEDUSA analysis identified a number of known regulators
whose predicted condition-specific role is consistent with previous
knowledge of oxygen and heme regulation. For example,
consistent with existing knowledge [33,34,46], Hap1 is important
for the regulation of oxygen-induced genes in cells bearing the
Hap1 expression plasmid and for heme induction of target genes
(see Figure 4A and 4C). Likewise, Hap4 is important for heme
induction and for the regulation of oxygen-induced genes in both
cells bearing the Hap1 expression plasmid (HAP1) and the empty
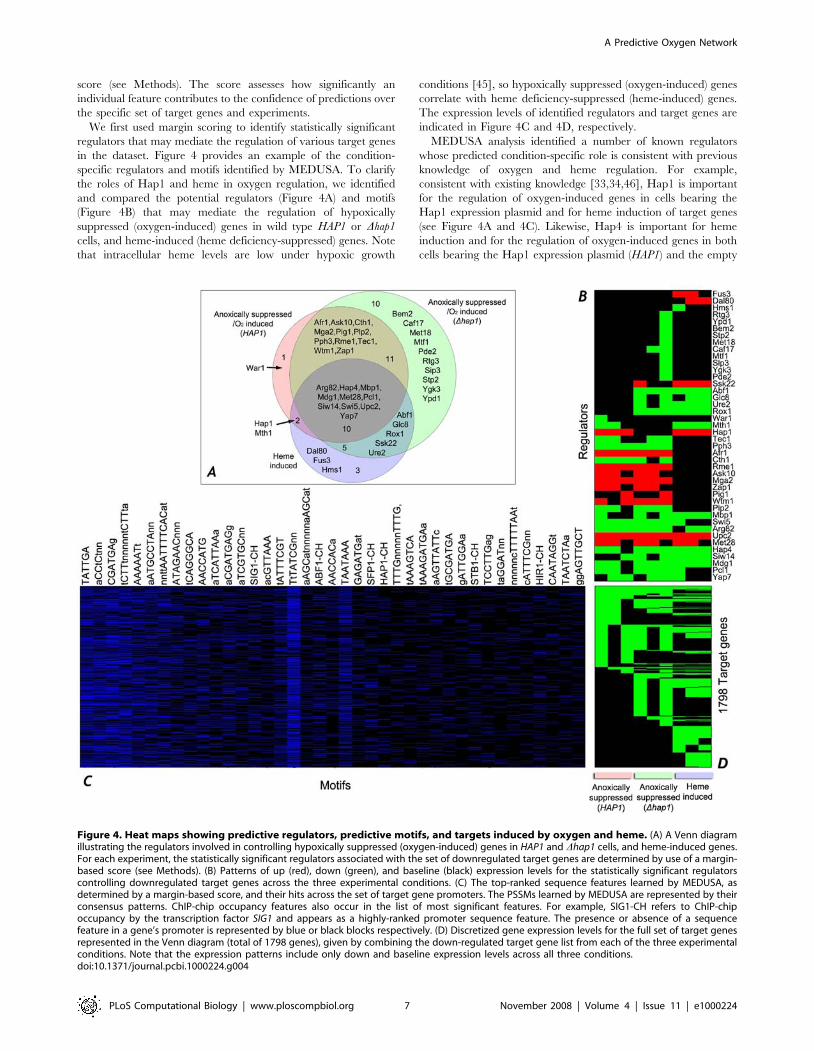
Figure 4. Heat maps showing predictive regulators, predictive motifs, and targets induced by oxygen and heme. (A) A Venn diagramillustrating the regulators involved in controlling hypoxically suppressed (oxygen-induced) genes in HAP1 and Dhap1 cells, and heme-induced genes.For each experiment, the statistically significant regulators associated with the set of downregulated target genes are determined by use of a margin-based score (see Methods). (B) Patterns of up (red), down (green), and baseline (black) expression levels for the statistically significant regulatorscontrolling downregulated target genes across the three experimental conditions. (C) The top-ranked sequence features learned by MEDUSA, asdetermined by a margin-based score, and their hits across the set of target gene promoters. The PSSMs learned by MEDUSA are represented by theirconsensus patterns. ChIP-chip occupancy features also occur in the list of most significant features. For example, SIG1-CH refers to ChIP-chipoccupancy by the transcription factor SIG1 and appears as a highly-ranked promoter sequence feature. The presence or absence of a sequencefeature in a gene’s promoter is represented by blue or black blocks respectively. (D) Discretized gene expression levels for the full set of target genesrepresented in the Venn diagram (total of 1798 genes), given by combining the down-regulated target gene list from each of the three experimentalconditions. Note that the expression patterns include only down and baseline expression levels across all three conditions.doi:10.1371/journal.pcbi.1000224.g004
A Predictive Oxygen Network
PLoS Computational Biology | www.ploscompbiol.org 7 November 2008 | Volume 4 | Issue 11 | e1000224

vector (Dhap1, Figure 4A and 4C). Rox1 appears to be important
for the regulation of oxygen-induced genes only in Dhap1 cells.
This is not surprising because Rox1 expression is known to be
under the control of Hap1 [33,34]. In cells bearing the Hap1
expression plasmid (HAP1), Hap1 would be the dominant
regulator. Another notable case is Mga2, which has been shown
to be important for oxygen regulation of certain genes, such as
OLE1 [31,47]. Here we found that it is indeed important for
oxygen induction of genes in both cells bearing the Hap1
expression plasmid (HAP1) and the empty vector, but it is not
important for heme regulation, as expected.
We also identified and compared statistically significant
regulators that may mediate the regulation of hypoxically induced
genes in cells bearing the Hap1 expression plasmid (HAP1) and the
empty vector (Dhap1) and those that mediate heme deficiency-
induced (heme-suppressed) genes (Figure 5A and Figure S3).
Likewise, we identified and compared regulators that may mediate
the regulation of Co2+-inducible genes with those mediating the
regulation of hypoxically induced genes (Figure 5B and Figure S4).
The comparison of these regulators mediating oxygen regulation,
heme regulation, and Co2+-inducible regulation provides several
important insights into the regulatory network mediating oxygen
sensing and regulation. First, more than half of the MEDUSA-
identified regulators mediating heme regulation may also be
involved in mediating oxygen regulation both in HAP1 cells (12
out of 20 regulators) and in Dhap1 cells (15 out of 20 regulators)
(Figure 4A). Many regulators predicted to be involved in heme
suppression of target genes may also be involved in oxygen
induction in wild type HAP1 cells (13 out of 18) and in Dhap1 cells
(11 out of 18) (Figure 5A). These results are consistent with the
previous idea that heme serves as a secondary messenger of oxygen
and plays a major role in mediating oxygen regulation of target
genes. Second, Hap1 plays a major role in oxygen regulation. In
the absence of Hap1, the number of regulators mediating oxygen
regulation may be significantly increased both for oxygen-induced
genes (Figure 4A) and hypoxically induced genes (Figure 5A).
Third, relatively few regulators may be involved in mediating
the regulation of hypoxically induced and Co2+-inducible genes
Figure 5. Venn diagrams showing the statistically significant, high ranking regulators mediating the regulation of oxygen-regulated, heme-regulated, and Co2+-inducible genes in HAP1 and Dhap1 cells. (A) A Venn diagram illustrating the regulators involved incontrolling hypoxically induced (oxygen-suppressed) genes in HAP1 and Dhap1 cells, and heme-suppressed genes. (B) A Venn diagram illustrating theregulators involved in controlling hypoxically induced (oxygen-suppressed) genes in HAP1 and Dhap1 cells, and Co2+-inducible genes. (C) A Venndiagram illustrating the regulators involved in controlling hypoxically induced (oxygen-suppressed) genes in HAP1 cells at 1.5 or 6 hours after shiftingto anaerobic growth conditions. (D) A Venn diagram illustrating the regulators involved in controlling hypoxically suppressed (oxygen-induced)genes in HAP1 cells at 1.5 or 6 hours after shifting to anaerobic growth conditions.doi:10.1371/journal.pcbi.1000224.g005
A Predictive Oxygen Network
PLoS Computational Biology | www.ploscompbiol.org 8 November 2008 | Volume 4 | Issue 11 | e1000224
(Figure 5B). These results suggest that the Co2+-inducible oxygen
regulatory pathway plays only a minor role in mediating oxygen
sensing and regulation.
MEDUSA identified the regulators that may mediate the
regulation of oxygen-regulated genes that were affected at the
early stage (1.5 hours) of anaerobic growth (Figure 5C and 5D) in
cells bearing the Hap1 expression plasmid (HAP1), finding some
regulators common to both time points and some specific to early
or late stages. The results from analysis of both target genes (Figure
S7) and regulators (Figure 5C and 5D and Figure S5) suggest that
there was a significant switch in the regulatory and expression
programs in the cells as anaerobic condition prolonged.
To display the statistical importance of various regulators in the
global oxygen and heme regulatory network, we summarized our
results by using a global regulatory map (Figure 6). Figure 6
illustrates the significance of the regulators for predicting the up or
down regulation of target genes under the tested six different
experimental conditions, ranked by margin score. Several previously
characterized regulators that are known to be important for oxygen
and/or heme regulation, including Upc2, Rox1, Mga2, Hap4, and
Hap1 [2,27,31–34,46–51], ranked highly in this global regulatory
map. Among the most significant regulators, six were previously
known to be important for hypoxia response or oxygen regulation
(Figure 6). Seven regulators known to be involved in cell cycle were
identified by MEDUSA in this network. Intriguingly, six regulators
known to be involved in pheromone response were identified
(Figure 6). Likewise, several regulators known to regulate osmotic,
salt and pseudohyphal growth were also identified. These results
suggest that oxygen and heme regulation may share many regulators
with pheromone and other signaling pathways. However, the
regulators that are involved in general stress responses, such as Msn2,
Msn4, and Hsf1 [52–55], were not identified by MEDUSA as
significant regulators.
Figure 6 includes a total of 54 regulators identified by margin
score for up/down regulated gene sets. We quantified the
statistical significance of these regulators by computing an
empirical null distribution for the margin score and then
estimating p-values for each regulator/gene set (see Figure S10
and Figure S11 for details). We then used a Benjamini-Hochberg
procedure [56] to estimate the false discovery rate (FDR)
associated with various p-value thresholds (Figure S12). We find
that if we set the p-value threshold so that all 54 regulators satisfy
the significance threshold for at least one gene set, then our
estimated FDR is less than .04.
Experimental Data Measuring the OLE1 Promoter ActivityConfirms Novel MEDUSA Regulators
To experimentally test specific regulators identified by using
MEDUSA, we examined the OLE1 promoter, because this promoter
has been well characterized previously [31,39,57]. The full-length
OLE1 promoter-lacZ reporter activity is strongly induced by hypoxia
[39]. By applying margin-based scoring to a set of previously
identified OLE1-like genes [31,39,57], we extracted significant
OLE1-specific motifs and regulators under hypoxia. Among the
significant motifs, we found LORE (low oxygen response element),
which has been experimentally determined [39] and is known to be
the Mga2 binding site [31], as well as the binding sites for Hap1 and
Aft1/2, which are also known to bind OLE1 [58].
We then used margin-based scoring for regulators to identify
Mdg1, Met28, Upc2, Pig1 and Rme1 as potential regulators for
the OLE1 promoter. Only Upc2 was previously known to be
involved in oxygen regulation. The expression of all these
regulators but Mdg1 was upregulated by hypoxia. Note that the
MEDUSA model does not assert that these regulators directly bind
the OLE1 promoter but does predict that they regulate OLE1
expression, perhaps through indirect interactions. Conceptually,
the margin score for a regulator is similar to ‘‘knocking out’’ the
regulator from the regulatory program and computing whether
the effect is predicted to be significant for specific targets and
conditions (see Methods). This connection suggests a direct
approach for validation of these regulators using the correspond-
ing deletion mutants. Namely, to determine the effects of these
regulators on the OLE1 promoter-lacZ reporter activity, we
measured b-galactosidase activities in wild type and mutant cells
with one of the regulator genes deleted (Figure 7). Except for
Dmdg1 cells, the reporter activity in the hypoxic mutant cells were
all reduced, compared to that in wild type cells (Figure 7). Because
hypoxia suppressed Mdg1 expression, indicating its negative role
in OLE1 induction, it is conceivable that its deletion would not
affect the reporter activity in hypoxic cells. In contrast, because
hypoxia induced the expression of other regulators, indicating
their positive role in OLE1 induction, their deletion would cause
the reporter activity to decrease in hypoxic cells. Deletion of
MET28, UPC2, and PIG1 also significantly reduced the fold
induction of the OLE1 reporter activity by hypoxia (Figure 7).
These experimental results strongly support the power of the
MEDUSA analysis to predict regulators for specific targets.
MEDUSA Reveals More Detailed Regulatory InformationThan Standard Computational Analysis
We further analyzed whether MEDUSA could correctly extract
regulatory information about a known functional regulon, and we
compared the results of MEDUSA analysis with AlignACE [59,60],
a standard motif algorithm. We then did a global comparison of
transcription factor binding motifs attributed by MEDUSA and
AlignACE to the 16 expression signatures in our dataset.
The functional regulon we examined was signature 16, one of the
smaller expression patterns consisting of a set of 34 HAP1-dependent
genes that are strongly suppressed in all conditions including the
Dhap1 experiment. These genes (such as the COX and QCR genes)
are involved in aerobic respiratory processes (1e-14), electron
transport (4.37e-14) and heme-dependent oxidoreducatase activity
(5.77e-14). Starting with the global MEDUSA regulatory program,
we extracted all sequence motifs and regulators with positive margin
score for this set of genes and further ranked them based on the
number of target genes they were predicted to regulate.
We first considered transcription factors that were high ranking
by both regulator and motif criteria. Namely, they were high
scoring regulators based on their mRNA expression states and
their binding site motifs were discovered by MEDUSA and ranked
as significant and frequent for the 34 genes in the signature. This
set of transcriptional regulators consisted of Hap1, Mot3, Ace2,
Mac1, Msn2, Ste12, Gcn4, Pho4 and Hap2/3/4. MEDUSA also
ranks the Hap1 and Hap4 ChIP-chip occupancy profiles as highly
significant features for these genes. By examining the literature, we
found support for many of these transcription factors regulating at
least several of the target genes in this set. For example, CYC1,
CYC7 and CYT1 are known to be directly regulated by Hap1 [61].
Hap2/3/4 is known to directly affect expression of COX4, COX5,
COX6, CYC1 and CYT1 [61]. Mot3 is known to directly regulate
CYC1 expression [62]. FRE1 and CTR3 are known to be regulated
by Mac1 [61,63]. Upc2 and Mga2 are also important hypoxia
regulators, and MEDUSA identified their binding sites as high
scoring motifs for smaller subsets of genes within the signature.
MEDUSA also identifies Abf1 as a significant regulator through its
mRNA expression, but the sequence motif corresponding to the
Abf1 binding site and the Abf1 ChIP-chip data have low margin
scores. Some of the COX genes are known to be regulated by Abf1
A Predictive Oxygen Network
PLoS Computational Biology | www.ploscompbiol.org 9 November 2008 | Volume 4 | Issue 11 | e1000224
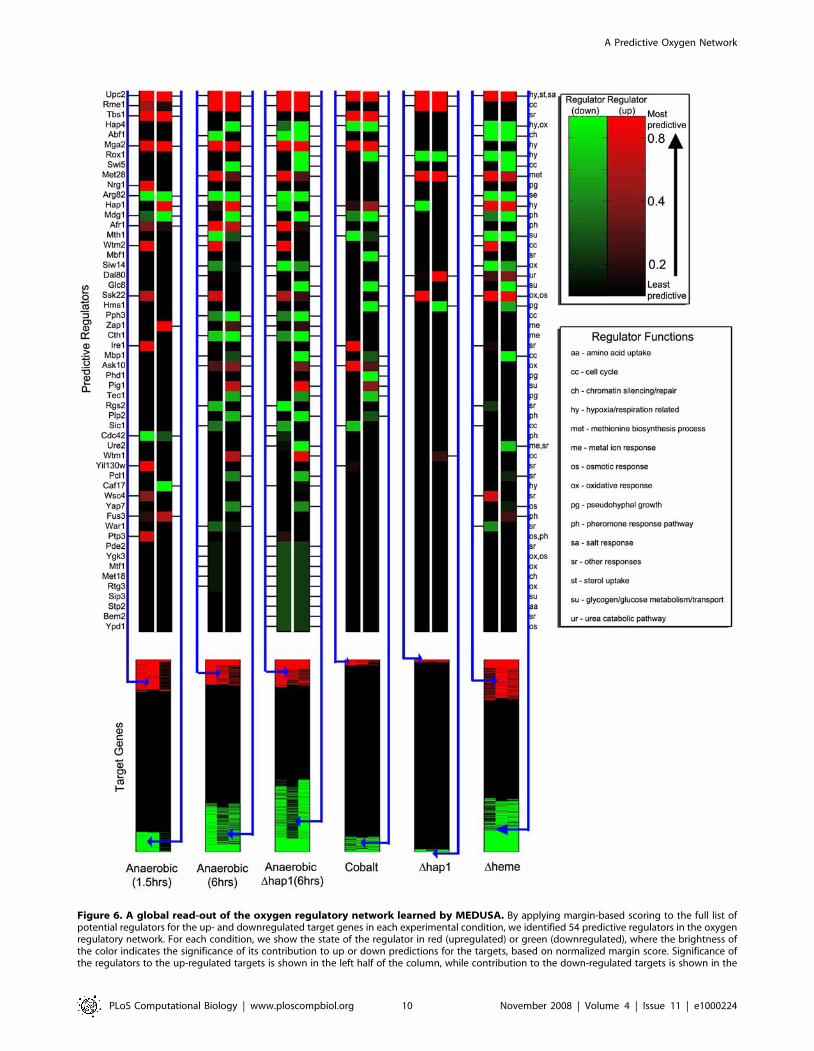
Figure 6. A global read-out of the oxygen regulatory network learned by MEDUSA. By applying margin-based scoring to the full list ofpotential regulators for the up- and downregulated target genes in each experimental condition, we identified 54 predictive regulators in the oxygenregulatory network. For each condition, we show the state of the regulator in red (upregulated) or green (downregulated), where the brightness ofthe color indicates the significance of its contribution to up or down predictions for the targets, based on normalized margin score. Significance ofthe regulators to the up-regulated targets is shown in the left half of the column, while contribution to the down-regulated targets is shown in the
A Predictive Oxygen Network
PLoS Computational Biology | www.ploscompbiol.org 10 November 2008 | Volume 4 | Issue 11 | e1000224
in other conditions [61], and the Abf1 binding site is present in
several of the genes. In this case, our MEDUSA analysis suggests
mixed evidence for Abf1 as a transcriptional regulator of the regulon,
and it is possible that under hypoxia other regulators dominate.
As a comparison, we also used AlignACE to find overrepresented
sequence motifs in the promoter regions of this gene set. Since the
signature is small and represents a true functional regulon, it provides
an ideal case for traditional motif discovery algorithms. Using the
motif discovery program in the most permissive way (that is, without
enforcing any significance threshold on the motifs), AlignACE was
only able to find significant hits for the binding sites of Cha4, Hap1,
Ace2 and Gcn4. For Hap2/3/4, the MAP score (3.4) had very low
statistical significance, even though the motif is very abundant in this
gene set (46.1%) and is known to regulate most of these genes [61].
Also, AlignACE was not able to identify more subtle context-specific
regulators such as Mot3, Mac1, and Mga2, which are known to
regulate these genes.
Figure 8 shows a comprehensive comparison of MEDUSA to
AlignACE motif discovery results across all 16 signatures. We used
AlignACE with default settings on 1000 base pair promoter
sequences of genes belonging to each signature and used AlignACE’s
maximum a posteriori (MAP) scores to rank their statistical
significance. We also defined the abundance score for each motif
as the fraction of promoters that were found to have the motif.
Similarly, we used margin scoring to identify significant MEDUSA
motifs for each of the signatures, reporting only those motifs with a
positive margin score. For MEDUSA, we defined the abundance
score for a motif as the fraction of promoters in the signature set that
were found to have the motif based on the tree structure of the
learned model. In order to compare the two methods, we report in
Figure 8 only those motifs that matched known transcription factor
binding sites PSSMs in TRANSFAC, SCPD or YPD (using
Kullback-Leibler divergence to compare motifs [8]) or matched
consensus sequences found by MacIsaac et al. [64]. (A separate
comparison of MEDUSA motifs to MacIsaac et al. motifs alone
appears in Figure S9.) If multiple motifs were found to be strong
matches to the same known binding site, we reported the one with
the highest statistical score. In total, we matched 111 motifs found by
either or both methods to known binding sites, and we sorted these
motifs into 3 categories based on the difference between the
cumulative margin score and cumulative MAP score across all the
signatures. The first set consists of 67 motifs identified by MEDUSA
but not by AlignACE; the second set consists of 22 motifs that are
identified by both MEDUSA and AlignACE; and the third set
consists of 22 motifs that are identified by AlignACE but not
MEDUSA. In Figure 8, the motifs highlighted in red are binding
sites of transcription factors known to play a key role in hypoxia-
related conditions. MEDUSA is able to identify a number important
hypoxia-related transcription factor binding sites, including Hap1
(CGGnnTAnCGG), Hap2/3/4 (CCAAT), Mga2 (ACTCAACAA),
Upc2/Ecm22 (TCGTATA), Ace2 (TGCTGGT), Mot3
(TTGCCT), Mac1 (TGCGCAAA), Aft2 (RVACCCTD), Msn2/4
(AAGGGGc), Rox1 (AAAGACAAAAAA) and Abf1
(RTCRnnnnnACG). Among these, AlignACE is able to identify
Rox1, Msn4 and Abf1, and it finds the Hap1 and Hap2/3/4 binding
sites only for a single signature (signature 16). Moreover, none of the
motifs exclusively identified by AlignACE are known to have any
role in the hypoxia-related conditions. In particular, the top scoring
AlignACE motif is a low complexity motif (AAAAAAAA) that
matches the Azf1 binding site. These results show that MEDUSA
outperforms AlignACE in finding relevant sequence motifs for our
dataset.
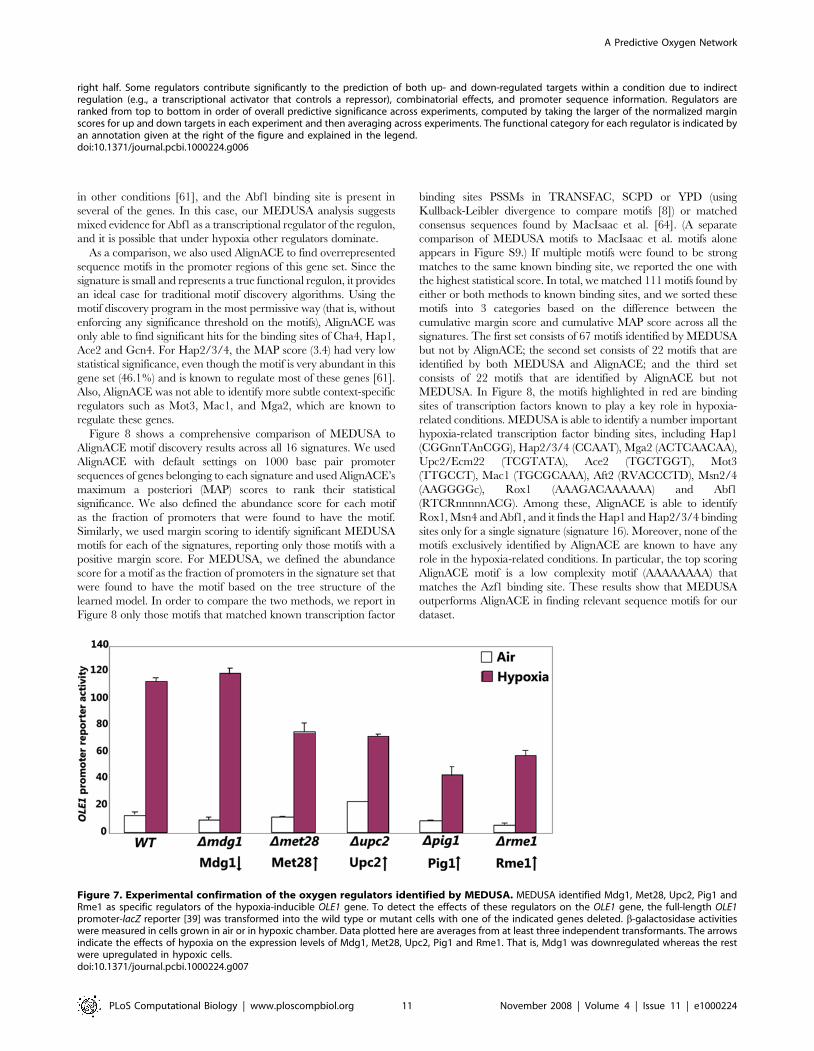
Figure 7. Experimental confirmation of the oxygen regulators identified by MEDUSA. MEDUSA identified Mdg1, Met28, Upc2, Pig1 andRme1 as specific regulators of the hypoxia-inducible OLE1 gene. To detect the effects of these regulators on the OLE1 gene, the full-length OLE1promoter-lacZ reporter [39] was transformed into the wild type or mutant cells with one of the indicated genes deleted. b-galactosidase activitieswere measured in cells grown in air or in hypoxic chamber. Data plotted here are averages from at least three independent transformants. The arrowsindicate the effects of hypoxia on the expression levels of Mdg1, Met28, Upc2, Pig1 and Rme1. That is, Mdg1 was downregulated whereas the restwere upregulated in hypoxic cells.doi:10.1371/journal.pcbi.1000224.g007
right half. Some regulators contribute significantly to the prediction of both up- and down-regulated targets within a condition due to indirectregulation (e.g., a transcriptional activator that controls a repressor), combinatorial effects, and promoter sequence information. Regulators areranked from top to bottom in order of overall predictive significance across experiments, computed by taking the larger of the normalized marginscores for up and down targets in each experiment and then averaging across experiments. The functional category for each regulator is indicated byan annotation given at the right of the figure and explained in the legend.doi:10.1371/journal.pcbi.1000224.g006
A Predictive Oxygen Network
PLoS Computational Biology | www.ploscompbiol.org 11 November 2008 | Volume 4 | Issue 11 | e1000224

Figure 8. Comparison of significance and abundance of motifs learned by MEDUSA and AlignACE for the 16 expression signaturesidentified in the dataset. Each row in the table represents a motif found by MEDUSA only (top section), by both MEDUSA and AlignACE (middlesection), or by AlignACE only (bottom section). The first column describes the motif by the name of the corresponding transcription factor followedby the consensus motif sequence. Some transcription factor names are followed by ‘ChIP’, indicating that these are significant ChIP-chip occupancy
A Predictive Oxygen Network
PLoS Computational Biology | www.ploscompbiol.org 12 November 2008 | Volume 4 | Issue 11 | e1000224
Discussion
In this study, we applied a novel machine learning algorithm to
learn regulatory programs underlying oxygen regulation and heme
regulation. This algorithm uses experimental data, including
microarray gene expression data, promoter sequence, and ChIP-
chip data, without introducing prior assumptions such as
presuming a cluster structure in gene expression data. The results
from our analysis show that the MEDUSA algorithm can provide
important, unbiased information about global regulatory pro-
grams. MEDUSA identifies many DNA sequence motifs impor-
tant for oxygen and heme regulation (Figure 8). Further,
experimental data from measuring OLE1 promoter activity
confirms the specific predictions made by MEDUSA (Figure 7).
Finally, a comprehensive comparison with a traditional ‘‘cluster-
first’’ motif discovery approach demonstrated that MEDUSA is
more successful at identifying binding site motifs relevant to
oxygen regulation (Figure 8).
MEDUSA identifies many regulators previously known to be
involved in this system. For example, MEDUSA identifies Upc2,
Mga2, and Hap1 [2,32,33,37,46,48,65] as important regulators in
oxygen regulation (Figure 5). Further, MEDUSA predicts many
new regulators of oxygen and heme regulation, such as Pph3,
Bem2, and Pcl1. In support of the regulatory network identified by
MEDUSA, several identified regulators are known to interact with
each other. For example, Mbp1 and Ure2 are known to coexist in
one complex, and the MAP kinase kinase kinase Ssk22 acts
upstream of Mbp1. Pph3 and Bem2 are known to coexist in one
complex, and both likely mediate the regulation of both
hypoxically induced genes and oxygen-induced genes in Dhap1
cells (Figures 4A, 5A, and 6). Wtm1 and Afr1, which are known to
coexist in one complex, act in concert to promote oxygen
regulation in wild type HAP1 cells (Figures 4A and 6). Likewise,
Ire1, which acts upstream of Rgs2, may act with Rgs2 to mediate
the regulation of heme-suppressed genes (Figures 5A and 6).
The purpose of achieving high prediction accuracy on the test
data is to confirm that the identified regulators are statistically
important predictors for the regulation of target genes. The number
of significant regulators identified by MEDUSA is much smaller
than the number of regulators whose expression is changed in a
specific experiment. For example, in cells bearing the Hap1
expression plasmid (HAP1), we identified 18 significant regulators
that may mediate the regulation of the oxygen-induced genes
(Figure 4A), out of 98 regulators whose mRNA levels were
significantly altered in the experiment. This dramatic filtering is
achieved by three aspects of our computational approach. First, we
require that regulators control their putative targets through shared
motifs in the promoter sequences. Second, we train on examples
from multiple experimental conditions. If a regulator cannot be
associated with a binding site motif through which it contributes to
target gene regulation in a consistent way across multiple conditions,
it will not be selected by the algorithm. Finally, we use a novel
margin-based score to identify the most significant regulators for
specific conditional and gene sets. This filtering represents an
important improvement over simply correlating expression levels of
regulators with those of target genes.
It is important to note that the MEDUSA analysis did not identify
the regulators that mediate stress responses, such as Msn2, Msn4,
Tpk1, Usv1, Yap1, and Hsf1 [22,52–55,66,67], although motifs for
some of these regulators are identified in the promoters of target
genes. In some aspects, anaerobic and heme-deficient conditions
exhibit certain characteristics of stress responses. As such, certain
genes induced by stress, such as genes involved in ribosome synthesis,
were induced by anaerobic and heme-deficient conditions (see
Figure S8). However, the regulatory network mediating oxygen and
heme regulation is clearly different from the general stress response
network. The most significant regulators in the oxygen and heme
regulatory network are not those involved in general stress responses.
Interestingly, however, this oxygen and heme regulatory network
shares many regulators with other signaling pathways, such as
pheromone signaling and osmotic responses.
Our analyses suggest a remarkable flexibility of the oxygen and
heme regulatory network. For example, in the absence of Hap1,
certain new regulators, such as Glc8 and Mbp1 and Ure2, along
with some of the regulators acting in wild type HAP1 cells, appear
to be recruited to mediate oxygen regulation to substitute Hap1
(Figure 6). Another feature of the oxygen and heme regulation
network is its complexity. Although several previously known
oxygen and heme regulators, including Hap1 and Mga2 [32,46],
are confirmed to be important in oxygen and heme regulation by
our analysis, many other regulators appear to play important roles
in global oxygen and heme regulation. Through biochemical
validation of the predicted regulators for the OLE1 promoter, we
have taken the first step in confirming the novel components of the
oxygen regulatory network as predicted by MEDUSA. While
much experimental work remains to be done, we are encouraged
by MEDUSA’s success in generating condition- and target-specific
hypotheses that we were able to validate experimentally.
MEDUSA’s ‘‘cluster-free’’ approach has the advantage that it
can still be effective for small expression datasets, where clustering
may only generate large and functionally heterogeneous gene sets.
Moreover, clustering and most ‘‘module’’ learning approaches rely
on the static assignment of genes to clusters across all experiments
in a dataset, which may oversimplify coregulation relationships
between genes. MEDUSA models condition-specific regulation in
a more flexible way that avoids the cluster assumption. However,
methods that produce sets of clusters or modules are more familiar
and easier to visualize than MEDUSA’s gene regulatory programs,
and MEDUSA analysis requires an interpretation step to reveal
detailed information for specific conditions or sets of genes. In the
present work, we used margin scoring to extract significant
regulators for the set of induced/suppressed target genes in each
condition and significant motifs associated with genes belonging to
expression signatures. This analysis gave a convenient summari-
zation of our results, but more general kinds of statistical post-
processing are possible and could be more informative. MEDUSA
features identified by MEDUSA. Motif descriptions highlighted in red indicate transcription factors that are specifically known to have an importantfunction in hypoxia. The remainder of the table shows MEDUSA (left section) and AlignACE (right section) results for each signature (S1 to S16),represented by a pair of columns scoring motifs by statistical significance (left column in each pair) and abundance within the set of genes making upthe signature (right column in each pair). For statistical significance scores, columns labeled ‘S’ represent the margin scores (in shades of blue)assigned by MEDUSA, and columns labeled ‘M’ represent the maximum a posteriori (MAP) scores (in shades of green) assigned by AlignACE. In bothcases, dark shades indicate higher statistical significance. The columns labeled ‘A’ show the percentage abundance scores of the motifs in each of thesignatures. For AlignACE, the abundance score of a motif simply reflects the ratio of the number of genes in each cluster whose promoters containthe motif, to the cluster size. For MEDUSA, it refers to the ratio of the number of genes in each cluster for which the motif contributes positively to themargin score, to the size of the cluster. A motif could be present in the promoter of a gene but not identified as significant by MEDUSA. In such cases,the motif does not contribute to the MEDUSA abundance score. Dark shades of pink indicate strong abundance scores.doi:10.1371/journal.pcbi.1000224.g008
A Predictive Oxygen Network
PLoS Computational Biology | www.ploscompbiol.org 13 November 2008 | Volume 4 | Issue 11 | e1000224

is well suited to a perturbation dataset, where the set of regulators
exhibit diverse expression signatures across conditions. In a dataset
where many of the regulators are highly correlated, such as in a
short time series, there may not be enough information in the
discretized regulator expression profiles for MEDUSA to resolve
condition-specific regulators. More generally, MEDUSA incurs
some loss of information by discretizing gene expression data prior
to training. Extending MEDUSA to handle real-valued regulator
and target gene expression levels, for example through a regression
formulation, might address this limitation, but it could also
introduce too much noise and lead to over-fitting. Further
investigation is needed to determine whether such extensions to
the MEDUSA algorithm will lead to greater biological insight.
Methods
Yeast Cell Growth and TreatmentYeast strains used were L51 (MATa, ura3-52, leu2-3, 112, his4-
519, ade1-100, trp1::HisG, hap1::LEU2) and MHY100 (MATa,
ura3-52, leu2-3, 112, his4-519, ade1-100, hem1-D100) [68]. L51 was
used for studies of oxygen regulation, and MHY100 was used for
studies of heme regulation. To avoid variations from the
differences accumulated after many generations of growth of
strains, we transformed the L51 strain with the HAP1 gene deleted
for studies of Hap1 function. Hap1 protein was expressed in L51
cells by transforming an ARS-CEN plasmid bearing the complete
HAP1 genomic sequence [69]. For comparison with cells without
Hap1 expressed, an empty vector was transformed into L51 cells.
The use of Hap1 expression plasmid generated much more
reproducible results than the use of different strains. Yeast cells
with or without Hap1 expressed grew at similar rates under both
anaerobic and aerobic conditions.
We chose to use a low oxygen level (,10 ppb) in this study, in
order to identify oxygen-regulated genes. Previous studies have
shown that most, if not all, oxygen-regulated genes are affected at
low concentrations, but some genes are not affected at higher
oxygen levels (for example, .1 ppm) [26,45]. Anaerobic
(,10 ppb O2, measured by using an oxygen monitor and
confirmed by CHEMetrics oxygen kits) growth condition was
created by using an anaerobic chamber (Coy Laboratory, Inc.)
and by filling the chamber with a mixture of 5% H2 and 95% N2
in the presence of palladium catalyst [45]. The oxygen level in the
chamber was monitored by using the Model 10 gas analyzer (COY
laboratory Inc). H2 was filled to keep the measured oxygen level at
zero. The precise level of oxygen was further measured by using
rhodazine kit (K-7511) with MDL at 1 ppb, and a range of 0–
20 ppb (http://www.envco.info/prod.php?product_id = 469). L51
cells bearing the Hap1 expression or empty vector were grown
under normoxic or anaerobic conditions for 1.5 or 6 hours. The
UAS1/CYC1-lacZ reporter plasmid [70] was transformed into
yeast cells to confirm the expression of Hap1 and the oxygen
levels. Cells were grown in yeast synthetic complete media. Co2+-
induced cells were grown in the presence of 400 mM cobalt
chloride for 6 hours, as described previously [31,32]. MHY100
cells were grown in medium containing 2.5 mg/ml (heme-
deficient) or 250 mg/ml (heme-sufficient) 5-aminolevulinic acid
[68]. For RNA preparations, yeast cells were inoculated so that the
optical density of yeast cells was in the range of 0.8–1.0
immediately before the collection of cells.
RNA Preparation and Microarray Gene ExpressionProfiling
RNA was extracted from yeast cells exactly as previously
described [71]. RNA samples were prepared from 8 different
experimental conditions: (1) L51 yeast cells bearing the Hap1
expression plasmid maintained under aerobic conditions, (2) L51
yeast cells bearing the empty expression plasmid maintained under
aerobic conditions, (3) L51 yeast cells bearing the Hap1 expression
plasmid maintained under anaerobic conditions for 1.5 hours, (4)
L51 yeast cells bearing the Hap1 expression plasmid maintained
under anaerobic conditions for 6 hours, (5) L51 yeast cells bearing
the empty expression plasmid maintained under anaerobic condi-
tions for 6 hours, (6) L51 yeast cells bearing the Hap1 expression
plasmid in the presence of 400 mM cobalt chloride for 6 hours, (7)
MHY100 cells grown in medium containing 250 mg/ml (heme-
sufficient) 5-aminolevulinic acid, and (8) MHY100 cells grown in
medium containing 2.5 mg/ml (heme-deficient) 5-aminolevulinic
acid. For each condition, three replicates were generated by
preparing RNA samples from three batches of independently grown
cells. Microarray expression analyses were performed by using three
batches of replicate RNA samples. The quality of RNA was high as
assessed by measuring absorbance at 260 and 280 nm, by gel
electrophoresis, and by the quality of microarray data (see below).
The synthesis of cDNA and biotin-labeled cRNA were carried
out exactly as described in the Affymetrix GeneChip Expression
Analysis Technical Manual (2000). The yeast Saccharomyces
cerevisiae genome 2.0 arrays were purchased from Affymetrix,
Inc. Probe hybridization and data collection were carried out by
the Columbia University Affymetrix GeneChip processing center.
Specifically, the Affymetrix GeneChip Hybridization Oven 640
and the next generation GeneChip Fluidics Station 450 were used
for hybridization and chip processing. Chip scanning was
performed by using the GeneChip scanner 3000. Initial data
acquisition analysis was performed by using the Affymetrix
Microarray suite. By using GCOS1.2 with the advanced PLIER
(probe logarithmic intensity error) algorithm, we calculated and
examined the parameters reflecting the image quality of the
arrays. Arrays with a high background level in any region were
discarded and replaced. The average noise or background level
was limited to less than 5%. The average intensity for those genes
judged to be present was at least 10-fold higher than those judged
to be absent. Also, arrays that deviated considerably in the
percentage of present and absent genes from the majority of the
arrays were replaced. Arrays with a b-actin 39/59 ratio greater
than 2 were replaced.
Normalization of Microarray DataFor each microarray, we converted the .DAT image files into
.CEL files using the Affymetrix GCOS software. These raw .CEL
files were further processed into expression values using the RMA
express software by Bolstad [72] (Dataset S1). This software uses
the robust multiarray average method by Irrizary et al. [73], which
involves a background correction and a quantile-based normali-
zation scheme.
Discretization of Microarray DataEach of the knockout, stress, or perturbation microarray
experiments was compared to a corresponding reference micro-
array as shown in Figure 2B. The expression fold-changes (Dataset
S3) were converted to p-values using an intensity-specific noise
model obtained from replicate data. We used the methodology
outlined in Stolovitzky et al. [74] to generate separate empirical
noise models for each of the reference conditions. The fold-
changes were then discretized into +1, 0 or 21 labels using a p-
value threshold of 0.05. A label of +1 (21) indicates up-regulation
(down-regulation) beyond the threshold level of noise.
Several genes have multiple probes on the microarrays. In such
cases, we discretized each probe reading independently and used a
A Predictive Oxygen Network
PLoS Computational Biology | www.ploscompbiol.org 14 November 2008 | Volume 4 | Issue 11 | e1000224

majority vote over the +1 and 21 discretized values to obtain a
final label for the gene. In cases where a majority vote was not
possible (due to equal number of probes with +1 and 21 values),
we used the label corresponding to the reading with the lowest p-
value. All the replicate experiments were used as input to
MEDUSA. However, in order to remove inconsistency, for each
gene, we further filtered out expression values that did not agree
with the consensus label (+1 or 21) across replicates of a particular
experimental condition. The discretized gene expression data is
presented in Dataset S2. Dataset S4 lists the sets of differentially
expressed genes in each of the experimental conditions.
Database AnnotationsWe obtained gene annotations and functional associations from
Saccharomyces Genome Database (SGD, ftp://ftp.yeastgenome.
org/yeast/, Jan 2006). The gene ontology tree structure was
downloaded from the Gene Ontology Consortium [75]. To
identify statistically enriched terms associated with sets of genes,
we calculated p-values using the cumulative hypergeometric null
distribution on the basis of the number of genes in the set, the
number of genes in that set that are annotated with each GO term,
and the number of genes in the genome that are annotated with
that GO term. We then filtered terms using 1e-5 as a threshold.
Candidate RegulatorsWe used a set of 507 regulators consisting of 240 known and
putative transcription factors and 267 known and putative
signaling molecules such as kinases, phosphatases and receptors.
This set includes 466 regulators from Segal et al. [22] and 9
generic (global) regulators from Lee et al. [76].
Promoter SequencesFor the motif discovery phase in MEDUSA, we used 1000 bp
nucleotide sequences upstream of the TSS of all S. cerevisiae genes
that we obtained from the Saccharomyces genome database
(SGD, ftp://ftp.yeastgenome.org/yeast/, Jan 2006). We scanned
these sequences for all occurring k-mer motifs (k = 2, 3, … , 7) as
well as 3-3 and 4-4 dimer motifs allowing a middle gap of up to
8 bp. We restricted the set of all dimers to those whose two
components have specific relationships, consistent with most
known dimer motifs: equal, reversed, complements, or reverse
complements. The MEDUSA algorithm uses an information-
theoretic, hierarchical agglomeration scheme to learn position-
specific scoring matrices (PSSMs) from k-mers and dimers
occurring in the promoter sequences. We generated a set of 450
PSSMs in the first pass of MEDUSA on our dataset.
Chromatin Immunoprecipitation Microarray DataHarbison et al. [77] use genome-wide location analysis, based
on modified chromatin immunoprecipitation (ChIP), to identify
genomic binding sites for 203 transcription factors in living yeast
cells under 13 diverse environmental conditions, using upstream
regions of approximately 6000 genes. For each genomic region,
the transcription factor occupancy is reported as the log intensity
ratio of the IP-enriched channel versus the genomic DNA channel,
and a single array error model [76] is used to assign p-values to
these measurements. In the second pass of the MEDUSA
algorithm, we used the ChIP data to obtain additional binary
features by thresholding the p-values, augmenting each target
gene’s motif vector by ChIP occupancy features corresponding to
set of transcription factors. We tried different thresholds of 0.001,
0.05 and 0.1 (results not shown) and found the best prediction
accuracy with a p-value threshold of 0.1. Although Harbison et al.
[77] suggest a stricter p-value threshold, their suggestion is based
on minimizing false positives, while in MEDUSA, we use these
binary features to define abstaining weak rules for boosting (see
below). Theoretically, weak rules need only give a small advantage
over random guessing to satisfy the assumptions of boosting. In
this context, false negatives are more of a concern, since rules with
very sparse hits lead to slow and modest improvement in
prediction accuracy. Moreover, other studies suggest that low
affinity binding in ChIP experiments may indeed be functional,
based on sequence conservation evidence [78].
Expression SignaturesWe used a two-phase procedure to partition the genes into
expression signatures for an initial qualitative view of the dataset.
The first phase was used to identify the number of unique
signatures. We first averaged the expression data for each gene in
each experimental condition over all replicates. We then
discretized this expression data into 2 levels (+1/21) based on
the sign of the foldchange in expression. We grouped genes into
sets of unique patterns across all experiments. We then averaged
the real-valued expression data for all genes belonging to each
pattern to obtain a ‘‘mean expression signature’’. Patterns with
small support (,10 genes) were hierarchically merged with their
nearest pattern until there were no patterns with ,10 genes. The
nearest neighbor was determined using a square-euclidean
distance metric over the mean expression signatures for each
pattern. This procedure grouped the 3358 significantly expressed
genes to be grouped into 16 sets.
The second phase was used to refine the clustering. We reclustered
the genes into 16 expression signatures using the k-means clustering
algorithm. We used the square-euclidean distance metric over the
real-valued expression data. In an attempt to avoid local minima, we
repeated the clustering procedure 10 times with different starting
points. The initial candidate genes for cluster centroids were
obtained by randomly sampling the 16 gene sets identified in the
first phase. The final expression signatures were calculated by taking
a majority vote over the 3-level (+1/0/21) discretized expression for
all genes in each gene set.
Nearest Neighbor MethodsWe compared MEDUSA to a simple correlation-based method,
where we predict a gene’s held-out expression levels based on the
‘‘nearest regulator’’ to its training set expression levels. We
calculated prediction accuracies for 10-fold cross validation using
held-out examples and by grouping replicates in the same fold. To
avoid any bias, we reported accuracies on target genes excluding
the 503 regulators. As in our main experiments, we performed 10-
fold cross-validation, and for each gene represented in the test set,
we considered its expression profile when restricted to examples
(i.e., experiments) in the training set and found the best-correlated
regulator across these experiments. The discrete expression level of
this regulator was then used to predict up/down expression in
experiments held out for this gene. As a similarity metric, we used
the normalized Hamming distance (excluding baseline examples)
for discretized expression data, where the inclusion/exclusion of
baseline examples was chosen in order to report the better results.
In cases where multiple regulators were equally distant from a
target gene, we randomly selected one amongst them as the
‘‘nearest regulator’’.
MEDUSA SoftwareAn open source matlab implementation of the MEDUSA
algorithm is freely available for academic users and downloadable
from http://cbio.mskcc.org/leslielab/software/medusa.
A Predictive Oxygen Network
PLoS Computational Biology | www.ploscompbiol.org 15 November 2008 | Volume 4 | Issue 11 | e1000224

The MEDUSA Regulation ModelThe MEDUSA algorithm models the control logic of transcrip-
tional regulation in the form of an alternating decision tree (ADT).
An ADT is a generalization of a decision tree that consists of
alternating layers of decision nodes and prediction nodes. Decision
nodes ask yes/no questions based on particular features. Prediction
nodes contain a real-valued score contribution associated with the
yes or no answer. Unlike regular decision trees, which make yes/no
predictions, ADTs generate real-valued prediction scores whose sign
gives the up/down prediction and whose size gives a measure of
confidence in that prediction. ADTs do not necessarily correspond to
a nested set of binary partitions of the example space like regulator
decision trees; that is, there can be more than one decision node
beneath a prediction node, and more than one of these decision node
conditions can be true for a given example.
Given the promoter sequence of a gene and the expression level of
the regulators in an experiment, the MEDUSA ADT predicts up/
down regulation of the gene in this experiment using yes/no
questions of the form, ‘‘Is motif m present in the upstream region of
the gene and is the state of regulator r up (or down) in that
experiment?’’, in the decision nodes. If the answer is ‘‘yes’’, we add
the associated real value score contribution to the overall prediction
score for the example, and we continue down to the next decision
node; for greater interpretability, we abstain if the answer to the
decision node condition is ‘‘no’’; that is, we contribute zero to the
prediction score. To compute the prediction score for a gene-
experiment example, we start at the root node and recursively check
which decision nodes we can pass through by answering ‘‘yes’’ to the
condition, working from the top to the bottom of the ADT; the final
prediction score is the sum of all the score contributions in all paths in
the ADT that we visit in this process.
More formally, the ADT takes the feature representation xge of the
gene-experiment pair (g,e)—namely the promoter sequence for gene g
and the vector of expression states of regulators in experiment e—and
computes a prediction score F xge
� �~P
t atht xge
� �, a weighted sum
of weak rules ht, where t is an index over paths in the tree. If c is a
boolean condition, then define h[c] to be the weak rule that evaluates
to 1 if the c is true and to 0 if c is false, i.e., h[c](xge) = 1(0) exactly when
c = T(F) for example xge. If the t-th path has length l and corresponds
to a sequence of decision nodes with conditions c1,c2,…,cl, then the
weak rule ht = h[c1 ‘ c2 ‘ … ‘ cl] corresponds to the conjunction of
these conditions. The weight at is the score contribution in the
prediction node for the lowest (depth l) decision node. The sign of the
prediction score F (xge) yields the up/down prediction for the example.
Learning Predictive ModelsWe learn the gene regulation program F (xge) in two phases. In
the first phase, we input discretized regulator and target gene
expression data along with target gene promoter sequences to the
core MEDUSA algorithm to discover DNA motifs and assemble
an initial ADT model. The core algorithm is described below. In
the second phase, we take the motif hits learned in the first ADT,
together with discretized target and regulator expression data and
ChIP chip occupancy data, to learn a stabilized ADT, as described
in the next section.
To learn the ADT in the first training phase, we use a training set
{xge, yge} of labeled examples, where xge is the feature representation of
the target gene-experiment pair (g,e) (promoter sequence of g and
vector of expression states of regulators in experiment e), labeled as
yge = +1 if the gene is up-regulated in the experiment and yge = 21 if it
is down-regulated. Examples that are not significantly differentially
expressed (‘‘baseline’’) are excluded from the training set. MEDUSA
uses a supervised learning algorithm based on boosting to iteratively
build an alternating decision tree (ADT) that represents a gene
regulation model for all target genes and experimental conditions.
MEDUSA learns binding site motifs from the target gene promoter
sequences while building the ADT, but the same ADT learning
algorithm can be run using a fixed set of motifs as an input [40,41].
In our hypoxia experiments, the training set consisted of 13,093
differentially expressed gene-experiment instances.
Boosting is a general machine learning algorithm for binary
prediction problems. The basic idea is to iteratively apply a simple
discriminative learning algorithm, called the weak learner, to
different weightings of the same training set. At each iteration
t = 1…T, boosting selects a weak rule ht that optimizes an
exponential loss function for the current weights; then weights wge
are recalculated so that examples xge that were misclassified by ht are
more highly weighted. Finally, all of the weak rules are combined
into a single strong rule using a weighted majority vote. Empirically,
boosting often learns to make large-margin (confident) predictions on
the training set, which is theoretically linked to its ability to obtain
good generalization on test data even when the feature space is very
high dimensional (that is, it avoids over-fitting the training data).
Detailed pseudocode for the core MEDUSA algorithm is given
in Figure 9. Briefly, each iteration t of boosting adds a new
decision node—corresponding to a binding site motif m, coupled
with a regulator r whose state s (either up or down) helps predict
up/down regulation of target genes—and a prediction node to a
gene regulation model described by an ADT. Each motif is either
a k-length sequence (‘‘k-mer’’), a dimer, or a PSSM. The weak rule
ht defined by the decision node depends both on the motif-
regulator condition that it tests and on the position at which it is
placed in the ADT. We define the precondition c1 to be the
conjunction of conditions in decision nodes along the path to the
existing prediction node under which the new decision node is
placed, and we write c2 = c2 (m, r, s) as the condition tested in the
new decision node. Then the corresponding weak rule is ht = [c1 ‘c2], and the prediction node value at can be computed from the
weight of the correct and incorrect training predictions made by ht
(see Figure 9). The motif m added at iteration t is learned in two
stages. First, the algorithm considers all deterministic motifs (k-
mers or dimers) md and optimizes boosting loss over choices of
preconditions c1 and new conditions c2 = c2 (m, r, s), yielding
optimal precondition c�1, regulator r�1 and state s*. Second,
candidate PSSMs are generated by considering the top-ranked
deterministic motifs mjd
n oj~1...K
generated in the first stage and
performing hierarchical agglomeration (see Figure 9). Optimizing
boosting loss over candidate PSSMs and choices of thresholds for
the log-odds score for each of these PSSMs yields an optimal
probabilistic motif m�p and threshold h*. This motif is used for the
new decision and prediction nodes if its loss is better than the best
deterministic motif m1d .
We ran the core MEDUSA algorithm for 450 iterations to
obtain a set of 450 PSSMs, their targets and thresholds along with
an initial ADT. We decided on the stopping criterion based on the
number of iterations required for the mean test-loss on cross-
validated folds to plateau.
Stabilized Predictive ModelsIn standard boosting, features that are correlated with the single
best feature at a particular round of the algorithm are decorrelated in
the next round of boosting and may fail to be captured by the model.
While this possible consequence does not affect prediction accuracy,
we may lose biologically important features that are correlated to the
ones selected by the algorithm. To address this issue, we previously
introduced a stabilized variant of boosting that can be used with
ADT learning for modeling gene regulation [41]. The main idea of
A Predictive Oxygen Network
PLoS Computational Biology | www.ploscompbiol.org 16 November 2008 | Volume 4 | Issue 11 | e1000224
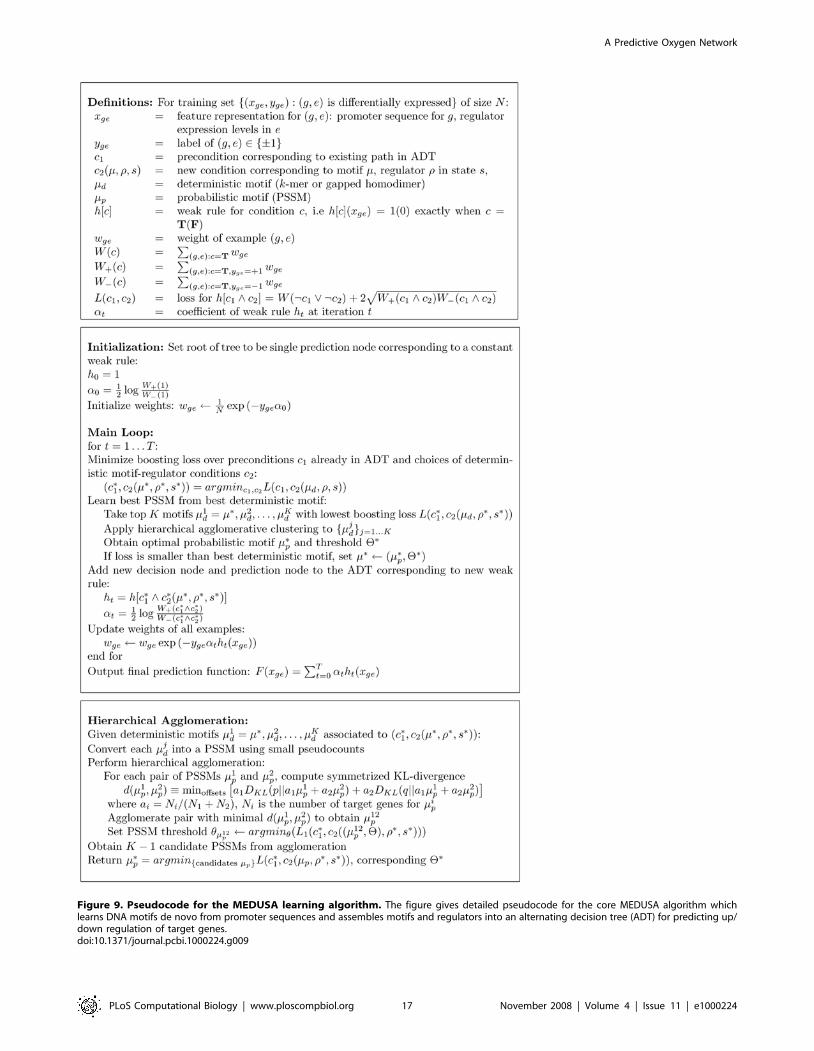
Figure 9. Pseudocode for the MEDUSA learning algorithm. The figure gives detailed pseudocode for the core MEDUSA algorithm whichlearns DNA motifs de novo from promoter sequences and assembles motifs and regulators into an alternating decision tree (ADT) for predicting up/down regulation of target genes.doi:10.1371/journal.pcbi.1000224.g009
A Predictive Oxygen Network
PLoS Computational Biology | www.ploscompbiol.org 17 November 2008 | Volume 4 | Issue 11 | e1000224

stabilized boosting is to allow a set of correlated features, rather than
single features, to be included at nodes of the tree. We average the
prediction of several weak rules in the case where the rules with
smallest boosting loss are highly correlated with each other.
More precisely, at each iteration of ADT learning, we find the
optimal precondition c�1 and new decision node condition c�2, and
we first decide whether to stabilize the node by looking for
conditions correlated to c�2. We stabilize only if the weak rule
h�~h c�1 ^ c�2� �
itself provides a significant advantage over random
guessing, namely if
1
2Wz c�1 ^ c�2
� �{W{ c�1 ^ c�2
� ��� ��§g1
ffiffiffiffiffiffiffiffiffiffiffiffiffiffiffiffiffiffiffiffiffiffiffiffiffiffiffiffiffiffiffiffiffiffiffiffiffiffiffiffiffiffiffiffiffiPg,eð Þ:c�
1xgeð Þ~T w2
gePg,eð Þ:c�
1xgeð Þ~T wge
� �2
vuuutwhere g1 is a parameter and other notation is as defined in
Figure 9. If this condition is satisfied, we look for additional
conditions c2 such that the weight of the symmetric difference of
the examples where conditions c�1 ^ c�2 and c�1 ^ c2 hold is
sufficiently small, i.e.,
W c�1 ^ c�2� �
7 c�1 ^ c2
� �� �ƒg2
ffiffiffiffiffiffiffiffiffiffiffiffiffiffiffiffiffiffiffiffiffiffiffiffiffiffiffiffiffiffiffiffiffiffiffiffiffiffiffiffiffiffiffiffiffiPg,eð Þ:c�
1xgeð Þ~T w2
gePg,eð Þ:c�
1xgeð Þ~T wge
� �2
vuuutwhere g2 is a second parameter. We then average over the weak
rules corresponding to c�1 ^ c2 as follows. For a condition c, write
the coefficient of the corresponding weak rule h as
ah~1
2ln
Wz cð ÞW{ cð Þ. For the set of weak rules h~h c�1 ^ c2
� � , we
define a new stabilized rule havg that takes a robust majority vote
over the set of weak rules as follows:
havg xð Þ~ 1,P
h ahh xð Þ�� ��wh
0, otherwise
(
where we set h~
Ph
ahj j{minh ahj jð Þ2
. In our experiments, we use
g1 = g2 = 0.1. Theoretical motivation for the stabilized boosting
equations can be found in our earlier work [41].
Stabilized boosting retains correlated features, so that in post-
processing we obtain more stable ranked lists of regulator and
motif features. The improved stability of the prediction tree allows
us to perform detailed condition-specific post-processing of target
gene sets.
For the second phase of training on the hypoxia data, we used
the stabilized boosting algorithm again for 450 iterations to relearn
the prediction tree using the motif hits learned in the initial
MEDUSA run together with promoter occupancy data for
transcription factors from ChIP-chip experiments. Here, we view
a promoter sequence as either as bound by a transcription factor
(TF) in the ChIP assay by thresholding on the p-value for the ChIP
chip occupancy ratio. We note that the stabilized decision nodes in
the ADT often contained a set of conditions involving a single
motif paired with different regulators. This final model was used
for all post-processing analysis (see Dataset S5).
Feature Extraction and SignificanceThe margin of a gene-experiment example is given by ygeF (xge),
where F (xge) is the real-valued score assigned to the example by the
ADT and yge is its binary label (+1 for up or 21 for down). The
margin is positive if the ADT correctly predicts the example, and the
size of the margin can be interpreted as the confidence of the
prediction [79]. Motivated by theoretical work that links large
margins on the training set with good generalization to test data, we
developed a margin-based score to evaluate the importance of a
given regulator to the overall predictive model. For a regulator r, we
write FrR0 (xge) to be the modified score that the ADT would assign a
given gene-experiment example if we artificially set the regulator’s
expression level to baseline in the experiment. Equivalently, we could
obtain the modified score for the example by eliminating all nodes
containing r, and all subtrees rooted at these nodes, from the ADT,
and then computing the prediction score. To assess the significance
of r for a particular set of genes G in a particular set of experiments E
in the training set, we computed the following margin-based score:
1
g,eð Þ : g[G,e[Ef gj jX
g[G,e[E
yge F xge
� �{Fr?0 xge
� �� �
This score will again be positive if regulator r contributes on
average to correct predictions, and the size of the score can be used
to rank regulators by predictive importance. Rather than using a
stringent threshold, we collected all regulators whose margin-based
score is above 0; we reasoned that since the score only measures
whether the regulator independently affects the prediction score, a
higher threshold could lose more subtle regulators that act
cooperatively with other factors. We also note that stabilized
boosting retains multiple correlated features in the ADT nodes,
which means that all statistically important regulators are identified
by the margin score; without stabilization, a regulator might not be
included in the tree if it is tightly correlated with another regulator
that has been included. For example, if two regulators are perfectly
correlated across all experiments, we expect them to occur in exactly
the same nodes and therefore give the same margin score.
Supporting Information
Dataset S1 Normalized gene expression data for all experiments
(processed using RMA Express)
Found at: doi:10.1371/journal.pcbi.1000224.s001 (2.76 MB ZIP)
Dataset S2 Discretized gene expression data for all experiments
that is used in the MEDUSA learning procedure
Found at: doi:10.1371/journal.pcbi.1000224.s002 (0.23 MB ZIP)
Dataset S3 log2 of fold change of gene expression data for all
experiments that is used in the MEDUSA learning procedure
Found at: doi:10.1371/journal.pcbi.1000224.s003 (1.29 MB ZIP)
Dataset S4 List of differentially expressed genes (UP -
upregulated, DOWN - downregulated) in each of the conditions
discussed in the paper
Found at: doi:10.1371/journal.pcbi.1000224.s004 (0.05 MB ZIP)
Dataset S5 Properties of the alternating decision tree learned by
MEDUSA. The file lists the regulators and motifs learned by
MEDUSA at each iteration. It also lists nodes that precede and
follow each node in the ADT.
Found at: doi:10.1371/journal.pcbi.1000224.s005 (0.03 MB ZIP)
Figure S1 Distribution of prediction scores for +1 (red curve), 0
(blue curve), 21 (green curve) examples.
Found at: doi:10.1371/journal.pcbi.1000224.s006 (0.18 MB TIF)
Figure S2 Scatter plot of true expression values versus
prediction scores F(x). The scatter plot shows a high correlation
between prediction scores (y-axis) and true log expression values (y-
A Predictive Oxygen Network
PLoS Computational Biology | www.ploscompbiol.org 18 November 2008 | Volume 4 | Issue 11 | e1000224
axis) for all examples. The red, blue, and green points represent
the +1, 0, and 21 labeled examples, respectively.
Found at: doi:10.1371/journal.pcbi.1000224.s007 (1.90 MB TIF)
Figure S3 Heat map of target genes that are anaerobically induced
in HAP1 and Dhap1 cells, and those that are suppressed by heme.
Significant predictive regulators and sequence motifs are also shown.
Found at: doi:10.1371/journal.pcbi.1000224.s008 (1.55 MB TIF)
Figure S4 Heat map of target genes that are anaerobically induced
in HAP1 and Dhap1 cells, and those that are induced by Co2+ ion.
Significant predictive regulators and sequence motifs are also shown.
Found at: doi:10.1371/journal.pcbi.1000224.s009 (1.51 MB TIF)
Figure S5 Heat map of target genes that are anaerobically
suppressed in HAP1 and Dhap1 cells, and those that are suppressed
by Co2+ ion. Significant predictive regulators and sequence motifs
are also shown.
Found at: doi:10.1371/journal.pcbi.1000224.s010 (1.66 MB TIF)
Figure S6 Conditions used in microarray expression experi-
ments and identified target genes.
Found at: doi:10.1371/journal.pcbi.1000224.s011 (0.59 MB TIF)
Figure S7 Venn diagrams showing the numbers of oxygen-
regulated, heme-regulated, and Co2+-inducible genes in HAP1 and
Dhap1 cells. (A) A Venn diagram illustrating the numbers of
hypoxically suppressed (oxygen-induced) genes in HAP1 and Dhap1
cells, and heme-induced genes. (B) A Venn diagram illustrating the
numbers of hypoxically induced (oxygen-suppressed) genes in HAP1
and Dhap1 cells, and heme-suppressed genes. (C) A Venn diagram
illustrating the numbers of hypoxically induced (oxygen-suppressed)
genes in HAP1 cells at 1.5 or 6 hours after shifting to anaerobic growth
conditions. (D) A Venn diagram illustrating the numbers of
hypoxically suppressed (oxygen-induced) genes in HAP1 cells at 1.5
or 6 hours after shifting to anaerobic growth conditions. (E) A Venn
diagram illustrating the numbers of hypoxically induced (oxygen-
suppressed) genes in HAP1 and Dhap1 cells, and Co2+-inducible genes.
Found at: doi:10.1371/journal.pcbi.1000224.s012 (1.42 MB TIF)
Figure S8 The functional categorization of identified oxygen-
regulated, heme-regulated, and Co2+-inducible genes. This figure
illustrates the enriched Gene Ontology process annotations for
selected sets of the differentially expressed target gene Venn
diagrams of Figure S7. Each row represents a set of genes, and
each column represents a GO process annotation. The set names
are to the left of the color matrix. The GO annotations are shown
below the color matrix. Each element of the color matrix illustrates
the p-value of enrichment. The colorbar on the right shows the
colors used for the range of p-values. The following naming
convention is used for the gene sets. Each set represents the
intersection of sets of genes that are differentially expressed in
different experimental contexts. Each experimental context is
represented by an identifier (e.g., Anaerobic represents the
hypoxia condition) followed by up or down arrows denoting up-
regulation or down-regulation of the genes in that context. The
symbol ‘,’ is the logical operation ‘NOT’, while the up and down
arrows specify whether the set of genes up or downregulated in
that condition. For example, AnaerobicqAnaerobic (Dhap1)
q,Coq refers to the set of target genes that are hypoxically
induced both in HAP1 and Dhap1 cells but are not Co2+-inducible.
The p-values shown are not corrected for multiple comparisons.
Found at: doi:10.1371/journal.pcbi.1000224.s013 (1.46 MB TIF)
Figure S9 Comparison of MacIsaac et al. PSSMs to PSSMs
learned by MEDUSA. MacIsaac et al. used ChIP-chip data to
identify potential binding sites for 124 transcription factors. We
use the symmetrized Kullback-Leibler (KL) distance to identify the
best matching MEDUSA PSSM to each of these 124 PSSMs. The
transcription factors are listed in ascending order by the KL
distance to the best match. Column 3 shows the MacIsaac et al.
PSSMs and Column 4 shows the best matching MEDUSA PSSM.
Found at: doi:10.1371/journal.pcbi.1000224.s014 (1.99 MB TIF)
Figure S10 Positive tail of the empirical null distribution for
normalized margin scores. The figure shows the normalized
histogram for positive margin scores (margin score .0) for all gene
sets in all the randomization trials. We normalize by dividing the
frequency in each bin by the total number of data points (|margin
scores .0|+|margin scores #0|). The highest observed margin
score computed from the randomized data was 0.53. The red
points are the 54 regulators with positive margin score using the
true labels; if a regulator was identified for multiple gene sets, its
most significant p-value is shown. We see that most of these points
lie far into the positive tail of the distribution.
Found at: doi:10.1371/journal.pcbi.1000224.s015 (10.19 MB TIF)
Figure S11 Empirical p-values for the (normalized) margin
score. We calculate a p-value for each margin score h as the
fraction of data points in the randomization trials with margin
score .h. The 54 regulators with positive margin scores using true
labels have low p-values. If a regulator was identified for multiple
gene sets, its most significant p-value is shown.
Found at: doi:10.1371/journal.pcbi.1000224.s016 (10.19 MB TIF)
Figure S12 Estimated false discovery rate for choices of p-value
threshold for 54 identified regulators. We obtain p-values for all
507 regulators in each of the 12 gene sets. We then apply the step-
wise Benjamini-Hochberg procedure to this set of p-values to
obtain the FDR corresponding to each p-value cutoff. The figure
shows the best margin score, corresponding p-value and FDR for
the 54 regulators with positive margin score in at least one gene
set. The top 16 regulators correspond to very small FDRs and
include many known hypoxia regulators such as Upc2, Hap4,
Mga2, Rox1, and Hap1, as well as novel regulators.
Found at: doi:10.1371/journal.pcbi.1000224.s017 (1.34 MB TIF)
Text S1 Supplemental methods. This file contains additional
supplemental information such as additional context-specific
results and detailed cross-validation and prediction accuracy
results and comparisons.
Found at: doi:10.1371/journal.pcbi.1000224.s018 (3.97 MB
DOC)
Acknowledgments
We thank Chris Wiggins and Yoav Freund for ongoing discussions during
the continued development of the MEDUSA algorithm.
Author Contributions
Conceived and designed the experiments: A. Kundaje, X. Xin, C. Lan, S.
Lianoglou, M. Zhou, L. Zhang, C. Leslie. Performed the experiments: X.
Xin, C. Lan, M. Zhou. Analyzed the data: A. Kundaje. Contributed
reagents/materials/analysis tools: A. Kundaje, S. Lianoglou, L. Zhang, C.
Leslie. Wrote the paper: A. Kundaje, L. Zhang, C. Leslie.
References
1. Bunn HF, Poyton RO (1996) Oxygen sensing and molecular adaptation to
hypoxia. Physiol Rev 76: 839–885.
2. Kwast KE, Lai LC, Menda N, James DT III, Aref S, et al. (2002) Genomic
analyses of anaerobically induced genes in Saccharomyces cerevisiae: functional
A Predictive Oxygen Network
PLoS Computational Biology | www.ploscompbiol.org 19 November 2008 | Volume 4 | Issue 11 | e1000224

roles of Rox1 and other factors in mediating the anoxic response. J Bacteriol184: 250–265.
3. Tai SL, Boer VM, Daran-Lapujade P, Walsh MC, de Winde JH, et al. (2005)
Two-dimensional transcriptome analysis in chemostat cultures. Combinatorialeffects of oxygen availability and macronutrient limitation in Saccharomyces
cerevisiae. J Biol Chem 280: 437–447.
4. Piper MD, Daran-Lapujade P, Bro C, Regenberg B, Knudsen S, et al. (2002)
Reproducibility of oligonucleotide microarray transcriptome analyses. An
interlaboratory comparison using chemostat cultures of Saccharomycescerevisiae. J Biol Chem 277: 37001–37008.
5. ter Linde JJ, Liang H, Davis RW, Steensma HY, van Dijken JP, et al. (1999)Genome-wide transcriptional analysis of aerobic and anaerobic chemostat
cultures of Saccharomyces cerevisiae. J Bacteriol 181: 7409–7413.
6. Lai L-C, Kosorukoff AL, Burke PV, Kwast KE (2005) Dynamical remodeling ofthe transcriptome during short-term anaerobiosis in Saccharomyces cerevisiae:
differential response and role of Msn2 and/or Msn4 and other factors ingalactose and glucose media. Mol Cell Biol 25: 4075–4091.
7. Lai L-C, Kosorukoff AL, Burke PV, Kwast KE (2006) Metabolic-state-
dependent remodeling of the transcriptome in response to anoxia andsubsequent reoxygenation in Saccharomyces cerevisiae. Eukaryot Cell 5:
1468–1489.
8. Middendorf M, Kundaje A, Shah M, Freund Y, Wiggins C, et al. (2005) Motif
discovery through predictive modeling of gene regulation. In: Miyano S,
Mesirov J, Kasif S, Istrail S, Pevzner P, et al. eds. RECOMB. Cambridge(Massachusetts): Springer. pp 358–552.
9. Tavazoie S, Hughes JD, Campbell MJ, Cho RJ, Church GM (1999) Systematicdetermination of genetic network architecture. Nat Genet 22: 281–285.
10. Pilpel Y, Sudarsanam P, Church GM (2001) Identifying regulatory networks by
combinatorial analysis of promoter elements. Nat Genet 29: 153–159.
11. Segal E, Yelensky R, Koller D (2003) Genome-wide discovery of transcriptional
modules from DNA sequence and gene expression. Bioinformatics 19(Suppl 1):
i273–i282.
12. Yeang CH, Mak HC, McCuine S, Workman C, Jaakkola T, et al. (2005)
Validation and refinement of gene-regulatory pathways on a network of physicalinteractions. Genome Biol 6: R62.
13. Tanay A, Sharan R, Kupiec M, Shamir R (2004) Revealing modularity and
organization in the yeast molecular network by integrated analysis of highlyheterogeneous genomewide data. Proc Natl Acad Sci U S A 101: 2981–2986.
14. Gardner TS, di Bernardo D, Lorenz D, Collins JJ (2003) Inferring geneticnetworks and identifying compound mode of action via expression profiling.
Science 301: 102–105.
15. Pe’er D, Regev A, Elidan G, Friedman N (2001) Inferring subnetworks fromperturbed expression profiles. Bioinformatics 17(Suppl 1): S215–S224.
16. Bar-Joseph Z, Gerber GK, Lee TI, Rinaldi NJ, Yoo JY, et al. (2003)
Computational discovery of gene modules and regulatory networks. NatBiotechnol 21: 1337–1342.
17. Kaern M, Blake WJ, Collins JJ (2003) The engineering of gene regulatorynetworks. Annu Rev Biomed Eng 5: 179–206.
18. Hartemink AJ, Gifford DK, Jaakkola TS, Young RA (2001) Using graphical
models and genomic expression data to statistically validate models of geneticregulatory networks. Pac Symp Biocomput. pp 422–433.
19. Ihmels J, Friedlander G, Bergmann S, Sarig O, Ziv Y, et al. (2002) Revealingmodular organization in the yeast transcriptional network. Nat Genet 31:
370–377.
20. Yeung MK, Tegner J, Collins JJ (2002) Reverse engineering gene networks usingsingular value decomposition and robust regression. Proc Natl Acad Sci U S A
99: 6163–6168.
21. Beer MA, Tavazoie S (2004) Predicting gene expression from sequence. Cell
117: 185–198.
22. Segal E, Shapira M, Regev A, Pe’er D, Botstein D, et al. (2003) Modulenetworks: identifying regulatory modules and their condition-specific regulators
from gene expression data. Nat Genet 34: 166–176.
23. Freund Y, Schapire R (1997) A decision-theoretic generalization of on-linelearning and an application to boosting. J Comput Syst Sci 55: 119–139.
24. Schapire R, Singer Y (1999) Improved boosting algorithms using confidence-rated predictions. Mach Learn 37: 297–336.
25. Dagsgaard C, Taylor LE, O’Brien KM, Poyton RO (2001) Effects of anoxia and
the mitochondrion on expression of aerobic nuclear COX genes in yeast:evidence for a signaling pathway from the mitochondrial genome to the nucleus.
J Biol Chem 276: 7593–7601.
26. Burke PV, Raitt DC, Allen LA, Kellogg EA, Poyton RO (1997) Effects of oxygen
concentration on the expression of cytochrome c and cytochrome c oxidase
genes in yeast. J Biol Chem 272: 14705–14712.
27. Lowry CV, Zitomer RS (1988) ROX1 encodes a heme-induced repression factor
regulating ANB1 and CYC7 of Saccharomyces cerevisiae. Mol Cell Biol 8:4651–4658.
28. Schneider JC, Guarente L (1991) Regulation of the yeast CYT1 gene encoding
cytochrome c1 by HAP1 and HAP2/3/4. Mol Cell Biol 11: 4934–4942.
29. Prezant T, Pfeifer K, Guarente L (1987) Organization of the regulatory region of
the yeast CYC7 gene: multiple factors are involved in regulation. Mol Cell Biol7: 3252–3259.
30. Kwast KE, Burke PV, Poyton RO (1998) Oxygen sensing and the
transcriptional regulation of oxygen-responsive genes in yeast. J Exp Biol 201:1177–1195.
31. Jiang Y, Vasconcelles MJ, Wretzel S, Light A, Gilooly L, et al. (2002) Mga2pprocessing by hypoxia and unsaturated fatty acids in Saccharomyces cerevisiae:
impact on LORE-dependent gene expression. Eukaryot Cell 1: 481–490.
32. Jiang Y, Vasconcelles MJ, Wretzel S, Light A, Martin CE, et al. (2001) MGA2 isinvolved in the low-oxygen response element-dependent hypoxic induction of
genes in Saccharomyces cerevisiae. Mol Cell Biol 21: 6161–6169.
33. Zitomer RS, Carrico P, Deckert J (1997) Regulation of hypoxic gene expression
in yeast. Kidney Int 51: 507–513.
34. Zitomer RS, Lowry CV (1992) Regulation of gene expression by oxygen inSaccharomyces cerevisiae. Microbiol Rev 56: 1–11.
35. Rachidi N, Martinez MJ, Barre P, Blondin B (2000) Saccharomyces cerevisiaePAU genes are induced by anaerobiosis. Mol Microbiol 35: 1421–1430.
36. Sertil O, Cohen BD, Davies KJ, Lowry CV (1997) The DAN1 gene of S.
cerevisiae is regulated in parallel with the hypoxic genes, but by a differentmechanism. Gene 192: 199–205.
37. Abramova NE, Cohen BD, Sertil O, Kapoor R, Davies KJ, et al. (2001)
Regulatory mechanisms controlling expression of the DAN/TIR mannoproteingenes during anaerobic remodeling of the cell wall in Saccharomyces cerevisiae.
Genetics 157: 1169–1177.
38. Abramova N, Sertil O, Mehta S, Lowry CV (2001) Reciprocal regulation of
anaerobic and aerobic cell wall mannoprotein gene expression in Saccharomy-
ces cerevisiae. J Bacteriol 183: 2881–2887.
39. Vasconcelles MJ, Jiang Y, McDaid K, Gilooly L, Wretzel S, et al. (2001)
Identification and characterization of a low oxygen response element involved inthe hypoxic induction of a family of Saccharomyces cerevisiae genes.
Implications for the conservation of oxygen sensing in eukaryotes. J Biol Chem
276: 14374–14384.
40. Middendorf M, Kundaje A, Wiggins C, Freund Y, Leslie C (2004) Predicting
genetic regulatory response using classification. Bioinformatics 20(Suppl 1):i232–i240.
41. Kundaje A, Middendorf M, Shah M, Wiggins C, Freund Y, et al. (2006) A
classification-based framework for predicting and analyzing gene regulatoryresponse. BMC Bioinformatics 7(Supp 1): S5.
42. Segal E, Barash Y, Simon I, Friedman N, Koller D (2002) From promotersequence to expression: a probabilistic framework. In: RECOMB. New York:
ACM Press. pp 263–272.
43. Ernst J, Vainas O, Harbison CT, Simon I, Bar-Joseph Z (2007) Reconstructingdynamic regulatory maps. Mol Syst Biol 3: 74.
44. Bussemaker HJ, Li H, Siggia ED (2001) Regulatory element detection using
correlation with expression. Nat Genet 27: 167–174.
45. Hon T, Dodd A, Dirmeier R, Gorman N, Sinclair PR, et al. (2003) A
mechanism of oxygen sensing in yeast: multiple oxygen-responsive steps in theheme biosynthetic pathway affect Hap1 activity. J Biol Chem 278:
50771–50780.
46. Zhang L, Hach A (1999) Molecular mechanism of heme signaling in yeast: thetranscriptional activator Hap1 serves as the key mediator. Cell Mol Life Sci 56:
415–426.
47. Hoppe T, Matuschewski K, Rape M, Schlenker S, Ulrich HD, et al. (2000)
Activation of a membrane-bound transcription factor by regulated ubiquitin/
proteasome-dependent processing. Cell 102: 577–586.
48. Shianna KV, Dotson WD, Tove S, Parks LW (2001) Identification of a UPC2
homolog in Saccharomyces cerevisiae and its involvement in aerobic steroluptake. J Bacteriol 183: 830–834.
49. Kastaniotis AJ, Zitomer RS (2000) Rox1 mediated repression. Oxygen
dependent repression in yeast. Adv Exp Med Biol 475: 185–195.
50. Keng T (1992) HAP1 and ROX1 form a regulatory pathway in the repression of
HEM13 transcription in Saccharomyces cerevisiae. Mol Cell Biol 12:2616–2623.
51. Olesen J, Hahn S, Guarente L (1987) Yeast HAP2 and HAP3 activators both
bind to the CYC1 upstream activation site, UAS2, in an interdependentmanner. Cell 51: 953–961.
52. Smith A, Ward MP, Garrett S (1998) Yeast PKA represses Msn2p/Msn4p-
dependent gene expression to regulate growth, stress response and glycogenaccumulation. EMBO J 17: 3556–3564.
53. Morano KA, Santoro N, Koch KA, Thiele DJ (1999) A trans-activation domainin yeast heat shock transcription factor is essential for cell cycle progression
during stress. Mol Cell Biol 19: 402–411.
54. Erkine AM, Magrogan SF, Sekinger EA, Gross DS (1999) Cooperative bindingof heat shock factor to the yeast HSP82 promoter in vivo and in vitro. Mol Cell
Biol 19: 1627–1639.
55. Grably MR, Stanhill A, Tell O, Engelberg D (2002) HSF and Msn2/4p can
exclusively or cooperatively activate the yeast HSP104 gene. Mol Microbiol 44:
21–35.
56. Benjamini Y, Hochberg Y (1995) Controlling the false discovery rate: a practical
and powerful approach to multiple testing. J R Stat Soc Ser B 57: 289–300.
57. Choi JY, Stukey J, Hwang SY, Martin CE (1996) Regulatory elements that
control transcription activation and unsaturated fatty acid-mediated repression
of the Saccharomyces cerevisiae OLE1 gene. J Biol Chem 271: 3581–3589.
58. MacIsaac KD, Wang T, Gordon DB, Gifford DK, Stormo GD, et al. (2006) An
improved map of conserved regulatory sites for Saccharomyces cerevisiae. BMCBioinformatics 7: 113.
59. Hughes JD, Estep PW, Tavazoie S, Church GM (2000) Computational
identification of cis-regulatory elements associated with groups of functionallyrelated genes in Saccharomyces cerevisiae. J Mol Biol 296: 1205–1214.
A Predictive Oxygen Network
PLoS Computational Biology | www.ploscompbiol.org 20 November 2008 | Volume 4 | Issue 11 | e1000224
60. Roth FP, Hughes JD, Estep PW, Church GM (1998) Finding DNA regulatory
motifs within unaligned noncoding sequences clustered by whole-genomemRNA quantitation. Nat Biotechnol 16: 939–945.
61. Svetlov VV, Cooper TG (1995) Review: compilation and characteristics of
dedicated transcription factors in Saccharomyces cerevisiae. Yeast 11:1439–1484.
62. Grishin AV, Rothenberg M, Downs MA, Blumer KJ (1998) Mot3, a Zn fingertranscription factor that modulates gene expression and attenuates mating
pheromone signaling in Saccharomyces cerevisiae. Genetics 149: 879–892.
63. Labb’ S, Zhu Z, Thiele DJ (1997) Copper-specific transcriptional repression ofyeast genes encoding critical components in the copper transport pathway. J Biol
Chem 272: 15951–15958.64. MacIsaac KD, Wang T, Gordon DB, Gifford DK, Stormo GD, et al. (2006) An
improved map of conserved regulatory sites for Saccharomyces cerevisiae. BMCBioinformatics 7: 113.
65. Sertil O, Vemula A, Salmon SL, Morse RH, Lowry CV (2007) Direct role for
the Rpd3 complex in transcriptional induction of the anaerobic DAN/TIRgenes in yeast. Mol Cell Biol 27: 2037–2047.
66. Gasch AP, Werner-Washburne M (2002) The genomics of yeast responses toenvironmental stress and starvation. Funct Integr Genomics 2: 181–192.
67. Kuge S, Jones N, Nomoto A (1997) Regulation of yAP-1 nuclear localization in
response to oxidative stress. EMBO J 16: 1710–1720.68. Zhang L, Hach A, Wang C (1998) Molecular mechanism governing heme
signaling in yeast: a higher-order complex mediates heme regulation of thetranscriptional activator HAP1. Mol Cell Biol 18: 3819–3828.
69. Pfeifer K, Kim KS, Kogan S, Guarente L (1989) Functional dissection and
sequence of yeast HAP1 activator. Cell 56: 291–301.70. Guarente L, Lalonde B, Gifford P, Alani E (1984) Distinctly regulated tandem
upstream activation sites mediate catabolite repression of the CYC1 gene of S.
cerevisiae. Cell 36: 503–511.71. Ausubel FM, Brent R, Kingston RE, Moore DD, Seidman JG, et al. (2000)
Current Protocols in Molecular Biology. New York: John Wiley & Sons.72. Bolstad BM, Irizarry RA, Astrand M, Speed TP (2003) A comparison of
normalization methods for high density oligonucleotide array data based on
variance and bias. Bioinformatics 19: 185–193.73. Irizarry RA, Bolstad BM, Collin F, Cope LM, Hobbs B, et al. (2003) Summaries
of Affymetrix GeneChip probe level data. Nucleic Acids Res 31: e15.74. Tu Y, Stolovitzky G, Klein U (2002) Quantitative noise analysis for gene
expression microarray experiments. Proc Natl Acad Sci U S A 99: 14031–14036.75. Gene Ontology Consortium (2006) The Gene Ontology (GO) project in 2006.
Nucleic Acids Res 34: D322–D326.
76. Lee TI, Rinaldi NJ, Robert F, Odom DT, Bar-Joseph Z, et al. (2002)Transcriptional regulatory networks in Saccharomyces cerevisiae. Science 298:
799–804.77. Harbison CT, Gordon DB, Lee TI, Rinaldi NJ, Macisaac KD, et al. (2004)
Transcriptional regulatory code of a eukaryotic genome. Nature 431: 99–104.
78. Tanay A (2006) Extensive low-affinity transcriptional interactions in the yeastgenome. Genome Res 16: 962–972.
79. Schapire RE, Freund Y, Bartlett P, Lee WS (1998) Boosting the margin: a newexplanation for the effectiveness of voting methods. Ann Stat 26: 1651–1686.
A Predictive Oxygen Network
PLoS Computational Biology | www.ploscompbiol.org 21 November 2008 | Volume 4 | Issue 11 | e1000224