Embed Size (px)
Citation preview
Journal of Educational Technology Development and Exchange Journal of Educational Technology Development and Exchange
(JETDE) (JETDE)
Volume 11 Issue 1
January 2019
A Predictive Study of Students’ Self-regulated Learning Skills and A Predictive Study of Students’ Self-regulated Learning Skills and
Their Roles in the Social Network Interaction of Online Discussion Their Roles in the Social Network Interaction of Online Discussion
Board Board
Cherng-Jyh Yen Old Dominion University
Aras Bozkurt Anadolu University
Chih-Hsiung Tu Northern Arizona University, [email protected]
Laura Sujo-Montes Northern Arizona University
Claudia Rodas Northern Arizona University
See next page for additional authors Follow this and additional works at: https://aquila.usm.edu/jetde
Part of the Instructional Media Design Commons, and the Online and Distance Education Commons
Recommended Citation Recommended Citation Yen, Cherng-Jyh; Bozkurt, Aras; Tu, Chih-Hsiung; Sujo-Montes, Laura; Rodas, Claudia; Harati, Hoda; and Lockwood, Adam B. (2019) "A Predictive Study of Students’ Self-regulated Learning Skills and Their Roles in the Social Network Interaction of Online Discussion Board," Journal of Educational Technology Development and Exchange (JETDE): Vol. 11 : Iss. 1 , Article 2. DOI: 10.18785/jetde.1101.02 Available at: https://aquila.usm.edu/jetde/vol11/iss1/2
This Article is brought to you for free and open access by The Aquila Digital Community. It has been accepted for inclusion in Journal of Educational Technology Development and Exchange (JETDE) by an authorized editor of The Aquila Digital Community. For more information, please contact [email protected].
A Predictive Study of Students’ Self-regulated Learning Skills and Their Roles in A Predictive Study of Students’ Self-regulated Learning Skills and Their Roles in the Social Network Interaction of Online Discussion Board the Social Network Interaction of Online Discussion Board
Authors Authors Cherng-Jyh Yen, Aras Bozkurt, Chih-Hsiung Tu, Laura Sujo-Montes, Claudia Rodas, Hoda Harati, and Adam B. Lockwood
This article is available in Journal of Educational Technology Development and Exchange (JETDE): https://aquila.usm.edu/jetde/vol11/iss1/2

INTRODUCTION
Increase of diversified online learners, educators need to understand how learners
interact; therefore, they can provide more personalized instructions to engage
learners in active social interaction. Digital learning vision suggests that emerging
practices signal the need for more personal, social, and participatory approaches
that support learners in becoming active users and co-creators of learning
resources to control learning processes (Leone, 2013). Online learning from
socio-constructivism and connectivism focuses on engaging learners in active
social network interaction. Frequently, instructors lack of knowledge how online
learners may interact in online instructions. Online learners’ learning skills and
behaviors are challenging for educators to foresee, particularly what skills may be
related to certain social interaction behaviors. Without knowing the relationships,
it is challenging for educators to provide relevant, and more personalized support
to each individual learner.
Online discussion is one of effective learning activities in online
instructions. Research (Klisc et al., 2017) found online discussion engages
learners in critical thinking and more constructive leaner-learner interaction in
addition to learner-content and learner-instructor interactions. Self-regulated
learning skills are identified to be a critical skill to in online learning (Barnard-
Brak et al., 2010). Current online learning research focuses the interaction on
who interact with whom on what (postings). From social learning perspective,
social network analysis (SNA) refines online interaction through understanding
what role each individual plays and what relationships they build in online
learning communication.
Horn and Fisher (2016) inspire research that pushes the understanding
beyond the average learners and instead works to discover predictably effective
paths for each individual. It’s unclear how SRL skills may predict social network
interaction. By predicting digital behavior would help educators to understand
what works for specific learners in specific circumstances. This study empirically investigated the following research question:
How will self-regulated learning skills predict various aspects of students’ role
(i.e., in-degree, out-degree, betweenness centrality, closeness centrality,
eigenvector centrality, reciprocated vertex pair ratio, & PageRank) in the social
network of discussion board within online courses? The research hypotheses
based on the theoretical expectations were that there were positive predictive
relationships SRL skills and various aspects of students’ role in the social
network.

SELF-REGULATED LEARNING (SRL) AND ONLINE DISCUSSIONS
SRL skills are critical success factors to online learning (Barnard-Brak et al.,
2010). “Self-regulated learning is seen as a mechanism to help explain
achievement differences among students and as a means to improve achievement”
(Schunk, 2005, p. 85). Barnard-Brak et al. (2010) concluded that learners who
were equipped with higher SRL skills demonstrated more positive in formal
academic learning outcomes than those who do not present SRL behaviors. In
addition, Chen and Huang (2014) concluded that online learners with higher SRL
skills have better learning performances. Furthermore, Hesterman (2015) argued
that competent SRL skills would lead to positive online learning. Students would
benefit from educational interventions to improve SRL skills (Bambacas et al.,
2013).
SRL refers to those active and initiative behaviors on the part of
individuals to achieve their learning (Woolfolk et al., 2000). These metacognitive
strategies and behaviors include goal setting, environment structuring, task
strategies, time management, help seeking, and self-evaluation (Barnard-Brak, et
al., 2010). Goal setting denotes setting personal learning standards for short and
long-term learning goals while environmental structuring commonly conveys as
how physical and digital environments may result in distraction, efficiency, and
learning. Task strategies indicate few distractions for studying, taking notes,
reading aloud, preparing questions, and pursuing extra work while time
management indicates allocating, scheduling, and distributing time for learning.
Help seeking designates how learner utilize human networks to obtain learning
support whereas self-evaluation employs different self-reflections processes to
ensure their learning meets their needs and goals.
SRL skills are vital to online discussions (Vighnarajah et al., 2009). With
the adoptions of socio-constructivism, online discussions are integrated to bolster
learning engagements (Johnson et al, 2017), critical thinking (Klisc et al., 2017;
Richardson & Ice, 2010), social interaction (Sun et al., 2018), higher-order
thinking (Darabi et al., 2013), cognitive engagement (Zhu, 2006), knowledge and
community building (Schrire, 2006; Tirado et al., 2015), academic achievement
(Msonde, & Van Aalst, 2017). Bai (2012) concluded that SRL facilitates critical
inquiry in online discussions. SRL skills influence how learners may interact in
online discussion (Lee & Lee, 2016). Moreover, engaging students in online
discussions would improve SRL skills (Kramarski, & Mizrachi, 2006).
SOCIAL NETWORK INTERACTION
Applying social network to examine learning interaction in online discussions
provide a more profound understanding in interaction behaviors (Jo et al., 2017;

Tirado et al., 2015). Social Network Analysis (SNA) examining interaction goes
beyond interaction frequency, and numbers and learner-learner interaction,
learner-content interaction, and learner-instructors interaction. It investigates
interaction, clusters/subgroups, social relationships, and social structures via
network, centrality, graph theory in how learners connect, and respond, how
influential, prominent, and prestigious their roles are, and what resources flow
they facilitate. It is a relational analysis. In other words, how network
participants connect, respond receive responses, the roles they function in
networks, how influential, whom they connect to, and who connect to them are
critical evidences. Researchers have applied SNA to examine and to understand
online interaction patterns, social presence, cognitive presence (Wu et al., 2014),
group cohesiveness, and knowledge co-construction (Heo et al., 2010). Based on
SNA results, Kale et al. (2011) found online discussion participants were
adversely influenced by more knowledgeable others while Enriquez (2008)
denoted SNA focuses on relational effects of multiple technical and social
arrangements and engagements that beyond the response relations.
Centrality
Centrality, in SNA, is a measure of the behavior and roles of individual
within a network. It indicates the extent to which individual (vertex) interact with
others in the network (Wasserman & Faust, 1994). SNA includes different
interaction measurements, in-degree, out-degree, betweenness centrality,
closeness centrality, eigenvector centrality, reciprocated vertex pair ratio, and
PageRank. Similar to frequency, in-degree shows the numbers of communication
ones receive while out-degree represents communication they make to others.
Betweenness centrality denotes the extent to which a person (vertex) lies
between others in their network. It is a measure of the potential influence
(Wasserman & Faust, 1994) arising from their position within the network
through both direct and indirect pathways (Friedkin, 1991). People who have
higher betweenness centrality is known as gatekeepers or bridges who can control
the flow of information (Haas, 2009). Therefore, they have more potential to
influence others (Friedkin, 1991) and have more influential power in the network.
Their connections are not based on the frequency but the strategic location in the
network. While betweenness centrality focuses on flow communication and
connection, closeness centrality accentuates on distance communication and
connection.
Closeness centrality is based on the premise that individuals in the
network with the shortest paths to access other members of the network faster.
High closeness centrality is connected to all others through smaller number of
connections (Otte & Rousseau, 2002) and reflects the ease of communication and

distance of resources between the members (Haas, 2009). Higher closeness
centrality is also called broadcaster or transmitter.
Eigenvector centrality is the degree to which a participant is connected to
other active participants. It measures a person’s prominence based on the number
of links it has to other nodes within the network. Those who are tied to more
central individuals would have higher eigenvector centrality and are more
prominent.
Reciprocated vertex pair ratio is ratio between ingoing and outgoing
connections in directed relationships. It is the proportion of vertices that have a
connection returned to them. Higher reciprocated vertex pair ratio denotes a
person engages in more two-way interaction.
PageRank is a way to rank the prestige individuals in network by counting
the number and quality of links to a person to determine a rough estimate of how
important the role one plays in the network. The assumption is based on more
prestigious person are likely to receive more connection from other network
members. It is used to identify more prestigious and authoritative ones in
networks. Bruun and Brewe (2013) found that course grade is correlated with
PageRank.
Social Network Interaction and Discussion Board
SNA has been utilized as an effective tool to understand online discussion
interaction (Sun et al., 2018). Lee and Lee (2016) observed the power of
closeness centrality measurement in SNA over the number of posts in online
discussion activity; and concluded the importance of a relational analysis to
examine interaction in discussion board. In addition, by applying SNA, Sun et al.
(2018) found participants used the online discussion forum resulted in more
communication aimed at knowledge construction, while using the mobile instant-
messaging app resulted in more social interactions. Furthermore, Jo et al. (2017)
concluded in-degree and out-degree centralities in online discussion were able to
predict students’ course final grades.
Besides SNA, Stevens (2016) argued and conclude research examining
online discussion interaction should apply sociograms (social graphs, network
graphs) to examine interaction in online discussion because sociograms provide
teachers a diagnostic dashboard with reference to learning activity, including
discussion posts, logins, or learning objects accessed. Sociograms visualize
complex sets of relationships as graphs of connected symbols and calculate
precise measures of the size, shape, and density of the network as a whole and the
positions of each element within it (Hansen et al., 2011). They serve as visual
illustrations in helping people to explore and understand network structural
characteristics, and to communicate specific information about the network to

others (Huang et al., 2007). Sobieski and Dell'Angelo (2016) found sociograms
reveal the complexity and change nature of relationships among students and
inform classroom-based decision that support teaching and learning. Macfadyen
and Dawson (2010) deployed SNA’ sociograms as a diagnostic tool to identify
students at risk of failure or drop-out. The diagrams generated provided teachers
and students with a ready-made diagnostic tool that could highlight individuals
who might be left out of important learning interactions, or others whose social
position could be beneficial to their peers in the network. Liu and Tsai (2008)
utilized sociograms to identify the network members with different social
interaction behaviors in the network, centralized knowledge exchanging,
distributed knowledge exchanging, impediments based on either limited
individual ability, and partial knowledge exchanging.
In fact, Card et al. (1999) argued that social graphs or InfoViz theoretical
structures include six aspects: Memory and processing capabilities, Information
search paths, Pattern detection, Critical information, Inferences, and Data
manipulations. By examining sociograms, ones may observe critical information
that may be not easy to be observed in SNA results in numbers. Sociograms
examining enables further and deeper insights into teaching and learning
practices. Ones can visualize complex sets of relationships as maps (i.e., graphs or
sociograms) of connected symbols and calculate precise measures of the size,
shape, and density of the network as a whole and the positions of each element
within it.
METHOD
Participants
In 2018, all thirty-three graduate online students (N = 33), enrolled in an upper
graduate level online course, Creating Technology Learning Environment,
participated in the online discussion board and responded to an online survey in a
Southwestern U.S. four-year public university. The majority of them were female
(n = 23, 69.70%), Caucasian (n = 25, 75.76%), and aged 26 years old and older (n
= 32, 96.97%). More detailed demographic information of the participants is
listed in Table 1.
Table 1
Demographic Information of Participants (N = 33)
Variable Frequency Percent
Gender
Female 23 69.70
Male 10 30.30
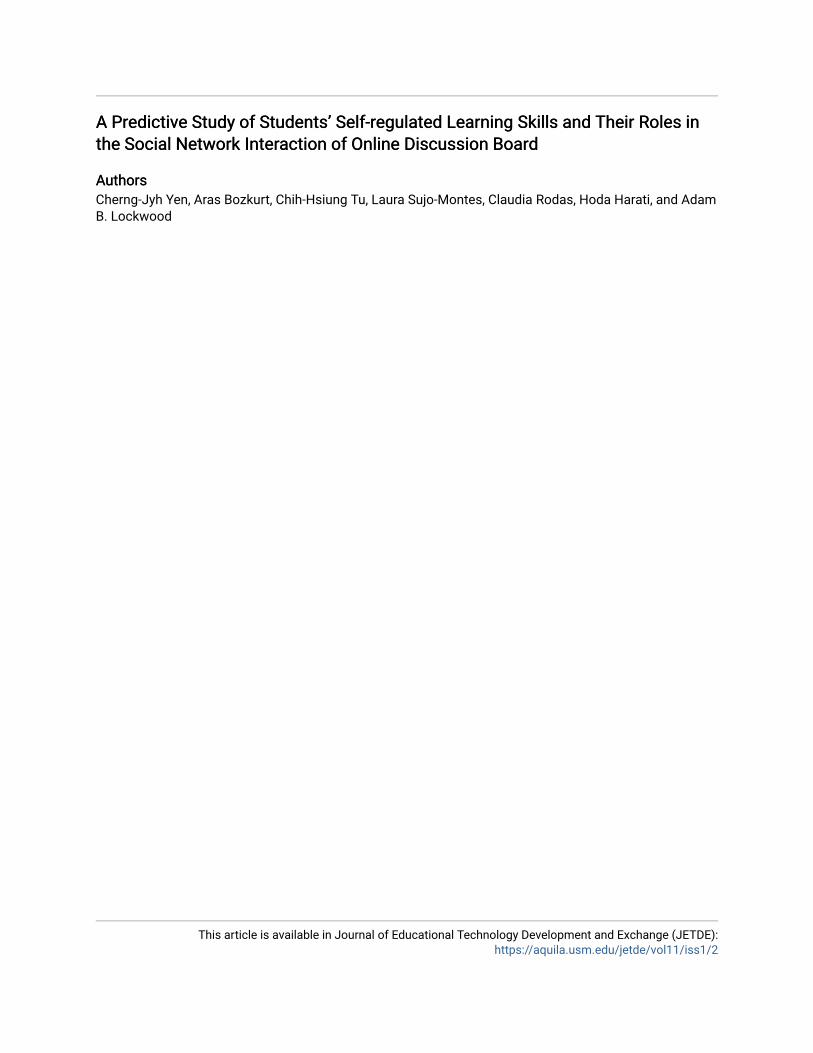
Ethnicity
Caucasian 25 75.76
African American 3 9.09
Latino 3 9.09
Asian and Pacific Islander 2 6.06
Age
18 - 25 1 3.03
26 - 35 9 27.27
36 - 45 12 36.36
45 + 11 33.33
Research Design
The participants partaken in the required and graded online discussion activities
which hosted on Nabble (https://nabble.com/), an online discussion platform.
They were required to respond to the discussion questions posted by the instructor
and required to respond to others’ postings to engage in learner-learner
interaction. The instructor participated and facilitated the online discussion
throughout the two-week discussion period.
Measurement of Research Variables
Predictor variables. The online survey was revised from the Online Self-
Regulated Learning Questionnaire (OLSQ) (Barnard-Brak et al., 2010) to
measure students’ self-regulated learning skills. In specific, self-regulated
learning skills of the students were measured by the total scores of accumulated
from all 40 items (see Table 2) on a 7-point Likert scale with 1 as strongly
disagree and 7 as strongly agree. The participants completed the questionnaire in
the first week of eight-week online instructions. In the validation study by
Barnard-Brak et al, (2010), the Cronbach alpha coefficient was .92 and supported
the internal consistency of the survey items. In light of the exploratory nature of
the current study, the overall scores of self-regulated skills instead of the subscale
scores were used as the predictor for various social network interaction scores.
Table 2
Online Survey Items of the Predictor Variable
Variable Survey item
Goal setting
I set standards for my assignment in online course.
I set short-term (daily or weekly) goals as well as long term goals (monthly or for
the semester).

I keep a high standard for my learning in my online courses.
I set goals to help me manage studying time for my online courses.
I don't compromise the quality of my work because it is online.
I set goals for my formal learning.
I set goals for my informal learning.
I apply online technologies to support goals.
I constantly search, evaluate, select, and reselect online technologies to reflect my
current goals.
Environment structuring
I choose the location where I study to avoid too much distraction.
I find a comfortable place to study.
I know where I can study most efficiently for online courses.
I choose a time with few distractions for studying for my online courses.
I use mobile devices (smartphones, tablets, etc.) to help me to study.
Task strategies
I try to take more thorough notes for my online courses because notes are even
more important for learning online than in a regular classroom.
I read aloud instructional materials posted online to fight against distractions.
I prepare my questions before joining in the chat room and discussions.
I work extra problems in my online courses in addition to the assigned ones to
master the course content.
I build "people network" online to help me to learn.
I build "resources network" online to help me to learn.
I build and connect "tools/technologies network" online to help me to learn.
I manage online tools and technologies regularly to help me to learn.
I use online technologies to collaborate with others to help me to learn.
Time management
I allocate extra studying time for my online courses because I know it is time-
demanding.
I try to schedule the same time every day or every week to study for my online
courses, and I observe the schedule.
Although we don't have to attend daily classes, I still try to distribute my studying
time evenly across days.
I frequently allocate small chunks of time to engage in just-in-case, just-in-time,
and bite size learning.
I frequently allocate substantial chunks of time to engage in learning.
Help seeking

I find someone who is knowledge in course content so that I can consult with him
or her.
I share my problems with my classmates online so we know what we are
struggling with and how to solve our problems.
If needed, I try to meet my classmates face-to-face.
I am persistent in getting help from the instructor through e-mail.
I am persistent in getting help by using different devices (computers, mobile
devices).
I am persistent in getting help by using different technologies (Twitter, social
networks, etc.).
Self-evaluation
I summarize my learning in online courses to examine my understanding of what
I have learned.
I ask myself a lot of questions about the course materials when studying for an
online course.
I communicate with my classmates to find out how I am doing in my online
classes.
I communicate with classmates to find out what I am learning that is different
from what they are learning.
I use different technologies to reflect my online learning, such as online portfolio,
personal blogs, Twitter, social media, etc.
I re-evaluate online tools and technologies that I used for my online learning after
each online course I took.
__________________________________________________________________
Criterion variables. Criterion variables: Role in social network of
online discussion board. Learners’ network interactions was collected and
analyzed through Social Network Analysis (SNA). SNA provided both
quantitative (local and global metrics) and qualitative data (sociograms/network
graphs). Local metrics (for vertex and edges) and global metrics (for overall
network structure) were calculated. Based on these metrics, network graphs were
created to have visual bird-eye views of the network.
The criterion variables were various measures of participants’ roles in the
social network of an online discussion board: (1) In-degree, (2) out-degree, (3)
betweenness centrality, (4) closeness centrality, (5) eigenvector centrality, (6)
reciprocated vertex pair ratio, and (7) PageRank. In the actual regression
analyses, each of them was used as the criterion variable (i.e., the dependent
variable) to be predicted by the total self-regulated skill scores of the students.
They were generated with the social network analysis software of NodeXL
(Aldhous, 2012; Smith et al., 2009) and store in an Excel file. Then the Excel file

was converted into the SPSS data file for the subsequent regression analyses. Due
to the nature of threaded discussion board, standard Reply network were
integrated since the participants were required to reply to each other after replying
to the discussion questions. Due to the nature of online discussion, one type of
vertex (learner) was utilized as single-mode or unimodal network (person-to-
person) data analysis. All 33 participants’ and the instructor’s postings were
coded as directed and weighted edges into NodeXL Pro. Post-and-reply threaded
message structure was analyzed. For example, if A replies to B, it is counted as
one directed edge between from Vertex A to Vertex B. Vertex A is counted with
1 out-degree while Vertex B is counted with 1 in-degree. If one replies to the
same participant multiple times, a stronger weighted ties or edges is created
(Hansen et al., 2011). The instructor initiated the discussion topics first and the
learners replied to them. In addition, the learners were required to reply each
other.
Data Analysis
All the data analyses of the current study were implemented with the IBM SPSS
Statistics 24.
Linear regression analyses. Linear regression analyses (Cohen et al.,
2003; Norusis, 2012) were conducted to assess the predictive relationship
between the predictor variable and each of the seven criterion variables, one at a
time.
Assumption checking. The assumptions of normality and homogeneity of
variances in linear regression analyses were assessed with the normal q-q plots
and the scatterplots of standardized residuals (Cohen et al., 2003; Norusis, 2012).
Significance test. The F test of the R2 (Cohen et al., 2003; Norusis, 2012)
was conducted to assess the predictive utility of the predictor (i.e., self-regulated
learning skills) for each criterion variable related to various aspects of role in
social network of online discussion board. The alpha level in all the F tests was
set at .05.
Effect size index. In each simple regression model, the R2 (Cohen et al.,
2003; Norusis, 2012) was computed to estimate the proportion of variance in a
criterion variable predictable by the predictor variable.
RESULTS
Social Network Analysis
The online discussion network was examined in terms of network metrics (Table
5). Visualize network in directed network sociograms (see Figure 1-5) were

created using the Harel-Koren Fast Multiscale layout algorithm (Harel and Koren,
2001) because it was relevant to analyze vertices’ relationships in threaded
discussion network (Hansen et al., 2010). Based on SNA results, the discussion
network was considered as highly interactive. The network is composed of 33
learners and 1 instructor (vertices) and 487 interactions (directed edges).
Maximum geodesic distance was 2.00 while average geodesic distance was 1.63.
According to Milgram’s experiment (1967), people in a network can be reached
from every other person in 6 steps. The studied discussion network provided an
ideal network learning space.
Table 5:
Social Network Metrics
Global Network Metrics Values
Graph Type Directed
Vertices 34
Unique Edges 208
Edges with Duplicates 279
Total Edges 487
Self-Loops 50
Reciprocated Vertex Pair Ratio 0.47
Reciprocated Edge Ratio 0.64
Maximum Geodesic Distance (Diameter) 2
Average Geodesic Distance 1.63
Graph Density 0.24

Figure 1. Vertex color-size & position based on betweenness centrality
Figure 2. Vertex color-size & position based on closeness centrality.

Figure 3. Clustered network based on closeness centrality.
Figure 4. Eigenvector centrality based on the vertex colors & size.

Figure 5. Vertex color-size and position based on PageRank centrality
The graph density value, which is the ratio of the observed number of ties
divided by the maximum possible ties and might range between 0 and 1, was
found 0.24. These dense networks are often communities of people who are aware
of one another, and converse, communicate and interact often. Theoretically, if
the number of the individuals are less, it is easy to get a high score. However,
considering the length of the 8-week instruction period, the discussion network
was considered as interactive. Reciprocated vertex pair ratio was found 0.47 while
reciprocated edge ratio was found 0.64, which is considered as high and further
supports highly two-way interactivity level.
Based on betweenness centrality and closeness centrality (see Figure 1 &
2), related tight crowd community structures were characterized by highly
interconnected people with few isolated participants.
Participants in the network have strong connections to one another and
significant connections that bridge between any sub-networks. To better see the
interaction pattern, the vertices was grouped by using the Clauset-Newman-
Moore cluster algorithm (Clauset et al., 2004) and visualized in a network graph
(see Figure 3). Participants with higher betweenness centrality connect and fuse
different sub-networks. Based on community structure classification (Smith et

al., 2014), the network demonstrated a connected and unified tight crowd
community structure.
Descriptive Statistics of the Research Variables
The descriptive statistics of the research variables are listed in Table 3.
Table 3
Descriptive Statistics of the Research Variables (N = 33)
Variable
M Mdn SD Min. Max.
Self-regulated learning skills 226.15 231.00 30.45 162.00 280.00
Role in social network
In-degree 8.06 7.00 5.87 .00 32.00
Out-degree 7.88 6.00 5.33 2.00 23.00
Betweenness centrality 20.44 7.52 47.75 .00 264.90
Closeness centrality .02 .02 .003 .02 .03
Eigenvector centrality .03 .03 .01 .008 .07
Reciprocated vertex pair ratio 45 .40 .26 .00 1.00
PageRank .97 .83 .51 .30 2.81
Note. Self-regulated learning skills were measured with 40 questionnaire items on
a 7-point Likert scale.
Linear Regression Analyses
Self-regulated learning skills was the predictor in all linear regression models in
the current study. The relevant statistics from linear regression analyses are listed
in Table 4. The normal q-q plots and the scatterplots of standardized residuals did
not suggest severe violations of the normality assumption and homogeneity of
variances assumption.
Table 4
Seven Simple Regression Models with Self-regulated Learning Skills as the
Predictor Variable (N = 33)
Criterion variable
F df1 df2 R2 B
In-degree 3.81 1 31 .11 .06
Out-degree 3.72 1 31 .11 .06

Betweenness centrality 4.55* 1 31 .13 .56
Closeness centrality 4.35* 1 31 .12 <.01
Eigenvector centrality 3.19 1 31 .09 <.01
Reciprocated vertex pair ratio .29 1 31 .01 <.01
PageRank 3.97 1 31 .11 .01
Note. F = F test statistic; df1 = regression degrees of freedom; df2 = residual
degrees of freedom; R2 = squared multiple correlation coefficient; B =
unstandardized regression coefficient. *p < .05
In-degree as the criterion variable. The results did not support the
predictive utility of self-regulated learning skills for in-degree in online social
network, F(1, 31) = 3.81, p > .05, R2 = .11. In light of the size of R2 close to the
cutoff of a medium R2 as .13 (Cohen, 1988) and the actual sample size in the
current study, a post hoc power analysis was implemented with the GPower 3
program (Faul et al., 2007). As a result, the observed statistical power level was
.50 and lower than the optimal .80 level (Cohen, 1988). Therefore, future studies
with larger sample sizes may be advisable to further investigate the predictive
utility of self-regulated learning skills for in-degree in online social network. In
this particular sample, 11% of variance in in-degree was predictable by self-
regulated learning skills.
Out-degree as the criterion variable. A predictive relationship between
self-regulated learning skills and out-degree in online social network was not
suggested by the results, F(1, 31) = 3.72, p > .05, R2 = .11. According to the post
hoc power analysis with the GPower 3 program (Faul et al., 2007), the observed
statistical power level (i.e., .50) was lower than the optimal .80 level (Cohen,
1988) and rendered the future studies using larger sample sizes advisable. About
11% of variance in in-degree was predictable by self-regulated learning skills
based on the value of R2.
Betweenness centrality as the criterion variable. The predictive utility
of self-regulated learning skills for betweenness centrality in online social
network was supported by the results, F(1, 31) = 4.55, p < .05, R2 = .13. The
positive regression coefficient of self-regulated learning skills also suggested a
positive predictive relationship between self-regulated learning skills and
betweenness centrality. As a result, students with higher self-regulated learning
skills were predicted to have higher betweenness centrality in online social
network relative to the ones with lower self-regulated learning skills. The size of
R2 indicated a predictive relationship of medium strength (Cohen, 1988) and a
13% of variance betweenness centrality predictable by self-regulated learning
skills.
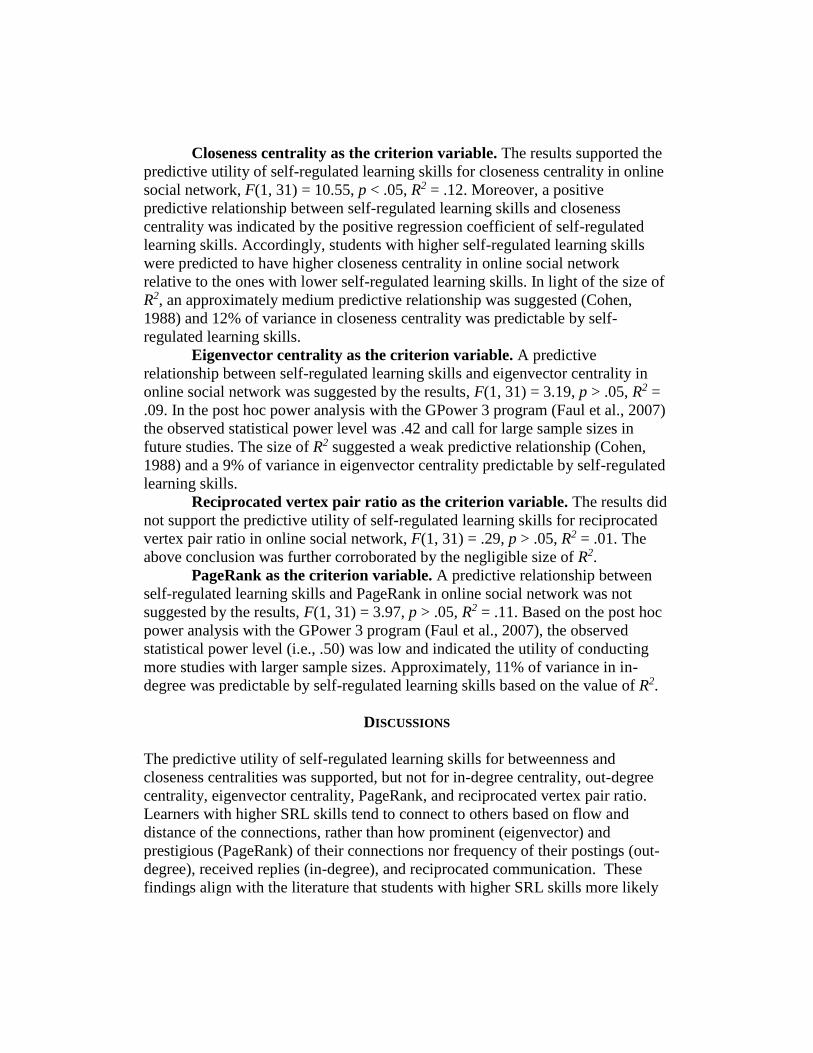
Closeness centrality as the criterion variable. The results supported the
predictive utility of self-regulated learning skills for closeness centrality in online
social network, F(1, 31) = 10.55, p < .05, R2 = .12. Moreover, a positive
predictive relationship between self-regulated learning skills and closeness
centrality was indicated by the positive regression coefficient of self-regulated
learning skills. Accordingly, students with higher self-regulated learning skills
were predicted to have higher closeness centrality in online social network
relative to the ones with lower self-regulated learning skills. In light of the size of
R2, an approximately medium predictive relationship was suggested (Cohen,
1988) and 12% of variance in closeness centrality was predictable by self-
regulated learning skills.
Eigenvector centrality as the criterion variable. A predictive
relationship between self-regulated learning skills and eigenvector centrality in
online social network was suggested by the results, F(1, 31) = 3.19, p > .05, R2 =
.09. In the post hoc power analysis with the GPower 3 program (Faul et al., 2007)
the observed statistical power level was .42 and call for large sample sizes in
future studies. The size of R2 suggested a weak predictive relationship (Cohen,
1988) and a 9% of variance in eigenvector centrality predictable by self-regulated
learning skills.
Reciprocated vertex pair ratio as the criterion variable. The results did
not support the predictive utility of self-regulated learning skills for reciprocated
vertex pair ratio in online social network, F(1, 31) = .29, p > .05, R2 = .01. The
above conclusion was further corroborated by the negligible size of R2.
PageRank as the criterion variable. A predictive relationship between
self-regulated learning skills and PageRank in online social network was not
suggested by the results, F(1, 31) = 3.97, p > .05, R2 = .11. Based on the post hoc
power analysis with the GPower 3 program (Faul et al., 2007), the observed
statistical power level (i.e., .50) was low and indicated the utility of conducting
more studies with larger sample sizes. Approximately, 11% of variance in in-
degree was predictable by self-regulated learning skills based on the value of R2.
DISCUSSIONS
The predictive utility of self-regulated learning skills for betweenness and
closeness centralities was supported, but not for in-degree centrality, out-degree
centrality, eigenvector centrality, PageRank, and reciprocated vertex pair ratio.
Learners with higher SRL skills tend to connect to others based on flow and
distance of the connections, rather than how prominent (eigenvector) and
prestigious (PageRank) of their connections nor frequency of their postings (out-
degree), received replies (in-degree), and reciprocated communication. These
findings align with the literature that students with higher SRL skills more likely

to apply metacognitive strategies, goal setting, environment structuring, task
strategies, time management, help seeking, and self-evaluation (Barnard-Brak et
al., 2010), and engage in active and initiative learning behaviors. Additionally,
learners with greater SRL skills play more influential and collaborative roles in
online discussion network. They, called as social connectors, tend to hold and
tighten network to facilitate social interaction. They bridge different sub-groups
and their removal from the network may have consequences to holding network
together as a whole. This denotes that learners with higher SRL skills play a more
facilitating roles focusing on communication dynamics between/among each
individual learners and sub-groups in the discussion network. However, they are
not necessary perceived as significant authority figures. The characteristics of the
discussion network tend to exhibit more supportive and collaborative posting
behaviors, and more connections to individuals in sharing information. Current
literature showed that SRL skills are related each individual’s metacognitive
strategies, and behaviors, and positive learning outcomes, performance, and
achievements. This study discerns higher SRL skills would lead to more social,
interactive, connecting, and facilitating behaviors. In other words, students with
higher SRL skills not just learn for themselves, they learn for and with the
network community. They are community learners.
Influential Roles
From betweenness centrality perspective, learner with higher SRL skills present
as bridges or gatekeepers and are located in strategic positions (see Figure 1) to
actively facilitate and influence what information flows through the networks.
They reflect the ease of communication and flow of resources between and among
the learners. In addition, they function and fuse others and warrant learning
resources flow effectively and efficiently. Furthermore, learners with higher SRL
skills function as bridges among other sub-networks or clusters in the network
(see Figure 3). They are the gatekeepers among the sub-networks; therefore, they
situate as central roles in the network. Students with higher SRL skills likely set
learning goals for the community, structure their learning environments within the
discussion network, and apply learning strategies for communal. Interestingly,
lower SRL skills associated with lower betweenness centrality more likely
clusters with the instructor to form group cohesion. These learners likely value
the interaction between them and the instructor higher than with peers. They see
the instructor is main information provider rather than learning from peers. This
group cohesive (Forsyth, 2010) with the instructor is based on the task relation
since the discussion activity was required and graded. Additionally, lower SRL
skills learners have the needs for cognitive closure (NFCC) (Kruglanski &

Webster, 1996) in their network learning since they may see online discussion as
question and answer activities between them and the instructor.
While higher betweenness centrality controls the flow of communication,
higher closeness centrality maneuvers the distance of communication. Closeness
centrality is a measure of how long it will take information to spread from a given
individual to all others in the network. Learners with higher closeness centrality
incline to interact with different participants rather than more prestige or more
interactive ones. This finding did not align with Lee and Lee’s (2016) findings
that concluded SRL level did not correlated with closeness centrality. These
learners with higher SRL skills tend to manage their time efficiently to access
learning resources, to structure their learning environments, and to obtain help
and supports online. In addition, they are more likely constantly to reflect the
efficiency of their learning environment structuring and time management in help
or support seeking to ensure positive interaction experiences. They can be seen as
transmitters or community learners because of their influential roles in
distributing information in the network. This could be explained SRL skills
cannot predict eigenvector centrality. In other words, learners with higher SRL
skills are more likely to engaged in distributed knowledge exchange (shared
exchange) rather than centralized knowledge exchange (single expert responder).
Connection Strategic
Although SRL skills cannot predict in-degree, out-degree, eigenvector centrality,
PageRank, and reciprocated vertex pair ratio, it should be noted this reflects the
characteristics of the network. Generally, in-degree, our-degree, betweenness,
and closeness centralities positively correlated (Valente et al., 2008; Valente &
Forman, 1998). When they are not or low correlated, likely it signifies unique
characteristics about the network. Although learners with higher SRL skills tend
to influence the flow communication and distance communication, their
interaction is not necessary based on the frequency of their connections in the
discussion board. In other words, they connect strategically in the network. Their
connections are more crucial to the network flow and tend to tie to more social
and active network members. Learners with lower SRL skills tend to make
redundant connection and network crucial communication likely bypass them. In
addition, they are embedded in cluster or sub-groups that is distant from the reset
of network, particularly the more influential ones. This could be explained as
they incline to learn for themselves, not necessary for the community. It should
be noted that the learners with lower SRL skills demonstrated lower in-degree and
out-degree. They are prone to meet the basic discussion requirements, respond to
the discussion questions and reply to others, to earn satisfactory grade.

Nurturing vs. Authority
Eigenvector centrality and PageRank concern the quality of connections. One
with higher scores tend to discern to connect more prominent (eigenvector
centrality) learners and more prestige (PageRank). Eigenvector centrality
provides a measure that incorporates both the number and quality of the
connections an individual actor has formed. Establishing relationships to highly
connected people in the network will provide greater access to resources than less
connected peers (Newman, 2010). Learners with higher SRL skills did not have
higher eigenvector centrality. It indicates they are not necessary to connect to
more prominent learners. They incline to connect to disparate parts of the
network based on flow (betweenness) and distance (closeness) of communication,
rather than to connect to more prominent ones.
SRL skills did not predict PageRank. PageRank factors in directionality
and connection weight; therefore, one with higher PageRank is considered as
prestigious or holding authority. In other words, one with higher SRL skills does
not demonstrate higher prestigious or authority. Although Zhu (2006) found SRL
is related cognitive engagement, the participants in this study likely were drawn
more to social connection rather than cognitive engagement. Learners with higher
SRL skills did not necessary receive higher incoming posts or connections (in-
degree) from highly influential ones. Network learners do not necessary to
recognize learners with SRL skill as more prestigious, particular as information
authority community members.
SRL skills cannot predict reciprocated vertex pair ratio. It signifies higher
SRL learners did not necessary engage in two-way communication with the same
discussion participants. While Sun et al. (2018) observed higher SRL is resulted
in higher social interaction in online discussion activity, the participants in this
study built their network in a broader sense, one-many or many-many interaction,
rather than two-way one-to-one interaction. This implies learners with higher SRL
skills may not necessary engage in two-way connection, rather than more
facilitating network communications as a whole.
Roles
The literature may suggest that learners with higher SRL skills should
demonstrate and behave actively in all social network roles. Based on the main
findings of this study, one question raised. Is it necessary for all learners to
pursue influential, prominent, and prestigious roles in social interaction in order to
ensure effective learning? In fact, a healthy and effective learning community
may be composed by different social network roles. This study concludes
learners with higher SRL skills tend to connect to others based on flow and

distance of the connections, rather than how prominent (eigenvector) and
prestigious (PageRank) of connections. Each individual learner has his/her own
learning goals and their own preferences to learn effectively; therefore, each
learner should be encouraged to identify ideal roles to play in network. Namely,
if learners with higher SRL skills, they will have wider ability and capability to
select and play their ideal social role in learning community. From educator’s
perspective, it is critical for instructors and instructional designers to understand
each individual learner’s ideal goals and roles and provide personalized support to
assist them prior the instructions and just-in-time supports. Effective online
instructions should empower learners to personalize and customize their learning
process. By knowing their SRL skills prior to the online instructions would help
instructors and instructional designers to be better prepared to provide the
personalized instructions and support.
Limitations
The limitations of this study should be noted in the online threaded discussion
natures of this study. Social network analysis is based on relational relationships
among learners and instructors. This study was conducted in a discussion
community that the instructor facilitated the required and graded online
discussions. Each online discussion instruction has unique characteristics that
may prompt learners’ different interaction behaviors and different network roles.
Learners may perceive and act differently with or without instructors’ presences.
This study examined social network interaction based on online threaded
discussions. Social network interaction is not limited to online threaded
discussions. Other interaction activities, such as e-mail, listserv, blogs, chat,
SMS, social network sites (Facebook, Twitter, Instagram etc.), are relevant to
social network interaction as well.
This study solely examined single-mode network (person-to-person).
Social network analysis and SRL skills could be examined from the aspects of
bimodal or multimodal networks. Besides learners as vertex or node, learners’
demographics, each individual discussion thread/topics, different online
discussion platforms (discussion board, blogs, social network sites etc.), or
different discussion affiliations/groups can be applied for bimodal or multimodal
networks to understand interaction behaviors.
Implications for Future Research
This study only examined social network roles in a single timepoint. The future
study should examine learners’ social network behaviors from temporal to
observe how learners’ social roles progress within three phases (forethought,

performance, and self-reflection) of SRL (Zimmerman, 2002). By examining
social interaction changed over time would help researchers to understand how
learners’ social network roles evolve throughout discussion activities, courses, or
educational program etc.
In addition, future studies should examine and cross-examine other
predictor variables, Community of Inquiry (teaching presence, cognitive presence,
and online social presence), network social presence, mobile social presence, and
online collaboration skills on different social network channels and platforms.
Furthermore, by examining and cross-examining these predictor variables would
help educators to understand how online community may progress in learning
network. These further researches would guide educators for facilitating change,
different approaches of participatory network mapping have proven useful.
CONCLUSIONS
This study observed the importance of SRL skills in predicting learners’ digital
social interaction behaviors. It enables further and deeper insights into online
teaching and learning practice. The results assist educators to provide
personalized guidance and support learners to navigate through online
discussions. By understanding how SRL skills related to social interaction roles
learners play would assist instructors to recognize each individual learner’s needs
and to provide personalized support. In addition, it would support instructors to
nurture and to balance healthy and dynamic learning networks for the learning
community. The findings help educators to prepare for network change,
understand the effects of prior decisions and instructional activities, and cultivate
crucial social and network relationships. In conjoining adaptive learning system
with evidence-centered instruction, data-driven instructions, data-informed
instructions, while real-time and contingency social network interaction data are
collected, just-in-time personalization guidance could be delivered at any point in
discussion activities. SNA sociograms and contingency graphs (Suther et al.,
2010) can be deployed across a temporal axis and annotated to show direction of
communication, connection, media, and collaborators. In addition, SNA results
and sociogram should not be limited to teachers only. They can be used by
academic staff to observe or give feedback, and by students to assist with self-
monitoring. Students can reflect on their learning based on provided SNA
information and sociograms that indicated their levels of social, cognitive, and
behavioral engagements. In addition, students and teachers can communicate
each other based on these presented to enhance and justify their learning and
teaching throughout the period of social interaction. With applicable SNA data
and graphic elicitation (Crilly et al., 2006), both teachers and students can achieve
effective data-informed instructions and data-driven instructions.

REFERENCES
Aldhous, P. (2012). NodeXL for network analysis. Presented at the NICAR 2012,
St Louis, MO. Retrieved from
http://www.peteraldhous.com/CAR/NodeXL_CAR2012.pdf
Bai, H. (2012). Students’ use of self-regulatory tool and critical inquiry in online
discussions. Journal of Interactive Learning Research, 23(3), 209–225.
Bambacas, M., Sanderson, G., Feast, V., & Yang, S. (2013). Understanding
transnational MBA students’ instructional communication preferences.
Journal of International Education in Business, 1(1), 15–28.
Barnard-Brak, L., Lan, W. Y., & Paton, V. O. (2010). Profiles in self-regulated
learning in the online learning environment. The International Review of
Research in Open and Distance Learning, 11(1). Retrieved from
http://www.irrodl.org/index.php/irrodl/article/view/769/1480
Bruun, J., & Brewe, E. (2013). Talking and learning physics: Predicting future
grades from network measures and Force Concept Inventory pretest
scores. Physical Review Special Topics - Physics Education Research,
9(2), 020109-1-020109-13.
Card, S. K., Mackinlay, J. D., & Shneiderman, B. (1999). Readings in information
visualization: Using vision to think. San Francisco, CA: Morgan
Kaufmann.
Chen, C.-M., & Huang, S.-H. (2014). Web-based reading annotation system with
an attention-based self-regulated learning mechanism for promoting
reading performance. British Journal of Educational Technology, 45(5),
959–980.
Clauset, A., Newman, M. E., & Moore, C. (2004). Finding community structure
in very large networks. Physical Review E, 70(6), 066111.
Cohen, J. (1988). Statistical power analysis for the behavioral sciences (2nd ed.).
Mahwah, NJ: Lawrence Erlbaum.
Cohen, J., Cohen, P., West, S. G., & Aiken, L. S. (2003). Applied multiple
regression/correlation analysis for the behavioral sciences (3rd ed.).
Mahwah, NJ: Lawrence Erlbaum.
Crilly, N., Blackwell, A. F., & Clarkson, P. J. (2006). Graphic elicitation: using
research diagrams as interview stimuli. Qualitative Research, 6(3), 341–
366.
Darabi, A., Liang, X., Suryavanshi, R., & Yurekli, H. (2013). Effectiveness of
online discussion strategies: A meta-analysis. American Journal of
Distance Education, 27(4), 228–241.
Enriquez, J. G. (2008). Translating networked learning: Un-tying relational ties.
Journal of Computer Assisted Learning, 24(2), 116–127.
Faul, F., Erdfelder, E., Lang, A.-G., & Buchner, A. (2007). G*Power 3: A flexible
statistical power analysis program for the social, behavioral, and
biomedical sciences. Behavior Research Methods, 39(2), 175–191.
Forsyth, D. R. (2010). Group dynamics (5th ed.). Belmont, CA:
Wadsworth/Cengage.
Freidkin. (1991). Theoretical foundations for centrality measures. The American
Journal of Sociology, 96(6), 1478–1504.
Haas, M. (2009). Social network theory and analysis: A preliminary exploration
(CHERE Working Paper). Sydney: University of Technology, Centre for
Health Economics Research and Evaluation.
Hansen, D. L., Shneiderman, B., & Smith, M. (2010). Visualizing threaded
conversation networks: Mining message boards and email lists for
actionable insights. In A., Lingras P., Petty S., Huang R. (eds.) Active
Media Technology. (pp. 47–62). Berlin, Heidelberg, Germany: Springer.
— and — (2011). Analyzing social media networks with NodeXL. Burlington,
MA: Elsevier.
Harel, D., & Koren, Y. (2001). A fast multi-scale method for drawing large
graphs. In Graph Drawing: Proceedings (No. 1984). (p. 183). Colonial
Williamsburg, VA, USA: Springer Science & Business Media.
Heo, H., Lim, K. Y., & Kim, Y. (2010). Exploratory study on the patterns of
online interaction and knowledge co-construction in project-based
learning. Computers & Education, 55(3), 1383–1392.
Hesterman, D. (2015). UWA ECM Report on intensive mode delivery in
engineering, computer science and mathematics. Retrieved June 25, 2016,
from
http://www.ecm.uwa.edu.au/__data/assets/pdf_file/0009/2700846/Hesterm
an-2015-UWA-ECM-Report-on-intensive-mode-delivery.pdf
Horn, M. B., & Fisher, J. F. (2016). A blueprint for breakthroughs: Federally
funded education research in 2016 and beyond. Clayton Christensen
Institute for Disruptive Innovation. Retrieved from
https://www.christenseninstitute.org/wp-content/uploads/2016/05/A-
blueprint-for-breakthroughs.pdf
Huang, W., Hong, S.-H., & Eades, P. (2007). Effects of sociogram drawing
conventions and edge crossings in social network visualization. Journal of
Graph Algorithms and Applications, 11(2), 397–429.
Jo, I., Park, Y., & Lee, H. (2017). Three interaction patterns on asynchronous
online discussion behaviours: A methodological comparison. Journal of
Computer Assisted Learning, 33(2), 106–122.
Johnson, C., Hill, L., Lock, J., Altowairiki, N., Ostrowski, C., da Rosa dos Santos,
L., & Liu, Y. (2017). Using design-based research to develop meaningful
online discussions in undergraduate field experience courses. International
Review of Research in Open and Distributed Learning, 18(6), 36–53.
Kale, U., Brush, T., Bryant, A., & Saye, J. (2011). Online communication patterns
of teachers. Journal of Interactive Learning Research, 22(4), 491–522.
Klisc, C., McGill, T., & Hobbs, V. (2017). Use of a post-asynchronous online
discussion assessment to enhance student critical thinking. Australasian
Journal of Educational Technology, 33(5), 63–76.
Kramarski, B. (2006). Online discussion and self-regulated learning: Effects of
instructional methods on mathematical literacy. Journal of Educational
Research, 99(4), 218–230.
Kruglanski, A. W., & Webster, D. M. (1996). Motivated closing of the mind:
“Seizing” and “freezing.” Psychological Review, 103(2), 263–283.
Lee, H. Y., & Lee, H. W. (2016). Comparing social network analysis of posts
with counting of posts as a measurement of learners’ participation in
Facebook discussions. Turkish Online Journal of Educational Technology,
15(1), 11–19.
Leone, S. (2013). Characterisation of a personal learning environment as a
lifelong learning tool. New York: Springer Publishing Company.
Liu, P., & Tsai, C. (2008). Using analytic network process to construct evaluation
indicators of knowledge sharing effectiveness in Taiwan’s high‐tech
industries. Asian Journal on Quality, 9(2), 99–117.
Macfadyen, L. P., & Dawson, S. (2010). Mining LMS data to develop an “early
warning system” for educators: A proof of concept. Computers &
Education, 54(2), 588–599.
Milgram, S. (1967). The small world problem. Psychology today, 2(1), 60–67.
Msonde, S. E., & Van Aalst, J. (2017). Designing for interaction, thinking and
academic achievement in a Tanzanian undergraduate chemistry course.
Educational Technology Research and Development, 65(5), 1389–1413.
Newman, M. E. J. (2010). Mathematics of networks: An introduction to the
mathematical tools used in the study of networks, tools that will be
important to many subsequent developments. In M. E. J. Newman,
Networks: An introduction. Oxford, UK: Oxford University Press.
Norusis, M. J. (2012). IBM SPSS statistics 19 statistical procedures companion.
Upper Saddle River, NJ: Prentice Hall.
Otte, E., & Rousseau, R. (2002). Social network analysis: A powerful strategy,
also for the information sciences. Journal of Information Science, 28(6),
441–453.
Richardson, J. C., & Ice, P. (2010). Investigating students’ level of critical
thinking across instructional strategies in online discussions. Internet and
Higher Education, 13, 52–59.

Schrire, S. (2006). Knowledge building in asynchronous discussion groups: Going
beyond quantitative analysis. Computers and Education, 46(1), 49–70.
Schunk, D. H. (2005). Self-regulated learning: The educational legacy of Paul R.
Pintrich. Educational Psychologist, 40(2), 85–94.
Smith, M., Rainie, L., Shneiderman, B., & Himelboim, I. (2014). Mapping
Twitter topic networks: From polarized crowds to community clusters.
Retrieved from http://www.pewinternet.org/2014/02/20/mapping-twitter-
topic-networks-from-polarized-crowds-to-community-clusters/
Smith, M.A., Shneiderman, B., Milic-Frayling, N., Rodrigues, E. M., Barash, V.,
Dunne, C., … Perer, A.,. (2009). Analyzing (social media) networks with
NodeXL. Retrieved from http://hcil2.cs.umd.edu/trs/2009-11/2009-11.pdf
Sobieski, C., & Dell’Angelo, T. (2016). Sociograms as a tool for teaching and
learning: Discoveries from a teacher research study. Educational Forum,
80(4), 417–429.
Stevens, T. L. (2016). I “see” what you are saying: The analytical work of
diagrams in online discussions. Australasian Journal of Educational
Technology, 32(4), 50–67.
Sun, Z., Lin, C.-H., Wu, M., Zhou, J., & Luo, L. (2018). A tale of two
communication tools: Discussion-forum and mobile instant-messaging
apps in collaborative learning. British Journal of Educational Technology,
49(2), 248–261. https://doi.org/10.1111/bjet.12571
Suthers, D. D., Dwyer, N., Medina, R., & Vatrapu, R. (2010). A framework for
conceptualizing, representing, and analyzing distributed interaction.
International Journal of Computer-Supported Collaborative Learning,
5(1), 5–42.
Tirado, R., Hernando, Á., & Aguaded, J. I. (2015). The effect of centralization
and cohesion on the social construction of knowledge in discussion
forums. Interactive Learning Environments, 23(3), 293–316.
Valente, T. W., Coronges, K., Lakon, C., & Costenbader, E. (2008). How
correlated are network centrality measures? Connections (Toronto, Ont.),
28(1), 16–26.
Valente, T. W., & Foreman, R. K. (1998). Integration and radiality: Measuring the
extent of an individual’s connectedness and reachability in a network.
Social Networks, 20(1), 89–105.
Vighnarajah, Wong, S. L., & Abu Bakar, K. (2009). Qualitative findings of
students’ perception on practice of self-regulated strategies in online
community discussion. Computers & Education, 53(1), 94–103.
Wasserman, S., & Galaskiewicz, J. (1994). Advances in social network analysis:
Research in the social and behavioral sciences. Thousand Oaks, CA:
Sage.

Woolfolk, A. E., Winne, P. H., & Perry, N. E. (2000). Educational psychology.
Scaborough, Ontario, Canada: Allyn and Bacon.
Wu, H., Gao, J., & Zhang, W. (2014). Chinese EFL teachers’ social interaction
and socio-cognitive presence in synchronous computer-mediated
communication. Language Learning & Technology, 18(3), 228–254.
Zhu, E. (2006). Interaction and cognitive engagement: An analysis of four
asynchronous online discussions. Instructional Science: An International
Journal of Learning and Cognition, 34(6), 451–480.
Zimmerman, B. J. (2002). Becoming a self-regulated learner: An overview.
Theory into Practice, 41(2), 64–72.