Embed Size (px)
Citation preview

City University of New York (CUNY) City University of New York (CUNY)
CUNY Academic Works CUNY Academic Works
Publications and Research New York City College of Technology
2016
A preliminary assessment of GPM-based multi-satellite A preliminary assessment of GPM-based multi-satellite
precipitation estimates over a monsoon dominated region precipitation estimates over a monsoon dominated region
Satya Prakash CUNY New York City College of Technology
Ashis K. Mitra NCMRWF, ESSO/MoES, India
Amir AghaKouchak University of California, Irvine
Zhong Liu George Mason University
Hamidreza Norouzi CUNY New York City College of Technology
See next page for additional authors
How does access to this work benefit you? Let us know!
More information about this work at: https://academicworks.cuny.edu/ny_pubs/75
Discover additional works at: https://academicworks.cuny.edu
This work is made publicly available by the City University of New York (CUNY). Contact: [email protected]

Authors Authors Satya Prakash, Ashis K. Mitra, Amir AghaKouchak, Zhong Liu, Hamidreza Norouzi, and D. S. Pai
This article is available at CUNY Academic Works: https://academicworks.cuny.edu/ny_pubs/75
0
A preliminary assessment of GPM-based multi-satellite precipitation
estimates over a monsoon dominated region
Satya Prakash1,2*, Ashis K. Mitra1, Amir AghaKouchak3, Zhong Liu4, Hamidreza
Norouzi2, and D. S. Pai5
1National Centre for Medium Range Weather Forecasting (NCMRWF),
Earth System Science Organisation, Ministry of Earth Sciences, Noida, UP, India
2New York City College of Technology,
The City University of New York, Brooklyn, NY, USA
3Center for Hydrometeorology & Remote Sensing (CHRS),
Department of Civil & Environmental Engineering,
University of California, Irvine, CA, USA
4Center for Spatial Information Science & Systems (CSISS)
George Mason University, Fairfax, VA, USA
5India Meteorological Department, Pune, India
*Corresponding author’s email: [email protected]
Journal of Hydrology (2016) doi:10.1016/j.jhydrol.2016.01.029.

1
Abstract: Following the launch of the Global Precipitation Measurement (GPM) Core
Observatory, two advanced high resolution multi-satellite precipitation products namely,
Integrated Multi-satellitE Retrievals for GPM (IMERG) and Global Satellite Mapping of
Precipitation (GSMaP) version 6 are released. A critical evaluation of these newly released
precipitation data sets is very important for both the end users and data developers. This study
provides a comprehensive assessment of IMERG research product and GSMaP estimates
over India at a daily scale for the southwest monsoon season (June to September 2014). The
GPM-based precipitation products are inter-compared with widely used TRMM Multi-
satellite Precipitation Analysis (TMPA), and gauge-based observations over India. Results
show that the IMERG estimates represent the mean monsoon rainfall and its variability more
realistically than the gauge-adjusted TMPA and GSMaP data. However, GSMaP has
relatively smaller root-mean-square error than IMERG and TMPA, especially over the low
mean rainfall regimes and along the west coast of India. An entropy-based approach is
employed to evaluate the distributions of the selected precipitation products. The results
indicate that the distribution of precipitation in IMERG and GSMaP has been improved
markedly, especially for low precipitation rates. IMERG shows a clear improvement in
missed and false precipitation bias over India. However, all the three satellite-based rainfall
estimates show exceptionally smaller correlation coefficient, larger RMSE, larger negative
total bias and hit bias over the northeast India where precipitation is dominated by orographic
effects. Similarly, the three satellite-based estimates show larger false precipitation over the
southeast peninsular India which is a rain-shadow region. The categorical verification
confirms that these satellite-based rainfall estimates have difficulties in detection of rain over
the southeast peninsula and northeast India. These preliminary results need to be confirmed in
other monsoon seasons in future studies when the fully GPM-based IMERG retrospectively
processed data prior to 2014 are available.

2
Keywords: Global Precipitation Measurement Mission, Multi-satellite precipitation estimates,
Southwest monsoon, Surface rain gauge, Error metrics
1. Introduction
Accurate estimates of precipitation are crucial for a wide range of applications from
hydrology to climate studies. In the last three decades, satellite measurements of precipitation
are proven to be cost-effective, uninterrupted, and reliable sources over large data-void
regions [Yilmaz et al., 2005; Hossain and Katiyar, 2008; Collins et al., 2013; Tapiador et al.,
2012]. The first dedicated meteorological precipitation satellite – the Tropical Rainfall
Measuring Mission (TRMM), launched in late 1997, was capable to measure moderate and
heavy tropical precipitation with reasonable accuracy from last 17 years and enhanced our
understanding of weather systems and real-time monitoring of monsoons and extreme
weather events [Liu et al., 2012; Mitra et al., 2013; Hamada et al., 2015; Prakash et al.,
2015c]. With the splendid success of TRMM, the Global Precipitation Measurement (GPM)
Core Observatory was launched in February 2014 to provide next-generation global rain as
well as snow observations in near-real-time [Hou et al., 2014; Yong et al., 2015]. It carries an
advanced 13-channel passive microwave radiometer namely, GPM Microwave Imager
(GMI), paired with a Ka/Ku-band dual-frequency precipitation radar (DPR) which serve as a
benchmark to unify and advance precipitation estimates made by a constellation of research
and operational microwave sensors [Draper et al., 2015]. The Ka-band in DPR is more
sensitive than TRMM – precipitation radar (PR) in light rainfall (sensitivity of Ka-band is 0.2
mm h–1 and that of PR is 0.5 mm h–1) and high-latitude snowfall measurements. In addition,
the DPR is able to detect and estimate extreme precipitation more precisely, which would be

3
crucial to study their impacts in the global climate models in order to better understand the
global water cycle [Liu and Zipser, 2015].
Multi-satellite rainfall estimates are very useful for several applications as they
integrate relative advantages of various available satellite-based sensors to estimate more
accurate gridded rainfall. The TRMM Multi-satellite Precipitation Analysis (TMPA) is one of
the most suitable TRMM-era multi-satellite rainfall products for research as well as near real-
time applications [Liu et al., 2012; Mitra et al., 2009, 2013; Prakash et al., 2014; Zhou et al.,
2015; Yong et al., 2014]. TMPA products were gone through major revisions several times
and version 7 (V7) was released in late 2012 [Huffman et al., 2007; Huffman and Bolvin,
2014]. However, a comprehensive evaluation of these products is essential for their
integration in several applications, improvement in retrieval algorithms and numerical model
output verification. Recently, several advanced methods were proposed to specify the error
components in any satellite-based rainfall product [e.g., Ebert et al., 2007; Turk et al., 2008;
Hossain and Huffman, 2008; Tian et al., 2009; Anagnostou et al., 2010; Gebremichael, 2010;
Tian and Peters-Lidard, 2010; AghaKouchak et al., 2012; AghaKouchak and Mehran, 2013;
Mehran and AghaKouchak, 2014; Li et al., 2015; Tang et al., 2015]. The differences between
real-time and research versions of TMPA-V7 data sets and between TMPA-V7 and V6 data
sets at global scale were comprehensively evaluated by Liu [2015a, 2015b]. Additionally,
TMPA-V7 showed an overall improvement over its predecessor V6 data sets over India and
surrounding oceanic regions with some exceptions [Prakash et al., 2013, 2014, 2015a, 2015d;
Prakash and Gairola, 2014]. This rainfall data set is superior to other contemporary multi-
satellite data sets over India for the southwest monsoon season [Prakash et al., 2014, 2015b,
2015d, 2015e].
The Integrated Multi-satellitE Retrievals for GPM (IMERG) precipitation products
were released in early 2015 [Huffman et al., 2014]. This very high resolution precipitation

4
product is now available at 0.1° latitude/longitude spatial and half-hourly temporal
resolutions in three modes namely, early, late, and final runs based on latency and accuracy.
This product is considered as the next generation of multi-sensor precipitation data that
includes features from three already existing satellite precipitation products: (1) TMPA
[Huffman et al., 2007], (2) CMORPH (Climate Prediction Center Morphing; Joyce et al.,
2004), and (3) Precipitation Estimation from Remotely Sensed Information using Artificial
Neural Networks (PERSIANN; Hsu et al., 1997; Sorooshian et al., 2000). The final run of
IMERG is analogous to TMPA research product which combines multi-satellite and gauge
analyses for research applications and model verification. However, a recent preliminary
evaluation of both IMERG and TMPA rainfall products over India indicate a notable
improvement in IMERG over TMPA in heavy monsoon rainfall detection [Prakash et al.,
2016]. Additionally, the Global Satellite Mapping of Precipitation (GSMaP) version 6
product was released in late 2014, which uses a new algorithm for the GPM mission to
retrieve rain rate and uses rain gauge analysis for bias correction [Ushio et al., 2013]. A
critical evaluation of these newly released precipitation data is very important for both the
end users and data developers.
The Indian summer monsoon (June to September, JJAS) is a key component of the
South Asian monsoon which has paramount social, environmental, and economic impacts.
Therefore, accurate estimation and prediction of the Indian summer monsoon rainfall at sub-
daily to seasonal scales are crucial for various applications such as for agricultural practices,
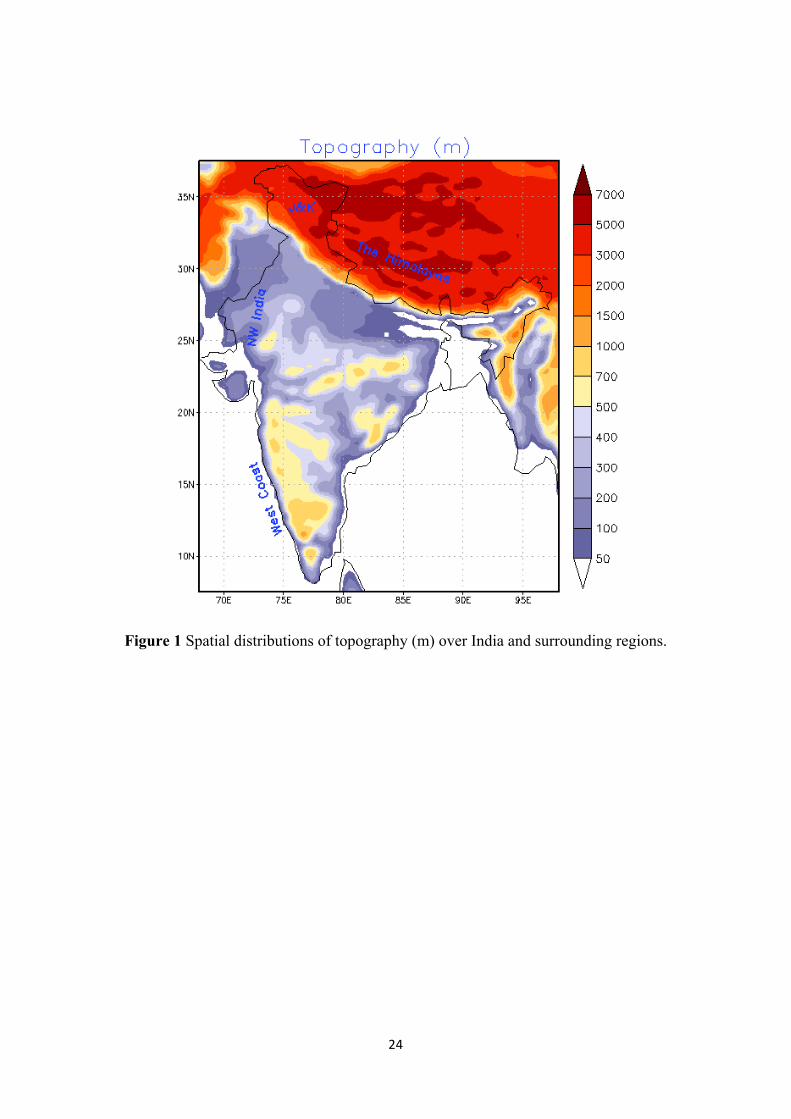
hydrology, water resource management, and energy sectors. Furthermore, characteristic
geographic and multifaceted topography (Figure 1), and huge spatial as well as temporal
variability in the monsoon rainfall make India a good test-bed to assess the accuracy of any
satellite-based rainfall estimates [Gadgil, 2003; Prakash et al., 2014, 2015a, 2015c, 2015d].

5
India has an appreciably good network of rain gauges (about 7000 gauges) well-spread across
the country except over the northern Jammu & Kashmir (J&K) state [Pai et al., 2014].
The objective of this study is to evaluate the GPM-based IMERG research version
and Global Satellite Mapping of Precipitation (GSMaP) version 6 rainfall products over India
for the southwest or summer monsoon season of 2014 using gridded gauge-based rainfall
data developed by the India Meteorological Department (IMD). The IMERG and GSMaP
data sets are also compared with widely used gauge-adjusted TMPA data over India for the
same period. Section 2 describes about the different data sets used in this study. The
methodologies used for the evaluation are presented in Section 3. Results are presented and
discussed in Section 4, and finally Section 5 contains the concluding remarks. Since most of
the “precipitation” during the monsoon over India occurs as “rainfall”, we interchangeably
used both terms in this paper.
2. Rainfall Data sets
Three gauge-calibrated multi-satellite and one gauge-only gridded rainfall data sets
for the southwest monsoon season of 2014 (JJAS-2014) are used in this study primarily due
to the reason that the IMERG is currently available from March 2014 onwards and the
retrospective processing of data prior to 2014 have not been completed. A brief description
of each data set is given here.
2.1 IMERG data
IMERG is the Day-1 U.S. multi-satellite precipitation estimation algorithm for GPM
which is based on components from three existing multi-satellite algorithms such as TMPA,
CMORPH and PERSIANN [Huffman et al., 2014]. This Day-1 algorithm was used at launch
of the GPM Core Observatory and continued to use for precipitation estimation. IMERG is a

6
suite of very high spatial (0.1° latitude/longitude) and temporal (half-hourly) resolution
multi-satellite precipitation products. It is available in three distinct modes – early, late, and
final runs, depending upon latency and requirements. The post-real-time research product
(version 03D) in the IMERG suite of products, released in January 2015 and available since
mid-March 2014, is used in this study. The input precipitation estimates for IMERG are
computed from various passive microwave and infrared satellite sensors. The microwave
precipitation estimates are calibrated against the GPM Combined Instrument product and
after morphing, integrated with microwave precipitation-calibrated infrared fields. Finally,
monthly rain gauge analyses from the Global Precipitation Climatology Center (GPCC) are
used for bias adjustments in the research version product.
2.2 GSMaP data
The GSMaP data sets are multi-satellite rainfall products which synergistically use
available microwave imagers/sounders and infrared satellite observations at high temporal
and spatial resolution for meteorological and climate studies [Ushio et al., 2009]. Similar to
IMERG and TMPA rainfall, GSMaP estimates are also available in near real-time and
delayed mode. Recently, a new algorithm for the GPM mission has been used to retrieve rain
rate and consequently a new version of GSMaP rainfall (version 6) estimates is released in
September 2014. The gauge-calibrated hourly GSMaP version 6 rainfall estimates available
at 0.1° latitude × 0.1° longitude resolution are used in this study. The global daily gauge
analysis based on the Climate Prediction Center (CPC) is used for bias correction in delayed
mode GSMaP estimates using the optimal theory [Ushio et al., 2013].

7
2.3 TMPA data
The TMPA data sets are developed by combining various microwave and infrared
satellite-based measurements and ground-based gauge observations which provide three-
hourly quasi-global quantitative precipitation estimates [Huffman et al., 2007]. TMPA data
sets are available in near real-time and delayed modes. The delayed or research version
precipitation monitoring products use gauge observations over land along with satellite
observations and are superior than near real-time products [Liu, 2015a]. The version 7 (V7)
of TMPA three-hourly rainfall products, released in late 2013, are used in this study which
are available at 0.25° latitude × 0.25° longitude resolution. TMPA-V7 estimates went through
major changes in terms of use of additional satellite observations, improved rain gauge
analyses, and uniformly reprocessed input data using updated algorithms with respect to its
predecessor version 6 [Huffman and Bolvin, 2014; Liu, 2015b]. TMPA-V7 rainfall estimates
showed an overall improvement than TMPA-V6 over India for the monsoon period [Prakash
et al., 2015a; 2015d].
2.4 IMD gauge-based data
The daily gridded IMD gauge-based rainfall data at a spatial resolution of 0.25°
latitude × 0.25° longitude over India [Pai et al., 2014] are used as benchmark data set because
it uses daily rainfall recorded from about 7000 gauge stations well-spread across the country
following rigorous quality-check. This recently released rainfall data set is able to reproduce
the spatial gradient of orographic rainfall more realistically and comparable with other
existing daily gauge-based rainfall data sets [Pai et al., 2014]. It is also to be noted that all
other available gauge-based rainfall products use only a subset of rain gauge data sets over
India.

8
3. Methodology
Since the reference IMD gridded gauge-based data sets are available at 0.25° latitude
× 0.25° longitude resolution, IMERG and GSMaP data sets are re-projected at the same
spatial resolution. In addition, IMD accumulates daily rainfall ending at 0300 UTC; we
computed daily rainfall from half-hourly IMERG, hourly GSMaP, and three-hourly TMPA-
3B42 rainfall products ending at the same time for homogeneity in comparison. As gridded
gauge-based rainfall estimates are available over the Indian landmass, we restrict our study to
India only. Evaluation is performed at the entire country as well as sub-regional scale within
India based on rainfall variability associated with characteristic geographical and
topographical features (Figures 1 and 2). At each grid over India, we have 122 pairs of
matches as the evaluation is performed at daily basis for a single monsoon season (1 June to
30 September) of 2014.
To evaluate the multi-satellite rainfall estimates against IMD gauge-based
observations, several continuous metrics such as mean, coefficient of variation (CV),
correlation coefficient, and root-mean-square error (RMSE) are computed. Furthermore, an
entropy-based approach is used to evaluate the cumulative distribution functions (CDFs) of
the selected multi-satellite precipitation estimates against IMD gauge-based observations.
The entropy-based approach is based on the concept of minimum cross entropy or the relative
entropy (also known as the Kullback-Leibler (KL) divergence test) as discussed in
AghaKouchak [2014] and Nasrollahi et al. [2015]. The KL divergence test measures the
distance of one distribution to another and assesses their similarity at a certain statistical
significance level. Here in the relative entropy test, the null hypothesis that the two
distributions (i.e., multi-satellite estimates and ground-based observations) are statistically
similar at 95% confidence level (i.e., at a 0.05 significance level). Denoting the probability

9
distribution functions of the ground-based observations and satellite estimates as f(x) and
g(x), the KL divergence (DKL) can be expressed as
𝐷!" = 𝑓 𝑥 𝑙𝑜𝑔 !(!)!(!)
𝑑𝑥 (1)
Equation (1) measures the divergence between two probability distribution functions.
Statistical significance testing is then used to assess whether the observed divergence is
statistically meaningful. The basic concept of the minimum cross entropy was introduced by
Kullback and Leibler [1951]. It is worth noting that if g(x) in equation (1) is uniform, the
minimum cross entropy reduces to the well-known entropy distribution [Hao and Singh,
2015]. For more information on entropy and its applications in hydrology, the reader is
referred to Singh [2011] and references therein.
In addition to distributional analysis, four categorical metrics based on a 2×2
contingency table [Wilks, 2006; Hogan et al., 2010] shown in Table 1 such as probability of
detection (POD), false alarm ratio (FAR), frequency bias index (FBI), and Peirce skill score
(PSS) are computed to assess the capability of multi-satellite rainfall estimates in detection of
precipitation events as compared to IMD gauge-based observations. Daily rainfall of less than
0.5 mm is assumed as “no-rain” in this study. These skill metrics can be defined as:
𝑃𝑂𝐷 = !"#$!"#$%&$' !"!#$%
(2)
𝐹𝐴𝑅 = !"#$% !"!#$%!"#$%&#'( !"!#$%
(3)
𝐹𝐵𝐼 = !"#$%&#'( !"!#$%!"#$%&$' !"!#$%
(4)

10
𝑃𝑆𝑆 = 𝑃𝑂𝐷 − !"#$% !"!#$%!"#$%&$' !"!!!"!#$%
(5)
Perfect values for POD, FAR, FBI, and PSS are 1, 0, 1, and 1, respectively.
The total error or total bias (E) in the three multi-satellite rainfall estimates with
respect to IMD gauge-based observations is decomposed using the error decomposition
approach derived by Tian et al. [2009]:
E = H – M + F (6)
Where, H, –M, and F are the three independent components of E known as hit bias,
missed precipitation, and false precipitation, respectively. Hit bias is the difference in
magnitude of precipitation detected by both satellite and ground-based observations. It may
be either positive or negative. Missed precipitation is a measure of precipitation which is not
detected by the satellite estimates and it is always negative. False precipitation is the
precipitation which is detected by the satellites but not occurred in reality as inferred from the
ground-based observations, and it is always positive. It is possible that the magnitude of any
of these error components has larger magnitude than E. These error components are crucial to
understand the error characteristics of any satellite-based precipitation estimate [Tian et al.,
2009; Tang et al., 2015].
4. Results and Discussions
Figure 2 shows the mean daily rainfall over India for the monsoon season of 2014
from IMD gauge-based, IMERG, TMPA, and GSMaP data sets. Three regions of higher
monsoon rainfall such as along the west coast (Region 1), over the monsoon trough region

11
(Region 3), and northeast India (Region 4) are well-depicted by all these data sets. The west
coast of India receives higher monsoon rainfall associated with low-level monsoon jet and
Western Ghats mountains, whereas the monsoon trough region receives fairly good amount
of rainfall due to passage of lows and depressions developed in the Bay of Bengal during the
monsoon season. The northeast India is hilly region, which gets heavy rainfall during this
season due to multi-scale interactions of monsoon flow and orography. The magnitudes of
mean daily rainfall marginally differ among them. TMPA shows less amount of rainfall along
the west coast of India as compared to IMD gauge-based data, which is notably improved in
IMERG and GSMaP data sets. The geometrical shape and spread of high rainfall areas over
the eastern central India is better captured in TMPA and IMERG data sets as compared to
GSMaP estimates. In addition, there are three regions of India – southeast peninsular India,
northwest India, and northern J&K region, which receive rather less or negligible rainfall
during the monsoon season. TMPA and GSMaP marginally overestimate rainfall over these
regions which are considerably improved in IMERG estimates as compared to gauge-based
observations. The mean daily rainfall averaged over India for the monsoon season of 2014
from IMD gauge-based, IMERG, TMPA, and GSMaP is 6.34 mm, 6.00 mm, 6.56 mm, and
5.91 mm, respectively. This shows that IMERG and GSMaP underestimate monsoon rainfall
averaged over India whereas TMPA overestimates when compared to gauge-based data set.
To investigate the variability of daily rainfall, CV is computed from each data set
which is shown in Figure 3. CV measures the variability of daily rainfall with respect to its
seasonal mean. Smaller magnitude of CV is observed along the west coast, the Himalayan
foothills and over the northeast and eastern central India from IMD gauge-based observations
whereas larger magnitude of CV is observed over the southeast peninsular India, northwest
India, and northern J&K regions. In general, larger (smaller) CV is observed over the lower
(higher) mean monsoon rainfall regimes. Larger CV over the southeast peninsular India is

12
notably underestimated by GSMaP and TMPA data sets. IMERG shows overall better
agreement with IMD gauge-based observations in representation of daily monsoon rainfall
variability. Figure 4 shows RMSE in IMERG, TMPA and GSMaP data sets as compared to
IMD gauge-based observations. All the three satellite-based data sets have larger RMSE
(more than 20 mm day-1) over the northeast India and along the west coast of India. GSMaP
has relatively smaller RMSE than IMERG and TMPA, specifically over the low mean rainfall
regimes and along the west coast of India.
The time-series of daily rainfall averaged over India from these data sets is presented
in Figure 5 (upper panel). All these four data sets exhibit similar day-to-day rainfall
variability, but having some differences in magnitude. The difference in the multi-satellite
estimates from IMD gauge-based data set is not obviously systematic. To show the statistical
comparison of daily all-India mean rainfall for the monsoon season of 2014, Taylor diagram
[Taylor, 2001] is plotted which is shown in Figure 5 (lower panel). Both IMERG and TMPA
show similar statistical behaviour. GSMaP has relatively smaller centred root-mean-square
difference, but it show smaller standard deviation than IMD gauge-based observations.
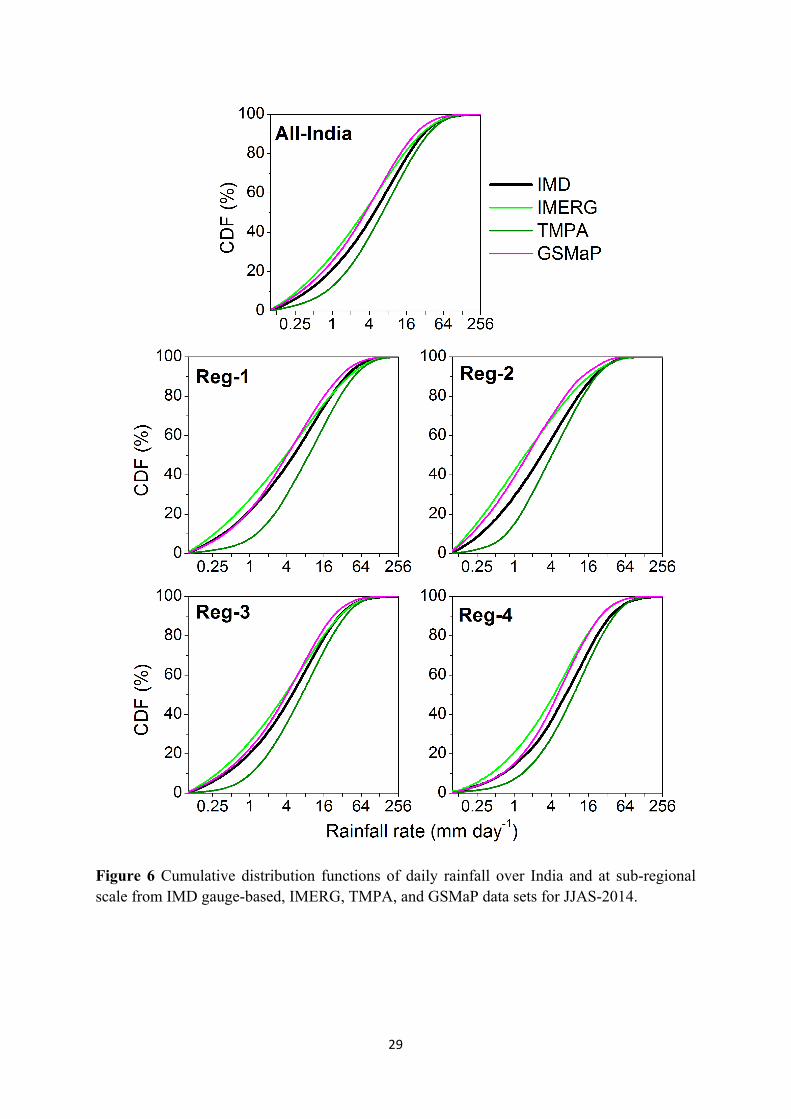
To investigate the frequency of daily rainfall distribution from multi-satellite and
gauge-based estimates, CDF is computed at all-India and sub-regional scales. Four sub-
regions within India (see Figure 2) are chosen based on mean monsoon rainfall
characteristics. The CDF of daily rainfall from these data sets for India and four sub-regions
are shown in Figure 6. TMPA substantially underestimates low rainfall at all-India scale
which is notably improved in IMERG and GSMaP estimates. The underestimation of light to
moderate rainfall by TMPA is observed in all the four sub-regions within India which is
larger for the Region 1, i.e., west coast of India. IMERG and GSMaP show a clear
improvement over TMPA across the scales. However, IMERG systematically overestimates
low to moderate rainfall over the southeast peninsular India (Region 2) and northeast India

13
(Region 4). GSMaP also shows an overestimation of low to moderate rainfall over the
southeast peninsular India.
The KL divergence test is used to assess whether the distribution functions of the
observed and satellite precipitation are statistically significant. Figure 7 presents the KL
divergence test of three gauge-adjusted multi-satellite rainfall estimates as compared to IMD
gauge-based observations at 95% confidence level. It shows that in most places the
distribution of the multi-satellite estimates is statistically similar to that of the observations
(i.e., the test does not reject the null hypothesis of distributional similarity at 0.05 significance
level). However, all the three multi-satellite products show a significant difference in
distribution of rainfall as compared to gauge-based observations over the southeast peninsular
and northern India. While the three panels in Figure 7 indicate the three satellite products are
similar with respect to the entire distribution, Figure 6 shows they are substantially different
at low to mid-range rates. We have applied the KL divergence test to the distribution
functions shown in Figure 6. The KL divergence test confirms that in all four regions, the
regional distributions of the IMERG (and GSMaP) and gauge data are statistically similar at
95% confidence level (i.e., 0.05 significance level). However, this test is rejected when
comparing gauge data and TMPA at the same significance level. This means that there are
inconsistencies in the regional distribution functions of TMPA precipitation and gauge data.
However, regional distribution functions of IMERG and GSMaP are statistically similar to
the observations.
The total error and its components in IMERG, TMPA, and GSMaP data sets with
respect to IMD gauge-based observations are illustrated in Figure 8. Larger error in the
satellite-based estimates is along the leeward side of the Western Ghats, the Himalayan
foothills, and over the eastern J&K region. However, IMERG show a considerable
improvement in error than TMPA over the northeast India, eastern J&K region, and central
14
India. GSMaP has relative smaller total error over most parts of the country. The patterns of
total bias are coincident with the patterns of hit bias. IMERG and TMPA have positive hit
bias over most parts of the country whereas GSMaP has mixed (positive and negative) hit
bias characteristics. IMERG and GSMaP show a notable improvement than TMPA in terms
of missed precipitation. TMPA and GSMaP show rather larger bias in false precipitation than
IMERG. All the three satellite-based data sets have bias of more than 150% in false
precipitation over eastern J&K region. One of the possible reasons of such large discrepancy
may be the uncertainty in IMD gauge-based data set over this region as the density of gauge
is very sparse over this region [Pai et al., 2014].
The correlation coefficient and percentage RMSE of IMERG, TMPA, and GSMaP
estimates as compared to IMD gauge-based daily rainfall averaged over India and four sub-
regions are shown in Figure 9. All the three gauge-adjusted multi-satellite rainfall estimates
show comparable correlation over India and three sub-regions, except over the northeast
India (Region 4) in rainfall estimation where both IMERG and GSMaP show relatively
smaller correlation and larger RMSE as compared with TMPA rainfall estimates. GSMaP
shows relatively smaller RMSE than TMPA and IMERG over India and three sub-regions
(Regions 1, 2 and 3), which is consistent with Figure 4. TMPA and IMERG show comparable
RMSE, in general. The total bias/error and its components (Figure 10) show that TMPA and
IMERG have total bias of the order of 20% over the southeast peninsular India, which is
much higher than that for GSMaP. Moreover, IMERG and GSMaP have larger negative total
bias and hit bias over the northeast India. GSMaP show systematic negative hit bias over all
the regions. TMPA shows rather larger bias in missed precipitation which is notably
improved in IMERG and GSMaP. However, IMERG shows no improvement in bias in
missed precipitation over the northeast India. All the three satellite-based estimates show
larger bias in false precipitation over the southeast peninsular India. IMERG has an
15
advantage of smaller bias in false precipitation as compared to other data sets except over
northeast India where IMERG and GSMaP show comparable performance.
Figure 11 shows the POD, FAR, FBI, and PSS in IMERG, TMPA, and GSMaP data
sets as compared to IMD gauge-based estimates in detection of daily rainfall for different
regions of India. POD shows that both IMERG and GSMaP show notable improvement in
rainfall detection over India and four sub-regions as compared to TMPA estimates. However,
GSMaP shows larger POD than IMERG, but having larger FAR than IMERG and TMPA.
All the three satellite-based estimates show larger FAR over the southeast peninsular India. In
terms of FBI and PSS, IMERG is the best performer than TMPA and GSMaP. Over the
southeast peninsula, TMPA show better agreement (FBI ~ 1) with observations than IMERG
and GSMaP in rainfall detection. GSMaP shows large underestimation over the northeast
India in detection of rain/no-rain events. All the satellite-based estimates have smaller PSS
over the northeast region. Overall analyses suggest that all the satellite-based rainfall
estimates have difficulties in rainfall detection and estimation over the southeast peninsula
and northeast India.
5. Conclusions
Accurate high-resolution multi-satellite precipitation estimates have wide applications
in hydrology, water resource management and NWP model verification. A very high-
resolution multi-satellite precipitation estimates known as IMERG was recently released after
the launch of the GPM Core Observatory. Another independent GPM-based GSMaP version
6 precipitation product was also released in late 2014. The capability of research version
IMERG product and GSMaP estimates, which use gauge analysis over the land for bias
correction, was assessed against gridded gauge-based rainfall observations over India. Both
IMERG and GSMaP products had also been compared with widely used gauge-adjusted

16
TMPA data set. The evaluation was performed primarily at a daily scale for the southwest
monsoon season of 2014 at a spatial resolution of 0.25° latitude/longitude. Several error
metrics as well as continuous verification were utilized to assess the potential of GPM-based
multi-satellite data set for the estimation and detection of precipitation over a monsoon
dominated region.
The results showed that IMERG represented large-scale monsoon rainfall features and
its variability more realistically compared to GSMaP and TMPA products. The higher rainfall
along the west coast and smaller rainfall over the southeast peninsular India due to the
presence of the Western Ghats were well-captured by the IMERG estimates. Both high-
resolution GPM-based IMERG and GSMaP products were comparable with gauge-based
observations and showed a considerable improvement in bias and RMSE over TMPA product
with some exceptions. Furthermore, both IMERG and GSMaP showed an improvement over
TMPA in the estimation of low to moderate rainfall distribution across the country. The
IMERG showed an overestimation of low to moderate rainfall over the southeast peninsula
and northeast India as compared to gauge-based observations. The entropy-based Kullback-
Leibler (KL) divergence test showed statistically similar rainfall distribution (at 95%
confidence level) by the three satellite-based estimates as compared to gauge-based
observations across most parts of India. However, CDFs of daily rain rate showed some
significant differences in rainfall distributions over the southeast peninsular and northern
India, especially for low and mid-range precipitation rates. The results of the entropy-based
distributional evaluation indicated that the representation of precipitation in IMERG and
GSMaP had been improved markedly compared to TMPA.
Although IMERG showed an improved total error over TMPA across the country,
larger error is observed over the mountainous regions of the Western Ghats, the Himalayan
foothills, and northeast India. Additionally, IMERG showed rather smaller missed and false

17
precipitation bias over India. None-the-less, all these satellite-based rainfall estimates showed
exceptionally smaller correlation, larger RMSE, larger negative total bias and hit bias over
the northeast India. This indicates that satellite precipitation estimates are still rather
uncertain in areas where precipitation is dominated by orographic effect [e.g., Houze, 2012;
Derin and Yilmaz, 2014; Mei et al., 2014; Prakash et al., 2014]. The three satellite-based
estimates showed notably larger false precipitation over the southeast peninsular India.
Furthermore, the categorical verification of the gauge-adjusted multi-satellite rainfall
estimates showed that all the three data sets had smaller skill in rainfall detection over the
southeast peninsula and northeast India. A sharp gradient in rainfall due to the Western Ghats
mountain chain and multi-scale interaction of the monsoon systems might be leading larger
error in satellite-based rainfall estimates over these two regions.
These preliminary results are solely based on the monsoon season of 2014 and further
studies for other monsoon seasons are needed when the fully GPM-based IMERG
retrospectively processed data starting from 1998 are available, to understand inter-annual
variability which is very important because sensors and satellites used in multi-satellite
products can be out of service and new sensors can be added in at any time. The evaluation of
GPM-based multi-satellite precipitation products at their native resolutions with respect to
station gauge observations would essentially provide in-depth error characteristics of each
data set. Additionally, the synergism of available in situ observations from rain gauges, radars
at regional scale would essentially improve the bias characteristics of IMERG and GSMaP
data sets for hydrological applications, monsoon-related applications, and high-resolution
NWP model output verification.
Acknowledgements: The authors would like to thank the editor, associate editor, anonymous reviewers, Dr. G. J. Huffman and Dr. D. T. Bolvin for constructive comments/suggestions. The IMERG data obtained from the Precipitation Processing System (PPS), TMPA data from the Goddard Earth Sciences Data and Information Services Center (GES-DISC), GSMaP data

18
from the Earth Observation Research Center, Japan Aerospace Exploration Agency (EORC/JAXA), and gauge-based data from IMD, Pune are thankfully acknowledged. References AghaKouchak, A., 2014: Entropy-copula in hydrology and climatology, Journal of Hydrometeorology, 15(6), 2176-2189, doi:10.1175/JHM-D-13-0207.1. AghaKouchak, A., A. Mehran, H. Norouzi, and A. Behrangi, 2012: Systematic and random error components in satellite precipitation data sets, Geophysical Research Letters, 39, L09406, doi:10.1029/2012GL051592. AghaKouchak, A., and A. Mehran, 2013: Extended contingency table: Performance metrics for satellite observations and climate model simulations, Water Resources Research, 49, 7144-7149, doi:10.1002/wrcr.20498. Anagnostou, E. N., V. Maggioni, E. I. Nikolopoulos, T. Meskele, F. Hossain, and A. Papadopoulos, 2010: Benchmarking high-resolution global satellite rainfall products to radar and rain-gauge rainfall estimates, IEEE Transactions on Geoscience and Remote Sensing, 48(4), 1667-1683. Collins, M., K. Achuta Rao, K. Ashok, S. Bhandari, A. K. Mitra, S. Prakash, R. Srivastava, and A. Turner, 2013: Observational challenges in evaluating climate models, Nature Climate Change, 3(11), 940-941, doi:10.1038/nclimate2012. Derin, Y. and K. K. Yilmaz, 2014: Evaluation of multiple satellite-based precipitation products over complex topography, Journal of Hydrometeorology, 15, 1498-1516, doi:10.1175/JHM-D-13-0191.1. Draper, D. W., D. A. Newell, F. J. Wentz, S. Krimchansky, and G. M. Skofronick-Jackson, 2015: The Global Precipitation Measurement (GPM) Microwave Imager (GMI): Instrument overview and early on-orbit performance, IEEE Journal of Selected Topics in Applied Earth Observations and Remote Sensing, 8(7), 3452-3462, doi:10.1109/JSTARS.2015.2403303. Ebert, E., J. Janowiak, and C. Kidd, 2007: Comparison of near real time precipitation estimates from satellite observations and numerical models, Bulletin of the American Meteorological Society, 88, 47-64. Gadgil, S., 2003: The Indian monsoon and its variability, Annual Review of Earth and Planetary Sciences, 31, 429-467. Gebremichael, M., 2010: Framework for satellite rainfall product evaluation, Geophysical Monograph Series, 191, 265-275 Hamada, A., Y. N. Takayabu, C. Liu, and E. J. Zipser, 2015: Weak linkage between the heaviest rainfall and tallest storms, Nature Communications, 6, 6213, doi:10.1038/ncomms7213. Hao, Z., and V. P. Singh, 2015: Integrating entropy and copula theories for hydrologic modeling and analysis, Entropy, 17, 2253-2280.

19
Hogan, R. J., C. A. T. Ferro, I. T. Jolliffe, and D. B. Stephenson, 2010: Equitability revisited: Why the “Equitable Threat Score” is not equitable, Weather and Forecasting, 25, 710-726. doi:10.1175/2009WAF2222350.1 Hossain, F., and N. Katiyar, 2008: Advancing the use of satellite rainfall datasets for flood prediction in ungauged basins: The role of scale, hydrologic process controls and the global precipitation measurement mission, In Quantitative Information Fusion for Hydrological Sciences Studies in Computational Intelligence, 79, 163-181. Hossain, F., and G. Huffman, 2008: Investigating error metrics for satellite rainfall data at hydrologically relevant scales, Journal of Hydrometeorology, 9(3), 563-575. Hou A. Y., R. K. Kakar, S. Neeck, A. A. Azarbarzin, C. D. Kumerrow, M. Kojima, R. Oki, K. Nakamura, and T. Iguchi, 2014: The Global Precipitation Measurement Mission, Bulletin of the American Meteorological Society, 95, 701-722, doi:10.1175/BAMS-D-13-00164-1. Houze, Jr., R. A., 2012: Orographic effects on precipitating clouds, Reviews of Geophysics, 50, RG1001, doi:10.1029/2011RG000365. Hsu, K., X. Gao, S. Sorooshian, and H. Gupta, 1997: Precipitation estimation from remotely sensed information using artificial neural networks, Journal of Applied Meteorology, 36, 1176-1190. Huffman, G. J., R. F. Adler, D. T. Bolvin, G. Gu, E. J. Nelkin, K. P. Bowman, Y. Hong, E. F. Stocker, and D. B. Wolff, 2007: The TRMM Multisatellite Precipitation Analysis (TMPA): Quasi-global, multiyear, combined-sensor precipitation estimates at fine scales, Journal of Hydrometeorology, 8, 38-55, doi:10.1175/JHM560.1. Huffman, G. J., and D. T. Bolvin, 2014: TRMM and other data precipitation data set documentation. NASA, 42 pp. [Available online at ftp://meso-a.gsfc.nasa.gov/pub/trmmdocs/3B42_3B43_doc.pdf]. Huffman, G. J., D. T. Bolvin, D. Braithwaite, K. Hsu, R. Joyce, and P. Xie, 2014: NASA Global Precipitation Measurement (GPM) Integrated Multi-satellitE Retrievals for GPM (IMERG). Algorithm Theoretical Basis Document (ATBD), version 4.4, NASA, 30 pp. [Available online at http://pmm.nasa.gov/sites/default/files/document_files/IMERG_ATBD_V4.4.pdf.] Joyce, R. J., J. E. Janowiak, P. A. Arkin, and P. Xie, 2004: CMORPH: A method that produces global precipitation estimates from passive microwave and infrared data at high spatial and temporal resolution. Journal of Hydrometeorology, 5, 487-503. Kullback, S., and R. Leibler, 1951: On information and sufficiency. The Annals of Mathematical Statistics, 22, 79-86. Li, J., K. Hsu, A. AghaKouchak, and S. Sorooshian, 2015: An object-based approach for verification of precipitation estimation, International Journal of Remote Sensing, 36, 513-529, doi:10.1080/01431161.2014.999170.

20
Liu, C., and E. J. Zipser, 2015: The global distribution of largest, deepest and most intense precipitation systems, Geophysical Research Letters, 42, doi:10.1002/2015GL063776. Liu, Z., D. Ostrenga, W. Teng, and S. Kempler, 2012: Tropical Rainfall Measuring Mission (TRMM) precipitation data and services for research and applications, Bulletin of the American Meteorological Society, 93, 1317-1325, doi:10.1175/BAMS-D-11-00152.1 Liu, Z., 2015a: Comparison of precipitation estimates between version 7 3-hourly TRMM Multi-satellite Precipitation Analysis (TMPA) near-real-time and research products, Atmospheric Research, 153, 119-133, doi:10.1016/j.atmosres.2014.07.032. Liu, Z., 2015b: Comparison of versions 6 and 7 3-hourly TRMM multi-satellite precipitation analysis (TMPA) research products, Atmospheric Research, 163, 91-101, doi:10.1016/j.atmosres.2014.12.015. Mehran, A., and A. AghaKouchak, 2014: Capabilities of satellite precipitation datasets to estimate heavy precipitation rates at different temporal accumulations, Hydrological Processes, 28, 2262-2270, doi:10.1002.hyp.9779. Mei, Y., E. N. Anagnostou, E. I. Nikolopoulos, and M. Borga, 2014: Error analysis of satellite precipitation products in mountainous basins, Journal of Hydrometeorology, 15, 1778-1793, doi:10.1175/JHM-D-13-0194.1. Mitra, A. K., A. K. Bohra, M. N. Rajeevan, and T. N. Krishnamurti, 2009: Daily Indian precipitation analyses formed from a merge of rain-gauge with TRMM TMPA satellite derived rainfall estimates, Journal of the Meteorological Society of Japan, 87A, 265-279. Mitra, A. K., I. M. Momin, E. N. Rajagopal, S. Basu, M. N. Rajeevan, and T. N. Krishnamurti, 2013: Gridded daily Indian monsoon rainfall for 14 seasons: Merged TRMM and IMD gauge analyzed values, Journal of Earth System Science, 122(5), 1173-1182. Nasrollahi, N., A. AghaKouchak, L. Cheng, L. Damberg, T. Phillips, C. Miao, K. Hsu, and S. Sorooshian, 2015: How well do CMIP5 climate simulations replicate historical trends and patterns of meteorological droughts? Water Resources Research, 51, 2847–2864, doi:10.1002/2014WR016318. Pai, D. S., L. Sridhar, M. Rajeevan, O. P. Sreejith, N. S. Satbhai, and B. Mukhopadhyay, 2014: Development of a new high spatial resolution (0.25° × 0.25°) long period (1901-2010) daily gridded rainfall data set over India and its comparison with existing data sets over the region, Mausam, 65(1), 1-18. Prakash, S., C. Mahesh, and R. M. Gairola, 2013: Comparison of TRMM Multisatellite Precipitation Analysis (TMPA)-3B43 version 6 and 7 products with rain gauge data from ocean buoys, Remote Sensing Letters, 4(7), 677-685, doi:10.1080/2150704X.2013.783248. Prakash, S., and R. M. Gairola, 2014: Validation of TRMM-3B42 precipitation product over the tropical Indian Ocean using rain gauge data from the RAMA buoy array, Theoretical and Applied Climatology, 115(3-4), 451-460, doi:10.1007/s00704-013-0903-3.
21
Prakash, S., V. Sathiyamoorthy, C. Mahesh, and R. M. Gairola, 2014: An evaluation of high-resolution multisatellite rainfall products over the Indian monsoon region, International Journal of Remote Sensing, 35(9), 3018-3035, doi:10.1080/01431161.2014.894661. Prakash, S., A. K. Mitra, I. M. Momin, D. S. Pai, E. N. Rajagopal, and S. Basu, 2015a: Comparison of TMPA-3B42 versions 6 and 7 precipitation products with gauge based data over India for the south-west monsoon period, Journal of Hydrometeorology, 16(1), 346-362, doi:10.1175/JHM-D-14-0024.1. Prakash, S., A. K. Mitra, and D. S. Pai, 2015b: Comparing two high-resolution gauge-adjusted multisatellite rainfall products over India for the southwest monsoon period, Meteorological Applications, 22(3), 679-688, doi:10.1002/met.1502. Prakash, S., A. K. Mitra, A. AghaKouchak, and D. S. Pai, 2015c: Error characterization of TRMM Multisatellite Precipitation Analysis (TMPA-3B42) products over India for different seasons, Journal of Hydrology, 529(P3), 1302-1312, doi:10.1016/j.jhydrol.2015.08.062. Prakash, S., A. K. Mitra, I. M. Momin, R. M. Gairola, D. S. Pai, E. N. Rajagopal, and S. Basu, 2015d: A review of recent evaluations of TRMM Multisatellite Precipitation Analysis (TMPA) research products against ground-based observations over Indian land and oceanic regions, Mausam, 66(3), 355-366. Prakash, S., A. K. Mitra, E. N. Rajagopal, and D. S. Pai, 2015e: Assessment of TRMM-based TMPA-3B42 and GSMaP precipitation products over India for the peak southwest monsoon season, International Journal of Climatology, doi:10.1002/joc.4446. Prakash, S., A. K. Mitra, D. S. Pai, and A. AghaKouchak, 2016: From TRMM to GPM: How well can heavy rainfall be detected from space?, Advances in Water Resources, 88, 1-7, doi:10.1016/j.advwatres.2015.11.008. Singh, V. P., 2011: Hydrologic synthesis using entropy theory: Review, Journal of Hydrologic Engineering, 16, 421-433. Sorooshian, S., K. Hsu, X. Gao, H. Gupta, B. Imam, and D. Braithwaite, 2000: Evolution of the PERSIANN system satellite-based estimates of tropical rainfall, Bulletin of the American Meteorological Society, 81(9), 2035-2046 Tang, L., Y. Tian, F. Yan, and E. Habib, 2015: An improved procedure for the validation of satellite-based precipitation estimates, Atmospheric Research, 163, 61-73, doi:10.1016/j.atmosres.2014.12.016. Tapiador, F. J., F. J. Turk, W. Petersen, A. Y. Hou, E. Garcia-Ortega, L. A. T. Machado, C. F. Angelis, P. Salio, C. Kidd, G. J. Huffman, and M. de Castro (2012), Global precipitation measurement: Methods, datasets and applications, Atmospheric Research, 104-105, 70-97, doi:10.1016/j.atmosres.2011.10.021. Taylor, K. E. (2001), Summarizing multiple aspects of model performance in a single diagram, Journal of Geophysical Research, 106(D7), 7183-7192.

22
Tian, Y., C. Peters-Lidard, J. Eylander, R. Joyce, G. Huffman, R. Adler, K.-L. Hsu, F. J. Turk, M. Garcia, and J. Zeng, 2009: Component analysis of errors in satellite-based precipitation estimates, Journal of Geophysical Research, 114, D24101, doi:10.1029/2009JD011949. Tian, Y., and C. D. Peters-‐Lidard, 2010: A global map of uncertainties in satellite-‐based precipitation measurements, Geophysical Research Letters, 37, L24407, doi:10.1029/2010GL046008. Turk, F. J., P. Arkin, E. E. Ebert, and M. R. P. Sapiano, 2008: Evaluating high-‐resolution precipitation products, Bulletin of the American Meteorological Society, 89(12), 1911-1916. Ushio, T., T. Kubota, S. Shige, K. Okamoto, K. Aonashi, T. Inoue, N. Takahashi, T. Iguchi, M. Kachi, R. Oki, T. Morimoto, and Z. Kawasaki (2009), A Kalman filter approach to the Global Satellite Mapping of Precipitation (GSMaP) from combined passive microwave and infrared radiometric data, Journal of the Meteorological Society of Japan, 87A, 137-151. Ushio, T., T. Tashima, T. Kubota, and M. Kachi, 2013: Gauge adjusted Global Satellite Mapping of Precipitation (GSMaP_Gauge), Proc. 29th ISTS, 2013-n-48. Wilks, D. S., 2006: Statistical Methods in the Atmospheric Sciences, 2nd ed. Academic, 648 pp. Yilmaz, K. K., H. Gupta, T. S. Hogue, K. L. Hsu, T. Wagener, and S. Sorooshian, 2005: Evaluating the utility of satellite-based precipitation estimates for runoff prediction in ungauged basins, In International Symposium on Regional Hydrological Impacts of Climatic Variability and Change with an Emphasis on Less Developed Countries, Regional Hydrological Impacts of Climate Change: Impact Assessment and Decision Making, 295, 273-282. Yong, B., B. Chen, J. J. Gourley, L. Ren, Y. Hong, X. Chen, W. Wang, S. Chen, and L. Gong, 2014: Intercomparison of the version-6 and version-7 TMPA precipitation products over high and low latitudes basins with independent gauge networks: is the newer version better in both real-time and post-real-time analysis for water resources and hydrologic extremes? Journal of Hydrology, 508, 77-87, doi:10.1016/j.jhydrol.2013.10.050. Yong, B., D. Liu, J. J. Gourley, Y. Tian, G. J. Huffman, L. Ren, and Y. Hong, 2015: Global view of real-time TRMM Multisatellite Precipitation Analysis: Implications for its successor Global Precipitation Measurement Mission, Bulletin of the American Meteorological Society, 96, 283-296, doi:10.1175/BAMS-D-14-00017.1. Zhou, Y., W. K. M. Lau, and G. J. Huffman, 2015: Mapping TRMM TMPA into average recurrence interval for monitoring extreme precipitation events, Journal of Applied Meteorology and Climatology, 979-995, doi:10.1175/JAMC-D-14-0269.1.

23
Table 1 A 2×2 contingency table used for the computation of categorical metrics
Est
imat
ed
Observed
Rain (Daily rain ≥
0.5 mm)
No-rain (Daily rain
< 0.5 mm)
Rain (Daily rain
≥ 0.5 mm)
Hits False alarms Estimated
events
No-rain (Daily
rain < 0.5 mm)
Misses Correct negatives Estimated non-
events
Observed events Observed non-
events
24
Figure 1 Spatial distributions of topography (m) over India and surrounding regions.

25
Figure 2 Spatial distributions of mean daily monsoon rainfall over India for 2014 derived from IMD gauge-based, IMERG, TMPA, and GSMaP data sets. Mean daily rainfall values averaged over India are given in parentheses. Four boxes drawn in Figure (a) are four sub-regions within India used for detailed study and are references to Figures 6 and 9-11.

26
Figure 3 Spatial distributions of coefficient of variation in daily monsoon rainfall over India for 2014 derived from IMD gauge-based, IMERG, TMPA, and GSMaP data sets.

27
Figure 4 Spatial distributions of RMSE in IMERG, TMPA, and GSMaP daily rainfall over India as compared with IMD gauge-based data for JJAS-2014.

28
Figure 5 (Upper panel) Time-series of daily rainfall averaged over India from IMD gauge-based, IMERG, TMPA, and GSMaP for JJAS-2014. (Lower panel) Taylor diagram showing the comparison of daily all-India monsoon rainfall from multi-satellite products with respect to IMD gauge-based data.
29
Figure 6 Cumulative distribution functions of daily rainfall over India and at sub-regional scale from IMD gauge-based, IMERG, TMPA, and GSMaP data sets for JJAS-2014.

30
Figure 7 KL divergence test of IMERG, TMPA, and GSMaP daily rainfall estimates against IMD gauge-based data at 95% confidence level for JJAS-2014.

31
Figure 8 Error components of IMERG, TMPA, and GSMaP daily rainfall over India as compared with IMD gauge-based data for JJAS-2014. The magnitude of error components are normalized with respect to mean gauge-based rainfall and converted into percentage.

32
Figure 9 Correlation coefficient and RMSE (converted into percentage after normalizing with respect to mean gauge-based rainfall) in IMERG, TMPA, and GSMaP daily rainfall products in comparison with IMD gridded gauge-based data over India and at sub-regional scale for JJAS-2014. Daily rainfall values less than 0.5 mm are assumed as no-rain.

33
Figure 10 Error components of IMERG, TMPA, and GSMaP daily rainfall products in comparison with IMD gridded gauge-based data over India and at sub-regional scale for JJAS-2014. Daily rainfall values less than 0.5 mm are assumed as no-rain. The magnitude of error components are normalized with respect to mean gauge-based rainfall and converted into percentage.

34
Figure 11 Probability of detection (POD), false alarm ratio (FAR), frequency bias index (FBI), and Peirce skill score (PSS) of IMERG, TMPA, and GSMaP daily rainfall products in rain detection as compared to IMD gridded gauge-based data over India and at sub-regional scale for JJAS-2014. Daily rainfall values less than 0.5 mm are assumed as no-rain.