Embed Size (px)
Citation preview
A Preliminary Calibrated Deglaciation Chronology for the Eurasian Ice
Complex
Lev Tarasov¹, W.R. Peltier²,R. Gyllencreutz³, O. Lohne³,
J. Mangerud³, and J.-I. Svensen³
(1) Memorial University of Newfoundland, (2) University of Toronto,
(3) University of Bergen
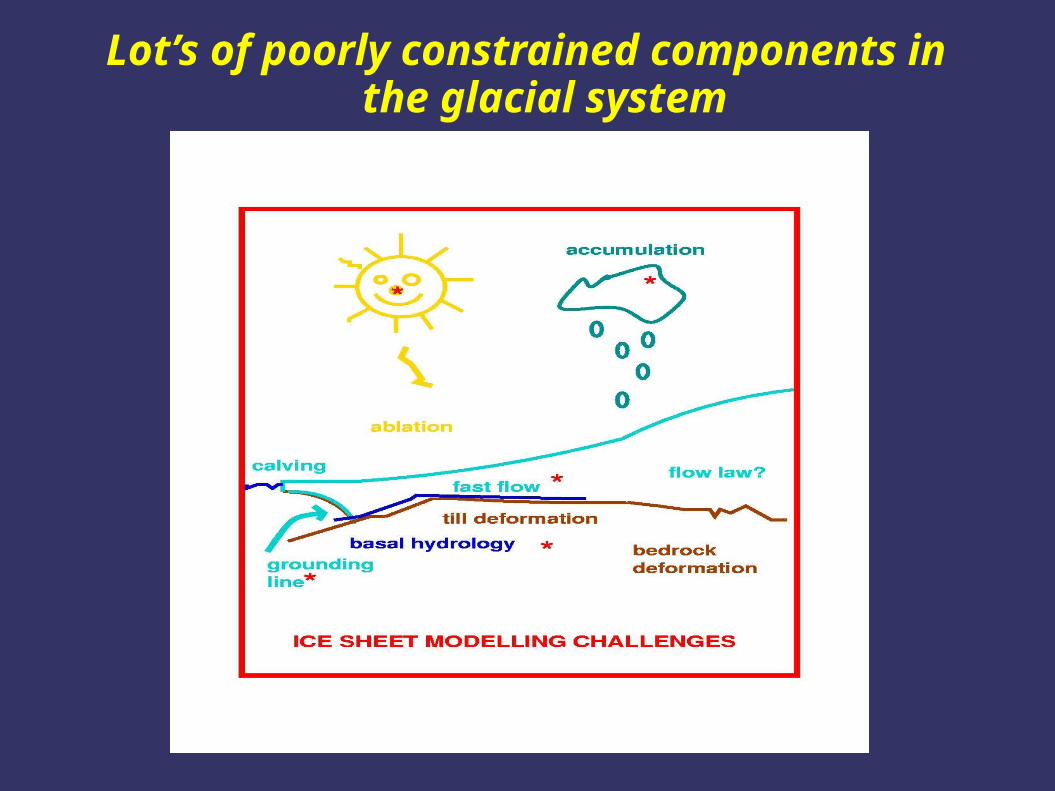
Lot’s of poorly constrained components in the glacial system

Poorly constrained system; model pre(retro)dictions have generally
lacked meaningful error bars => no meaningful interpretation.Solution: 3 components:
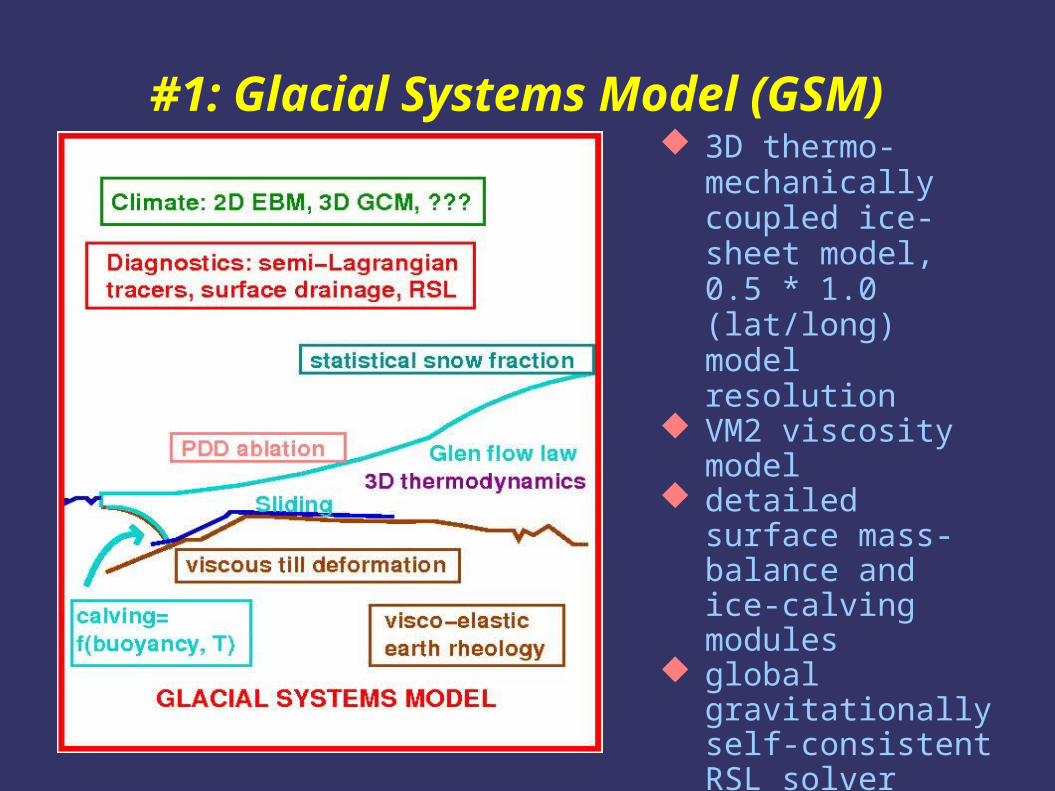
#1: Glacial Systems Model (GSM) 3D thermo-
mechanically coupled ice-sheet model, 0.5 * 1.0 (lat/long) model resolution
VM2 viscosity model detailed surface
mass-balance and ice-calving modules
global gravitationally self-consistent RSL solver
fully coupled surface drainage solver
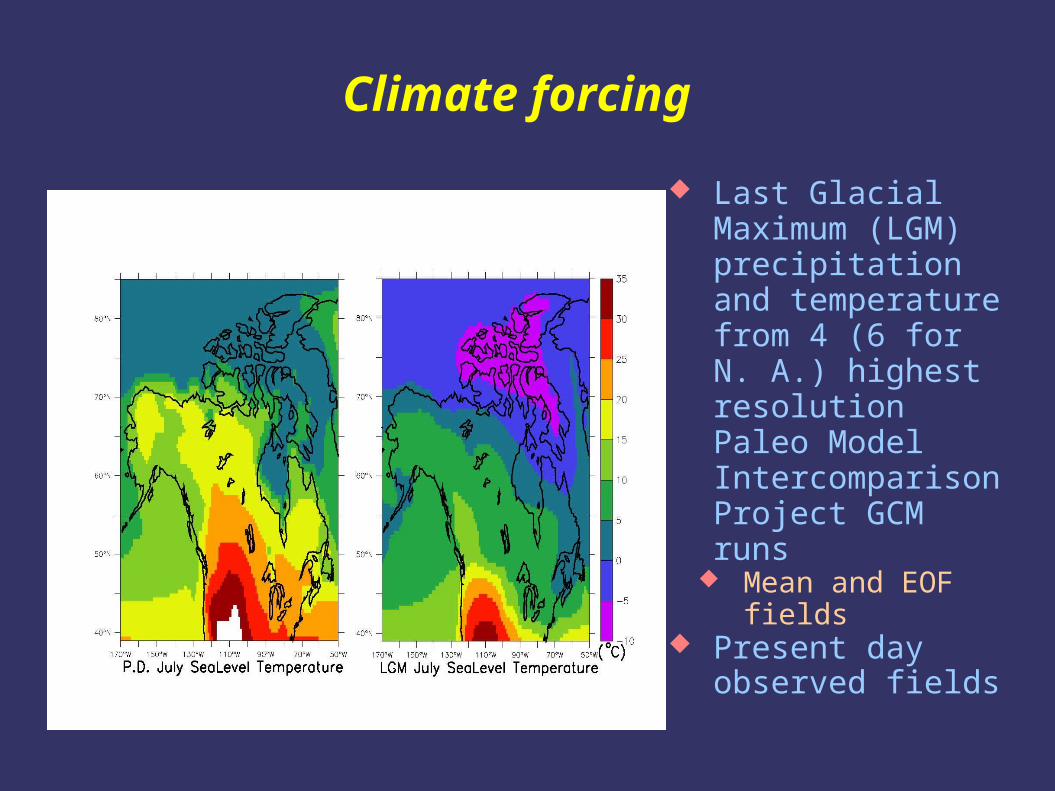
Climate forcing
Last Glacial Maximum (LGM) precipitation and temperature from 4 (6 for N. A.) highest resolution Paleo Model Intercomparison Project GCM runs
Mean and EOF fields
Present day observed fields
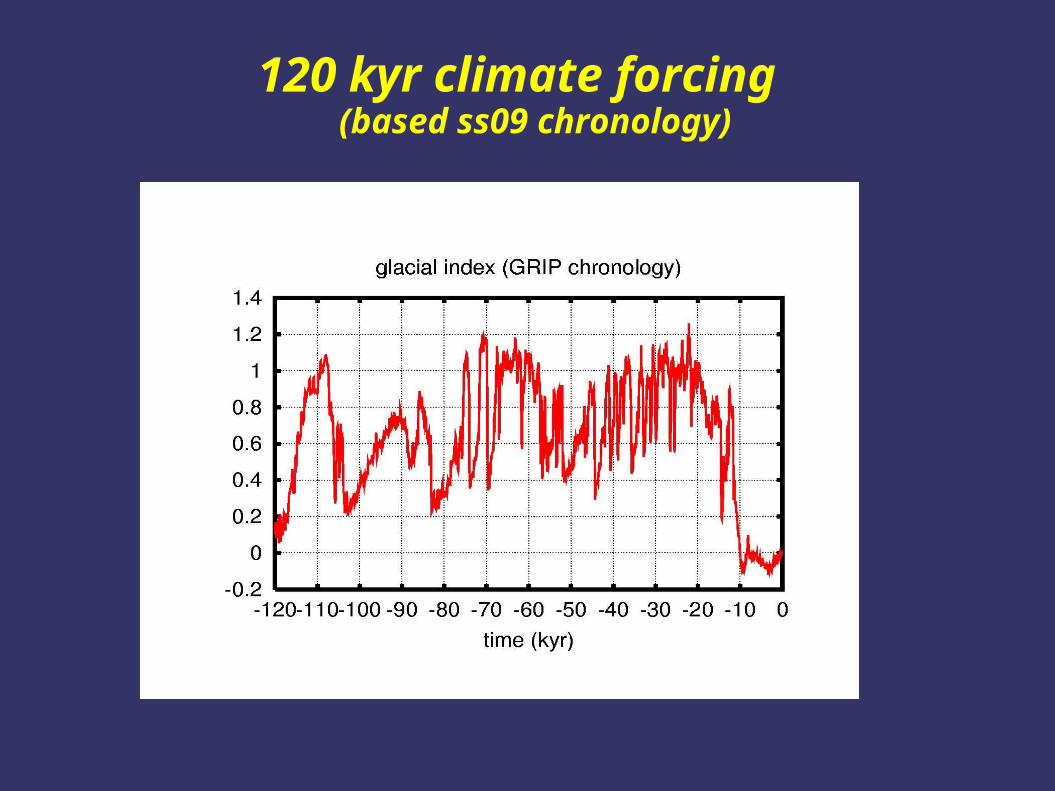
120 kyr climate forcing(based ss09 chronology)
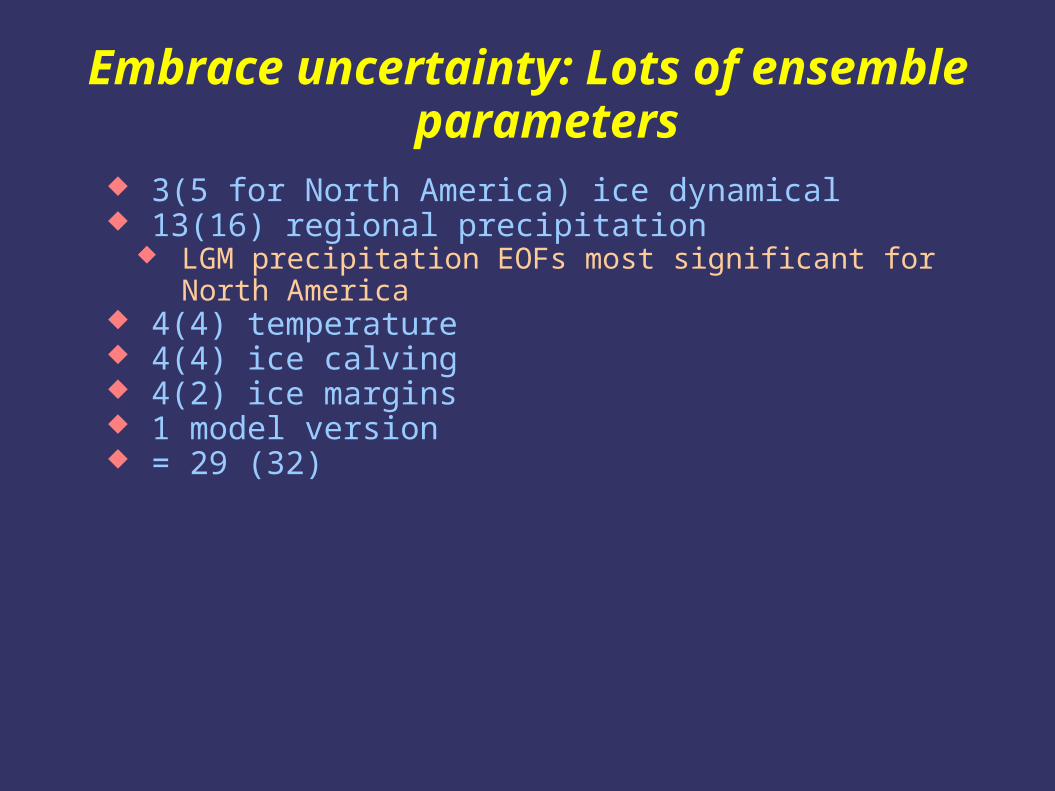
Embrace uncertainty: Lots of ensemble parameters
3(5 for North America) ice dynamical 13(16) regional precipitation
LGM precipitation EOFs most significant for North America 4(4) temperature 4(4) ice calving 4(2) ice margins 1 model version = 29 (32)
Need constraints -> #2: DATA
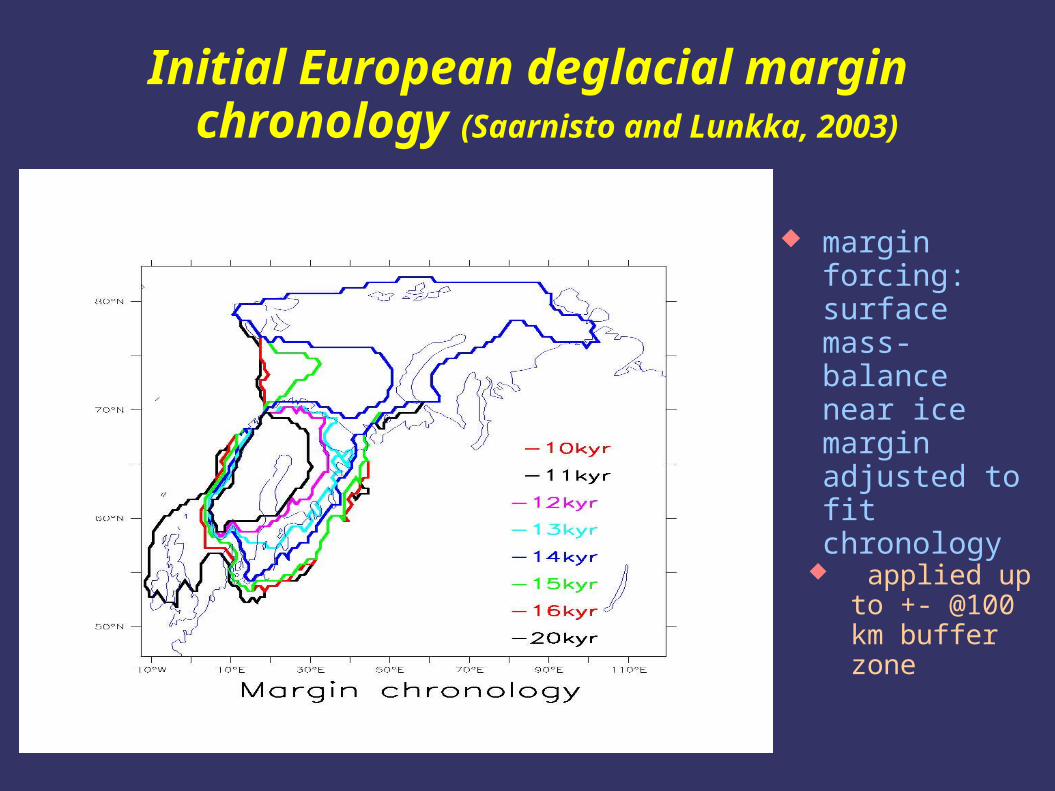
Initial European deglacial margin chronology (Saarnisto and Lunkka, 2003)
margin forcing: surface mass-balance near ice margin adjusted to fit chronology
applied up to +- @100 km buffer zone
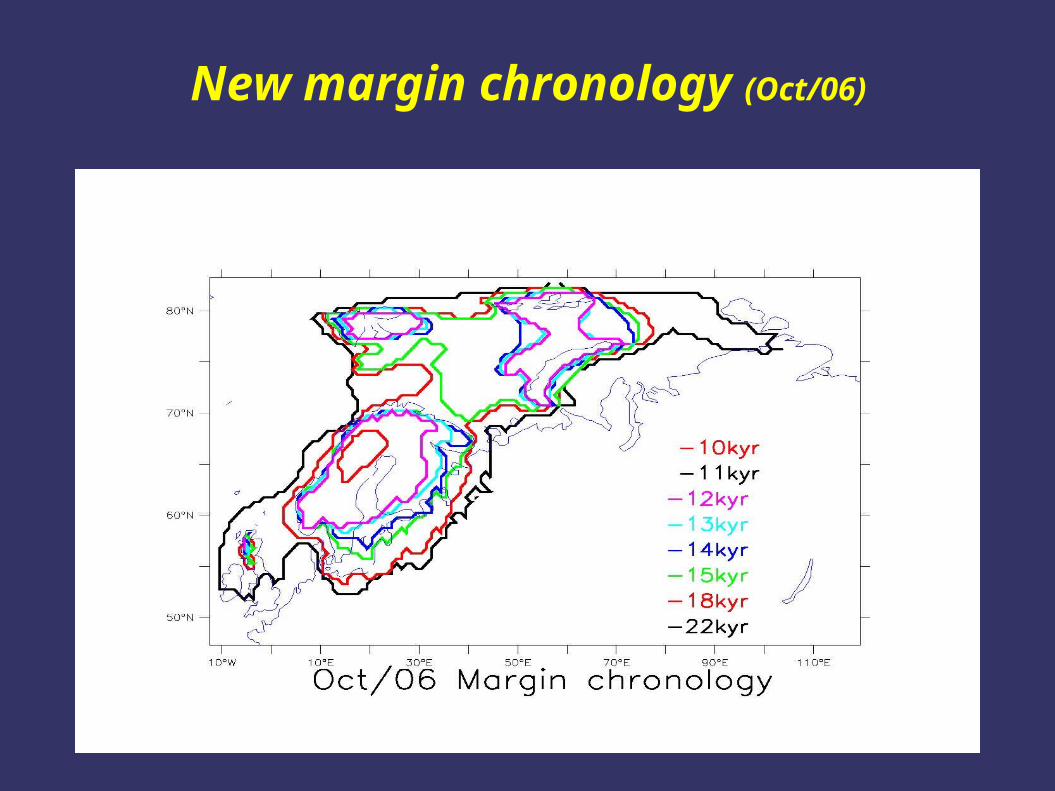
New margin chronology (Oct/06)
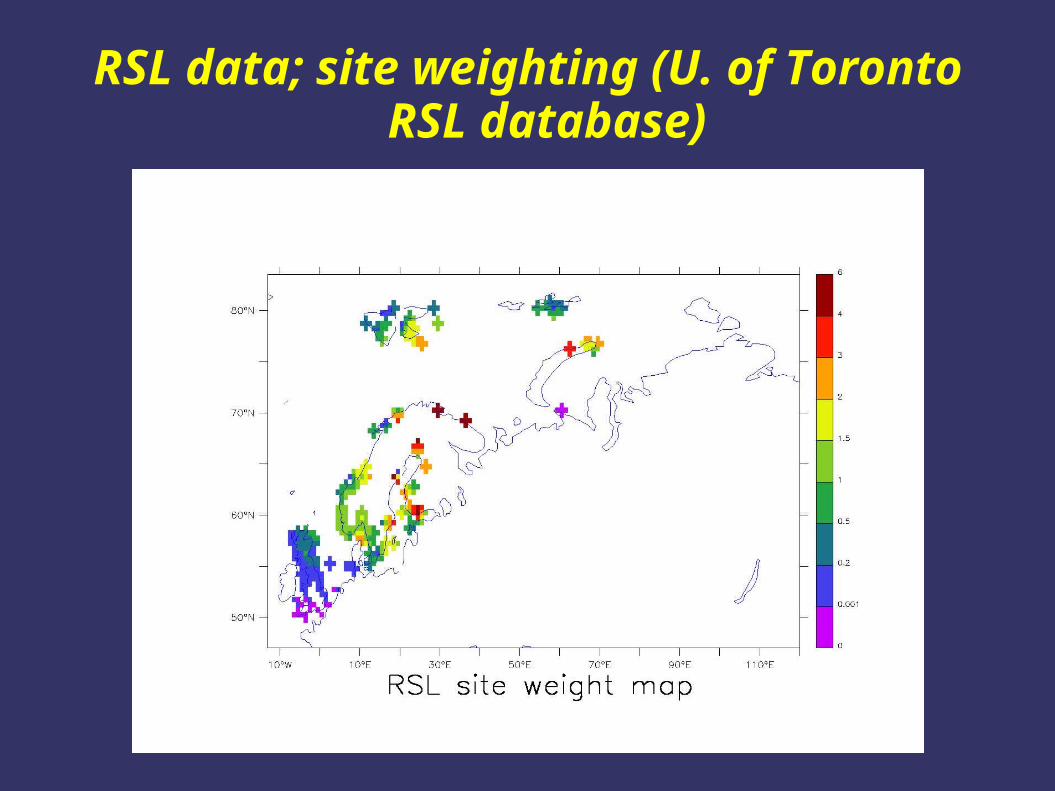
RSL data; site weighting (U. of Toronto RSL database)

Noisy data and non-linear system => need #3: calibration and error bars
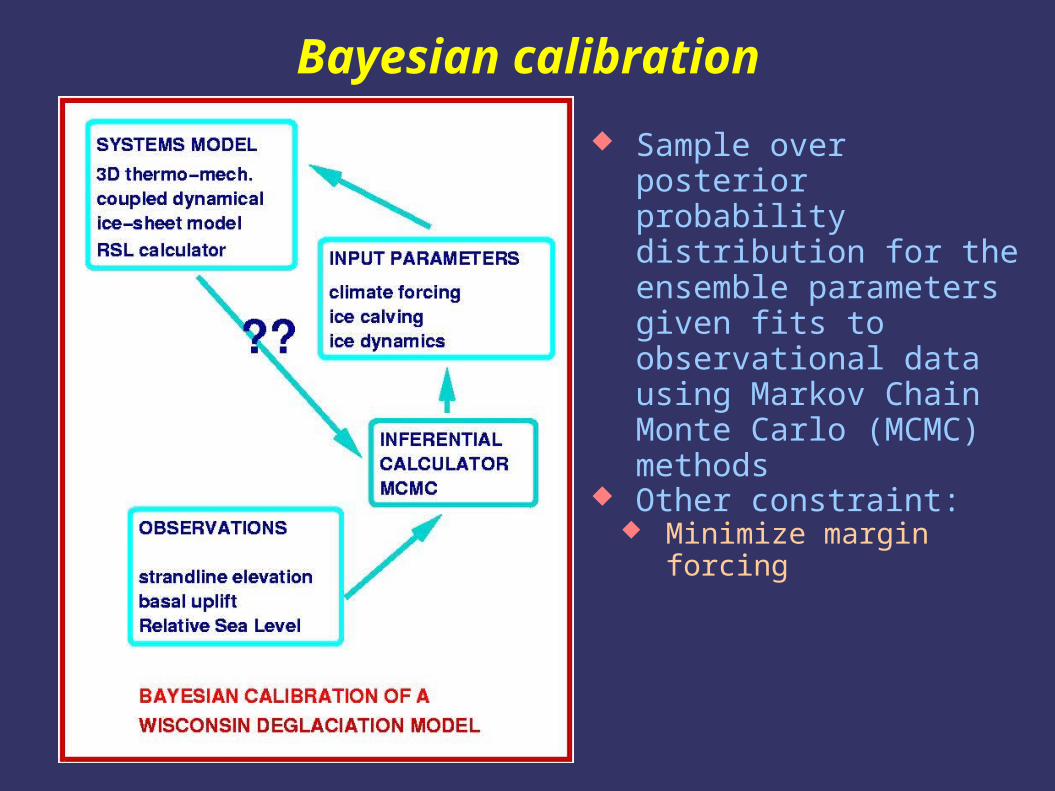
Bayesian calibration
Sample over posterior probability distribution for the ensemble parameters given fits to observational data using Markov Chain Monte Carlo (MCMC) methods
Other constraint: Minimize margin forcing
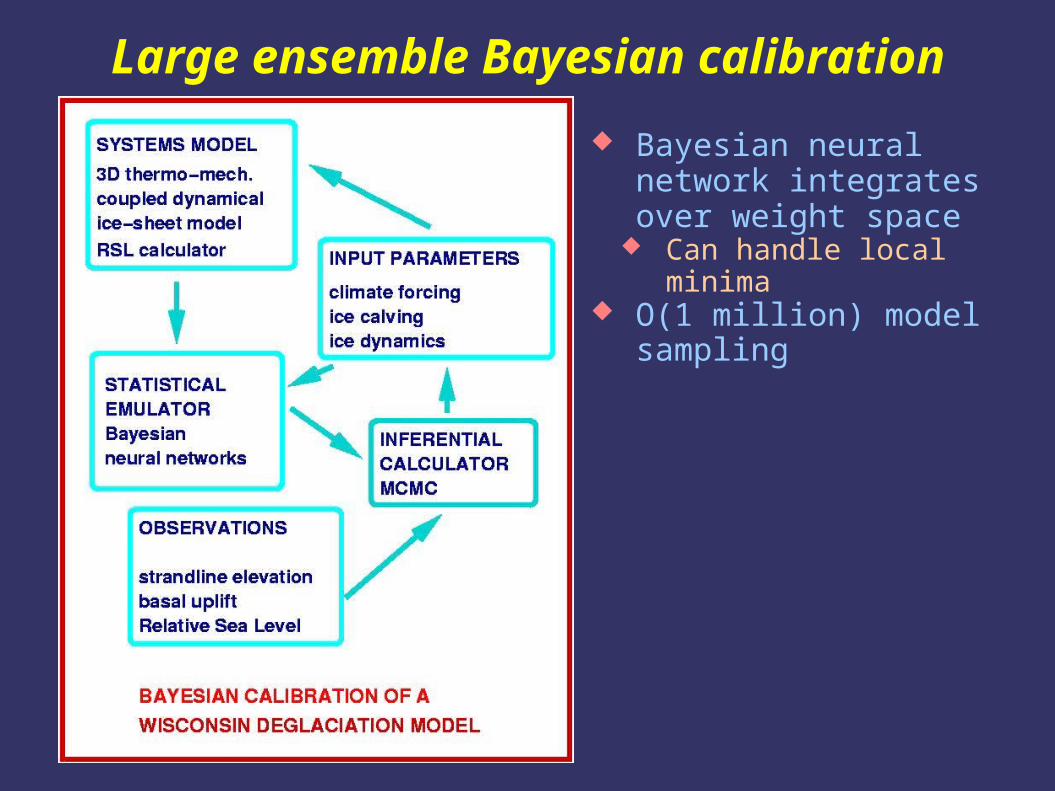
Large ensemble Bayesian calibration
Bayesian neural network integrates over weight space
Can handle local minima O(1 million) model
sampling
Results
from 1 calibration iteration with new margin 923 model runs @ 2 million MCMC samplings
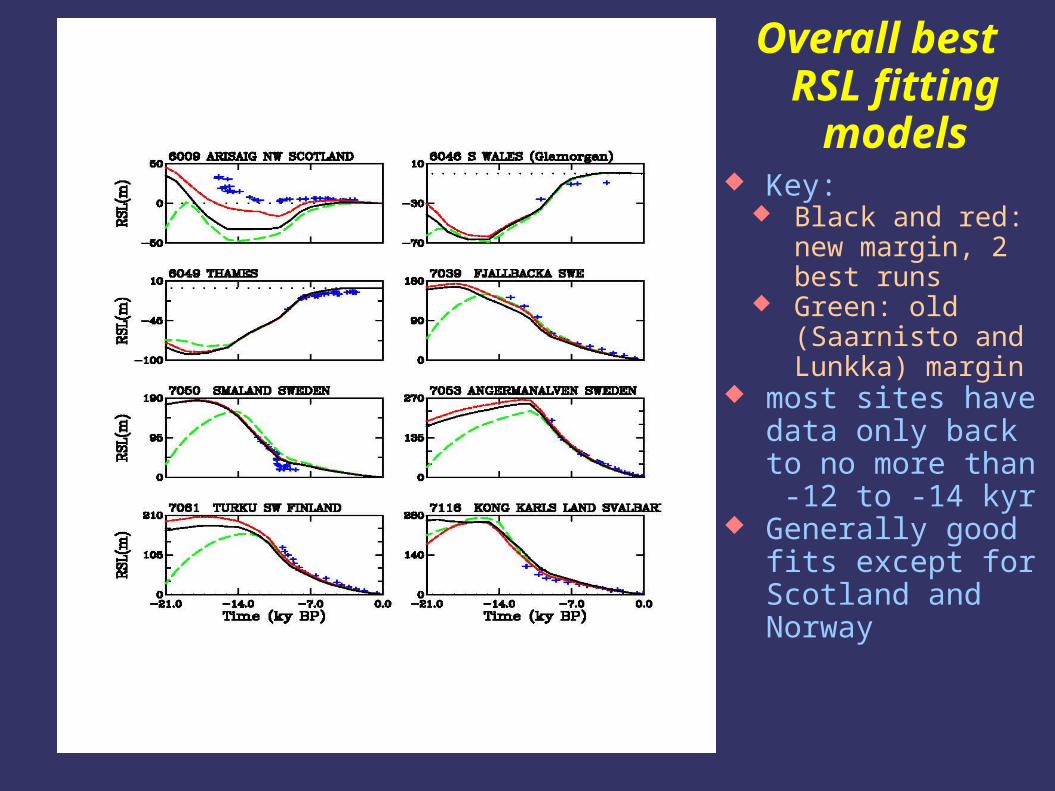
Overall best RSL fitting
models Key:
Black and red: new margin, 2 best runs
Green: old (Saarnisto and Lunkka) margin
most sites have data only back to no more than -12 to -14 kyr
Generally good fits except for Scotland and Norway
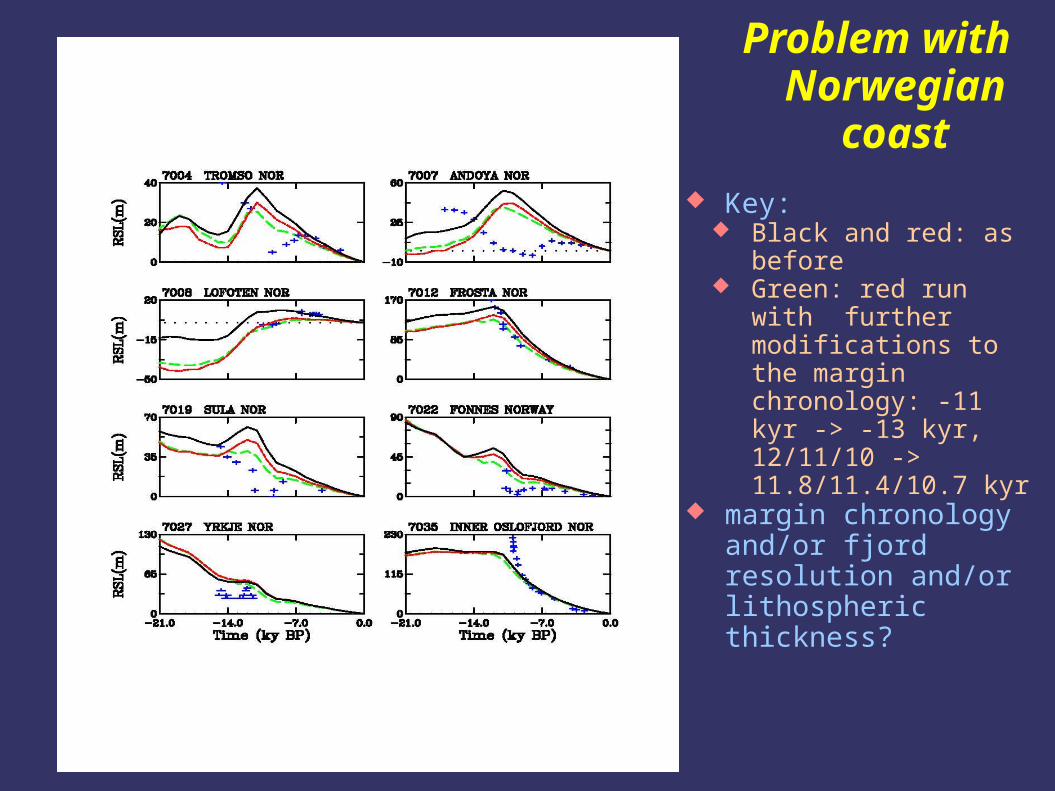
Problem with Norwegian
coast
Key: Black and red: as
before Green: red run with
further modifications to the margin chronology: -11 kyr -> -13 kyr, 12/11/10 -> 11.8/11.4/10.7 kyr
margin chronology and/or fjord resolution and/or lithospheric thickness?
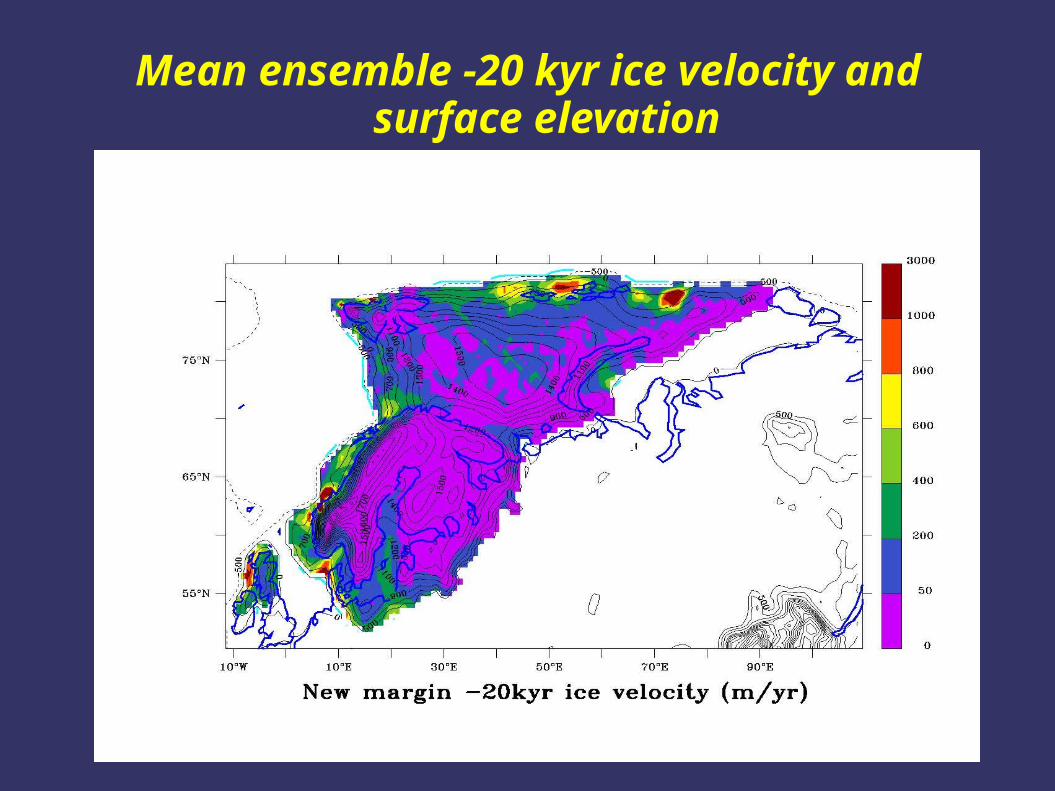
Mean ensemble -20 kyr ice velocity and surface elevation
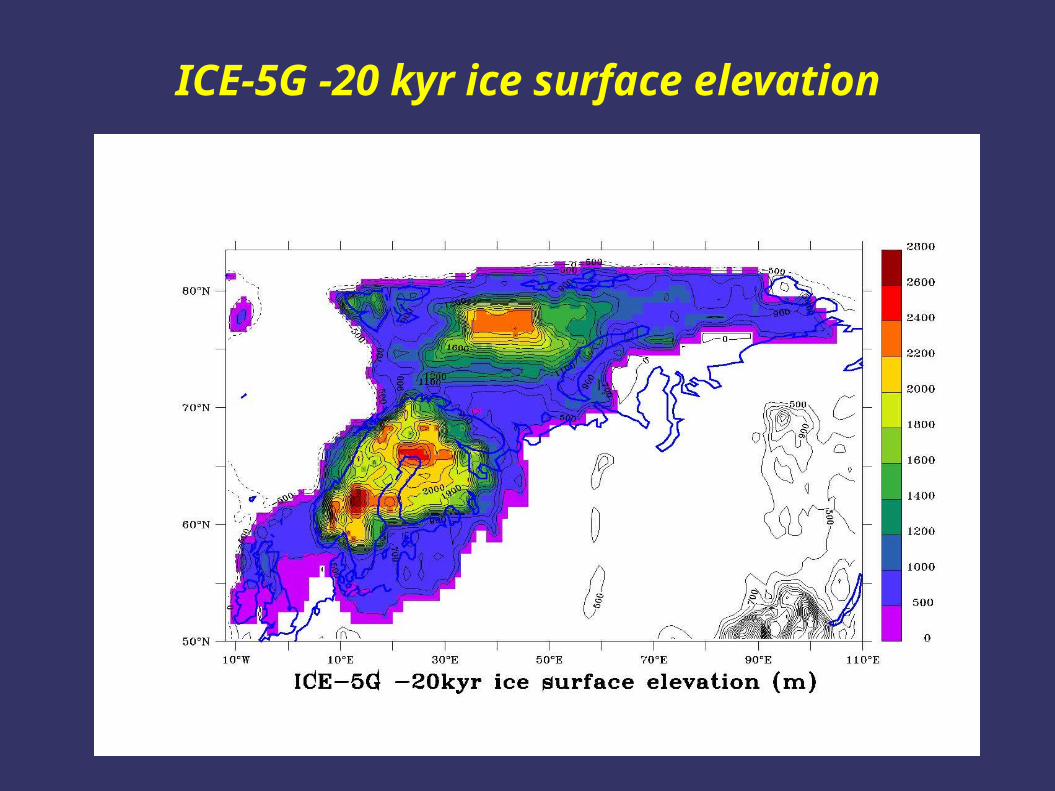
ICE-5G -20 kyr ice surface elevation
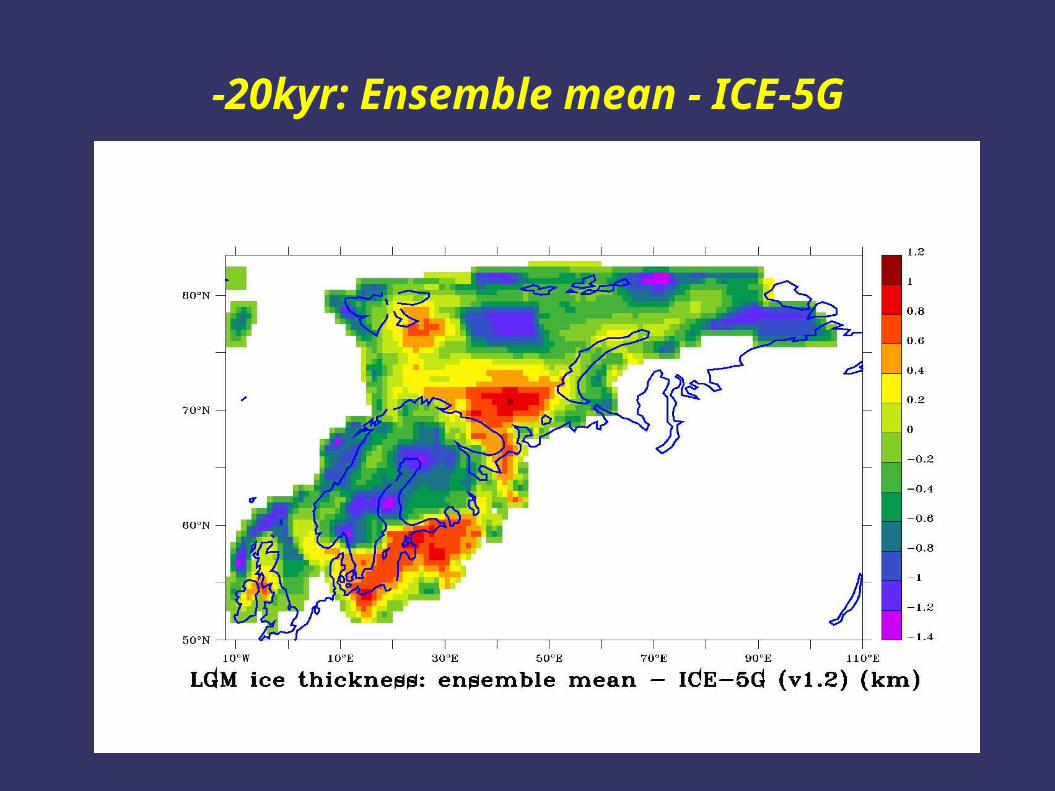
-20kyr: Ensemble mean - ICE-5G
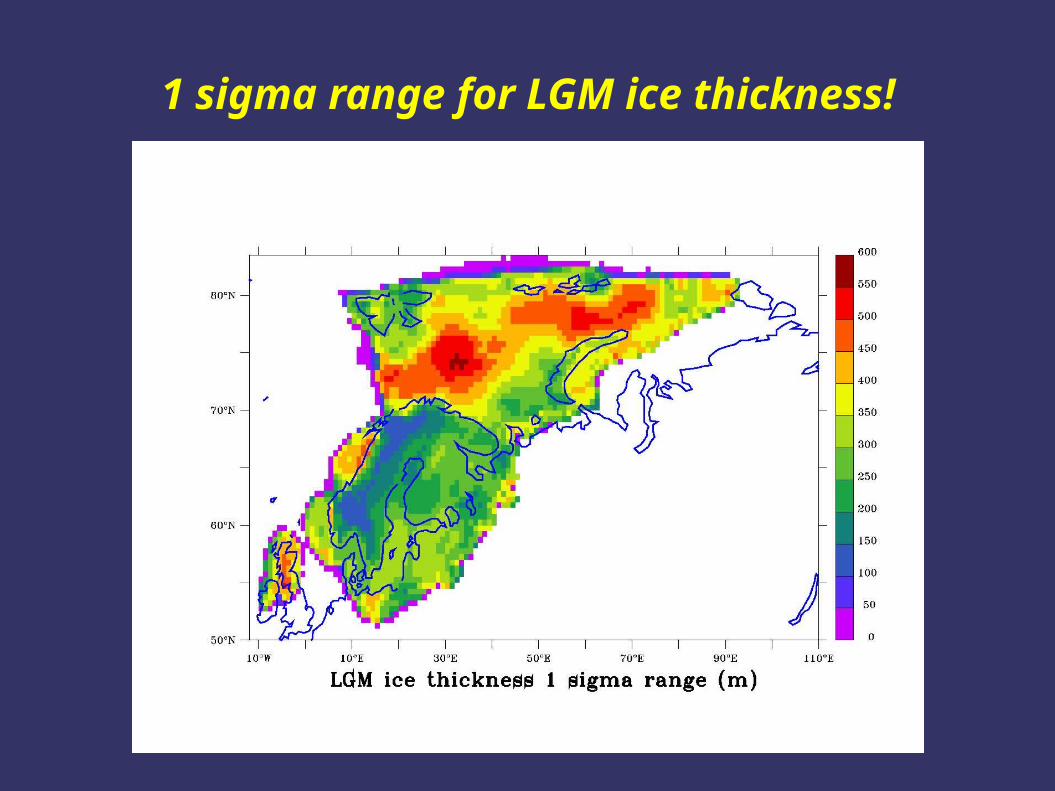
1 sigma range for LGM ice thickness!
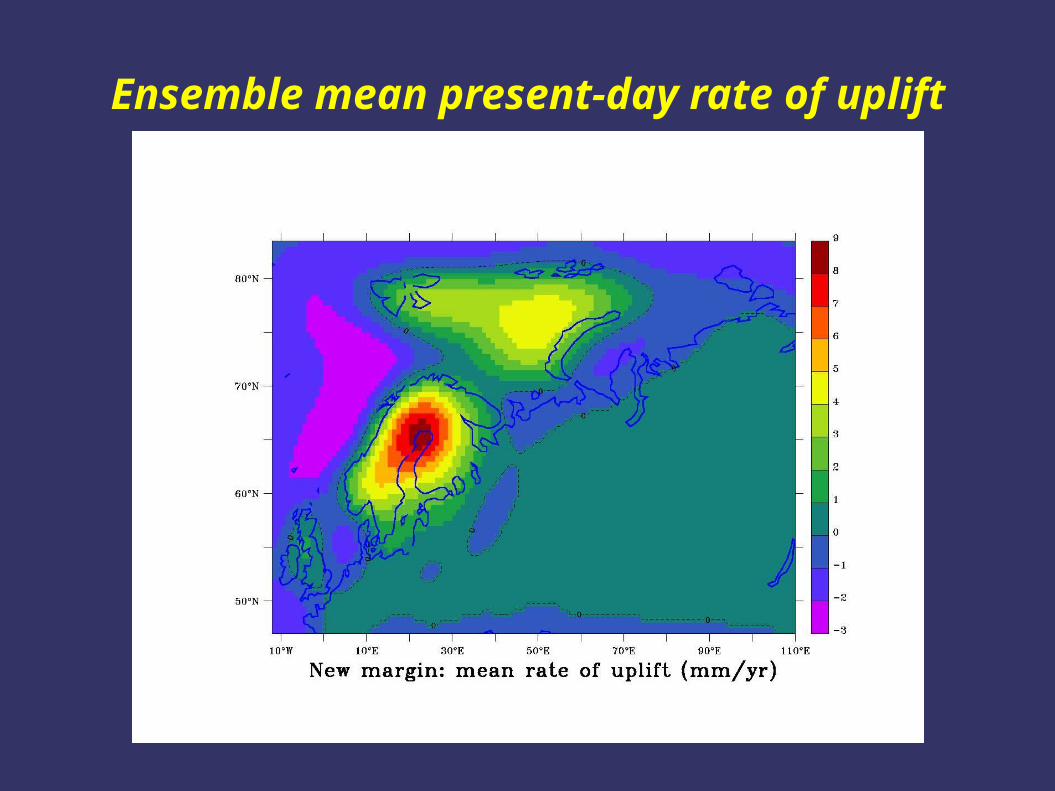
Ensemble mean present-day rate of uplift
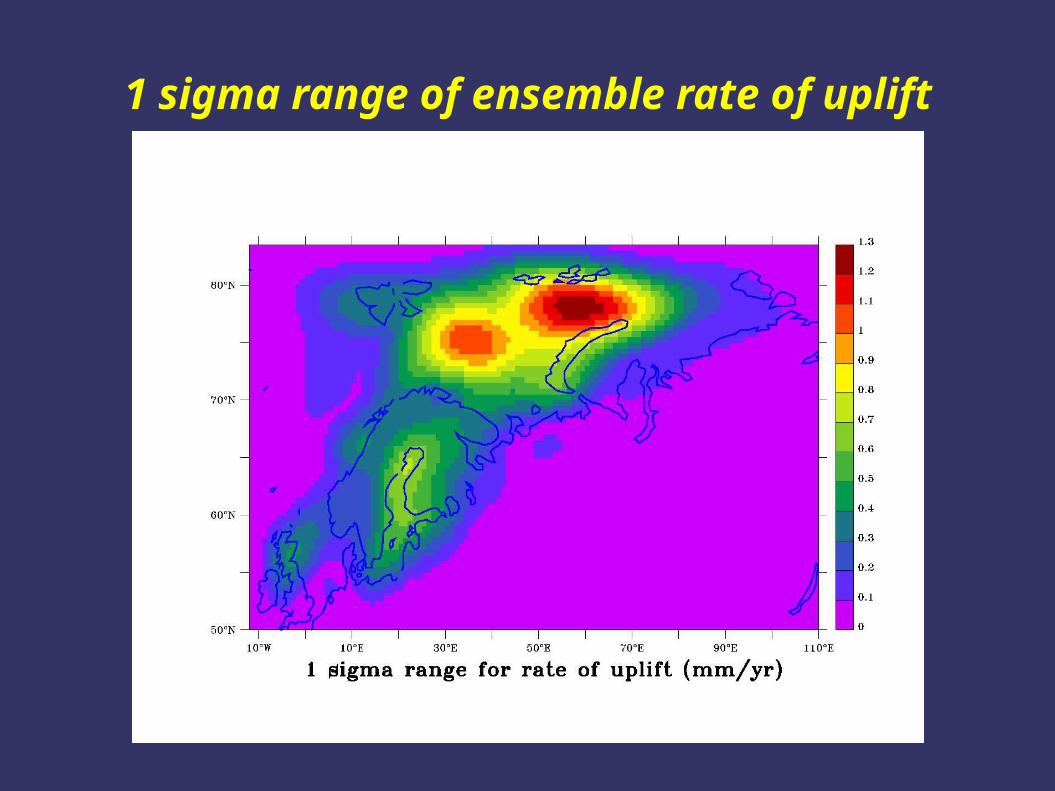
1 sigma range of ensemble rate of uplift
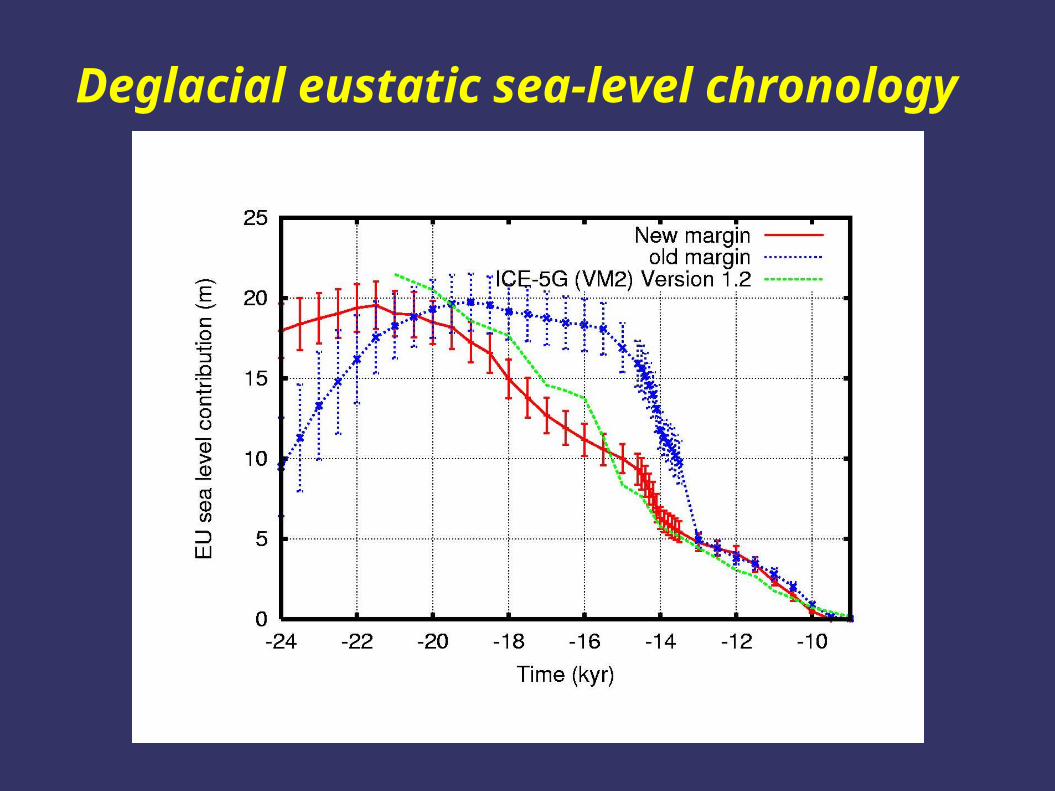
Deglacial eustatic sea-level chronology
Summary
European contributions: LGM: 19.5 +- 1.5 m eustatic mwp1-a: 3.1 +- 0.5 m eustatic (4.9 +- 0.8 m old margin)
Strong dependence on margin chronology (given apparent uncertainties)
likely problems with western margin chronology for Fennoscandia and/or sub-grid issues related to lack of resolution of fjords and/or lithospheric thickness
Significant differences with ICE-5G => can’t ignore climate and ice dynamics
physical model + calibration against data => meaningful error bars/probability distributions