Embed Size (px)
Citation preview
LLNL-JRNL-490059
A PRELIMINARY COST ANDENGINEERING ESTIMATE FORDESALINATING PRODUCEDFORMATION WATER ASSOCIATEDWITH CARBON DIOXIDE CAPTUREAND STORAGE
W L Bourcier T J Wolery T Wolfe CHaussmann T A Buscheck R D Aines
June 29 2011
International Journal of Greenhouse Gas Control
Disclaimer
This document was prepared as an account of work sponsored by an agency of the United States government Neither the United States government nor Lawrence Livermore National Security LLC nor any of their employees makes any warranty expressed or implied or assumes any legal liability or responsibility for the accuracy completeness or usefulness of any information apparatus product or process disclosed or represents that its use would not infringe privately owned rights Reference herein to any specific commercial product process or service by trade name trademark manufacturer or otherwise does not necessarily constitute or imply its endorsement recommendation or favoring by the United States government or Lawrence Livermore National Security LLC The views and opinions of authors expressed herein do not necessarily state or reflect those of the United States government or Lawrence Livermore National Security LLC and shall not be used for advertising or product endorsement purposes
1
A Preliminary Cost and Engineering Estimate for Desalinating Produced Formation Water Associated With Carbon Dioxide Capture and Storage
Bourcier W La T J Wolery a T Wolfe b C Haussmann c T A Buscheck a and R D Aines a
a - Lawrence Livermore National Laboratory 7000 East Avenue Livermore CA 94550
b ndash PerLorica Inc PO Box 190 Rough and Ready California 95975
c - Water Systems Specialists Inc 5808 Princeton Ave NE Seattle WA 98105
Corresponding author
William BourcierL-184Lawrence Livermore National LaboratoryLivermore California 94550925-422-9885 office925-667-7165 cellbourcier1llnlgov
2
Abstract
The risk associated with storage of carbon dioxide in the subsurface can be reduced by removal of a comparable volume of existing brines (eg Buscheck et al 2011) In order to avoid high costs for disposal the brines should be processed into useful forms such as fresh and low-hardness water We have carried out a cost analysis of treatment of typical subsurface saline waters found in sedimentary basins comparedwith conventional seawater desalination We have also accounted for some cost savings by utilization of potential well-head pressures at brine production wells whichmay be present in some fields due to CO2 injection to drive desalination using reverse osmosis Predicted desalination costs for brines having salinities equal to seawater are about half the cost of conventional seawater desalination when we assume the energy can be obtained from excess pressure at the well head These costs range from 32 to 40cent per cubic meter permeate produced Without well-head energy recovery the costs are from 60 to 80cent per cubic meter permeate These costs do not include the cost of any brine production or brine reinjection wells or pipelines to the well field or other site-dependent factors
Keywords carbon capture and storage desalination brines reverse osmosis osmotic pressure produced waters
3
11 Introduction
A major risk associated with geologic sequestration of carbon dioxide is the buildup of pressure in the subsurface due to injection The maximum sustainable pressure is limited by the ability of the cap-rock to contain the CO2 as a low permeability barrier and also the potential for the overpressure to create new fractures or to reactivate existing fractures which would then open new flow paths for CO2 escape (Rutqvist et al 2007) Moreover emplacement of CO2 could drive the existing brine into useful aquifers where potable water would be contaminated and could also increase the likelihood of induced seismicity (Bachu 2008)
A method to avoid these potential problems is to withdraw the saline fluid existing in the subsurface and thus reduce the amount of overpressure However the outstanding problem with this approach is the disposition of the withdrawn fluids Because of their high salinities (gt10000 mgL TDS) these fluids are generally not useful for either domestic or agricultural use The large volume of CO2 to be emplaced implies a similarly large fluid volume must be produced Such a large volume of brine cannot be disposed of as-is without significant cost
Desalinating the produced brines using membrane-based technologies is a potential solution that would allow brine withdrawal with disposal partly accounted for by production of useful low salinity water Moreover some of the energy needed to drive desalination could be obtained directly from the overpressure present in the subsurface generated by the emplacement of CO2 for some sequestration sites This would allow are-capture of some fraction of the energy used to pressurize and inject CO2 into the subsurface to be used to desalinate the produced fluids This can be done directly using reverse osmosis (RO) a technology that uses a pressure gradient across a semi-permeable membrane to produce desalinated water
An additional benefit is that strategic withdrawal and reinjection of brines may allow manipulation of the location and migration of the CO2 pool in the subsurface This could be accomplished by using brine injectionwithdrawal to alter the subsurface pressure field so as to affect the pressure gradient surrounding the CO2 pool in the desired way This ability to manipulate the CO2 by imposing pressure gradients has the potential to substantially reduce the inherent risk of geologic sequestration of CO2 (Buscheck et al 2010)
The permeate (low salinity water) produced from the reverse osmosis desalination process would be suitable for power plant cooling or could be used for agricultural domestic or other uses for which it has monetary value The residual brine produced by the process could be re-injected back into the aquifer such that there would be
4
minimal brine disposal cost With brine re-injection the net volume of water removed would be approximately equal to the amount of fresh water recovered in the reverse osmosis process
In this paper we examine the costs and benefits associated with the concept of removal and desalination of fluids present in CO2 sequestration sites We note that the full development of all of the concepts noted in this paper will require a considerable body of future work The scope of this paper is necessarily limited to only one aspect water treatment Using brine removal to control reservoir pressure and manage plume shape and migration is being developed within the concept of Active CO2 Reservoir Management or ACRM (Buscheck et al 2011 Court et al 2011) The need to manage displaced brine has been noted in the case of commercial scale sequestration in the Rock Springs Uplift of Wyoming (Surdam et al 2011) Court et al (2011) note other examples where this need has been realized We note that the issue of pressure buildup in saline formations targeted for CO2 sequestration has become a somewhat controversial topic (cf Ehlig-Economides and Economides 2010 Dooley and Davidson 2010) and that more and specific analyses will be required to determine where pressure buildup (or brine migration which relieves pressure buildup) might and might not be a potential problem and under which conditions it may be possible to produce pressurized brine
111 Desalination Technologies
For most of human history desalination of water has been accomplished through distillation Most of the worldrsquos desalination of ocean water is still carried out using thermal distillation (Buros 2000) However membrane-based methods such as reverse osmosis developed over the last 50 years are now the technology of choice for new desalination plants (NRC 2008) Membrane-based methods are expected to soon overtake thermal methods in total capacity driven mainly by the high energy costs of thermal methods (Karagiannis and Soldatos 2008) The heat of vaporization of water is so large (~630 kW-hm3) that even extremely efficient energy recovery (gt90) in thermal systems cannot compete with energy costs of 4-6 kW-hm3 typical for seawater RO systems (Khawaji et al 2008)
Reverse osmosis (RO) uses a membrane permeable to water but impermeable to salt to separate salt from water To carry out reverse osmosis a pressure gradient is imposed across a membrane that separates the solution to be de-salted (eg ocean water) from a more dilute solution Because of the osmotic pressure gradient water naturally tends to flow from the dilute solution to the salt solution By applying a pressure larger than the osmotic pressure in an opposite direction water can be forced to flow from the salt solution across the membrane to the dilute side For desalination of seawater pressures on the order of 5-7 MPa (700-1200 psi) are used to overcome the
5
25 MPa (~360 psi) of osmotic pressure gradient between ocean water and dilute permeate (Fritzmann et al 2007)
Typical aromatic polyamide thin film composite reverse osmosis membranes are composed of a 200 nm layer of semi-permeable polyamide that is cast onto a porous polysulfone support material (Figure 1) which itself sits on a spacer to allow water flow along the membrane [FIGURE 1] The pore size of the polyamide is controlled for the specific application of use Pores size estimates are in the range of 5-10 Angstroms(Baker 2004) Smaller pore-sized (tighter) membranes are used for high salinity solutions such as seawater in order to increase salt rejection Larger pore-size membranes are used for more dilute (brackish) waters where less salt rejection is needed to produce permeates that are potable (lt500 mgL TDS) Salt rejection for tight membranes is greater than 99 salt rejection for brackish water membranes is 98-99(Amjad 1993) The downside to high rejection is that the membrane is less permeable for water transport and therefore higher driving pressures are needed to produce the same water flux (Fritzmann et al 2007)
Reverse osmosis is limited by the maximum pressure difference that the membrane spacers can withstand without collapsing and causing the membrane to become impermeable to water flow (Matsuura 2001) The current limit for commercially available membranes is about 83 MPa (1200 psi) The semi-permeable polyamide layer can withstand higher pressures and does not itself currently limit maximum RO pressures
Nanofiltration (NF) membranes are similar to RO membranes but are synthesized with larger pores and usually bear some surface charge due to changes in the membrane chemistry They are able to separate divalent from monovalent ions For example a nanofiltration membrane may allow Na and Cl to pass through the membrane freely while rejecting greater than 90 of the sulfate and calcium in many fluids (Hilal et al 2004) The actual selectivity of NF membranes varies with some functioning more like RO membrances with low rejection NF membranes are typically used for removing hardness (divalent cations such as calcium) from waters and also for removing sulfate to prevent sulfate mineral scaling Because NF removes only some fraction of the electrolyte content it operates at lower pressure differences than RO (because the osmotic pressure depends on the salinity gradient across the membrane not the total salinity) NF can be used in front of RO to partially reduce the feed salinity and reduce pressure for the subsequent RO stage In this way the maximum salinity limit formembrane treatment can be increased
Reverse osmosis systems can operate over a range of water recoveries Recovery is defined as the volume ratio of product water (permeate) to feed High recoveries are preferred because they more efficiently use the energy applied to pressurize the fluid
6
Once feed water is pressurized it can continue to generate a clean permeate until its salinity increases to the point where the osmotic pressure gradient is nearly equal to the applied pressure Upon exiting an RO unit the residual brine (on the feed side of the membrane) is still pressurized Energy recovery methods are generally used to capture that energy using either turbines or pressure exchangers that transfer the pressure of the exiting concentrate to the upstream feed
The downside to high recoveries is the increased likelihood of mineral scaling High pressures cause more rapid water flux through the membrane and increases ldquoconcentration polarizationrdquo at the membrane surface This refers to the buildup at the membrane surface of anything contained in the fluid that does not pass through the membrane in particular salt and high MW species too large to fit through the 5-10Aring pores in the polyamide layer
All of these considerations must be accounted for in accessing desalination costs Software packages such as WTCOST (Moch 2008) have been created that provide for unit process costs of each treatment step and are used to identify the minimum cost treatment configuration Seawater desalination costs for membrane-based systems generally vary between $050 and $100 per cubic meter of product (Karagiannis and Soldatos 2008) Costs increase with the salinity of the fluid because of the higher pressure needed to drive water through the membranes Energy costs for seawater desalination are generally half the total cost Because membranes are easily fouled by organics biological activity and mineral formation pretreatment to avoid fouling is needed and can significantly increase cost Pretreatment is highly specific to the feed with waters having high organic productivity being particularly difficult to pretreat Formation waters are generally not very biologically active and some of these pretreatment costs can therefore be avoided However formation waters may contain other components that would introduce a different set of pretreatment problems and costs We will discuss this later in this paper
112 Limitations of Membrane Desalination Technologies
The main limitation of membrane-based desalination technologies is the salinity of the feed Higher salinity requires a higher pressure difference across the membrane in order to produce permeate This pressure difference must be maintained below a certain limit to avoid loss of permeability due to membrane compaction As noted previously this limit is associated with the properties of the spacers Figure 2 shows the relationships between osmotic pressure and water recovery (percent extraction) during treatment of waters having a range of starting salinities [FIGURE 2] A recovery of 20 means that for each 1000 ml of feed 200 ml of permeate and 800 ml of brine are produced Lines are drawn for recoveries of 0 10 20 and 50 This plot illustrates the basic effect which is driven mainly by salinity as represented by TDS (Total Dissolved
7
Salts) commonly given in mgL All the waters here are taken to be in the ldquoseawaterrdquo family (which extends in nature to about 350000 mgL TDS greater than the range shown here) The ionic ratios correspond to those in seawater the essential feature being that these brines are NaCl-dominated The results here are representative for many but not all subsurface brines (cf Kharaka and Hanor 2007) At least two other major types occur Na-Ca-Cl brines and Na-Cl-SO4 brines which occur in the RockyMountain Basins region Somewhat different results should be expected for waters of these types (we will present below examples of calculations for specific brine chemistries)
Figure 2 can be used to estimate the maximum osmotic pressure for a fluid undergoing desalination at a given recovery (it will be more accurate for a fluid in the seawater family) For example for a salinity of 78000 mgL (shown by the left vertical dotted line) the initial osmotic pressure is about 62 MP (900 psi) and after recovering 20 of the fluid as permeate the residual brine would have an osmotic pressure of 82 MPa (1200 psi) the upper maximum for current RO membranes Above this pressure the membrane product spacers collapse and the membrane elements can no longer pass permeate to the discharge tube (see Figure 1)
Note that this pressure limit is not a limit for the functional part of the membrane only the materials currently used as supports Higher pressure membranes useful up to 103 MPa (1500 psi) have been developed and allow brines up to about 80000 TDS to be desalinated (eg Baker 2004) but are not yet commercially available
21 Subsurface brines
To estimate brine desalination costs we need to know the characteristics of the fluidspresent in the subsurface at proposed carbon storage sites Because a catalog of site data are not yet available we use here a database for subsurface brines co-produced from oil and gas wells and compiled by the US Geological Survey (Breit 2002) This dataset covers the oil and gas-producing areas of the US and has over 14000 analyses These data are relevant because these brines are typical of sedimentary basins that host petroleum reservoirs in permeable rocks sites that are also targets for subsurface CO2 storage (Kharaka 2007) Analysis of these data provides compositional information on the brines present in sedimentary basins and theirdistribution with depth and geographic location The USGS database contains abundant data for most of the states west of the Mississippi River but does not have good coverage for most of the eastern states We note that other databases of produced waters exist notably NATCARB (Carr et al 2007)
Figure 3 shows the distribution of salinities from the USGS database for fluids produced from depths greater than 3000 feet (about one kilometer) [FIGURE 3] The
8
salinity range varies widely up to over 300000 mgL (30 wt ) where salt mineral saturation begins to limit TDS Over half of the brines have salinities less than 85000 mgL TDS Although there is some tendency for brines to become more concentrated with depth there are many exceptions to this For example in Wyoming waters in the Nugget Formation with salinities of over 80000 mgLTDS overlie the Tensleep Formation which has waters with salinities less than 25000 mgL TDS (cf data for Sublette County Wyoming from Breit 2002)
The concentration of calcium plus magnesium (hardness calcium + magnesiumexpressed as equivalent mgL calcium) in the database is shown in Figure 4 [FIGURE 4] Fluids with relatively high hardness are more susceptible to scale formation but are also amenable to calcium and magnesium removal using nanofiltation Fluids with hardness above about 10000 mgL are prime candidates for salinity reduction using an NF-RO process which effectively increases the salinity maximum for membrane desalination by first removing hardness (calcium magnesium and other divalent ions) prior to removal of the remaining salts Over 20 of produced waters have hardness in this range based on the USGS database
Some produced brines have significant hydrocarbon contents which will require complete removal as these compounds are known to irreversibly foul RO membranes(Fritzmann et al 2007) This is one of the reasons many co-produced waters from fossil fuel production are not currently treated but are instead re-injected into the subsurface at significant cost For this reason fluids from CO2 sequestration sites that contain significant amounts of hydrocarbons will be more costly to desalinate Additional research is needed in this area to address this problem New treatment methods may be needed if existing ones prove insufficient or overly costly Other pre-treatment needs may arise from the presence of other components such as dissolved iron and silica In the present paper we make the assumption that such problems can be dealt with at reasonable cost and focus instead on mineral precipitation involving major ions and the development of osmotic pressure resulting from extraction of water
Both mineral scaling and osmotic pressure can limit how much fresh water can be recovered from a given brine An example is shown in Figures 5 and 6 for reverse osmosis treatment of three solutions seawater and two saline waters from formations in Sublette County Wyoming a potential carbon storage site (cf httpwwwelectricityforumcomnewsnov08DOEtofundcarboncaptureprojecthtml) The compositions of the two saline formation waters were taken from Breit (2002) The first Wyoming brine ldquoSublette 3rdquo (UNIQID 49003037) from the Nugget Formation is very saline (86000 mgL TDS 29000 Na+ 2650 Ca++ 2400 K+ 1200 SO4-- 415 HCO3
- ) The second Wyoming brine ldquoSublette 2rdquo (UNIQID49003313) is a high sulfate brine of lower total salinity (24500 mgL TDS 7800 Na+ 200 Ca++ 100 Mg++ 14600 SO4--
9
1340 HCO3-) from the Tensleep Formation which underlies the Nugget Formation
[FIGURE 5] [FIGURE 6] In Figure 5 we show predicted mineral scaling of seawaterand the Sublette County brines during reverse osmosis treatment simulated using the EQ36 modeling software (Wolery and Jarek 2003) For seawater Figure 5a shows that as the water is concentrated during reverse osmosis both calcite (CaCO3) and anhydrite (CaSO4) are predicted to precipitate However both phases can be controlledusing anti-scalants and do not necessarily limit water recovery Likewise for the Sublette County 3 brine calcite and anhydrite are predicted to precipitate (Figure 5b) For the high sulfate Sublette 2 brine (Figure 5c) only anhydrite is predicted to precipitate even at recoveries of over 85 However in all three cases at very high recoveries halite (NaCl) and other phases such as glauberite (Na2Ca(SO4)2) nahcolite (NaHCO3) and thenardite (Na2SO4) are predicted to precipitate in quantitites that provide a firm upper limit to recovery
We calculate the osmotic pressure for the same feed solutions as they are concentrated in the reverse osmosis process The pressures are shown by the red and blue lines in Figure 6 The blue line is calculated using a simple formula based on ideal mixing (the vanrsquot Hoff equation Dow 2009) The red line shows a more rigorous calculation using Pitzerrsquos equations and is based on thermodynamic measurements of salt solutions and includes non-ideal mixing corrections (Greenberg and Moller 1989 Pabalan and Pitzer 1987) As can be seen at high salinities the two methods differ by several MPa indicating that the more rigorous osmotic pressure calculation must be used for solutions for modeling salinities above about 1 molal Comparing Figure 6b and 6c shows that the more rigorous calculated pressure can be either higher or lower than the vanrsquot Hoff value depending on the solution composition and in particular on the relative amounts of monovalent and divalent ions
The upper limit on recovery occurs when the lines cross the horizontal line drawn at 83 MPa (1200 psi) the current membrane technology pressure limit For seawater (a) the absolute limit is a recovery of about 65 which corresponds to a practical recovery limit of less than about 50 This is because for normal operation the pressure across the membrane must be equal to the osmotic pressure plus an additional differential pressure of 07-14 MPa (100-200 psi) to maintain appreciable flow of water across the membrane For the more saline Sublette 3 water (~86000 mgL TDS) the theoretical recovery is limited by osmotic pressure to about 7 or for practical purposes the brine is at the edge of treatability using conventional reverse osmosis For the less saline Sublette 2 water recoveries of 80 appear achievable Overall it is apparent that the development of osmotic pressure is more limiting than mineral precipitation
10
We conclude that the potential for freshwater extraction from saline brines can be categorized as follows
bull 10000ndash40000 mgL TDS Standard RO with ge 50 recovery
bull 40000ndash85000 mgL TDS Standard RO with ge 10 recovery higher recovery possible using 103 MPa (1500 psi) RO membranes andor multi-stageincremental desalination including NF (nanofiltration)
bull 85000ndash300000 mgL TDS Multi-stage process (NF + RO) using process design that may differ significantly from seawater systems
bull gt 300000 mgL TDS brines Not likely to be treatable
As can be seen in Figures 3 and 4 brines in the 10000-85000 mgL TDS range appear to be abundant (geographically and with depth) and could be targeted in siting CCS operations These brines will be chemically different than seawater and these differences will affect treatment costs Brines greater in salinity than 85000 will be expensive to treat and will not be addressed further in this paper
211 Desalination of seawater vs saline formation water
Because many of the candidate brines present in the subsurface at sequestration sites have salinities somewhat similar to that of seawater we will use for our first cost analysis a generic fluid having a total salinity equal to that of normal seawater but with specific chemical characteristics more typical of subsurface brines This allows the most accurate cost estimate to be made with minimal additional assumptions There is abundant experience and cost data available for the reverse osmosis desalination of seawater (Karagiannis and Soldatos 2008)
A conventional seawater RO desalination system uses raw ocean water as feed The ocean water is first filtered for particulates and micro-organisms Instead of open water intakes many treatment plants now take the feed from wells drilled into the coastal sand wedge to take advantage of the sand as a first filtration step (Frenkel 2011) The water may then be acidified have antiscalants added filtered again at a finer size and then pressurized and passed into the RO elements The RO elements are arranged in multiple stages to maximize permeate recovery and minimize the energy used to pressurize the system The feed water stays pressurized throughout the desalination process It exits with a pressure only 1mdash30 kPa lower than the starting pressure The permeate fluid may be adjusted in pH and chlorinated prior to being sent to storage and distribution The concentrate is sent to disposal typically piped out to sea
The major steps in desalination of saline formation water are compared with those of conventional seawater RO in Figure 7 [FIGURE 7] For the saline water we assume for this analysis that we have a well-head pressure of 83 MPa (1200 psi) This is at the
11
upper limit of what can be used in current RO systems and therefore provides an end-member cost comparison We also account for the likely differences for desalinatingfluids pumped from the subsurface versus those obtained from the ocean We then compare the process steps for seawater vs pressurized brine and examine how they differ
The first difference is that the saline formation fluids are assumed to be saturated with several mineral phases a good assumption since they have had significant time in the subsurface to equilibrate with the surrounding reservoir rocks These minerals include carbonates sulfates and silicates As a consequence we include in our process costs much more extensive pre-treatment in particular the addition of antiscalants and acid to avoid mineral scaling of the membranes
We assume there is none or only minor biological activity in the saline formation fluids as is typical for fluids co-produced with oil and gas compared with ocean water This allows us to eliminate the need for extensive biological pre-treatment to avoid biofilm formation Biofilm formation is generally regarded one of the most difficult problems in seawater RO systems (Amjad 1993)
Many saline formation waters contain significant hydrocarbons which are known to aggressively foul RO membranes (Fritzmann et al 2007) Removal methods may be needed if the saline water contains significant hydrocarbons (xx We discussed this earlier - need to resolve this)
Since the measured temperature for many reservoir feeds can exceed 100degC the saline formation water may need to be chilled to a temperature cool enough to allow treatment using conventional RO membranes The current limit for long-term use of conventional membranes is around 50oC although high-temperature elements are available that can be used up to 70oC (Snow et al 1996) Heat exchangers will therefore be necessary to bring the feed water to within the membrane operating envelope We include in our costs the use of heat exchangers of a shell and tube design (due to the high pressures involved) and made of 317L stainless steel or better and employed in a split stream formation The necessary corrosion resistance of the material to be used will be a function of the chloride and sulfide levels in the reservoir fluid
The split heat exchanger arrangement would cool a portion of the feed using the counter flowing previously cooled permeate The second heat exchanger package would treat the remaining hot feed by cooling it with the previously cooled reject
The inherent heat losses and inefficiencies of this heat transfer arrangement would be supplemented by an auxiliary heat transfer device which would either be in the form of an air cooled atmospheric exchanger or it would be tied into the power plant cooling system to provide for the additional cooling as needed In our cost analysis we assume
12
air cooling For the latter arrangement surplus cooling capacity from the power plant would be required While there would be some pressure losses associated with the passage through the heat exchange system the pressure drops across exchangers are typically less than 100 kPa
One area of difference between the two processes is that the design of seawater systems views the amount of feed strictly from an economic point of view The only treatment product of value is the extracted permeate water Seawater RO plants strive to maximize recovery in order to reduce the cost per unit volume of permeate for a given degree of pressurization
The situation is different for conditions where there is significant subsurface pressure (eg well confined sequestration reservoirs) because a significant fraction of the energy needed to drive RO can be obtained from the pressurized reservoir In this case energy costs which ordinarily make it most effective to maximize recovery are less important and allow favorable economics for low recovery The benefit from low recovery is that it increases membrane longevity by reducing the risk of membrane scaling and lowering the driving pressure The down side is that one now then has to pump and treat a larger volume of brine in order to produce the same amount of permeate ndash and equivalent storage space for CO2 in the subsurface We explored a range of recoveries in our cost analysis
The last stage of seawater RO is an energy recovery step where the pressure of theexiting concentrate is recovered and used to either generate electrical energy or to pressurize the incoming feed The energy recovery device is not needed for our saline formation water process because the residual pressure is needed to re-inject the concentrate back into the formation In fact the pressure of the concentrate may need to be increased depending on where it is injected into the formation
31 Saline formation water desalination costs
A list of the treatment components for seawater compared to saline formation waters is given in Table 1 These are the unit processes and operations that are considered in our cost analysis that follows The system capital costs include the following major components
1 High pressure piping from the well head to the treatment system The piping would require a material quality of 316L or better to minimize corrosion
2 Activated carbon pretreatment to remove organics (oil and grease) unlike conventional seawater RO these systems will have to accommodate high feed pressure
3 Heat exchanger to reduce the feed temperature to 50degC 4 Cartridge filter system
13
5 Chemical injection system for scale inhibitor or acid6 RO skids pressure vessels and membranes7 System instrumentation and control (IampC)8 System piping valves controls amp instruments9 Forward flush and clean-in-place systems10Tankage for chemicals and permeate water11Re-pumping station for reject (concentrate) deep well injection 12Pretreatment system for deep well injection13Civil works equipment housing and installation costs14One spare RO train for standby assurance
We did not include costs for land acquisition or for construction of the brine well field which includes costs associated with drilling production and reinjection wells
Operating and maintenance costs include
1 Consumable chemicals filter replacements etc2 Hazardous wastes disposal costs3 RO membrane replacement depreciation ranging over two (2) to four (4) years
depending on the percent recovery of the system4 Labor costs for supervisorengineer operators and technician Salaries estimated
with an overhead factor of two (2)5 Maintenance estimated at 3 of capital annually
The capital and operating costs were analyzed for several system sizes and recoveries Base models for costing were developed for 2 and 4 million gallons per day (MGD) systems which were then used to estimate the costs for the 6 and 8 MGD systems using exponential escalation factors Elements vessels and piping were estimated by actual cost and quantity or in the case of piping per pound costs for calculated pipe diameters and thickness
RO costs were estimated for 45 40 35 30 25 and 15 percent recoveries -defined as percent permeate extracted from the feed As described above percent recovery is a function of the incoming feed salinity Since processing ceiling is dictated by the maximum allowable membrane operating pressure the osmotic pressure of the reject stream becomes the limiting factor The higher the feed salinity the lower thepercent recovery before the maximum allowable pressure is reached Operating pressure is comprised of the osmotic pressure of the concentrate plus the hydraulicpressure loss created by the membrane barrier plus a driving pressure to push water through the membrane) At a feed TDS of 60000 mgL recovery may be limited to 15 to 20 recovery for maximum operating pressures of 83 MPa (1200 psi)
14
Table 2 summarizes the major costs and cost factors employed in developing the system costs Results for the scenarios are displayed in Table 3 and Figures 8 and 9 Figure 8 shows that levelized water costs per acre-foot of permeate vary from about $450 to $1000 (32-81cent cubic meter one acre foot is 1233 cubic meters) and that the costs decrease as the size of the operation increases [FIGURE 8] In addition there is a cost effective recovery point (minimum) in plots of recovery vs cost
Most importantly however the lower recovery options are economically close to the higher recovery options ndash that is the curve is fairly flat With conventional pumped systems the curve is much more pronounced greatly favoring higher recovery As mentioned above this is because the additional costs associated with moving and pressurizing additional feed is now reduced because the pressurization is no longer a large operating expense In this scenario we assume that the energy to pressurize the fluid is supplied by the reservoir (which we believe may be obtainable for some but not likely all storage reservoir scenarios)
Although we have assumed a fluid salinity similar to that of seawater our estimated costs are not highly sensitive to salinity This is because we assume the energy for desalination comes mainly from the existing reservoir pressure field and is not a major component of the operating cost In a conventional desalination system an increase in salinity makes the process more expensive due to the need for additional energy to operate the system at higher pressures For this reason we believe our estimated costs are fairly representative for the range of fluid salinities for which an essentially conventional RO process can be used (ie 10000-85000 mgL TDS)
Figure 9 directly compares the costs for a system using reservoir pressure to drive the RO process with an identical system using high-pressure pumps [FIGURE 9] The difference between the curves reflects the estimated cost of energy to drive the desalination system Note also the pumped system shows a steeper cost vs recovery curve
One of the items to warrant further review is the problem of optimizing the front end heat exchanger system used to reduce the reservoir fluidrsquos temperature for RO processing As described above a cooling device to accomplish the necessary heat reduction mightconsist of a split heat exchanger arrangement which will have to be augmented via a secondary heat reduction source The specific nature of this supplementary heat rejection will have to be considered The technical and cost impact of coupling the heat reduction with the power plantrsquos cooling system vs a stand-alone system that uses atmospheric cooling possibly augmented by spray evaporation must be made Since this would consume RO permeate thereby reducing the amount of recovered water for power plant use it may be a significant factor to consider
15
41 Conclusions
Our analysis indicates that RO plants for CCS brines that are similar in salinity to seawater can be built and operated for about half of the cost of seawater desalination if sufficient over-pressure (from CO2 injection) exists to supply the pressure needed to drive reverse osmosis Over 40 of subsurface brines co-produced with fossil fuels have salinities at or below seawater For a fresh water production of six million gallons per day (about 23000 cubic meters or about 18 acre feet) we estimate costs of about 32 to 40cent per cubic meter permeate produced Without well-head energy recovery the costs are from 60 to 80cent per cubic meter permeate similar to conventional seawater desalination This analysis includes all surface facilities transfer pumps and piping but does not consider the cost of the brine extraction and reinjection wells which will be site dependent
The costs for membrane desalination of sedimentary brines that are higher in salinity than our upper limit of 85000 mgL will be larger It is currently impossible to estimate these costs because membrane treatment technologies that operate in that salinity range do not exist However we believe it is likely that improved RO technologies capable of desalinating more concentrated brines would quickly become available if sufficient demand existed As mentioned above both the pressure and temperature limits are due to support materials and are not intrinsic limitations of the semi-permeable polyamide membrane High temperature-pressure RO membranes could be constructed with improved support materials For these reasons we expect the treatment costs for higher salinity brines to be only modestly higher than those for seawater after allowing for higher pressures and lower recoveries
The amount of fresh water produced by our process is significant For example atypical 1 GW coal plant emits more than 7 MtCO2year A well-designed capture system might provide 6 MtCO2 for sequestration Sequestered at a depth of 300 meters this CO2 would displace about 8 million cubic meters of water per year or about 22000 cubic meters per day Reverse osmosis treatment of that brine with a recovery of 40 would annually produce about 32 million cubic meters of fresh water which could serve the needs of 10000 homes irrigate 2000 acres of cropland or provide half of the water volume usage of a typical 1 GW IGCC power plant based on a plant use of about 2000 litersMW-h (Grubert and Kitasei 2010)
An additional benefit of our process is that strategic withdrawal and reinjection of saline aquifer brines will allow manipulation of the location and migration of the CO2 pool in the subsurface This could be accomplished by using brine injectionwithdrawal to alter the subsurface pressure field so as to affect the pressure gradient surrounding the CO2 pool in the desired way This ability to manipulate the CO2 by imposing pressure gradients
16
has the potential to substantially reduce the inherent risk of geologic sequestration of CO2
Finally site selection for saline aquifers suitable for disposal of carbon dioxide and for which brine removal increases reservoir capacity should include some consideration of the fluid salinity because lower salinity fluids are less costly to desalinate
Acknowledgements
Financial support for this work was provided by DOE through the National Energy Technology Laboratory We thank Sean Plasynski and Andrea McNemar for their help and advice We also thank Geoffrey Thyne of the Enhanced Oil Recovery Institute at the University of Wyoming George Breit of the USGS and Julio Friedmann of LLNL for helpful discussions about produced waters
17
References
Amjad Z 1993 Reverse Osmosis Membrane technology water chemistry and industrial applications Springer 384 p
Bachu S 2008 CO2 storage in geological media Role means status and barriers to deployment Progress in Energy and Combustion Science 34 254-273
Baker R W 2004 Membrane Technology and Applications 2nd ed John Wiley amp Sons Ltd Chichester
Breit GN 2002 Produced Waters Database US Geological Survey provisional database Downloadable from httpenergycrusgsgovprovprodwatindexhtm
Buros O K 2000 The ABCs of Desalting 2nd edition International Desalination Association Topsfield Massachusetts USA
Buscheck TA Hao Y Tompson A Sun Y Aines RD Wolery T Bourcier WL Burton E Waggoner J and Friedmann SJ 2011 Combining brine extraction desalination and residual brine reinjection with CO2 storage in saline formations Implications for pressure management capacity and risk mitigation Energy Procedia 4 4283-4290
Carr TR Rich PM and Bartley JD 2007 The NATCARB geoportal linking distributed data from the Carbon Sequestration Regional Partnerships Journal of Map and Geography Libraries Special Issue on Department of Energy (DOE) Geospatial Science Innovations 4(1)131-147
Court B Celia MA Nordbotten JM and Elliot TR 2011 Active and integrated management of water resources throughout CO2 capture and sequestration operations Energy Procedia 4 4221-4229
Dooley JJ and Davidson CL 2010 A Brief Technical Critique of Economides and Ehlig-Economides 2010 Sequestering Carbon Dioxide in a Closed Underground Volume PNNL-19249 Pacific Northwest National Laboratory Richland WA
Dow Water Solutions 2009 FILMTECTM Reverse Osmosis Membranes Technical Manual Form No 609-00071-1009 Dow Water Solutions Midland MI Downloadable from httpmsdssearchdowcomPublishedLiteratureDOWCOMdh_03440901b80380344689pdffilepath=liquidsepspdfsnoreg609-00071pdf
18
Ehlig-Economides C and Economides MJ 2010 Sequestering carbon dioxide in a closed underground volume Journal of Petroleum Science and Engineering 70 123-130
Frenkel V S 2011 Chapter 6 in Desalination Trends and Technologies Michael Schorr ed InTech February 2011
Fritzmann C Lowenberg J Wintegns T and Melin T 2007 State-of-the-art of reverse osmosis desalination Desalination 216 1-76
Greenberg J P and N Moslashller N 1989 The prediction of mineral solubilities in natural waters A chemical equilibrium model for the Na-K-Ca-Cl-SO4-H2O system to high concentration from 0 to 250degC Geochimica et Cosmochimica Acta 532503ndash2518
Grubert E and Kitasei S 2010 How energy choices affect fresh water supplies A comparison of US coal and natural gas Worldwatch Institute Briefing Paper 2
Hilal N Al-Zoubi H Darwish N A Mohammed A W and Arabi M A 2004 A comprehensive review of nanofiltration membranes Treatment pretreatment modeling and atomic force microscopy Desalination 170 281-308
Karagiannis I C and Soldatos P G 2008 Water desalination cost literature review and assessment Desalination 223 448-456
Kharaka Y K and Hanor J S 2007 Deep fluids in the Continents I Sedimentary Basins Chapter 516 in Treatise on Geochemistry H Holland and K Turekian eds p 1-48 Elsevier
Khawaji A D Kutubkhanah I K and Wie J-M 2008 Advances in seawater desalination technologies Desalination 221 47-69
Matsuura T 2001 Progress in membrane science and technology for seawater desalination ndash a review Desalination 134 47-54
Moch I 2008 WT Cost II Modeling the capital and operating costs of thermal desalination processes utilizing a recently developed computer program that evaluates membrane desalting electrodialysis and ion exchange plants US Bureau of Reclamation Desalination and Water Purification Research and Development Program Report No 130
National Research Council 2008 Desalination A National Perspective National Academies Press httpwwwnapedu
19
Pabalan RT and Pitzer KS 1987 Thermodynamics of concentrated electrolyte mixtures and the prediction of mineral solubilities to high temperatures for mixtures in the system Na-K-Mg-Cl-SO4-OH-H2O Geochimica et Cosmochimica Acta 51 2429-2443
Rutqvist J J T Birkholzer J T Cappa F and Tsang C-F 2007 Estimating maximum sustainable injection pressure during geological sequestration of CO2
using coupled fluid flow and geomechanical fault-slip analysis Energy Conversion Management 48 1798ndash180
Snow M D de Winter Buckingham R Campbell J and Wagner J 1996 New techniques for extreme conditions High temperature reverse osmosis and nanofiltration Desal 105 57-61
Surdam RC Jiao Z Stauffer P and Miller T 2011 The key to commercial-scale geological CO2 sequestration Displaced fluid management Energy Procedia 4 4246-4251
Wolery TJ and Jarek RL 2003 Software Userrsquos Manual EQ36 Version 80 Civilian Radioactive Waste Management System Management amp Operating Contractor 10813-UM-80-00 Prepared for US Department of Energy Office of Civilian Radioactive Waste Management Las Vegas Nevada
20
Figure captions
Figure 1 Schematic of reverse osmosis membrane geometry Example pressures of feed concentrate and permeate are shown to illustrate relative pressures during conventional treatment of seawater
Figure 2 Osmotic pressure for salt solutions as a function of system recovery
Figure 3 Histogram of salinities of produced waters in the US from depths greater than 3000 feet Data from the USGS data base of produced waters (Breit 2002)
Figure 4 Histogram of hardness (Ca + Mg expressed as mgL Ca) for produced waters in the US using data from the USGS data base of produced waters (Breit 2002)
Figure 5 Predicted mineral precipitation as a function of water removal due to reverse osmosis at 50degC in a batch system for (a) seawater brine (35000 mgL) (b) Sublette County Wyoming 3 brine (86000 mgL) and (c) Sublette County Wyoming 2 brine (24500 mgL) Minor calcite (CaCO3) precipitates at the start (not shown) and persists for all three fluids
Figure 6 Predicted osmotic pressure in residual brine as a function of water removal due to reverse osmosis at 50degC in a batch system (a) seawater (b) Sublette County Wyoming 3 brine (86000 mgL) (c) Sublette County Wyoming 2 brine (24500 mgL) The ldquoPitzerrdquo curves show the osmotic pressure as obtained from the activity of water calculated from a thermodynamic model using Pitzerrsquos equations incorporated in the EQ36 modeling code The Dow model uses the vanrsquot Hoff equation discussed in text
Figure 7 Comparison of major treatment steps in conventional high-pressure seawater desalination vs low-recovery desalination of saline formation waters
Figure 8 Comparison of estimated levelized costs per acre-ft of brine at 4 different production rates in million gallons permeate per day (MGD)
Figure 9 Comparison of levelized cost of water desalination for pressurized brines from CCS sites (where we assume well-head pressure is adequate to drive RO system) vs cost for conventional seawater RO that includes energy needed for high pressure pumps
21
22
Figure 1
23
Figure 2
0
200
400
600
800
1000
1200
1400
1600
1800
2000
0 25000 50000 75000 100000 125000 150000
Osm
otic
pre
ssur
e (π
) ps
i
Initial TDS mgL
0
10
20
50
Seawater brine family
Extraction
1500 psi RO or NF + RO
Conventional RO
NF + RO
larrNormal seawater
24
Figure 3
0
10
20
30
40
50
60
70
0-10000 10000-40000 40000-85000 85000-300000 gt300000
Freq
uenc
y
TDS mgL
Depth ge 3000 ft
25
Figure 4
26
Figure 5
00
05
10
15
20
25
30
35
55 60 65 70 75 80 85
Wei
ght
gkg
H2O
H2O Removed
Calcite
Anhydrite
Halite
00
05
10
15
20
25
30
35
75 80 85 90 95
Wei
ght
gkg
H2O
H2O Removed
Calcite
Anhydrite
Glauberite
Halite
(b) Sublette County 3 brine
(a) seawater
27
00
05
10
15
20
25
30
35
55 65 75 85 95
Wei
ght
gkg
H2O
H2O Removed
Anhydrite
Glauberite
Nahcolite
Thenardite
(c) Sublette County 2 brine
28
Figure 6
0
400
800
1200
1600
2000
2400
0 20 40 60 80
Osm
otic
pre
ssur
e (π
) ps
i
H2O Removed
Dow
Pitzer
1200 psi limit
0
400
800
1200
1600
2000
2400
0 20 40 60
Osm
otic
pre
ssur
e (π
) ps
i
H2O Removed
Dow
Pitzer
1200 psi limit
(b) seawater
(b) Sublette County 3 brine
29
0
200
400
600
800
1000
1200
1400
1600
1800
2000
0 20 40 60 80 100
Osm
otic
pre
ssur
e (π
) ps
i
H2O Removed
Dow
Pitzer
1200 psi limit
(c) Sublette County 2 Brine
30
Figure 7
Pre-treatment
Physical filtrationpH adjustment
Remove organics
Saline aquifer fluidSea water
Desalination
Fresh water Brine dischargeConcentrate2X feed
Feed
Fresh water Concentrate12X Feed
Feed
RO
RO
Pressure(PSI)1200
1200
1190
1200+
Pressure(PSI)15
1200
1180
15+
ChillerCoolingAnti-scalantsDisinfectant
Pressurization
Energy recoveryDepress
urization
Ocean Saline aquifer
Repressurization
Serial Elements
Parallel Elements
31
Figure 8
$-
$100
$200
$300
$400
$500
$600
$700
$800
$900
$1000
10 15 20 25 30 35 40 45 50
LCO
W -
$A
C-FT
System RO Recovery
Levelized Cost of Water vs Recovery
2 MGD - LEVELIZED COSTAC-FT 25 yrs4 MGD - LEVELIZED COSTAC-FT 25 yrs6 MGD - LEVELIZED COSTAC-FT 25 yrs
32
Figure 9
$500
$700
$900
$1100
$1300
$1500
$1700
10 15 20 25 30 35 40 45 50
System RO Recovery
LCOW
- $A
C-FT
2 MGD - Pump to Pressure 2 MGD - Reservoir Pressure
33
Table 1 Conventional seawater vs saline formation water reverse osmosis treatment systems
RO System Major Component Items Conventional SW Systems Reservoir Treatment System
EQUIPMENT
High pressure feed pipingOnly necessary after the high pressure
pumpStarting from the well head
High pressure reject pipingOnly to back pressure control valve ie
skid boundaryReturn line to the deep well injection
pointIntake feed structure Open intake structure or sea wells Reservoir wellsPretreatment system Multi-media filter or micro-filter Activated carbon filterFeed pumping system Needed from feed source to RO skid Not needed - Use well head pressurePretreatment system Cartridge filters Cartridge filtersHeat exchanger None Yes Reduce feed temperature to 50degC
Chemical Injection system ndash bio controlYes ndash for bio control followed by
reducing agentNot needed
Chemical Injection system ndash scale control
Yes ndash scale inhibitor for calcium carbonate
Yes ndash scale inhibitor for calcium carbonate andor calcium sulfate
High pressure pump Yes (most costly item of RO skid) No - Use well head pressure
Energy recovery device Yes ndash typically used for larger systemsNo ndash keep reject at maximum pressure
for reinjectionRO pressure vessels (PV) Same for equal permeate capacity Same for equal permeate capacityRO membranes Conventional seawater membranes Conventional seawater membranes
Array ndash configurationSingle pass
7 elements per PVSingle pass
7 elements per PV
Percent recoveryRanges between 30 to 50 depending on seawater concentration system size
and energy costs
Ranges between 15 to 45 depending on reservoir feed concentration and
compositionSystem IampC Similar to reservoir system Similar to seawater system
MCCVFDIncludes electrical supply for high HP
pump(s)
Same as conventional SW system with exception of the high HP pump(s) ie
no VFD needed
Valves controls amp Instrumentation Similar to reservoir systemSimilar to seawater system except high pressure pump associated valving and
controlsTanking Similar to reservoir system Similar to seawater systemDeep well injection Reject typically goes to seawater outfall Deep well injection requiredCivil works Very site dependent Very site dependent
OPERATIONS
OperatingSimilar to reservoir system except no
deep well injection
Similar to seawater system except no high pressure pump(s) and energy
recovery but use of deep well injection for reject concentrate
Energy consumptionEnergy to deliver feed to high pressure
pumps and then raise to ~ 1000 psi
Similar to seawater system without the feed and process pumping Deep well injection pumping energy required
Chemicals consumption including membrane cleaning
Similar to reservoir system Similar to seawater system
Maintenance as of capital Similar to reservoir system Similar to seawater system
34
Table 2 Major Costs and Cost Factors for RO Treatment Systems
Assumed Discount Rate 700Plant Lifetime Evaluation Period 2500 yearsOperating Cost escalation yr 000
Base Operating Pressure at reference conditions 1200 psiBase recovery 40Cleaning timesyear 05Chemicals $3ConsumablesActivated Carbon $ 30 $ft^3Filter cartridges $ 4 $eachPower Repressurization $007 $kWhPower Misc uses 20000 kWhdayLaborFringe amp Overhead Multiplier 200 factorSupervisor $ 150000 SalaryOperators $ 60000 SalaryTechnicians $ 75000 Salary
Mechanical Maintenance of Capital 3Length of high pressure piping 125 ft
35
Table 3 Itemization of costs for water desalination plants of 2 and 8 MGD permeate at 40 water recovery
Base FEED Flow MGD 500 Product Flow MGD 20 20 20 20 20 20Base PRODUCT Flow MGD 200 Recovery percent 450 400 350 300 250 150Base Recovery 40 AC-FTYR 2240 2240 2240 2240 2240 2240
TOTAL DIRECT OPERATING COSTS $YR 123369829$ 120648345$ 118969371$ 118731532$ 118346855$ 125187892$ $AC-FT 55077$ 53862$ 53112$ 53006$ 52835$ 55889$
INSTALLED CAPITAL COST $GPD 347$ 349$ 356$ 371$ 398$ 493$ TOTAL DIRECT CAPITAL 3844576$ 3912316$ 4027492$ 4234852$ 4588768$ 5823751$ INSTALLED CAPITAL COST 6934334$ 6987133$ 7120062$ 7414175$ 7962181$ 9869483$
NPV of OampM 14149698$ 13837562$ 13644994$ 13617716$ 13573596$ 14358217$ NPV of OampM + Capital Cost 21084032$ 20824694$ 20765056$ 21031891$ 21535777$ 24227701$ NPV of AC-FTyr NPV AC-FTPeriod 25691 25691 25691 25691 25691 25691
2 MGD - LEVELIZED COSTAC-FT 25 yrs 821$ 811$ 808$ 819$ 838$ 943$
Base FEED Flow MGD 2000 Product Flow MGD 80 80 80 80 80 80Base PRODUCT Flow MGD 800 Recovery percent 460 400 350 300 250 150Base Recovery 40 AC-FTYR 8960 8960 8960 8960 8960 8960
TOTAL DIRECT OPERATING COSTS $YR 225984618$ 214298472$ 207398788$ 206191914$ 204172161$ 229163595$ $AC-FT 25222$ 23918$ 23148$ 23013$ 22788$ 25577$
INSTALLED CAPITAL COST $GPD 257$ 259$ 262$ 272$ 292$ 367$ TOTAL DIRECT CAPITAL 10609856$ 10796811$ 10996812$ 11530415$ 12499362$ 16138799$ INSTALLED CAPITAL COST 20594678$ 20756123$ 20947918$ 21757741$ 23349555$ 29354228$
NPV of OampM 25918931$ 24578608$ 23787260$ 23648839$ 23417187$ 26283538$ NPV of OampM + Capital Cost 46513609$ 45334730$ 44735177$ 45406581$ 46766742$ 55637766$ NPV of AC-FTyr NPV AC-FTPeriod 102763 102763 102763 102763 102763 102763
8 MGD - LEVELIZED COSTAC-FT 25 yrs 453$ 441$ 435$ 442$ 455$ 541$
36
Summary of reply to JGGC-D-00120 editor comments (attached PDF file)
Page 3
Qualifiers added throughout the manuscript to statements regarding potential existence of subsurface pressure due to CO2 injection
More details of excluded costs provided
Page 4
Offending statements regarding pressure in well field removed
Page 5
Reference to companion paper removed
References added
Page 6
Pore size range given along with reference
Page 7
Added cost reference
Added sentence to note lack of organisms in typical formation fluids
Noted reference to left vertical dotted line
Comment to editor These high pressure membranes are being developed by membrane manufacturers but this sort of information is not in the refereed journals because of its business sensitivity I hear this by word-of-mouth Not sure how to handle this What do you recommend
Page 8
Added USGS database size and coverage
Added references as specified
Page 10
Added comment on treatability of brines gt 85000 TDS
Added references
Page 11
37
Added reference
Modified temperature assertion for basinal brines
Page 13
Added clarification of what is being considered in cost estimate
Page 14
Caveats associated with assumed subsurface pressure have been inserted Paragraph re-worded based on reviewer comments
Page 15
Changes made Last sentence modified to exclude sites where subsurface pressure increase is not an issue
Page 19
Changes made added titles to figures and omitted reference to Big Sky CSP
Page 20
No simple way to modify figure ndash added details in text to clarify
X-axis adjusted to match in Figures 8 and 9 Y-axis was not changed as compressing it to match Figure 9 made Figure 8 harder to interpret
Summary of reply to JGGC-D-00120 editor comments (embodied e-mail)
Jim DooleySenior Staff ScientistJoint Global Change Research InstitutePacific Northwest National LaboratoryAssociate Editor for Integrated Systems and Economics International Journal of Greenhouse Gas Control
-----Original Message-----From eesjggc0c97e7d697ae1feesmailelseviercom[mailtoeesjggc0c97e7d697ae1feesmailelseviercom] On Behalf Of Int Jnl of Greenhouse Gas ControlSent Tuesday October 19 2010 1204 PMTo bourcier1llnlgov wbourciergmailcomCc Dooley James J (Jim)
38
Subject Your Submission to International Journal of Greenhouse Gas Control
Ms Ref No JGGC-D-10-00120Title Desalination of Formation Waters as a Strategy for Reducing Risk in Geological Sequestration of Carbon Dioxide International Journal of Greenhouse Gas Control
Dear Dr William L Bourcier
The reviewers have commented on your above paper They indicated that it is not acceptable for publication in its present form and major revisions will need to be implemented Once these major revisions have been completed to the Editors satisfaction we will consider publishing your paper
For your reference the comments from the editor and reviewers are listed below for your consideration and action
Thank you for submitting your work to International Journal of Greenhouse Gas Control
When you are submitting a revised manuscript please also
a) outline each change made (point by point) as raised in the reviewer comments ANDOR
b) provide a suitable rebuttal to each reviewer comment not addressed
To submit your revision please do the following
1 Go to httpBLOCKEDeeselseviercomjggc
2 Enter your login details
3 Click [Author Login]This takes you to the Author Main Menu
4 Click [Submissions Needing Revision]I look forward to receiving your revised manuscript
Yours sincerely
James J DooleyAssociate EditorInternational Journal of Greenhouse Gas Control
Comments from the editors and reviewers
Editor comments for JGGC-D-10-00120 (jjdooleypnlgov)
39
This is a good and very useful paper If you can address the concerns raised by myself and the peer reviewers I am confident that we should be able to get this paper into press in short order
Please consider revising the title of the paper to better match the contents of the paper To my mind A Preliminary Cost and Engineering Estimate for Desalinating Produced Formation Waters Associated with Carbon Dioxide Capture and Storage (agreed ndash title changed) is closer to the mark The current submission does not develop a technical argument for how desalinzation of formation waters reduces risk The paper asserts that point but it is not shown here What is shown here is a preliminary cost and engineering estimate I think this sentence from Section 1 of your paper places things in their proper perspective An additional benefit is that strategic withdrawal and reinjection of brines may allow manipulation of the location and migration of the CO2 pool in the subsurface That is the process you are looking at here provides and additional benefit (ie it is not the primary focus of what is presented in the paper) and it allows the subsurface plume to be manipulated as a part of good reservoir engineering to assure that CO2 injected into the subsurface stays there This phrasing of additional benefit and manipulation seems more consistent with the thrust of this paper and the broad body of technical literature than many of the statements in Section 1 (and elsewhewre) which seem to indicate that unless CCS+desal is done for all DSFs a whole host of very bad things are likely (almost surely) going to happen (agreed ndash text modified to make it clear that if we assume reservoir pressure existsit is an assumption Our goal is to evaluate how much benefit there is in using it if present to power desalination)
I do not believe this paper demonstrates that there would be significant pressure in the formation to deliver to the surface this pressuized feedstream for the desal unit This is asserted many times It is not shown here I therefore think you need to state assumed cost savings assumed pressure head I dont see how you can develop that point robustly in this paper as that is a whole body of work that would need to be written up in another paper showing the distance between the CO2 injector well(s) the brine production well(s) and brine reinjection well(s) and how those change over the life of the CO2 storage field This is a significant concern of mine This paper needs to stand by itself (agreed ndash text modified in several places to alleviate this concern)
Another concern I have with the paper and in particular Section 1 (but elsewhere) is that the ideal formation for CO2 storage + desal of produced water would appear from the text to be a formation that has a structural trap with a fourway closure Yet there is nothing in the technical literature that would lead one to assert that is the best or only type of DSF that could be used for CO2 storage What I really would like to avoid in your article (as the article is strong enough that it doesnt need to go down this path at all) is a simplistic Economides and Eligh-Economides caricature of CO2 storage can only happen in a sealed vessel and if you do it in a sealed vessel then you cant put any CO2 in the formation as it is already full and therefore CO2 storage is impossible I know that is not what you are saying I would like you to be more clear that you are not saying that One (but only one) simple thing I think you could do is mention specifically that Gorgon is going to produce water to manage the plume but that Sleipner Insalah Snovit do not need to employ this strategy for risk reduction and no one is asserting that those fields are a ticking time bomb that must surely leak someday soon (agreed ndash sections that infer this have been qualified or removed in particular section 11 has been edited)
There are many many many missing references in the paper I have noted them in the marked up PDF In short unless you are sure that everyone in the relevant technical community
40
understands a point if you are citing a specific value I think there needs to be a reference For example a nanofiltration membrane will allow Na and Cl to pass through the membrane freely while holding back greater than 95 of the sulfate and calcium What is the reference for such a specific point 95(text modified and reference provided) Seawater desalination costs for membrane-based systems generally vary between $050 and $100 per cubic meter of product Again what is the reference (reference for this added 11 references added in total)
Please consider standardizing terminology in the paper In particular given that both seawater and the formation brines are going to be saline I think that term probably should be used unless it is clear to the reader which is being discussed Produced saline formation waters from a deep geologic CO2 storage reservoir is a mouthful and will get tiresome if it is repeated but it is obvious that this is not seawater
Is seawater on word or is it two words sea water The paper uses both (ldquoseawaterrdquo nowspelled consistently)
Please make sure that your revised submission adheres to the format guidelines for this journal httpBLOCKEDwwwBLOCKEDelseviercomwpsfindjournaldescriptioncws_home709061authorinstructions Please use SI units in the paper In particular the paper bounces back at and forth between psi and Mpa which does nothing to improve the papers readability (all pressures now in MPa with psi conversion in parentheses)
Reviewer 1 Bourcier et al JGGC
Overall the paper is fine There are several specifics comments that may require minor revisions
Figure 2 has two vertical lines (text modified to explain which line is being referred to)
pg 7 - reinjection of produced water is usually for purposes of enhancing continued oil production (unclear what is being referred to in comment)
Figure 5c should be mentioned in the text (missing reference added)
Figure 5 contains mineral phases not discussed in the text (added text to explain significance of these minerals)
bulleted list section with 8500 to 300000 TDS should specify not possible with current technology to match later discussion of issue in text (no change made text suggests some hybrid methods may allow treatment of these fluids)
section 211 - text suggests that well head pressures of 1200 psi are upper limit in real system - what is the basis for this assertion (Changed text to state that this is the current maximum pressure for RO systems for which there are good cost data)
41
section 31 - authors calculate scale up of costs using expotential factors why not additive given the scale up is only a doubling of the basis (the cost data are based on costs data from real systems the scale-up cost savings are empirical)
Conlusions - first paragraph gives costs in cubic meters and water production in gallons without conversion use consistent units (made units consistent and added conversions)
Calculation of fresh water production associated with 1GW emissions should specify recovery factor used in calculation (we are using a recovery of 40 and units now made consistent ndashjust cubic meters of water)
Reviewer 2 Overall this is a well presented and well researched paper Management of brine in deep saline formations by producing and treating them can make some otherwise non-viable sites acceptable for geologic storage The concepts chemical principles and assumptions are clearly presented in the paper
Although this is an interesting and potentially useful analysis I have significant concerns whether the technology option presented here will be widely deployed The primary reason for concern is that almost all saline formation disposal projects that I am aware of have salinity well in excess of seawater For example Crenfield and Frio are more than 100000 mgL All of the midwestern storage projects in the Mt Simon Sandstone or other lower Paleozoic formations have salinities well in excess of 100000 and generally exceeding 250000 mgL The authors have chosen to use Wyoming brines as a primary example However it is likely that the primary deployment of CCS is likely to be in Gulf Coast and midwestern US or in similar deep high salinity settings Furthermore when the brine wells are added to the cost the total cost will be less attractive compared to seawater desalination Despite these limitations it seems that the authors have done a good job of outlining limitations and evaluating the technology for the seawater and similar salinity scenarios They also mention working on a subsequent paper that will evaluate the hydrogeologic aspects of the brine production It is hoped that in addition to the general design aspects this paper will address issues such as potential for preferential channeling of CO2 co-production of CO2 or other dissolved species with brine and other environmental or reservoir management challengesAgreed We are laying out the costs and limitations and are not making further judgements as to likelihood of deployment We used Wyoming brines as examples for the reasons this reviewer mentions
10
We conclude that the potential for freshwater extraction from saline brines can be categorized as follows
bull 10000ndash40000 mgL TDS Standard RO with ge 50 recovery
bull 40000ndash85000 mgL TDS Standard RO with ge 10 recovery higher recovery possible using 103 MPa (1500 psi) RO membranes andor multi-stageincremental desalination including NF (nanofiltration)
bull 85000ndash300000 mgL TDS Multi-stage process (NF + RO) using process design that may differ significantly from seawater systems
bull gt 300000 mgL TDS brines Not likely to be treatable
As can be seen in Figures 3 and 4 brines in the 10000-85000 mgL TDS range appear to be abundant (geographically and with depth) and could be targeted in siting CCS operations These brines will be chemically different than seawater and these differences will affect treatment costs Brines greater in salinity than 85000 will be expensive to treat and will not be addressed further in this paper
211 Desalination of seawater vs saline formation water
Because many of the candidate brines present in the subsurface at sequestration sites have salinities somewhat similar to that of seawater we will use for our first cost analysis a generic fluid having a total salinity equal to that of normal seawater but with specific chemical characteristics more typical of subsurface brines This allows the most accurate cost estimate to be made with minimal additional assumptions There is abundant experience and cost data available for the reverse osmosis desalination of seawater (Karagiannis and Soldatos 2008)
A conventional seawater RO desalination system uses raw ocean water as feed The ocean water is first filtered for particulates and micro-organisms Instead of open water intakes many treatment plants now take the feed from wells drilled into the coastal sand wedge to take advantage of the sand as a first filtration step (Frenkel 2011) The water may then be acidified have antiscalants added filtered again at a finer size and then pressurized and passed into the RO elements The RO elements are arranged in multiple stages to maximize permeate recovery and minimize the energy used to pressurize the system The feed water stays pressurized throughout the desalination process It exits with a pressure only 1mdash30 kPa lower than the starting pressure The permeate fluid may be adjusted in pH and chlorinated prior to being sent to storage and distribution The concentrate is sent to disposal typically piped out to sea
The major steps in desalination of saline formation water are compared with those of conventional seawater RO in Figure 7 [FIGURE 7] For the saline water we assume for this analysis that we have a well-head pressure of 83 MPa (1200 psi) This is at the
11
upper limit of what can be used in current RO systems and therefore provides an end-member cost comparison We also account for the likely differences for desalinatingfluids pumped from the subsurface versus those obtained from the ocean We then compare the process steps for seawater vs pressurized brine and examine how they differ
The first difference is that the saline formation fluids are assumed to be saturated with several mineral phases a good assumption since they have had significant time in the subsurface to equilibrate with the surrounding reservoir rocks These minerals include carbonates sulfates and silicates As a consequence we include in our process costs much more extensive pre-treatment in particular the addition of antiscalants and acid to avoid mineral scaling of the membranes
We assume there is none or only minor biological activity in the saline formation fluids as is typical for fluids co-produced with oil and gas compared with ocean water This allows us to eliminate the need for extensive biological pre-treatment to avoid biofilm formation Biofilm formation is generally regarded one of the most difficult problems in seawater RO systems (Amjad 1993)
Many saline formation waters contain significant hydrocarbons which are known to aggressively foul RO membranes (Fritzmann et al 2007) Removal methods may be needed if the saline water contains significant hydrocarbons (xx We discussed this earlier - need to resolve this)
Since the measured temperature for many reservoir feeds can exceed 100degC the saline formation water may need to be chilled to a temperature cool enough to allow treatment using conventional RO membranes The current limit for long-term use of conventional membranes is around 50oC although high-temperature elements are available that can be used up to 70oC (Snow et al 1996) Heat exchangers will therefore be necessary to bring the feed water to within the membrane operating envelope We include in our costs the use of heat exchangers of a shell and tube design (due to the high pressures involved) and made of 317L stainless steel or better and employed in a split stream formation The necessary corrosion resistance of the material to be used will be a function of the chloride and sulfide levels in the reservoir fluid
The split heat exchanger arrangement would cool a portion of the feed using the counter flowing previously cooled permeate The second heat exchanger package would treat the remaining hot feed by cooling it with the previously cooled reject
The inherent heat losses and inefficiencies of this heat transfer arrangement would be supplemented by an auxiliary heat transfer device which would either be in the form of an air cooled atmospheric exchanger or it would be tied into the power plant cooling system to provide for the additional cooling as needed In our cost analysis we assume
12
air cooling For the latter arrangement surplus cooling capacity from the power plant would be required While there would be some pressure losses associated with the passage through the heat exchange system the pressure drops across exchangers are typically less than 100 kPa
One area of difference between the two processes is that the design of seawater systems views the amount of feed strictly from an economic point of view The only treatment product of value is the extracted permeate water Seawater RO plants strive to maximize recovery in order to reduce the cost per unit volume of permeate for a given degree of pressurization
The situation is different for conditions where there is significant subsurface pressure (eg well confined sequestration reservoirs) because a significant fraction of the energy needed to drive RO can be obtained from the pressurized reservoir In this case energy costs which ordinarily make it most effective to maximize recovery are less important and allow favorable economics for low recovery The benefit from low recovery is that it increases membrane longevity by reducing the risk of membrane scaling and lowering the driving pressure The down side is that one now then has to pump and treat a larger volume of brine in order to produce the same amount of permeate ndash and equivalent storage space for CO2 in the subsurface We explored a range of recoveries in our cost analysis
The last stage of seawater RO is an energy recovery step where the pressure of theexiting concentrate is recovered and used to either generate electrical energy or to pressurize the incoming feed The energy recovery device is not needed for our saline formation water process because the residual pressure is needed to re-inject the concentrate back into the formation In fact the pressure of the concentrate may need to be increased depending on where it is injected into the formation
31 Saline formation water desalination costs
A list of the treatment components for seawater compared to saline formation waters is given in Table 1 These are the unit processes and operations that are considered in our cost analysis that follows The system capital costs include the following major components
1 High pressure piping from the well head to the treatment system The piping would require a material quality of 316L or better to minimize corrosion
2 Activated carbon pretreatment to remove organics (oil and grease) unlike conventional seawater RO these systems will have to accommodate high feed pressure
3 Heat exchanger to reduce the feed temperature to 50degC 4 Cartridge filter system
13
5 Chemical injection system for scale inhibitor or acid6 RO skids pressure vessels and membranes7 System instrumentation and control (IampC)8 System piping valves controls amp instruments9 Forward flush and clean-in-place systems10Tankage for chemicals and permeate water11Re-pumping station for reject (concentrate) deep well injection 12Pretreatment system for deep well injection13Civil works equipment housing and installation costs14One spare RO train for standby assurance
We did not include costs for land acquisition or for construction of the brine well field which includes costs associated with drilling production and reinjection wells
Operating and maintenance costs include
1 Consumable chemicals filter replacements etc2 Hazardous wastes disposal costs3 RO membrane replacement depreciation ranging over two (2) to four (4) years
depending on the percent recovery of the system4 Labor costs for supervisorengineer operators and technician Salaries estimated
with an overhead factor of two (2)5 Maintenance estimated at 3 of capital annually
The capital and operating costs were analyzed for several system sizes and recoveries Base models for costing were developed for 2 and 4 million gallons per day (MGD) systems which were then used to estimate the costs for the 6 and 8 MGD systems using exponential escalation factors Elements vessels and piping were estimated by actual cost and quantity or in the case of piping per pound costs for calculated pipe diameters and thickness
RO costs were estimated for 45 40 35 30 25 and 15 percent recoveries -defined as percent permeate extracted from the feed As described above percent recovery is a function of the incoming feed salinity Since processing ceiling is dictated by the maximum allowable membrane operating pressure the osmotic pressure of the reject stream becomes the limiting factor The higher the feed salinity the lower thepercent recovery before the maximum allowable pressure is reached Operating pressure is comprised of the osmotic pressure of the concentrate plus the hydraulicpressure loss created by the membrane barrier plus a driving pressure to push water through the membrane) At a feed TDS of 60000 mgL recovery may be limited to 15 to 20 recovery for maximum operating pressures of 83 MPa (1200 psi)
14
Table 2 summarizes the major costs and cost factors employed in developing the system costs Results for the scenarios are displayed in Table 3 and Figures 8 and 9 Figure 8 shows that levelized water costs per acre-foot of permeate vary from about $450 to $1000 (32-81cent cubic meter one acre foot is 1233 cubic meters) and that the costs decrease as the size of the operation increases [FIGURE 8] In addition there is a cost effective recovery point (minimum) in plots of recovery vs cost
Most importantly however the lower recovery options are economically close to the higher recovery options ndash that is the curve is fairly flat With conventional pumped systems the curve is much more pronounced greatly favoring higher recovery As mentioned above this is because the additional costs associated with moving and pressurizing additional feed is now reduced because the pressurization is no longer a large operating expense In this scenario we assume that the energy to pressurize the fluid is supplied by the reservoir (which we believe may be obtainable for some but not likely all storage reservoir scenarios)
Although we have assumed a fluid salinity similar to that of seawater our estimated costs are not highly sensitive to salinity This is because we assume the energy for desalination comes mainly from the existing reservoir pressure field and is not a major component of the operating cost In a conventional desalination system an increase in salinity makes the process more expensive due to the need for additional energy to operate the system at higher pressures For this reason we believe our estimated costs are fairly representative for the range of fluid salinities for which an essentially conventional RO process can be used (ie 10000-85000 mgL TDS)
Figure 9 directly compares the costs for a system using reservoir pressure to drive the RO process with an identical system using high-pressure pumps [FIGURE 9] The difference between the curves reflects the estimated cost of energy to drive the desalination system Note also the pumped system shows a steeper cost vs recovery curve
One of the items to warrant further review is the problem of optimizing the front end heat exchanger system used to reduce the reservoir fluidrsquos temperature for RO processing As described above a cooling device to accomplish the necessary heat reduction mightconsist of a split heat exchanger arrangement which will have to be augmented via a secondary heat reduction source The specific nature of this supplementary heat rejection will have to be considered The technical and cost impact of coupling the heat reduction with the power plantrsquos cooling system vs a stand-alone system that uses atmospheric cooling possibly augmented by spray evaporation must be made Since this would consume RO permeate thereby reducing the amount of recovered water for power plant use it may be a significant factor to consider
15
41 Conclusions
Our analysis indicates that RO plants for CCS brines that are similar in salinity to seawater can be built and operated for about half of the cost of seawater desalination if sufficient over-pressure (from CO2 injection) exists to supply the pressure needed to drive reverse osmosis Over 40 of subsurface brines co-produced with fossil fuels have salinities at or below seawater For a fresh water production of six million gallons per day (about 23000 cubic meters or about 18 acre feet) we estimate costs of about 32 to 40cent per cubic meter permeate produced Without well-head energy recovery the costs are from 60 to 80cent per cubic meter permeate similar to conventional seawater desalination This analysis includes all surface facilities transfer pumps and piping but does not consider the cost of the brine extraction and reinjection wells which will be site dependent
The costs for membrane desalination of sedimentary brines that are higher in salinity than our upper limit of 85000 mgL will be larger It is currently impossible to estimate these costs because membrane treatment technologies that operate in that salinity range do not exist However we believe it is likely that improved RO technologies capable of desalinating more concentrated brines would quickly become available if sufficient demand existed As mentioned above both the pressure and temperature limits are due to support materials and are not intrinsic limitations of the semi-permeable polyamide membrane High temperature-pressure RO membranes could be constructed with improved support materials For these reasons we expect the treatment costs for higher salinity brines to be only modestly higher than those for seawater after allowing for higher pressures and lower recoveries
The amount of fresh water produced by our process is significant For example atypical 1 GW coal plant emits more than 7 MtCO2year A well-designed capture system might provide 6 MtCO2 for sequestration Sequestered at a depth of 300 meters this CO2 would displace about 8 million cubic meters of water per year or about 22000 cubic meters per day Reverse osmosis treatment of that brine with a recovery of 40 would annually produce about 32 million cubic meters of fresh water which could serve the needs of 10000 homes irrigate 2000 acres of cropland or provide half of the water volume usage of a typical 1 GW IGCC power plant based on a plant use of about 2000 litersMW-h (Grubert and Kitasei 2010)
An additional benefit of our process is that strategic withdrawal and reinjection of saline aquifer brines will allow manipulation of the location and migration of the CO2 pool in the subsurface This could be accomplished by using brine injectionwithdrawal to alter the subsurface pressure field so as to affect the pressure gradient surrounding the CO2 pool in the desired way This ability to manipulate the CO2 by imposing pressure gradients
16
has the potential to substantially reduce the inherent risk of geologic sequestration of CO2
Finally site selection for saline aquifers suitable for disposal of carbon dioxide and for which brine removal increases reservoir capacity should include some consideration of the fluid salinity because lower salinity fluids are less costly to desalinate
Acknowledgements
Financial support for this work was provided by DOE through the National Energy Technology Laboratory We thank Sean Plasynski and Andrea McNemar for their help and advice We also thank Geoffrey Thyne of the Enhanced Oil Recovery Institute at the University of Wyoming George Breit of the USGS and Julio Friedmann of LLNL for helpful discussions about produced waters
17
References
Amjad Z 1993 Reverse Osmosis Membrane technology water chemistry and industrial applications Springer 384 p
Bachu S 2008 CO2 storage in geological media Role means status and barriers to deployment Progress in Energy and Combustion Science 34 254-273
Baker R W 2004 Membrane Technology and Applications 2nd ed John Wiley amp Sons Ltd Chichester
Breit GN 2002 Produced Waters Database US Geological Survey provisional database Downloadable from httpenergycrusgsgovprovprodwatindexhtm
Buros O K 2000 The ABCs of Desalting 2nd edition International Desalination Association Topsfield Massachusetts USA
Buscheck TA Hao Y Tompson A Sun Y Aines RD Wolery T Bourcier WL Burton E Waggoner J and Friedmann SJ 2011 Combining brine extraction desalination and residual brine reinjection with CO2 storage in saline formations Implications for pressure management capacity and risk mitigation Energy Procedia 4 4283-4290
Carr TR Rich PM and Bartley JD 2007 The NATCARB geoportal linking distributed data from the Carbon Sequestration Regional Partnerships Journal of Map and Geography Libraries Special Issue on Department of Energy (DOE) Geospatial Science Innovations 4(1)131-147
Court B Celia MA Nordbotten JM and Elliot TR 2011 Active and integrated management of water resources throughout CO2 capture and sequestration operations Energy Procedia 4 4221-4229
Dooley JJ and Davidson CL 2010 A Brief Technical Critique of Economides and Ehlig-Economides 2010 Sequestering Carbon Dioxide in a Closed Underground Volume PNNL-19249 Pacific Northwest National Laboratory Richland WA
Dow Water Solutions 2009 FILMTECTM Reverse Osmosis Membranes Technical Manual Form No 609-00071-1009 Dow Water Solutions Midland MI Downloadable from httpmsdssearchdowcomPublishedLiteratureDOWCOMdh_03440901b80380344689pdffilepath=liquidsepspdfsnoreg609-00071pdf
18
Ehlig-Economides C and Economides MJ 2010 Sequestering carbon dioxide in a closed underground volume Journal of Petroleum Science and Engineering 70 123-130
Frenkel V S 2011 Chapter 6 in Desalination Trends and Technologies Michael Schorr ed InTech February 2011
Fritzmann C Lowenberg J Wintegns T and Melin T 2007 State-of-the-art of reverse osmosis desalination Desalination 216 1-76
Greenberg J P and N Moslashller N 1989 The prediction of mineral solubilities in natural waters A chemical equilibrium model for the Na-K-Ca-Cl-SO4-H2O system to high concentration from 0 to 250degC Geochimica et Cosmochimica Acta 532503ndash2518
Grubert E and Kitasei S 2010 How energy choices affect fresh water supplies A comparison of US coal and natural gas Worldwatch Institute Briefing Paper 2
Hilal N Al-Zoubi H Darwish N A Mohammed A W and Arabi M A 2004 A comprehensive review of nanofiltration membranes Treatment pretreatment modeling and atomic force microscopy Desalination 170 281-308
Karagiannis I C and Soldatos P G 2008 Water desalination cost literature review and assessment Desalination 223 448-456
Kharaka Y K and Hanor J S 2007 Deep fluids in the Continents I Sedimentary Basins Chapter 516 in Treatise on Geochemistry H Holland and K Turekian eds p 1-48 Elsevier
Khawaji A D Kutubkhanah I K and Wie J-M 2008 Advances in seawater desalination technologies Desalination 221 47-69
Matsuura T 2001 Progress in membrane science and technology for seawater desalination ndash a review Desalination 134 47-54
Moch I 2008 WT Cost II Modeling the capital and operating costs of thermal desalination processes utilizing a recently developed computer program that evaluates membrane desalting electrodialysis and ion exchange plants US Bureau of Reclamation Desalination and Water Purification Research and Development Program Report No 130
National Research Council 2008 Desalination A National Perspective National Academies Press httpwwwnapedu
19
Pabalan RT and Pitzer KS 1987 Thermodynamics of concentrated electrolyte mixtures and the prediction of mineral solubilities to high temperatures for mixtures in the system Na-K-Mg-Cl-SO4-OH-H2O Geochimica et Cosmochimica Acta 51 2429-2443
Rutqvist J J T Birkholzer J T Cappa F and Tsang C-F 2007 Estimating maximum sustainable injection pressure during geological sequestration of CO2
using coupled fluid flow and geomechanical fault-slip analysis Energy Conversion Management 48 1798ndash180
Snow M D de Winter Buckingham R Campbell J and Wagner J 1996 New techniques for extreme conditions High temperature reverse osmosis and nanofiltration Desal 105 57-61
Surdam RC Jiao Z Stauffer P and Miller T 2011 The key to commercial-scale geological CO2 sequestration Displaced fluid management Energy Procedia 4 4246-4251
Wolery TJ and Jarek RL 2003 Software Userrsquos Manual EQ36 Version 80 Civilian Radioactive Waste Management System Management amp Operating Contractor 10813-UM-80-00 Prepared for US Department of Energy Office of Civilian Radioactive Waste Management Las Vegas Nevada
20
Figure captions
Figure 1 Schematic of reverse osmosis membrane geometry Example pressures of feed concentrate and permeate are shown to illustrate relative pressures during conventional treatment of seawater
Figure 2 Osmotic pressure for salt solutions as a function of system recovery
Figure 3 Histogram of salinities of produced waters in the US from depths greater than 3000 feet Data from the USGS data base of produced waters (Breit 2002)
Figure 4 Histogram of hardness (Ca + Mg expressed as mgL Ca) for produced waters in the US using data from the USGS data base of produced waters (Breit 2002)
Figure 5 Predicted mineral precipitation as a function of water removal due to reverse osmosis at 50degC in a batch system for (a) seawater brine (35000 mgL) (b) Sublette County Wyoming 3 brine (86000 mgL) and (c) Sublette County Wyoming 2 brine (24500 mgL) Minor calcite (CaCO3) precipitates at the start (not shown) and persists for all three fluids
Figure 6 Predicted osmotic pressure in residual brine as a function of water removal due to reverse osmosis at 50degC in a batch system (a) seawater (b) Sublette County Wyoming 3 brine (86000 mgL) (c) Sublette County Wyoming 2 brine (24500 mgL) The ldquoPitzerrdquo curves show the osmotic pressure as obtained from the activity of water calculated from a thermodynamic model using Pitzerrsquos equations incorporated in the EQ36 modeling code The Dow model uses the vanrsquot Hoff equation discussed in text
Figure 7 Comparison of major treatment steps in conventional high-pressure seawater desalination vs low-recovery desalination of saline formation waters
Figure 8 Comparison of estimated levelized costs per acre-ft of brine at 4 different production rates in million gallons permeate per day (MGD)
Figure 9 Comparison of levelized cost of water desalination for pressurized brines from CCS sites (where we assume well-head pressure is adequate to drive RO system) vs cost for conventional seawater RO that includes energy needed for high pressure pumps
21
22
Figure 1
23
Figure 2
0
200
400
600
800
1000
1200
1400
1600
1800
2000
0 25000 50000 75000 100000 125000 150000
Osm
otic
pre
ssur
e (π
) ps
i
Initial TDS mgL
0
10
20
50
Seawater brine family
Extraction
1500 psi RO or NF + RO
Conventional RO
NF + RO
larrNormal seawater
24
Figure 3
0
10
20
30
40
50
60
70
0-10000 10000-40000 40000-85000 85000-300000 gt300000
Freq
uenc
y
TDS mgL
Depth ge 3000 ft
25
Figure 4
26
Figure 5
00
05
10
15
20
25
30
35
55 60 65 70 75 80 85
Wei
ght
gkg
H2O
H2O Removed
Calcite
Anhydrite
Halite
00
05
10
15
20
25
30
35
75 80 85 90 95
Wei
ght
gkg
H2O
H2O Removed
Calcite
Anhydrite
Glauberite
Halite
(b) Sublette County 3 brine
(a) seawater
27
00
05
10
15
20
25
30
35
55 65 75 85 95
Wei
ght
gkg
H2O
H2O Removed
Anhydrite
Glauberite
Nahcolite
Thenardite
(c) Sublette County 2 brine
28
Figure 6
0
400
800
1200
1600
2000
2400
0 20 40 60 80
Osm
otic
pre
ssur
e (π
) ps
i
H2O Removed
Dow
Pitzer
1200 psi limit
0
400
800
1200
1600
2000
2400
0 20 40 60
Osm
otic
pre
ssur
e (π
) ps
i
H2O Removed
Dow
Pitzer
1200 psi limit
(b) seawater
(b) Sublette County 3 brine
29
0
200
400
600
800
1000
1200
1400
1600
1800
2000
0 20 40 60 80 100
Osm
otic
pre
ssur
e (π
) ps
i
H2O Removed
Dow
Pitzer
1200 psi limit
(c) Sublette County 2 Brine
30
Figure 7
Pre-treatment
Physical filtrationpH adjustment
Remove organics
Saline aquifer fluidSea water
Desalination
Fresh water Brine dischargeConcentrate2X feed
Feed
Fresh water Concentrate12X Feed
Feed
RO
RO
Pressure(PSI)1200
1200
1190
1200+
Pressure(PSI)15
1200
1180
15+
ChillerCoolingAnti-scalantsDisinfectant
Pressurization
Energy recoveryDepress
urization
Ocean Saline aquifer
Repressurization
Serial Elements
Parallel Elements
31
Figure 8
$-
$100
$200
$300
$400
$500
$600
$700
$800
$900
$1000
10 15 20 25 30 35 40 45 50
LCO
W -
$A
C-FT
System RO Recovery
Levelized Cost of Water vs Recovery
2 MGD - LEVELIZED COSTAC-FT 25 yrs4 MGD - LEVELIZED COSTAC-FT 25 yrs6 MGD - LEVELIZED COSTAC-FT 25 yrs
32
Figure 9
$500
$700
$900
$1100
$1300
$1500
$1700
10 15 20 25 30 35 40 45 50
System RO Recovery
LCOW
- $A
C-FT
2 MGD - Pump to Pressure 2 MGD - Reservoir Pressure
33
Table 1 Conventional seawater vs saline formation water reverse osmosis treatment systems
RO System Major Component Items Conventional SW Systems Reservoir Treatment System
EQUIPMENT
High pressure feed pipingOnly necessary after the high pressure
pumpStarting from the well head
High pressure reject pipingOnly to back pressure control valve ie
skid boundaryReturn line to the deep well injection
pointIntake feed structure Open intake structure or sea wells Reservoir wellsPretreatment system Multi-media filter or micro-filter Activated carbon filterFeed pumping system Needed from feed source to RO skid Not needed - Use well head pressurePretreatment system Cartridge filters Cartridge filtersHeat exchanger None Yes Reduce feed temperature to 50degC
Chemical Injection system ndash bio controlYes ndash for bio control followed by
reducing agentNot needed
Chemical Injection system ndash scale control
Yes ndash scale inhibitor for calcium carbonate
Yes ndash scale inhibitor for calcium carbonate andor calcium sulfate
High pressure pump Yes (most costly item of RO skid) No - Use well head pressure
Energy recovery device Yes ndash typically used for larger systemsNo ndash keep reject at maximum pressure
for reinjectionRO pressure vessels (PV) Same for equal permeate capacity Same for equal permeate capacityRO membranes Conventional seawater membranes Conventional seawater membranes
Array ndash configurationSingle pass
7 elements per PVSingle pass
7 elements per PV
Percent recoveryRanges between 30 to 50 depending on seawater concentration system size
and energy costs
Ranges between 15 to 45 depending on reservoir feed concentration and
compositionSystem IampC Similar to reservoir system Similar to seawater system
MCCVFDIncludes electrical supply for high HP
pump(s)
Same as conventional SW system with exception of the high HP pump(s) ie
no VFD needed
Valves controls amp Instrumentation Similar to reservoir systemSimilar to seawater system except high pressure pump associated valving and
controlsTanking Similar to reservoir system Similar to seawater systemDeep well injection Reject typically goes to seawater outfall Deep well injection requiredCivil works Very site dependent Very site dependent
OPERATIONS
OperatingSimilar to reservoir system except no
deep well injection
Similar to seawater system except no high pressure pump(s) and energy
recovery but use of deep well injection for reject concentrate
Energy consumptionEnergy to deliver feed to high pressure
pumps and then raise to ~ 1000 psi
Similar to seawater system without the feed and process pumping Deep well injection pumping energy required
Chemicals consumption including membrane cleaning
Similar to reservoir system Similar to seawater system
Maintenance as of capital Similar to reservoir system Similar to seawater system
34
Table 2 Major Costs and Cost Factors for RO Treatment Systems
Assumed Discount Rate 700Plant Lifetime Evaluation Period 2500 yearsOperating Cost escalation yr 000
Base Operating Pressure at reference conditions 1200 psiBase recovery 40Cleaning timesyear 05Chemicals $3ConsumablesActivated Carbon $ 30 $ft^3Filter cartridges $ 4 $eachPower Repressurization $007 $kWhPower Misc uses 20000 kWhdayLaborFringe amp Overhead Multiplier 200 factorSupervisor $ 150000 SalaryOperators $ 60000 SalaryTechnicians $ 75000 Salary
Mechanical Maintenance of Capital 3Length of high pressure piping 125 ft
35
Table 3 Itemization of costs for water desalination plants of 2 and 8 MGD permeate at 40 water recovery
Base FEED Flow MGD 500 Product Flow MGD 20 20 20 20 20 20Base PRODUCT Flow MGD 200 Recovery percent 450 400 350 300 250 150Base Recovery 40 AC-FTYR 2240 2240 2240 2240 2240 2240
TOTAL DIRECT OPERATING COSTS $YR 123369829$ 120648345$ 118969371$ 118731532$ 118346855$ 125187892$ $AC-FT 55077$ 53862$ 53112$ 53006$ 52835$ 55889$
INSTALLED CAPITAL COST $GPD 347$ 349$ 356$ 371$ 398$ 493$ TOTAL DIRECT CAPITAL 3844576$ 3912316$ 4027492$ 4234852$ 4588768$ 5823751$ INSTALLED CAPITAL COST 6934334$ 6987133$ 7120062$ 7414175$ 7962181$ 9869483$
NPV of OampM 14149698$ 13837562$ 13644994$ 13617716$ 13573596$ 14358217$ NPV of OampM + Capital Cost 21084032$ 20824694$ 20765056$ 21031891$ 21535777$ 24227701$ NPV of AC-FTyr NPV AC-FTPeriod 25691 25691 25691 25691 25691 25691
2 MGD - LEVELIZED COSTAC-FT 25 yrs 821$ 811$ 808$ 819$ 838$ 943$
Base FEED Flow MGD 2000 Product Flow MGD 80 80 80 80 80 80Base PRODUCT Flow MGD 800 Recovery percent 460 400 350 300 250 150Base Recovery 40 AC-FTYR 8960 8960 8960 8960 8960 8960
TOTAL DIRECT OPERATING COSTS $YR 225984618$ 214298472$ 207398788$ 206191914$ 204172161$ 229163595$ $AC-FT 25222$ 23918$ 23148$ 23013$ 22788$ 25577$
INSTALLED CAPITAL COST $GPD 257$ 259$ 262$ 272$ 292$ 367$ TOTAL DIRECT CAPITAL 10609856$ 10796811$ 10996812$ 11530415$ 12499362$ 16138799$ INSTALLED CAPITAL COST 20594678$ 20756123$ 20947918$ 21757741$ 23349555$ 29354228$
NPV of OampM 25918931$ 24578608$ 23787260$ 23648839$ 23417187$ 26283538$ NPV of OampM + Capital Cost 46513609$ 45334730$ 44735177$ 45406581$ 46766742$ 55637766$ NPV of AC-FTyr NPV AC-FTPeriod 102763 102763 102763 102763 102763 102763
8 MGD - LEVELIZED COSTAC-FT 25 yrs 453$ 441$ 435$ 442$ 455$ 541$
36
Summary of reply to JGGC-D-00120 editor comments (attached PDF file)
Page 3
Qualifiers added throughout the manuscript to statements regarding potential existence of subsurface pressure due to CO2 injection
More details of excluded costs provided
Page 4
Offending statements regarding pressure in well field removed
Page 5
Reference to companion paper removed
References added
Page 6
Pore size range given along with reference
Page 7
Added cost reference
Added sentence to note lack of organisms in typical formation fluids
Noted reference to left vertical dotted line
Comment to editor These high pressure membranes are being developed by membrane manufacturers but this sort of information is not in the refereed journals because of its business sensitivity I hear this by word-of-mouth Not sure how to handle this What do you recommend
Page 8
Added USGS database size and coverage
Added references as specified
Page 10
Added comment on treatability of brines gt 85000 TDS
Added references
Page 11
37
Added reference
Modified temperature assertion for basinal brines
Page 13
Added clarification of what is being considered in cost estimate
Page 14
Caveats associated with assumed subsurface pressure have been inserted Paragraph re-worded based on reviewer comments
Page 15
Changes made Last sentence modified to exclude sites where subsurface pressure increase is not an issue
Page 19
Changes made added titles to figures and omitted reference to Big Sky CSP
Page 20
No simple way to modify figure ndash added details in text to clarify
X-axis adjusted to match in Figures 8 and 9 Y-axis was not changed as compressing it to match Figure 9 made Figure 8 harder to interpret
Summary of reply to JGGC-D-00120 editor comments (embodied e-mail)
Jim DooleySenior Staff ScientistJoint Global Change Research InstitutePacific Northwest National LaboratoryAssociate Editor for Integrated Systems and Economics International Journal of Greenhouse Gas Control
-----Original Message-----From eesjggc0c97e7d697ae1feesmailelseviercom[mailtoeesjggc0c97e7d697ae1feesmailelseviercom] On Behalf Of Int Jnl of Greenhouse Gas ControlSent Tuesday October 19 2010 1204 PMTo bourcier1llnlgov wbourciergmailcomCc Dooley James J (Jim)
38
Subject Your Submission to International Journal of Greenhouse Gas Control
Ms Ref No JGGC-D-10-00120Title Desalination of Formation Waters as a Strategy for Reducing Risk in Geological Sequestration of Carbon Dioxide International Journal of Greenhouse Gas Control
Dear Dr William L Bourcier
The reviewers have commented on your above paper They indicated that it is not acceptable for publication in its present form and major revisions will need to be implemented Once these major revisions have been completed to the Editors satisfaction we will consider publishing your paper
For your reference the comments from the editor and reviewers are listed below for your consideration and action
Thank you for submitting your work to International Journal of Greenhouse Gas Control
When you are submitting a revised manuscript please also
a) outline each change made (point by point) as raised in the reviewer comments ANDOR
b) provide a suitable rebuttal to each reviewer comment not addressed
To submit your revision please do the following
1 Go to httpBLOCKEDeeselseviercomjggc
2 Enter your login details
3 Click [Author Login]This takes you to the Author Main Menu
4 Click [Submissions Needing Revision]I look forward to receiving your revised manuscript
Yours sincerely
James J DooleyAssociate EditorInternational Journal of Greenhouse Gas Control
Comments from the editors and reviewers
Editor comments for JGGC-D-10-00120 (jjdooleypnlgov)
39
This is a good and very useful paper If you can address the concerns raised by myself and the peer reviewers I am confident that we should be able to get this paper into press in short order
Please consider revising the title of the paper to better match the contents of the paper To my mind A Preliminary Cost and Engineering Estimate for Desalinating Produced Formation Waters Associated with Carbon Dioxide Capture and Storage (agreed ndash title changed) is closer to the mark The current submission does not develop a technical argument for how desalinzation of formation waters reduces risk The paper asserts that point but it is not shown here What is shown here is a preliminary cost and engineering estimate I think this sentence from Section 1 of your paper places things in their proper perspective An additional benefit is that strategic withdrawal and reinjection of brines may allow manipulation of the location and migration of the CO2 pool in the subsurface That is the process you are looking at here provides and additional benefit (ie it is not the primary focus of what is presented in the paper) and it allows the subsurface plume to be manipulated as a part of good reservoir engineering to assure that CO2 injected into the subsurface stays there This phrasing of additional benefit and manipulation seems more consistent with the thrust of this paper and the broad body of technical literature than many of the statements in Section 1 (and elsewhewre) which seem to indicate that unless CCS+desal is done for all DSFs a whole host of very bad things are likely (almost surely) going to happen (agreed ndash text modified to make it clear that if we assume reservoir pressure existsit is an assumption Our goal is to evaluate how much benefit there is in using it if present to power desalination)
I do not believe this paper demonstrates that there would be significant pressure in the formation to deliver to the surface this pressuized feedstream for the desal unit This is asserted many times It is not shown here I therefore think you need to state assumed cost savings assumed pressure head I dont see how you can develop that point robustly in this paper as that is a whole body of work that would need to be written up in another paper showing the distance between the CO2 injector well(s) the brine production well(s) and brine reinjection well(s) and how those change over the life of the CO2 storage field This is a significant concern of mine This paper needs to stand by itself (agreed ndash text modified in several places to alleviate this concern)
Another concern I have with the paper and in particular Section 1 (but elsewhere) is that the ideal formation for CO2 storage + desal of produced water would appear from the text to be a formation that has a structural trap with a fourway closure Yet there is nothing in the technical literature that would lead one to assert that is the best or only type of DSF that could be used for CO2 storage What I really would like to avoid in your article (as the article is strong enough that it doesnt need to go down this path at all) is a simplistic Economides and Eligh-Economides caricature of CO2 storage can only happen in a sealed vessel and if you do it in a sealed vessel then you cant put any CO2 in the formation as it is already full and therefore CO2 storage is impossible I know that is not what you are saying I would like you to be more clear that you are not saying that One (but only one) simple thing I think you could do is mention specifically that Gorgon is going to produce water to manage the plume but that Sleipner Insalah Snovit do not need to employ this strategy for risk reduction and no one is asserting that those fields are a ticking time bomb that must surely leak someday soon (agreed ndash sections that infer this have been qualified or removed in particular section 11 has been edited)
There are many many many missing references in the paper I have noted them in the marked up PDF In short unless you are sure that everyone in the relevant technical community
40
understands a point if you are citing a specific value I think there needs to be a reference For example a nanofiltration membrane will allow Na and Cl to pass through the membrane freely while holding back greater than 95 of the sulfate and calcium What is the reference for such a specific point 95(text modified and reference provided) Seawater desalination costs for membrane-based systems generally vary between $050 and $100 per cubic meter of product Again what is the reference (reference for this added 11 references added in total)
Please consider standardizing terminology in the paper In particular given that both seawater and the formation brines are going to be saline I think that term probably should be used unless it is clear to the reader which is being discussed Produced saline formation waters from a deep geologic CO2 storage reservoir is a mouthful and will get tiresome if it is repeated but it is obvious that this is not seawater
Is seawater on word or is it two words sea water The paper uses both (ldquoseawaterrdquo nowspelled consistently)
Please make sure that your revised submission adheres to the format guidelines for this journal httpBLOCKEDwwwBLOCKEDelseviercomwpsfindjournaldescriptioncws_home709061authorinstructions Please use SI units in the paper In particular the paper bounces back at and forth between psi and Mpa which does nothing to improve the papers readability (all pressures now in MPa with psi conversion in parentheses)
Reviewer 1 Bourcier et al JGGC
Overall the paper is fine There are several specifics comments that may require minor revisions
Figure 2 has two vertical lines (text modified to explain which line is being referred to)
pg 7 - reinjection of produced water is usually for purposes of enhancing continued oil production (unclear what is being referred to in comment)
Figure 5c should be mentioned in the text (missing reference added)
Figure 5 contains mineral phases not discussed in the text (added text to explain significance of these minerals)
bulleted list section with 8500 to 300000 TDS should specify not possible with current technology to match later discussion of issue in text (no change made text suggests some hybrid methods may allow treatment of these fluids)
section 211 - text suggests that well head pressures of 1200 psi are upper limit in real system - what is the basis for this assertion (Changed text to state that this is the current maximum pressure for RO systems for which there are good cost data)
41
section 31 - authors calculate scale up of costs using expotential factors why not additive given the scale up is only a doubling of the basis (the cost data are based on costs data from real systems the scale-up cost savings are empirical)
Conlusions - first paragraph gives costs in cubic meters and water production in gallons without conversion use consistent units (made units consistent and added conversions)
Calculation of fresh water production associated with 1GW emissions should specify recovery factor used in calculation (we are using a recovery of 40 and units now made consistent ndashjust cubic meters of water)
Reviewer 2 Overall this is a well presented and well researched paper Management of brine in deep saline formations by producing and treating them can make some otherwise non-viable sites acceptable for geologic storage The concepts chemical principles and assumptions are clearly presented in the paper
Although this is an interesting and potentially useful analysis I have significant concerns whether the technology option presented here will be widely deployed The primary reason for concern is that almost all saline formation disposal projects that I am aware of have salinity well in excess of seawater For example Crenfield and Frio are more than 100000 mgL All of the midwestern storage projects in the Mt Simon Sandstone or other lower Paleozoic formations have salinities well in excess of 100000 and generally exceeding 250000 mgL The authors have chosen to use Wyoming brines as a primary example However it is likely that the primary deployment of CCS is likely to be in Gulf Coast and midwestern US or in similar deep high salinity settings Furthermore when the brine wells are added to the cost the total cost will be less attractive compared to seawater desalination Despite these limitations it seems that the authors have done a good job of outlining limitations and evaluating the technology for the seawater and similar salinity scenarios They also mention working on a subsequent paper that will evaluate the hydrogeologic aspects of the brine production It is hoped that in addition to the general design aspects this paper will address issues such as potential for preferential channeling of CO2 co-production of CO2 or other dissolved species with brine and other environmental or reservoir management challengesAgreed We are laying out the costs and limitations and are not making further judgements as to likelihood of deployment We used Wyoming brines as examples for the reasons this reviewer mentions
15
41 Conclusions
Our analysis indicates that RO plants for CCS brines that are similar in salinity to seawater can be built and operated for about half of the cost of seawater desalination if sufficient over-pressure (from CO2 injection) exists to supply the pressure needed to drive reverse osmosis Over 40 of subsurface brines co-produced with fossil fuels have salinities at or below seawater For a fresh water production of six million gallons per day (about 23000 cubic meters or about 18 acre feet) we estimate costs of about 32 to 40cent per cubic meter permeate produced Without well-head energy recovery the costs are from 60 to 80cent per cubic meter permeate similar to conventional seawater desalination This analysis includes all surface facilities transfer pumps and piping but does not consider the cost of the brine extraction and reinjection wells which will be site dependent
The costs for membrane desalination of sedimentary brines that are higher in salinity than our upper limit of 85000 mgL will be larger It is currently impossible to estimate these costs because membrane treatment technologies that operate in that salinity range do not exist However we believe it is likely that improved RO technologies capable of desalinating more concentrated brines would quickly become available if sufficient demand existed As mentioned above both the pressure and temperature limits are due to support materials and are not intrinsic limitations of the semi-permeable polyamide membrane High temperature-pressure RO membranes could be constructed with improved support materials For these reasons we expect the treatment costs for higher salinity brines to be only modestly higher than those for seawater after allowing for higher pressures and lower recoveries
The amount of fresh water produced by our process is significant For example atypical 1 GW coal plant emits more than 7 MtCO2year A well-designed capture system might provide 6 MtCO2 for sequestration Sequestered at a depth of 300 meters this CO2 would displace about 8 million cubic meters of water per year or about 22000 cubic meters per day Reverse osmosis treatment of that brine with a recovery of 40 would annually produce about 32 million cubic meters of fresh water which could serve the needs of 10000 homes irrigate 2000 acres of cropland or provide half of the water volume usage of a typical 1 GW IGCC power plant based on a plant use of about 2000 litersMW-h (Grubert and Kitasei 2010)
An additional benefit of our process is that strategic withdrawal and reinjection of saline aquifer brines will allow manipulation of the location and migration of the CO2 pool in the subsurface This could be accomplished by using brine injectionwithdrawal to alter the subsurface pressure field so as to affect the pressure gradient surrounding the CO2 pool in the desired way This ability to manipulate the CO2 by imposing pressure gradients
16
has the potential to substantially reduce the inherent risk of geologic sequestration of CO2
Finally site selection for saline aquifers suitable for disposal of carbon dioxide and for which brine removal increases reservoir capacity should include some consideration of the fluid salinity because lower salinity fluids are less costly to desalinate
Acknowledgements
Financial support for this work was provided by DOE through the National Energy Technology Laboratory We thank Sean Plasynski and Andrea McNemar for their help and advice We also thank Geoffrey Thyne of the Enhanced Oil Recovery Institute at the University of Wyoming George Breit of the USGS and Julio Friedmann of LLNL for helpful discussions about produced waters
17
References
Amjad Z 1993 Reverse Osmosis Membrane technology water chemistry and industrial applications Springer 384 p
Bachu S 2008 CO2 storage in geological media Role means status and barriers to deployment Progress in Energy and Combustion Science 34 254-273
Baker R W 2004 Membrane Technology and Applications 2nd ed John Wiley amp Sons Ltd Chichester
Breit GN 2002 Produced Waters Database US Geological Survey provisional database Downloadable from httpenergycrusgsgovprovprodwatindexhtm
Buros O K 2000 The ABCs of Desalting 2nd edition International Desalination Association Topsfield Massachusetts USA
Buscheck TA Hao Y Tompson A Sun Y Aines RD Wolery T Bourcier WL Burton E Waggoner J and Friedmann SJ 2011 Combining brine extraction desalination and residual brine reinjection with CO2 storage in saline formations Implications for pressure management capacity and risk mitigation Energy Procedia 4 4283-4290
Carr TR Rich PM and Bartley JD 2007 The NATCARB geoportal linking distributed data from the Carbon Sequestration Regional Partnerships Journal of Map and Geography Libraries Special Issue on Department of Energy (DOE) Geospatial Science Innovations 4(1)131-147
Court B Celia MA Nordbotten JM and Elliot TR 2011 Active and integrated management of water resources throughout CO2 capture and sequestration operations Energy Procedia 4 4221-4229
Dooley JJ and Davidson CL 2010 A Brief Technical Critique of Economides and Ehlig-Economides 2010 Sequestering Carbon Dioxide in a Closed Underground Volume PNNL-19249 Pacific Northwest National Laboratory Richland WA
Dow Water Solutions 2009 FILMTECTM Reverse Osmosis Membranes Technical Manual Form No 609-00071-1009 Dow Water Solutions Midland MI Downloadable from httpmsdssearchdowcomPublishedLiteratureDOWCOMdh_03440901b80380344689pdffilepath=liquidsepspdfsnoreg609-00071pdf
18
Ehlig-Economides C and Economides MJ 2010 Sequestering carbon dioxide in a closed underground volume Journal of Petroleum Science and Engineering 70 123-130
Frenkel V S 2011 Chapter 6 in Desalination Trends and Technologies Michael Schorr ed InTech February 2011
Fritzmann C Lowenberg J Wintegns T and Melin T 2007 State-of-the-art of reverse osmosis desalination Desalination 216 1-76
Greenberg J P and N Moslashller N 1989 The prediction of mineral solubilities in natural waters A chemical equilibrium model for the Na-K-Ca-Cl-SO4-H2O system to high concentration from 0 to 250degC Geochimica et Cosmochimica Acta 532503ndash2518
Grubert E and Kitasei S 2010 How energy choices affect fresh water supplies A comparison of US coal and natural gas Worldwatch Institute Briefing Paper 2
Hilal N Al-Zoubi H Darwish N A Mohammed A W and Arabi M A 2004 A comprehensive review of nanofiltration membranes Treatment pretreatment modeling and atomic force microscopy Desalination 170 281-308
Karagiannis I C and Soldatos P G 2008 Water desalination cost literature review and assessment Desalination 223 448-456
Kharaka Y K and Hanor J S 2007 Deep fluids in the Continents I Sedimentary Basins Chapter 516 in Treatise on Geochemistry H Holland and K Turekian eds p 1-48 Elsevier
Khawaji A D Kutubkhanah I K and Wie J-M 2008 Advances in seawater desalination technologies Desalination 221 47-69
Matsuura T 2001 Progress in membrane science and technology for seawater desalination ndash a review Desalination 134 47-54
Moch I 2008 WT Cost II Modeling the capital and operating costs of thermal desalination processes utilizing a recently developed computer program that evaluates membrane desalting electrodialysis and ion exchange plants US Bureau of Reclamation Desalination and Water Purification Research and Development Program Report No 130
National Research Council 2008 Desalination A National Perspective National Academies Press httpwwwnapedu
19
Pabalan RT and Pitzer KS 1987 Thermodynamics of concentrated electrolyte mixtures and the prediction of mineral solubilities to high temperatures for mixtures in the system Na-K-Mg-Cl-SO4-OH-H2O Geochimica et Cosmochimica Acta 51 2429-2443
Rutqvist J J T Birkholzer J T Cappa F and Tsang C-F 2007 Estimating maximum sustainable injection pressure during geological sequestration of CO2
using coupled fluid flow and geomechanical fault-slip analysis Energy Conversion Management 48 1798ndash180
Snow M D de Winter Buckingham R Campbell J and Wagner J 1996 New techniques for extreme conditions High temperature reverse osmosis and nanofiltration Desal 105 57-61
Surdam RC Jiao Z Stauffer P and Miller T 2011 The key to commercial-scale geological CO2 sequestration Displaced fluid management Energy Procedia 4 4246-4251
Wolery TJ and Jarek RL 2003 Software Userrsquos Manual EQ36 Version 80 Civilian Radioactive Waste Management System Management amp Operating Contractor 10813-UM-80-00 Prepared for US Department of Energy Office of Civilian Radioactive Waste Management Las Vegas Nevada
20
Figure captions
Figure 1 Schematic of reverse osmosis membrane geometry Example pressures of feed concentrate and permeate are shown to illustrate relative pressures during conventional treatment of seawater
Figure 2 Osmotic pressure for salt solutions as a function of system recovery
Figure 3 Histogram of salinities of produced waters in the US from depths greater than 3000 feet Data from the USGS data base of produced waters (Breit 2002)
Figure 4 Histogram of hardness (Ca + Mg expressed as mgL Ca) for produced waters in the US using data from the USGS data base of produced waters (Breit 2002)
Figure 5 Predicted mineral precipitation as a function of water removal due to reverse osmosis at 50degC in a batch system for (a) seawater brine (35000 mgL) (b) Sublette County Wyoming 3 brine (86000 mgL) and (c) Sublette County Wyoming 2 brine (24500 mgL) Minor calcite (CaCO3) precipitates at the start (not shown) and persists for all three fluids
Figure 6 Predicted osmotic pressure in residual brine as a function of water removal due to reverse osmosis at 50degC in a batch system (a) seawater (b) Sublette County Wyoming 3 brine (86000 mgL) (c) Sublette County Wyoming 2 brine (24500 mgL) The ldquoPitzerrdquo curves show the osmotic pressure as obtained from the activity of water calculated from a thermodynamic model using Pitzerrsquos equations incorporated in the EQ36 modeling code The Dow model uses the vanrsquot Hoff equation discussed in text
Figure 7 Comparison of major treatment steps in conventional high-pressure seawater desalination vs low-recovery desalination of saline formation waters
Figure 8 Comparison of estimated levelized costs per acre-ft of brine at 4 different production rates in million gallons permeate per day (MGD)
Figure 9 Comparison of levelized cost of water desalination for pressurized brines from CCS sites (where we assume well-head pressure is adequate to drive RO system) vs cost for conventional seawater RO that includes energy needed for high pressure pumps
21
22
Figure 1
23
Figure 2
0
200
400
600
800
1000
1200
1400
1600
1800
2000
0 25000 50000 75000 100000 125000 150000
Osm
otic
pre
ssur
e (π
) ps
i
Initial TDS mgL
0
10
20
50
Seawater brine family
Extraction
1500 psi RO or NF + RO
Conventional RO
NF + RO
larrNormal seawater
24
Figure 3
0
10
20
30
40
50
60
70
0-10000 10000-40000 40000-85000 85000-300000 gt300000
Freq
uenc
y
TDS mgL
Depth ge 3000 ft
25
Figure 4
26
Figure 5
00
05
10
15
20
25
30
35
55 60 65 70 75 80 85
Wei
ght
gkg
H2O
H2O Removed
Calcite
Anhydrite
Halite
00
05
10
15
20
25
30
35
75 80 85 90 95
Wei
ght
gkg
H2O
H2O Removed
Calcite
Anhydrite
Glauberite
Halite
(b) Sublette County 3 brine
(a) seawater
27
00
05
10
15
20
25
30
35
55 65 75 85 95
Wei
ght
gkg
H2O
H2O Removed
Anhydrite
Glauberite
Nahcolite
Thenardite
(c) Sublette County 2 brine
28
Figure 6
0
400
800
1200
1600
2000
2400
0 20 40 60 80
Osm
otic
pre
ssur
e (π
) ps
i
H2O Removed
Dow
Pitzer
1200 psi limit
0
400
800
1200
1600
2000
2400
0 20 40 60
Osm
otic
pre
ssur
e (π
) ps
i
H2O Removed
Dow
Pitzer
1200 psi limit
(b) seawater
(b) Sublette County 3 brine
29
0
200
400
600
800
1000
1200
1400
1600
1800
2000
0 20 40 60 80 100
Osm
otic
pre
ssur
e (π
) ps
i
H2O Removed
Dow
Pitzer
1200 psi limit
(c) Sublette County 2 Brine
30
Figure 7
Pre-treatment
Physical filtrationpH adjustment
Remove organics
Saline aquifer fluidSea water
Desalination
Fresh water Brine dischargeConcentrate2X feed
Feed
Fresh water Concentrate12X Feed
Feed
RO
RO
Pressure(PSI)1200
1200
1190
1200+
Pressure(PSI)15
1200
1180
15+
ChillerCoolingAnti-scalantsDisinfectant
Pressurization
Energy recoveryDepress
urization
Ocean Saline aquifer
Repressurization
Serial Elements
Parallel Elements
31
Figure 8
$-
$100
$200
$300
$400
$500
$600
$700
$800
$900
$1000
10 15 20 25 30 35 40 45 50
LCO
W -
$A
C-FT
System RO Recovery
Levelized Cost of Water vs Recovery
2 MGD - LEVELIZED COSTAC-FT 25 yrs4 MGD - LEVELIZED COSTAC-FT 25 yrs6 MGD - LEVELIZED COSTAC-FT 25 yrs
32
Figure 9
$500
$700
$900
$1100
$1300
$1500
$1700
10 15 20 25 30 35 40 45 50
System RO Recovery
LCOW
- $A
C-FT
2 MGD - Pump to Pressure 2 MGD - Reservoir Pressure
33
Table 1 Conventional seawater vs saline formation water reverse osmosis treatment systems
RO System Major Component Items Conventional SW Systems Reservoir Treatment System
EQUIPMENT
High pressure feed pipingOnly necessary after the high pressure
pumpStarting from the well head
High pressure reject pipingOnly to back pressure control valve ie
skid boundaryReturn line to the deep well injection
pointIntake feed structure Open intake structure or sea wells Reservoir wellsPretreatment system Multi-media filter or micro-filter Activated carbon filterFeed pumping system Needed from feed source to RO skid Not needed - Use well head pressurePretreatment system Cartridge filters Cartridge filtersHeat exchanger None Yes Reduce feed temperature to 50degC
Chemical Injection system ndash bio controlYes ndash for bio control followed by
reducing agentNot needed
Chemical Injection system ndash scale control
Yes ndash scale inhibitor for calcium carbonate
Yes ndash scale inhibitor for calcium carbonate andor calcium sulfate
High pressure pump Yes (most costly item of RO skid) No - Use well head pressure
Energy recovery device Yes ndash typically used for larger systemsNo ndash keep reject at maximum pressure
for reinjectionRO pressure vessels (PV) Same for equal permeate capacity Same for equal permeate capacityRO membranes Conventional seawater membranes Conventional seawater membranes
Array ndash configurationSingle pass
7 elements per PVSingle pass
7 elements per PV
Percent recoveryRanges between 30 to 50 depending on seawater concentration system size
and energy costs
Ranges between 15 to 45 depending on reservoir feed concentration and
compositionSystem IampC Similar to reservoir system Similar to seawater system
MCCVFDIncludes electrical supply for high HP
pump(s)
Same as conventional SW system with exception of the high HP pump(s) ie
no VFD needed
Valves controls amp Instrumentation Similar to reservoir systemSimilar to seawater system except high pressure pump associated valving and
controlsTanking Similar to reservoir system Similar to seawater systemDeep well injection Reject typically goes to seawater outfall Deep well injection requiredCivil works Very site dependent Very site dependent
OPERATIONS
OperatingSimilar to reservoir system except no
deep well injection
Similar to seawater system except no high pressure pump(s) and energy
recovery but use of deep well injection for reject concentrate
Energy consumptionEnergy to deliver feed to high pressure
pumps and then raise to ~ 1000 psi
Similar to seawater system without the feed and process pumping Deep well injection pumping energy required
Chemicals consumption including membrane cleaning
Similar to reservoir system Similar to seawater system
Maintenance as of capital Similar to reservoir system Similar to seawater system
34
Table 2 Major Costs and Cost Factors for RO Treatment Systems
Assumed Discount Rate 700Plant Lifetime Evaluation Period 2500 yearsOperating Cost escalation yr 000
Base Operating Pressure at reference conditions 1200 psiBase recovery 40Cleaning timesyear 05Chemicals $3ConsumablesActivated Carbon $ 30 $ft^3Filter cartridges $ 4 $eachPower Repressurization $007 $kWhPower Misc uses 20000 kWhdayLaborFringe amp Overhead Multiplier 200 factorSupervisor $ 150000 SalaryOperators $ 60000 SalaryTechnicians $ 75000 Salary
Mechanical Maintenance of Capital 3Length of high pressure piping 125 ft
35
Table 3 Itemization of costs for water desalination plants of 2 and 8 MGD permeate at 40 water recovery
Base FEED Flow MGD 500 Product Flow MGD 20 20 20 20 20 20Base PRODUCT Flow MGD 200 Recovery percent 450 400 350 300 250 150Base Recovery 40 AC-FTYR 2240 2240 2240 2240 2240 2240
TOTAL DIRECT OPERATING COSTS $YR 123369829$ 120648345$ 118969371$ 118731532$ 118346855$ 125187892$ $AC-FT 55077$ 53862$ 53112$ 53006$ 52835$ 55889$
INSTALLED CAPITAL COST $GPD 347$ 349$ 356$ 371$ 398$ 493$ TOTAL DIRECT CAPITAL 3844576$ 3912316$ 4027492$ 4234852$ 4588768$ 5823751$ INSTALLED CAPITAL COST 6934334$ 6987133$ 7120062$ 7414175$ 7962181$ 9869483$
NPV of OampM 14149698$ 13837562$ 13644994$ 13617716$ 13573596$ 14358217$ NPV of OampM + Capital Cost 21084032$ 20824694$ 20765056$ 21031891$ 21535777$ 24227701$ NPV of AC-FTyr NPV AC-FTPeriod 25691 25691 25691 25691 25691 25691
2 MGD - LEVELIZED COSTAC-FT 25 yrs 821$ 811$ 808$ 819$ 838$ 943$
Base FEED Flow MGD 2000 Product Flow MGD 80 80 80 80 80 80Base PRODUCT Flow MGD 800 Recovery percent 460 400 350 300 250 150Base Recovery 40 AC-FTYR 8960 8960 8960 8960 8960 8960
TOTAL DIRECT OPERATING COSTS $YR 225984618$ 214298472$ 207398788$ 206191914$ 204172161$ 229163595$ $AC-FT 25222$ 23918$ 23148$ 23013$ 22788$ 25577$
INSTALLED CAPITAL COST $GPD 257$ 259$ 262$ 272$ 292$ 367$ TOTAL DIRECT CAPITAL 10609856$ 10796811$ 10996812$ 11530415$ 12499362$ 16138799$ INSTALLED CAPITAL COST 20594678$ 20756123$ 20947918$ 21757741$ 23349555$ 29354228$
NPV of OampM 25918931$ 24578608$ 23787260$ 23648839$ 23417187$ 26283538$ NPV of OampM + Capital Cost 46513609$ 45334730$ 44735177$ 45406581$ 46766742$ 55637766$ NPV of AC-FTyr NPV AC-FTPeriod 102763 102763 102763 102763 102763 102763
8 MGD - LEVELIZED COSTAC-FT 25 yrs 453$ 441$ 435$ 442$ 455$ 541$
36
Summary of reply to JGGC-D-00120 editor comments (attached PDF file)
Page 3
Qualifiers added throughout the manuscript to statements regarding potential existence of subsurface pressure due to CO2 injection
More details of excluded costs provided
Page 4
Offending statements regarding pressure in well field removed
Page 5
Reference to companion paper removed
References added
Page 6
Pore size range given along with reference
Page 7
Added cost reference
Added sentence to note lack of organisms in typical formation fluids
Noted reference to left vertical dotted line
Comment to editor These high pressure membranes are being developed by membrane manufacturers but this sort of information is not in the refereed journals because of its business sensitivity I hear this by word-of-mouth Not sure how to handle this What do you recommend
Page 8
Added USGS database size and coverage
Added references as specified
Page 10
Added comment on treatability of brines gt 85000 TDS
Added references
Page 11
37
Added reference
Modified temperature assertion for basinal brines
Page 13
Added clarification of what is being considered in cost estimate
Page 14
Caveats associated with assumed subsurface pressure have been inserted Paragraph re-worded based on reviewer comments
Page 15
Changes made Last sentence modified to exclude sites where subsurface pressure increase is not an issue
Page 19
Changes made added titles to figures and omitted reference to Big Sky CSP
Page 20
No simple way to modify figure ndash added details in text to clarify
X-axis adjusted to match in Figures 8 and 9 Y-axis was not changed as compressing it to match Figure 9 made Figure 8 harder to interpret
Summary of reply to JGGC-D-00120 editor comments (embodied e-mail)
Jim DooleySenior Staff ScientistJoint Global Change Research InstitutePacific Northwest National LaboratoryAssociate Editor for Integrated Systems and Economics International Journal of Greenhouse Gas Control
-----Original Message-----From eesjggc0c97e7d697ae1feesmailelseviercom[mailtoeesjggc0c97e7d697ae1feesmailelseviercom] On Behalf Of Int Jnl of Greenhouse Gas ControlSent Tuesday October 19 2010 1204 PMTo bourcier1llnlgov wbourciergmailcomCc Dooley James J (Jim)
38
Subject Your Submission to International Journal of Greenhouse Gas Control
Ms Ref No JGGC-D-10-00120Title Desalination of Formation Waters as a Strategy for Reducing Risk in Geological Sequestration of Carbon Dioxide International Journal of Greenhouse Gas Control
Dear Dr William L Bourcier
The reviewers have commented on your above paper They indicated that it is not acceptable for publication in its present form and major revisions will need to be implemented Once these major revisions have been completed to the Editors satisfaction we will consider publishing your paper
For your reference the comments from the editor and reviewers are listed below for your consideration and action
Thank you for submitting your work to International Journal of Greenhouse Gas Control
When you are submitting a revised manuscript please also
a) outline each change made (point by point) as raised in the reviewer comments ANDOR
b) provide a suitable rebuttal to each reviewer comment not addressed
To submit your revision please do the following
1 Go to httpBLOCKEDeeselseviercomjggc
2 Enter your login details
3 Click [Author Login]This takes you to the Author Main Menu
4 Click [Submissions Needing Revision]I look forward to receiving your revised manuscript
Yours sincerely
James J DooleyAssociate EditorInternational Journal of Greenhouse Gas Control
Comments from the editors and reviewers
Editor comments for JGGC-D-10-00120 (jjdooleypnlgov)
39
This is a good and very useful paper If you can address the concerns raised by myself and the peer reviewers I am confident that we should be able to get this paper into press in short order
Please consider revising the title of the paper to better match the contents of the paper To my mind A Preliminary Cost and Engineering Estimate for Desalinating Produced Formation Waters Associated with Carbon Dioxide Capture and Storage (agreed ndash title changed) is closer to the mark The current submission does not develop a technical argument for how desalinzation of formation waters reduces risk The paper asserts that point but it is not shown here What is shown here is a preliminary cost and engineering estimate I think this sentence from Section 1 of your paper places things in their proper perspective An additional benefit is that strategic withdrawal and reinjection of brines may allow manipulation of the location and migration of the CO2 pool in the subsurface That is the process you are looking at here provides and additional benefit (ie it is not the primary focus of what is presented in the paper) and it allows the subsurface plume to be manipulated as a part of good reservoir engineering to assure that CO2 injected into the subsurface stays there This phrasing of additional benefit and manipulation seems more consistent with the thrust of this paper and the broad body of technical literature than many of the statements in Section 1 (and elsewhewre) which seem to indicate that unless CCS+desal is done for all DSFs a whole host of very bad things are likely (almost surely) going to happen (agreed ndash text modified to make it clear that if we assume reservoir pressure existsit is an assumption Our goal is to evaluate how much benefit there is in using it if present to power desalination)
I do not believe this paper demonstrates that there would be significant pressure in the formation to deliver to the surface this pressuized feedstream for the desal unit This is asserted many times It is not shown here I therefore think you need to state assumed cost savings assumed pressure head I dont see how you can develop that point robustly in this paper as that is a whole body of work that would need to be written up in another paper showing the distance between the CO2 injector well(s) the brine production well(s) and brine reinjection well(s) and how those change over the life of the CO2 storage field This is a significant concern of mine This paper needs to stand by itself (agreed ndash text modified in several places to alleviate this concern)
Another concern I have with the paper and in particular Section 1 (but elsewhere) is that the ideal formation for CO2 storage + desal of produced water would appear from the text to be a formation that has a structural trap with a fourway closure Yet there is nothing in the technical literature that would lead one to assert that is the best or only type of DSF that could be used for CO2 storage What I really would like to avoid in your article (as the article is strong enough that it doesnt need to go down this path at all) is a simplistic Economides and Eligh-Economides caricature of CO2 storage can only happen in a sealed vessel and if you do it in a sealed vessel then you cant put any CO2 in the formation as it is already full and therefore CO2 storage is impossible I know that is not what you are saying I would like you to be more clear that you are not saying that One (but only one) simple thing I think you could do is mention specifically that Gorgon is going to produce water to manage the plume but that Sleipner Insalah Snovit do not need to employ this strategy for risk reduction and no one is asserting that those fields are a ticking time bomb that must surely leak someday soon (agreed ndash sections that infer this have been qualified or removed in particular section 11 has been edited)
There are many many many missing references in the paper I have noted them in the marked up PDF In short unless you are sure that everyone in the relevant technical community
40
understands a point if you are citing a specific value I think there needs to be a reference For example a nanofiltration membrane will allow Na and Cl to pass through the membrane freely while holding back greater than 95 of the sulfate and calcium What is the reference for such a specific point 95(text modified and reference provided) Seawater desalination costs for membrane-based systems generally vary between $050 and $100 per cubic meter of product Again what is the reference (reference for this added 11 references added in total)
Please consider standardizing terminology in the paper In particular given that both seawater and the formation brines are going to be saline I think that term probably should be used unless it is clear to the reader which is being discussed Produced saline formation waters from a deep geologic CO2 storage reservoir is a mouthful and will get tiresome if it is repeated but it is obvious that this is not seawater
Is seawater on word or is it two words sea water The paper uses both (ldquoseawaterrdquo nowspelled consistently)
Please make sure that your revised submission adheres to the format guidelines for this journal httpBLOCKEDwwwBLOCKEDelseviercomwpsfindjournaldescriptioncws_home709061authorinstructions Please use SI units in the paper In particular the paper bounces back at and forth between psi and Mpa which does nothing to improve the papers readability (all pressures now in MPa with psi conversion in parentheses)
Reviewer 1 Bourcier et al JGGC
Overall the paper is fine There are several specifics comments that may require minor revisions
Figure 2 has two vertical lines (text modified to explain which line is being referred to)
pg 7 - reinjection of produced water is usually for purposes of enhancing continued oil production (unclear what is being referred to in comment)
Figure 5c should be mentioned in the text (missing reference added)
Figure 5 contains mineral phases not discussed in the text (added text to explain significance of these minerals)
bulleted list section with 8500 to 300000 TDS should specify not possible with current technology to match later discussion of issue in text (no change made text suggests some hybrid methods may allow treatment of these fluids)
section 211 - text suggests that well head pressures of 1200 psi are upper limit in real system - what is the basis for this assertion (Changed text to state that this is the current maximum pressure for RO systems for which there are good cost data)
41
section 31 - authors calculate scale up of costs using expotential factors why not additive given the scale up is only a doubling of the basis (the cost data are based on costs data from real systems the scale-up cost savings are empirical)
Conlusions - first paragraph gives costs in cubic meters and water production in gallons without conversion use consistent units (made units consistent and added conversions)
Calculation of fresh water production associated with 1GW emissions should specify recovery factor used in calculation (we are using a recovery of 40 and units now made consistent ndashjust cubic meters of water)
Reviewer 2 Overall this is a well presented and well researched paper Management of brine in deep saline formations by producing and treating them can make some otherwise non-viable sites acceptable for geologic storage The concepts chemical principles and assumptions are clearly presented in the paper
Although this is an interesting and potentially useful analysis I have significant concerns whether the technology option presented here will be widely deployed The primary reason for concern is that almost all saline formation disposal projects that I am aware of have salinity well in excess of seawater For example Crenfield and Frio are more than 100000 mgL All of the midwestern storage projects in the Mt Simon Sandstone or other lower Paleozoic formations have salinities well in excess of 100000 and generally exceeding 250000 mgL The authors have chosen to use Wyoming brines as a primary example However it is likely that the primary deployment of CCS is likely to be in Gulf Coast and midwestern US or in similar deep high salinity settings Furthermore when the brine wells are added to the cost the total cost will be less attractive compared to seawater desalination Despite these limitations it seems that the authors have done a good job of outlining limitations and evaluating the technology for the seawater and similar salinity scenarios They also mention working on a subsequent paper that will evaluate the hydrogeologic aspects of the brine production It is hoped that in addition to the general design aspects this paper will address issues such as potential for preferential channeling of CO2 co-production of CO2 or other dissolved species with brine and other environmental or reservoir management challengesAgreed We are laying out the costs and limitations and are not making further judgements as to likelihood of deployment We used Wyoming brines as examples for the reasons this reviewer mentions
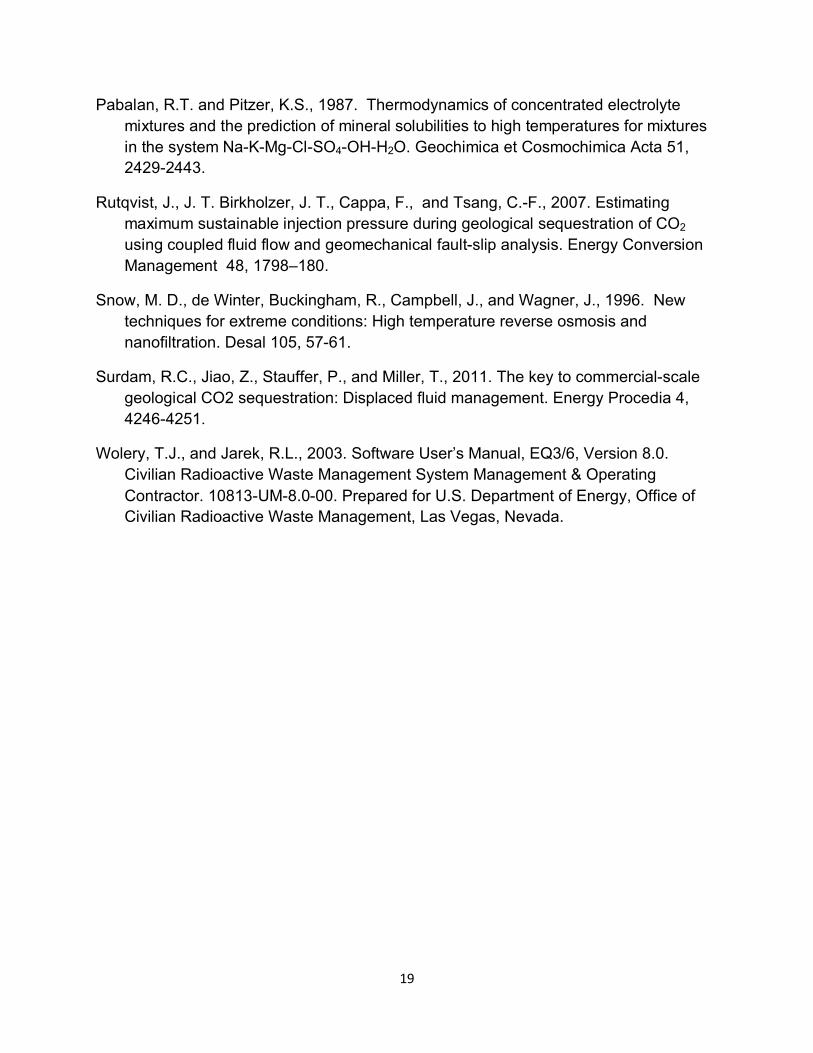
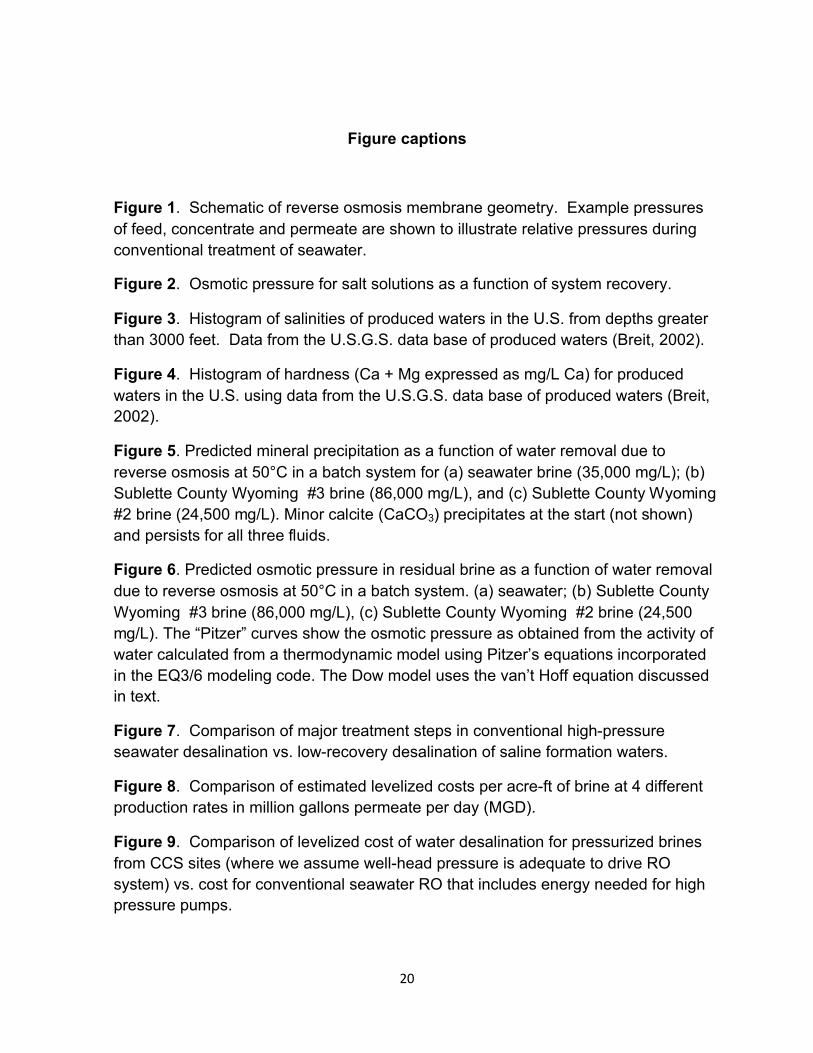
20
Figure captions
Figure 1 Schematic of reverse osmosis membrane geometry Example pressures of feed concentrate and permeate are shown to illustrate relative pressures during conventional treatment of seawater
Figure 2 Osmotic pressure for salt solutions as a function of system recovery
Figure 3 Histogram of salinities of produced waters in the US from depths greater than 3000 feet Data from the USGS data base of produced waters (Breit 2002)
Figure 4 Histogram of hardness (Ca + Mg expressed as mgL Ca) for produced waters in the US using data from the USGS data base of produced waters (Breit 2002)
Figure 5 Predicted mineral precipitation as a function of water removal due to reverse osmosis at 50degC in a batch system for (a) seawater brine (35000 mgL) (b) Sublette County Wyoming 3 brine (86000 mgL) and (c) Sublette County Wyoming 2 brine (24500 mgL) Minor calcite (CaCO3) precipitates at the start (not shown) and persists for all three fluids
Figure 6 Predicted osmotic pressure in residual brine as a function of water removal due to reverse osmosis at 50degC in a batch system (a) seawater (b) Sublette County Wyoming 3 brine (86000 mgL) (c) Sublette County Wyoming 2 brine (24500 mgL) The ldquoPitzerrdquo curves show the osmotic pressure as obtained from the activity of water calculated from a thermodynamic model using Pitzerrsquos equations incorporated in the EQ36 modeling code The Dow model uses the vanrsquot Hoff equation discussed in text
Figure 7 Comparison of major treatment steps in conventional high-pressure seawater desalination vs low-recovery desalination of saline formation waters
Figure 8 Comparison of estimated levelized costs per acre-ft of brine at 4 different production rates in million gallons permeate per day (MGD)
Figure 9 Comparison of levelized cost of water desalination for pressurized brines from CCS sites (where we assume well-head pressure is adequate to drive RO system) vs cost for conventional seawater RO that includes energy needed for high pressure pumps
21
22
Figure 1
23
Figure 2
0
200
400
600
800
1000
1200
1400
1600
1800
2000
0 25000 50000 75000 100000 125000 150000
Osm
otic
pre
ssur
e (π
) ps
i
Initial TDS mgL
0
10
20
50
Seawater brine family
Extraction
1500 psi RO or NF + RO
Conventional RO
NF + RO
larrNormal seawater
24
Figure 3
0
10
20
30
40
50
60
70
0-10000 10000-40000 40000-85000 85000-300000 gt300000
Freq
uenc
y
TDS mgL
Depth ge 3000 ft
25
Figure 4
26
Figure 5
00
05
10
15
20
25
30
35
55 60 65 70 75 80 85
Wei
ght
gkg
H2O
H2O Removed
Calcite
Anhydrite
Halite
00
05
10
15
20
25
30
35
75 80 85 90 95
Wei
ght
gkg
H2O
H2O Removed
Calcite
Anhydrite
Glauberite
Halite
(b) Sublette County 3 brine
(a) seawater
27
00
05
10
15
20
25
30
35
55 65 75 85 95
Wei
ght
gkg
H2O
H2O Removed
Anhydrite
Glauberite
Nahcolite
Thenardite
(c) Sublette County 2 brine
28
Figure 6
0
400
800
1200
1600
2000
2400
0 20 40 60 80
Osm
otic
pre
ssur
e (π
) ps
i
H2O Removed
Dow
Pitzer
1200 psi limit
0
400
800
1200
1600
2000
2400
0 20 40 60
Osm
otic
pre
ssur
e (π
) ps
i
H2O Removed
Dow
Pitzer
1200 psi limit
(b) seawater
(b) Sublette County 3 brine
29
0
200
400
600
800
1000
1200
1400
1600
1800
2000
0 20 40 60 80 100
Osm
otic
pre
ssur
e (π
) ps
i
H2O Removed
Dow
Pitzer
1200 psi limit
(c) Sublette County 2 Brine
30
Figure 7
Pre-treatment
Physical filtrationpH adjustment
Remove organics
Saline aquifer fluidSea water
Desalination
Fresh water Brine dischargeConcentrate2X feed
Feed
Fresh water Concentrate12X Feed
Feed
RO
RO
Pressure(PSI)1200
1200
1190
1200+
Pressure(PSI)15
1200
1180
15+
ChillerCoolingAnti-scalantsDisinfectant
Pressurization
Energy recoveryDepress
urization
Ocean Saline aquifer
Repressurization
Serial Elements
Parallel Elements
31
Figure 8
$-
$100
$200
$300
$400
$500
$600
$700
$800
$900
$1000
10 15 20 25 30 35 40 45 50
LCO
W -
$A
C-FT
System RO Recovery
Levelized Cost of Water vs Recovery
2 MGD - LEVELIZED COSTAC-FT 25 yrs4 MGD - LEVELIZED COSTAC-FT 25 yrs6 MGD - LEVELIZED COSTAC-FT 25 yrs
32
Figure 9
$500
$700
$900
$1100
$1300
$1500
$1700
10 15 20 25 30 35 40 45 50
System RO Recovery
LCOW
- $A
C-FT
2 MGD - Pump to Pressure 2 MGD - Reservoir Pressure
33
Table 1 Conventional seawater vs saline formation water reverse osmosis treatment systems
RO System Major Component Items Conventional SW Systems Reservoir Treatment System
EQUIPMENT
High pressure feed pipingOnly necessary after the high pressure
pumpStarting from the well head
High pressure reject pipingOnly to back pressure control valve ie
skid boundaryReturn line to the deep well injection
pointIntake feed structure Open intake structure or sea wells Reservoir wellsPretreatment system Multi-media filter or micro-filter Activated carbon filterFeed pumping system Needed from feed source to RO skid Not needed - Use well head pressurePretreatment system Cartridge filters Cartridge filtersHeat exchanger None Yes Reduce feed temperature to 50degC
Chemical Injection system ndash bio controlYes ndash for bio control followed by
reducing agentNot needed
Chemical Injection system ndash scale control
Yes ndash scale inhibitor for calcium carbonate
Yes ndash scale inhibitor for calcium carbonate andor calcium sulfate
High pressure pump Yes (most costly item of RO skid) No - Use well head pressure
Energy recovery device Yes ndash typically used for larger systemsNo ndash keep reject at maximum pressure
for reinjectionRO pressure vessels (PV) Same for equal permeate capacity Same for equal permeate capacityRO membranes Conventional seawater membranes Conventional seawater membranes
Array ndash configurationSingle pass
7 elements per PVSingle pass
7 elements per PV
Percent recoveryRanges between 30 to 50 depending on seawater concentration system size
and energy costs
Ranges between 15 to 45 depending on reservoir feed concentration and
compositionSystem IampC Similar to reservoir system Similar to seawater system
MCCVFDIncludes electrical supply for high HP
pump(s)
Same as conventional SW system with exception of the high HP pump(s) ie
no VFD needed
Valves controls amp Instrumentation Similar to reservoir systemSimilar to seawater system except high pressure pump associated valving and
controlsTanking Similar to reservoir system Similar to seawater systemDeep well injection Reject typically goes to seawater outfall Deep well injection requiredCivil works Very site dependent Very site dependent
OPERATIONS
OperatingSimilar to reservoir system except no
deep well injection
Similar to seawater system except no high pressure pump(s) and energy
recovery but use of deep well injection for reject concentrate
Energy consumptionEnergy to deliver feed to high pressure
pumps and then raise to ~ 1000 psi
Similar to seawater system without the feed and process pumping Deep well injection pumping energy required
Chemicals consumption including membrane cleaning
Similar to reservoir system Similar to seawater system
Maintenance as of capital Similar to reservoir system Similar to seawater system
34
Table 2 Major Costs and Cost Factors for RO Treatment Systems
Assumed Discount Rate 700Plant Lifetime Evaluation Period 2500 yearsOperating Cost escalation yr 000
Base Operating Pressure at reference conditions 1200 psiBase recovery 40Cleaning timesyear 05Chemicals $3ConsumablesActivated Carbon $ 30 $ft^3Filter cartridges $ 4 $eachPower Repressurization $007 $kWhPower Misc uses 20000 kWhdayLaborFringe amp Overhead Multiplier 200 factorSupervisor $ 150000 SalaryOperators $ 60000 SalaryTechnicians $ 75000 Salary
Mechanical Maintenance of Capital 3Length of high pressure piping 125 ft
35
Table 3 Itemization of costs for water desalination plants of 2 and 8 MGD permeate at 40 water recovery
Base FEED Flow MGD 500 Product Flow MGD 20 20 20 20 20 20Base PRODUCT Flow MGD 200 Recovery percent 450 400 350 300 250 150Base Recovery 40 AC-FTYR 2240 2240 2240 2240 2240 2240
TOTAL DIRECT OPERATING COSTS $YR 123369829$ 120648345$ 118969371$ 118731532$ 118346855$ 125187892$ $AC-FT 55077$ 53862$ 53112$ 53006$ 52835$ 55889$
INSTALLED CAPITAL COST $GPD 347$ 349$ 356$ 371$ 398$ 493$ TOTAL DIRECT CAPITAL 3844576$ 3912316$ 4027492$ 4234852$ 4588768$ 5823751$ INSTALLED CAPITAL COST 6934334$ 6987133$ 7120062$ 7414175$ 7962181$ 9869483$
NPV of OampM 14149698$ 13837562$ 13644994$ 13617716$ 13573596$ 14358217$ NPV of OampM + Capital Cost 21084032$ 20824694$ 20765056$ 21031891$ 21535777$ 24227701$ NPV of AC-FTyr NPV AC-FTPeriod 25691 25691 25691 25691 25691 25691
2 MGD - LEVELIZED COSTAC-FT 25 yrs 821$ 811$ 808$ 819$ 838$ 943$
Base FEED Flow MGD 2000 Product Flow MGD 80 80 80 80 80 80Base PRODUCT Flow MGD 800 Recovery percent 460 400 350 300 250 150Base Recovery 40 AC-FTYR 8960 8960 8960 8960 8960 8960
TOTAL DIRECT OPERATING COSTS $YR 225984618$ 214298472$ 207398788$ 206191914$ 204172161$ 229163595$ $AC-FT 25222$ 23918$ 23148$ 23013$ 22788$ 25577$
INSTALLED CAPITAL COST $GPD 257$ 259$ 262$ 272$ 292$ 367$ TOTAL DIRECT CAPITAL 10609856$ 10796811$ 10996812$ 11530415$ 12499362$ 16138799$ INSTALLED CAPITAL COST 20594678$ 20756123$ 20947918$ 21757741$ 23349555$ 29354228$
NPV of OampM 25918931$ 24578608$ 23787260$ 23648839$ 23417187$ 26283538$ NPV of OampM + Capital Cost 46513609$ 45334730$ 44735177$ 45406581$ 46766742$ 55637766$ NPV of AC-FTyr NPV AC-FTPeriod 102763 102763 102763 102763 102763 102763
8 MGD - LEVELIZED COSTAC-FT 25 yrs 453$ 441$ 435$ 442$ 455$ 541$
36
Summary of reply to JGGC-D-00120 editor comments (attached PDF file)
Page 3
Qualifiers added throughout the manuscript to statements regarding potential existence of subsurface pressure due to CO2 injection
More details of excluded costs provided
Page 4
Offending statements regarding pressure in well field removed
Page 5
Reference to companion paper removed
References added
Page 6
Pore size range given along with reference
Page 7
Added cost reference
Added sentence to note lack of organisms in typical formation fluids
Noted reference to left vertical dotted line
Comment to editor These high pressure membranes are being developed by membrane manufacturers but this sort of information is not in the refereed journals because of its business sensitivity I hear this by word-of-mouth Not sure how to handle this What do you recommend
Page 8
Added USGS database size and coverage
Added references as specified
Page 10
Added comment on treatability of brines gt 85000 TDS
Added references
Page 11
37
Added reference
Modified temperature assertion for basinal brines
Page 13
Added clarification of what is being considered in cost estimate
Page 14
Caveats associated with assumed subsurface pressure have been inserted Paragraph re-worded based on reviewer comments
Page 15
Changes made Last sentence modified to exclude sites where subsurface pressure increase is not an issue
Page 19
Changes made added titles to figures and omitted reference to Big Sky CSP
Page 20
No simple way to modify figure ndash added details in text to clarify
X-axis adjusted to match in Figures 8 and 9 Y-axis was not changed as compressing it to match Figure 9 made Figure 8 harder to interpret
Summary of reply to JGGC-D-00120 editor comments (embodied e-mail)
Jim DooleySenior Staff ScientistJoint Global Change Research InstitutePacific Northwest National LaboratoryAssociate Editor for Integrated Systems and Economics International Journal of Greenhouse Gas Control
-----Original Message-----From eesjggc0c97e7d697ae1feesmailelseviercom[mailtoeesjggc0c97e7d697ae1feesmailelseviercom] On Behalf Of Int Jnl of Greenhouse Gas ControlSent Tuesday October 19 2010 1204 PMTo bourcier1llnlgov wbourciergmailcomCc Dooley James J (Jim)
38
Subject Your Submission to International Journal of Greenhouse Gas Control
Ms Ref No JGGC-D-10-00120Title Desalination of Formation Waters as a Strategy for Reducing Risk in Geological Sequestration of Carbon Dioxide International Journal of Greenhouse Gas Control
Dear Dr William L Bourcier
The reviewers have commented on your above paper They indicated that it is not acceptable for publication in its present form and major revisions will need to be implemented Once these major revisions have been completed to the Editors satisfaction we will consider publishing your paper
For your reference the comments from the editor and reviewers are listed below for your consideration and action
Thank you for submitting your work to International Journal of Greenhouse Gas Control
When you are submitting a revised manuscript please also
a) outline each change made (point by point) as raised in the reviewer comments ANDOR
b) provide a suitable rebuttal to each reviewer comment not addressed
To submit your revision please do the following
1 Go to httpBLOCKEDeeselseviercomjggc
2 Enter your login details
3 Click [Author Login]This takes you to the Author Main Menu
4 Click [Submissions Needing Revision]I look forward to receiving your revised manuscript
Yours sincerely
James J DooleyAssociate EditorInternational Journal of Greenhouse Gas Control
Comments from the editors and reviewers
Editor comments for JGGC-D-10-00120 (jjdooleypnlgov)
39
This is a good and very useful paper If you can address the concerns raised by myself and the peer reviewers I am confident that we should be able to get this paper into press in short order
Please consider revising the title of the paper to better match the contents of the paper To my mind A Preliminary Cost and Engineering Estimate for Desalinating Produced Formation Waters Associated with Carbon Dioxide Capture and Storage (agreed ndash title changed) is closer to the mark The current submission does not develop a technical argument for how desalinzation of formation waters reduces risk The paper asserts that point but it is not shown here What is shown here is a preliminary cost and engineering estimate I think this sentence from Section 1 of your paper places things in their proper perspective An additional benefit is that strategic withdrawal and reinjection of brines may allow manipulation of the location and migration of the CO2 pool in the subsurface That is the process you are looking at here provides and additional benefit (ie it is not the primary focus of what is presented in the paper) and it allows the subsurface plume to be manipulated as a part of good reservoir engineering to assure that CO2 injected into the subsurface stays there This phrasing of additional benefit and manipulation seems more consistent with the thrust of this paper and the broad body of technical literature than many of the statements in Section 1 (and elsewhewre) which seem to indicate that unless CCS+desal is done for all DSFs a whole host of very bad things are likely (almost surely) going to happen (agreed ndash text modified to make it clear that if we assume reservoir pressure existsit is an assumption Our goal is to evaluate how much benefit there is in using it if present to power desalination)
I do not believe this paper demonstrates that there would be significant pressure in the formation to deliver to the surface this pressuized feedstream for the desal unit This is asserted many times It is not shown here I therefore think you need to state assumed cost savings assumed pressure head I dont see how you can develop that point robustly in this paper as that is a whole body of work that would need to be written up in another paper showing the distance between the CO2 injector well(s) the brine production well(s) and brine reinjection well(s) and how those change over the life of the CO2 storage field This is a significant concern of mine This paper needs to stand by itself (agreed ndash text modified in several places to alleviate this concern)
Another concern I have with the paper and in particular Section 1 (but elsewhere) is that the ideal formation for CO2 storage + desal of produced water would appear from the text to be a formation that has a structural trap with a fourway closure Yet there is nothing in the technical literature that would lead one to assert that is the best or only type of DSF that could be used for CO2 storage What I really would like to avoid in your article (as the article is strong enough that it doesnt need to go down this path at all) is a simplistic Economides and Eligh-Economides caricature of CO2 storage can only happen in a sealed vessel and if you do it in a sealed vessel then you cant put any CO2 in the formation as it is already full and therefore CO2 storage is impossible I know that is not what you are saying I would like you to be more clear that you are not saying that One (but only one) simple thing I think you could do is mention specifically that Gorgon is going to produce water to manage the plume but that Sleipner Insalah Snovit do not need to employ this strategy for risk reduction and no one is asserting that those fields are a ticking time bomb that must surely leak someday soon (agreed ndash sections that infer this have been qualified or removed in particular section 11 has been edited)
There are many many many missing references in the paper I have noted them in the marked up PDF In short unless you are sure that everyone in the relevant technical community
40
understands a point if you are citing a specific value I think there needs to be a reference For example a nanofiltration membrane will allow Na and Cl to pass through the membrane freely while holding back greater than 95 of the sulfate and calcium What is the reference for such a specific point 95(text modified and reference provided) Seawater desalination costs for membrane-based systems generally vary between $050 and $100 per cubic meter of product Again what is the reference (reference for this added 11 references added in total)
Please consider standardizing terminology in the paper In particular given that both seawater and the formation brines are going to be saline I think that term probably should be used unless it is clear to the reader which is being discussed Produced saline formation waters from a deep geologic CO2 storage reservoir is a mouthful and will get tiresome if it is repeated but it is obvious that this is not seawater
Is seawater on word or is it two words sea water The paper uses both (ldquoseawaterrdquo nowspelled consistently)
Please make sure that your revised submission adheres to the format guidelines for this journal httpBLOCKEDwwwBLOCKEDelseviercomwpsfindjournaldescriptioncws_home709061authorinstructions Please use SI units in the paper In particular the paper bounces back at and forth between psi and Mpa which does nothing to improve the papers readability (all pressures now in MPa with psi conversion in parentheses)
Reviewer 1 Bourcier et al JGGC
Overall the paper is fine There are several specifics comments that may require minor revisions
Figure 2 has two vertical lines (text modified to explain which line is being referred to)
pg 7 - reinjection of produced water is usually for purposes of enhancing continued oil production (unclear what is being referred to in comment)
Figure 5c should be mentioned in the text (missing reference added)
Figure 5 contains mineral phases not discussed in the text (added text to explain significance of these minerals)
bulleted list section with 8500 to 300000 TDS should specify not possible with current technology to match later discussion of issue in text (no change made text suggests some hybrid methods may allow treatment of these fluids)
section 211 - text suggests that well head pressures of 1200 psi are upper limit in real system - what is the basis for this assertion (Changed text to state that this is the current maximum pressure for RO systems for which there are good cost data)
41
section 31 - authors calculate scale up of costs using expotential factors why not additive given the scale up is only a doubling of the basis (the cost data are based on costs data from real systems the scale-up cost savings are empirical)
Conlusions - first paragraph gives costs in cubic meters and water production in gallons without conversion use consistent units (made units consistent and added conversions)
Calculation of fresh water production associated with 1GW emissions should specify recovery factor used in calculation (we are using a recovery of 40 and units now made consistent ndashjust cubic meters of water)
Reviewer 2 Overall this is a well presented and well researched paper Management of brine in deep saline formations by producing and treating them can make some otherwise non-viable sites acceptable for geologic storage The concepts chemical principles and assumptions are clearly presented in the paper
Although this is an interesting and potentially useful analysis I have significant concerns whether the technology option presented here will be widely deployed The primary reason for concern is that almost all saline formation disposal projects that I am aware of have salinity well in excess of seawater For example Crenfield and Frio are more than 100000 mgL All of the midwestern storage projects in the Mt Simon Sandstone or other lower Paleozoic formations have salinities well in excess of 100000 and generally exceeding 250000 mgL The authors have chosen to use Wyoming brines as a primary example However it is likely that the primary deployment of CCS is likely to be in Gulf Coast and midwestern US or in similar deep high salinity settings Furthermore when the brine wells are added to the cost the total cost will be less attractive compared to seawater desalination Despite these limitations it seems that the authors have done a good job of outlining limitations and evaluating the technology for the seawater and similar salinity scenarios They also mention working on a subsequent paper that will evaluate the hydrogeologic aspects of the brine production It is hoped that in addition to the general design aspects this paper will address issues such as potential for preferential channeling of CO2 co-production of CO2 or other dissolved species with brine and other environmental or reservoir management challengesAgreed We are laying out the costs and limitations and are not making further judgements as to likelihood of deployment We used Wyoming brines as examples for the reasons this reviewer mentions
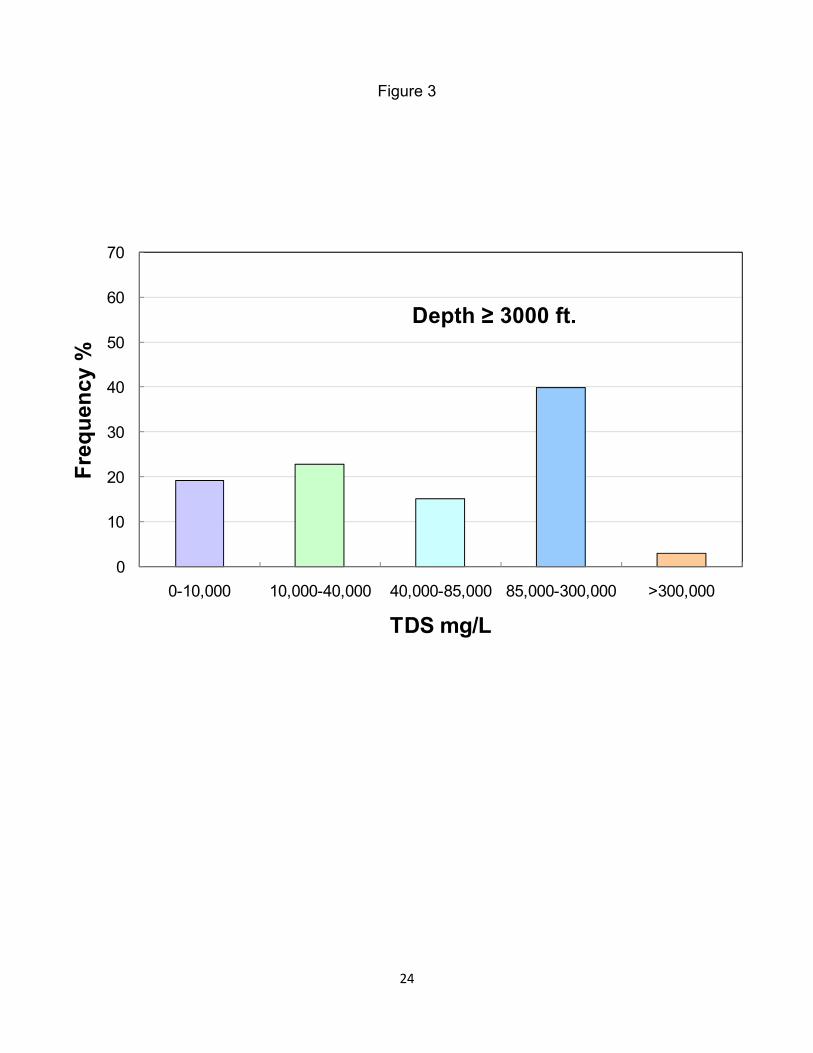
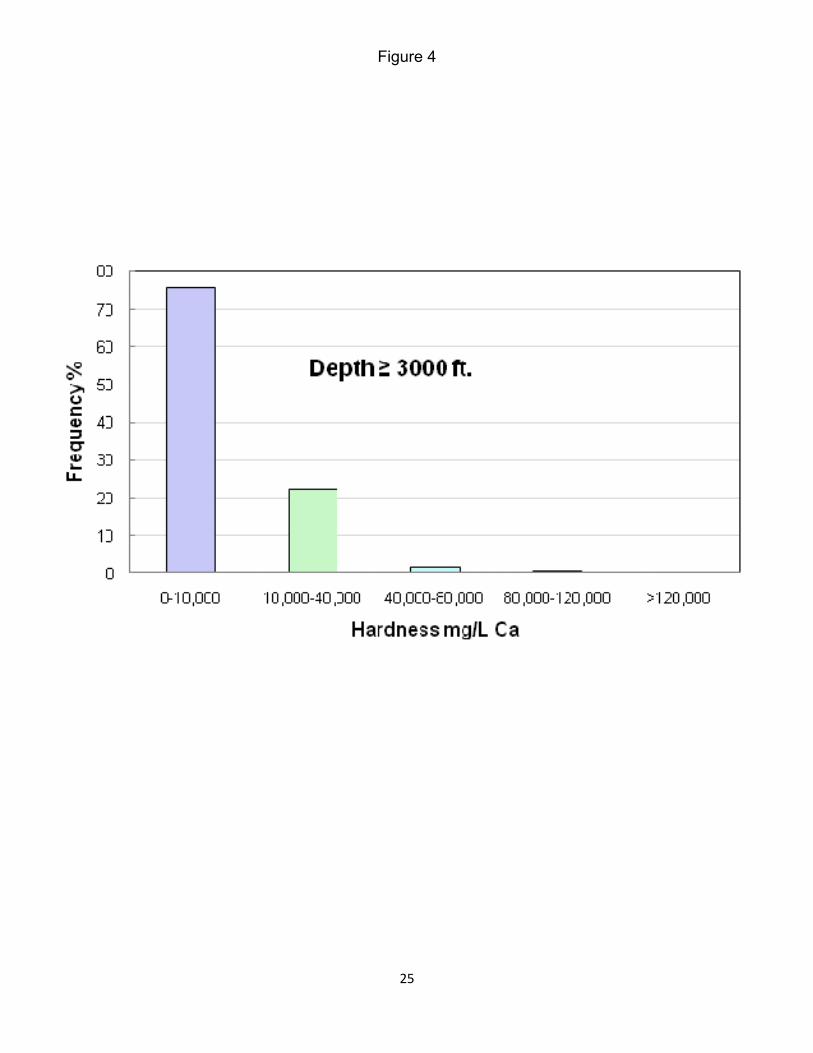
25
Figure 4
26
Figure 5
00
05
10
15
20
25
30
35
55 60 65 70 75 80 85
Wei
ght
gkg
H2O
H2O Removed
Calcite
Anhydrite
Halite
00
05
10
15
20
25
30
35
75 80 85 90 95
Wei
ght
gkg
H2O
H2O Removed
Calcite
Anhydrite
Glauberite
Halite
(b) Sublette County 3 brine
(a) seawater
27
00
05
10
15
20
25
30
35
55 65 75 85 95
Wei
ght
gkg
H2O
H2O Removed
Anhydrite
Glauberite
Nahcolite
Thenardite
(c) Sublette County 2 brine
28
Figure 6
0
400
800
1200
1600
2000
2400
0 20 40 60 80
Osm
otic
pre
ssur
e (π
) ps
i
H2O Removed
Dow
Pitzer
1200 psi limit
0
400
800
1200
1600
2000
2400
0 20 40 60
Osm
otic
pre
ssur
e (π
) ps
i
H2O Removed
Dow
Pitzer
1200 psi limit
(b) seawater
(b) Sublette County 3 brine
29
0
200
400
600
800
1000
1200
1400
1600
1800
2000
0 20 40 60 80 100
Osm
otic
pre
ssur
e (π
) ps
i
H2O Removed
Dow
Pitzer
1200 psi limit
(c) Sublette County 2 Brine
30
Figure 7
Pre-treatment
Physical filtrationpH adjustment
Remove organics
Saline aquifer fluidSea water
Desalination
Fresh water Brine dischargeConcentrate2X feed
Feed
Fresh water Concentrate12X Feed
Feed
RO
RO
Pressure(PSI)1200
1200
1190
1200+
Pressure(PSI)15
1200
1180
15+
ChillerCoolingAnti-scalantsDisinfectant
Pressurization
Energy recoveryDepress
urization
Ocean Saline aquifer
Repressurization
Serial Elements
Parallel Elements
31
Figure 8
$-
$100
$200
$300
$400
$500
$600
$700
$800
$900
$1000
10 15 20 25 30 35 40 45 50
LCO
W -
$A
C-FT
System RO Recovery
Levelized Cost of Water vs Recovery
2 MGD - LEVELIZED COSTAC-FT 25 yrs4 MGD - LEVELIZED COSTAC-FT 25 yrs6 MGD - LEVELIZED COSTAC-FT 25 yrs
32
Figure 9
$500
$700
$900
$1100
$1300
$1500
$1700
10 15 20 25 30 35 40 45 50
System RO Recovery
LCOW
- $A
C-FT
2 MGD - Pump to Pressure 2 MGD - Reservoir Pressure
33
Table 1 Conventional seawater vs saline formation water reverse osmosis treatment systems
RO System Major Component Items Conventional SW Systems Reservoir Treatment System
EQUIPMENT
High pressure feed pipingOnly necessary after the high pressure
pumpStarting from the well head
High pressure reject pipingOnly to back pressure control valve ie
skid boundaryReturn line to the deep well injection
pointIntake feed structure Open intake structure or sea wells Reservoir wellsPretreatment system Multi-media filter or micro-filter Activated carbon filterFeed pumping system Needed from feed source to RO skid Not needed - Use well head pressurePretreatment system Cartridge filters Cartridge filtersHeat exchanger None Yes Reduce feed temperature to 50degC
Chemical Injection system ndash bio controlYes ndash for bio control followed by
reducing agentNot needed
Chemical Injection system ndash scale control
Yes ndash scale inhibitor for calcium carbonate
Yes ndash scale inhibitor for calcium carbonate andor calcium sulfate
High pressure pump Yes (most costly item of RO skid) No - Use well head pressure
Energy recovery device Yes ndash typically used for larger systemsNo ndash keep reject at maximum pressure
for reinjectionRO pressure vessels (PV) Same for equal permeate capacity Same for equal permeate capacityRO membranes Conventional seawater membranes Conventional seawater membranes
Array ndash configurationSingle pass
7 elements per PVSingle pass
7 elements per PV
Percent recoveryRanges between 30 to 50 depending on seawater concentration system size
and energy costs
Ranges between 15 to 45 depending on reservoir feed concentration and
compositionSystem IampC Similar to reservoir system Similar to seawater system
MCCVFDIncludes electrical supply for high HP
pump(s)
Same as conventional SW system with exception of the high HP pump(s) ie
no VFD needed
Valves controls amp Instrumentation Similar to reservoir systemSimilar to seawater system except high pressure pump associated valving and
controlsTanking Similar to reservoir system Similar to seawater systemDeep well injection Reject typically goes to seawater outfall Deep well injection requiredCivil works Very site dependent Very site dependent
OPERATIONS
OperatingSimilar to reservoir system except no
deep well injection
Similar to seawater system except no high pressure pump(s) and energy
recovery but use of deep well injection for reject concentrate
Energy consumptionEnergy to deliver feed to high pressure
pumps and then raise to ~ 1000 psi
Similar to seawater system without the feed and process pumping Deep well injection pumping energy required
Chemicals consumption including membrane cleaning
Similar to reservoir system Similar to seawater system
Maintenance as of capital Similar to reservoir system Similar to seawater system
34
Table 2 Major Costs and Cost Factors for RO Treatment Systems
Assumed Discount Rate 700Plant Lifetime Evaluation Period 2500 yearsOperating Cost escalation yr 000
Base Operating Pressure at reference conditions 1200 psiBase recovery 40Cleaning timesyear 05Chemicals $3ConsumablesActivated Carbon $ 30 $ft^3Filter cartridges $ 4 $eachPower Repressurization $007 $kWhPower Misc uses 20000 kWhdayLaborFringe amp Overhead Multiplier 200 factorSupervisor $ 150000 SalaryOperators $ 60000 SalaryTechnicians $ 75000 Salary
Mechanical Maintenance of Capital 3Length of high pressure piping 125 ft
35
Table 3 Itemization of costs for water desalination plants of 2 and 8 MGD permeate at 40 water recovery
Base FEED Flow MGD 500 Product Flow MGD 20 20 20 20 20 20Base PRODUCT Flow MGD 200 Recovery percent 450 400 350 300 250 150Base Recovery 40 AC-FTYR 2240 2240 2240 2240 2240 2240
TOTAL DIRECT OPERATING COSTS $YR 123369829$ 120648345$ 118969371$ 118731532$ 118346855$ 125187892$ $AC-FT 55077$ 53862$ 53112$ 53006$ 52835$ 55889$
INSTALLED CAPITAL COST $GPD 347$ 349$ 356$ 371$ 398$ 493$ TOTAL DIRECT CAPITAL 3844576$ 3912316$ 4027492$ 4234852$ 4588768$ 5823751$ INSTALLED CAPITAL COST 6934334$ 6987133$ 7120062$ 7414175$ 7962181$ 9869483$
NPV of OampM 14149698$ 13837562$ 13644994$ 13617716$ 13573596$ 14358217$ NPV of OampM + Capital Cost 21084032$ 20824694$ 20765056$ 21031891$ 21535777$ 24227701$ NPV of AC-FTyr NPV AC-FTPeriod 25691 25691 25691 25691 25691 25691
2 MGD - LEVELIZED COSTAC-FT 25 yrs 821$ 811$ 808$ 819$ 838$ 943$
Base FEED Flow MGD 2000 Product Flow MGD 80 80 80 80 80 80Base PRODUCT Flow MGD 800 Recovery percent 460 400 350 300 250 150Base Recovery 40 AC-FTYR 8960 8960 8960 8960 8960 8960
TOTAL DIRECT OPERATING COSTS $YR 225984618$ 214298472$ 207398788$ 206191914$ 204172161$ 229163595$ $AC-FT 25222$ 23918$ 23148$ 23013$ 22788$ 25577$
INSTALLED CAPITAL COST $GPD 257$ 259$ 262$ 272$ 292$ 367$ TOTAL DIRECT CAPITAL 10609856$ 10796811$ 10996812$ 11530415$ 12499362$ 16138799$ INSTALLED CAPITAL COST 20594678$ 20756123$ 20947918$ 21757741$ 23349555$ 29354228$
NPV of OampM 25918931$ 24578608$ 23787260$ 23648839$ 23417187$ 26283538$ NPV of OampM + Capital Cost 46513609$ 45334730$ 44735177$ 45406581$ 46766742$ 55637766$ NPV of AC-FTyr NPV AC-FTPeriod 102763 102763 102763 102763 102763 102763
8 MGD - LEVELIZED COSTAC-FT 25 yrs 453$ 441$ 435$ 442$ 455$ 541$
36
Summary of reply to JGGC-D-00120 editor comments (attached PDF file)
Page 3
Qualifiers added throughout the manuscript to statements regarding potential existence of subsurface pressure due to CO2 injection
More details of excluded costs provided
Page 4
Offending statements regarding pressure in well field removed
Page 5
Reference to companion paper removed
References added
Page 6
Pore size range given along with reference
Page 7
Added cost reference
Added sentence to note lack of organisms in typical formation fluids
Noted reference to left vertical dotted line
Comment to editor These high pressure membranes are being developed by membrane manufacturers but this sort of information is not in the refereed journals because of its business sensitivity I hear this by word-of-mouth Not sure how to handle this What do you recommend
Page 8
Added USGS database size and coverage
Added references as specified
Page 10
Added comment on treatability of brines gt 85000 TDS
Added references
Page 11
37
Added reference
Modified temperature assertion for basinal brines
Page 13
Added clarification of what is being considered in cost estimate
Page 14
Caveats associated with assumed subsurface pressure have been inserted Paragraph re-worded based on reviewer comments
Page 15
Changes made Last sentence modified to exclude sites where subsurface pressure increase is not an issue
Page 19
Changes made added titles to figures and omitted reference to Big Sky CSP
Page 20
No simple way to modify figure ndash added details in text to clarify
X-axis adjusted to match in Figures 8 and 9 Y-axis was not changed as compressing it to match Figure 9 made Figure 8 harder to interpret
Summary of reply to JGGC-D-00120 editor comments (embodied e-mail)
Jim DooleySenior Staff ScientistJoint Global Change Research InstitutePacific Northwest National LaboratoryAssociate Editor for Integrated Systems and Economics International Journal of Greenhouse Gas Control
-----Original Message-----From eesjggc0c97e7d697ae1feesmailelseviercom[mailtoeesjggc0c97e7d697ae1feesmailelseviercom] On Behalf Of Int Jnl of Greenhouse Gas ControlSent Tuesday October 19 2010 1204 PMTo bourcier1llnlgov wbourciergmailcomCc Dooley James J (Jim)
38
Subject Your Submission to International Journal of Greenhouse Gas Control
Ms Ref No JGGC-D-10-00120Title Desalination of Formation Waters as a Strategy for Reducing Risk in Geological Sequestration of Carbon Dioxide International Journal of Greenhouse Gas Control
Dear Dr William L Bourcier
The reviewers have commented on your above paper They indicated that it is not acceptable for publication in its present form and major revisions will need to be implemented Once these major revisions have been completed to the Editors satisfaction we will consider publishing your paper
For your reference the comments from the editor and reviewers are listed below for your consideration and action
Thank you for submitting your work to International Journal of Greenhouse Gas Control
When you are submitting a revised manuscript please also
a) outline each change made (point by point) as raised in the reviewer comments ANDOR
b) provide a suitable rebuttal to each reviewer comment not addressed
To submit your revision please do the following
1 Go to httpBLOCKEDeeselseviercomjggc
2 Enter your login details
3 Click [Author Login]This takes you to the Author Main Menu
4 Click [Submissions Needing Revision]I look forward to receiving your revised manuscript
Yours sincerely
James J DooleyAssociate EditorInternational Journal of Greenhouse Gas Control
Comments from the editors and reviewers
Editor comments for JGGC-D-10-00120 (jjdooleypnlgov)
39
This is a good and very useful paper If you can address the concerns raised by myself and the peer reviewers I am confident that we should be able to get this paper into press in short order
Please consider revising the title of the paper to better match the contents of the paper To my mind A Preliminary Cost and Engineering Estimate for Desalinating Produced Formation Waters Associated with Carbon Dioxide Capture and Storage (agreed ndash title changed) is closer to the mark The current submission does not develop a technical argument for how desalinzation of formation waters reduces risk The paper asserts that point but it is not shown here What is shown here is a preliminary cost and engineering estimate I think this sentence from Section 1 of your paper places things in their proper perspective An additional benefit is that strategic withdrawal and reinjection of brines may allow manipulation of the location and migration of the CO2 pool in the subsurface That is the process you are looking at here provides and additional benefit (ie it is not the primary focus of what is presented in the paper) and it allows the subsurface plume to be manipulated as a part of good reservoir engineering to assure that CO2 injected into the subsurface stays there This phrasing of additional benefit and manipulation seems more consistent with the thrust of this paper and the broad body of technical literature than many of the statements in Section 1 (and elsewhewre) which seem to indicate that unless CCS+desal is done for all DSFs a whole host of very bad things are likely (almost surely) going to happen (agreed ndash text modified to make it clear that if we assume reservoir pressure existsit is an assumption Our goal is to evaluate how much benefit there is in using it if present to power desalination)
I do not believe this paper demonstrates that there would be significant pressure in the formation to deliver to the surface this pressuized feedstream for the desal unit This is asserted many times It is not shown here I therefore think you need to state assumed cost savings assumed pressure head I dont see how you can develop that point robustly in this paper as that is a whole body of work that would need to be written up in another paper showing the distance between the CO2 injector well(s) the brine production well(s) and brine reinjection well(s) and how those change over the life of the CO2 storage field This is a significant concern of mine This paper needs to stand by itself (agreed ndash text modified in several places to alleviate this concern)
Another concern I have with the paper and in particular Section 1 (but elsewhere) is that the ideal formation for CO2 storage + desal of produced water would appear from the text to be a formation that has a structural trap with a fourway closure Yet there is nothing in the technical literature that would lead one to assert that is the best or only type of DSF that could be used for CO2 storage What I really would like to avoid in your article (as the article is strong enough that it doesnt need to go down this path at all) is a simplistic Economides and Eligh-Economides caricature of CO2 storage can only happen in a sealed vessel and if you do it in a sealed vessel then you cant put any CO2 in the formation as it is already full and therefore CO2 storage is impossible I know that is not what you are saying I would like you to be more clear that you are not saying that One (but only one) simple thing I think you could do is mention specifically that Gorgon is going to produce water to manage the plume but that Sleipner Insalah Snovit do not need to employ this strategy for risk reduction and no one is asserting that those fields are a ticking time bomb that must surely leak someday soon (agreed ndash sections that infer this have been qualified or removed in particular section 11 has been edited)
There are many many many missing references in the paper I have noted them in the marked up PDF In short unless you are sure that everyone in the relevant technical community
40
understands a point if you are citing a specific value I think there needs to be a reference For example a nanofiltration membrane will allow Na and Cl to pass through the membrane freely while holding back greater than 95 of the sulfate and calcium What is the reference for such a specific point 95(text modified and reference provided) Seawater desalination costs for membrane-based systems generally vary between $050 and $100 per cubic meter of product Again what is the reference (reference for this added 11 references added in total)
Please consider standardizing terminology in the paper In particular given that both seawater and the formation brines are going to be saline I think that term probably should be used unless it is clear to the reader which is being discussed Produced saline formation waters from a deep geologic CO2 storage reservoir is a mouthful and will get tiresome if it is repeated but it is obvious that this is not seawater
Is seawater on word or is it two words sea water The paper uses both (ldquoseawaterrdquo nowspelled consistently)
Please make sure that your revised submission adheres to the format guidelines for this journal httpBLOCKEDwwwBLOCKEDelseviercomwpsfindjournaldescriptioncws_home709061authorinstructions Please use SI units in the paper In particular the paper bounces back at and forth between psi and Mpa which does nothing to improve the papers readability (all pressures now in MPa with psi conversion in parentheses)
Reviewer 1 Bourcier et al JGGC
Overall the paper is fine There are several specifics comments that may require minor revisions
Figure 2 has two vertical lines (text modified to explain which line is being referred to)
pg 7 - reinjection of produced water is usually for purposes of enhancing continued oil production (unclear what is being referred to in comment)
Figure 5c should be mentioned in the text (missing reference added)
Figure 5 contains mineral phases not discussed in the text (added text to explain significance of these minerals)
bulleted list section with 8500 to 300000 TDS should specify not possible with current technology to match later discussion of issue in text (no change made text suggests some hybrid methods may allow treatment of these fluids)
section 211 - text suggests that well head pressures of 1200 psi are upper limit in real system - what is the basis for this assertion (Changed text to state that this is the current maximum pressure for RO systems for which there are good cost data)
41
section 31 - authors calculate scale up of costs using expotential factors why not additive given the scale up is only a doubling of the basis (the cost data are based on costs data from real systems the scale-up cost savings are empirical)
Conlusions - first paragraph gives costs in cubic meters and water production in gallons without conversion use consistent units (made units consistent and added conversions)
Calculation of fresh water production associated with 1GW emissions should specify recovery factor used in calculation (we are using a recovery of 40 and units now made consistent ndashjust cubic meters of water)
Reviewer 2 Overall this is a well presented and well researched paper Management of brine in deep saline formations by producing and treating them can make some otherwise non-viable sites acceptable for geologic storage The concepts chemical principles and assumptions are clearly presented in the paper
Although this is an interesting and potentially useful analysis I have significant concerns whether the technology option presented here will be widely deployed The primary reason for concern is that almost all saline formation disposal projects that I am aware of have salinity well in excess of seawater For example Crenfield and Frio are more than 100000 mgL All of the midwestern storage projects in the Mt Simon Sandstone or other lower Paleozoic formations have salinities well in excess of 100000 and generally exceeding 250000 mgL The authors have chosen to use Wyoming brines as a primary example However it is likely that the primary deployment of CCS is likely to be in Gulf Coast and midwestern US or in similar deep high salinity settings Furthermore when the brine wells are added to the cost the total cost will be less attractive compared to seawater desalination Despite these limitations it seems that the authors have done a good job of outlining limitations and evaluating the technology for the seawater and similar salinity scenarios They also mention working on a subsequent paper that will evaluate the hydrogeologic aspects of the brine production It is hoped that in addition to the general design aspects this paper will address issues such as potential for preferential channeling of CO2 co-production of CO2 or other dissolved species with brine and other environmental or reservoir management challengesAgreed We are laying out the costs and limitations and are not making further judgements as to likelihood of deployment We used Wyoming brines as examples for the reasons this reviewer mentions
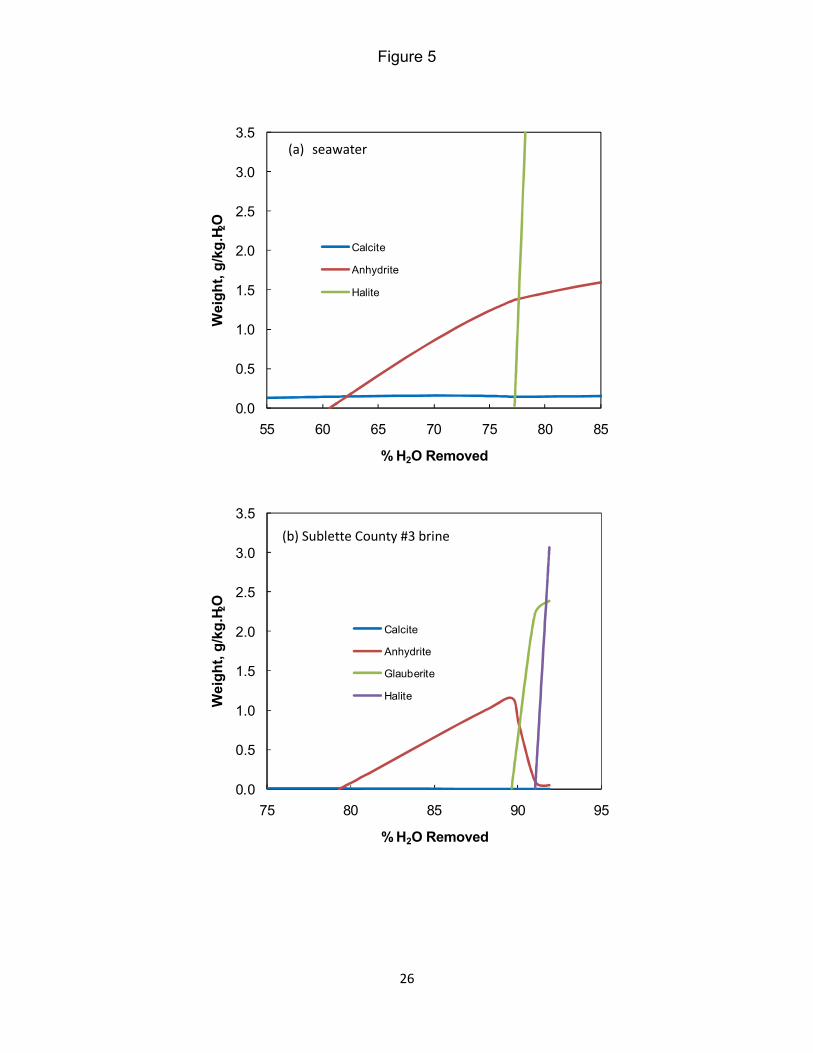
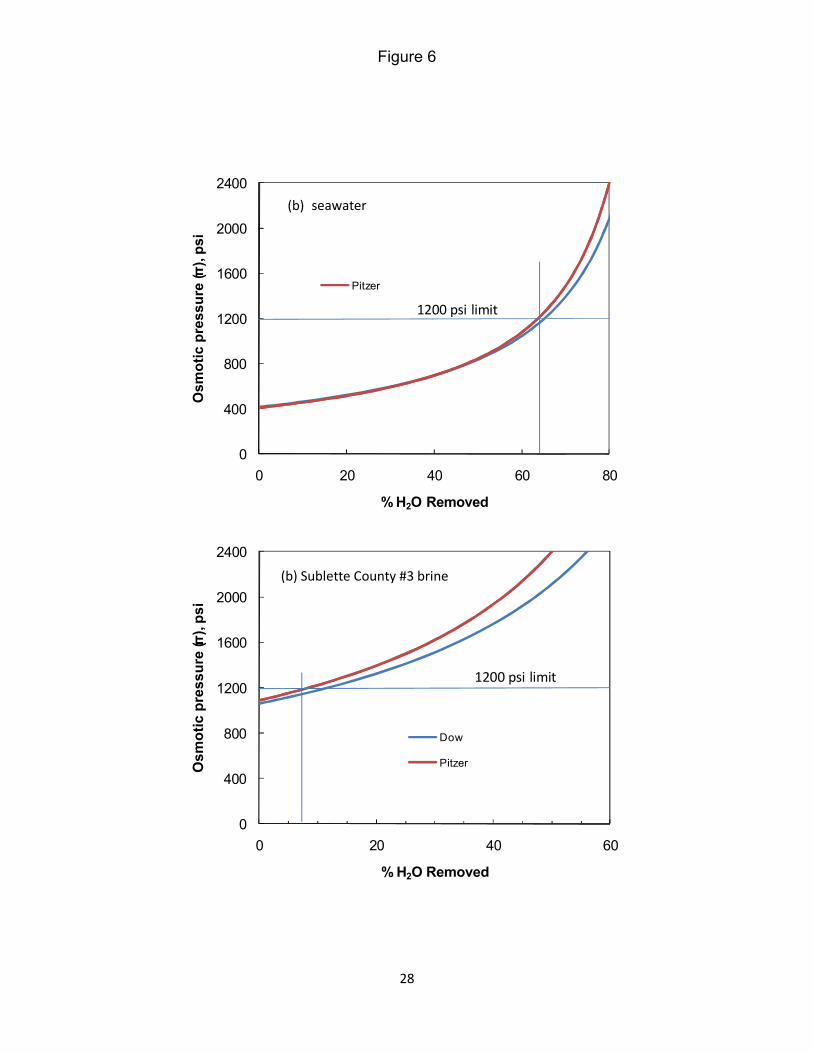
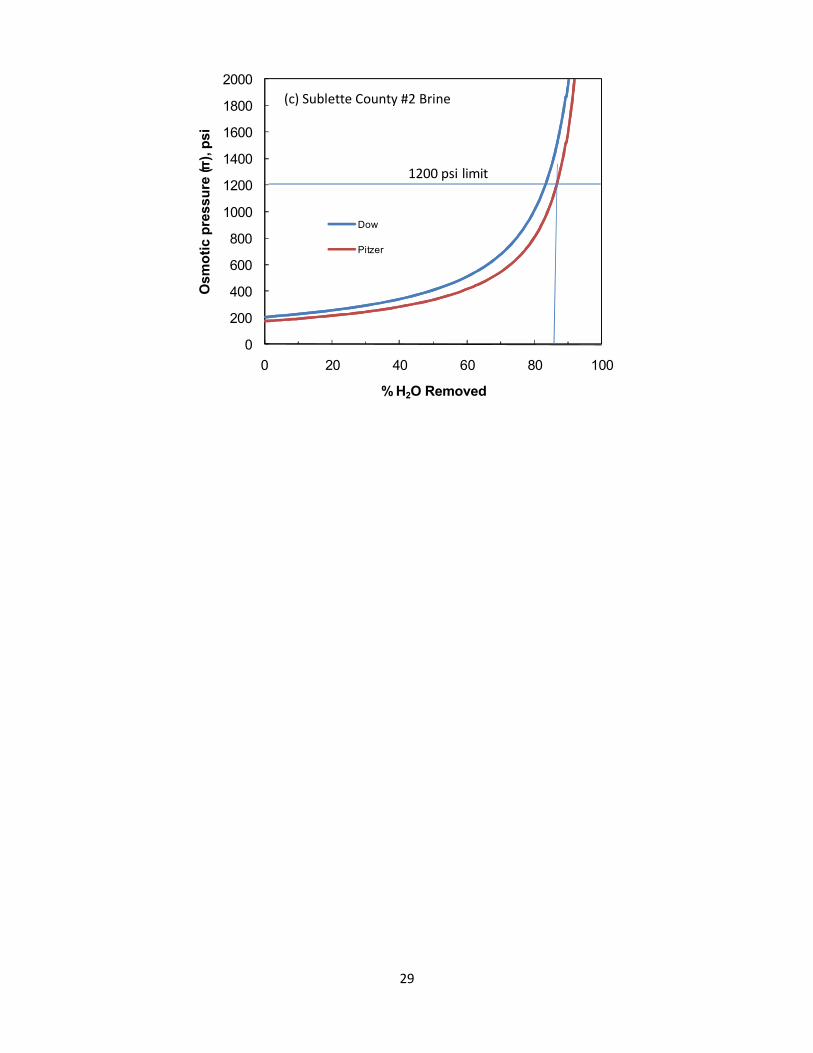
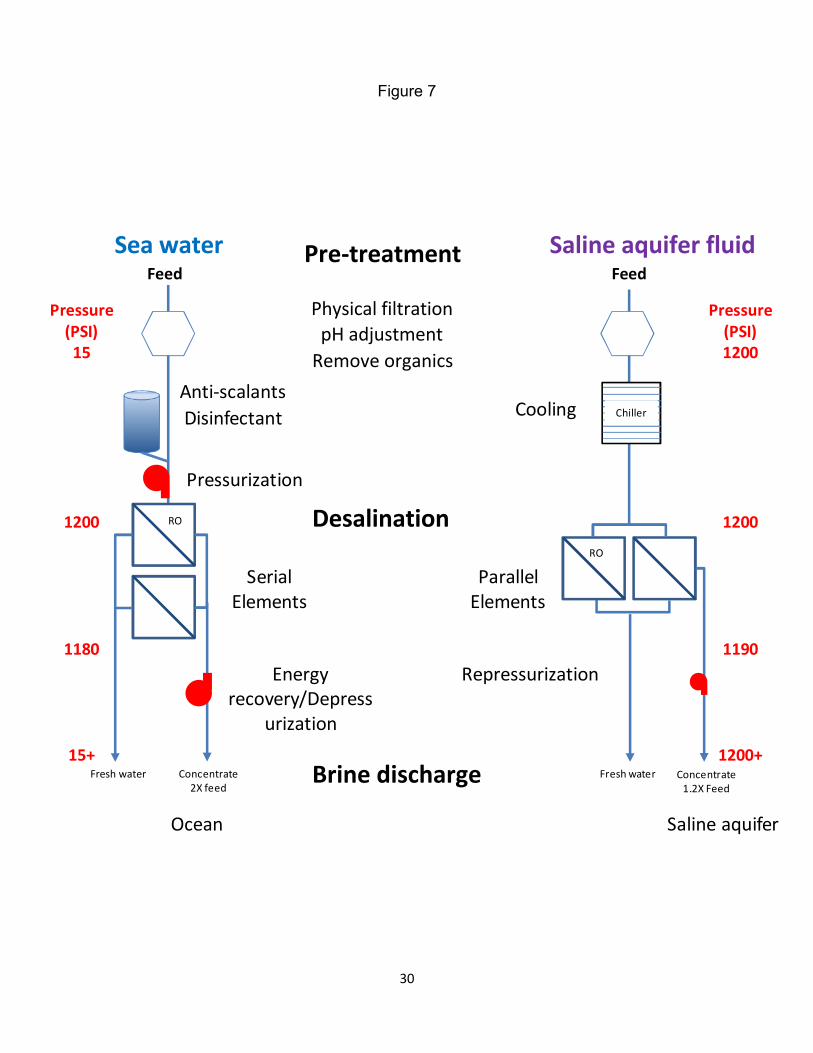
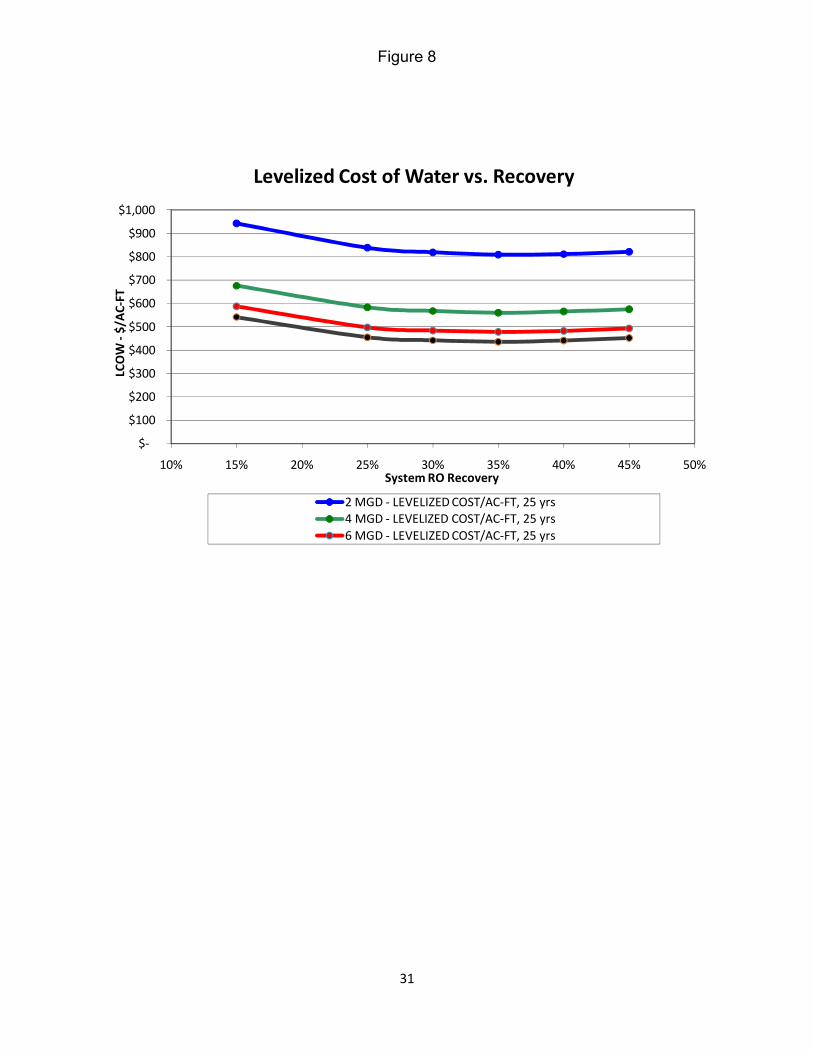
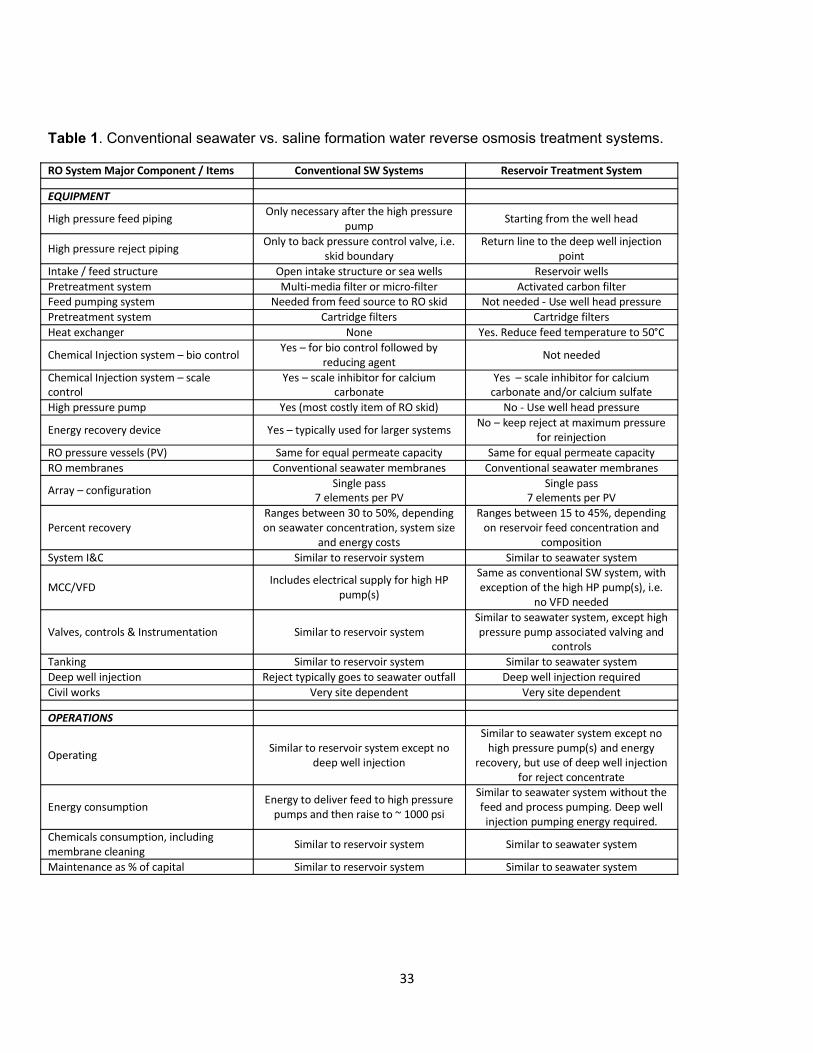
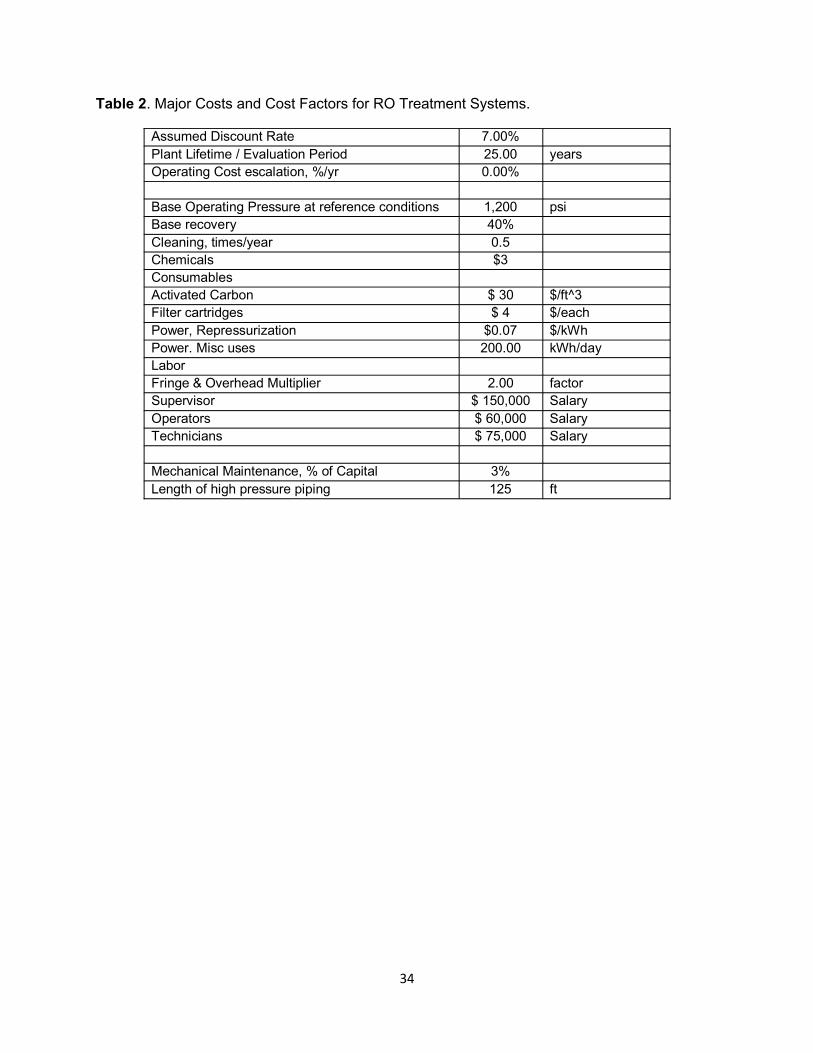
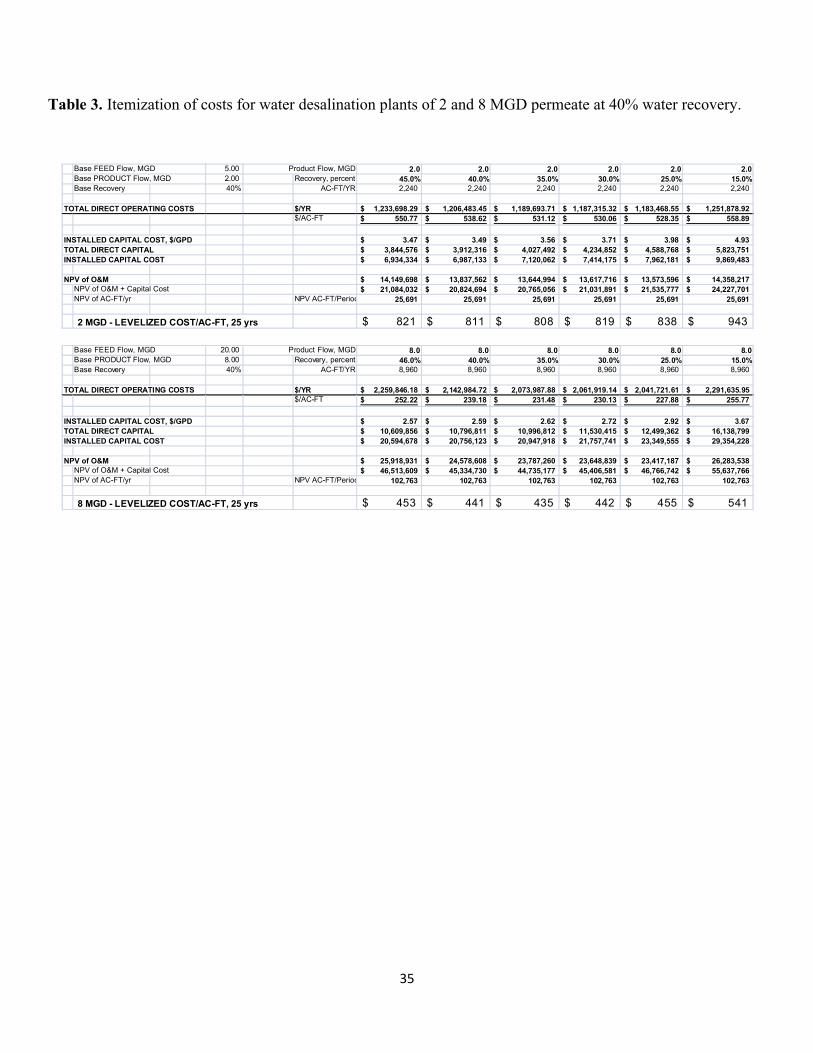