Embed Size (px)
Citation preview

The More Alaska Production Act in 15 minutes A presentation to Southeast Conference
March 13, 2014
Department of Revenue
Michael Pawlowski Deputy Commissioner

2
Revenues from oil production provide
~90% of unrestricted state revenues
and half of Alaska jobs.
Sources: 1. UGF Revenues : Fall 2013 Revenue Sources Book pages 94-95 (December 4, 2013)
2. Jobs: Institute of Social and Economic Research, Alaska’s Economy: The Challenge Ahead (September 24, 2013)

What were the main reforms? Oil taxes were reformed
because of:
1. Declining production.
2. Comparatively low
investment.
3. Declining opportunities
for Alaskans.
Key reforms:
1. Replaced variable tax
rates with fixed rate.
2. Changed from credit
based on spending to
one based on production.
3. Added incentives for new
oil production.
3

Replaced variable tax with fixed rate?
ACES
Tax Rate = 25% + Progressive Rate
Progressive Rate:
1. West Coast Price – Transportation
Costs = Gross Value at the Point of
Production (GVPP).
2. GVPP – Lease Expenditures =
Production Tax Value (PTV).
3. If PTV/bbl is less than $92.50, rate is
25% PLUS PTV/bbl – 30 x .004%.
4. Above $92.50, rate is 50% PLUS
PTV/bbl – 92.50 x .001%.
Maximum Rate: 75% (25% +50%)
MAP Act (SB 21)
Tax Rate = 35%
4

ACES Had Tax Rates That Changed Monthly
5
Source: Alaska Department of Revenue, Economic Research Group
52%
48%
44%
34%
26% 25% 25% 25% 25% 25% 27%
30%
0%
10%
20%
30%
40%
50%
60%
Jun-08 Jul-08 Sep-08 Oct-08 Dec-08 Feb-09 Mar-09 May-09 Jul-09
Monthly Tax Rates under ACES for Fiscal Year 2009

Changed from credit based on spending to one based on production.
ACES
Qualified Capital
Expenditure Credit:
20% of capital spending.
Credit can reduce tax below minimum
tax.
MAP Act (SB 21)
Dollars Per Taxable Barrel:
Gross Value < $80 = $8
Gross Value < $90 = $7
Gross Value < $100 = $6
Gross Value < $110 = $5
Gross Value < $120 = $4
Gross Value < $130 = $3
Gross Value < $140 = $2
Gross Value < $150 = $1
Gross Value > $150 = $0
Credit cannot reduce tax due below
minimum tax of 4% of gross value.
6
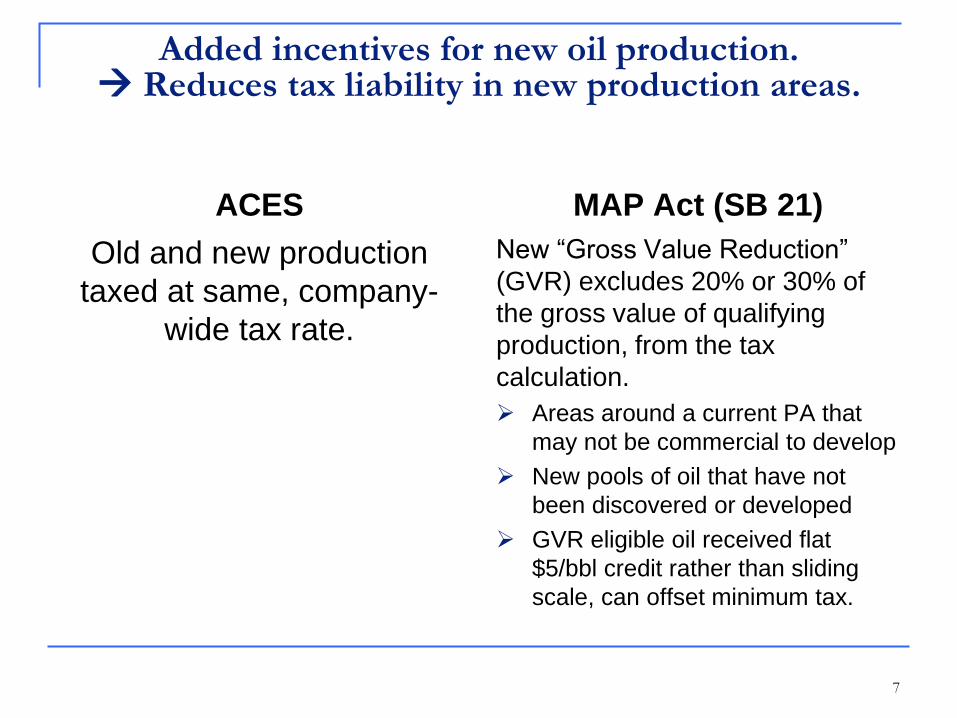
Added incentives for new oil production. Reduces tax liability in new production areas.
7
Old and new production
taxed at same, company-
wide tax rate.
ACES
New “Gross Value Reduction”
(GVR) excludes 20% or 30% of
the gross value of qualifying
production, from the tax
calculation.
Areas around a current PA that
may not be commercial to develop
New pools of oil that have not
been discovered or developed
GVR eligible oil received flat
$5/bbl credit rather than sliding
scale, can offset minimum tax.
MAP Act (SB 21)

What did the More Alaska Production Act (SB 21) do?
Took a tax system with variable tax rates and
credits for capital spending and simplified it
with a flat tax rate of 35% and credits for
production.
Provided extra incentives for production from
new units and undeveloped participating
areas in existing units.
Did not change royalties, property tax or
corporate income taxes on oil production.
8

Now What? What is happening with
State revenues?
What is happening with
North Slope production?
9

Revenue Has Been Declining Since 2011
10
Fiscal Year 2012 July 1, 2011—June 30, 2012
Fiscal Year 2013 July 1, 2012—June 30, 2013
Fiscal Year 2014 July 1, 2013—June 30, 2014
Unrestricted Revenues
$9.485 billion Unrestricted Revenues
$6.929 billion Unrestricted Revenues
$4.930 billion
GF Unrestricted Revenues fell ~$2.5 billion between FY 12 and FY 13
SB 21 took effect Jan. 1, 2014
*Note: Fiscal Year 2014 is forecast, prior fiscal years are actuals.
Sources: Alaska Department of Revenue Fall 2012, Spring 2013 and Fall 2013 Revenue Sources Books
11
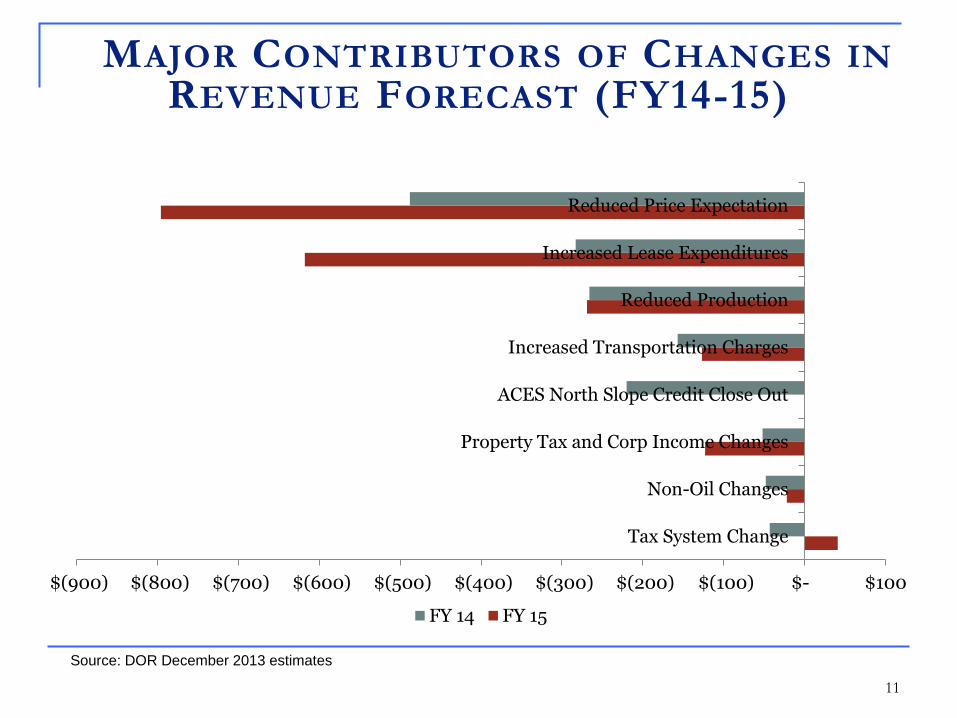
$(900) $(800) $(700) $(600) $(500) $(400) $(300) $(200) $(100) $- $100
Tax System Change
Non-Oil Changes
Property Tax and Corp Income Changes
ACES North Slope Credit Close Out
Increased Transportation Charges
Reduced Production
Increased Lease Expenditures
Reduced Price Expectation
FY 14 FY 15
MAJOR CONTRIBUTORS OF CHANGES IN REVENUE FORECAST (FY14-15)
Source: DOR December 2013 estimates

2014 2015 2016 2017 2018 2019 2020 2021 2022 2023
Fall 2013 $3,929 $4,894 $4,617 $3,747 $3,294 $3,666 $3,664 $3,521 $3,370 $3,019
Spring 2013 $3,862 $4,069 $3,632 $2,870 $2,841 $2,416 $2,281 $2,184 $2,083 $1,992
0
1,000
2,000
3,000
4,000
5,000
6,000
Mill
ion
s o
f D
olla
rs
Total North Slope CAPEX
12
CHANGE IN NORTH SLOPE LEASE EXPENDITURE FORECAST
F A L L 2 0 1 3 T O S P R I N G 2 0 1 3
Source: Department of Revenue - Revenue Sources Book Fall 2013 / 2012
Total Increase: $9,492
Change $67 $826 $985 $877 $453 $1,250 $1,383 $1,337 $1,287 $1,027
Note: These estimates include lease expenditures by companies that are not expected to have a tax liability.
13
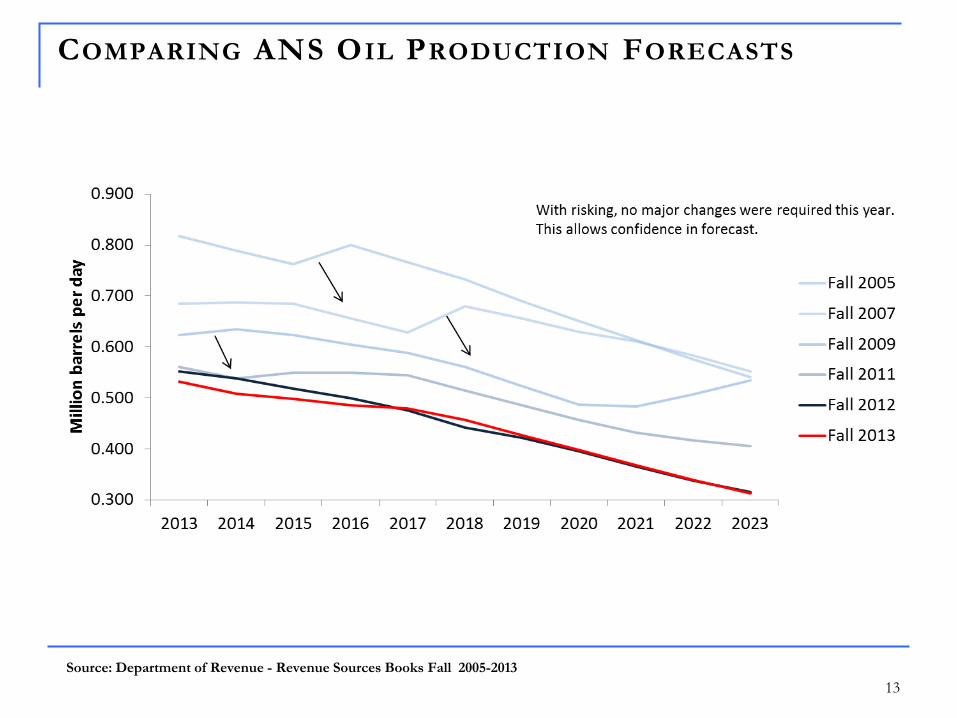
COMPARING ANS OIL PRODUCTION FORECASTS
Source: Department of Revenue - Revenue Sources Books Fall 2005-2013

NORTH SLOPE PRODUCTION FORECAST F ALL 2013
14

THANK YOU
Please find our contact information below:
Michael Pawlowski Deputy Commissioner Department of Revenue [email protected]
Resources
http://dor.alaska.gov/MAPActDocuments.aspx

Supplemental Slides
16
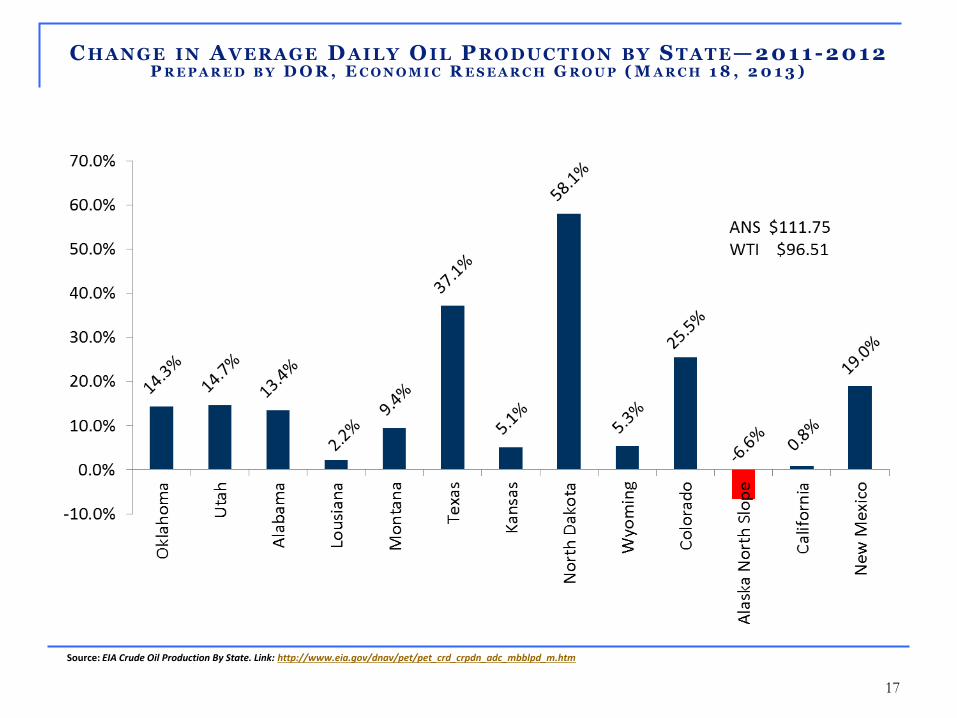
C HANGE IN A VERAGE D AILY O IL P RODUCTION BY S TATE—2011-2012 P R E P A R E D B Y D O R , E C O N O M I C R E S E A R C H G R O U P ( M A R C H 1 8 , 2 0 1 3 )
17
Source: EIA Crude Oil Production By State. Link: http://www.eia.gov/dnav/pet/pet_crd_crpdn_adc_mbblpd_m.htm

EST. CAPITAL SPENDING FOR EXPLORATION & DEVELOPMENT:
A K N ORTH S LOPE VS. U . S. & W ORLD S PENDING* , 2003 -2012
18
Prepared for Department of Revenue by EconOne: North Slope based on tax return information; U.S. based on top 50 public companies;
worldwide based on top 75 public companies

Wait, SB 21 raises more revenue than ACES? • Both the More Alaska
Production Act (SB 21) and
ACES are net tax systems
that allow companies to
deduct their spending in
Alaska.
• Both levy the tax against
the production tax value,
which for the majority of oil
is calculated the same way.
• “New” oil gets an additional
reduction to its production
tax value which accounts
for the difference in
Production Tax Value.
19 Calculations based on FY 15 income statement found on page 106 of the Fall 2013 Revenue Sourcebook. It is illustrative and represents an approximation of the
production tax calculation and does not match production tax estimates throughout the Revenue Source Book.
ACES MAP Act
ANS Price $105.06 $105.06
Transportation -$10.03 -$10.03
Lease
Expenditures -$45.99 -$45.99
Production Tax
Value (PTV/bbl) $49.04 $49.04
Production Tax
Value (total) $7.778 billion $7.715 billion*
*Difference in PTV due to “New” Oil benefit (GVR) in SB 21 (~$63 million in FY 15).

Wait, SB 21 raises more revenue than ACES? • A key difference
between the two is:
• Under ACES, the tax
rate depends on (1)
price (2) production (3)
lease expenditures (4)
cost of transportation,
i.e. the tariff.
• At these prices, the
ACES tax rate = 25% +
[(PTV-30) x .004]
• Under the MAP Act, the
tax rate is 35%.
20 Calculations based on FY 15 income statement found on page 106 of the Fall 2013 Revenue Sourcebook. It is illustrative and represents an approximation of the
production tax calculation and does not match production tax estimates throughout the Revenue Source Book.
ACES MAP Act
Production Tax
Value (PTV) $49.04 $49.04
Progressive Tax 7.6% N/A
Base Tax 25% 35%
Tax Rate 32.6% 35%

Wait, SB 21 raises more revenue than ACES?
21
1. ACES credits based on qualified capital spending of $4.45 billion in deductible capital expenditures in FY 15.
Calculations based on FY 15 income statement found on page 106 of the Fall 2013 Revenue Sourcebook. It is illustrative and represents an approximation of the
production tax calculation and does not match production tax estimates throughout the Revenue Source Book.
ACES MAP Act
Production Tax Value (PTV)
Billions of dollars $7.778 $7.715
Tax Rate 32.6% 35%
Tax Before Credits Billions of dollars $2.535 $2.700
Deductible Credits1 -$890 -$960
Tax Revenue Billions of dollars $1.625 $1.740