Embed Size (px)
Citation preview
A PRIMER FOR EVALUATING UNDERAGE DRINKING AND DRIVING PROGRAMS
NATIONAL HIGHWAY TRAFFIC SAFETY ADMINISTRATION
2021
2 National Highway Trafc Safety Administration
Disclaimer
This publication is distributed by the U.S. Department of Transportation, National Highway Trafc Safety Administration, in the interest of information exchange. The opinions, fndings, and conclusions expressed in this publication are those of the authors and not necessarily those of the Department of Transportation or the National Highway Trafc Safety Administration. The United States Government assumes no liability for its contents or use thereof. If trade names, manufacturers’ names, or specifc products are mentioned, it is because they are considered essential to the object of the publication and should not be construed as an endorsement. The United States Government does not endorse products or manufacturers.
The contents of this document do not have the force and efect of law and are not meant to bind the public in any way. This document is intended only to provide clarity to the public regarding existing requirements under the law or agency policies.
Suggested APA Format Citation:
Ankem, G., Smith, R., Klauer, C., Henclewood, D., & Johnson, K. (2021, June). A primer
for evaluating underage drinking and driving programs (Report No. DOT HS
812 953). National Highway Trafc Safety Administration.
A Primer for Evaluating Underage Drinking and Driving Programs i
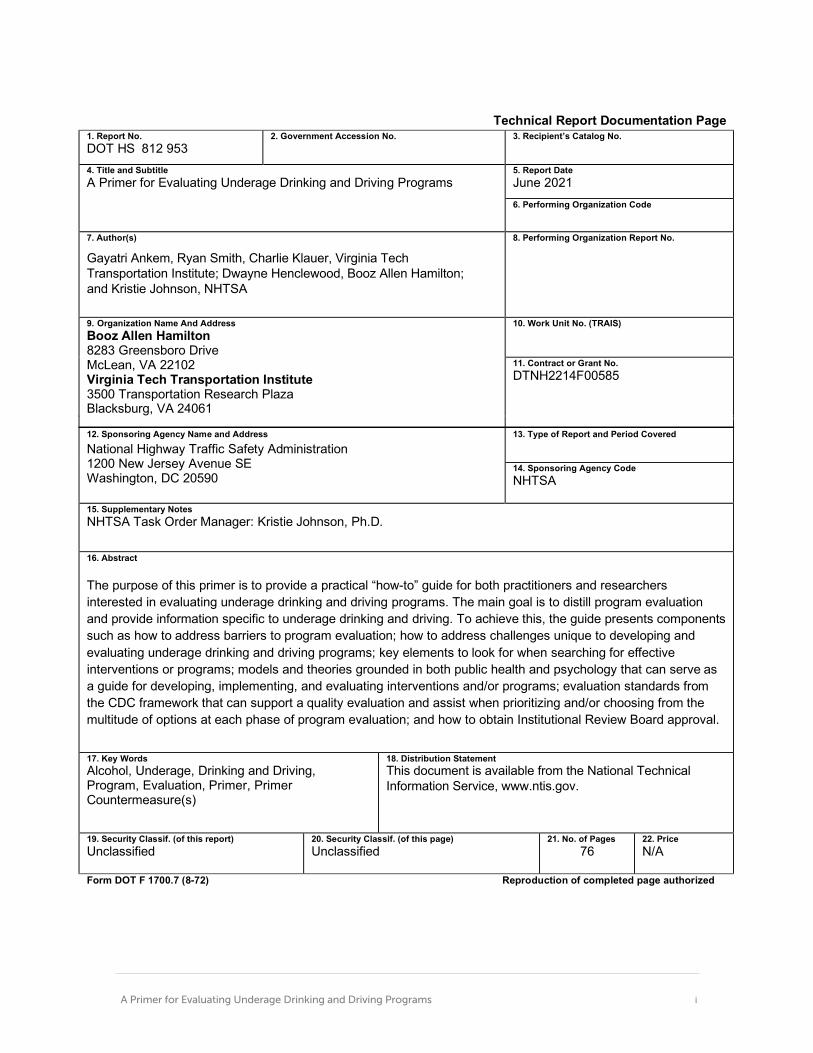
Technical Report Documentation Page 1. Report No. DOT HS 812 953
2. Government Accession No. 3. Recipient’s Catalog No.
4. Title and Subtitle A Primer for Evaluating Underage Drinking and Driving Programs
5. Report Date June 2021 6. Performing Organization Code
7. Author(s)
Gayatri Ankem, Ryan Smith, Charlie Klauer, Virginia Tech Transportation Institute; Dwayne Henclewood, Booz Allen Hamilton; and Kristie Johnson, NHTSA
8. Performing Organization Report No.
9. Organization Name And Address Booz Allen Hamilton 8283 Greensboro Drive McLean, VA 22102
10. Work Unit No. (TRAIS)
11. Contract or Grant No.
Virginia Tech Transportation Institute 3500 Transportation Research Plaza Blacksburg, VA 24061
DTNH2214F00585
12. Sponsoring Agency Name and Address
National Highway Traffic Safety Administration 1200 New Jersey Avenue SE Washington, DC 20590
13. Type of Report and Period Covered
14. Sponsoring Agency Code NHTSA
15. Supplementary Notes NHTSA Task Order Manager: Kristie Johnson, Ph.D.
16. Abstract
The purpose of this primer is to provide a practical “how-to” guide for both practitioners and researchers interested in evaluating underage drinking and driving programs. The main goal is to distill program evaluation and provide information specific to underage drinking and driving. To achieve this, the guide presents components such as how to address barriers to program evaluation; how to address challenges unique to developing and evaluating underage drinking and driving programs; key elements to look for when searching for effective interventions or programs; models and theories grounded in both public health and psychology that can serve as a guide for developing, implementing, and evaluating interventions and/or programs; evaluation standards from the CDC framework that can support a quality evaluation and assist when prioritizing and/or choosing from the multitude of options at each phase of program evaluation; and how to obtain Institutional Review Board approval.
17. Key Words Alcohol, Underage, Drinking and Driving, Program, Evaluation, Primer, Primer Countermeasure(s)
18. Distribution Statement This document is available from the National Technical Information Service, www.ntis.gov.
19. Security Classif. (of this report) Unclassified
20. Security Classif. (of this page) Unclassified
21. No. of Pages 76
22. Price N/A
Form DOT F 1700.7 (8-72) Reproduction of completed page authorized
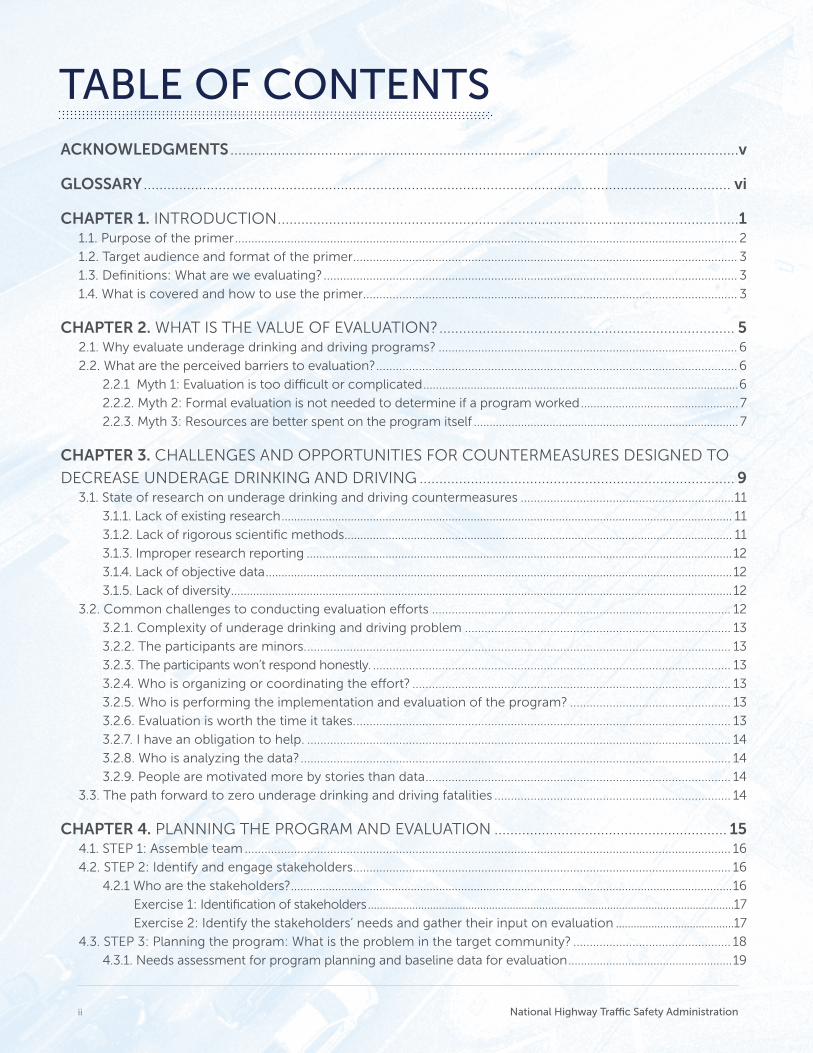
TABLE OF CONTENTS ACKNOWLEDGMENTS .................................................................................................................................v
GLOSSARY ..................................................................................................................................................... vi
CHAPTER 1. INTRODUCTION.....................................................................................................................1 1.1. Purpose of the primer......................................................................................................................................................... 2
1.2. Target audience and format of the primer..................................................................................................................... 3
1.3. Defnitions: What are we evaluating?.............................................................................................................................. 3
1.4. What is covered and how to use the primer.................................................................................................................. 3
CHAPTER 2. WHAT IS THE VALUE OF EVALUATION?........................................................................... 5 2.1. Why evaluate underage drinking and driving programs? ...........................................................................................6
2.2. What are the perceived barriers to evaluation?..............................................................................................................6
2.2.1 Myth 1: Evaluation is too difcult or complicated....................................................................................................6
2.2.2. Myth 2: Formal evaluation is not needed to determine if a program worked.................................................. 7
2.2.3. Myth 3: Resources are better spent on the program itself ....................................................................................7
CHAPTER 3. CHALLENGES AND OPPORTUNITIES FOR COUNTERMEASURES DESIGNED TO
DECREASE UNDERAGE DRINKING AND DRIVING ................................................................................ 9 3.1. State of research on underage drinking and driving countermeasures .................................................................11
3.1.1. Lack of existing research............................................................................................................................................... 11
3.1.2. Lack of rigorous scientifc methods........................................................................................................................... 11
3.1.3. Improper research reporting .......................................................................................................................................12
3.1.4. Lack of objective data....................................................................................................................................................12
3.1.5. Lack of diversity...............................................................................................................................................................12
3.2. Common challenges to conducting evaluation eforts ........................................................................................... 12
3.2.1. Complexity of underage drinking and driving problem ................................................................................. 13
3.2.2. The participants are minors.................................................................................................................................. 13
3.2.3. The participants won’t respond honestly. ............................................................................................................. 13
3.2.4. Who is organizing or coordinating the efort? ................................................................................................. 13
3.2.5. Who is performing the implementation and evaluation of the program? ................................................. 13
3.2.6. Evaluation is worth the time it takes................................................................................................................... 13
3.2.7. I have an obligation to help. ................................................................................................................................. 14
3.2.8. Who is analyzing the data?................................................................................................................................... 14
3.2.9. People are motivated more by stories than data............................................................................................. 14
3.3. The path forward to zero underage drinking and driving fatalities ........................................................................ 14
CHAPTER 4. PLANNING THE PROGRAM AND EVALUATION ........................................................... 15 4.1. STEP 1: Assemble team .................................................................................................................................................... 16
4.2. STEP 2: Identify and engage stakeholders................................................................................................................... 16
4.2.1 Who are the stakeholders?............................................................................................................................................16
Exercise 1: Identifcation of stakeholders............................................................................................................................17
Exercise 2: Identify the stakeholders’ needs and gather their input on evaluation ........................................17
4.3. STEP 3: Planning the program: What is the problem in the target community? ................................................ 18
4.3.1. Needs assessment for program planning and baseline data for evaluation....................................................19
National Highway Trafc Safety Administration ii
A Primer for Evaluating Underage Drinking and Driving Programs iii
4.4. STEP 4: Planning the program: Identify efective programs.................................................................................... 19
4.4.1. Appreciating the need for evidence-based programs ......................................................................................... 20
4.4.2. Using expert judgment to evaluate research evidence ....................................................................................... 20
4.4.3. Identifying efective programs ....................................................................................................................................21
4.5. STEP 5: Planning the program: Tailor the program to ft target community needs and population..............23
4.6. STEP 6: Planning your program: Develop the strategy ............................................................................................23
4.6.1. What is the mission? ......................................................................................................................................................23
4.6.2. What is the vision? .........................................................................................................................................................23
4.6.3. What are the goals? ...................................................................................................................................................... 24
4.6.4. What are the objectives? ............................................................................................................................................. 24
4.6.5. What are the outcomes?............................................................................................................................................. 24
4.6.6. What are the indicators or measures? ..................................................................................................................... 24
4.6.7. What are the activities? .................................................................................................................................................25
4.6.8. What are the outputs?.................................................................................................................................................. 26
4.6.9. What are the resources/inputs?................................................................................................................................. 26
4.6.10. What is the context?................................................................................................................................................... 26
4.7. STEP 7: Develop a logic model.......................................................................................................................................26
4.7.1. Exercise 3: Developing a logic model........................................................................................................................27
4.8. STEP 8: Planning the evaluation: Develop the strategy............................................................................................28
4.8.1. Purpose: Why evaluate?............................................................................................................................................... 28
Exercise 4: Evaluation purpose............................................................................................................................29
4.8.2. Evaluation questions: What to evaluate ................................................................................................................29
4.8.3. Evaluation design: How to evaluate ..........................................................................................................................31
4.9. STEP 9: Choose the indicators or outcomes measures to evaluate......................................................................34
4.10. STEP 10: Figure out the stage of development or maturation of program........................................................34
4.10.1. Exercise 5: Program stage of development...........................................................................................................35
4.11. STEP 11: Decide who will conduct the evaluation – an internal or external evaluator ........................................35
4.12. STEP 12: Ensure the planning steps are in compliance with the standards .......................................................36
4.13. Wrapping up the planning phase................................................................................................................................. 37
CHAPTER 5. IMPLEMENTING THE COUNTERMEASURE AND EVALUATION ................................38 5.1. Implementing the countermeasure ..............................................................................................................................39
5.2. Implementing the evaluation .........................................................................................................................................39
5.2.1. Data collection............................................................................................................................................................... 39
5.2.2. Data Analysis....................................................................................................................................................................47
CHAPTER 6. INTERPRETING THE RESULTS AND JUSTIFYING THE CONCLUSIONS..................50 6.1. Interpretation of fndings ................................................................................................................................................. 51
6.2. Tips for interpreting your results ................................................................................................................................... 51
6.3. Useful evaluation questions............................................................................................................................................52
CHAPTER 7. DISSEMINATION AND UTILIZATION OF EVALUATION FINDINGS............................53 7.1. Useful tips for writing reports..........................................................................................................................................54
7.2. Sample outline for report.................................................................................................................................................55
A Primer for Evaluating Underage Drinking and Driving Programs iii
CHAPTER 8. PUTTING IT TOGETHER ....................................................................................................56
REFERENCES................................................................................................................................................58
APPENDIX A: OVERVIEW OF RELEVANT PUBLIC HEALTH AND PSYCHOLOGY BASED
MODELS ........................................................................................................................................................62 Socio-Ecological Model..........................................................................................................................................................62
Health Belief Model (HBM) .....................................................................................................................................................62
Theory of Planned Behavior (TPB) ........................................................................................................................................63
APPENDIX B: DETERMINING SAMPLE SIZES FOR DIFFERENT PRECISION LEVELS.....................64
LIST OF FIGURES Figure 1. The interplay between program planning and evaluation .............................................................................. 18
Figure 2. Potential hierarchy of efects ................................................................................................................................25
Figure 3. Basic framework of a typical logic model ..........................................................................................................26
Figure 4. Which evaluation study design will meet your needs?....................................................................................32
Figure 5. What do you need for experimental or quasi-experimental study? .............................................................32
Figure 6. Activity to decide whether to hire an external evaluator or not....................................................................36
LIST OF TABLES Table 1. Identifying key stakeholders .................................................................................................................................... 17
Table 2. Exercise to develop the purpose of the evaluation............................................................................................29
Table 3. Evaluation questions and time frame....................................................................................................................30
Table 4. How far along?...........................................................................................................................................................35
Table 5. Where is your program?...........................................................................................................................................35
Table 6. Implementation readiness checklist......................................................................................................................39
Table 7. Data collection methods..........................................................................................................................................40
Table 8. Evaluation matrix I: Matching evaluation questions with data collection tools...........................................42
Table 9. Evaluation matrix II: Matching evaluation questions with data collection tools..........................................42
Table 10. Data collection checklist .......................................................................................................................................47
Table 11. Activity table..............................................................................................................................................................54
iv National Highway Trafc Safety Administration
Acknowledgments
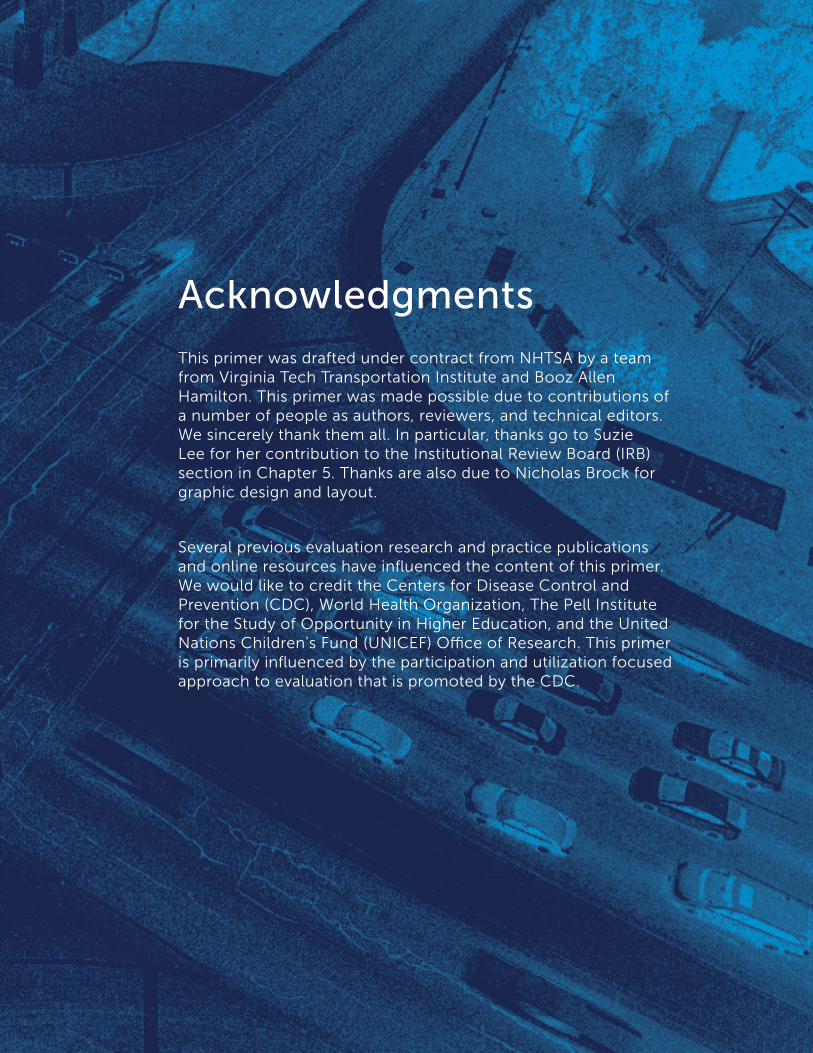
This primer was drafted under contract from NHTSA by a team from Virginia Tech Transportation Institute and Booz Allen Hamilton. This primer was made possible due to contributions of a number of people as authors, reviewers, and technical editors. We sincerely thank them all. In particular, thanks go to Suzie Lee for her contribution to the Institutional Review Board (IRB) section in Chapter 5. Thanks are also due to Nicholas Brock for graphic design and layout.
Several previous evaluation research and practice publications and online resources have infuenced the content of this primer. We would like to credit the Centers for Disease Control and Prevention (CDC), World Health Organization, The Pell Institute for the Study of Opportunity in Higher Education, and the United Nations Children’s Fund (UNICEF) Ofce of Research. This primer is primarily infuenced by the participation and utilization focused approach to evaluation that is promoted by the CDC.
vi
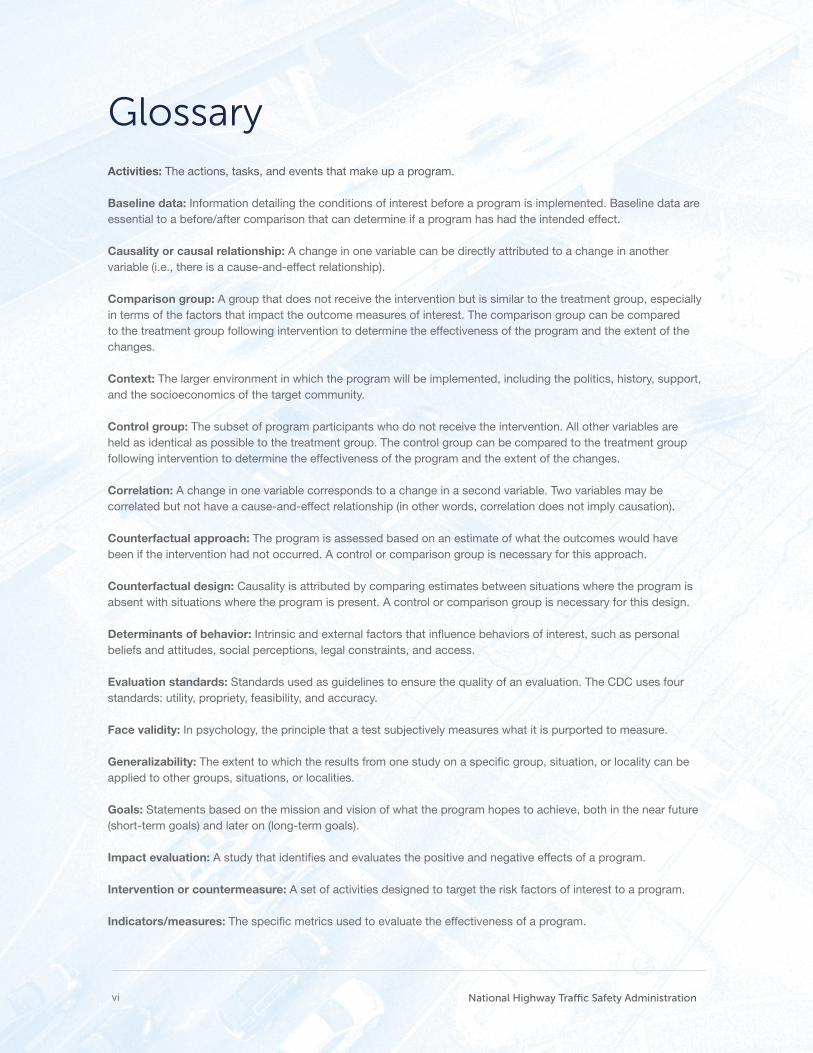
Glossary Activities: The actions, tasks, and events that make up a program.
Baseline data: Information detailing the conditions of interest before a program is implemented. Baseline data are essential to a before/after comparison that can determine if a program has had the intended effect.
Causality or causal relationship: A change in one variable can be directly attributed to a change in another variable (i.e., there is a cause-and-effect relationship).
Comparison group: A group that does not receive the intervention but is similar to the treatment group, especially in terms of the factors that impact the outcome measures of interest. The comparison group can be compared to the treatment group following intervention to determine the effectiveness of the program and the extent of the changes.
Context: The larger environment in which the program will be implemented, including the politics, history, support, and the socioeconomics of the target community.
Control group: The subset of program participants who do not receive the intervention. All other variables are held as identical as possible to the treatment group. The control group can be compared to the treatment group following intervention to determine the effectiveness of the program and the extent of the changes.
Correlation: A change in one variable corresponds to a change in a second variable. Two variables may be correlated but not have a cause-and-effect relationship (in other words, correlation does not imply causation).
Counterfactual approach: The program is assessed based on an estimate of what the outcomes would have been if the intervention had not occurred. A control or comparison group is necessary for this approach.
Counterfactual design: Causality is attributed by comparing estimates between situations where the program is absent with situations where the program is present. A control or comparison group is necessary for this design.
Determinants of behavior: Intrinsic and external factors that infuence behaviors of interest, such as personal beliefs and attitudes, social perceptions, legal constraints, and access.
Evaluation standards: Standards used as guidelines to ensure the quality of an evaluation. The CDC uses four standards: utility, propriety, feasibility, and accuracy.
Face validity: In psychology, the principle that a test subjectively measures what it is purported to measure.
Generalizability: The extent to which the results from one study on a specifc group, situation, or locality can be applied to other groups, situations, or localities.
Goals: Statements based on the mission and vision of what the program hopes to achieve, both in the near future (short-term goals) and later on (long-term goals).
Impact evaluation: A study that identifes and evaluates the positive and negative effects of a program.
Intervention or countermeasure: A set of activities designed to target the risk factors of interest to a program.
Indicators/measures: The specifc metrics used to evaluate the effectiveness of a program.
vi National Highway Trafc Safety Administration
vii
Logic model: A visual representation of the relationships between the program's inputs, activities, outputs, and outcomes.
Mission: A statement identifying the reasons for the program, who will beneft from it, and what those benefts will be.
Needs assessment: The process of determining the factors that contribute to the problem in the context of the target community and establishing the baseline condition.
Objective data: Observable data that can be measured and that do not rely on individual perception.
Objectives: The expected results of a program, ideally expressed in terms that are specifc and measurable.
Outcomes: The desired behavioral changes that will occur as a result of participation in a program.
Outcomes evaluation: A program assessment that compares any observed changes with the program’s stated objectives. An outcomes evaluation determines the program’s effectiveness and can be used to guide program developments and improvements.
Outputs: The program’s immediate effects and deliverables.
Performance standards: Benchmarks established prior to evaluation (ideally in consultation with stakeholders) used to determine the effectiveness of a program.
Process evaluation: An assessment that determines whether the program was implemented as planned instead of measuring any changes among the target audience.
Program: One or more countermeasures and activities designed to target a specifc risky behavior.
Randomization: The selection of a sample based on random chance.
Recall bias: How well participants remember details about the past when being interviewed or responding to a survey.
Reliability: The extent to which data are consistent when collected at different times and places and by different individuals.
Representative sample: A subsample selected to refect the overall characteristics of the entire population of interest.
Resources/Inputs: The resources needed to implement a program in terms of funding, people, equipment, material, facilities, etc.
Selection bias: A disparity between the treatment and control/comparison group.
vii A Primer for Evaluating Underage Drinking and Driving Programs

National Highway Trafc Safety Administration viii
A Primer for Evaluating Underage Drinking and Driving Programs 1
Spotlight: FDA staff scientist
Placeholder text. A picture of idendae dolum iducidem aut explitae quasinum intia doloresecto eos sum nis repra pe volupic toratecto.
1 Introduction
THE PURPOSE of this primer is to provide a practical “how-to” guide for practitioners and researchers who are interested in evaluating underage drinking and driving programs. The main goal is to distill the large quantity of program evaluation research and provide information specifc to underage drinking and driving.
2 National Highway Trafc Safety Administration
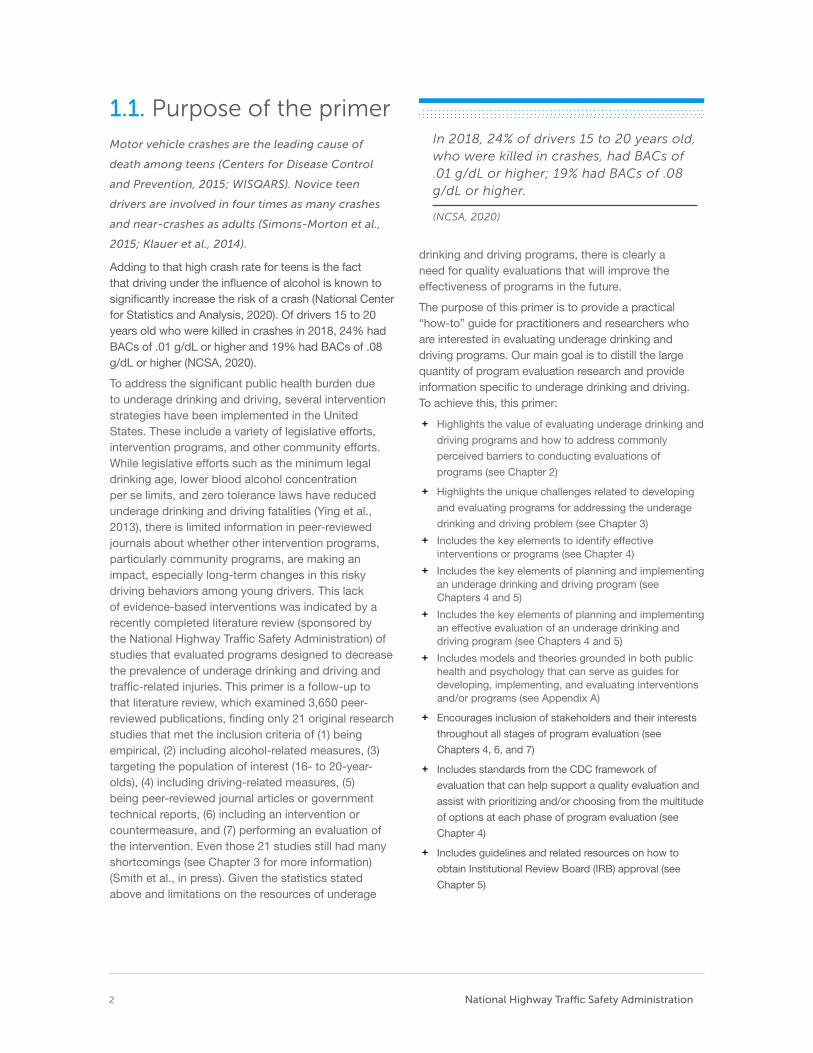
1.1. Purpose of the primer Motor vehicle crashes are the leading cause of
death among teens (Centers for Disease Control
and Prevention, 2015; WISQARS). Novice teen
drivers are involved in four times as many crashes
and near-crashes as adults (Simons-Morton et al.,
2015; Klauer et al., 2014).
Adding to that high crash rate for teens is the fact that driving under the infuence of alcohol is known to signifcantly increase the risk of a crash (National Center for Statistics and Analysis, 2020). Of drivers 15 to 20 years old who were killed in crashes in 2018, 24% had BACs of .01 g/dL or higher and 19% had BACs of .08 g/dL or higher (NCSA, 2020).
To address the signifcant public health burden due to underage drinking and driving, several intervention strategies have been implemented in the United States. These include a variety of legislative efforts, intervention programs, and other community efforts. While legislative efforts such as the minimum legal drinking age, lower blood alcohol concentration per se limits, and zero tolerance laws have reduced underage drinking and driving fatalities (Ying et al., 2013), there is limited information in peer-reviewed journals about whether other intervention programs, particularly community programs, are making an impact, especially long-term changes in this risky driving behaviors among young drivers. This lack of evidence-based interventions was indicated by a recently completed literature review (sponsored by the National Highway Traffc Safety Administration) of studies that evaluated programs designed to decrease the prevalence of underage drinking and driving and traffc-related injuries. This primer is a follow-up to that literature review, which examined 3,650 peer-reviewed publications, fnding only 21 original research studies that met the inclusion criteria of (1) being empirical, (2) including alcohol-related measures, (3) targeting the population of interest (16- to 20-year-olds), (4) including driving-related measures, (5) being peer-reviewed journal articles or government technical reports, (6) including an intervention or countermeasure, and (7) performing an evaluation of the intervention. Even those 21 studies still had many shortcomings (see Chapter 3 for more information) (Smith et al., in press). Given the statistics stated above and limitations on the resources of underage
In 2018, 24% of drivers 15 to 20 years old, who were killed in crashes, had BACs of .01 g/dL or higher; 19% had BACs of .08 g/dL or higher.
(NCSA, 2020)
drinking and driving programs, there is clearly a need for quality evaluations that will improve the effectiveness of programs in the future.
The purpose of this primer is to provide a practical “how-to” guide for practitioners and researchers who are interested in evaluating underage drinking and driving programs. Our main goal is to distill the large quantity of program evaluation research and provide information specifc to underage drinking and driving. To achieve this, this primer:
+ Highlights the value of evaluating underage drinking and
driving programs and how to address commonly
perceived barriers to conducting evaluations of
programs (see Chapter 2)
+ Highlights the unique challenges related to developing
and evaluating programs for addressing the underage
drinking and driving problem (see Chapter 3)
+ Includes the key elements to identify effectiveinterventions or programs (see Chapter 4)
+ Includes the key elements of planning and implementingan underage drinking and driving program (seeChapters 4 and 5)
+ Includes the key elements of planning and implementingan effective evaluation of an underage drinking anddriving program (see Chapters 4 and 5)
+ Includes models and theories grounded in both publichealth and psychology that can serve as guides fordeveloping, implementing, and evaluating interventionsand/or programs (see Appendix A)
+ Encourages inclusion of stakeholders and their interests
throughout all stages of program evaluation (see
Chapters 4, 6, and 7)
+ Includes standards from the CDC framework of
evaluation that can help support a quality evaluation and
assist with prioritizing and/or choosing from the multitude
of options at each phase of program evaluation (see
Chapter 4)
+ Includes guidelines and related resources on how to
obtain Institutional Review Board (IRB) approval (see
Chapter 5)
A Primer for Evaluating Underage Drinking and Driving Programs 3
1.2. Target audience and format of the primer This primer is a “how-to” guide for practitioners and researchers who want to develop, implement, and evaluate programs aimed at reducing underage drinking and driving. The intended audience will vary depending on the context of the problem and the setting chosen in which to implement and/or evaluate the program and may include the following.
+ Highway safety professionals
+ Law enforcement offcers
+ Health professionals
+ Manufacturers and suppliers of alcohol
+ Owners of hotels and restaurants
+ School teachers
+ Researchers
+ Driving instructors
+ Government agencies
+ Non-proft organizations
+ Insurance professionals
1.3. Defnitions: What are we evaluating?
Due to the variation in the meaning of some terms across professions and contexts, the terms intervention/ countermeasure and program as used in this primer are defned below. Additional terminology is defned in the Glossary on page vi.
Intervention or countermeasures: These two terms are used interchangeably throughout the primer. An intervention/countermeasure is a set of activities (including any material such as brochures) to address the underage drinking and driving problem and the contributing risk factors. For example, a school may implement a peer-based educational countermeasure that includes multiple activities conducted at various times to increase awareness of the adverse impacts of drinking and driving.
Program: A program includes a group or set of countermeasures or interventions developed to reduce underage drinking and driving. For instance, a community may implement a three-part program consisting of a school-based educational program, the strict enforcement of underage drinking laws, and a hospital-based educational program targeting underage drinkers.
Just as there are different levels of programs, ranging from numerous activities and countermeasures, to a single activity, evaluation also occurs at many different levels. Evaluations can be used to assess your entire program or specifc countermeasures. Consequently, this primer is written to accommodate the reader’s specifc requirements, and the reader is encouraged to keep this in mind and consider how the information presented here can be used to address their circumstances.
1.4. What is covered and how to use the primer
Underage drinking and driving is a complex public health and transportation safety problem that requires a systematic approach specifc to the situation and target community. This primer provides a step-by-step process to highlight the importance of a systematic approach. However, the number of and specifc steps needed will vary according to each case. Additionally, even though this guide is written in a step-by-step manner, it may not be necessary to complete Step 3 before moving to Step 4; sometimes it may make sense to skip a step and come back to that step later. Furthermore, some steps may be best implemented simultaneously to save time and resources. Consider which steps are essential based on the situation and proceed accordingly.
Secondly, this primer highlights the importance of planning an evaluation before a countermeasure is even implemented. Hence, the primer discusses key components of identifying, planning and implementing a program along with planning and implementing an evaluation of a program.
Chapter 2 explains why it is necessary to evaluate the program. This chapter describes some common program evaluation myths and explains how this primer will assist conducting a program evaluation.
Ch
apte
r 1 C
hap
ter 2
C
hap
ter 3
C
hap
ter 4
C
hap
ter 5
C
hap
ter 6
C
hap
ter 7
Ch
apte
r 8
4 National Highway Trafc Safety Administration
Chapter 3 provides a brief overview of the challenges inherent to evaluating programs in general and those that are unique to programs addressing the underage drinking and driving problem. This chapter highlights the importance of identifying the problem, and then implementing and evaluating these programs.
Chapter 4 details the planning phase and leads the reader through the process of planning an implementation and evaluation of a program. It identifes which steps are related to the program and which are related to the evaluation. This chapter contains the primer’s core information on engaging stakeholders, identifying suitable programs, identifying the purpose of the evaluation, choosing the best evaluation design, and determining whether to hire an external evaluator. As the focus of this primer is evaluation, in-depth descriptions of program planning and implementation are not provided; however, some good resources to review are provided in the references.
Chapter 5 is related to the implementation phase of both the program and evaluation and provides details on data collection, data analysis, and how to obtain IRB approval. As in Chapter 4, given that the focus of this primer is evaluation, in-depth descriptions of program implementation are not provided.
Chapter 6 provides a brief overview on the importance of planning for the interpretation of results, along with tips on how to accomplish this. Planning for interpretation is the most frequently overlooked step in designing a program evaluation, but is essential in justifying the conclusions reached
and sets the foundation to ensure that the evaluation results are put to good use.
Chapter 7 is related to the dissemination and utilization of evaluation results.
Chapter 8 provides some important takeaway messages for the reader.
Appendices
+ Appendix A provides an overview of public health and
psychology based models that are useful for developing
and evaluating interventions and/or programs.
+ Appendix B includes links to a few statistical calculators
that are available to estimate sample sizes.
Underage drinking and driving is a complex public health and transportation safety problem that requires a systematic approach specifc to the situation and target community. This primer provides a step-by-step process to highlight the importance of a systematic approach.
A Primer for Evaluating Underage Drinking and Driving Programs 5
Spotlight: FDA staff scientist
Placeholder text. A picture of idendae dolum iducidem aut explitae quasinum intia doloresecto eos sum nis repra pe volupic toratecto.
2 What is the Value of Evaluation?
HISTORICALLY, most evaluations of the efectiveness of underage drinking and driving prevention programs have been limited to anecdotal information and/ or reports to sponsors indicating the number of participants who attended the program. However, neither of these commonly used methods answers the question of whether the program made any diference in reducing the frequency of underage drinking and driving or the number of crash-related injuries or deaths associated with underage drinking and driving.

6 National Highway Trafc Safety Administration
2.1. Why evaluate underage drinking and driving programs?
Historically, most evaluations of the effectiveness of underage drinking and driving prevention programs have been limited to anecdotal information and/ or reports to sponsors indicating the number of participants who attended the program. However, neither of these commonly used methods answers the question of whether the programs made any difference in reducing the frequency of underage drinking and driving or the number of crash-related injuries or deaths associated with underage drinking and driving. As indicated in the Introduction, out of 3,560 study publications retrieved for a literature review in this topic area, only 21 peer-reviewed publications met the inclusion criteria and even these studies had some limitations.
Reducing the prevalence and public health burden of underage alcohol-impaired driving, or preventing it altogether, requires programs to address risk factors at the systems level and/or on multiple levels. Human behavior is infuenced by factors operating at multiple levels: individual, interpersonal, institutional, community, and societal/public policy. The most effective interventions tend to address multiple factors operating on multiple levels because successful individual behavior changes happen when society or environment supports or reinforces the change in behaviors. For instance, reduction in rates of underage drinking and driving requires intervention at the individual level, where attitudes and perceptions of the risks of underage drinking and driving are changed, along with broad policy changes, at the local, state, or national levels that reinforce or facilitate the change (e.g., reduced access to alcohol for the teen drivers). (See Appendix A for the socio-ecological model). Furthermore, the effectiveness or impact of underage drinking and driving programs also depends on the contextual factors related to the locale where the program is implemented. Blindly transferring an intervention to another location may not only produce minimal results but may also cause unintended consequences instead of having a positive impact. Conducting an effective program evaluation will help address these issues and may also help tailor the program to the community over time.
Recently, program sponsors have begun to place emphasis on accountability and evidence for the effectiveness of programs—did the program achieve what it planned to achieve? The good news is that providing evaluation fndings may make a strong case for continued support and funding. On the other hand, any negative unintended consequences highlighted by the evaluation create an opportunity to understand why the program did not achieve its goals or why negative or unintended consequences were the result. These insights can then become the basis for making necessary program changes so that the program achieves its goals.
2.2. What are the perceived barriers to evaluation? There are several myths about and perceived barriers to evaluation that are due either to historical practices and/or a lack of information about advances made in the feld of evaluation in the past two to three decades.
2.2.1. Myth 1: Evaluation is too difcult or complicated.
The Truth
The feld of program evaluation has made great strides over the past 20 to 30 years. Historically, program evaluation was often done by hiring an external contractor, who would write a fnal report— often using complex jargon—and then step away. There are now numerous free resources that present the basic concepts of program evaluation, thus allowing practitioners to confdently conduct their own evaluations with proper planning. In fact, most programs are already doing some form of informal evaluation, such as asking participants for feedback. A formal evaluation is merely more structured, more effcient, and allows more useful information to be gathered that may ultimately help to either improve a program or reach the target audience more effectively.
A Primer for Evaluating Underage Drinking and Driving Programs 7
2.2.2. Myth 2: Formal evaluation is not needed to determine if a program worked.
The Truth
This myth stems from the assumption that successful programs reach a certain number of participants and the program will run successfully without any additional effort. This is very rare. The success that matters is changing the target audience’s drinking and driving behaviors and continuously adapting the program to achieve the desired outcomes. Formal evaluation helps to develop the correct time- and context-based questions to effectively assess a program. Formal evaluation helps make a strong case for continued funding, as more and more sponsors and policy makers want to know whether the program was effective. The evaluation process may also help to improve the program.
Example 1 The evaluation may show that the venue was a barrier for the participants. As a result, planning for the next offering would focus on fnding a better venue.
Example 2 The evaluation might show that a new policy is needed for preventing underage drinking and driving in the community. Without formal evaluation, it will be hard to convince policy makers to make new laws.
Evaluation provides feedback that can inform choices about future resource allocation and can identify the areas where the resources matter the most, especially when they are scarce. Evaluation also helps to improve the program’s design and implementation.
2.2.3. Myth 3: Resources are better spent on the program itself.
The Truth
It seems logical to put limited resources into activities and implementing other aspects of the program. However, depending on the goal of your program, it may be wise to set aside the resources and time for an evaluation. Evaluation provides feedback that can inform choices about future resource allocation and can identify the areas where the resources matter the most, especially when they are scarce. Secondly, evaluation also helps to improve the program’s design and implementation. Making evaluation an integral part of a program, as encouraged in this primer, can facilitate making the most of a program and its resources. This primer also emphasizes the participation— and utilization—focused approach to evaluation adopted by the CDC in its program evaluation framework, which helps to ensure that evaluation fndings are relevant and practical.
Ch
apte
r 1 C
hap
ter 2
C
hap
ter 3
C
hap
ter 4
C
hap
ter 5
C
hap
ter 6
C
hap
ter 7
Ch
apte
r 8
8 National Highway Trafc Safety Administration
Evaluation is not as daunting as it may seem, and will help in many ways. The benefts of program evaluation include the following.
+ Determining if a program made a difference or had the desired impact
+ Understanding why a program did or did not have the desired impact
+ Understanding whether goals were reached
+ Determining whether the target audience was reached
+ Understanding how to improve the program
+ Making a case for further funding and support
+ Making sure that effective programs are maintained
+ Preventing resources from being invested in ineffective
programs
A Primer for Evaluating Underage Drinking and Driving Programs 9
9 U.S. DEPARTMENT OF TRANSPORTATION
Spotlight: FDA staff scientist
Placeholder text. A picture of idendae dolum iducidem aut explitae quasinum intia doloresecto eos sum nis repra pe volupic toratecto.
3 Challenges and Opportunities for Countermeasures Designed to Decrease Underage Drinking and Driving
ALTHOUGH there are thousands of published research articles on underage drinking, very few articles detail rigorous evaluation eforts of programs designed to decrease underage drinking and driving. This lack of published evaluation research may not only highlight the difculty of conducting a proper evaluation, but also the difculty of selecting an evidence-based program.
10 National Highway Trafc Safety Administration
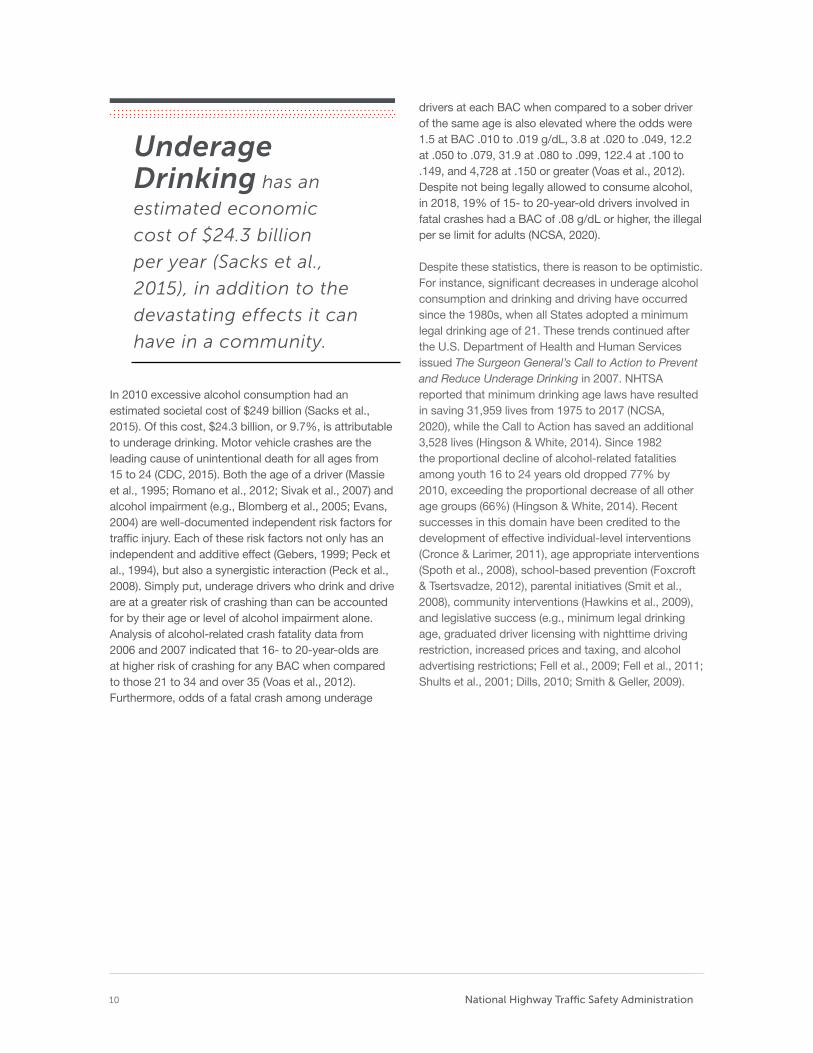
Underage Drinking has an
estimated economic
cost of $24.3 billion
per year (Sacks et al.,
2015), in addition to the
devastating effects it can
have in a community.
In 2010 excessive alcohol consumption had an estimated societal cost of $249 billion (Sacks et al., 2015). Of this cost, $24.3 billion, or 9.7%, is attributable to underage drinking. Motor vehicle crashes are the leading cause of unintentional death for all ages from 15 to 24 (CDC, 2015). Both the age of a driver (Massie et al., 1995; Romano et al., 2012; Sivak et al., 2007) and alcohol impairment (e.g., Blomberg et al., 2005; Evans, 2004) are well-documented independent risk factors for traffc injury. Each of these risk factors not only has an independent and additive effect (Gebers, 1999; Peck et al., 1994), but also a synergistic interaction (Peck et al., 2008). Simply put, underage drivers who drink and drive are at a greater risk of crashing than can be accounted for by their age or level of alcohol impairment alone. Analysis of alcohol-related crash fatality data from 2006 and 2007 indicated that 16- to 20-year-olds are at higher risk of crashing for any BAC when compared to those 21 to 34 and over 35 (Voas et al., 2012). Furthermore, odds of a fatal crash among underage
drivers at each BAC when compared to a sober driver of the same age is also elevated where the odds were 1.5 at BAC .010 to .019 g/dL, 3.8 at .020 to .049, 12.2 at .050 to .079, 31.9 at .080 to .099, 122.4 at .100 to .149, and 4,728 at .150 or greater (Voas et al., 2012). Despite not being legally allowed to consume alcohol, in 2018, 19% of 15- to 20-year-old drivers involved in fatal crashes had a BAC of .08 g/dL or higher, the illegal per se limit for adults (NCSA, 2020).
Despite these statistics, there is reason to be optimistic. For instance, signifcant decreases in underage alcohol consumption and drinking and driving have occurred since the 1980s, when all States adopted a minimum legal drinking age of 21. These trends continued after the U.S. Department of Health and Human Services issued The Surgeon General’s Call to Action to Prevent and Reduce Underage Drinking in 2007. NHTSA reported that minimum drinking age laws have resulted in saving 31,959 lives from 1975 to 2017 (NCSA, 2020), while the Call to Action has saved an additional 3,528 lives (Hingson & White, 2014). Since 1982 the proportional decline of alcohol-related fatalities among youth 16 to 24 years old dropped 77% by 2010, exceeding the proportional decrease of all other age groups (66%) (Hingson & White, 2014). Recent successes in this domain have been credited to the development of effective individual-level interventions (Cronce & Larimer, 2011), age appropriate interventions (Spoth et al., 2008), school-based prevention (Foxcroft & Tsertsvadze, 2012), parental initiatives (Smit et al., 2008), community interventions (Hawkins et al., 2009), and legislative success (e.g., minimum legal drinking age, graduated driver licensing with nighttime driving restriction, increased prices and taxing, and alcohol advertising restrictions; Fell et al., 2009; Fell et al., 2011; Shults et al., 2001; Dills, 2010; Smith & Geller, 2009).
A Primer for Evaluating Underage Drinking and Driving Programs 11
"The literature review found several broad programs that were efective, most notably high-visibility enforcement campaigns. Education-based programs were represented by 16 studies."
3.1. State of research on underage drinking and driving countermeasures Despite these successes, work remains to be done. The decrease in underage drinking and driving fatalities suggests that effective programs exist that not only reduce underage alcohol consumption, but also reduce underage drinking and driving. Yet, it is unclear how much of this success is due to legislative progress versus the development of effective non-legislative countermeasures. This may leave many wondering if there are existing and effective programs that can be implemented in their own communities. Recently, NHTSA examined existing research on countermeasures to prevent underage drinking and driving (Smith et al., in press).
Smith et al. (in press) searched numerous databases to identify all peer-reviewed, published, empirical research on effective countermeasures to prevent underage drinking and driving. In total, 3,560 unique records were examined based upon the literature review search. Out of these records, only 21 empirical studies on this topic met the inclusion criteria. As discussed in Chapter 1, articles were excluded if they were not empirical, not related to the topic or population, not peer-reviewed journals/government reports, or not countermeasure-based. Additionally, research related to laws was excluded because signifcant research was already conducted in that area. Even taking the exclusion criteria into consideration, there simply is a scarcity of existing research to guide program planners
in the selection of effective countermeasures. This lack of research highlights two very important phenomena: (1) research in this area is challenging and (2) further evaluation efforts are drastically needed. The following sections highlight some of the challenges that were identifed through the review and then provide some insight into the aspects of conducting evaluations in this area.
3.1.1. Lack of existing research
Although 3,560 journal articles were examined, it seems highly unlikely that only 21 rigorous efforts (based on the literature review criteria) have been made to evaluate a program designed to decrease underage drinking and driving. The lack of published research may not only highlight the diffculty of conducting a proper evaluation, but also the diffculty of selecting an evidence-based program. Additionally, the lack of published research also could be an artifact of the “fle drawer problem” in which results from non-signifcant effect interventions are never publicly released. Even with a notable lack of existing rigorous efforts, the literature review found several broad programs that were effective, most notably high-visibility enforcement campaigns. Education-based programs were represented by 16 studies.
3.1.2. Lack of rigorous scientifc methods
Out of the 21 research studies, many were conducted with less-than-ideal research methods, including not selecting a control group. As another example, longitudinal data collection (i.e., studying behavior

12 National Highway Trafc Safety Administration
over time) was rarely chosen over cross-sectional data collection (i.e., a single point in time). The effectiveness of interventions can deteriorate over time, and it is necessary to see how behavior changes are maintained over time. It is diffcult to develop a proper evaluation effort, and this diffculty was represented in the research that was identifed.
3.1.3. Improper research reporting
The proper reporting of research fndings is necessary to critically review existing research. Unfortunately, many individuals who published research in this area omitted key details. This was not only true for many of the articles that were excluded from the original literature review, but also true for the 21 articles that were ultimately evaluated (Smith et al., in press). Studies often failed to describe where the research was conducted and what the demographics were for their participants. Important information such as dropout rates and attrition were also regularly omitted. Be aware of these omissions when selecting programs and tailoring it to the community of interest.
3.1.4. Lack of objective data
Objective data are generally a gold standard. Perceptions are not as accurate, especially with underage participants who may not want to tell researchers, doctors, teachers, police, and others about their drinking and driving behavior. Furthermore, changes in perception are typically not suffcient to achieve desired outcomes such as reduction in underage drinking and driving behaviors. Unfortunately, only 6 of the 21 studies reported any objective measures (e.g., BAC or crashes). This type of data can be very diffcult to collect, but evaluation efforts should strive to support subjective data with objective data whenever possible. Subjective data are information related to a participant’s perceptions, attitudes, feelings and intentions that cannot be measured, while objective data are measurable data such as crash statistics or BACs that quantify the actual behaviors.
3.1.5. Lack of diversity Communities vary in important ways. Something that works for one community may not only be less effective in different communities, but may even have unintended results. It is important to understand the community where an evaluation was conducted. This provides insight into the potential suitability of the program for another community. Not only is it important to know the location of where a program was evaluated (e.g., countries have different minimum legal drinking ages), but also the gender and race of participants. Only 11 out of the 21 studies reported gender, and females represented the greater frequency of participation in seven of these studies. Race was reported only in 9 studies, and White participants made up the majority in each of the studies. Overall, there was a lack of diversity in the existing research. In the future, dedicated efforts should be made to conduct research in a broad range of communities in order to improve the generalizability of the program to other communities.
3.2. Common challenges to conducting evaluation eforts
While there are numerous challenges to conducting any evaluation effort [recruitment, randomization, demand characteristics (when participants respond in the way they think the researcher wants them to respond), mortality, etc.], certain challenges are unique to underage drinking and driving, such as the complexity of underage drinking and driving, and the fact that the target population of interest consists of minors. These challenges may reduce interest in conducting a proper evaluation. Indeed, this is likely one reason for the lack of existing research in this area. These challenges may make an evaluation effort not seem to be worth the time and resources; however, it is because of these challenges that proper evaluation is so important.
To best overcome these potential hurdles, it is important to be aware of the common barriers at the onset of an evaluation effort. We describe some of these common barriers below, focusing on their relevance to underage drinking and driving evaluation efforts.

A Primer for Evaluating Underage Drinking and Driving Programs 13
3.2.1 Complexity of the underage drinking and driving problem
The contributing factors to underage drinking are multi-faceted and there is no one thing that leads to and/or reinforces drinking and driving behaviors. For instance, several studies highlight the complexity and multiple risk factors for drinking, particularly among adolescents (Sudhinaraset et al., 2016; NIAAA, 1997). Instead, there is a complex intersection of individual, peer, family, and community factors that infuence this behavior. Hence, interventions should be multi-faceted in order to change the circumstances surrounding underage drinking and driving. In addition to the need for interventions to address more than one contributing factor, they may also need to be implemented in diverse settings such as schools, hospitals, etc. This added complexity also increases the challenges of implementing an effective evaluation.
3.2.2. The participants are minors.
Having participants younger than 18 creates challenges. Minors are not able to provide consent, which can add an extra layer to the evaluation process. As one example, parents may need to sign off on a student participating in an evaluation effort. This can reduce response rates and make parents uncomfortable if the purpose of the evaluation is not effectively discussed and disseminated to the community.
3.2.3. The participants won’t respond honestly.
Teens and young adults may not want to accurately report on their perceptions or actual behaviors related to illegal activity. This includes drinking and driving. If participants are not responding accurately and honestly, then it is nearly impossible to truly evaluate the effectiveness of a program. Fortunately, there are established procedures for facilitating honest and accurate participant reports, such as letting participants know that their feedback is needed, specifying the kind of feedback being sought after, clarifying how the feedback will be used, and guaranteeing anonymity. Objective data can also be used to support or replace subjective data in some instances.
3.2.4. Who is organizing or coordinating the efort?
Groups of people can be called upon to develop, implement, and evaluate a program, including teachers, parents, police offcers, judges, doctors, and peers. As an example, consider who may be involved in implementing prom-night programs within schools. This can widely vary across schools and include driver’s education instructors, school counselors, gym teachers, Spanish teachers, special education instructors, and students. Finding the right person in a community to help with these efforts, appreciating the diversity of professional backgrounds, and developing efforts that can be implemented by a wide variety of personnel is an important challenge.
3.2.5. Who is performing the implementation and evaluation of the program? It was evident from Smith et al. (in press) that the neutrality of program implementers and evaluators was not always considered. In terms of evaluators, think about who is collecting the data or responses. If high school students are asked to anonymously complete a survey, should they personally hand in their responses (particularly, if the responses are an admission of illegal activity) to a teacher or place the survey into an envelope held by an independent entity or researcher? In terms of implementation, make sure the implementer is truly unbiased. For example, a likeable teacher implementing an intervention could subtly signal the “proper” response to the students. Instead, it is important to maximize the accuracy and honesty of participant responses by having a neutral implementer where possible.
3.2.6. Evaluation is worth the time it takes.
Most people involved in programs to reduce underage drinking and driving have job responsibilities outside of program development and evaluation. Even with the support of a full-time program specialist or a position fully dedicated to these efforts, evaluation efforts can feel overwhelming due to the balancing of duties required for everyone involved. This guide can help you effectively develop, implement, and evaluate a program that can improve effciency and help everyone see the meaning behind their efforts.
Ch
apter 3
C
hallen
ges an
d O
pp
ortu
nities: C
ou
nterm
easures D
esign
ed to
Decrease U
nd
erage D
rinkin
g an
d D
riving
14 National Highway Trafc Safety Administration
3.2.7. I have an obligation to help.
Often, understanding the effectiveness of a program or intervention requires direct comparison to an equivalent group of individuals who did not participate in the program or intervention. However, this could be seen as not helping a certain group of individuals for the sake of comparison. Fortunately, this issue can be solved by using strategies such as providing the intervention to the control group at a later time or staggering the intervention to the control group behind the implementation group.
3.2.8. Who is analyzing the data?
It is likely that a variety of individuals will assist with various stages of a program. However, it is unlikely that any of these individuals will have a strong data analysis and interpretation background. Statisticians are limited in number, and even statistics programs can be costly and diffcult to use. It is likely that support will be needed related to analysis. Fortunately, resources do exist, and there are trained individuals who can help with this challenge.
3.2.9. People are motivated more by stories than data.
Unfortunately, we often wait until tragedy strikes our community to develop and evaluate programs. Furthermore, stakeholders and other members of the community may rely more on anecdotal stories and news reports than data to support the need for an evaluation or interpret the effectiveness of an evaluation. For example, imagine a school that does nothing to address underage drinking on prom night, but assumes that they “do not have a problem” because no students were injured or killed last year on prom night. The lack of a tragedy does not imply that no harm will result in the future.
3.3. The path forward to zero underage drinking and driving fatalities
There are important but not insurmountable challenges to conducting effective evaluation efforts in the domain of underage alcohol consumption. Only by identifying these challenges and proactively developing strategies to overcome these hurdles can an effective evaluation effort be achieved.
Continuing the progress in reducing harm from underage drinking and driving requires continued research and evaluation. Due to the limited existing research on programs designed to reduce underage drinking and driving, increasing the number of evaluations conducted on existing and new programs is essential to fnding truly effcacious solutions addressing underage drinking and driving.
A Primer for Evaluating Underage Drinking and Driving Programs 15
Spotlight: FDA staff scientist
Placeholder text. A picture of idendae dolum iducidem aut explitae quasinum intia doloresecto eos sum nis repra pe volupic toratecto.
4 Planning the Program and Evaluation
PROGRAM and evaluation plans provide a roadmap for the efective development of a program and its evaluation. These plans outline the steps needed to put limited time and resources to the best use. In addition, planning for evaluation at the beginning—even before implementing a program—is highly recommended.
16 National Highway Trafc Safety Administration
Program and evaluation plans provide a roadmap for the effective development of a program and its evaluation. These plans outline the steps needed to put limited time and resources to the best use. In addition, planning for evaluation at the beginning— even before implementing a program—is highly recommended because doing so allows baseline data to be collected that can be used to assess whether changes in participants’ behaviors were due to the program.
This chapter is organized based on the assumption that both the program and evaluation plans are developed during the planning phase. However, this may not be the situation in all cases. Depending on the case at hand, consider the steps that are relevant and leave out the non-relevant steps. Even though the guide is organized as a procedure–Step 1, Step 2, and so on– program planning and evaluation do not have to occur in a linear fashion. For example, Step 2 - Identify and Engage Stakeholders, could be done either before or after Step 3. Additionally, some steps are best done iteratively.
4.1. STEP 1: Assemble team
Program planning, implementation, and evaluation are best carried out as team-based activities. Assemble a core team of administrators, managers, staff, and volunteers who are passionate about and believe in the purpose, mission, vision, and goal of the program.
A successful program will involve the team throughout the process of planning, implementing, and evaluating the program, including brainstorming strategies, creating evaluation questions, gathering feedback, and so on. Full team involvement also helps to ensure organizational commitment to and buy-in for the program. Before assembling the team, it is also important to spend some time assigning roles and responsibilities to ensure effective resource utilization.
Here are some questions to keep in mind during this process (adapted from FEMA, 2013)
+ What are the strengths and values of team members?
+ Do individuals at all levels support the program?
+ Does the staff within your organization have the capacity and support to implement and sustain the program? If not, brainstorm strategies for creating or maintaining this support.
Depending on the resources available, and the needs of the program and evaluation, one core team could be responsible for all the phases from planning to implementation of the program and evaluation, or different team members could be chosen for each task.
4.2. STEP 2: Identify and engage stakeholders 4.2.1. Who are the stakeholders? A stakeholder is anyone with a stake or vested interest in the program, such as:
+ Intended users of the program who are served or affected, such as participants, advocacy groups, and community members;
+ Intended users of the evaluation results, such as policy makers, community members, parents, and teachers; and
+ Those involved in the program’s implementation and evaluation, such as core team members, program staff, and sponsors.
In general, stakeholder members are not limited to the categories listed above. Consider including members who can provide quality information to develop, plan, implement, and evaluate the program. One of the key requirements for conducting good quality evaluations is addressing stakeholders’ concerns and needs at every stage of the evaluation process. The process of engaging stakeholders is not trivial; it is worth the effort.
Benefts for engaging the stakeholders from the beginning include the following.
+ Garnering organizational commitment and buy-in from the target audience
+ Improving the validity and utilization of evaluation results
+ Increasing the chances of funding for the program
+ Developing and prioritizing program activities and evaluation questions
+ Selecting and piloting data collection methods

A Primer for Evaluating Underage Drinking and Driving Programs 17
Exercise 1: Identifcation of stakeholders
The frst part of Step 2 is fguring out which group of stakeholders to include in the process, from initial program planning up to the fnal step of disseminating evaluation results. This activity can be done in various ways; we offer an exercise adapted from a CDC program evaluation primer (CDC, 2011a).
1. Identify stakeholders with interests that align withthe program’s goals along with the purpose of theevaluation and its focus. Some stakeholders withkey interests include the following.
+ Implementation of program (i.e., those who areinvolved in implementing the activities of the program)
+ Utilization of evaluation results (i.e., who will advocatefor the changes recommended by the evaluation)
+ Target audience (i.e., those who will be impacted bythe program)
+ Infuence over program’s future (i.e., who willadvocate for continuation of funding)
+ Credibility of the evaluation (i.e., who will use theevaluation information)
One good practice is to use team-based activities to fnalize these criteria.
2. Create a table listing the characteristic of interestand jot down the stakeholders who fall under thosecategories (Table 1). The number of stakeholdersand the categories they fall into varies case-by-case. Sometimes a stakeholder may fall into morethan one category and sometimes there may benone in a category.
The CDC suggests forming a stakeholder working group of 8 to 10 members. While it may not be feasible to get every stakeholder into a working group, it is worth considering their information needs from their diverse viewpoints. The exercise that follows may be helpful in gathering the needs of a stakeholder group.
Table 1. Identifying key stakeholders (excerpted and adapted from CDC, 2011a).
Who are the key stakeholders needed to…
Increase credibility of evaluation and efforts
Implement the program activities and evaluation
Advocate for changes and utilize the evaluation results
Fund and/or infuence the future of the program
Exercise 2: Identify the stakeholders’ needs and gather their input on evaluation
Once the stakeholders are identifed, the next step is to understand their needs and perspectives and the components of the evaluation that matter most to them.
This activity can also be done in several ways. One way is to ask the following questions during the planning phase (excerpted from CDC, 2011a, p. 16):
+ Who do you represent and why are you interested in thisprogram?
+ What is important about this program to you?
+ What would you like this program to accomplish?
+ How much progress would you expect this program tohave made at this time?
+ What do you see as the critical evaluation questions at this time?
+ How will you use the results of this evaluation?
+ How would you like to receive the evaluation results?How often would you like to receive them?
+ What resources (i.e., time, funds, evaluation expertise,access to respondents, and access to policymakers)might you contribute to this evaluation effort?
Ch
apte
r 1 C
hap
ter 2
C
hap
ter 3
C
hap
ter 4
C
hap
ter 5
C
hap
ter 6
C
hap
ter 7
Ch
apte
r 8
18 National Highway Trafc Safety Administration
The responses can be tabulated and themes can be developed from them. Some of the expected outcomes of this exercise include:
+ Identifcation of the information each stakeholderwill use;
+ Identifcation of the role each stakeholder will play;
+ Identifcation of the mode of communication preferred byeach stakeholder along with the preferred frequency ofcommunication; and
+ Identifcation of the stakeholder’s expertise.
Consider spending some time developing a plan and an agreement on shared stakeholder roles and responsibilities to avoid any conficts or diversions from the purpose (e.g., a group of stakeholders overstepping their boundaries and interfering with another group’s work). Depending on the interest and expertise of stakeholders, one might be involved in various phases of program planning and evaluation. The potential phases in which stakeholders might be best involved in are:
+ Program planning: Needs assessment, developing thestrategy and activities that would address the needs ofthe target community;
+ Evaluation planning: Prioritizing the evaluationquestions, selection of evaluation approach, anddesign;
+ Data collection: Pilot testing data collection tools,
collecting data from the target community, ensuring that
data collection is conducted ethically; and
+ Data dissemination and utilization of evaluation fndings.
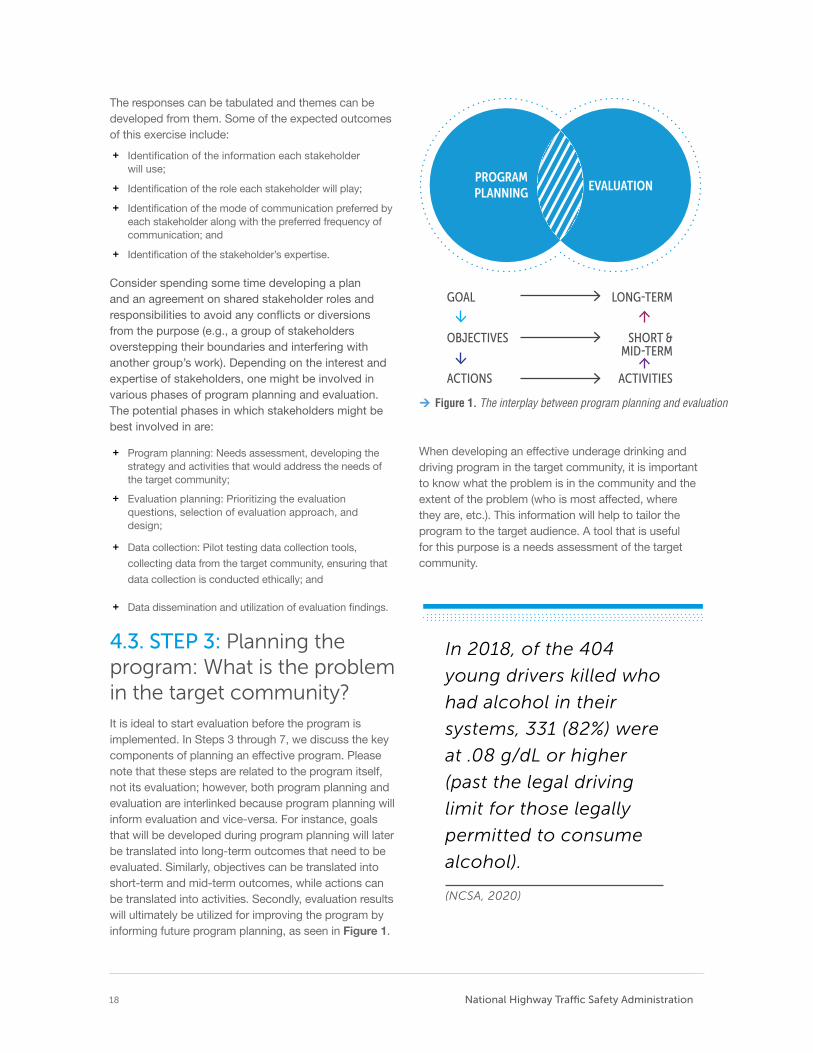
4.3. STEP 3: Planning the program: What is the problem in the target community? It is ideal to start evaluation before the program is implemented. In Steps 3 through 7, we discuss the key components of planning an effective program. Please note that these steps are related to the program itself, not its evaluation; however, both program planning and evaluation are interlinked because program planning will inform evaluation and vice-versa. For instance, goals that will be developed during program planning will later be translated into long-term outcomes that need to be evaluated. Similarly, objectives can be translated into short-term and mid-term outcomes, while actions can be translated into activities. Secondly, evaluation results will ultimately be utilized for improving the program by informing future program planning, as seen in Figure 1.
PROGRAM PLANNING EVALUATION
GOAL LONG˜TERM
OBJECTIVES SHORT & MID˜TERM
ACTIONS ACTIVITIES
Figure 1. The interplay between program planning and evaluation
When developing an effective underage drinking and driving program in the target community, it is important to know what the problem is in the community and the extent of the problem (who is most affected, where they are, etc.). This information will help to tailor the program to the target audience. A tool that is useful for this purpose is a needs assessment of the target community.
In 2018, of the 404
young drivers killed who
had alcohol in their
systems, 331 (82%) were
at .08 g/dL or higher
(past the legal driving
limit for those legally
permitted to consume
alcohol).
(NCSA, 2020)
A Primer for Evaluating Underage Drinking and Driving Programs 19
4.3.1. Needs assessment for program planning and baseline data for evaluation
Needs assessment is a good opportunity to gain deeper understanding of the problem in the target community. Assessing the contributing, predisposing, and enabling factors leading to underage drinking and driving behaviors in the target population and community is critical, as human behaviors are infuenced by one’s environment, social structure, and culture. Therefore, in order to change behaviors, effective interventions should address the target problem by including the factors that infuence underage drinking behavior, situational context, and the target community’s environment, which can be determined through a needs assessment. Needs assessment will also help to determine the community’s baseline condition, which is essential information for assessing whether the program has made any difference in the target community by comparing the changes in outcomes after the program has been implemented with those from the baseline condition before program implementation.
Furthermore, needs assessment, when done by reaching out to the target population (the stakeholders with a vested interest in the program), will provide an opportunity to build relationships with community members and other stakeholders. This will be valuable in ensuring the buy-in and development of a tailored program relevant to the target audience.
The needs assessment process could be simple or in-depth, depending on the questions to be answered and available resources, including time, money, and staff. The following are two commonly used methods for needs assessment: existing data review and cross-sectional study.
1. Existing data review – Many agencies may alreadyhave a signifcant amount of the information neededto understand the underage drinking and drivingproblem in the target community. Before consideringthe task of collecting data, review any existing data.Some potential sources for underage drinking anddriving information may include:
+ Police records
+ Vital statistics division of public health departments
+ The Census Bureau
+ Colleges and universities
+ Hospital emergency rooms
+ Youth risk behavior surveys
+ Schools
+ Motor vehicle licensing agencies
+ Highway safety agencies
2. Cross-sectional study – This strategy involves use of surveys, interviews, and focus group discussions of a selected sample of the target audience. This methodology will help in gathering data about attitudes, perceptions, local policies, and the local environment promoting underage drinking and driving in the community. As discussed earlier, this method also has the potential of providing an opportunity to develop relationships with your target audience.
USEFUL RESOURCES TO LOOK AT:
• NHTSA's Community How to Guide
on Needs Assessment & Strategic
Planning (Beer & Leonard, 2001)
• The University of Kansas
Community Tool Box (Center
for Community Health and
Development, n.d.)
4.4. STEP 4: Planning the program: Identify efective programs
Selecting the ideal program can be one of the biggest challenges. The process may include countless hours searching for programs (e.g., online), talking with colleagues, or speaking with vendors at a professional conference. A section below is designed to provide a few strategies that might help to identify effective programs for the community of interest. Two misconceptions related to selecting a program are highlighted, along with advice on how to avoid these common hurdles.
Ch
apter 4
P
lann
ing
the P
rog
ram an
d E
valuatio
n
20 National Highway Trafc Safety Administration
3REASONSsummarize why an evidence-based program is important.
Good intentions do not guarantee good results. Effective programs all begin with the good intentions of the implementers to devote time and energy to improving the health outcomes in a community. This dedication should be applauded and fostered. Yet, it takes more than passion to achieve positive results. Implementing programs with proven track records or conducting proper evaluations of new programs to be implemented will make the most of the team’s effort. This is the best way to guarantee that the hard work is rewarded with positive results.
Face validity is a start, not a solution. In psychology, face validity refers to the extent that a test subjectively measures what it is purported to measure. Simply put, any test or program should subjectively appear that it will be effective. However, one of the most dangerous things a program implementer can do is rely solely on this instinct. Program implementers should use their best judgment to select a program, but also must have the neutrality to look at the data and support for each program. Select a program that not only feels right but also has a strong research backing.
Doing something does not mean doing the right thing. Simply implementing a program does not guarantee that the program will be effective. Sometimes the most effective programs that have been implemented elsewhere may even produce the opposite effect in a different target community. Indeed, some well-intentioned programs have been shown to increase the problem behavior they were attempting to reduce. It seems logical that any program designed to produce a positive health outcome would have a positive effect, but this is not always the case. Do not pick a program just to do something.
4.4.1. Appreciating the need for evidence-based programs
Misconception 1: With my experience, I already know which programs will and will not work for my community.
The experience, commitment, and passion of program planners are the foundation of selecting an ideal program for a community. We encourage bringing in experienced perspectives (Steps 1 & 2) and assessing the specifc needs of your community (Step 3). However, these steps do not supplant the need for identifying programs with a demonstrated history of success in other communities through solid research.
The focus of this primer is on evidence-based programs. While many defnitions exist for evidence-based programs, all have similar key components. These programs have been researched using rigorous scientifc methods and have consistently and reliably demonstrated positive change in relevant outcome measures across multiple studies. This is the gold standard for identifying the programs that have proven successful, thus increasing the likelihood of achieving positive results. This primer provides information on identifying evidence-based programs and evaluating the evidence behind those programs.
4.4.2. Using expert judgment to evaluate research evidence
Misconception 2: All programs that claim to be efective are efective.
Evaluating the true effectiveness of a program is a challenge, especially for those who are not trained in program evaluation or research. Some strategies to evaluate research evidence to select a program are detailed below.
STRATEGY 1 The story behind a program does not make it efective. There is often an assumption that the people and businesses developing these programs all have their hearts in the right place. Indeed, many of the creators of popular programs related to underage alcohol consumption, drug usage, or drinking and driving care deeply about saving lives. Personal tragedies and loss have motivated many individuals to develop programs to prevent their

A Primer for Evaluating Underage Drinking and Driving Programs 21
heartache from being repeated. Remember from Misconception #1, even if someone has his or her heart in the right place that does not necessarily mean the resulting program will be effective. This is particularly true if the individuals do not have a background in program design and evaluation, or if they did not receive expert help. Appreciate the heart that went into developing a program, but do not let that replace the need for direct evidence of program effectiveness. Programs that rely on passion as evidence may not have the direct research evidence to demonstrate their effectiveness. Consider both the passion and the results when deciding which program to choose.
STRATEGY 2 Seeing the evidence to believe the evidence. Many programs will tell you that their program is evidence-based or supported by research, but they will not provide any specifc details about this evidence. Furthermore, the developers of these programs may be trying to describe their program through the best possible lens. This could be handpicking the research studies or only highlighting the most positive fndings. It should also be understood that the developers, marketers, and sellers of many of these programs are also running a business. This does not take away from good intentions or mean that these programs are not good choices. However, businesses must sell a product to survive. Just like other businesses, the developers of these programs may develop convincing advertisements and may promote an optimistic view of their program or product. Be careful to see through the marketing and examine any evidence that the program has a demonstrated effectiveness.
The frst step is to begin looking for supporting evidence for the claims made by the program. Surprisingly, programs may not even claim to have research evidence or will ignore the evaluation of their program entirely. Others will make broad, general claims, like “our program reduces drinking and driving crashes by 74%.” Be skeptical of any program that does not provide specifcs on how these numbers were calculated. Look for the methods for how these numbers were generated. If specifc methods are missing, then there is probably a reason to not believe their claims.
If claims are made about the effectiveness of the program, pay careful attention to how effectiveness was assessed, who performed the evaluation, and where the results were published. If the outcome is self-reported (as opposed to objective data such as reductions in crashes) or has “client satisfaction” as the only outcome, be skeptical. For example, it is not paramount if the participants, teachers, or students “liked” the program. What is important is evidence of the program’s impact; that is, did the program produce the desired health outcomes? Since it is diffcult for a program to provide unbiased research into its own effectiveness, try to fnd programs that were evaluated by external researchers or frms. Finally, consider if the research evidence supporting the program was published in a peer-reviewed journal or by a government entity. Give more weight to programs that were published following a peer review, which indicates that the methods and results of the research in question were evaluated by other experts in the feld.
Specifc warning signs that a program may merit more research are:
+ There is no mention of any evaluation efforts or data tosupport the effectiveness of the program.
+ The program relies entirely upon testimonials to supportthe program.
+ No external evaluation has been performed or theprogram only discusses its internal results.
+ “Client satisfaction” or other subjective measures wereused as the primary evaluation metric.
+ Claims are made regarding the effectiveness of theprogram, but it is unclear how these data were generatedor where the statistics were taken from.
+ The program has not yet been implemented and doesnot have any previous clients.
+ There are broad claims of success or the programappears too good to be true.
4.4.3. Identifying efective programs
Even practitioners with years of experience may have trouble identifying the newest programs or smaller programs that have not received signifcant public attention. This section offers information on how to initiate a search for the best program. All the sections below highlight important ways to identify programs. It is best to use multiple methods and identify the largest number of relevant programs available.
Ch
apter 4
P
lann
ing
the P
rog
ram an
d E
valuatio
n
22 National Highway Trafc Safety Administration
Existing resources
There are many reports, documents, and guides that may help you fnd existing programs. A few useful resources include the following:
+ Countermeasures That Work: A Highway Safety
Countermeasure Guide for State Highway Safety Offces,
Ninth Edition, 2017 (Richard et al., 2018).
+ Drinking and Driving – A Road Safety Manual for
Decision-Makers and Practitioners (Cairney et al., 2007).
+ Smith, Baker, Downing, & Klauer (in press). Effectiveunderage drinking countermeasures that reduce crashes:Literature review. National Highway Traffc SafetyAdministration.
+ Community How to Guide on Underage Drinking
Prevention (Beer & Leonard, 2001).
Internet searching
Many relevant programs are developing a stronger online presence. Entering simple keywords into a search engine can result in dozens of potential programs. Please be mindful that there are two different ways to do online searches. The frst method is broad and non-academic. This includes simply identifying programs, perusing their material, and perhaps fnding other indirect sources that describe a program. This is highly useful, but targeted searches to fnd evidence on the programs that emerge during the initial search may also be needed.
The second method of searching is academic. Specifcally, this method involves targeting the academic, scientifc, and peer-reviewed literature. Instead of entering keywords into a basic search engine, an academic database, such as Web of Science or "Google Scholar," is recommended. Depending on institutional resources, it may be challenging to gain access to some of this academic literature since access to the original article will most likely require permissions and may not be free. In this case, a library may be able to request copies of articles or you may be able to gain access by partnering with an academic institution or contacting the author or researcher for more information.
Survey colleagues
Colleagues in your feld may be implementing similar types of programs in their communities and they may be valuable resources in fnding effective programs. Learn from their experiences. Collect the names of programs, listen to their thoughts and experiences, and independently seek out evidence for the effectiveness of these programs.
Contact experts in the area
Through conferences, professional gatherings, colleagues, or the Internet, there are many opportunities to identify experts in your program area. Experts may have backgrounds or experiences that make them an insightful contact. Experts could include program implementers, community leaders, university researchers or professors, program evaluators, or even the companies who designed a program or product. Do not feel reluctant to reach out to these experts. Many of these individuals will be pleased and happy to know someone is interested in their experience. Again, remember to independently seek out evidence supporting any programs that may emerge from this process.
Develop a new program
Even after conducting research into possible programs and evaluating the evidence supporting each one, it is possible that no programs adequately meet your specifc needs. In these circumstances, it may be preferable to develop a unique program. Please keep a few things in mind when deciding to take this route. By defnition, a new program will not have been evaluated, which will make it challenging to truly predict its effectiveness. It may be worth renewing efforts to identify programs or offering to provide an evaluation of an existing program.
If developing a new program, be extra vigilant in following the steps outlined in this primer. It will be important to build a broad base of partners that will be able to aid the development, implementation, evaluation, and documentation of the program. These efforts may not only improve your community, but could potentially be implemented in other communities. The ability of this program to serve as a model for other communities will rely heavily on conducting a proper evaluation.
A Primer for Evaluating Underage Drinking and Driving Programs 23
4.5. STEP 5: Planning the program: Tailor the program to ft target community needs and population
One size does not ft all. It is not advisable to simply replicate a program conducted somewhere else. Instead, consider how the individuals and the community affected by the intervention are unique, and create an intervention program that best suits the target population. Needs assessment and engaging stakeholders will help in tailoring the program to its target audience. This is crucial for making an impact, ensuring a successful implementation, and gaining community acceptance.
In addition to tailoring the program to the target audience, developing a program that incorporates multiple strategies affecting multiple social-ecological levels (e.g., individual, interpersonal, community, and population) is critical to changing youth behaviors. One model that is well studied and evaluated in the public health community is the socio-ecological model (Appendix A).
4.6. STEP 6: Planning your program: Develop the strategy The elements of program strategy include:
+ Mission + Indictors/measures
+ Vision + Activities
+ Goals + Outputs
+ Objectives + Resources/inputs
+ Outcomes + Context
This step will help in fguring out some of the important questions, such as the reason for developing the program, and what the program is expected to achieve. Additionally, the elements of the strategy will also inform the evaluation of a program, as depicted earlier in Figure 1. Strategy development is best done by engaging thecore team and stakeholders. This is not a trivial activity.
“Many research-based programs are being implemented for populations for whom they were never intended, and for whom research has not proven their efectiveness. For instance, a universal drug prevention program, such as the Life Skills Training program, should be implemented with whole classrooms and not with drug-addicted youth for whom the program has not been tested. The prevention elements of this program may not be efective with youth involved in drugs.”
Source: Successful Program Implementation: Lessons From Blueprints (Mihalic et al., 2004)
While it may be challenging, it is ultimately worthwhile, as it will enhance the commitment of the team and help secure the support of the target population.
4.6.1. What is the mission?
The mission is the purpose of the program. Developing the mission statement helps ensure development of effective goals and activities.
Consider these questions when developing a mission statement (Source: FEMA, 2013, p. 5):
+ Why does this program exist?
+ How will this program beneft my organization?
+ How will this program beneft the public?
+ How will this program beneft the young people whoparticipate in it?
4.6.2. What is the vision?
The vision frames the long-term aspirations for the program, for example, its intended accomplishments in 5 years.
Consider these questions when developing a vision statement (Source: FEMA, 2013, p. 6):
Ch
apter 4
P
lann
ing
the P
rog
ram an
d E
valuatio
n
24 National Highway Trafc Safety Administration
+ What will the program be doing in fve years?
+ What will the program accomplish?
+ What impact will the program make on the community?
4.6.3. What are the goals?
Goals are like milestones and are the result of mission and vision statements. In other words, they are the aims of the program. Develop goals that are realistic, broad, and that clearly refect what the program hopes to achieve. Goals may evolve over time, and thus it is important to develop both short-term and long-term goals.
Examples: + Increased commitment among teens, parents, and
community to reducing alcohol access and use amongteens.
+ Increased enforcement of sobriety checks.
+ Increased awareness of GDL laws.
4.6.4. What are the objectives?
Program objectives state the expected results and the steps to reach them. Developing specifc and measurable objectives helps to ensure the effcient use of funds and resources. One useful strategy is to use SMART (Specifc, Measurable, Achievable, Realistic, Time bound) objectives, as follows.
+ Specifc: related to one result.- “What exactly are we going to do, and with
or for whom?”
+ Measurable: guide developing data collection forevaluation.
- “Is it measurable, can WE measure it, and how?”
+ Achievable: attainable expectations.- “Can we get to the desired results?”
+ Realistic: executable and achievable withavailable resources.- “Can we get it done in the proposed time frame with
our existing resources and context?”
+ Time bound: specifc to a given time frame- “When will we accomplish this objective?”
Example: One year after initiation of the program, rates of underage drinking and driving among high school students in the school district will be reduced by 30%.
The majority of program planning and evaluation primers suggest developing a statement like the one above (Bjerke & Renger, 2017), which is sometimes considered one item off the list of things to do for
planning and evaluating program; however, will developing such a statement be suffcient as a SMART objective— is it really SMART? For instance, if baseline measurements in the community are missing, the above statement of achieving a 30% reduction in underage drinking and driving rates in one year does not make any sense, and secondly, is a reduction of that magnitude achievable in one year? Bjerke and Renger suggested a step approach where the team should frst develop a specifc, measurable, and realistic objective. After collecting the baseline data, the achievable and timely component of the objective can be developed. The idea is that collecting baseline data would inform the program planner whether the objective can be achieved, and if so, what would be the appropriate timeframe for reaching that objective? Thus, this step approach will help in developing objectives that are indeed SMART.
4.6.5. What are the outcomes?
The outcomes are the desired benefts resulting from the program. The outcomes can take on several forms depending on the levels at which they are collected: long-term, intermediate, short-term, and distal or proximal to the program. Another way to look at this is as the presence of a “potential hierarchy of effects” (Rockwell & Bennett, 2004). The central hypothesis is that participation in a program (number of participants reached, their characteristics, etc.) will create reactions to the program (e.g., feelings, interest, and acceptance of the program countermeasures). These reactions will lead to learning (i.e., knowledge, opinions, skills, and aspirations). Later actions (behaviors) will result from learning, which will further lead to changes at the system and environmental level, and thus lead to long-term health outcomes in the target community (see Figure 2).
Evaluation experts recommend collecting outcome data at several levels of the hierarchy to improve the quality of evaluation. Furthermore, data on outcomes at lower levels help in explaining changes seen in outcomes at higher levels (CDC, 2011a).
4.6.6. What are the indicators or measures?
Once the objectives and outcomes are clearly stated, the next step is to fgure out indicators or measures. Indicators are statements that defne exactly what is desired; they are specifc, observable, and measurable, such as crash rates.
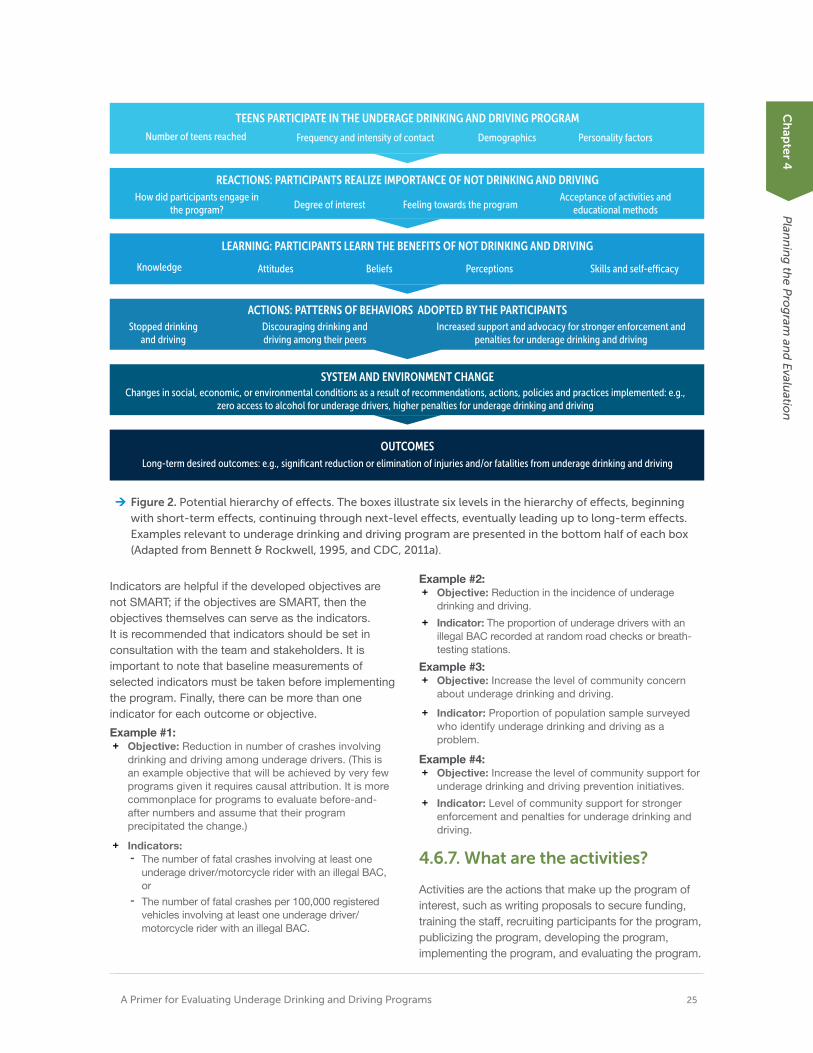
A Primer for Evaluating Underage Drinking and Driving Programs 25
TEENS PARTICIPATE IN THE UNDERAGE DRINKING AND DRIVING PROGRAM
Number of teens reached Frequency and intensity of contact Demographics Personality factors
REACTIONS: PARTICIPANTS REALIZE IMPORTANCE OF NOT DRINKING AND DRIVING How did participants engage in Acceptance of activities and
Degree of interest Feeling towards the program the program? educational methods
LEARNING: PARTICIPANTS LEARN THE BENEFITS OF NOT DRINKING AND DRIVING
Knowledge Attitudes Beliefs Perceptions Skills and self-e⁄cacy
ACTIONS: PATTERNS OF BEHAVIORS ADOPTED BY THE PARTICIPANTS Stopped drinking
and driving Discouraging drinking and driving among their peers
Increased support and advocacy for stronger enforcement and penalties for underage drinking and driving
SYSTEM AND ENVIRONMENT CHANGE Changes in social, economic, or environmental conditions as a result of recommendations, actions, policies and practices implemented: e.g.,
zero access to alcohol for underage drivers, higher penalties for underage drinking and driving
Ch
apter 4
P
lann
ing
the P
rog
ram an
d E
valuatio
n
OUTCOMES Long-term desired outcomes: e.g., significant reduction or elimination of injuries and/or fatalities from underage drinking and driving
Figure 2. Potential hierarchy of efects. The boxes illustrate six levels in the hierarchy of efects, beginningwith short-term efects, continuing through next-level efects, eventually leading up to long-term efects.Examples relevant to underage drinking and driving program are presented in the bottom half of each box(Adapted from Bennett & Rockwell, 1995, and CDC, 2011a).
Indicators are helpful if the developed objectives are not SMART; if the objectives are SMART, then the objectives themselves can serve as the indicators. It is recommended that indicators should be set in consultation with the team and stakeholders. It is important to note that baseline measurements of selected indicators must be taken before implementing the program. Finally, there can be more than one indicator for each outcome or objective.
Example #1: + Objective: Reduction in number of crashes involving
drinking and driving among underage drivers. (This isan example objective that will be achieved by very fewprograms given it requires causal attribution. It is morecommonplace for programs to evaluate before-and-after numbers and assume that their programprecipitated the change.)
+ Indicators:- The number of fatal crashes involving at least one
underage driver/motorcycle rider with an illegal BAC,or
- The number of fatal crashes per 100,000 registeredvehicles involving at least one underage driver/motorcycle rider with an illegal BAC.
Example #2: + Objective: Reduction in the incidence of underage
drinking and driving.
+ Indicator: The proportion of underage drivers with anillegal BAC recorded at random road checks or breath-testing stations.
Example #3: + Objective: Increase the level of community concern
about underage drinking and driving.
+ Indicator: Proportion of population sample surveyedwho identify underage drinking and driving as aproblem.
Example #4: + Objective: Increase the level of community support for
underage drinking and driving prevention initiatives.
+ Indicator: Level of community support for strongerenforcement and penalties for underage drinking anddriving.
4.6.7. What are the activities?
Activities are the actions that make up the program of interest, such as writing proposals to secure funding, training the staff, recruiting participants for the program, publicizing the program, developing the program, implementing the program, and evaluating the program.

26 National Highway Trafc Safety Administration
4.6.8. What are the outputs? Outputs are the direct results of activities, such as funds procured, number of staff members trained, and number of participants recruited.
4.6.9. What are the resources/ inputs?
Resources/inputs are the resources needed for developing and implementing the program, including the people, funding, and data needed.
4.6.10. What is the context?
The context of the program is the larger environment in which the program will be implemented. Some of the contextual factors include politics, history of the program, support for the program, social and economic conditions of the agency involved, and the target community. Essentially, these are the external factors that may infuence the program and evaluation. It is wise to be aware of them.
From the perspective of program evaluation, understanding the context will provide signifcant direction for interpreting the evaluation results. Secondly, knowing the context also helps when assessing whether a program can be transferred to other settings or geographic locations. When considering transferring a program, it is essential to compare the original context of the program with that of the proposed location.
4.7. Step 7: Develop a logic model
A logic model is a useful tool for program implementation and evaluation. + It conceptualizes the utilization of resources (inputs)
into activities and outputs, and then further intooutcomes (short-, medium-, and long-term), all ofwhich include the environmental context of the targetcommunity. Thus, a logic model highlights therelationships between resources, activities, and desiredoutcomes (see Figure 3 right).
+ It ties the elements of program strategy together andlater connects the program planning with evaluation.For instance, the outcomes that are desired and/orplanned during the program planning are the measuresto be assessed during the evaluation (See Figure 1).
INPUTS
ACTIVITIES
OUTPUTS
OUTCOMES
MEDIUM LONG SHORT
Figure 3. Basic framework of a typical logic model
A brief depiction of components of logic model:
1. Inputs: these are the resources, and/orinvestments made for developing the program;e.g., activities, funding, etc.
2. Activities: these are actual initiatives chosen forimplementation to address the issue at hand.
3. Outputs: as discussed earlier, these are tangibleproducts of implementing the activities such asnumber of participants, number of staff trained,etc.
4. Outcomes: these are the desired end results.
“A logic model is a systematic and visual way to present and share your understanding of the relationships among the resources you have to operate your program, the activities you plan, and the changes or results you hope to achieve.”
(W.K. Kellogg Foundation, 2004)
A Primer for Evaluating Underage Drinking and Driving Programs 27
Logic models can take several forms built on the components of the basic framework shown in Figure 3. The University of Wisconsin-Extension’s EducationalProgram Development and Evaluation (Taylor-Powell,1998) resource provides a wealth of logic modeltemplates and examples, and instructions to consultwhen developing a logic model for your program.These templates and examples provide additional
information and context as to how one can leverage the above basic framework to develop an appropriate logic model for your program. For a relevant example, see the Reducing Under Age Drinking - Logic Model (Lisowski, 2009) that was developed for Buffalo County, Wisconsin.
Exercise 3: Developing a logic model
To better illustrate the method of developing a logic model, this step-by-step exercise outlines the best practices for developing a logic model.
Step 1: Assemble the team for a logic model development meeting. Logic model development is best done as a team-based activity. This will facilitate team member cohesion and will also garner buy-in and organizational commitment.
Step 2: Distribute key information about the program ahead of the meeting. Not everyone will have a complete understanding of the program, so it is good practice to circulate important documents. This will ensure that everyone is on the same page and can better contribute to the logic model’s development. These documents include program strategy, mission, vision, goals, objectives, outputs, outcomes and activities, needs assessment fndings if any, etc.
Consider developing a note taking plan. This is an activity that is often neglected. Approach a member or members of the group in advance of the meeting and develop a note taking plan. Determine and write out the timeline for completing the logic model development activity based on your organizational setup, resources, and team. This could be a few hours, a full day, or a series of meetings over a longer time frame.
Step 3: As a team, begin the task of creating the logic model.
Discuss and write down the elements of the logic model (inputs, activities, outputs, and outcomes), using the basic logic model shown in Figure 3 as an example. These elements were discussed earlier in Step 6.
One easy method would be to simply use the elements developed in Step 6. If this is not a viable option, then working backward from outcomes by asking “how to” will help to identify the elements of the logic model. A third option for identifying the elements is working forward from activities by asking “So then what happens?” (taken from CDC, 2011a, p. 27).+ Inputs (Resources):
» Make a list of program resources, includingfnancial and non-fnancial. Utilize mission, vision,and strategy documents to carve out theresources. If these are not developed, considerdoing it now.
+ Activities:
» Answer the question, “What do we do with theavailable resources?”
» List all of the program’s events, actions, andservices.
» Consider developing activities that align with theprogram’s goals.
» Work with the team to identify:
- Any current activities that are not in line withprogram goals
- Additional activities necessary to reach goalsand objectives that are not currently plannedor being provided by the program
+ Outputs:
» Outputs are direct results of the activities andtherefore link activities to the target population.
» Example: Number of participants in attendance.
+ Outcomes:
» Outcomes are the measurable changes that aredesired from implementing the activities.
» There are short-term, intermediate, and long-term outcomes, which are expected to beattainable at different times.
- For example, short-term outcomes could be
Ch
apter 4
P
lann
ing
the P
rog
ram an
d E
valuatio
n
28 National Highway Trafc Safety Administration
those related to behavior changes that are attainable 1–3 years post program implementation.
- Long-term outcomes encompass factorsrelated to societal, economic, civic, andenvironmental changes that may take moretime (e.g., ~5 years). Changes in fatalities andinjuries from underage drinking and driving thatmay have occurred due to programimplementation are examples of long-termoutcomes.
- Please note that the stated timelines are justexamples, and will likely differ based uponhow and what outcomes will result from theprogram’s activities and interventions.
+ Make note of the assumptions made for achievingthe program’s goals.
+ Develop measures/indicators for outcomes.
» Developing objective measures is advisable.These are determined by the aim of theevaluation, the evaluation approach used,resources available, and requirements of thestakeholders.
» Consider the following checklist to ensure thatindicators are developed appropriately (adaptedfrom Project STAR, 2006).
- Are the indicators specifc and measurable?- Are the indicators in line with desired results?- Are the indicators reliable sources of success?
» Examples:
- Injury and death rates- Drinking and driving rates- BAC levels- Changes in attitudes
Step 4: Finalize the logic model.
Before wrapping up the activity, there are few items to note:
(a) Is the logic model as detailed or as broad asdesired? Logic models can be broad or specifcas needed, which depends on the purpose ofthe logic model. For instance, sponsors may bemore interested in broad logic models. while staffmembers might like to see a very detailed logicmodel; and(b) Clean and develop the fnal logical model.
4.8. Step 8: Planning the evaluation: Develop the strategy
In the previous step, we discussed developing a strategy for the program and a logic model that connects the resources to the desired outputs from the program. This step moves on to developing a strategy for evaluating the program. Program evaluation strategy elements include purpose, evaluation questions, and evaluation design.
4.8.1. Purpose: Why evaluate?
Determining the purpose of the evaluation will inform stakeholder identifcation, the questions to be addressed during evaluation, the evaluation approach, the methods of data collection, and dissemination of evaluation results.
Generally, the purpose of evaluation falls into four primary categories:
+ Accountability: Evaluation of the program will help to
determine if the program objectives were reached. This
information will help in deciding whether it is best to
continue the program or not.
+ Program Improvement: Evaluation of the program in
most cases is done to understand the program’s
strengths and weaknesses, whether the funds were
utilized effectively to reach the goals of the program, and
why or why not. These insights will help to improve the
program further, either by process or strategy
modifcations.
+ Effectiveness: Did the program achieve changes in the
behaviors of interest? Did it sustain the changes in the
behavior?
+ Evidence for Impact: For this purpose, the evaluation
will examine whether the program made an impact in the
target community.
Determining the purpose of the evaluation informs important decisions such as choosing stakeholders, choosing evaluation questions, and deciding when to implement the evaluation.
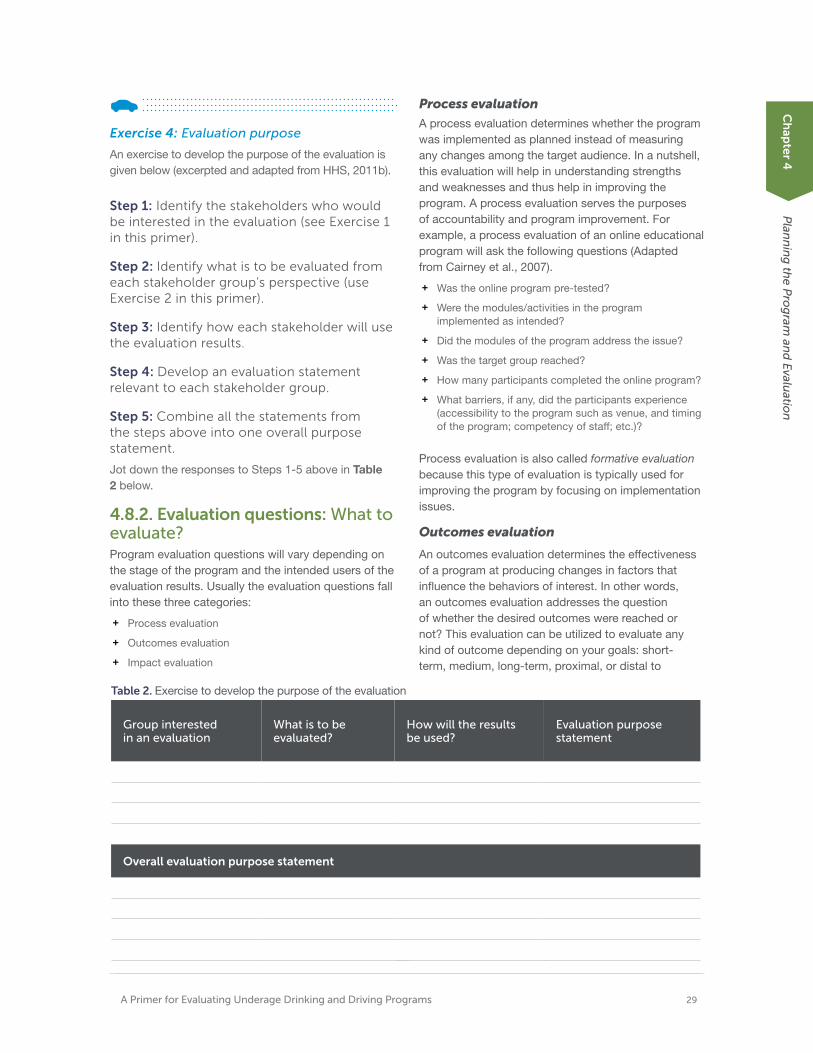
A Primer for Evaluating Underage Drinking and Driving Programs 29
Exercise 4: Evaluation purpose
An exercise to develop the purpose of the evaluation is given below (excerpted and adapted from HHS, 2011b).
Step 1: Identify the stakeholders who would be interested in the evaluation (see Exercise 1 in this primer).
Step 2: Identify what is to be evaluated from each stakeholder group’s perspective (use Exercise 2 in this primer).
Step 3: Identify how each stakeholder will use the evaluation results.
Step 4: Develop an evaluation statement relevant to each stakeholder group.
Step 5: Combine all the statements from the steps above into one overall purpose statement.
Jot down the responses to Steps 1-5 above in Table 2 below.
4.8.2. Evaluation questions: What to evaluate? Program evaluation questions will vary depending on the stage of the program and the intended users of the evaluation results. Usually the evaluation questions fall into these three categories:
+ Process evaluation
+ Outcomes evaluation
+ Impact evaluation
Table 2. Exercise to develop the purpose of the evaluation
Process evaluation
A process evaluation determines whether the program was implemented as planned instead of measuring any changes among the target audience. In a nutshell, this evaluation will help in understanding strengths and weaknesses and thus help in improving the program. A process evaluation serves the purposes of accountability and program improvement. For example, a process evaluation of an online educational program will ask the following questions (Adapted from Cairney et al., 2007).
+ Was the online program pre-tested?
+ Were the modules/activities in the programimplemented as intended?
+ Did the modules of the program address the issue?
+ Was the target group reached?
+ How many participants completed the online program?
+ What barriers, if any, did the participants experience(accessibility to the program such as venue, and timingof the program; competency of staff; etc.)?
Process evaluation is also called formative evaluation because this type of evaluation is typically used for improving the program by focusing on implementation issues.
Outcomes evaluation
An outcomes evaluation determines the effectiveness of a program at producing changes in factors that infuence the behaviors of interest. In other words, an outcomes evaluation addresses the question of whether the desired outcomes were reached or not? This evaluation can be utilized to evaluate any kind of outcome depending on your goals: short-term, medium, long-term, proximal, or distal to
Ch
apter 4
P
lann
ing
the P
rog
ram an
d E
valuatio
n
Group interested What is to be How will the results Evaluation purpose in an evaluation evaluated? be used? statement
Overall evaluation purpose statement
the intervention. Depending on the purpose of the evaluation, outcomes evaluation will examine changes in any, all, or some of the following outcomes.
+ Knowledge, attitudes, intrinsic motivation to drinkand drive
+ Perceived risk or protective behaviors
+ Access to alcohol, local laws, availability of alcoholalternatives, etc.
+ Any unintended consequences (e.g., have participantsadopted any attitudes favoring drinking and driving?)
Typically, the outcome measures collect evidence for change in the lower end of the “potential hierarchy of effects” shown in Figure 2, which includes the reactions, learning, and actions. The impact evaluation discussed below evaluates changes in system and environment and health outcomes (e.g., injury and fatality rates from motor vehicle crashes due to underage drinking and driving).
Impact evaluation Impact evaluation provides evidence for whether the program worked and made a difference. Establishing causal attribution is necessary (i.e., the changes in outcomes can be attributed to the program). Causal attributions are the gold standard, and few programs can defnitively claim that their program achieved its desired impact. The next step provides more detail on evaluation designs and approaches for establishing causality or causal attribution. Impact evaluation also provides proof of concept and is helpful in scaling the program to other regions.
+ Did the program make any difference in the targetcommunity?
+ Was there a reduction in the number of underagedrivers who drink and drive that can be related toimplementing the program of interest?
+ Was there a reduction in road crashes involvingunderage drinking and driving that can be related toimplementing the program of interest?
+ Are there any unintended consequences that can be
related to implementing the program of interest (e.g., did
teens mention more drinking and driving after attending
the program of interest)?
Finally, based on the available resources, purpose, and goals of the evaluation, along with input from stakeholders, prioritize the evaluation questions. Rank them and then develop a time frame for each question. In other words, include in the plan when to conduct the evaluation and how long the evaluation should take to complete. Table 3 is provided as a tool for this purpose.
Table 3. Evaluation questions and time frame
Evaluation questions for the current evaluation are:
Time frame
30 National Highway Trafc Safety Administration
"These study designs are helpful to understand if a program is being implemented as intended, assess participant reception of the program, and observe and track program outputs, activities, and services."
4.8.3. Evaluation design: How to evaluate?
Evaluation design offers a plan for how to evaluate the program of interest by answering evaluation questions. Please note that evaluation design is different from the data collection method, which is described in the next chapter.
There are three types of designs to choose from: (1) descriptive; (2) experimental; and (3) quasi-experimental.
Figure 4 and Figure 5 can be used to identify a design that will ft the program evaluation purpose and answer the evaluation questions. The frst fgure helps to choose among the three types of studies, and the second fgure further refnes the choice between experimental and quasi-experimental.
Considering the following questions may also help to determine a study design (excerpted and adapted from Pell Institute, 2017a):
+ Which design will provide the desired/neededinformation?
+ How feasible is each option?
+ How valid and reliable do the fndings need to be?
+ Are there any ethical concerns related to choosing aspecifc design?
+ How much would each option cost?
Based on the answers to these questions, choose either one or a combination of the study designs— descriptive, experimental, or quasi-experimental— each of which is described in more detail below.
Pre-experimental or descriptive studies
As the term “pre-experimental” suggests, pre-experimental, or descriptive studies, are typically used for exploratory purposes. In-depth descriptions of participant and/or program characteristics are collected with the main goal of providing context and understanding the underlying reasons for any change or patterns. This is also called a qualitative study design because of the type of data being collected, which is typically non-numerical data in the form of opinions, attitudes, beliefs, etc. Sometimes these study designs provide pilot data for experimental and quasi-experimental study designs.
These study designs are helpful to understand if a program is being implemented as intended, assess participant reception of the program, and observe and track program outputs, activities, and services.
Data collection methods to capture the experiences and perspectives of participants typically include surveys/polls, focus groups, interviews, and observations (see Chapter 5 for more details).
In this study design, a representative sample of participants is selected. Sometimes a comparison group is also selected. Statistical analyses can be performed to understand the attributes of participants,
31 A Primer for Evaluating Underage Drinking and Driving Programs
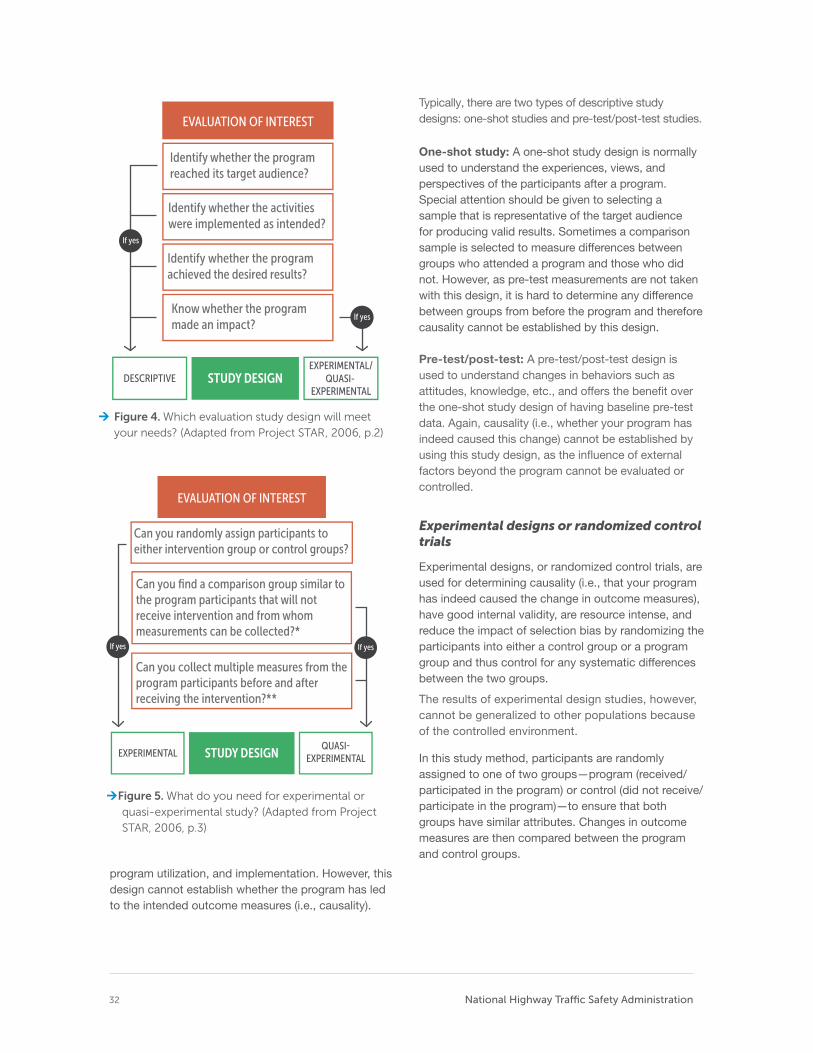
32 National Highway Trafc Safety Administration
Identify whether the program reached its target audience?
Identify whether the activities were implemented as intended?
Identify whether the program achieved the desired results?
Know whether the program made an impact?
EVALUATION OF INTEREST
DESCRIPTIVE STUDY DESIGN EXPERIMENTAL/
EXPERIMENTAL QUASI-
Figure 4. Which evaluation study design will meet
your needs? (Adapted from Project STAR, 2006, p.2)
Can you randomly assign participants to either intervention group or control groups?
Can you find a comparison group similar to the program participants that will not receive intervention and from whom measurements can be collected?*
Can you collect multiple measures from the program participants before and after receiving the intervention?**
EVALUATION OF INTEREST
EXPERIMENTAL STUDY DESIGN EXPERIMENTAL
Figure 5. What do you need for experimental or
quasi-experimental study? (Adapted from Project
STAR, 2006, p.3)
program utilization, and implementation. However, this design cannot establish whether the program has led to the intended outcome measures (i.e., causality).
Typically, there are two types of descriptive study designs: one-shot studies and pre-test/post-test studies.
One-shot study: A one-shot study design is normally used to understand the experiences, views, and perspectives of the participants after a program. Special attention should be given to selecting a sample that is representative of the target audience for producing valid results. Sometimes a comparison sample is selected to measure differences between groups who attended a program and those who did not. However, as pre-test measurements are not taken with this design, it is hard to determine any difference between groups from before the program and therefore causality cannot be established by this design.
Pre-test/post-test: A pre-test/post-test design is used to understand changes in behaviors such as attitudes, knowledge, etc., and offers the beneft over the one-shot study design of having baseline pre-test data. Again, causality (i.e., whether your program has indeed caused this change) cannot be established by using this study design, as the infuence of external factors beyond the program cannot be evaluated or controlled.
Experimental designs or randomized control trials
Experimental designs, or randomized control trials, are used for determining causality (i.e., that your program has indeed caused the change in outcome measures), have good internal validity, are resource intense, and reduce the impact of selection bias by randomizing the participants into either a control group or a program group and thus control for any systematic differences between the two groups.
The results of experimental design studies, however, cannot be generalized to other populations because of the controlled environment.
In this study method, participants are randomly assigned to one of two groups—program (received/ participated in the program) or control (did not receive/ participate in the program)—to ensure that both groups have similar attributes. Changes in outcome measures are then compared between the program and control groups.
A Primer for Evaluating Underage Drinking and Driving Programs 33
Although this design is considered to be the gold standard, it may not be feasible to identify a control group. Moreover, ethical issues may be raised by denying intervention to a group of participants.
Typically, there are two types of experimental study design: pre-test–post-test control group design and post-test only control group design.
Pre-test–post-test control group design: In this design, participants are randomly assigned to either the program or control group. Measurements of both groups are taken twice: once before implementing the program and once after. To establish causality, the characteristics of both groups must be similar at the pre-test phase.
Post-test only control group design: Similar to the pre-test–post-test design, participants are randomly assigned to either the program or control groups. However, the measurements of both groups will be taken only once at the same time after the implementation of the program. Because a pre-test measurement is not taken, it is diffcult to determine if the difference in the post-test is an actual change resulting from the program.
Quasi-experimental designs
Quasi-experimental designs are more feasible than a randomized control trial and do not require a control group or randomization. However, it is important to select an appropriate comparison group. An appropriate comparison group means a group of participants who are similar to the treatment group, especially with regards to factors which could impact the outcome measures of interest. This similarity in terms of key factors cannot be assumed. Instead, collect data on key factors of both groups that can be assessed through statistical analysis to verify that the groups are similar.
Typically, there are two types of quasi-experimental study designs: non-equivalent before-after design and time series design.
Non-equivalent before-after design: If resources are available to secure an appropriate comparison group, this design can be used to compare the outcome measures (e.g., rates of drinking and driving) between the program and comparison groups both before and after the program. As the participants are not
randomly assigned, it is diffcult to ascertain if any differences are due to the program. Make sure to note all non-equivalent attributes of both groups in order to address any selection bias.
Time series design: If a suitable comparison group cannot be found, consider conducting a time series study where outcomes are measured at various points in time before and after the intervention to assess changes in the pattern of outcome measures. Note that this study design will not be able to establish causality and is not robust against time-related factors.
Ascertaining causal attribution
Ascertaining causality is not an easy task and is often done incorrectly. Hence, we provide a brief description about this concept.
Causal attribution (or causal inference or causal contribution) means there is causal link between the changes in the outcomes observed and the program (Development Assistance Committee Working Party on Aid Evaluation, 2010). Before considering the strategies or approaches to confrm causality, it is useful to understand three concepts related to causality (excerpted and adapted from Rogers, 2014).
1. Sole causal attribution: As the name indicates, thismeans the program is suffcient to produce desiredchanges in the outcomes without any infuence ofexternal factors. This is rarely possible.
2. Joint causal attribution: This concept indicatesthat desired changes in the outcomes are onlypossible due to implementing the program ofinterest in an environment that supports theprogram of interest, be it political context, anothercomplementary program, skill level of instructors, orcharacteristics of participants. If any of the favorableconditions or complementary program or factors areabsent, the impact would be minimal or nonexistent.This is a common situation, and collecting dataon the conditions and factors that are jointlycontributing improves the quality of evaluation andinterpretation of the evaluation results. Furthermore,knowing about the environmental conditions alsohelps in fguring out what needs to be done whenscaling the program of interest to another locationor community.
3. Alternative (multiple) causal paths: This conceptindicates that desired changes in the outcomes
Ch
apter 4
P
lann
ing
the P
rog
ram an
d E
valuatio
n

34 National Highway Trafc Safety Administration
are possible due to other programs or external factors not related to the program of interest, such as policy, increased enforcement, law change, etc. For instance, in a community there could be several programs trying to reduce or prevent underage drinking and driving: a few through peer-to-peer programs, a few by high-visibility enforcement campaigns, etc.
Typically, three approaches are undertaken for determining the causality.
Counterfactual approach: Causality is attributed by comparing estimates between situations where an underage drinking and driving program is absent with situations when or where the program is present. Therefore, it is necessary to include either a control group (randomized control trials) or comparison group (quasi-experimental designs) that did not receive any intervention. In cases where it is not possible to recruit participants that did not receive any intervention, it is important to collect data on whether the control or comparison groups participated in any alternate programs before or during the program implementation. This information will have implications on the evaluation results regarding attributing causality. Sometimes advanced statistical models, such as regression analysis, are used to estimate what would have happened in the absence of the program of interest.
Consistency of evidence with causal relationship: The evidence or patterns for causal attribution will be identifed frst and then data collection and data analysis will be used for either confrming or disconfrming the evidence. Logic models as described in Chapter 4 will be helpful in identifying the patterns or evidence for ascertaining the causality (e.g., the achievement of intermediate outcomes identifed through the logic model). Other techniques include checking results against predictions, comparative case study analysis, dose-response patterns, timing of impacts, and analysis of testable hypotheses (where a theory is developed about what works for whom in what circumstances, in what respects, and how, which is then tested against the evidence).
Eliminating alternatives: Although this approach is mentioned in this section on causal attribution, it is most useful when evidence suggesting correlation but not causality exists. As the name indicates, alternative explanations are identifed frst and data gathered and analyzed later to seek evidence to eliminate the alternative attribution pathways.
4.9. STEP 9: Choose the indicators or outcomes measures to evaluate Outcome measures to evaluate follow from the evaluation purpose, evaluation questions, and evaluation design chosen. Typically, the measures fall into two categories: (1) injury and fatality outcomes, and (2) drinking and driving rates. Choose the indicators that will most likely answer the evaluation questions by consulting your stakeholders. Depending on the activities of the program and the evaluation purpose, it is wise to collect data on intermediate measures such as changes in attitudes, perceptions, and other factors that are known to infuence underage drinking and driving.
4.10. STEP 10: Figure out the stage of development or maturation of program The stage of the program infuences the evaluation, particularly what to evaluate, because what the evaluation can answer depends on the program’s maturity. If the evaluation is focused on process evaluation, then the evaluation must wait until the program is implemented. Furthermore, stakeholders need to know the program’s stage of development or maturity so that they will have an idea of whether an evaluation question can be answered at the time of implementing the evaluation.
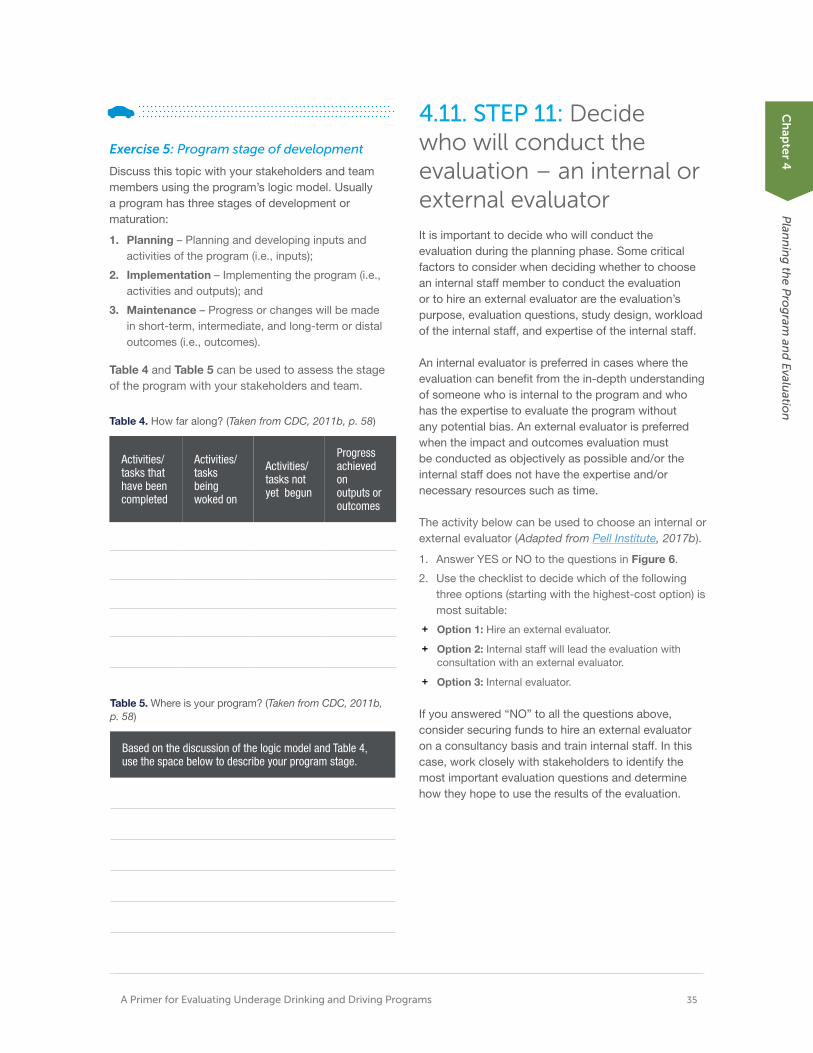
A Primer for Evaluating Underage Drinking and Driving Programs 35
Exercise 5: Program stage of development
Discuss this topic with your stakeholders and team members using the program’s logic model. Usually a program has three stages of development or maturation:
1. Planning – Planning and developing inputs andactivities of the program (i.e., inputs);
2. Implementation – Implementing the program (i.e.,activities and outputs); and
3. Maintenance – Progress or changes will be madein short-term, intermediate, and long-term or distaloutcomes (i.e., outcomes).
Table 4 and Table 5 can be used to assess the stage of the program with your stakeholders and team.
Table 4. How far along? (Taken from CDC, 2011b, p. 58)
Activities/ tasks that have been completed
Activities/ tasks being woked on
Activities/ tasks not yet begun
Progress achieved on outputs or outcomes
Table 5. Where is your program? (Taken from CDC, 2011b, p. 58)
Based on the discussion of the logic model and Table 4, use the space below to describe your program stage.
4.11. STEP 11: Decide who will conduct the evaluation – an internal or external evaluator It is important to decide who will conduct the evaluation during the planning phase. Some critical factors to consider when deciding whether to choose an internal staff member to conduct the evaluation or to hire an external evaluator are the evaluation’s purpose, evaluation questions, study design, workload of the internal staff, and expertise of the internal staff.
An internal evaluator is preferred in cases where the evaluation can beneft from the in-depth understanding of someone who is internal to the program and who has the expertise to evaluate the program without any potential bias. An external evaluator is preferred when the impact and outcomes evaluation must be conducted as objectively as possible and/or the internal staff does not have the expertise and/or necessary resources such as time.
The activity below can be used to choose an internal or external evaluator (Adapted from Pell Institute, 2017b).
1. Answer YES or NO to the questions in Figure 6.
2. Use the checklist to decide which of the followingthree options (starting with the highest-cost option) ismost suitable:
+ Option 1: Hire an external evaluator.
+ Option 2: Internal staff will lead the evaluation withconsultation with an external evaluator.
+ Option 3: Internal evaluator.
If you answered “NO” to all the questions above, consider securing funds to hire an external evaluator on a consultancy basis and train internal staff. In this case, work closely with stakeholders to identify the most important evaluation questions and determine how they hope to use the results of the evaluation.
Ch
apter 4
P
lann
ing
the P
rog
ram an
d E
valuatio
n
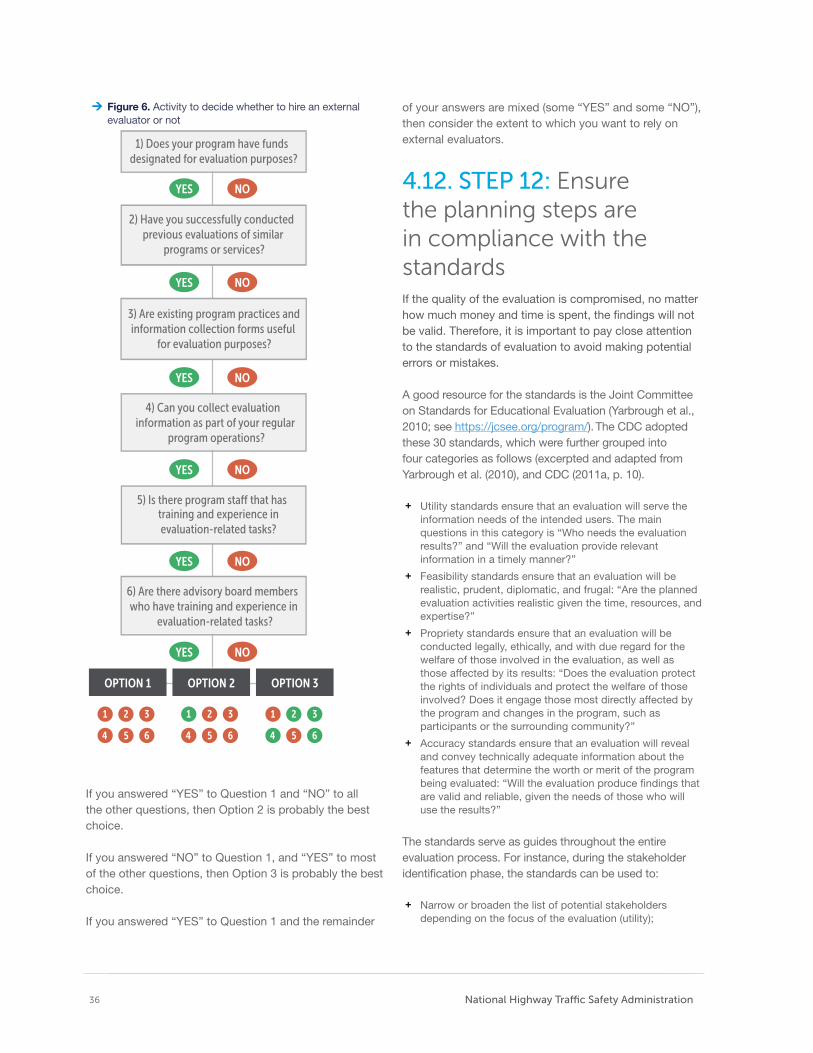
36 National Highway Trafc Safety Administration
Figure 6. Activity to decide whether to hire an externalevaluator or not
2) Have you successfully conducted previous evaluations of similar
programs or services?
3) Are existing program practices and information collection forms useful
for evaluation purposes?
4) Can you collect evaluation information as part of your regular
program operations?
training and experience in evaluation-related tasks?
6) Are there advisory board members who have training and experience in
evaluation-related tasks?
OPTION 1 OPTION 2 OPTION 3
YES NO
1) Does your program have funds designated for evaluation purposes?
5) Is there program sta˜ that has
YES NO
YES NO
YES NO
YES NO
YES NO
If you answered “YES” to Question 1 and “NO” to all the other questions, then Option 2 is probably the best choice.
If you answered “NO” to Question 1, and “YES” to most of the other questions, then Option 3 is probably the best choice.
If you answered “YES” to Question 1 and the remainder
of your answers are mixed (some “YES” and some “NO”), then consider the extent to which you want to rely on external evaluators.
4.12. STEP 12: Ensure the planning steps are in compliance with the standards If the quality of the evaluation is compromised, no matter how much money and time is spent, the fndings will not be valid. Therefore, it is important to pay close attention to the standards of evaluation to avoid making potential errors or mistakes.
A good resource for the standards is the Joint Committee on Standards for Educational Evaluation (Yarbrough et al., 2010; see https://jcsee.org/program/). The CDC adopted these 30 standards, which were further grouped into four categories as follows (excerpted and adapted from Yarbrough et al. (2010), and CDC (2011a, p. 10).
+ Utility standards ensure that an evaluation will serve theinformation needs of the intended users. The mainquestions in this category is “Who needs the evaluationresults?” and “Will the evaluation provide relevantinformation in a timely manner?”
+ Feasibility standards ensure that an evaluation will berealistic, prudent, diplomatic, and frugal: “Are the plannedevaluation activities realistic given the time, resources, andexpertise?”
+ Propriety standards ensure that an evaluation will beconducted legally, ethically, and with due regard for thewelfare of those involved in the evaluation, as well asthose affected by its results: “Does the evaluation protectthe rights of individuals and protect the welfare of thoseinvolved? Does it engage those most directly affected bythe program and changes in the program, such asparticipants or the surrounding community?”
+ Accuracy standards ensure that an evaluation will revealand convey technically adequate information about thefeatures that determine the worth or merit of the programbeing evaluated: “Will the evaluation produce fndings thatare valid and reliable, given the needs of those who willuse the results?”
The standards serve as guides throughout the entire evaluation process. For instance, during the stakeholder identifcation phase, the standards can be used to:
+ Narrow or broaden the list of potential stakeholdersdepending on the focus of the evaluation (utility);
A Primer for Evaluating Underage Drinking and Driving Programs 37
+ Gauge if the evaluation is feasible, in terms of both time and effort (feasibility);
+ Ensure the evaluation proceeds ethically by including the stakeholders from the target audience (propriety); and
+ Figure out how to engage the stakeholders for developing an evaluation program that will accurately assess the success of the program (accuracy).
4.13. Wrapping up the Planning Phase
Potential checklist questions (and corresponding steps) for this chapter.
Checklist for the planning phase:
STEP 1: Assemble team
+ Who should be included in the core team?
STEP 2: Identify and engage stakeholders + Who are the stakeholders? + What is the plan to engage to stakeholders and is
the plan ready?
STEP 3: Planning the program: What is the problem in the target community? + What is the problem and the extent of the problem
in the community? + Is needs assessment required? If so, how should it
be conducted? + When should baseline data/measures be
collected? + Do these data already exist or do they need to be
collected?
STEP 4: Planning the program: Identify efective programs
+ What is the program strategy?
STEP 5: Planning the program: Tailor the program to ft target community needs and population + Is the current plan original to or adopted for this
program? + Is there suffcient information to develop a tailored
program for the target population?
STEP 6: Planning the program: Develop the strategy + Have the mission and vision for this program
clearly defned, and articulated? + What are the program goals and objectives? And
have outcomes been defned to determine when these goals and objectives are achieved?
STEP 7: Develop a logic model
+ What is the logic model of your program?
STEP 8: Planning the evaluation: Develop the strategy + What is the purpose of evaluation? + Who is the audience of the evaluation? + What is the evaluation design? + What are the evaluation questions? + Who will conduct the evaluation?
+ Is the evaluation team ready?
STEP 9: Choose the indicators or outcomes measures to evaluate + What are the indicators or measures?
STEP 10: Figure out the stage of development or maturation of program + Which of the three development stages is the
program in - planning, implementation, or maintenance?
+ Are stakeholders aware of the current development stage of the program?
STEP 11: Decide who will conduct the evaluation – an internal or external evaluator + Has the program evaluator been selected? If not, is
the decision between an internal and external evaluator?
+ What factors are being considered in selecting an entity to evaluate the program?
STEP 12: Ensure the planning steps comply with the standards + Are there measures in place to ensure that
evaluation standards are adhered to; safeguarding the program from producing invalid results?
Ch
apter 4
P
lann
ing
the P
rog
ram an
d E
valuatio
n

Spotlight: FDA staff scientist
Placeholder text. A picture of idendae dolum iducidem aut explitae quasinumintia doloresecto eos sum nis repra pe volupic toratecto.
5 Implementing theCountermeasure and Evaluation
ONCE a plan and a team responsible for implementing the program are in place, it is time to follow through with the plan. To conduct a successful evaluation, execution of all critical steps in both the data collection and data analysis phases are necessary. One fundamental aspect of countermeasure implementation is ensuring that ethical guidelines are followed.
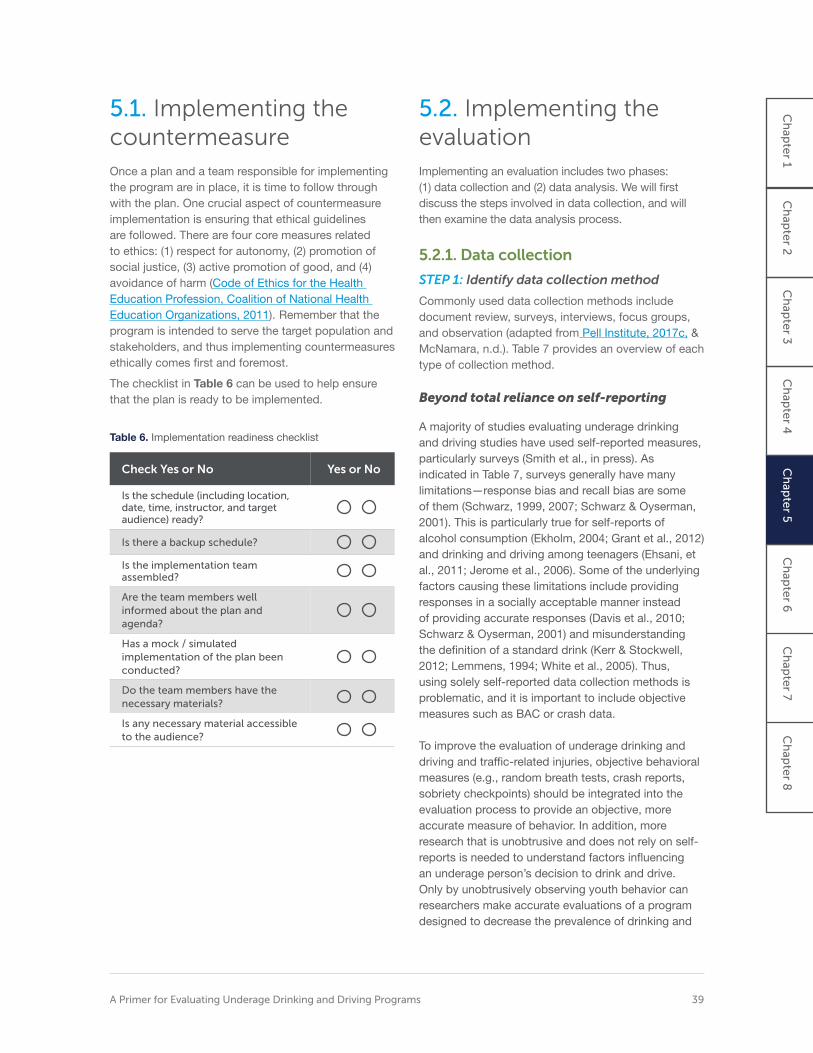
5.1. Implementing the countermeasure Once a plan and a team responsible for implementing the program are in place, it is time to follow through with the plan. One crucial aspect of countermeasure implementation is ensuring that ethical guidelines are followed. There are four core measures related to ethics: (1) respect for autonomy, (2) promotion of social justice, (3) active promotion of good, and (4) avoidance of harm (Code of Ethics for the Health Education Profession, Coalition of National Health Education Organizations, 2011). Remember that the program is intended to serve the target population and stakeholders, and thus implementing countermeasures ethically comes frst and foremost.
The checklist in Table 6 can be used to help ensure that the plan is ready to be implemented.
Table 6. Implementation readiness checklist
Check Yes or No Yes or No
Is the schedule (including location, date, time, instructor, and target audience) ready?
Is there a backup schedule?
Is the implementation team assembled?
Are the team members well informed about the plan and agenda?
Has a mock / simulated implementation of the plan been conducted?
Do the team members have the necessary materials?
Is any necessary material accessible to the audience?
5.2. Implementing the evaluation Implementing an evaluation includes two phases: (1) data collection and (2) data analysis. We will frst discuss the steps involved in data collection, and will then examine the data analysis process.
5.2.1. Data collection
STEP 1: Identify data collection method
Commonly used data collection methods include document review, surveys, interviews, focus groups, and observation (adapted from Pell Institute, 2017c, & McNamara, n.d.). Table 7 provides an overview of each type of collection method.
Beyond total reliance on self-reporting
A majority of studies evaluating underage drinking and driving studies have used self-reported measures, particularly surveys (Smith et al., in press). As indicated in Table 7, surveys generally have many limitations—response bias and recall bias are some of them (Schwarz, 1999, 2007; Schwarz & Oyserman, 2001). This is particularly true for self-reports of alcohol consumption (Ekholm, 2004; Grant et al., 2012) and drinking and driving among teenagers (Ehsani, et al., 2011; Jerome et al., 2006). Some of the underlying factors causing these limitations include providing responses in a socially acceptable manner instead of providing accurate responses (Davis et al., 2010; Schwarz & Oyserman, 2001) and misunderstanding the defnition of a standard drink (Kerr & Stockwell, 2012; Lemmens, 1994; White et al., 2005). Thus, using solely self-reported data collection methods is problematic, and it is important to include objective measures such as BAC or crash data.
To improve the evaluation of underage drinking and driving and traffc-related injuries, objective behavioral measures (e.g., random breath tests, crash reports, sobriety checkpoints) should be integrated into the evaluation process to provide an objective, more accurate measure of behavior. In addition, more research that is unobtrusive and does not rely on self-reports is needed to understand factors infuencing an underage person’s decision to drink and drive. Only by unobtrusively observing youth behavior can researchers make accurate evaluations of a program designed to decrease the prevalence of drinking and
Ch
apte
r 1 C
hap
ter 2
C
hap
ter 3
C
hap
ter 4
C
hap
ter 5
C
hap
ter 6
C
hap
ter 7
Ch
apte
r 8
A Primer for Evaluating Underage Drinking and Driving Programs 39
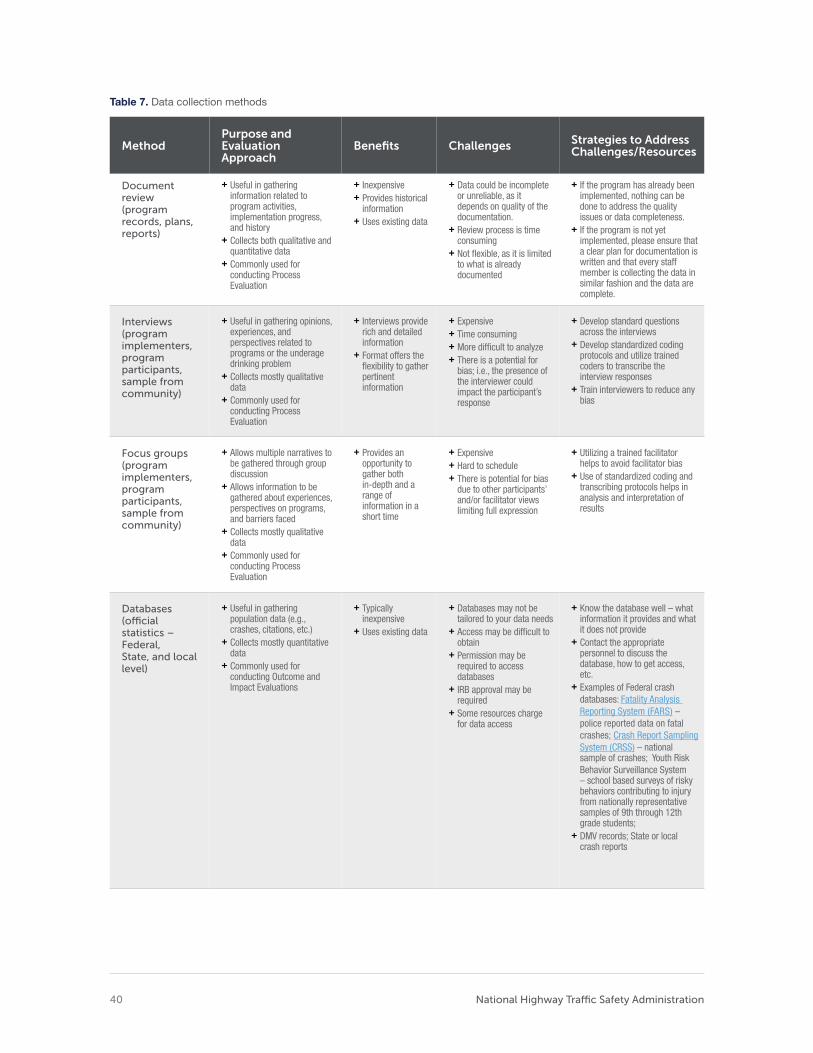
Table 7. Data collection methods
Method Purpose and Evaluation Approach
Benefts Challenges Strategies to Address Challenges/Resources
Document review (program records, plans, reports)
+ Useful in gathering information related to program activities, implementation progress, and history
+ Collects both qualitative and quantitative data
+ Commonly used for conducting Process Evaluation
+ Inexpensive + Provides historical
information + Uses existing data
+ Data could be incomplete or unreliable, as it depends on quality of the documentation.
+ Review process is time consuming
+ Not fexible, as it is limited to what is already documented
+ If the program has already been implemented, nothing can be done to address the quality issues or data completeness.
+ If the program is not yet implemented, please ensure that a clear plan for documentation is written and that every staff member is collecting the data in similar fashion and the data are complete.
Interviews (program implementers, program participants, sample from community)
+ Useful in gathering opinions, experiences, and perspectives related to programs or the underage drinking problem
+ Collects mostly qualitative data
+ Commonly used for conducting Process Evaluation
+ Interviews provide rich and detailed information
+ Format offers the fexibility to gather pertinent information
+ Expensive + Time consuming + More diffcult to analyze + There is a potential for
bias; i.e., the presence of the interviewer could impact the participant’s response
+ Develop standard questions across the interviews
+ Develop standardized coding protocols and utilize trained coders to transcribe the interview responses
+ Train interviewers to reduce any bias
Focus groups (program implementers, program participants, sample from community)
+ Allows multiple narratives to be gathered through group discussion
+ Allows information to be gathered about experiences, perspectives on programs, and barriers faced
+ Collects mostly qualitative data
+ Commonly used for conducting Process Evaluation
+ Provides an opportunity to gather both in-depth and a range of information in a short time
+ Expensive + Hard to schedule + There is potential for bias
due to other participants’ and/or facilitator views limiting full expression
+ Utilizing a trained facilitator helps to avoid facilitator bias
+ Use of standardized coding and transcribing protocols helps in analysis and interpretation of results
Databases (ofcial statistics – Federal, State, and local level)
+ Useful in gathering population data (e.g., crashes, citations, etc.)
+ Collects mostly quantitative data
+ Commonly used for conducting Outcome and Impact Evaluations
+ Typically inexpensive
+ Uses existing data
+ Databases may not be tailored to your data needs
+ Access may be diffcult to obtain
+ Permission may be required to access databases
+ IRB approval may be required
+ Some resources charge for data access
+ Know the database well – what information it provides and what it does not provide
+ Contact the appropriate personnel to discuss the database, how to get access, etc.
+ Examples of Federal crash databases: Fatality Analysis Reporting System (FARS) – police reported data on fatal crashes; Crash Report Sampling System (CRSS) – national sample of crashes; Youth Risk Behavior Surveillance System – school based surveys of risky behaviors contributing to injury from nationally representative samples of 9th through 12th grade students;
+ DMV records; State or local crash reports
National Highway Trafc Safety Administration 40
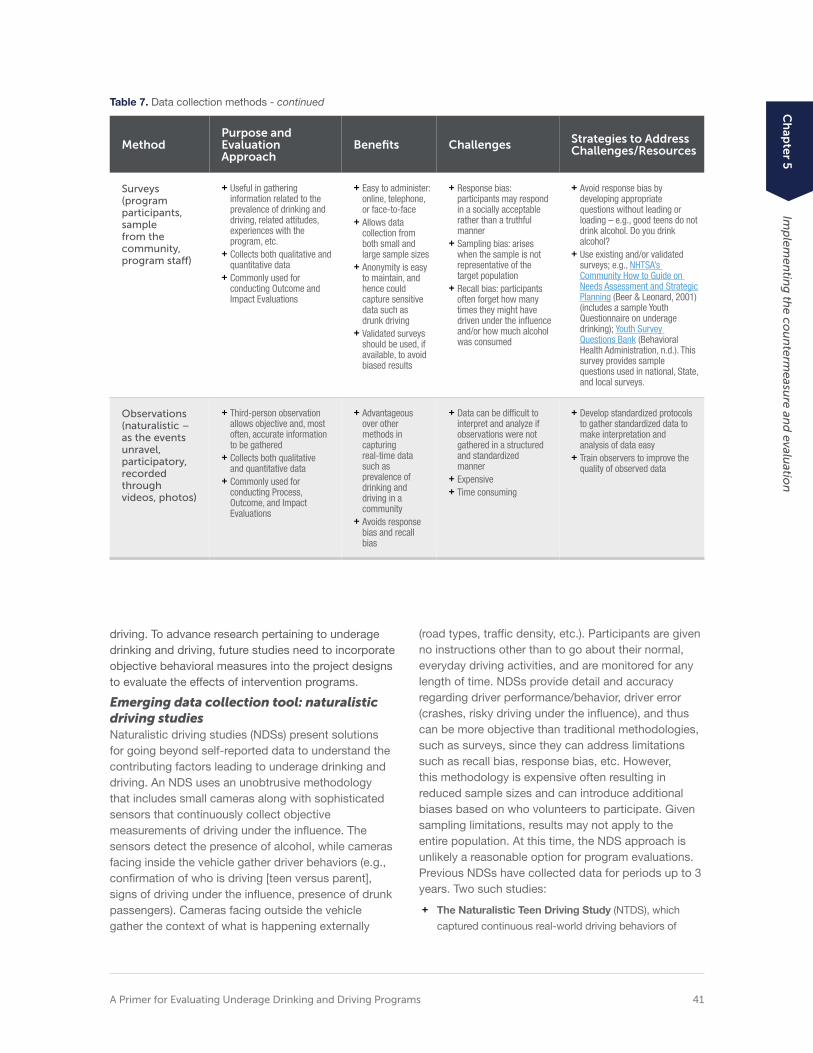
Table 7. Data collection methods - continued
Method Purpose and Evaluation Approach
Benefts Challenges Strategies to Address Challenges/Resources
Surveys (program participants, sample from the community, program staf)
+ Useful in gathering information related to the prevalence of drinking and driving, related attitudes, experiences with the program, etc.
+ Collects both qualitative and quantitative data
+ Commonly used for conducting Outcome and Impact Evaluations
+ Easy to administer: online, telephone, or face-to-face
+ Allows data collection from both small and large sample sizes
+ Anonymity is easy to maintain, and hence could capture sensitive data such as drunk driving
+ Validated surveys should be used, if available, to avoid biased results
+ Response bias: participants may respond in a socially acceptable rather than a truthful manner
+ Sampling bias: arises when the sample is not representative of the target population
+ Recall bias: participants often forget how many times they might have driven under the infuence and/or how much alcohol was consumed
+ Avoid response bias by developing appropriate questions without leading or loading – e.g., good teens do not drink alcohol. Do you drink alcohol?
+ Use existing and/or validated surveys; e.g., NHTSA’s Community How to Guide on Needs Assessment and Strategic Planning (Beer & Leonard, 2001) (includes a sample Youth Questionnaire on underage drinking); Youth Survey Questions Bank (Behavioral Health Administration, n.d.). This survey provides sample questions used in national, State, and local surveys.
Observations (naturalistic – as the events unravel, participatory, recorded through videos, photos)
+ Third-person observation allows objective and, most often, accurate information to be gathered
+ Collects both qualitative and quantitative data
+ Commonly used for conducting Process, Outcome, and Impact Evaluations
+ Advantageous over other methods in capturing real-time data such as prevalence of drinking and driving in a community
+ Avoids response bias and recall bias
+ Data can be diffcult to interpret and analyze if observations were not gathered in a structured and standardized manner
+ Expensive + Time consuming
+ Develop standardized protocols to gather standardized data to make interpretation and analysis of data easy
+ Train observers to improve the quality of observed data
driving. To advance research pertaining to underage drinking and driving, future studies need to incorporate objective behavioral measures into the project designs to evaluate the effects of intervention programs.
Emerging data collection tool: naturalistic driving studies Naturalistic driving studies (NDSs) present solutions for going beyond self-reported data to understand the contributing factors leading to underage drinking and driving. An NDS uses an unobtrusive methodology that includes small cameras along with sophisticated sensors that continuously collect objective measurements of driving under the infuence. The sensors detect the presence of alcohol, while cameras facing inside the vehicle gather driver behaviors (e.g., confrmation of who is driving [teen versus parent], signs of driving under the infuence, presence of drunk passengers). Cameras facing outside the vehicle gather the context of what is happening externally
(road types, traffc density, etc.). Participants are given no instructions other than to go about their normal, everyday driving activities, and are monitored for any length of time. NDSs provide detail and accuracy regarding driver performance/behavior, driver error (crashes, risky driving under the infuence), and thus can be more objective than traditional methodologies, such as surveys, since they can address limitations such as recall bias, response bias, etc. However, this methodology is expensive often resulting in reduced sample sizes and can introduce additional biases based on who volunteers to participate. Given sampling limitations, results may not apply to the entire population. At this time, the NDS approach is unlikely a reasonable option for program evaluations. Previous NDSs have collected data for periods up to 3 years. Two such studies:
+ The Naturalistic Teen Driving Study (NTDS), which
captured continuous real-world driving behaviors of
A Primer for Evaluating Underage Drinking and Driving Programs 41
Ch
apter 5
Im
plem
entin
g th
e cou
nterm
easure an
d evalu
ation

Table 8. Evaluation matrix I: Matching evaluation questions with data collection tools (adapted from Peersman, 2014)
Data Collection Method to Consider
Evaluation questions Interview (program staff, participants)
Survey (participants)
Document review (program records) Observation
What was the quality of the program implemented? (Did the implementation of the program go as intended? Has the program been implemented as intended or planned?)
How did the target audience perceive the program? (Did the participants feel like the program was worthwhile?)
What are the strengths and weaknesses of the program? (A strength could be that the program activities matched the learning style of the audience; if not, then it would be a weakness.)
novice teen drivers—those who just started driving Choosing a data collection methodology independently—during the frst 18 months of
Successful evaluations focus on developing anindependent driving (Simons-Morton et al., 2015; Klauer overarching evaluation approach. In other words, et al., 2011, 2014) evaluation questions should be developed and a+ The Second Strategic Highway Research Program set of data collection tools chosen that will answer
(SHRP2) NDS: Alcohol Sensor Performance study, which those questions rather than choosing one method
evaluated whether alcohol-impaired driving could be and/or starting with a list of data collection tools.
detected through alcohol sensors in conjunction with an This strategy is also known as triangulation of data
alcohol-detection algorithm (Smith et al., 2015) collection methods. This approach will ensure (a) that the set of data collection tools complement each
Table 9. Evaluation matrix II: Matching evaluation questions with data collection tools (adapted from CDC, 2011b)
Evaluation questions
Method to answer your question
Assumptions for this method to be viable
Resources needed Limitations
Example: How did Surveys from participants who Participants who chose + Validated surveys Recall bias the target audience perceive the program?
volunteered after they took the course
to participate are not self-selecting and are not providing biased answers
+ Money + Time + Volunteers to distribute
Unstructured questions could lead to response
and collect the surveys bias
National Highway Trafc Safety Administration 42

other’s individual inherent strengths and weakness; and (b) improve validity and credibility of evaluation fndings when data from different sources converge. Key evaluation questions should be matched with specifc data collection tools (see Table 8 for the evaluation matrix); this will be helpful in identifying data needs, any data gaps, and prioritizing data collection methods.
In addition to triangulating the data collection methods and ensuring that the methods will answer the relevant evaluation question, it is important to keep in mind the assumptions made, resources needed, and limitations of the methods chosen (Table 9).
Additional data collection matrices could include columns for staff/person responsible, timeline (when to collect data and how long, etc.), and measures or indicators for data collection.
Developing a good data management plan
A good data management plan ensures the quality of the data collected, which will further impact the results of the evaluation. Using a set of standards as a guideline while choosing, collecting, cleaning, storing, and analyzing data is advisable.
Some of the commonly used standards include the following (adapted from Peersman, 2014, p. 6):
Validity: Validity is one of the most important standards to keep in mind and is relevant to several components; for example, data collection, data measurement, the sampling strategy, etc. Validity concerns (1) whether the chosen data collection method is appropriate to answer the evaluation question of interest; (2) whether the data collected inform the indicators or objectives; and (3) whether the chosen sampling strategy is appropriate for the purpose of the evaluation. In other words, validity means that the data collection tool (e.g., survey question) is understood by the respondent in a way consistent with what the evaluator intended.
Conformity and Reliability: Data are measured per agreed-upon standard defnitions and methodologies. For example, if more than one interviewer conducts participant interviews, are the interviewers reading the interview scripts and interviewing the participants in a consistent way following the agreed upon standard?
Precision: The data have suffcient detail and repeated measurements will produce the same results.
Integrity: Data are protected from deliberate bias such as incorrect data entry. For instance, the participant ID should be linked correctly with the demographic data and outcome measures. If any feld is missing either due to an inappropriate data collection tool or data entry, then the data are no longer integral. This standard ensures that procedures are put in place to protect the data quality.
Timeliness: Information is up-to-date and available on time. For example, the evaluation purpose requires that the data on certain measures need to be collected during a specifc period of time. This standard ensures that the data collection is completed during the time window that was planned. Furthermore, this standard also requires that the data are current and up-to-date.
Completeness: All data elements are included per defnitions and methodologies. For instance, if the participant’s frst name and last name are collected then the data are considered complete regardless of whether the middle name is missing or not.
Whenever possible, validated data collection tools that have been used successfully in the past are recommended. Pilot testing of data collection tools using a group of stakeholders is also a good strategy for ensuring the tools’ validity and reliability. Training the data collector and interviewer or facilitator is highly recommended to avoid any bias and/or errors.
STEP 2: Determine sampling strategy and sample size
What is a sample?
A sample is a proportion of the target population of interest. To develop countermeasures to reduce underage drinking and driving, the target population of interest includes the following groups/entities, depending on the purpose of the countermeasure and what you want to know.
+ Teenagers and young adults (<21 years old)
+ Parents + Schools
+ Policy makers at the local, State, and/or Federal level
Ch
apter 5
Im
plem
entin
g th
e cou
nterm
easure an
d evalu
ation
A Primer for Evaluating Underage Drinking and Driving Programs 43
After identifying the population of interest, identify the location from where the sample will be selected and the timing of sampling to collect data during the appropriate time window of interest (i.e., where and when to select the sample).
Choosing a sampling strategy: probability versus non-probability sampling
The main distinction between probability and non-probability sampling methods is that probability sampling requires the random selection of samples; i.e., every unit or participant has an equal chance to be selected for evaluation. Random sampling ensures good generalizability of sample results to the entire target population. Generalizability broadly means the ability to apply the results from a study to groups or situations other than the groups from which the results of the study have emerged (Rogers, 2014, p. 18). Non-probability sampling does not require random selection)
Types of probability sampling
Simple random sample: Every unit or participant has an equal chance of being selected. For a small or moderate population, a simple lottery system can be used to select the sample. For larger populations, sampling software is useful.
Stratifed sampling: The population is divided into groups based on a characteristic (e.g., age, gender, school, geographic location) and then a random sample is drawn from each group. This ensures that each characteristic of interest is represented without the need for a larger sample.
Non-probability sampling: Every participant or unit does NOT have an equal chance of being selected. Instead, selection depends on the purpose and/or judgement of the evaluator. The fndings may or may not generalize to the entire population. This sampling strategy is not based on probability theory, hence the “non-probability” part of the name. Here, we cannot estimate the confdence level of the results (more details about confdence levels are provided below).
Types of non-probability sampling methods
Quota sample: Usually the population will be divided into subgroups and the sample will be continuously selected until a predefned quota/target percentage is reached. For instance, if you knew that 25% of the teenage drivers in your area were Asian, you would recruit Asian teenagers until they made up 25% of the desired sample size.
Purposive: Participants are selected for a purpose per the subjective judgment of the evaluator rather than by the representativeness of the sample.
There are several types of purposive sampling (taken from Taylor-Powell, 1998).
Types of Purposive Sampling and Description:
+ Convenience: Participants are selected based on their availability to participate at the desired time and location. No structure. Cheap and saves time and effort.
+ Snowball or chain: Participants are recruited by referral from other participants or people.
+ Criterion: Participants are selected based on a particular criterion or set of criteria; e.g., newly licensed teenage drivers.
+ Homogenous: Participants are chosen by similarity. Less variability and easy to analyze.
+ Typical case: Normal or typical participants are chosen.
+ Extreme case: Non-typical, unusual participants are recruited to learn about their characteristics.
Determining a sample size
The validity and reliability of evaluation depends on whether the sample size is appropriate for the purpose of the evaluation. The factors that are important to consider for determining the sample size are as follows.
+ Research questions and purpose of evaluation
+ Available resources
+ Desired precision (precision is normally defned as the
degree to which measurements under the same
conditions produce results within an acceptable range or
“scatter”; the higher the precision, the lesser the scatter
of measurements will be)
+ Desired accuracy (accuracy is defned as deviation from the “true” value)
+ Desired effect (effect normally means the size of the
change in the outcome measure before and after the
program, or the size of the difference in the outcome
measure between those who took the program and those
who did not)
+ Characteristics of the target population
If higher accuracy is desired, then larger samples are needed to overcome the increased variability in a smaller population.
National Highway Trafc Safety Administration 44
For random sampling strategies, the parameters needed to calculate the sample size include the margin of error and confdence level.
Margin of error is a parameter indicating the range of the results when a random sampling strategy is used. For instance, if the margin of error is 5% and results indicate that 85% of participants improved their skills after participating in the countermeasure, then we can comfortably state that 80% to 90% of participants improved their skills.
Confdence level indicates the risk of being wrong within the margin of error. If the confdence level is 95% in the previous example, then we are 95% sure that 80% to 90% of participants improved their skills and that there is only a 5% chance that 80% to 90% of participants did not improve their skills.
+ Appendix B provides links to several online statistical
calculators that are currently available to estimate sample
sizes, given a desired margin of error.
Non-response rate is an important factor that needs attention when you are determining the sample size. It is the percentage of participants who did not respond for some reason or another. Non-responses in a sample adversely impact the generalizability of the results because the data collected are no longer representative of the target population due to non-response. One way to address this is to estimate the expected non-response rate and increase the sample size to account for the non-response rate. For example, a non-response rate of 30% means that only 70% of participants contacted will respond. In this case, if the sample size was determined to be 150 (using Appendix B), then it is better to contact 214 participants (150/0.7) so that at least 150 respond.
Improving response rates
Response rate is the percentage of participants who responded or participated in data collection. While high response rates are important to generalize the results to the target population, there is no hard-set rule for the required response rate.
Response rates can be improved by: + Providing information about the purpose of the survey,
how the results will be analyzed, and emphasizing that the participants’ information will be confdential
+ Providing clear instructions on how to complete the survey
+ Providing suffcient time to complete the survey and, if possible, send friendly reminders (via phone, mail, or email)
+ Providing incentives for participation (if possible)
+ Using culturally relevant designs and personalizing the data collection tool
STEP 3: Get Institutional Review Board approval to ensure protection of human subjects
History is littered with examples of the unethical use of humans as experimental subjects. The ethical issues range from the use of deception and exposure to great risk without consent (both were present in the Tuskegee syphilis experiment, [2020]), to the intentional use of medical experiments leading to death (equivalent to medical torture, such as in the Nazi medical experiments, [2020]). Other studies subjected participants to extreme psychological and emotional stress (such as the Milgram experiment, [2020]). Studies such as these from as recently as the last century have resulted in global condemnation of the unethical use of humans as experimental subjects and have resulted in a series of international and U.S. laws and regulations governing the rules by which humans can be used in experiments.
The Nazi war crimes trials resulted in the Nuremberg Code (United States Holocaust Memorial Museum, n.a.) of 1947, which set out 10 important points regarding the protection of humans in experiments. This was followed in 1964 by the Declaration of Helsinki, put forth by the World Medical Association, still considered the foundational cornerstone of human research ethics. The United States contributed the Belmont Report (National Commission for the Protection of Human Subjects of Biomedical and Behavioral Research, 1979) in 1978, which established the three ethical pillars of Respect for Persons, Benefcence, and Justice, from which the U.S. rules were derived. Although the rules initially applied only to work done within the Department of Health and Human Services, 14 other Federal agencies and departments adopted the rules in 1991 under the term “The Common Rule.” A signifcant revision of the Common Rule was enacted in early 2017, and went into effect in July 2018. In general, these rules ensure that all human subjects studies are reviewed by an Institutional Review Board (2006) to ensure (among other things) that participants provide informed
Ch
apter 5
Im
plem
entin
g th
e cou
nterm
easure an
d evalu
ation
A Primer for Evaluating Underage Drinking and Driving Programs 45
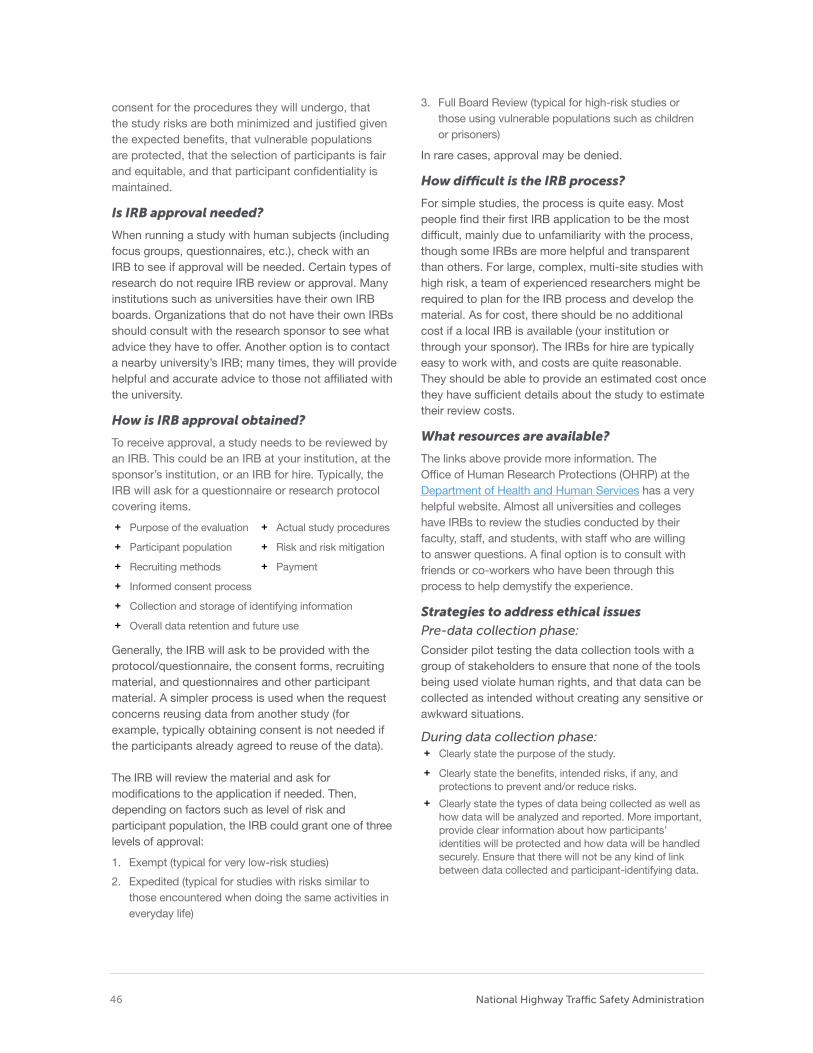
consent for the procedures they will undergo, that the study risks are both minimized and justifed given the expected benefts, that vulnerable populations are protected, that the selection of participants is fair and equitable, and that participant confdentiality is maintained.
Is IRB approval needed?
When running a study with human subjects (including focus groups, questionnaires, etc.), check with an IRB to see if approval will be needed. Certain types of research do not require IRB review or approval. Many institutions such as universities have their own IRB boards. Organizations that do not have their own IRBs should consult with the research sponsor to see what advice they have to offer. Another option is to contact a nearby university’s IRB; many times, they will provide helpful and accurate advice to those not affliated with the university.
How is IRB approval obtained?
To receive approval, a study needs to be reviewed by an IRB. This could be an IRB at your institution, at the sponsor’s institution, or an IRB for hire. Typically, the IRB will ask for a questionnaire or research protocol covering items.
+ Purpose of the evaluation + Actual study procedures
+ Participant population + Risk and risk mitigation
+ Recruiting methods + Payment
+ Informed consent process
+ Collection and storage of identifying information
+ Overall data retention and future use
Generally, the IRB will ask to be provided with the protocol/questionnaire, the consent forms, recruiting material, and questionnaires and other participant material. A simpler process is used when the request concerns reusing data from another study (for example, typically obtaining consent is not needed if the participants already agreed to reuse of the data).
The IRB will review the material and ask for modifcations to the application if needed. Then, depending on factors such as level of risk and participant population, the IRB could grant one of three levels of approval:
1. Exempt (typical for very low-risk studies)
2. Expedited (typical for studies with risks similar to those encountered when doing the same activities in everyday life)
3. Full Board Review (typical for high-risk studies or those using vulnerable populations such as children or prisoners)
In rare cases, approval may be denied.
How difcult is the IRB process?
For simple studies, the process is quite easy. Most people fnd their frst IRB application to be the most diffcult, mainly due to unfamiliarity with the process, though some IRBs are more helpful and transparent than others. For large, complex, multi-site studies with high risk, a team of experienced researchers might be required to plan for the IRB process and develop the material. As for cost, there should be no additional cost if a local IRB is available (your institution or through your sponsor). The IRBs for hire are typically easy to work with, and costs are quite reasonable. They should be able to provide an estimated cost once they have suffcient details about the study to estimate their review costs.
What resources are available?
The links above provide more information. The Offce of Human Research Protections (OHRP) at the Department of Health and Human Services has a very helpful website. Almost all universities and colleges have IRBs to review the studies conducted by their faculty, staff, and students, with staff who are willing to answer questions. A fnal option is to consult with friends or co-workers who have been through this process to help demystify the experience.
Strategies to address ethical issues Pre-data collection phase:
Consider pilot testing the data collection tools with a group of stakeholders to ensure that none of the tools being used violate human rights, and that data can be collected as intended without creating any sensitive or awkward situations.
During data collection phase: + Clearly state the purpose of the study.
+ Clearly state the benefts, intended risks, if any, and protections to prevent and/or reduce risks.
+ Clearly state the types of data being collected as well as how data will be analyzed and reported. More important, provide clear information about how participants’ identities will be protected and how data will be handled securely. Ensure that there will not be any kind of link between data collected and participant-identifying data.
National Highway Trafc Safety Administration 46
Table 10. Data collection checklist
Check Yes or No YES NO
Will the data collection methodology address the evaluation questions appropriately?
Will the current methods address the data gaps and weakness of the methods selected?
Will the audience conform to the methods? For example, will they fll out questionnaires carefully, engage in interviews or focus groups, let their behaviors or study-relevant data be examined, etc.?
Can someone administer the methods now or is training required?
Is the selected sample representative of the target population?
Is IRB approval needed?
Ensure informed consent includes the following key elements: + Emphasize that participation is voluntary, and that
participants are free to opt out at any time.
+ Allow participants suffcient time to read and understand the informed consent before they agree to participate. (Participants under 18 may require parental permission and child assent before being able to participate.)
+ Finally, honor the informed consent agreement.
The checklist in Table 10 can be used before beginning data collection.
5.2.2. Data Analysis STEP 1: Clean and organize the data for analysis
In most cases, data collected are not very useful for analysis in raw form and need some form of cleaning, data entry, and organization before analysis. Microsoft Excel is a great tool for this purpose.
Developing a plan for cleaning data will help improve the data’s validity. The following questions address the main data-cleaning objectives:
1. Do the data make sense?
2. Are the data complete?
3. Were all the necessary data captured?
These are the most commonly used methods of cleaning data:
+ Spot checking – A random sample of questions will be
checked for accuracy of data entry and to identify any
data entry errors.
+ Eyeballing – Data will be reviewed for any errors from
data entry.
+ Logic-check – Responses to different questions will be
checked to see if they make sense.
Next, have a plan for developing a database structure or a data coding protocol for converting raw data into something that can be analyzed. Some important items for each variable include name, description, method of collection, data, and notes.
STEP 2: Analyze data
Numerical data
Commonly used methods for analyzing numerical data, such as frequency or physical measurements, are discussed in the following sections.
Descriptive data analysis provides a description of the data in simple form by using a set of measures. Some of the commonly used measures for univariate analysis (i.e., single variable analysis) are as follows.
Frequency distribution: Frequency distribution of a data value captures the number of times that particular value has occurred in the data. Visualizing the data this way provides an overview of
Ch
apter 5
Im
plem
entin
g th
e cou
nterm
easure an
d evalu
ation
A Primer for Evaluating Underage Drinking and Driving Programs 47
the data and may help in identifying patterns.
+ Tabulating is a simple form of data analysis used to
determine frequency distribution. For this method, data
are arranged in ascending order along with their
corresponding frequency values, which are further
tabulated. Excel can be used for this task. In cases where
large amounts of data are collected, statistics packages
such as SAS, SPSS, or R are helpful in analyzing the data
in a meaningful way.
Central tendency: Central tendency indicates an estimate of the “center” of the distribution of values. Commonly used measures:
+ Mean – Numerical average of a variable
+ Mode – Most common data value
+ Median – Numerical midpoint that cuts the distribution in half for a particular variable
Dispersion: Dispersion indicates the spread of the distribution of data. Commonly used measures:
+ Range – Maximum value minus minimum value
+ Variance and Standard deviation – These measures quantify the variation of the data.
Correlation: Correlation is a statistical technique that measures the relationship between two or more variables. One important concept to note: correlation does not imply causation. Just because two variables are found to be positively correlated does not mean that one variable caused the occurrence of the other variable. Causation is further discussed below and in Chapter 4, Section 4.8.3 in the subsection titled “Ascertaining causal attribution."
Inferential statistics: Inferential statistics are used to make inferences and estimations about the population using the sample data.
Parametric inferential: This is the most commonly used method and can only be used on data that follow normally distributed parameters (i.e., like a bell curve), is randomly selected, and is of a sample size large enough to assume that the data are normally distributed.
Commonly used parametric inferential techniques include t-tests, analysis of variance, and regression.
It is important to note that using this method, or techniques that fall under this category, will result in invalid results when the sample size is small (less than 10, for example).
Non-parametric inferential: This method is used for data that are fexible and that do not follow normal distribution parameters.
Textual analysis
Textual analysis (or qualitative analysis) is normally used for analyzing responses collected through surveys, interviews, and documents. Most often, the contextual information—perceptions, perspectives, and experiences—are collected as qualitative data. Therefore, these analyses provide depth and contextual information in evaluations. The two most commonly used methods are content analysis and thematic coding.
+ Content analysis – Data are systematically converted
into manageable research questions that are relevant to
the research.
+ Thematic coding – Data are arranged into common
themes or categories.
National Highway Trafc Safety Administration 48
STEP 3: Other important concepts for working with data
Causal attribution and statistical signifcance are not types of data analysis but are nonetheless important concepts to consider, and are often not given enough attention.
Causal attribution
Most often changes in outcomes such as reduction in drinking and driving among teen drivers in a community are attributed to programs without adequate evidence pointing to causal attribution. Please see Chapter 4, Section 4.8.3, subsection “Ascertaining causal attribution” section for more on determining whether there is a causal relationship between a program and observed changes.
Data analysis for statistically signifcant results
“Statistically signifcant” and “p < 0.05” are terms often seen in research studies. These terms imply that the results of an evaluation study are due to something other than random chance. This is normally indicated by the p value, which is the probability that the results are caused by random chance. For example, p < 0.05 means that the probability of random chance causing the results is less than 5%. This concept is especially important when conclusions are drawn about the effectiveness of a program. Tests of statistical signifcance are useful in discerning whether the differences between an intervention and control group are due to intervention or due to random chance.
Importance of longitudinal data collection
The goal of underage drinking and driving programs is to reduce and prevent traffc-related deaths and injuries related to alcohol consumption. The stated health outcome is a long-term outcome, which takes time. To evaluate if a program has achieved its goal, the evaluation should consider collecting data for an appropriate length of time (at least 1 to 5 years if your program targets 16- to 20-year-old drivers), rather than relying on a cross-sectional study, also known as a one-shot study. Lack of longitudinal data collection and evaluation is one of the drawbacks of most studies evaluating underage drinking and driving programs (Smith et al., in press).
STEP 4: Determine what data analysis tools are needed
Simple descriptive analysis can easily be accomplished with Excel. Several tutorials are widely available for this purpose. Here is a resource useful for analyzing questionnaire data: https://cdn.shopify.com/s/fles/1/0145/8808/4272/ fles/G3658-14.pdf.
Inferential analysis requires a background in statistics and involves computer software packages such as SPSS (www.ibm.com/ analytics/us/en/technology/spss/), SAS (www.sas. com/), STATA (www.stata.com/), and R (www.r-project.org/). Among these packages, R is an open source software environment that can be downloaded for free.
Ch
apter 5
Im
plem
entin
g th
e cou
nterm
easure an
d evalu
ation
A Primer for Evaluating Underage Drinking and Driving Programs 49
50 U.S. DEPARTMENT OF TRANSPORTATION
Spotlight: FDA staff scientist
Placeholder text. A picture of idendae dolum iducidem aut explitae quasinumintia doloresecto eos sum nis repra pe volupic toratecto.
6 Interpreting the Results and Justifying the Conclusions
DEVELOPING a plan for interpreting the results and making conclusions is often overlooked. It is important to remember that the purpose of evaluation is to either improve the program or assess its efectiveness. Unless the conclusions are interpreted or justifed through common, agreed-upon standards and values, the chances that the stakeholders will accept and use the evaluation results are very low. The key component of this step is to negotiate and fnalize a set of program standards that most of the stakeholders agree upon.
Developing a plan for interpreting the results and making conclusions is often overlooked, even though it will help the results be meaningful and useful to the program’s stakeholders. It is important to remember that the purpose of evaluation is to either improve the program or assess its effectiveness. Unless the conclusions are interpreted or justifed through common, agreed-upon standards and values, the chances that the stakeholders will accept and use the evaluation results are very low. Not including stakeholders during this step could even result in contradictory conclusions arising out of the same evaluation study.
The key component of this step is to negotiate and fnalize a set of program standards that most of the stakeholders agree upon. Including stakeholders’ input will improve the transparency, validity, and utility of the evaluation results. These program standards are benchmarks or thresholds for making judgements about the evaluation fndings. In addition, address questions such as which standards must be fulflled or how much progress or reduction in outcomes is required to conclude that an underage drinking and driving program can be considered successful or unsuccessful. Potential standards to consider when developing performance indicators (excerpted from CDC, 2011a):
+ Needs, values, and social norms of target community
+ Program strategy: mission, goals, and objectives
+ Program protocols and procedures
+ Context, political environment in the community (e.g.,
mandates, policy, regulations, and law)
+ Performance by control or comparison group
+ Performance by similar programs
+ Social equity
+ Human rights
6.1 Interpretation of fndings
Once the program standards or thresholds are identifed, the next step is to use them in making judgments regarding the program’s worth or merit.
6.2 Tips for interpreting your results Although it seems counterintuitive, it can be quite diffcult to interpret one’s results. Very rarely do we see the perfect “success” or “failure” of a program. Most often the picture is much more complicated. Results can be mixed, statistical effects can be hard to interpret, and it may be unclear which aspects of the program were the most or least effective. Challenges with interpreting results often include determining if the program had a signifcant effect and what aspects of the program were effective.
Did the program have a signifcant effect? There is an important distinction between “statistical” and “practical” signifcance. Statistical signifcance is a statistical probability that the results were not due to random chance. Practical, or clinical signifcance, refers to the actual magnitude of the effect and whether this would have any real-world, practical beneft. For example, a statistician could determine with 95% certainty that a given program reduced underage alcohol consumption but that it only reduced alcohol consumption by .005%. In this case, the fndings may be statistically signifcant but not have a large practical signifcance. More often, a program may have had a large impact (e.g., students who went through the program were 25% less likely to drive compared to students who did not go through the program), but it cannot be determined with 95% certainty that this effect was not due to random chance (i.e., statistical signifcance). This is commonly the result of a low sample size (e.g., only a small number of students were surveyed).
What aspect of the program had an effect? We often use a “kitchen sink” approach to implementing a program. Naturally, program developers will try to implement as many components as possible across multiple times and settings. While this is useful in achieving the desired effect, it can be diffcult to later identify which specifc components of the program led to a positive result.
Ch
apte
r 1 C
hap
ter 2
C
hap
ter 3
C
hap
ter 4
C
hap
ter 5
C
hap
ter 6
C
hap
ter 7
Ch
apte
r 8
A Primer for Evaluating Underage Drinking and Driving Programs 51
6.3 Useful evaluation questions (Source: CDC, 2011a)
1. Were evaluation results interpreted with the goals of the program in mind?
2. Who will be involved in making interpretations and judgments and what process will be employed?
3. Were limitations such as potential biases, generalizability, validity, and reliability of results due to data collection method, design, data analysis, etc. considered?
4. Against what standards will the interpretations be compared?
5. Are there alternative explanations for the results?
6. If multiple indicators were used to answer the same evaluation question, were similar results obtained?
7. Will others interpret the fndings in an appropriate manner?
8. How does the program’s worth or merit compare with those of similar programs?
9. How do the results compare with existing research?
10. Are the results consistent with what was expected? If not, why?
National Highway Trafc Safety Administration 52
A Primer for Evaluating Underage Drinking and Driving Programs 53 53 U.S. DEPARTMENT OF TRANSPORTATION
Spotlight: FDA staff scientist
Placeholder text. A picture of idendae dolum iducidem aut explitae quasinum intia doloresecto eos sum nis repra pe volupic toratecto.
7 Dissemination and Utilization of Evaluation Findings
AFTER program evaluation has been completed, the results should be disseminated to all stakeholders. Efective dissemination should consider the format and channel favored by the stakeholders. It is better to use multiple modes or channels to reach the target audience and stakeholders. Such modes and channels include reports, publications, executive summaries, slides, and fact sheets.
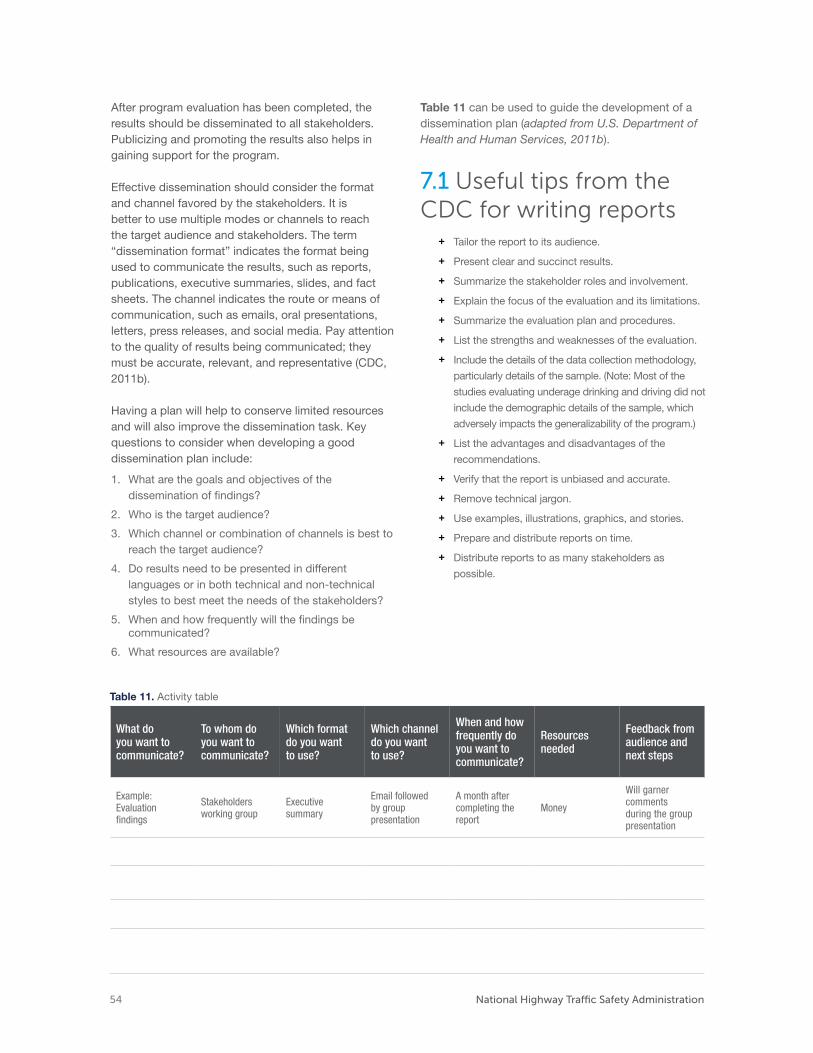
After program evaluation has been completed, the results should be disseminated to all stakeholders. Publicizing and promoting the results also helps in gaining support for the program.
Effective dissemination should consider the format and channel favored by the stakeholders. It is better to use multiple modes or channels to reach the target audience and stakeholders. The term “dissemination format” indicates the format being used to communicate the results, such as reports, publications, executive summaries, slides, and fact sheets. The channel indicates the route or means of communication, such as emails, oral presentations, letters, press releases, and social media. Pay attention to the quality of results being communicated; they must be accurate, relevant, and representative (CDC, 2011b).
Having a plan will help to conserve limited resources and will also improve the dissemination task. Key questions to consider when developing a good dissemination plan include:
1. What are the goals and objectives of the dissemination of fndings?
2. Who is the target audience?
3. Which channel or combination of channels is best to reach the target audience?
4. Do results need to be presented in different languages or in both technical and non-technical styles to best meet the needs of the stakeholders?
5. When and how frequently will the fndings be communicated?
6. What resources are available?
Table 11 can be used to guide the development of a dissemination plan (adapted from U.S. Department of Health and Human Services, 2011b).
7.1 Useful tips from the CDC for writing reports
+ Tailor the report to its audience.
+ Present clear and succinct results.
+ Summarize the stakeholder roles and involvement.
+ Explain the focus of the evaluation and its limitations.
+ Summarize the evaluation plan and procedures.
+ List the strengths and weaknesses of the evaluation.
+ Include the details of the data collection methodology,
particularly details of the sample. (Note: Most of the
studies evaluating underage drinking and driving did not
include the demographic details of the sample, which
adversely impacts the generalizability of the program.)
+ List the advantages and disadvantages of the
recommendations.
+ Verify that the report is unbiased and accurate.
+ Remove technical jargon.
+ Use examples, illustrations, graphics, and stories.
+ Prepare and distribute reports on time.
+ Distribute reports to as many stakeholders as
possible.
Table 11. Activity table
What do you want to communicate?
To whom do you want to communicate?
Which format do you want to use?
Which channel do you want to use?
When and how frequently do you want to communicate?
Resources needed
Feedback from audience and next steps
Example: Evaluation fndings
Stakeholders working group
Executive summary
Email followed by group presentation
A month aftercompleting the report
Money
Will garnercomments
during the grouppresentation
National Highway Trafc Safety Administration 54
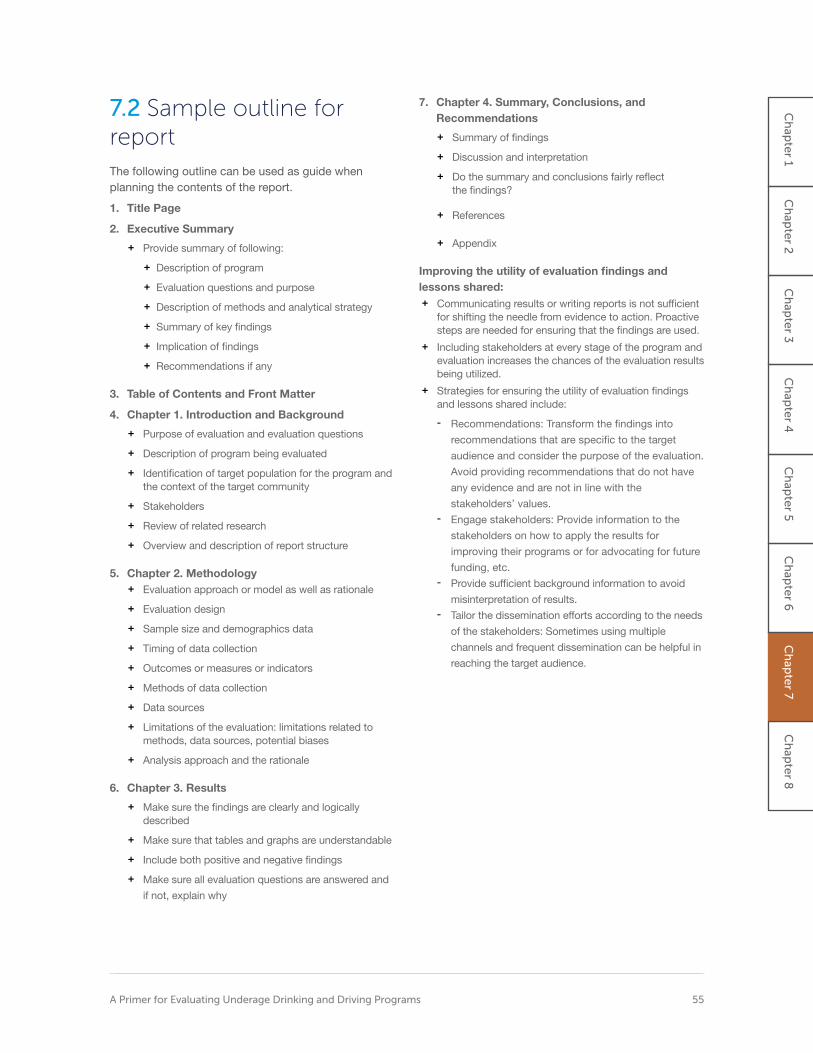
7.2 Sample outline for report The following outline can be used as guide when planning the contents of the report.
1. Title Page
2. Executive Summary
+ Provide summary of following:
+ Description of program
+ Evaluation questions and purpose
+ Description of methods and analytical strategy
+ Summary of key fndings
+ Implication of fndings
+ Recommendations if any
3. Table of Contents and Front Matter
4. Chapter 1. Introduction and Background
+ Purpose of evaluation and evaluation questions
+ Description of program being evaluated
+ Identifcation of target population for the program and the context of the target community
+ Stakeholders
+ Review of related research
+ Overview and description of report structure
5. Chapter 2. Methodology + Evaluation approach or model as well as rationale
+ Evaluation design
+ Sample size and demographics data
+ Timing of data collection
+ Outcomes or measures or indicators
+ Methods of data collection
+ Data sources
+ Limitations of the evaluation: limitations related to methods, data sources, potential biases
+ Analysis approach and the rationale
6. Chapter 3. Results
+ Make sure the fndings are clearly and logically described
+ Make sure that tables and graphs are understandable
+ Include both positive and negative fndings
+ Make sure all evaluation questions are answered and
if not, explain why
7. Chapter 4. Summary, Conclusions, and Recommendations
+ Summary of fndings
+ Discussion and interpretation
+ Do the summary and conclusions fairly refect the fndings?
+ References
+ Appendix
Improving the utility of evaluation fndings and lessons shared: + Communicating results or writing reports is not suffcient
for shifting the needle from evidence to action. Proactive steps are needed for ensuring that the fndings are used.
+ Including stakeholders at every stage of the program and evaluation increases the chances of the evaluation results being utilized.
+ Strategies for ensuring the utility of evaluation fndings and lessons shared include:
- Recommendations: Transform the fndings into
recommendations that are specifc to the target
audience and consider the purpose of the evaluation.
Avoid providing recommendations that do not have
any evidence and are not in line with the
stakeholders’ values. - Engage stakeholders: Provide information to the
stakeholders on how to apply the results for
improving their programs or for advocating for future
funding, etc. - Provide suffcient background information to avoid
misinterpretation of results. - Tailor the dissemination efforts according to the needs
of the stakeholders: Sometimes using multiple
channels and frequent dissemination can be helpful in
reaching the target audience.
A Primer for Evaluating Underage Drinking and Driving Programs 55
Ch
apte
r 1 C
hap
ter 2
C
hap
ter 3
C
hap
ter 4
C
hap
ter 5
C
hap
ter 6
C
hap
ter 7
Ch
apte
r 8
Spotlight: FDA staff scientist
Placeholder text. A picture of idendae dolum iducidem aut explitae quasinumintia doloresecto eos sum nis repra pe volupic toratecto.
8 Putting It Together
THE PURPOSE of this primer has been to provide practical tools for anyone interested in evaluating underage drinking and driving programs. Two of the more critical takeaway messages are 1) integrate evaluation into program planning and implementation rather than considering it a post-implementation option; and 2) develop a written evaluation plan that is tailored, as well as possible, to the program being implemented.

First and foremost, it is strongly recommended to integrate evaluation into program planning and implementation rather than considering it as a post-implementation option. Including program evaluation from the beginning allows the maximum benefts from the evaluation process to be reaped. To reiterate, some of the benefts include:
+ Gaining insights into the needs of the target audience,
allowing more effective programs to be developed that
address those needs;
+ Developing SMART objectives, which will serve as
milestones and may provide feedback on overall
progress;
+ Improving the program based on evaluation fndings; and
+ Ensuring the sustainability of the program.
Second, the importance of planning an evaluation and developing a written evaluation plan are emphasized. Some of the key elements of the evaluation plan and some of the best practices for each are outlined below.
Purpose of the evaluation – intended use and stakeholders
+ Defne the purpose of the evaluation. What is the
intended use?
+ Identify and engage the stakeholders. This ensures that
the evaluation represents the needs of the stakeholders
and that the fndings will be used.
+ Engage stakeholders at every stage of the program
evaluation.
Evaluation questions + Make sure that the evaluation questions match the
purpose of the evaluation and represent what the
stakeholders hope to answer.
Program description + Develop SMART goals and objectives if the program has
not been developed or is in the program planning phase.
+ If the program is not in the pre-program or program
planning phase, consider identifying its current
program stage.
+ Develop a logic model that will connect the strategic planning of the program with its evaluation.
Evaluation of design + Make sure the design matches up with the evaluation
questions, purpose(s), and needs of the stakeholders.
Data collection methods + Understand the advantages and disadvantages of each
type of data collection method.
+ Consider triangulating the methods. Use a set of data
collection methods that complement each other instead
of choosing just one method.
Analysis and interpretation plan + Set aside some time and resources for this commonly
overlooked step, which will ultimately be helpful in utilizing and making sense of the evaluation results.
+ Consider developing evaluation standards ahead of time during the planning phase. Not only will this be a guide to conducting a high-quality evaluation, it will also inform many choices that must be made from among the multitude of options available at various stages of the evaluation.
Dissemination + Develop a plan for how to communicate the evaluation
fndings to the stakeholders. Consider using Table 11 in Chapter 7 for sorting this out.
Remember that while a set of steps for planning, implementing, and evaluating a program are provided, the implementation of a specifc program may not necessarily begin at Step 1. These steps should be imagined as a cycle of success rather than a linear progression with a clear beginning and end. Once a frst evaluation has been successfully completed, the information in this primer can be used to improve a program and its evaluation efforts.
Above all, create an evaluation culture that embraces and encourages participatory and utility-focused evaluation frameworks.
Ch
apte
r 1 C
hap
ter 2
C
hap
ter 3
C
hap
ter 4
C
hap
ter 5
C
hap
ter 6
C
hap
ter 7
Ch
apte
r 8
A Primer for Evaluating Underage Drinking and Driving Programs 57
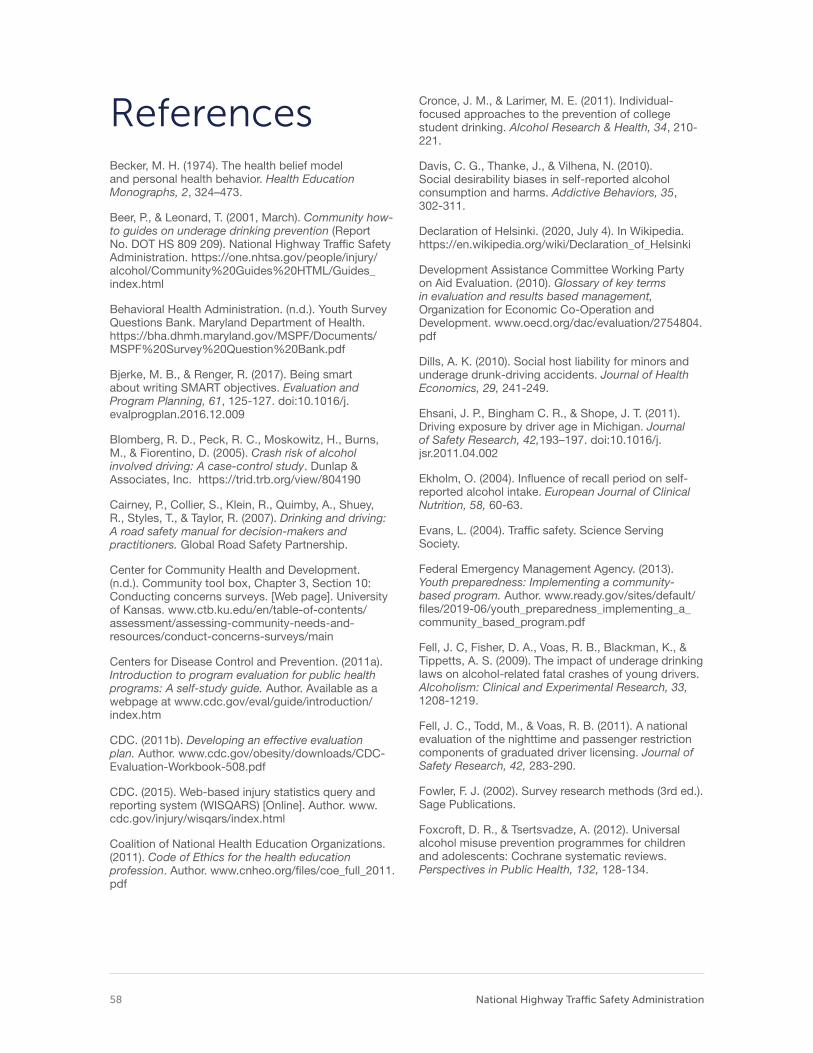
References Becker, M. H. (1974). The health belief model and personal health behavior. Health Education Monographs, 2, 324–473.
Beer, P., & Leonard, T. (2001, March). Community how-to guides on underage drinking prevention (Report No. DOT HS 809 209). National Highway Traffc Safety Administration. https://one.nhtsa.gov/people/injury/ alcohol/Community%20Guides%20HTML/Guides_ index.html
Behavioral Health Administration. (n.d.). Youth Survey Questions Bank. Maryland Department of Health. https://bha.dhmh.maryland.gov/MSPF/Documents/ MSPF%20Survey%20Question%20Bank.pdf
Bjerke, M. B., & Renger, R. (2017). Being smart about writing SMART objectives. Evaluation and Program Planning, 61, 125-127. doi:10.1016/j. evalprogplan.2016.12.009
Blomberg, R. D., Peck, R. C., Moskowitz, H., Burns, M., & Fiorentino, D. (2005). Crash risk of alcohol involved driving: A case-control study. Dunlap & Associates, Inc. https://trid.trb.org/view/804190
Cairney, P., Collier, S., Klein, R., Quimby, A., Shuey, R., Styles, T., & Taylor, R. (2007). Drinking and driving: A road safety manual for decision-makers and practitioners. Global Road Safety Partnership.
Center for Community Health and Development. (n.d.). Community tool box, Chapter 3, Section 10: Conducting concerns surveys. [Web page]. University of Kansas. www.ctb.ku.edu/en/table-of-contents/ assessment/assessing-community-needs-and-resources/conduct-concerns-surveys/main
Centers for Disease Control and Prevention. (2011a). Introduction to program evaluation for public health programs: A self-study guide. Author. Available as a webpage at www.cdc.gov/eval/guide/introduction/ index.htm
CDC. (2011b). Developing an effective evaluation plan. Author. www.cdc.gov/obesity/downloads/CDC-Evaluation-Workbook-508.pdf
CDC. (2015). Web-based injury statistics query and reporting system (WISQARS) [Online]. Author. www. cdc.gov/injury/wisqars/index.html
Coalition of National Health Education Organizations. (2011). Code of Ethics for the health education profession. Author. www.cnheo.org/fles/coe_full_2011. pdf
Cronce, J. M., & Larimer, M. E. (2011). Individual-focused approaches to the prevention of college student drinking. Alcohol Research & Health, 34, 210-221.
Davis, C. G., Thanke, J., & Vilhena, N. (2010). Social desirability biases in self-reported alcohol consumption and harms. Addictive Behaviors, 35, 302-311.
Declaration of Helsinki. (2020, July 4). In Wikipedia. https://en.wikipedia.org/wiki/Declaration_of_Helsinki
Development Assistance Committee Working Party on Aid Evaluation. (2010). Glossary of key terms in evaluation and results based management, Organization for Economic Co-Operation and Development. www.oecd.org/dac/evaluation/2754804. pdf
Dills, A. K. (2010). Social host liability for minors and underage drunk-driving accidents. Journal of Health Economics, 29, 241-249.
Ehsani, J. P., Bingham C. R., & Shope, J. T. (2011). Driving exposure by driver age in Michigan. Journal of Safety Research, 42,193–197. doi:10.1016/j. jsr.2011.04.002
Ekholm, O. (2004). Infuence of recall period on self-reported alcohol intake. European Journal of Clinical Nutrition, 58, 60-63.
Evans, L. (2004). Traffc safety. Science Serving Society.
Federal Emergency Management Agency. (2013). Youth preparedness: Implementing a community-based program. Author. www.ready.gov/sites/default/ fles/2019-06/youth_preparedness_implementing_a_ community_based_program.pdf
Fell, J. C, Fisher, D. A., Voas, R. B., Blackman, K., & Tippetts, A. S. (2009). The impact of underage drinking laws on alcohol-related fatal crashes of young drivers. Alcoholism: Clinical and Experimental Research, 33, 1208-1219.
Fell, J. C., Todd, M., & Voas, R. B. (2011). A national evaluation of the nighttime and passenger restriction components of graduated driver licensing. Journal of Safety Research, 42, 283-290.
Fowler, F. J. (2002). Survey research methods (3rd ed.). Sage Publications.
Foxcroft, D. R., & Tsertsvadze, A. (2012). Universal alcohol misuse prevention programmes for children and adolescents: Cochrane systematic reviews. Perspectives in Public Health, 132, 128-134.
National Highway Trafc Safety Administration 58
Fylan, F., Hempel, S., Grunfeld, B, Conner M., & Lawton, R. (2006). Effective interventions for speeding motorists (Road Safety Research Report No. 66). [United Kingdom] Department for Transport. webarchive.nationalarchives.gov.uk/20110504194319/ www.dft.gov.uk/pgr/roadsafety/research/rsrr/theme2/ effectiveinterventionsforspe.pdf
Gebers, M. A. (1999). Strategies for estimating driver accident risk in relation to California’s negligent-operator point system (Technical monograph No. 183). California Department of Motor Vehicles. www.dmv. ca.gov/portal/uploads/2020/04/S4-183.pdf
Ghaffari, M., Tavassoli, E., Esmaillzadeh, A., & Hassanzadeh, A. (2012). Effect of health belief model based intervention on promoting nutritional behaviors about osteoporosis prevention among students of female middle schools in Isfahan, Iran. Journal of Education and Health Promotion, 1-14. www.ncbi.nlm. nih.gov/pubmed/23555117
Glanz, K., Rimer, B. K., & Lewis, F. M. (Eds.). (2002). Health behavior and health education (3rd ed.). Jossey-Bass [John Wiley & Sons].
Grant, S., LaBrie, J. W., Hummer, J. F., & Lac, A. (2012). How drunk am I? Misperceiving one’s level of intoxication in the college drinking environment. Psychology of Addictive Behaviors, 26, 51-58. doi:10.1037/a0023942
Hawkins, J. D., Oesterle, S., Brown, E. C., Arthur, M. W., Abbott, R. D., Fagan, A. A., & Catalano, R. F. (2009). Results of a type 2 translational research trial to prevent adolescent drug use and delinquency: A test of Communities That Care. Archives of Pediatrics & Adolescent Medicine, 163, 789-798.
Hingson, R., & White, A. (2014). New research fndings since the 2007 Surgeon General’s Call to Action to Prevent and Reduce Underage Drinking: A review. Journal of Studies on Alcohol and Drugs, 75, 158-169.
Hochbaum, G. M. (1958). Public participation in medical screening programs: A socio-psychological study (Publication No. 572). Public Health Service, Division of Special Health Services.
Institutional Review Board. (2020, April 17). In Wikipedia. https://en.wikipedia.org/wiki/Institutional_ review_board
Jerome, L., Segal, A., & Habinski, L. (2006). What we know about ADHD and driving risk: A literature review, meta-analysis and critique. Journal of the Canadian Academy of Child Adolescent Psychiatry, 15(3), 105-125.
Joint Committee on Standards for Educational Evaluation. (2017). Program evaluation standards statements [Webpage]. www.jcsee.org/program-evaluation-standards-statements [See below: The full report is cited as Yarbrough, D. B., Shula, L. M., Hopson, R. K., & Caruthers, F. A. (2010). The Program Evaluation Standards: A guide for evaluators and evaluation users (3rd. ed). Corwin Press.]
Kahan, S., Gielen, A. C., Fagan, P. J., & Green, L. W. (2014). Health behavior change in populations. Johns Hopkins University Press.
Kerr, W. C., & Stockwell, T. (2012). Understanding standard drinks and drinking guidelines. Drug and Alcohol Review, 31(2), 200-205. doi:10.1111/j.1465-3362.2011.00374.x
Klauer, S. G., Guo, F., Simons-Morton, B. G., Ouimet, M-C., Lee, S. E., & Dingus, T. A. (2014). Distracted driving and risk of road crashes among novice and experienced drivers. The New England Journal of Medicine, 370, 54-59.
Klauer, S. G., Simons-Morton, B., Lee, S. E., Ouimet, M. C., Howard, E. H., & Dingus, T. A. (2011, April). Novice drivers' exposure to known risk factors during the frst 18 months of licensure: The effect of vehicle ownership. Traffc Injury Prevention,12(2), 159-168.
Lemmens, P. H. (1994, May). The alcohol content of self-report and “standard” drinks. Addiction, 89, 593-601.
Lisowski, A. (2009). Reducing under [sic] age drinking. (Webpage Table). University of Wisconsin-Extension. https://fyi.extension.wisc.edu/programdevelopment/ fles/2016/03/AnnieLisowskialcohol.pdf
Massie, D. L., Campbell, K. L., & Williams, A. F. (1995). Traffc accident involvement rates by driver age and gender. Accident Analysis and Prevention, 27, 73-87.
McNamara, C. (n.d.). Basic guide to program evaluation (including outcomes evaluation). [Web page]. Free Management Library. https:// managementhelp.org/evaluation/program-evaluation-guide.htm [Web page based on McNamara, C., (2017, August 24). Field guide to nonproft program design, marketing and evaluation, 5th ed. Authenticity Consulting, LLC.]
Mihalic, S., Irwin, K., Fagan, A., Ballard, D., & Elliott, D. (2004, July). Successful program implementation: Lessons from blueprints (Juvenile Justice Bulletin). Offce of Justice Programs, Partnerships for Safer Communities. www.ncjrs.gov/pdffles1/ojjdp/204273. pdf
Referen
ces
A Primer for Evaluating Underage Drinking and Driving Programs 59
Milgram experiment. (2020, June 28). In Wikipedia. en.wikipedia.org/wiki/Milgram_experiment
National Center for Statistics and Analysis. (in press). Young drivers: 2018 data (Traffc Safety Facts. Report No. DOT HS 812 968). https://crashstats.nhtsa.dot. gov/Api/Public/ViewPublication/812968
National Commission for the Protection of Human Subjects of Biomedical and Behavioral Research. (1979, April 18). The Belmont report: Ethical principles and guidelines for the protection of human subjects of research. Offce for Human Research Protections. www.hhs.gov/ohrp/sites/default/fles/the-belmont-report-508c_FINAL.pdf
National Institute on Alcohol Abuse and Alcoholism. (1997, July). Youth drinking: Risk factors and consequences (Alcohol Alert No. 37). https://pubs. niaaa.nih.gov/publications/aa37.htm
Nazi human experimentation. (2020, July 3). In Wikipedia. https://en.wikipedia.org/wiki/Nazi_human_ experimentation
Parker, D., Manstead, A. S. R., Stradling, S. G., Reason, J. T., & Baxter, J. S. (1992). Intention to commit driving violations: An application of the theory of planned behavior. Journal of Applied Psychology, 77, 94-101.
Peck, R. C., Arstein-Kerslake, G. W., & Helander, C. J. (1994). Psychometric and biographical correlates of drunk-driving recidivism and treatment programs compliance. Journal of Studies on Alcohol, 55(6), 667-678.
Peck, R. C., Gebers, M. A., Voas, R. B., & Romano, E. (2008). The relationship between blood alcohol concentration (BAC), age, and crash risk. Journal of Safety Research, 39, 311-319. doi:10.1016/j. jsr.2008.02.030
Peersman, G. (2014). Overview: Data collection and analysis methods in impact evaluation (Methodological Briefs: Impact Evaluation 10). UNICEF Offce of Research-Innocenti. www.unicef-irc.org/publications/ pdf/brief_10_data_collection_analysis_eng.pdf
Pell Institute. (2017a). Choose an evaluation design (Webpage). Author. http://toolkit.pellinstitute.org/ evaluation-guide/planbudget/choose-an-evaluation-design/
Pell Institute. (2017b). Select an evaluator (Webpage). Author. http://toolkit.pellinstitute.org/evaluationguide/ plan-budget/select-an-evaluator/
Pell Institute. (2017c). Determine collection method (Webpage). Author. http://toolkit.pellinstitute.org/ evaluation-guide/collectdata/determine-collection-method/
Project STAR. (2006, June 13). Study designs for program evaluation (Report No. A-EV037). Author. www.pacenterofexcellence.pitt.edu/documents/Study_ Designs_for_Evaluation.pdf [STAR: Steps to Achieving Resilience]
Richard, C. M., Campbell, J. L., Lichty, M. G., Brown, J. L., Chrysler, S., Lee, J. D., Boyle, L., & Reagle, G. (2013). Motivations for speeding, volume II: Findings report (Report No. DOT HS 811 818). National Highway Traffc Safety Administration. www.nhtsa.gov/ sites/nhtsa.dot.gov/fles/811818.pdf
Richard, C. M., Magee, K., Bacon-Abdelmoteleb, P., & Brown, J. L. (2018, April). Countermeasures that work: A highway safety countermeasure guide for State Highway Safety Offces, 9th edition (Report No. DOT HS 812 478). National Highway Traffc Safety Administration. www.nhtsa.gov/sites/nhtsa.dot.gov/ fles/documents/812478_countermeasures-that-work-a-highway-safety-countermeasures-guide-.pdf
Rimer, B. K., & Glanz, K. (2005). Theory at a glance: A guide for health promotion practice (2nd edition). National Cancer Institute. www. sbccimplementationkits.org/demandrmnch/wp-content/uploads/2014/02/Theory-at-a-Glance-A-Guide-For-Health-Promotion-Practice.pdf
Rockwell, K., & Bennett, C. (2004). Targeting outcomes of programs: A hierarchy for targeting outcomes and evaluating their achievement (Paper No. 48). Faculty publications: Agricultural Leadership, Education & Communication Department, University of Nebraska-Lincoln. https://digitalcommons.unl.edu/ aglecfacpub/48/
Rogers, P. (2014). Overview: Strategies for causal attribution (Methodological Briefs: Impact Evaluation 60). UNICEF Offce of Research-Innocenti. www. unicef-irc.org/publications/pdf/brief_6_overview_ strategies_causal_attribution_eng.pdf
Romano, E. O., Peck, R. C., & Voas, R. B. (2012). Traffc environment and demographic factors affecting impaired driving and crashes. Journal of Safety Research, 43, 75-82. doi:10.1016/j.jsr.2011.12.001
Sacks, J. J., Gonzales, K. R., Bouchery, E. E., Tomedi, L. E., & Brewer, R. D. (2015). 2010 National and state costs of excessive alcohol consumption. American Journal of Preventive Medicine, 49(5), 73-79.
Schwarz, N. (1999). Self-reports: How the questions shape the answers. American Psychologist, 54, 93-105.
Schwarz, N., & Oyserman, D. (2001). Asking questions about behavior: Cognition, communication, and questionnaire construction. American Journal of Evaluation, 22(2), 127- 160. doi: 10.1177/109821400102200202
National Highway Trafc Safety Administration 60
A Primer for Evaluating Underage Drinking and Driving Programs 61
Schwarz, N. (2007). Retrospective and concurrent self-reports: The rationale for real-time data capture. In A. Stone, S. Shiffman, A. Atienza, & L. Nebeling (Eds.), The science of real-time data capture: Self-reports in health research (pp. 11-26). Oxford University Press.
Simons-Morton, B. G., Klauer, S. G., Ouimet, M. C., Guo, F., Albert, P. S., Lee, S. E., Ehsani, J. P., Pradhan, A. K., & Dingus T. A. (2015). Naturalistic Teenage Driving Study: Findings and lessons learned. Journal of Safety Research, 54, 41-e29.
Shults, R. A., Elder, R. W., Sleet, D. A., Nichols, J. L., Alao, M. O., Carande-Kulis, V. G., Thompson, R. S., & The Task Force on Community Preventive Services (2001). Reviews of evidence regarding interventions to reduce alcohol-impaired driving. American Journal of Preventive Medicine, 21(4), Supplement 1, 66-88.
Sivak, M., Luoma, J., Flannagan, M. J., Bingham, C. R., Eby, D. W., & Shope, J. T. (2007). Traffc safety in the U.S.: Re-examining major opportunities. Journal of Safety Research, 38, 337-355.
Smit, E., Verdurmen, J., Monshouwer, K., & Smit, F. (2008). Family interventions and their effect on adolescent alcohol use in general populations: A meta-analysis of randomized controlled trials. Drug and Alcohol Dependence, 97, 195-206.
Smith R. C. (2011). Incorporating motives into the theory of planned behavior: Implications for reducing alcohol abuse among college students (Unpublished master’s thesis). Virginia Tech, Blacksburg, VA.
Smith, R. C., Doerzaph, Z., & Hankey, J. (2015). Naturalistic driving study: Alcohol sensor performance (SHRP 2 Report No. S2-S31-RW-2). National Academies Press. https://doi.org/10.17226/22230
Smith, R. C., & Geller, E. S. (2009). Marketing and alcohol-related traffc fatalities: Impact of alcohol advertising targeting minors. Journal of Safety Research, 40(5), 359-364.
Smith, R. C., Baker, S., Downing, C. O., & Klauer, S. G. (in press). Effective underage drinking countermeasures that reduce crashes: Literature review. National Highway Traffc Safety Administration.
Spoth, R., Greenberg, M., & Turrisi, R. (2008). Preventive interventions addressing underage drinking: State of the evidence and steps toward public health impact. Pediatrics, 121, Supplement 4, S311-S336.
Sudhinaraset, M., Wigglesworth, C., & Takeuchi, D. T. (2016). Social and cultural contexts of alcohol use: Infuences in a social-ecological framework. Alcohol Research: Current Reviews, 38(1), 35–45.
Taylor-Powell, E. (1998, May) Sampling. University of Wisconsin-Extension. https://cdn.shopify.com/s/ fles/1/0145/8808/4272/fles/G3658-03.pdf
Tuskegee syphilis experiment. (2020, July 12). In Wikipedia. https://en.wikipedia.org/wiki/Tuskegee_ syphilis_experiment
United States Holocaust Memorial Museum. (n.a.). Nuremberg code. [Web page]. www.ushmm.org/ information/exhibitions/online-exhibitions/special-focus/ doctors-trial/nuremberg-code
Voas, R. B, Torres, P., Romano, E., & Lacey, J. H. (2012). Alcohol-related risk of driver fatalities: An update using 2007 data. Journal of Studies on Alcohol and Drugs, 73(3), 341-50.
W. K. Kellogg Foundation. (2004, January). Logic model development guide: Using logic models to bring together planning, evaluation, and action. Author. www. wkkf.org/resource-directory/resources/2004/01/logic-model-development-guide
White, H. R., Kraus, C., Flom, J., Kestenbaum, L., Mitchell, J., Shah, K., & Swartzwelder, H. S. (2005). College students lack knowledge of standard drink volumes: Implications for defnitions of risky drinking based on survey data. Alcoholism: Clinical and Experimental Research, 29, 631-638.
Yarbrough, D. B., Shula, L. M., Hopson, R. K., & Caruthers, F. A. (2010). The Program Evaluation Standards: A guide for evaluators and evaluation users (3rd. ed). Corwin Press. Webpage portal available at https://jcsee.org/program/
Ying, Y.-H., Wu, C.-C., & Chang, K. (2013). The effectiveness of drinking and driving policies for different alcohol-related fatalities: A quantile regression analysis. International Journal of Environmental Research and Public Health, 10(10), 4628–4644. http://doi. org/10.3390/ijerph10104628 66
Referen
ces
62 National Highway Trafc Safety Administration
Appendix A: Overview of Relevant Public Health and Psychology-Based Models
Socio-Ecological Model
When the goal of any program or initiative
is to change behaviors, such as preventing
drunk driving among underage drivers, it
is important to understand the following
concepts.
1. Human behavior is very complex and is infuenced by a multitude of factors, such as one’s attitudes about drinking and driving, perceptions of how friends, family, and signifcant others view underage drinking and driving, and availability of alcohol for underage drivers.
2. Knowledge of risk factors and how they infuence one’s choice to drink and drive.
The socio-ecological model is a good model to understand human behaviors, and provides information on how to address them. + The premise of the socio-ecological model is that
human behavior is very complex and is infuenced by factors that play at various levels: individual, interpersonal (peers/family), institutional, or community, and public policy.
+ The factors that play at the individual level are one’s attitudes, perceptions (perceived risks, susceptibility to be in a crash, etc.), perception of the ease or diffculty of drunk driving, perceived benefts and barriers for engaging in drinking and driving, etc. Several health behavior and psychology models such as the health-belief model and theory of planned behavior would help in systematic identifcation of individual factors infuencing underage drinking and driving. See below for a summary of these models. Programs that are intended to change factors at this level are normally education-related activities that will increase knowledge and awareness of risks related to drinking and driving, change attitudes and perceptions, and provide tools to help change behaviors. However, just providing information and/or addressing the factors at the individual level is not suffcient to bring changes in underage drinking and driving.
+ The factors at the interpersonal level include infuence on personal behaviors by peers or family members, such as the presence or lack of support for not engaging in drinking and driving, and norms (whether family or signifcant others or friends approve of the behavior).
+ The factors at the organizational or institutional level include the rules and regulations of an organization that one belongs to, for example, the rules at schools regarding drinking.
+ The factors at the community level include sociocultural and structural factors such as whether alcohol is easily available for underage drivers, etc.
+ Public policy/societal factors include policies and enforcement in place at local, state, and national levels that will infuence the choice to drink and drive, such as minimum drinking age, penalties for drinking and driving, zero tolerance, etc.
For additional information regarding socio-ecological models please see:
Kahan, S., Gielen, A. C., Fagan, P. J., & Green, L. W. (2014). Health behavior change in populations. Johns Hopkins University Press.
Glanz, K., Rimer, B. K., & Lewis, F. M. (Eds.). (2002). Health behavior and health education (3rd ed.). Jossey-Bass.
Health Belief Model
The health belief model (HBM), a well-recognized health behavioral model, suggests that individual engagement in certain behaviors and the likelihood of behavior change is determined by one’s perceived susceptibility to injury, perceived severity of injury, perceived benefts of taking a specifc action, beliefs about one’s capability to take action (self-effcacy) and the availability of cues to action (Hochbaum, 1958; Glanz et al., 2002; National Cancer Institute, 2003). The addition of individual factors such as personality, knowledge and attitudes improves the model’s capacity to understand the underlying factors that play a role in individual’s behavior (Glanz et al., 2002). This model was successfully used in planning effective interventions for changing individual’s behaviors and attitudes and for evaluating the effect of interventions in bringing changes in behaviors such as seat belt use (Becker, 1974; Ghaffari et al., 2012). One point to note is that HBM doesn’t provide strategies of intervening; however, it is helpful when one would like to identify the potential factors that are operating at the individual level.
Limitations of HBM: + The original HBM model does not consider personality,
attitudes, or beliefs; however, the most recent modifed models do consider these components.
+ Neglects behaviors that are habitual such as smoking or drinking.
+ Neglects behaviors that are infuenced by peer pressures or to gain social acceptability such as drinking and driving if friends are also involved in such behaviors.
A Primer for Evaluating Underage Drinking and Driving Programs 63
+ Neglects the infuence of context or environment that could reinforce or prevent behaviors.
+ Assumes that individuals make decisions rationally, i.e., considering the health effects of drinking and driving, which may not be true. So many other factors such as peer infuence, societal factors, etc. do play a role as to whether an individual chooses to drink and drive or not.
Therefore, it is also important to integrate or combine the HBM model with other models such as the socio-economic model for effective use of health models to help shape behaviors of interest.
Theory of Planned Behavior Experts have used the Theory of Planned Behavior (TPB) for several transportation-related behaviors such as altering speeding behaviors (Fylan et al., 2006; Richard et al., 2013) and alcohol abuse in college students (Smith, 2011). The model suggests that intentions, attitudes (both cognitive and affective), beliefs, perceived behavioral control, self-effcacy, personality factors, self-identity, and perceptions of norms play a role in one’s behavior (National Cancer Institute, 2003). Perceived behavioral control is defned as “the degree to which a person feels that engaging or non-engaging in a behavior is under his or her volitional control" (Parker et al., 1992), while self-effcacy denotes one’s confdence in their ability to successfully implement a recommended action (Fylan et al., 2006). However, it is diffcult to directly change driver intentions.Therefore, interventions should target other factors that are easier to modify (e.g., attitudes, beliefs, values, perceptions, norms, and self-effcacy).
Limitations of the TPB: + Neglects to consider that not all individuals have the
same opportunities to engage in the behavior of interest
+ Neglects the infuence of factors such as previous experience, fear, etc. on the behavior of interest
+ Neglects the infuence of social, environmental, and contextual factors on behaviors
+ Neglects to consider changes in behaviors over time
+ Neglects the fact that perceived behavioral control is not the same as actual behavioral control
+ Assumes that intentions directly result in behaviors
Over time, several components were added to the TPD to address some of the above limitations. For instance, Smith (2011) proposed the addition of motives into the model to better predict alcohol abuse in college students.
Ap
pen
dices
Ap
pen
dix A
64 National Highway Trafc Safety Administration
Appendix B: Determining Sample Sizes for Diferent Precision Levels Below is a short list of statistical calculators that are available online to estimate sample size based on
desired level of precision.
Statistical calculators for sample size selection
Creative Research Systems: www.surveysystem.com/sscalc.htm
National Statistical Service: www.nss.gov.au/nss/home.nsf/pages/Sample+size+calculator
UCSF Clinical & Translational Science Institute: Sample Size Calculators: www.sample-size.net/

A Primer for Evaluating Underage Drinking and Driving Programs 65

DOT HS 812 953
June 2021
1200 New Jersey Avenue SE Washington, DC 20590
www.nhtsa.gov
14840-060221-v12b


![Underage drinking[1]](https://img.pdfslide.net/doc/110x75/547c0174b4af9fa8118b45d9/underage-drinking1.jpg)