Embed Size (px)
Citation preview
A Profile of
Older Americans: 2011
Administration on Aging U.S. Department of Health and Human Services
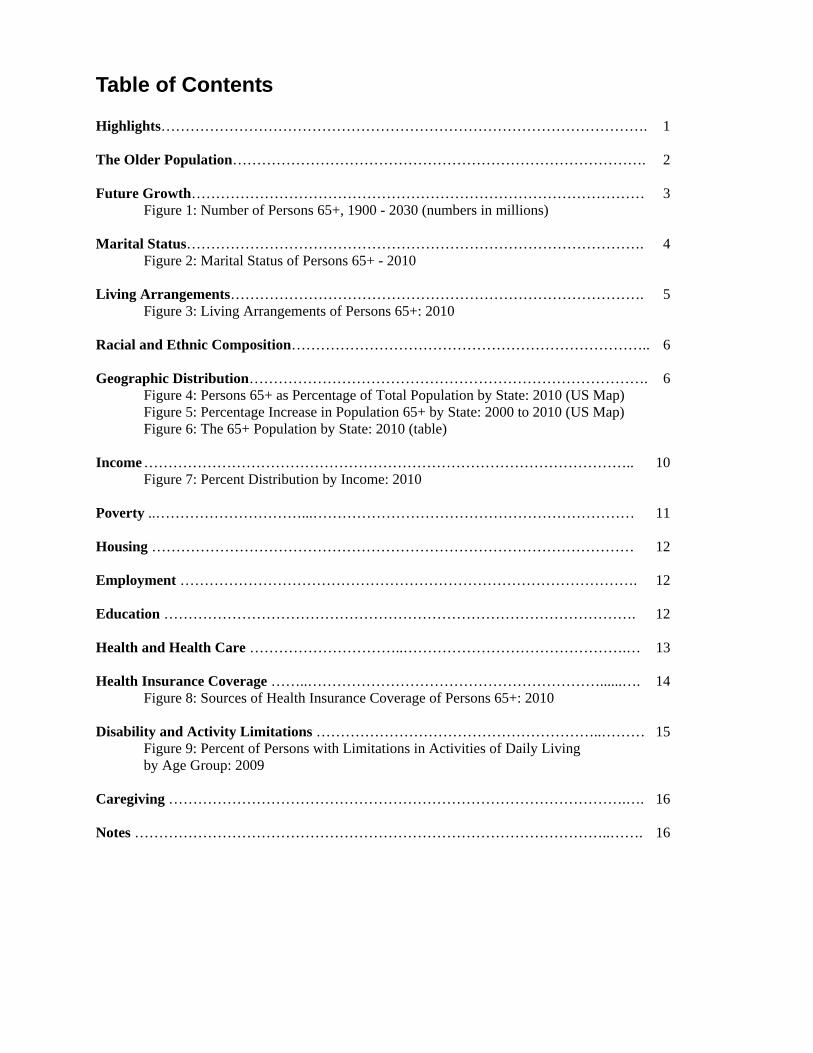
Table of Contents Highlights………………………………………………………………………………………. 1 The Older Population…………………………………………………………………………. 2 Future Growth………………………………………………………………………………… 3 Figure 1: Number of Persons 65+, 1900 - 2030 (numbers in millions) Marital Status…………………………………………………………………………………. 4 Figure 2: Marital Status of Persons 65+ - 2010 Living Arrangements…………………………………………………………………………. 5 Figure 3: Living Arrangements of Persons 65+: 2010 Racial and Ethnic Composition……………………………………………………………….. 6 Geographic Distribution………………………………………………………………………. 6
Figure 4: Persons 65+ as Percentage of Total Population by State: 2010 (US Map) Figure 5: Percentage Increase in Population 65+ by State: 2000 to 2010 (US Map) Figure 6: The 65+ Population by State: 2010 (table)
Income ……………………………………………………………………………………….. 10 Figure 7: Percent Distribution by Income: 2010 Poverty ..…………………………...………………………………………………………… 11 Housing ……………………………………………………………………………………… 12 Employment …………………………………………………………………………………. 12 Education ……………………………………………………………………………………. 12 Health and Health Care …………………………..……………………………………….… 13 Health Insurance Coverage ……..……………………………………………………......…. 14 Figure 8: Sources of Health Insurance Coverage of Persons 65+: 2010 Disability and Activity Limitations …………………………………………………..……… 15 Figure 9: Percent of Persons with Limitations in Activities of Daily Living
by Age Group: 2009 Caregiving ………………………………………………………………………………….…. 16 Notes ……………………………………………………………………………………..……. 16
Highlights*
• The older population (65+) numbered 40.4 million in 2010, an increase of 5.4 million or 15.3% since 2000.
• The number of Americans aged 45-64 – who will reach 65 over the next two decades – increased by 31% during this decade.
• Over one in every eight, or 13.1%, of the population is an older American. • Persons reaching age 65 have an average life expectancy of an additional 18.8 years (20.0 years
for females and 17.3 years for males). • Older women outnumber older men at 23.0 million older women to 17.5 million older men. • In 2010, 20.0% of persons 65+ were minorities--8.4% were African-Americans.** Persons of
Hispanic origin (who may be of any race) represented 6.9% of the older population. About 3.5% were Asian or Pacific Islander,** and less than 1% were American Indian or Native Alaskan.** In addition, 0.8% of persons 65+ identified themselves as being of two or more races.
• Older men were much more likely to be married than older women--72% of men vs. 42% of women (Figure 2). 40% older women in 2010 were widows.
• About 29% (11.3 million) of noninstitutionalized older persons live alone (8.1 million women, 3.2 million men).
• Almost half of older women (47%) age 75+ live alone. • About 485,000 grandparents aged 65 or more had the primary responsibility for their
grandchildren who lived with them. • The population 65 and over has increased from 35 million in 2000 to 40 million in 2010 (a 15%
increase) and is projected to increase to 55 million in 2020 (a 36% increase for that decade). • The 85+ population is projected to increase from 5.5 million in 2010 and then to 6.6 million in
2020 (19%) for that decade. • Minority populations have increased from 5.7 million in 2000 (16.3% of the elderly population)
to 8.1 million in 2010 (20% of the elderly) and are projected to increase to 13.1 million in 2020 (24% of the elderly).
• The median income of older persons in 2010 was $25,704 for males and $15,072 for females. Median money income (after adjusting for inflation) of all households headed by older people fell 1.5% (not statistically significant) from 2009 to 2010. Households containing families headed by persons 65+ reported a median income in 2010 of $45,763.
• The major sources of income as reported by older persons in 2009 were Social Security (reported by 87% of older persons), income from assets (reported by 53%), private pensions (reported by 28%), government employee pensions (reported by 14%), and earnings (reported by 26%).
• Social Security constituted 90% or more of the income received by 35% of beneficiaries in 2009 (22% of married couples and 43% of non-married beneficiaries).
• Almost 3.5 million elderly persons (9.0%) were below the poverty level in 2010. This poverty rate is not statistically different from the poverty rate in 2009 (8.9%). During 2011, the U.S. Census Bureau also released a new Supplemental Poverty Measure (SPM) which takes into account regional variations in the livings costs, non-cash benefits received, and non-discretionary expenditures but does not replace the official poverty measure. The SPM shows a poverty level for older persons of 15.9%, an increase of over 75% over the official rate of 9.0% mainly due to medical out-of-pocket expenses.
• About 11% (3.7 million) of older Medicare enrollees received personal care from a paid or unpaid source in 1999.
*Principal sources of data for the Profile are the U.S. Census Bureau, the National Center for Health Statistics, and the Bureau of Labor Statistics. The Profile incorporates the latest data available but not all items are updated on an annual basis.

The Older Population
The older population--persons 65 years or older--numbered 40.4 million in 2010 (the most recent year for which data are available). They represented 13.1% of the U.S. population, over one in every eight Americans. The number of older Americans increased by 5.4 million or 15.3% since 2000, compared to an increase of 8.7% for the under-65 population. However, the number of Americans aged 45-64 – who will reach 65 over the next two decades – increased by 31% during this period. In 2010, there were 23.0 million older women and 17.5 million older men, or a sex ratio of 132 women for every 100 men. The female to male sex ratio increases with age, ranging from 112 for the 65-69 age group to a high of 206 for persons 85 and over. Since 1900, the percentage of Americans 65+ has more than tripled (from 4.1% in 1900 to 13.1% in 2010), and the number has increased almost thirteen times (from 3.1 million to 40.4 million). The older population itself is increasingly older. In 2010, the 65-74 age group (20.8 million) was 10 times larger than in 1900. In contrast, the 75-84 group (13.1 million) was 17 times larger and the 85+ group (5.5 million) was 45 times larger. In 2009, persons reaching age 65 had an average life expectancy of an additional 18.8 years (20.0 years for females and 17.3 years for males). A child born in 2009 could expect to live 78.2 years, about 30 years longer than a child born in 1900. Much of this increase occurred because of reduced death rates for children and young adults. However, the period of 1990-2007 also has seen reduced death rates for the population aged 65-84, especially for men – by 41.6% for men aged 65-74 and by 29.5% for men aged 75-84. Life expectancy at age 65 increased by only 2.5 years between 1900 and 1960, but has increased by 4.2 years from 1960 to 2007. Nonetheless, some research has raised concerns about future increases in life expectancy in the US compared to other high-income countries, primarily due to past smoking and current obesity levels, especially for women age 50 and over (National Research Council (2011)). About 2.6 million persons celebrated their 65th birthday in 2010. In the same year, almost 1.8 million persons 65 or older died. Census estimates showed an annual net increase of 814,406 in the number of persons 65 and over. There were 53,364 persons aged 100 or more in 2010 (0.13% of the total 65+ population).*** This is a 53% increase from the 1990 figure of 37,306. (Data for this section were compiled primarily from Internet releases of the U.S. Census Bureau and the National Center for Health Statistics/Health Data Interactive).
- 2-
Future Growth
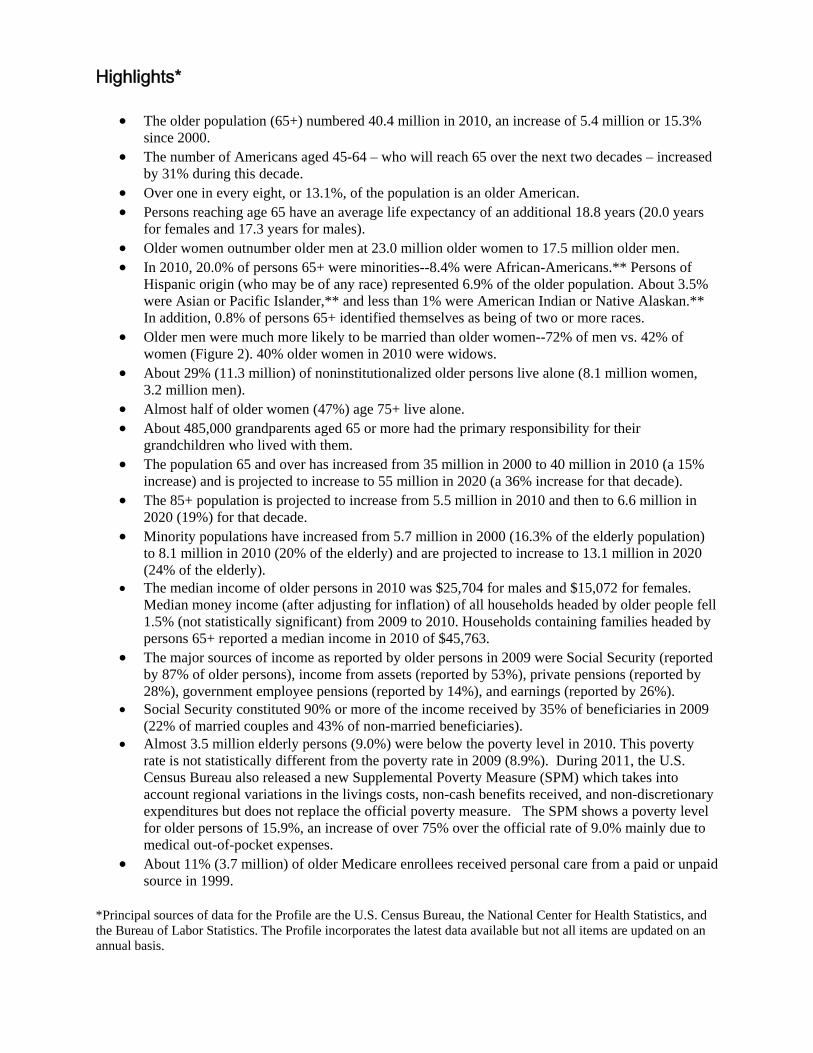
The older population will continue to grow significantly in the future (see Figure 1). This growth slowed somewhat during the 1990's because of the relatively small number of babies born during the Great Depression of the 1930's. But the older population will burgeon between the years 2010 and 2030 when the "baby boom" generation reaches age 65. The population 65 and over has increased from 35 million in 2000 to 40 million in 2010 (a 15% increase) and is projected to increase to 55 million in 2020 (a 36% increase for that decade). By 2030, there will be about 72.1 million older persons, over twice their number in 2000. People 65+ represented 13.1% of the population in the year 2010 but are expected to grow to be 19.3% of the population by 2030. The 85+ population is projected to increase from 5.5 million in 2010 and then to 6.6 million in 2020 (19%) for that decade. Minority populations have increased from 5.7 million in 2000 (16.3% of the elderly population) to 8.1 million in 2010 (20% of the elderly) and are projected to increase to 13.1 million in 2020 (24% of the elderly). Between 2010 and 2030, the white** population 65+ is projected to increase by 59% compared with 160% for older minorities, including Hispanics (202%), African-Americans** (114%), American Indians, Eskimos, and Aleuts** (145%), and Asians and Pacific Islanders** (145%).
Note: Increments in years are uneven. (Sources: Projections for 2010 through 2050 are from: Table 12. Projections of the Population by Age and Sex for the United States: 2010 to 2050 (NP2008-T12), Population Division, U.S. Census Bureau; Release Date: August 14, 2008. The source of the data for 1900 to 2000 is Table 5. Population by Age and Sex for the United States: 1900 to 2000, Part A. Number, Hobbs, Frank and Nicole Stoops, U.S. Census Bureau, Census 2000 Special Reports, Series CENSR-4, Demographic Trends in the 20th Century. The data for 2010 are from the U.S. Census Bureau Decennial Census.)
- 3-
Marital Status
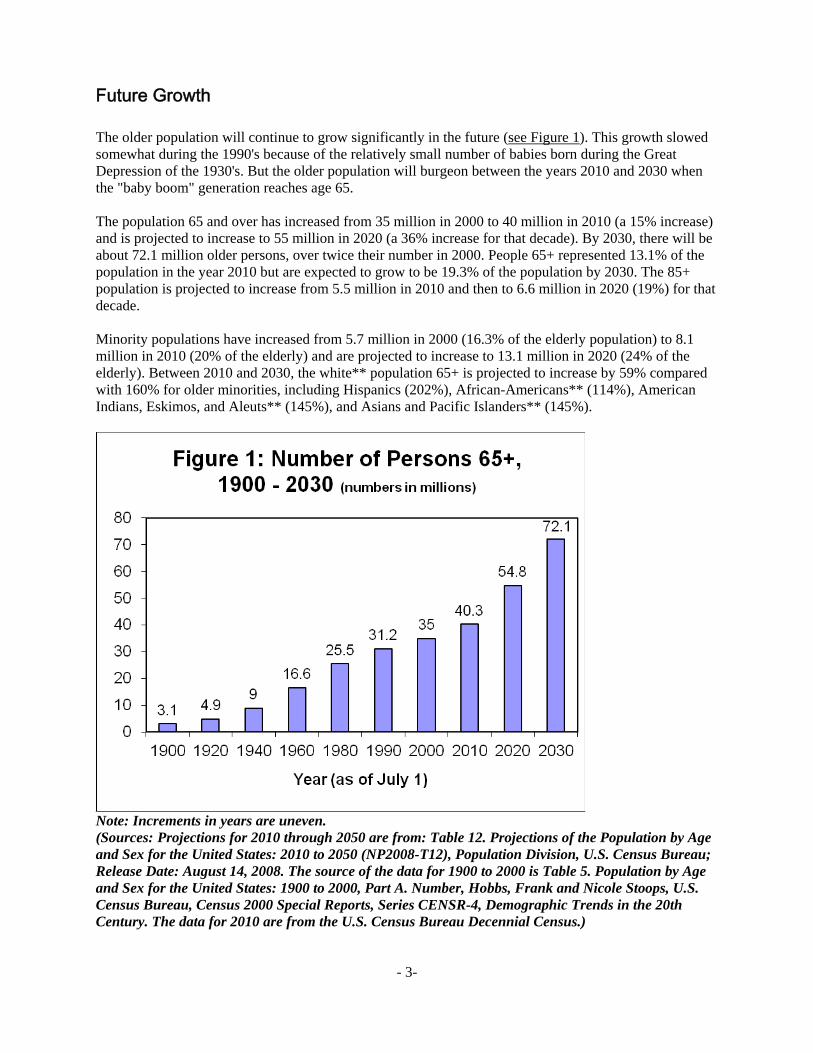
In 2010, older men were much more likely to be married than older women--72% of men, 42% of women (Figure 2). Widows accounted for 40% of all older women in 2010. There were over four times as many widows (8.7 million) as widowers (2.1 million). Divorced and separated (including married/spouse absent) older persons represented only 12.4% of all older persons in 2010. However, this percentage has increased since 1980, when approximately 5.3% of the older population were divorced or separated/spouse absent.
(Based on Internet releases of data from the 2010 Current Population Survey, Annual Social and Economic Supplement of the U.S. Census Bureau)
- 4 -
Living Arrangements
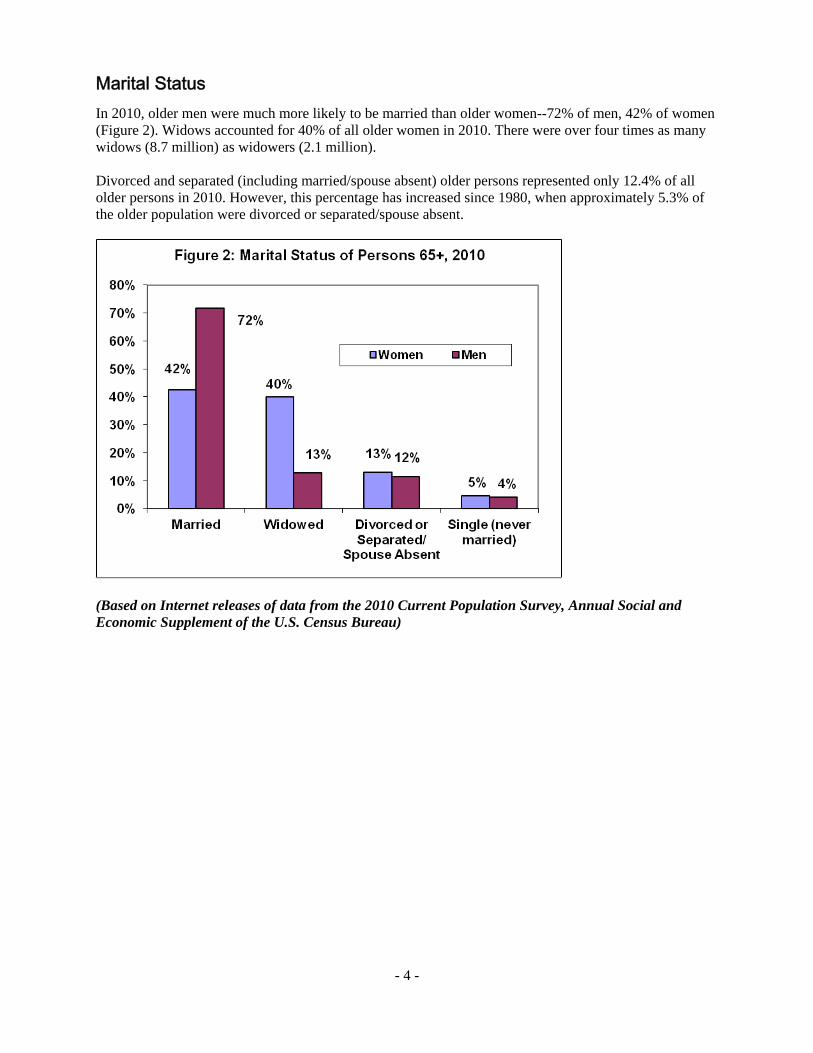
Over half (55.1%) the older noninstitutionalized persons lived with their spouse in 2010. Approximately 11.7 million or 69.9% of older men, and 9.0 million or 41.3% of older women, lived with their spouse (Figure 3). The proportion living with their spouse decreased with age, especially for women. Only 30.4% of women 75+ years old lived with a spouse. About 29.3% (11.3 million) of all noninstitutionalized older persons in 2010 lived alone (8.1 million women, 3.2 million men). They represented 37.3% of older women and 19.1% of older men. The proportion living alone increases with advanced age. Among women aged 75 and over, for example, almost half (47%) lived alone. Approximately 746,000 grandparents aged 65 or over maintained households in which grandchildren were present in 2010. (Another 275,000 elderly were spouses of such people.) In addition, about 955,000 grandparents over 65 years lived in parent-maintained households in which their grandchildren were present. A total of about 1.94 million older people lived in household with a grandchild present in the house. About 485,000 of these grandparents over 65 years old were the persons with primary responsibility for their grandchildren who lived with them. A relatively small number (1.5 million) and percentage (4.1%) of the 65+ population in 2009 lived in institutional settings such as nursing homes (1.3 million). However, the percentage increases dramatically with age, ranging (in 2009) from 1.1% for persons 65-74 years to 3.5% for persons 75-84 years and 13.2% for persons 85+. In addition, approximately 2.4% of the elderly lived in senior housing with at least one supportive service available to their residents. Figure 3: Living Arrangements of Persons 65+, 2010
(Based on data from U.S. Census Bureau including the 2010 Current Population Survey, Annual Social and Economic Supplement and the 2010 American Community Survey. See: November 2010 Current Population Survey Internet releases, Detailed Tables and data from the 2009 Medicare Current Beneficiary Survey retrieved from Health Data Interactive, 11/29/2011; also the 2007 Medicare Current Beneficiary Survey)
- 5 -
Racial and Ethnic Composition
In 2010, 20.0% of persons 65+ were minorities--8.4% were African-Americans.** Persons of Hispanic origin (who may be of any race) represented 6.9% of the older population. About 3.5% were Asian or Pacific Islander,** and less than 1% were American Indian or Native Alaskan.** In addition, 0.8% of persons 65+ identified themselves as being of two or more races. Only 7.2% of all the people who were minority race or of Hispanic ethnicity were 65+ in 2010 (8.9% of African-Americans,** 5.5% of Hispanics, 9.4% of Asians and Pacific Islanders,** 8.0% of American Indians and Native Alaskans,**), compared with 16.3% of non-Hispanic whites.** (Data for this section were compiled from Internet releases of the 2010 Decennial Census).
Geographic Distribution
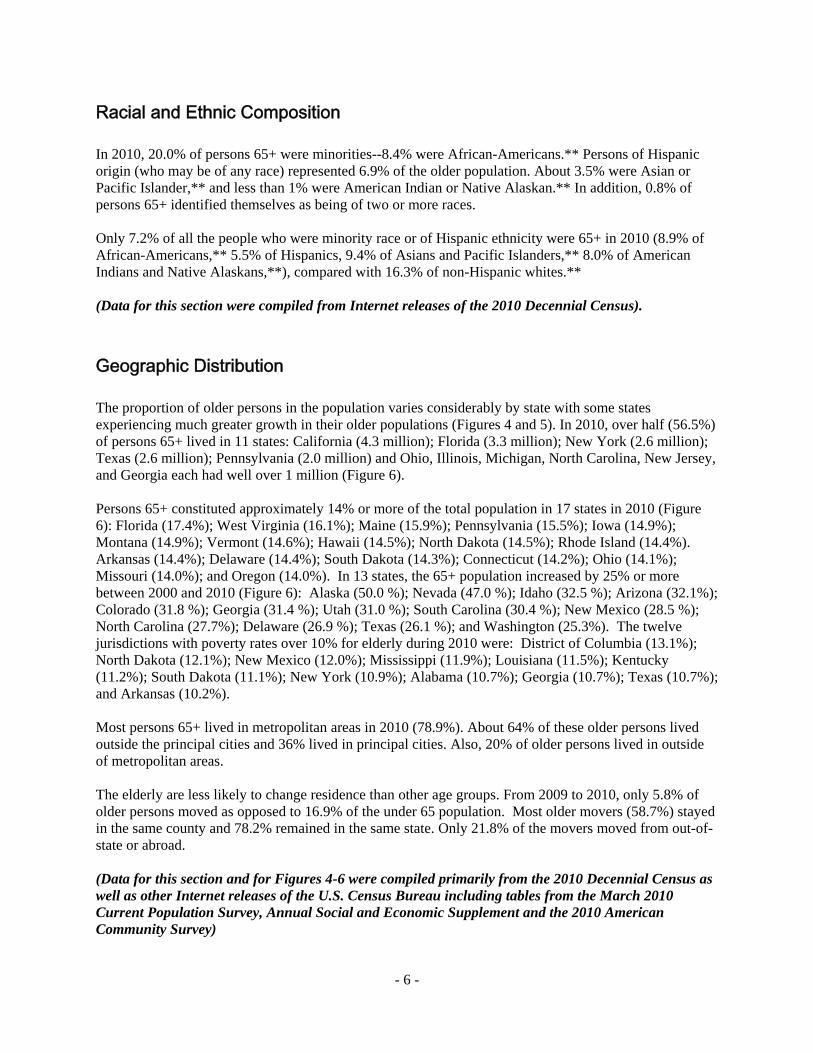
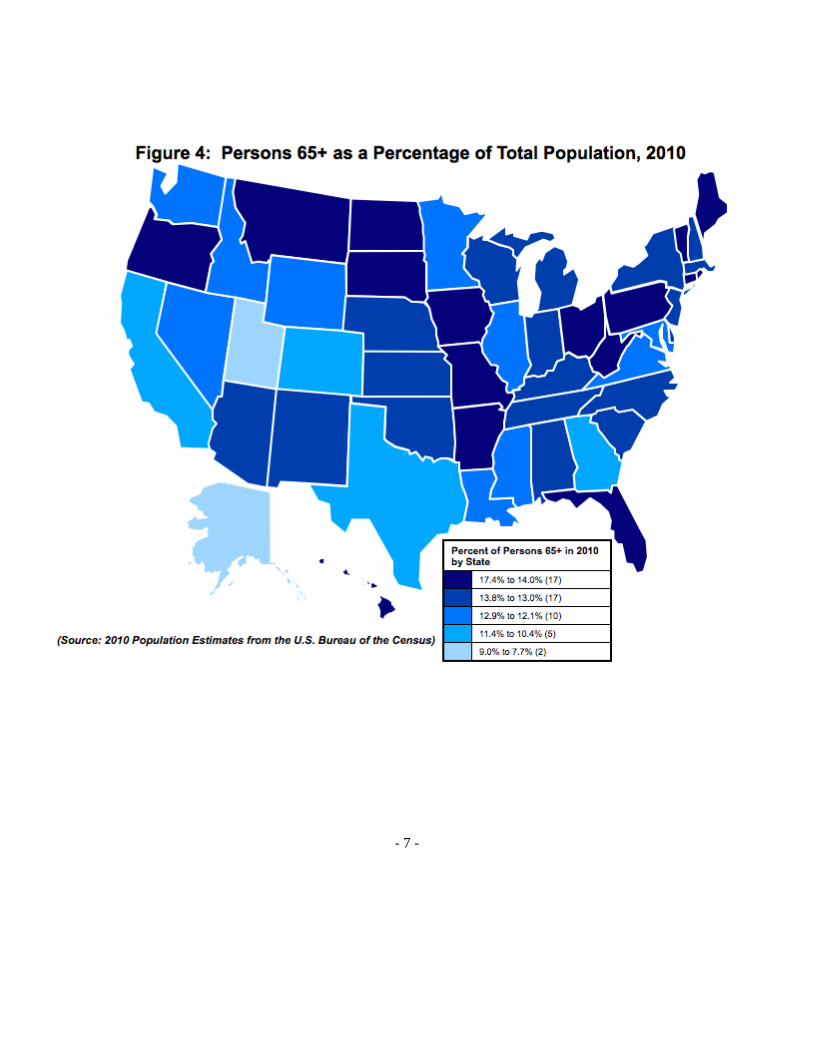
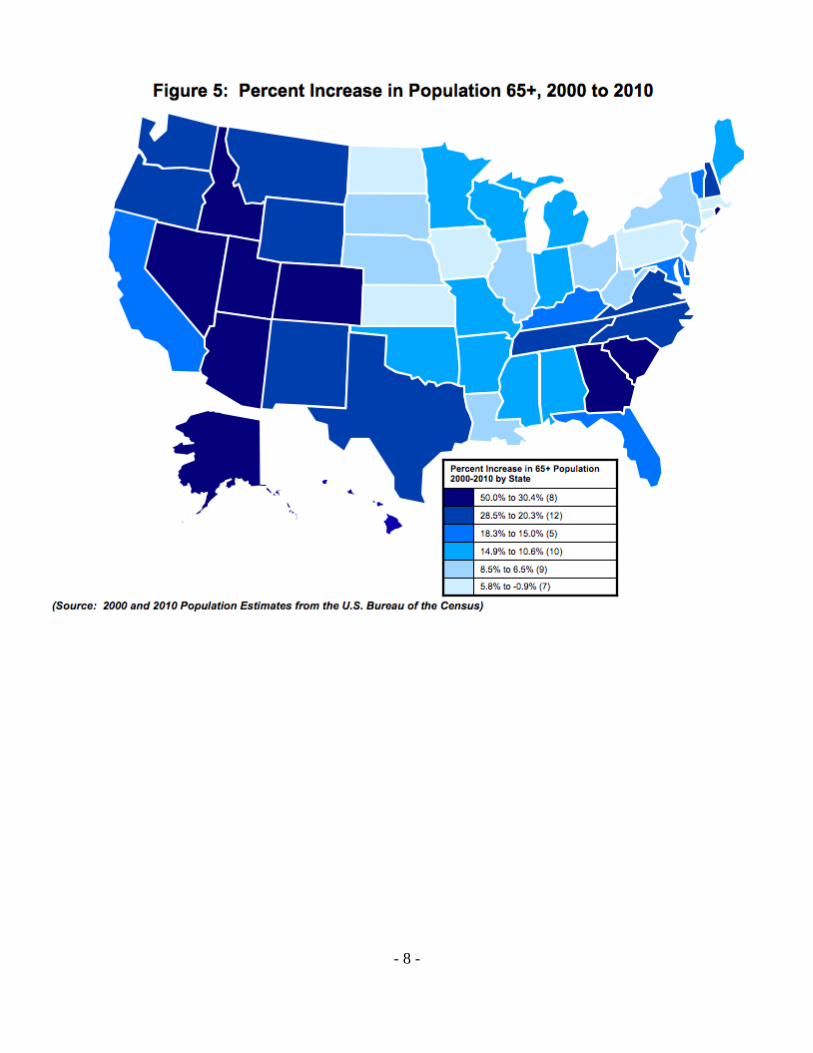
The proportion of older persons in the population varies considerably by state with some states experiencing much greater growth in their older populations (Figures 4 and 5). In 2010, over half (56.5%) of persons 65+ lived in 11 states: California (4.3 million); Florida (3.3 million); New York (2.6 million); Texas (2.6 million); Pennsylvania (2.0 million) and Ohio, Illinois, Michigan, North Carolina, New Jersey, and Georgia each had well over 1 million (Figure 6). Persons 65+ constituted approximately 14% or more of the total population in 17 states in 2010 (Figure 6): Florida (17.4%); West Virginia (16.1%); Maine (15.9%); Pennsylvania (15.5%); Iowa (14.9%); Montana (14.9%); Vermont (14.6%); Hawaii (14.5%); North Dakota (14.5%); Rhode Island (14.4%). Arkansas (14.4%); Delaware (14.4%); South Dakota (14.3%); Connecticut (14.2%); Ohio (14.1%); Missouri (14.0%); and Oregon (14.0%). In 13 states, the 65+ population increased by 25% or more between 2000 and 2010 (Figure 6): Alaska (50.0 %); Nevada (47.0 %); Idaho (32.5 %); Arizona (32.1%); Colorado (31.8 %); Georgia (31.4 %); Utah (31.0 %); South Carolina (30.4 %); New Mexico (28.5 %); North Carolina (27.7%); Delaware (26.9 %); Texas (26.1 %); and Washington (25.3%). The twelve jurisdictions with poverty rates over 10% for elderly during 2010 were: District of Columbia (13.1%); North Dakota (12.1%); New Mexico (12.0%); Mississippi (11.9%); Louisiana (11.5%); Kentucky (11.2%); South Dakota (11.1%); New York (10.9%); Alabama (10.7%); Georgia (10.7%); Texas (10.7%); and Arkansas (10.2%). Most persons 65+ lived in metropolitan areas in 2010 (78.9%). About 64% of these older persons lived outside the principal cities and 36% lived in principal cities. Also, 20% of older persons lived in outside of metropolitan areas. The elderly are less likely to change residence than other age groups. From 2009 to 2010, only 5.8% of older persons moved as opposed to 16.9% of the under 65 population. Most older movers (58.7%) stayed in the same county and 78.2% remained in the same state. Only 21.8% of the movers moved from out-of-state or abroad. (Data for this section and for Figures 4-6 were compiled primarily from the 2010 Decennial Census as well as other Internet releases of the U.S. Census Bureau including tables from the March 2010 Current Population Survey, Annual Social and Economic Supplement and the 2010 American Community Survey)
- 6 -
- 7 -
- 8 -
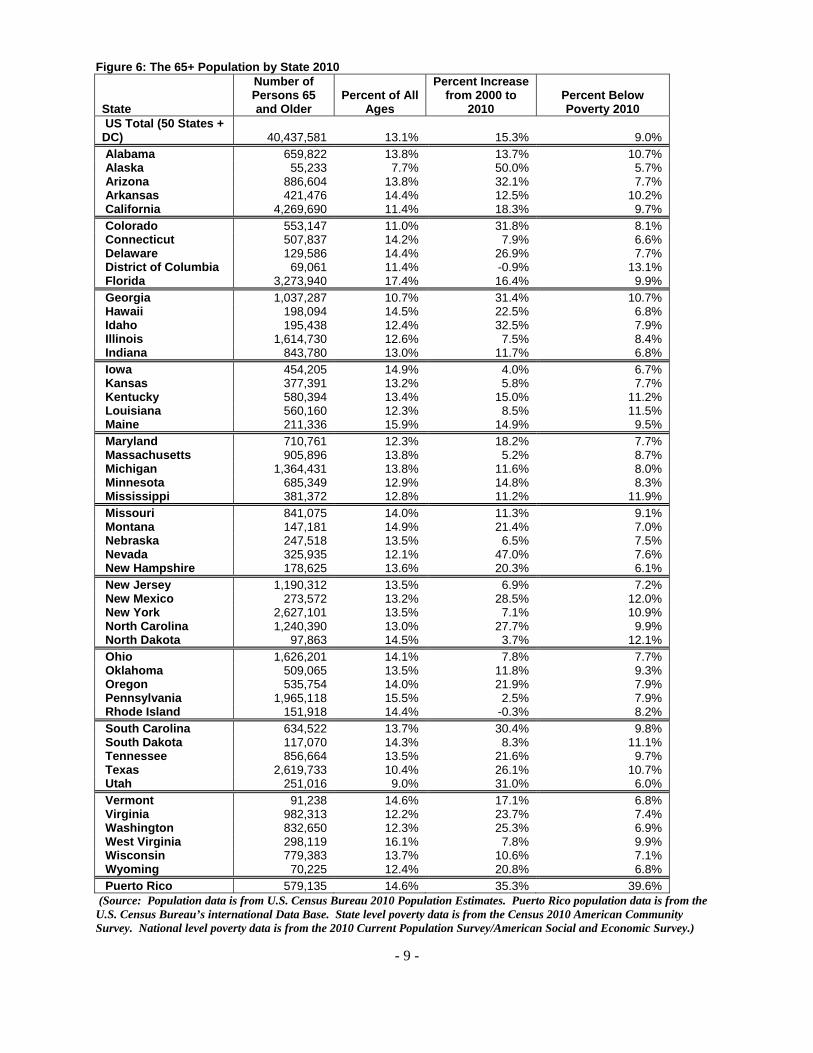
Figure 6: The 65+ Population by State 2010
State
Number of Persons 65 and Older
Percent of All Ages
Percent Increase from 2000 to
2010 Percent Below Poverty 2010
US Total (50 States + DC) 40,437,581 13.1% 15.3% 9.0% Alabama 659,822 13.8% 13.7% 10.7% Alaska 55,233 7.7% 50.0% 5.7% Arizona 886,604 13.8% 32.1% 7.7% Arkansas 421,476 14.4% 12.5% 10.2% California 4,269,690 11.4% 18.3% 9.7% Colorado 553,147 11.0% 31.8% 8.1% Connecticut 507,837 14.2% 7.9% 6.6% Delaware 129,586 14.4% 26.9% 7.7% District of Columbia 69,061 11.4% -0.9% 13.1% Florida 3,273,940 17.4% 16.4% 9.9% Georgia 1,037,287 10.7% 31.4% 10.7% Hawaii 198,094 14.5% 22.5% 6.8% Idaho 195,438 12.4% 32.5% 7.9% Illinois 1,614,730 12.6% 7.5% 8.4% Indiana 843,780 13.0% 11.7% 6.8% Iowa 454,205 14.9% 4.0% 6.7% Kansas 377,391 13.2% 5.8% 7.7% Kentucky 580,394 13.4% 15.0% 11.2% Louisiana 560,160 12.3% 8.5% 11.5% Maine 211,336 15.9% 14.9% 9.5% Maryland 710,761 12.3% 18.2% 7.7% Massachusetts 905,896 13.8% 5.2% 8.7% Michigan 1,364,431 13.8% 11.6% 8.0% Minnesota 685,349 12.9% 14.8% 8.3% Mississippi 381,372 12.8% 11.2% 11.9% Missouri 841,075 14.0% 11.3% 9.1% Montana 147,181 14.9% 21.4% 7.0% Nebraska 247,518 13.5% 6.5% 7.5% Nevada 325,935 12.1% 47.0% 7.6% New Hampshire 178,625 13.6% 20.3% 6.1% New Jersey 1,190,312 13.5% 6.9% 7.2% New Mexico 273,572 13.2% 28.5% 12.0% New York 2,627,101 13.5% 7.1% 10.9% North Carolina 1,240,390 13.0% 27.7% 9.9% North Dakota 97,863 14.5% 3.7% 12.1% Ohio 1,626,201 14.1% 7.8% 7.7% Oklahoma 509,065 13.5% 11.8% 9.3% Oregon 535,754 14.0% 21.9% 7.9% Pennsylvania 1,965,118 15.5% 2.5% 7.9% Rhode Island 151,918 14.4% -0.3% 8.2% South Carolina 634,522 13.7% 30.4% 9.8% South Dakota 117,070 14.3% 8.3% 11.1% Tennessee 856,664 13.5% 21.6% 9.7% Texas 2,619,733 10.4% 26.1% 10.7% Utah 251,016 9.0% 31.0% 6.0% Vermont 91,238 14.6% 17.1% 6.8% Virginia 982,313 12.2% 23.7% 7.4% Washington 832,650 12.3% 25.3% 6.9% West Virginia 298,119 16.1% 7.8% 9.9% Wisconsin 779,383 13.7% 10.6% 7.1% Wyoming 70,225 12.4% 20.8% 6.8% Puerto Rico 579,135 14.6% 35.3% 39.6%
(Source: Population data is from U.S. Census Bureau 2010 Population Estimates. Puerto Rico population data is from the U.S. Census Bureau’s international Data Base. State level poverty data is from the Census 2010 American Community Survey. National level poverty data is from the 2010 Current Population Survey/American Social and Economic Survey.)
- 9 -
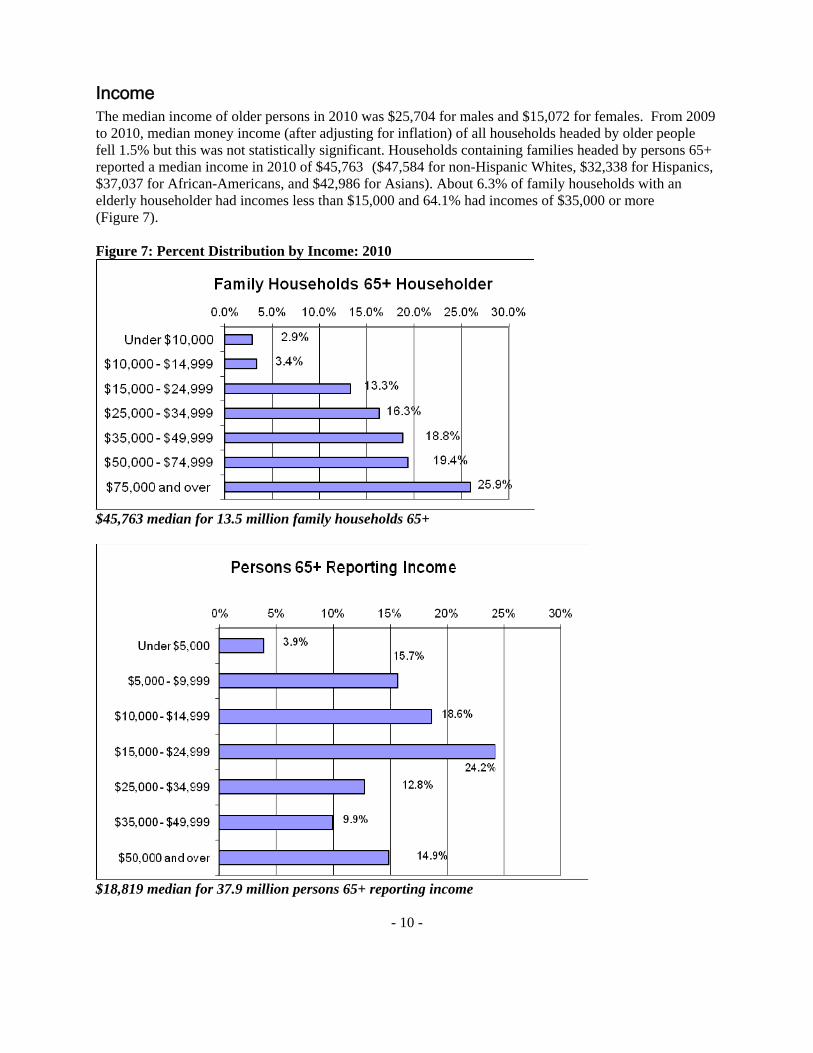
Income The median income of older persons in 2010 was $25,704 for males and $15,072 for females. From 2009 to 2010, median money income (after adjusting for inflation) of all households headed by older people fell 1.5% but this was not statistically significant. Households containing families headed by persons 65+ reported a median income in 2010 of $45,763 ($47,584 for non-Hispanic Whites, $32,338 for Hispanics, $37,037 for African-Americans, and $42,986 for Asians). About 6.3% of family households with an elderly householder had incomes less than $15,000 and 64.1% had incomes of $35,000 or more (Figure 7). Figure 7: Percent Distribution by Income: 2010
$45,763 median for 13.5 million family households 65+
$18,819 median for 37.9 million persons 65+ reporting income
- 10 -

For all older persons reporting income in 2010 (37.9 million), 19.6% reported less than $10,000 and 37.6% reported $25,000 or more. The median income reported was $18,819. The major sources of income as reported by older persons in 2009 were Social Security (reported by 87% of older persons), income from assets (reported by 53%), private pensions (reported by 28%), government employee pensions (reported by 14%), and earnings (reported by 26%). In 2009, Social Security benefits accounted for 38% of the aggregate income of the older population. The bulk of the remainder consisted of earnings (29%), asset income (11%), and pensions (19%). Social Security constituted 90% or more of the income received by 35% of beneficiaries (22% of married couples and 43% of non-married beneficiaries). (Based on data from Current Population Survey, Annual Social and Economic Supplement, "Income, Poverty, and Health Insurance Coverage in the United States: 2010" P60-239, issued September, 2011 by the U.S. Census Bureau, related Census detailed tables on the U.S. Census Bureau web site, and from Fast Facts and Figures About Social Security, 2011, Social Security Administration)
Poverty
Almost 3.5 million elderly persons (9.0%) were below the poverty level in 2010. This poverty rate is not statistically different from the poverty rate in 2009 (8.9%). Another 2.3 million or 5.8% of the elderly were classified as "near-poor" (income between the poverty level and 125% of this level). One of every 15 elderly Whites** (6.8%) was poor in 2010, compared to 18.0% of elderly African-Americans, 14.6% of Asians, and 18.0% of elderly Hispanics. Higher than average poverty rates were found in 2010 for older persons who lived in principal cities (11.2%), outside metropolitan areas (i.e. rural areas and small towns) (10.4%), and in the South (10.5%). Older women had a higher poverty rate (10.7%) than older men (6.7%) in 2010. Older persons living alone were much more likely to be poor (16.0%) than were older persons living with families (5.3%). The highest poverty rates were experienced among Hispanic women (40.8%) who lived alone and also by older Black women (30.7%) who lived alone. During 2011, the U.S. Census Bureau released a new Supplemental Poverty Measure (SPM). The SPM methodology shows a significantly higher number of older persons below poverty than is shown by the official poverty measure. For persons 65 and older this poverty measure shows a poverty level of 15.9% (an increase of over 75% over the official rate of 9.0%). Unlike the official poverty rate, the SPM takes into account regional variations in the cost of housing etc. and, even more significantly, the impact of both non-cash benefits received (e.g., SNAP/food stamps, low income tax credits, WIC, etc.) and non-discretionary expenditures including medical out-of-pocket (MOOP) expenses. For persons 65 and over, MOOP was the major source of the significant differences between these measures. Bear in mind that the SPM does not replace the official poverty measure. (Based on data from Current Population Survey, Annual Social and Economic Supplement, "Income, Poverty, and Health Insurance Coverage in the United States: 2010," P60-239, issued September, 2011, by the U.S. Census Bureau and related Census detailed tables on the U.S. Census Bureau web site and on “The Research Supplemental Poverty Measure,” P60-241, issued November 2011)
- 11 -
Housing
Of the 23.1 million households headed by older persons in 2009, 80% were owners and 20% were renters. The median family income of older homeowners was $30,400. The median family income of older renters was $15,744. In 2009, 48% of older householders spent more than one-fourth of their income on housing costs - 42% for owners and 70% for renters - as compared to 48% of all householders. For homes of older householders in 2007, the median construction year was 1970 (it was 1974 for all householders) and 4.3% of the homes had physical problems. In 2009, the median value of homes owned by older persons was $150,000 (with a median purchase price of $49,000) compared to a median home value of $170,500 for all homeowners. About 65% of older homeowners in 2009 owned their homes free and clear. (Source: American Housing Survey National Tables: 2009, U.S. Census Bureau web site)
Employment
In 2009, 6.7 million (17.4 %) Americans age 65 and over were in the labor force (working or actively seeking work), including 3.7 million men (22.1%) and 3.0 million women (13.8%). They constituted 4.4% of the U.S. labor force. About 6.7% were unemployed. Labor force participation of men 65+ decreased steadily from 2 of 3 in 1900 to 15.8% in 1985; then stayed at 16%-18% until 2002; and has been increasing since then to over 20%. The participation rate for women 65+ rose slightly from 1 of 12 in 1900 to 10.8% in 1956, fell to 7.3% in 1985, was around 7%-9% from 1986 – 2002. However, beginning in 2000, labor force participation of older women has been gradually rising to the 2010 level. This increase is especially noticeable among the population aged 65-69. (Source: Current Population Survey, labor force statistics. See: Bureau of Labor Statistics web-site: http://www.bls.gov/cps/home.htm)
Education
The educational level of the older population is increasing. Between 1970 and 2010, the percentage of older persons who had completed high school rose from 28% to 79.5%. About 22.5% in 2010 had a bachelor's degree or higher. The percentage who had completed high school varied considerably by race and ethnic origin in 2010: 84.3% of Whites**, 73.6% of Asians, 64.8% of African-Americans, and 47.0% of Hispanics. The increase in educational levels is also evident within these groups. In 1970, only 30% of older Whites and 9% of older African-Americans were high school graduates. (Source: Current Population Survey, Annual Social and Economic Supplement, 2010 and related tables on the U.S. Census Bureau web site)
- 12 -
Health and Health Care
In 2000-2009, 40.0% of noninstitutionalized older persons assessed their health as excellent or very good (compared to 64.7% for all persons aged 18-64 years). There was little difference between the sexes on this measure, but older African-Americans** (26.0%), older American Indians/Alaska Natives (24.3%) and older Hispanics (28.2%) were less likely to rate their health as excellent or very good than were older Whites** (42.8%) or older Asians (35.3%)†. Most older persons have at least one chronic condition and many have multiple conditions. In 2007-2009, the most frequently occurring conditions among older persons were: uncontrolled hypertension (34%), diagnosed arthritis (50%), all types of heart disease (32%), any cancer (23%), diabetes (19%), and sinusitis (14%). Almost 63% reported in 2010 that they received an influenza vaccination during the past 12 months and 59% reported that they had ever received a pneumococcal vaccination. About 27.7% (of persons 60+) report height/weight combinations that place them among the obese. Almost 35% of persons aged 65-74 and 24% of persons 75+ report that they engage in regular leisure-time physical activity. Only 9.5% reported that they are current smokers and only 5% reported excessive alcohol consumption. Only 2% reported that they had experienced psychological distress during the past 30 days. In 2007, about 12.9 million persons aged 65 and older were discharged from short stay hospitals. This is a rate of 3,395 for every 10,000 persons aged 65+ which is about three times the comparable rate for persons of all ages (which was 1,149 per 10,000). The average length of stay for persons aged 65+ was 5.6 days; the comparable rate for persons of all ages was 4.8 days. The average length of stay for older people has decreased by 5 days since 1980. Older persons averaged more office visits with doctors in 2007: 7.1 office visits for those aged 65 and over while persons aged 45-65 averaged only 3.7 office visits during that year. In 2010, almost 97% of older persons reported that they did have a usual place to go for medical care and only 3.0% said that they failed to obtain needed medical care during the previous 12 months due to financial barriers. In 2010 older consumers averaged out-of-pocket health care expenditures of $4,843, an increase of 49% since 2000. In contrast, the total population spent considerably less, averaging $3,157 in out-of-pocket costs. Older Americans spent 13.2% of their total expenditures on health, more than twice the proportion spent by all consumers (6.6%). Health costs incurred on average by older consumers in 2010 consisted of $3,085 (65%) for insurance, $795 (18%) for medical services, $805 (17%) for drugs, and $158 (3.0%) for medical supplies. (Sources: Data releases from the web sites of the National Center for Health Statistics; and from the Bureau of Labor Statistics web site) † These figures are from 2006-2008 data.
- 13 -
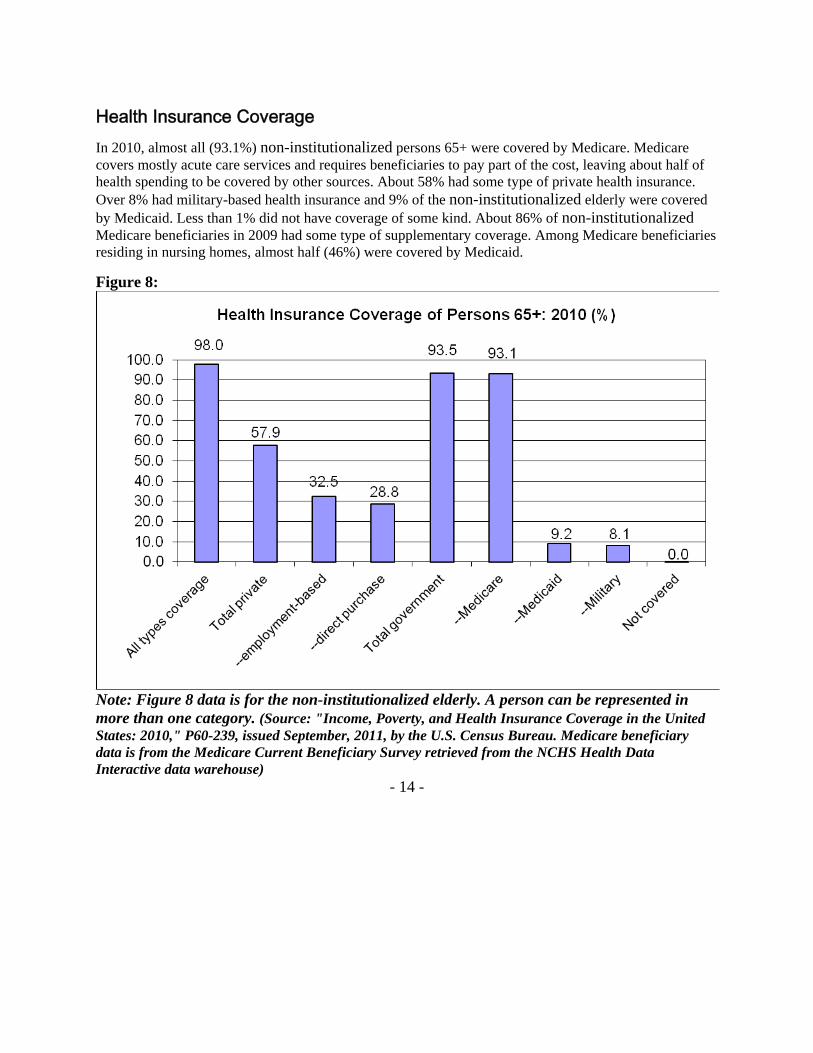
Health Insurance Coverage In 2010, almost all (93.1%) non-institutionalized persons 65+ were covered by Medicare. Medicare covers mostly acute care services and requires beneficiaries to pay part of the cost, leaving about half of health spending to be covered by other sources. About 58% had some type of private health insurance. Over 8% had military-based health insurance and 9% of the non-institutionalized elderly were covered by Medicaid. Less than 1% did not have coverage of some kind. About 86% of non-institutionalized Medicare beneficiaries in 2009 had some type of supplementary coverage. Among Medicare beneficiaries residing in nursing homes, almost half (46%) were covered by Medicaid. Figure 8:
Note: Figure 8 data is for the non-institutionalized elderly. A person can be represented in more than one category. (Source: "Income, Poverty, and Health Insurance Coverage in the United States: 2010," P60-239, issued September, 2011, by the U.S. Census Bureau. Medicare beneficiary data is from the Medicare Current Beneficiary Survey retrieved from the NCHS Health Data Interactive data warehouse)
- 14 -
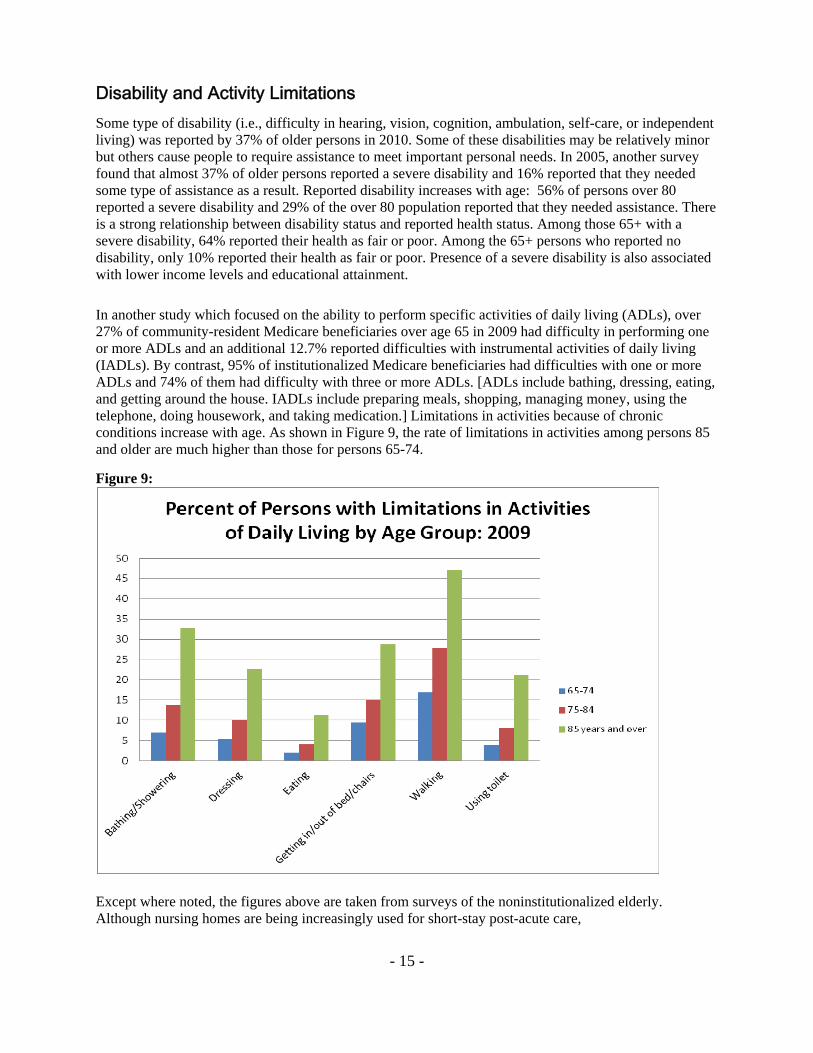
Disability and Activity Limitations Some type of disability (i.e., difficulty in hearing, vision, cognition, ambulation, self-care, or independent living) was reported by 37% of older persons in 2010. Some of these disabilities may be relatively minor but others cause people to require assistance to meet important personal needs. In 2005, another survey found that almost 37% of older persons reported a severe disability and 16% reported that they needed some type of assistance as a result. Reported disability increases with age: 56% of persons over 80 reported a severe disability and 29% of the over 80 population reported that they needed assistance. There is a strong relationship between disability status and reported health status. Among those 65+ with a severe disability, 64% reported their health as fair or poor. Among the 65+ persons who reported no disability, only 10% reported their health as fair or poor. Presence of a severe disability is also associated with lower income levels and educational attainment. In another study which focused on the ability to perform specific activities of daily living (ADLs), over 27% of community-resident Medicare beneficiaries over age 65 in 2009 had difficulty in performing one or more ADLs and an additional 12.7% reported difficulties with instrumental activities of daily living (IADLs). By contrast, 95% of institutionalized Medicare beneficiaries had difficulties with one or more ADLs and 74% of them had difficulty with three or more ADLs. [ADLs include bathing, dressing, eating, and getting around the house. IADLs include preparing meals, shopping, managing money, using the telephone, doing housework, and taking medication.] Limitations in activities because of chronic conditions increase with age. As shown in Figure 9, the rate of limitations in activities among persons 85 and older are much higher than those for persons 65-74. Figure 9:
Except where noted, the figures above are taken from surveys of the noninstitutionalized elderly. Although nursing homes are being increasingly used for short-stay post-acute care,
- 15 -
about 1.3 million elderly are in nursing homes (about half are age 85 and over). These individuals often have high needs for care with their ADLs and/or have severe cognitive impairment due to Alzheimer's disease or other dementias. (Sources: Americans with Disabilities: 2005, December 2008, P70-117 and other Internet releases of data from the U.S. Census Bureau, the Centers for Medicare and Medicaid, and the National Center on Health Statistics, including the NCHS Health Data Interactive data warehouse)
Caregiving About 11% (3.7 million) of older Medicare enrollees received personal care from a paid or unpaid source in 1999. Almost all community resident older persons with chronic disabilities receive either informal care (from family or friends) or formal care (from service provider agencies). Over 90% of these older persons with chronic disabilities received informal care and/or formal care; and about two thirds received only informal care. About 9% of this chronically disabled group received only formal services. (Source: National Long Term Care Survey, 1999)
Notes: *Principal sources of data for the Profile are the U.S. Census Bureau, the National Center for Health Statistics, and the Bureau of Labor Statistics. The Profile incorporates the latest data available but not all items are updated on an annual basis. **Excludes persons of Hispanic origin. ***The U.S. Census Bureau’s 2010 Decennial Census release revised downward the previously issued estimates of the 100+ population.
A Profile of Older Americans: 2011 was developed by the Administration on Aging (AoA), U.S. Department of Health and Human Services. The annual Profile of Older Americans was originally developed and researched by Donald G. Fowles, AoA. Saadia Greenberg, AoA, developed the 2011 edition. AoA serves as an advocate for the elderly within the federal government and is working to encourage and coordinate a responsive system of family and community based services throughout the nation. AoA helps states develop comprehensive service systems which are administered by 56 State and Territorial Units on Aging, 629 Area Agencies on Aging, 246 Native American and Hawaiian organizations, and approximately 20,000 local service providers.
- 16 -