Embed Size (px)
Citation preview
A PROFILE OF THE SOUTH AFRICAN AVOCADO MARKET VALUE CHAIN
2011
Directorate Marketing Private Bag X 15
Arcadia 0007
Tel: 012 319 8455 Fax: 012 319 8131
E-mail: [email protected]
www.daff.gov.za
TABLE OF CONTENTS
1. DESCRIPTION OF THE PRODUCT AND INDUSTRY.............................................................................. 3 1.1 Production areas ................................................................................................................................. 4
6
78
10141922222323242428292932323233343436363637383839393939404040414243434344
1.2 Production quantities........................................................................................................................... 1.3 Cultivars .............................................................................................................................................. 7 1.4 Employment ........................................................................................................................................
2. MARKETING STRUCTURE...................................................................................................................... 2.1 Domestic market and prices ................................................................................................................ 8 2.2 Exports .............................................................................................................................................. 2.3 Provincial and district export values of South African avocados........................................................ 2.4 District share analysis per province................................................................................................... 2.5 Processing ........................................................................................................................................
2.5.1 Avocado Oil................................................................................................................................ 2.5.2 Medicinal Uses........................................................................................................................... 2.5.3 Other Uses.................................................................................................................................
3. MARKET INTELIGENCE ........................................................................................................................ 3.1 Competitiveness of South African avocado exports .......................................................................... 3.2 South Africa vs. Southern hemisphere production ............................................................................
4. MARKET ACCESS ................................................................................................................................. 4.1 Tariffs, quotas and the price entry system......................................................................................... 4.2 European Union (EU) ........................................................................................................................
4.2.1 Tariff barriers.............................................................................................................................. 4.2.2 Non tariff barriers .......................................................................................................................
4.2.2.1 Legal requirements ............................................................................................................. 4.2.2.2 Non-legal requirements: social and environmental accountability ...................................... 4.2.2.3 Consumer health and safety requirements .........................................................................
4.3 United States of America (USA) ........................................................................................................ 4.3.1 Tariff barriers.............................................................................................................................. 4.3.2 Non tariff barriers .......................................................................................................................
4.4 Japan ................................................................................................................................................ 4.5 China.................................................................................................................................................
5. DISTRIBUTION CHANNELS .................................................................................................................. 6. LOGISTICS .............................................................................................................................................
6.1 Mode of transport .............................................................................................................................. 6.2 Cold chain management ................................................................................................................... 6.3 Packaging .........................................................................................................................................
7. ORGANIZATIONAL ANALYSIS ............................................................................................................. 7.1 The South African Avocado Growers’ Association ............................................................................ 7.2 Strength, Weakness, Opportunities and Threats (SWOT) analysis................................................... 7.3 The avocado value chain .................................................................................................................. 7.4 Quality standards and food safety ..................................................................................................... 7.5 Producers and packhouses ............................................................................................................... 7.6 Cold storage...................................................................................................................................... 7.7 Exporters...........................................................................................................................................
8. ACKNOWLEDGEMENTS .......................................................................................................................
2
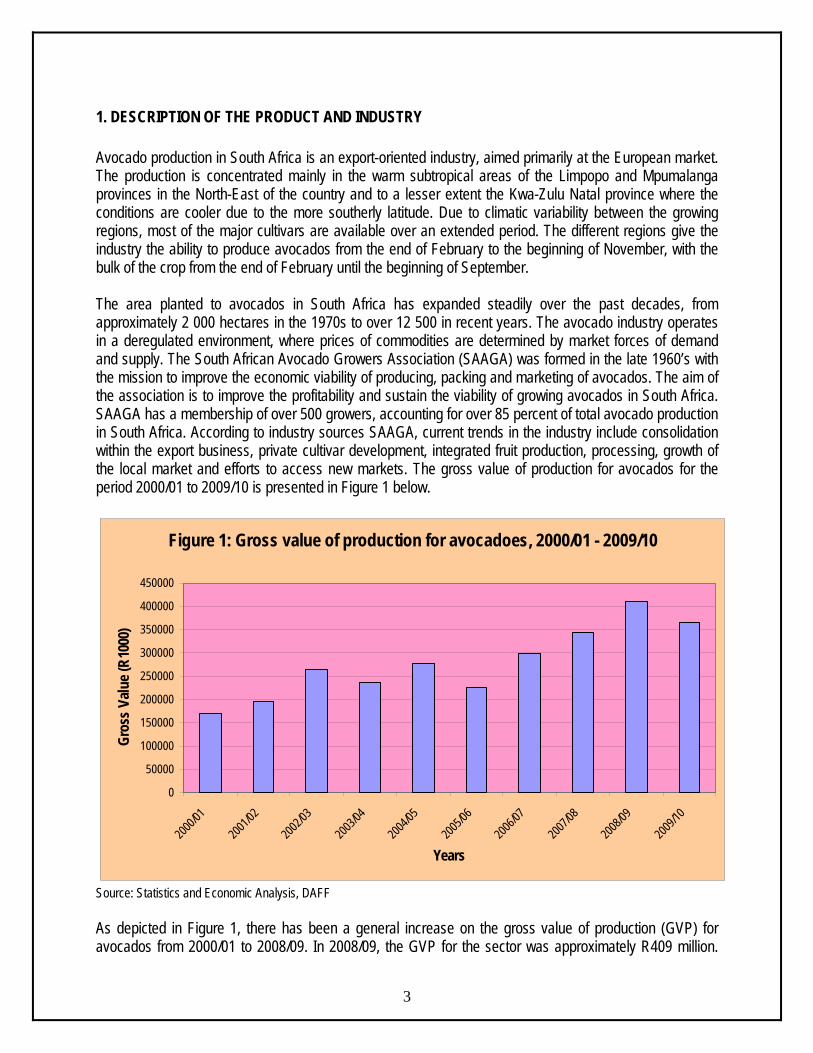
1. DESCRIPTION OF THE PRODUCT AND INDUSTRY Avocado production in South Africa is an export-oriented industry, aimed primarily at the European market. The production is concentrated mainly in the warm subtropical areas of the Limpopo and Mpumalanga provinces in the North-East of the country and to a lesser extent the Kwa-Zulu Natal province where the conditions are cooler due to the more southerly latitude. Due to climatic variability between the growing regions, most of the major cultivars are available over an extended period. The different regions give the industry the ability to produce avocados from the end of February to the beginning of November, with the bulk of the crop from the end of February until the beginning of September. The area planted to avocados in South Africa has expanded steadily over the past decades, from approximately 2 000 hectares in the 1970s to over 12 500 in recent years. The avocado industry operates in a deregulated environment, where prices of commodities are determined by market forces of demand and supply. The South African Avocado Growers Association (SAAGA) was formed in the late 1960’s with the mission to improve the economic viability of producing, packing and marketing of avocados. The aim of the association is to improve the profitability and sustain the viability of growing avocados in South Africa. SAAGA has a membership of over 500 growers, accounting for over 85 percent of total avocado production in South Africa. According to industry sources SAAGA, current trends in the industry include consolidation within the export business, private cultivar development, integrated fruit production, processing, growth of the local market and efforts to access new markets. The gross value of production for avocados for the period 2000/01 to 2009/10 is presented in Figure 1 below.
Figure 1: Gross value of production for avocadoes, 2000/01 - 2009/10
0
50000
100000
150000
200000
250000
300000
350000
400000
450000
2000/0
1
2001/0
2
2002/0
3
2003/0
4
2004/0
5
2005/0
6
2006/0
7
2007/0
8
2008/0
9
2009/1
0
Years
Gros
s Valu
e (R1
000)
Source: Statistics and Economic Analysis, DAFF
3
As depicted in Figure 1, there has been a general increase on the gross value of production (GVP) for avocados from 2000/01 to 2008/09. In 2008/09, the GVP for the sector was approximately R409 million.
That represents a 19% increase in GVP for avocados from the 2007/08 production season. The increase may have been primarily due to large volumes of avocados produced and sold locally and internationally in foreign markets. However, there were also decreases of 11% and 19% on GVP in 2003/04 and 2005/06 respectively. That may have been due to the reduction in both volume and value of exports. The 2009/10 marketing season recorded an 11% decline in the GVP for avocados when compared to the 2008/09 figure. The GVP for industry was approximately R365 million during 2009/10. The 2009/10 GVP was lower than that of the previous season mainly due to a decline in the volume produced in 2009/10 when compared to the previous season.
1.1 Production areas Avocado production in South Africa is concentrated mainly in the warm subtropical areas of the Limpopo and Mpumalanga provinces in the North East of the country between latitudes 22 ˚S and 25 ˚S (see Map 1). Annual rainfall in most of these areas is high (> 1000 mm p.a.), but there are some orchards in semi arid regions with rainfall of ± 400 mm p.a. Approximately 11% of commercial avocado orchards are in KwaZulu-Natal province where the conditions are cooler due to the more southerly latitude (± 30 oS). As already indicated above, due to climatic variability between the growing regions, most of the major cultivars are available over an extended period during the season. For example, ‘Fuerte’ is harvested from mid-March to May in the northern regions, and is harvested in July and August in KwaZulu-Natal. SAAGA reports that growth in plantings has slowed since 2003 with total area planted to commercial avocado orchards remaining stable at around 12 000 ha.
4
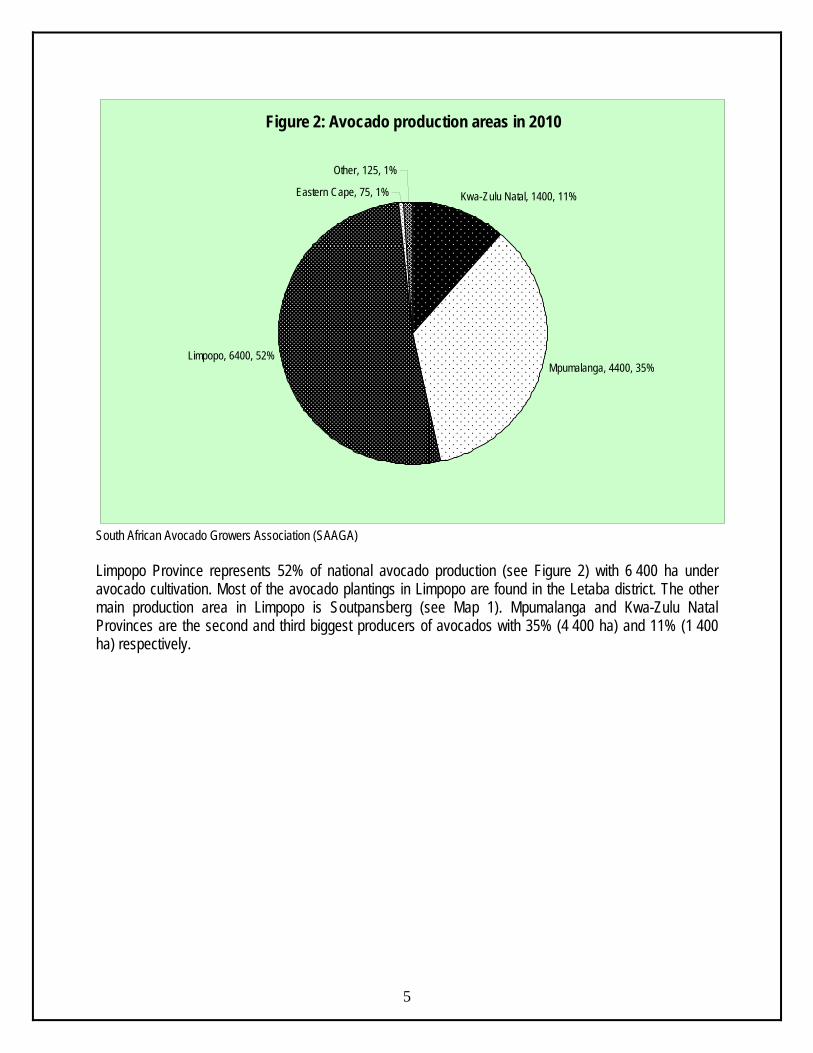
Figure 2: Avocado production areas in 2010
Kwa-Zulu Natal, 1400, 11%
Mpumalanga, 4400, 35%Limpopo, 6400, 52%
Eastern Cape, 75, 1%
Other, 125, 1%
South African Avocado Growers Association (SAAGA) Limpopo Province represents 52% of national avocado production (see Figure 2) with 6 400 ha under avocado cultivation. Most of the avocado plantings in Limpopo are found in the Letaba district. The other main production area in Limpopo is Soutpansberg (see Map 1). Mpumalanga and Kwa-Zulu Natal Provinces are the second and third biggest producers of avocados with 35% (4 400 ha) and 11% (1 400 ha) respectively.
5
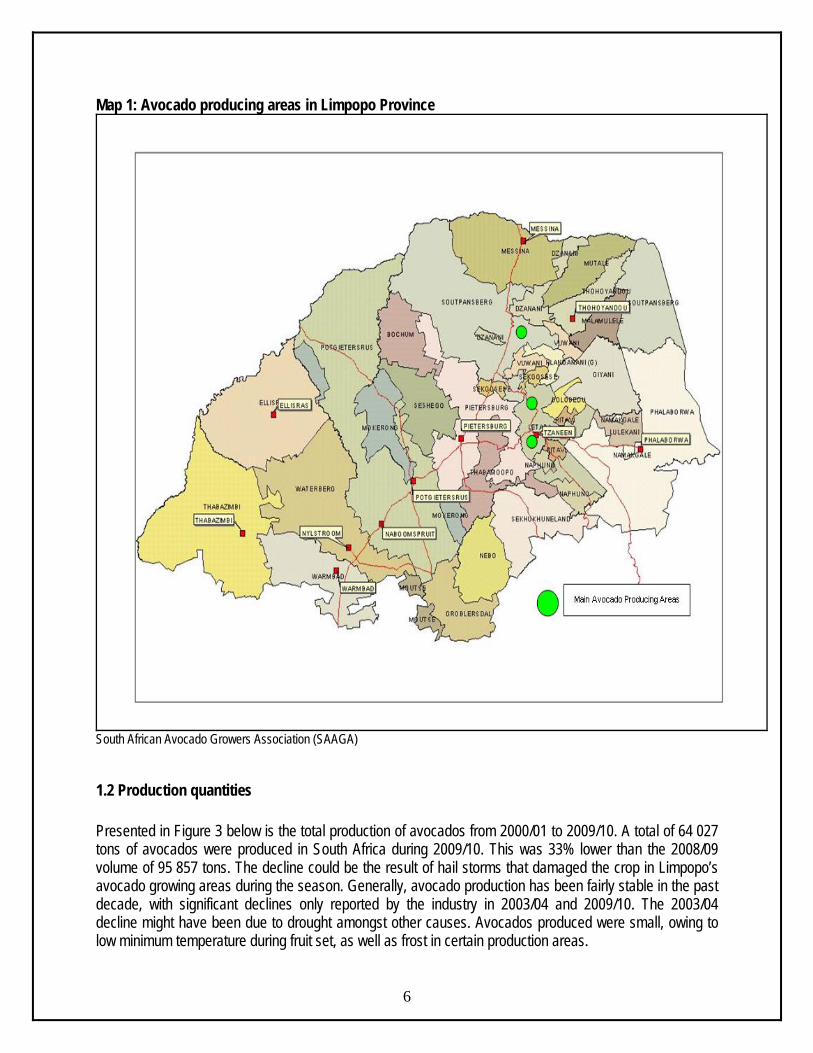
Map 1: Avocado producing areas in Limpopo Province
South African Avocado Growers Association (SAAGA)
1.2 Production quantities
6
Presented in Figure 3 below is the total production of avocados from 2000/01 to 2009/10. A total of 64 027 tons of avocados were produced in South Africa during 2009/10. This was 33% lower than the 2008/09 volume of 95 857 tons. The decline could be the result of hail storms that damaged the crop in Limpopo’s avocado growing areas during the season. Generally, avocado production has been fairly stable in the past decade, with significant declines only reported by the industry in 2003/04 and 2009/10. The 2003/04 decline might have been due to drought amongst other causes. Avocados produced were small, owing to low minimum temperature during fruit set, as well as frost in certain production areas.
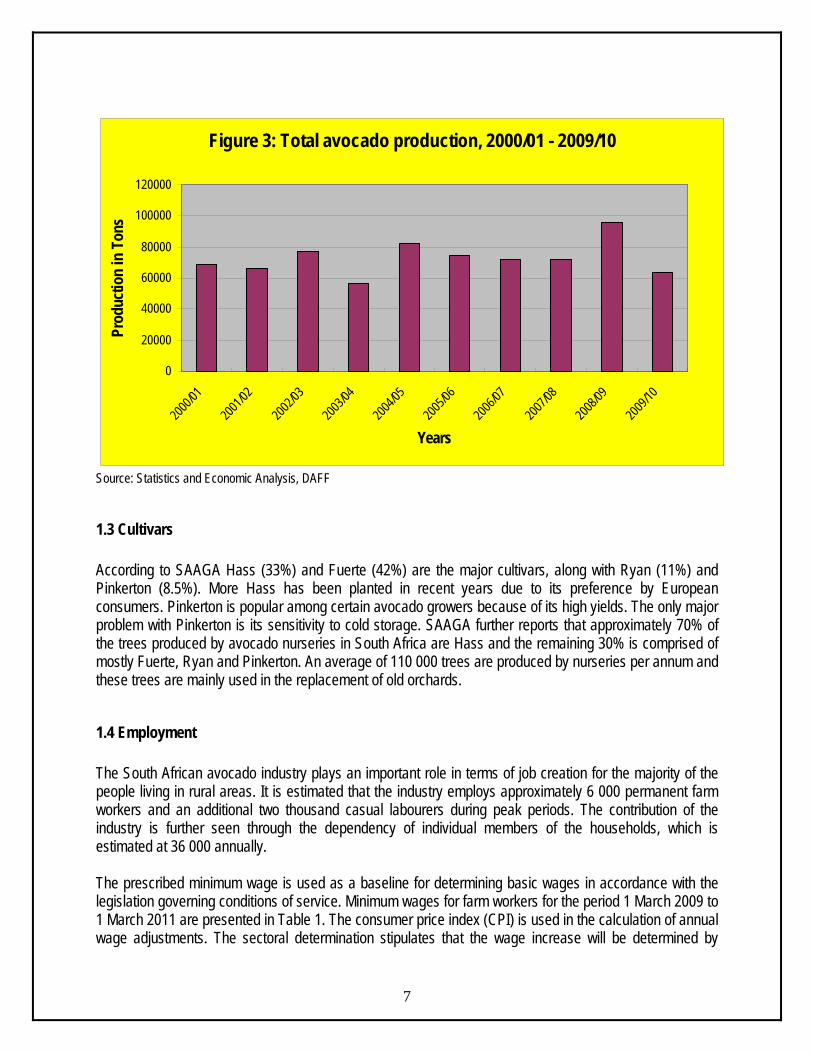
Figure 3: Total avocado production, 2000/01 - 2009/10
0
20000
40000
60000
80000
100000
120000200
0/01
2001/0
2
2002/0
3
2003/0
4
2004/0
5
2005/0
6
2006/0
7
2007/0
8
2008/0
9
2009/1
0
Years
Prod
uctio
n in
Ton
s
Source: Statistics and Economic Analysis, DAFF
1.3 Cultivars According to SAAGA Hass (33%) and Fuerte (42%) are the major cultivars, along with Ryan (11%) and Pinkerton (8.5%). More Hass has been planted in recent years due to its preference by European consumers. Pinkerton is popular among certain avocado growers because of its high yields. The only major problem with Pinkerton is its sensitivity to cold storage. SAAGA further reports that approximately 70% of the trees produced by avocado nurseries in South Africa are Hass and the remaining 30% is comprised of mostly Fuerte, Ryan and Pinkerton. An average of 110 000 trees are produced by nurseries per annum and these trees are mainly used in the replacement of old orchards.
1.4 Employment The South African avocado industry plays an important role in terms of job creation for the majority of the people living in rural areas. It is estimated that the industry employs approximately 6 000 permanent farm workers and an additional two thousand casual labourers during peak periods. The contribution of the industry is further seen through the dependency of individual members of the households, which is estimated at 36 000 annually.
7
The prescribed minimum wage is used as a baseline for determining basic wages in accordance with the legislation governing conditions of service. Minimum wages for farm workers for the period 1 March 2009 to 1 March 2011 are presented in Table 1. The consumer price index (CPI) is used in the calculation of annual wage adjustments. The sectoral determination stipulates that the wage increase will be determined by
ustilising the CPI + 1%. In terms of percentage increase, the 2011 minimum wage is 4.5% higher than the 2010 minimum wage (CPI on 19 January 2011 was 3.5%). Table 1: Minimum wages for farm workers in the Republic of South Africa, 2009 - 2011-05-24 Year Frequency
1/03/2009 1/03/2010 1/03/2011
Hourly R6.31 R6.74 R7.04 Weekly R284.23 R303.84 R317.51 Monthly R1231.70 R1316.69 R1375.94 Hortgro, 2010
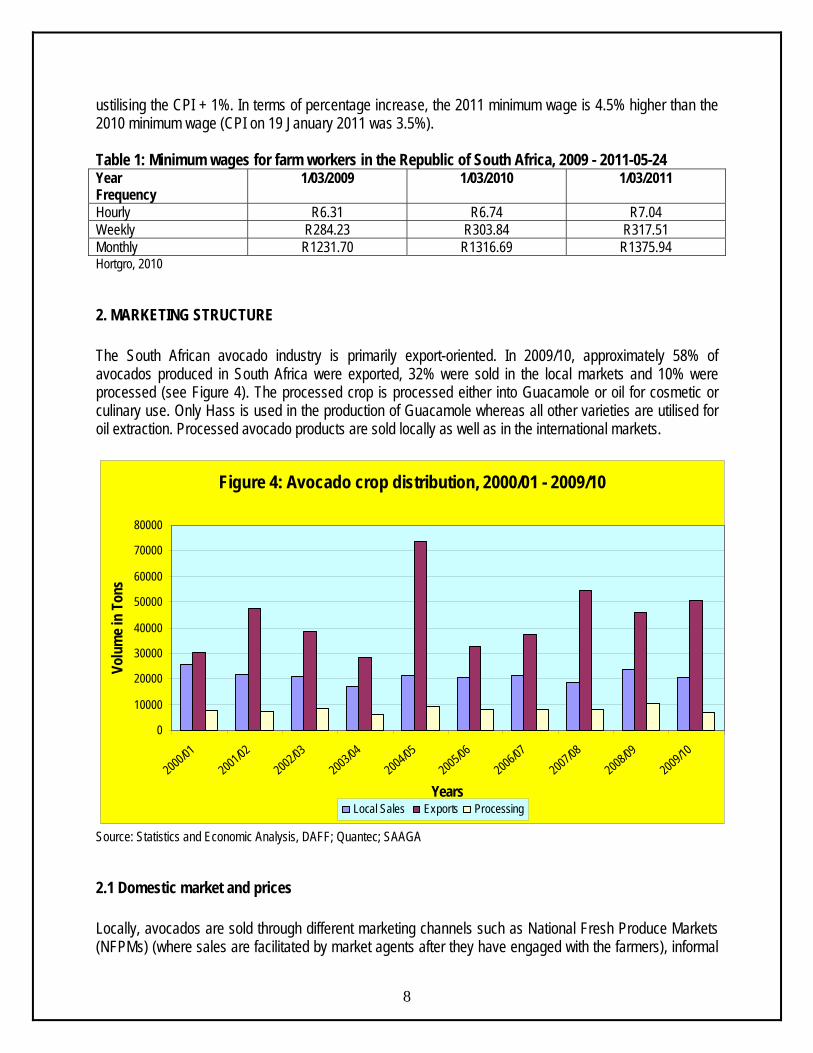
2. MARKETING STRUCTURE The South African avocado industry is primarily export-oriented. In 2009/10, approximately 58% of avocados produced in South Africa were exported, 32% were sold in the local markets and 10% were processed (see Figure 4). The processed crop is processed either into Guacamole or oil for cosmetic or culinary use. Only Hass is used in the production of Guacamole whereas all other varieties are utilised for oil extraction. Processed avocado products are sold locally as well as in the international markets.
Figure 4: Avocado crop distribution, 2000/01 - 2009/10
0
10000
20000
30000
40000
50000
60000
70000
80000
2000/012001/02
2002/032003/04
2004/052005/06
2006/072007/08
2008/092009/10
Years
Volu
me i
n To
ns
Local Sales Exports Processing
Source: Statistics and Economic Analysis, DAFF; Quantec; SAAGA
2.1 Domestic market and prices
8
Locally, avocados are sold through different marketing channels such as National Fresh Produce Markets (NFPMs) (where sales are facilitated by market agents after they have engaged with the farmers), informal
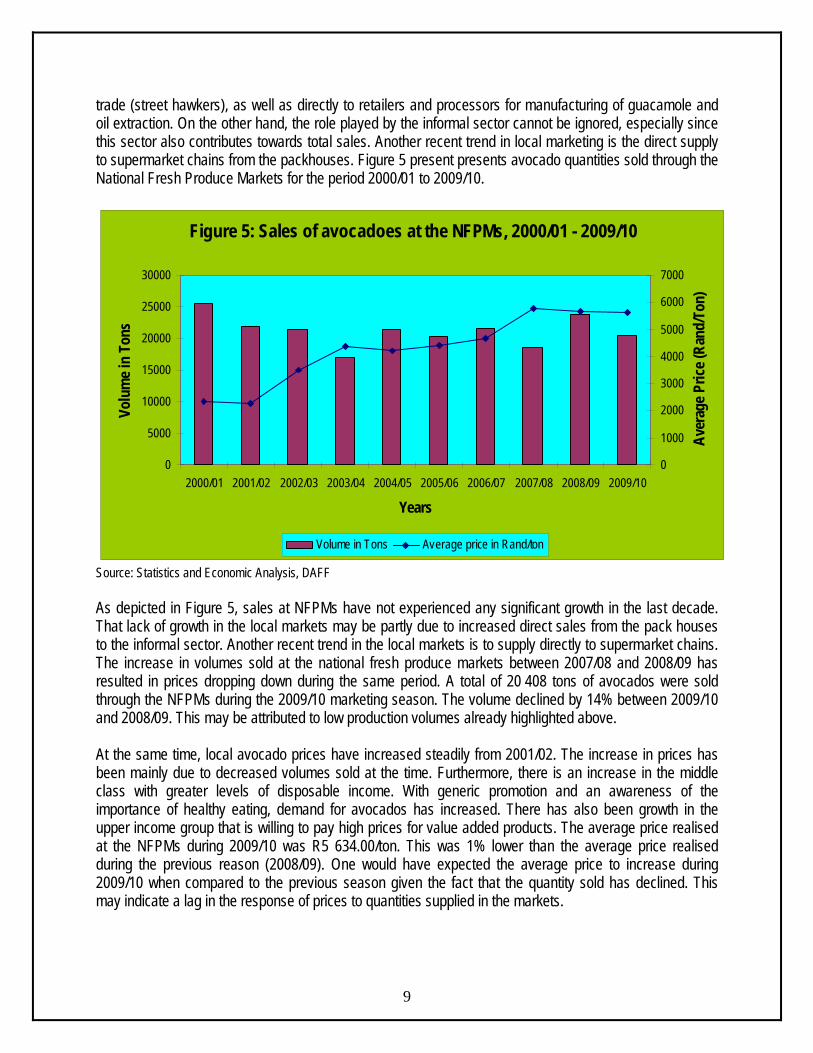
trade (street hawkers), as well as directly to retailers and processors for manufacturing of guacamole and oil extraction. On the other hand, the role played by the informal sector cannot be ignored, especially since this sector also contributes towards total sales. Another recent trend in local marketing is the direct supply to supermarket chains from the packhouses. Figure 5 present presents avocado quantities sold through the National Fresh Produce Markets for the period 2000/01 to 2009/10.
Figure 5: Sales of avocadoes at the NFPMs, 2000/01 - 2009/10
0
5000
10000
15000
20000
25000
30000
2000/01 2001/02 2002/03 2003/04 2004/05 2005/06 2006/07 2007/08 2008/09 2009/10
Years
Volu
me i
n To
ns
0
1000
2000
3000
4000
5000
6000
7000
Aver
age P
rice (
Rand
/Ton
)
Volume in Tons Average price in Rand/ton
Source: Statistics and Economic Analysis, DAFF As depicted in Figure 5, sales at NFPMs have not experienced any significant growth in the last decade. That lack of growth in the local markets may be partly due to increased direct sales from the pack houses to the informal sector. Another recent trend in the local markets is to supply directly to supermarket chains. The increase in volumes sold at the national fresh produce markets between 2007/08 and 2008/09 has resulted in prices dropping down during the same period. A total of 20 408 tons of avocados were sold through the NFPMs during the 2009/10 marketing season. The volume declined by 14% between 2009/10 and 2008/09. This may be attributed to low production volumes already highlighted above. At the same time, local avocado prices have increased steadily from 2001/02. The increase in prices has been mainly due to decreased volumes sold at the time. Furthermore, there is an increase in the middle class with greater levels of disposable income. With generic promotion and an awareness of the importance of healthy eating, demand for avocados has increased. There has also been growth in the upper income group that is willing to pay high prices for value added products. The average price realised at the NFPMs during 2009/10 was R5 634.00/ton. This was 1% lower than the average price realised during the previous reason (2008/09). One would have expected the average price to increase during 2009/10 when compared to the previous season given the fact that the quantity sold has declined. This may indicate a lag in the response of prices to quantities supplied in the markets.
9
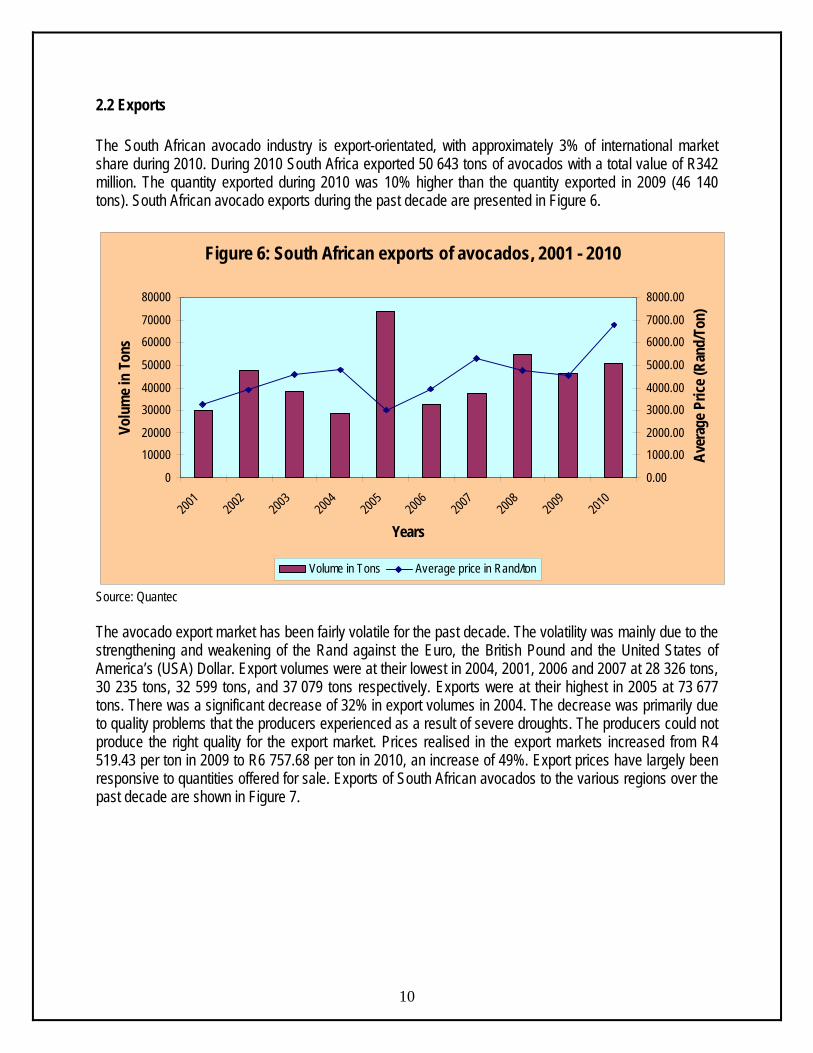
2.2 Exports The South African avocado industry is export-orientated, with approximately 3% of international market share during 2010. During 2010 South Africa exported 50 643 tons of avocados with a total value of R342 million. The quantity exported during 2010 was 10% higher than the quantity exported in 2009 (46 140 tons). South African avocado exports during the past decade are presented in Figure 6.
Figure 6: South African exports of avocados, 2001 - 2010
0
10000
20000
30000
40000
50000
60000
70000
80000
2001
2002
2003
2004
2005
2006
2007
2008
2009
2010
Years
Volu
me i
n To
ns
0.00
1000.00
2000.00
3000.00
4000.00
5000.00
6000.00
7000.00
8000.00
Aver
age P
rice (
Rand
/Ton
)
Volume in Tons Average price in Rand/ton
Source: Quantec The avocado export market has been fairly volatile for the past decade. The volatility was mainly due to the strengthening and weakening of the Rand against the Euro, the British Pound and the United States of America’s (USA) Dollar. Export volumes were at their lowest in 2004, 2001, 2006 and 2007 at 28 326 tons, 30 235 tons, 32 599 tons, and 37 079 tons respectively. Exports were at their highest in 2005 at 73 677 tons. There was a significant decrease of 32% in export volumes in 2004. The decrease was primarily due to quality problems that the producers experienced as a result of severe droughts. The producers could not produce the right quality for the export market. Prices realised in the export markets increased from R4 519.43 per ton in 2009 to R6 757.68 per ton in 2010, an increase of 49%. Export prices have largely been responsive to quantities offered for sale. Exports of South African avocados to the various regions over the past decade are shown in Figure 7.
10
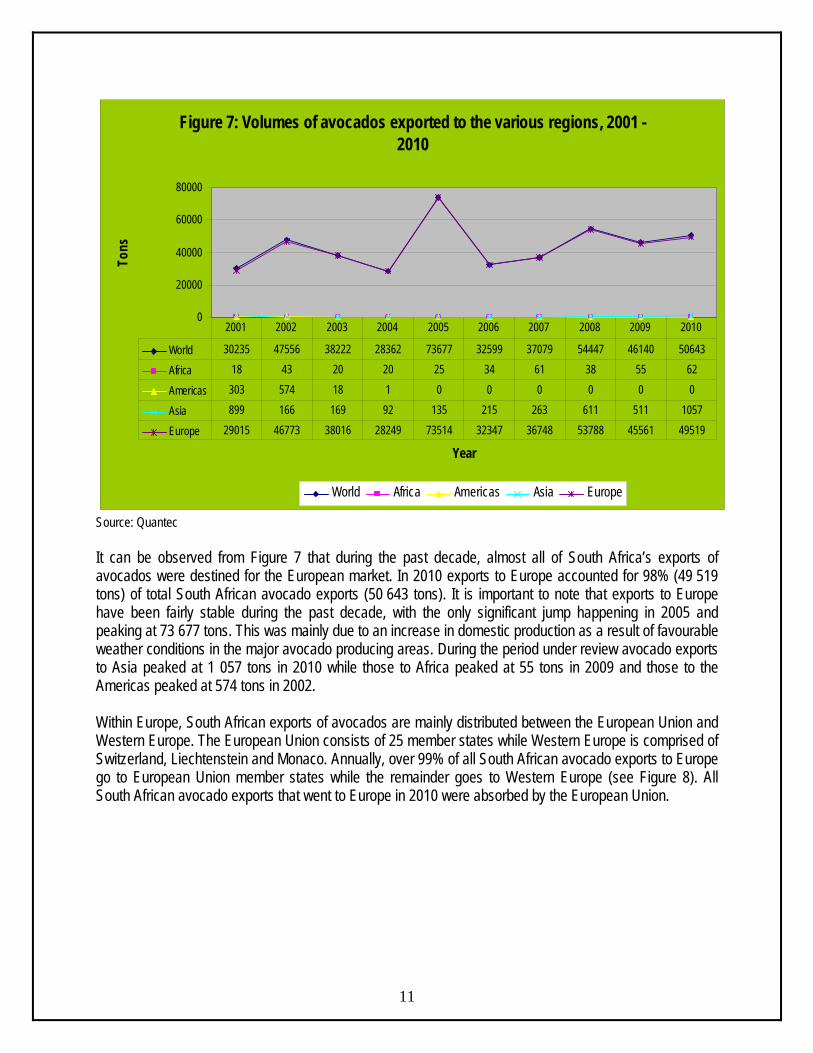
Figure 7: Volumes of avocados exported to the various regions, 2001 - 2010
0
20000
40000
60000
80000
Year
Tons
World Africa Americas Asia Europe
World 30235 47556 38222 28362 73677 32599 37079 54447 46140 50643
Africa 18 43 20 20 25 34 61 38 55 62
Americas 303 574 18 1 0 0 0 0 0 0
Asia 899 166 169 92 135 215 263 611 511 1057
Europe 29015 46773 38016 28249 73514 32347 36748 53788 45561 49519
2001 2002 2003 2004 2005 2006 2007 2008 2009 2010
Source: Quantec It can be observed from Figure 7 that during the past decade, almost all of South Africa’s exports of avocados were destined for the European market. In 2010 exports to Europe accounted for 98% (49 519 tons) of total South African avocado exports (50 643 tons). It is important to note that exports to Europe have been fairly stable during the past decade, with the only significant jump happening in 2005 and peaking at 73 677 tons. This was mainly due to an increase in domestic production as a result of favourable weather conditions in the major avocado producing areas. During the period under review avocado exports to Asia peaked at 1 057 tons in 2010 while those to Africa peaked at 55 tons in 2009 and those to the Americas peaked at 574 tons in 2002. Within Europe, South African exports of avocados are mainly distributed between the European Union and Western Europe. The European Union consists of 25 member states while Western Europe is comprised of Switzerland, Liechtenstein and Monaco. Annually, over 99% of all South African avocado exports to Europe go to European Union member states while the remainder goes to Western Europe (see Figure 8). All South African avocado exports that went to Europe in 2010 were absorbed by the European Union.
11
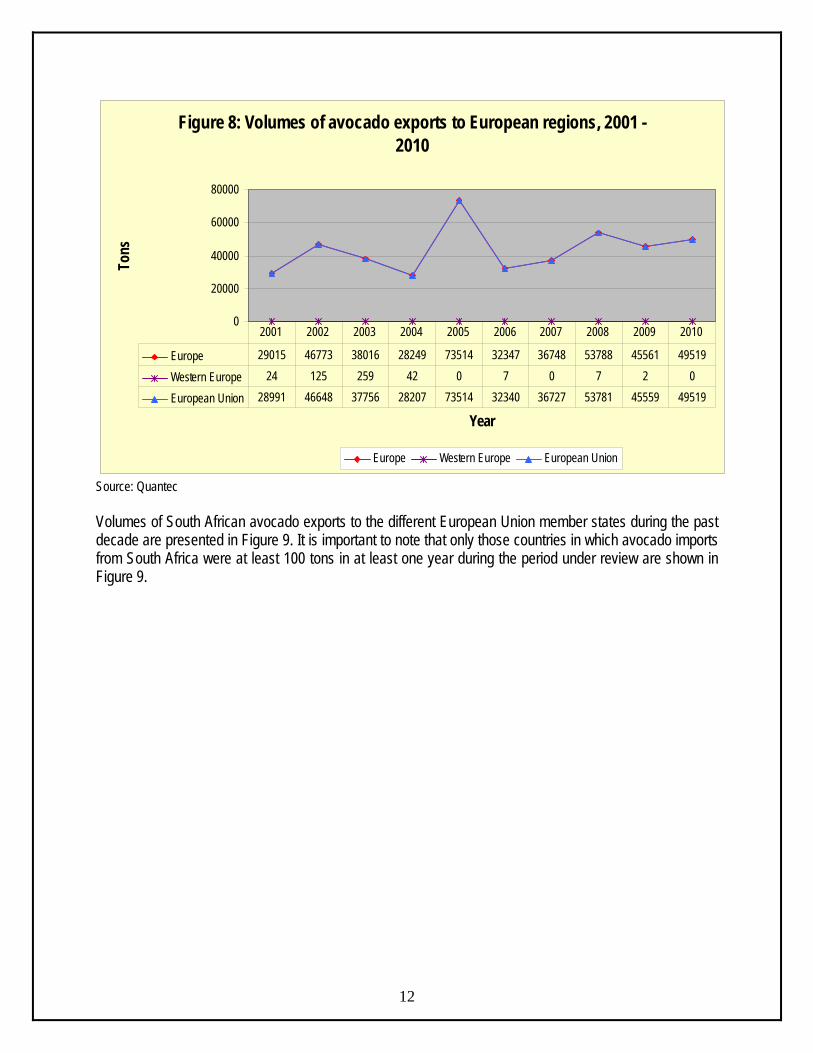
Figure 8: Volumes of avocado exports to European regions, 2001 - 2010
0
20000
40000
60000
80000
Year
Tons
Europe Western Europe European Union
Europe 29015 46773 38016 28249 73514 32347 36748 53788 45561 49519
Western Europe 24 125 259 42 0 7 0 7 2 0
European Union 28991 46648 37756 28207 73514 32340 36727 53781 45559 49519
2001 2002 2003 2004 2005 2006 2007 2008 2009 2010
Source: Quantec Volumes of South African avocado exports to the different European Union member states during the past decade are presented in Figure 9. It is important to note that only those countries in which avocado imports from South Africa were at least 100 tons in at least one year during the period under review are shown in Figure 9.
12
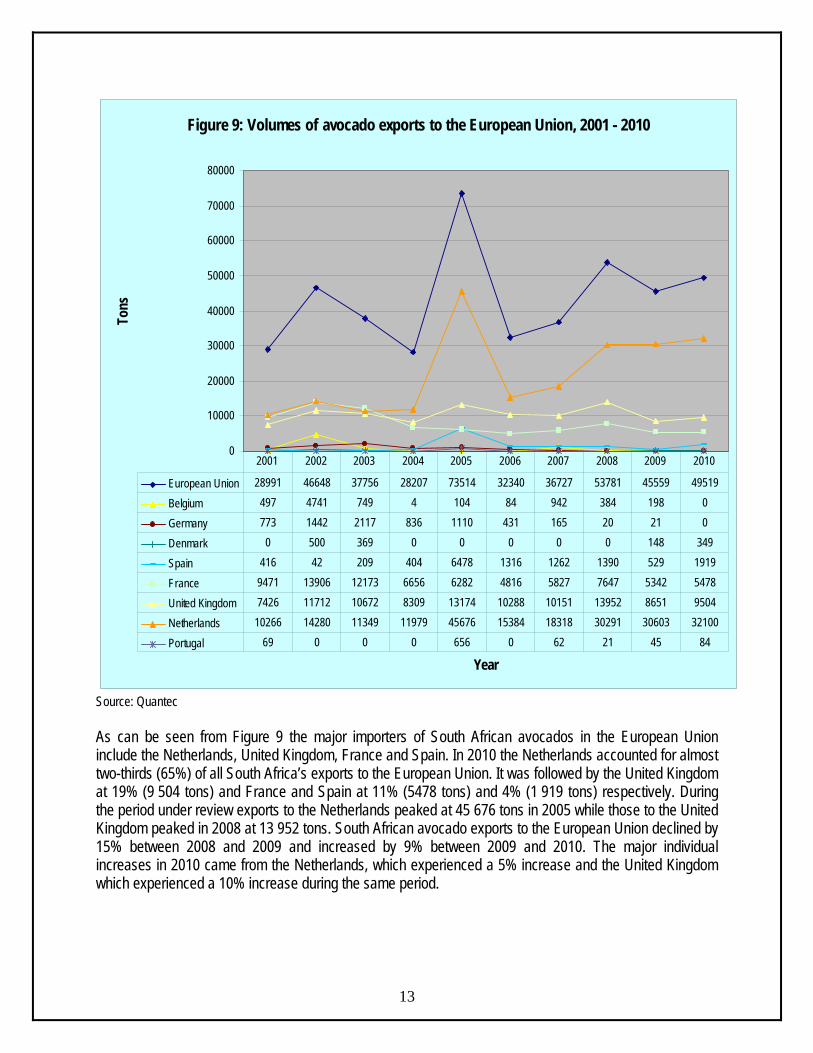
Figure 9: Volumes of avocado exports to the European Union, 2001 - 2010
0
10000
20000
30000
40000
50000
60000
70000
80000
Year
Tons
European Union 28991 46648 37756 28207 73514 32340 36727 53781 45559 49519
Belgium 497 4741 749 4 104 84 942 384 198 0
Germany 773 1442 2117 836 1110 431 165 20 21 0
Denmark 0 500 369 0 0 0 0 0 148 349
Spain 416 42 209 404 6478 1316 1262 1390 529 1919
France 9471 13906 12173 6656 6282 4816 5827 7647 5342 5478
United Kingdom 7426 11712 10672 8309 13174 10288 10151 13952 8651 9504
Netherlands 10266 14280 11349 11979 45676 15384 18318 30291 30603 32100
Portugal 69 0 0 0 656 0 62 21 45 84
2001 2002 2003 2004 2005 2006 2007 2008 2009 2010
Source: Quantec As can be seen from Figure 9 the major importers of South African avocados in the European Union include the Netherlands, United Kingdom, France and Spain. In 2010 the Netherlands accounted for almost two-thirds (65%) of all South Africa’s exports to the European Union. It was followed by the United Kingdom at 19% (9 504 tons) and France and Spain at 11% (5478 tons) and 4% (1 919 tons) respectively. During the period under review exports to the Netherlands peaked at 45 676 tons in 2005 while those to the United Kingdom peaked in 2008 at 13 952 tons. South African avocado exports to the European Union declined by 15% between 2008 and 2009 and increased by 9% between 2009 and 2010. The major individual increases in 2010 came from the Netherlands, which experienced a 5% increase and the United Kingdom which experienced a 10% increase during the same period.
13
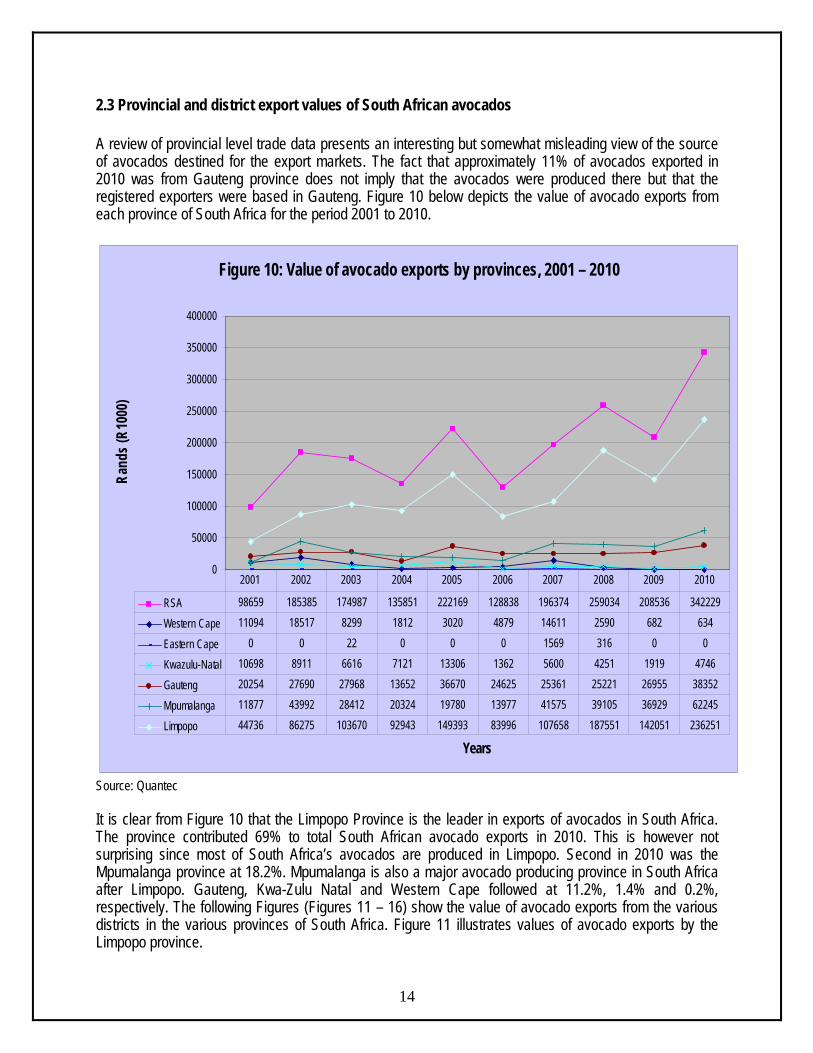
2.3 Provincial and district export values of South African avocados A review of provincial level trade data presents an interesting but somewhat misleading view of the source of avocados destined for the export markets. The fact that approximately 11% of avocados exported in 2010 was from Gauteng province does not imply that the avocados were produced there but that the registered exporters were based in Gauteng. Figure 10 below depicts the value of avocado exports from each province of South Africa for the period 2001 to 2010.
Figure 10: Value of avocado exports by provinces, 2001 – 2010
0
50000
100000
150000
200000
250000
300000
350000
400000
Years
Rand
s (R1
000)
RSA 98659 185385 174987 135851 222169 128838 196374 259034 208536 342229
Western Cape 11094 18517 8299 1812 3020 4879 14611 2590 682 634
Eastern Cape 0 0 22 0 0 0 1569 316 0 0
Kwazulu-Natal 10698 8911 6616 7121 13306 1362 5600 4251 1919 4746
Gauteng 20254 27690 27968 13652 36670 24625 25361 25221 26955 38352
Mpumalanga 11877 43992 28412 20324 19780 13977 41575 39105 36929 62245
Limpopo 44736 86275 103670 92943 149393 83996 107658 187551 142051 236251
2001 2002 2003 2004 2005 2006 2007 2008 2009 2010
Source: Quantec
14
It is clear from Figure 10 that the Limpopo Province is the leader in exports of avocados in South Africa. The province contributed 69% to total South African avocado exports in 2010. This is however not surprising since most of South Africa’s avocados are produced in Limpopo. Second in 2010 was the Mpumalanga province at 18.2%. Mpumalanga is also a major avocado producing province in South Africa after Limpopo. Gauteng, Kwa-Zulu Natal and Western Cape followed at 11.2%, 1.4% and 0.2%, respectively. The following Figures (Figures 11 – 16) show the value of avocado exports from the various districts in the various provinces of South Africa. Figure 11 illustrates values of avocado exports by the Limpopo province.
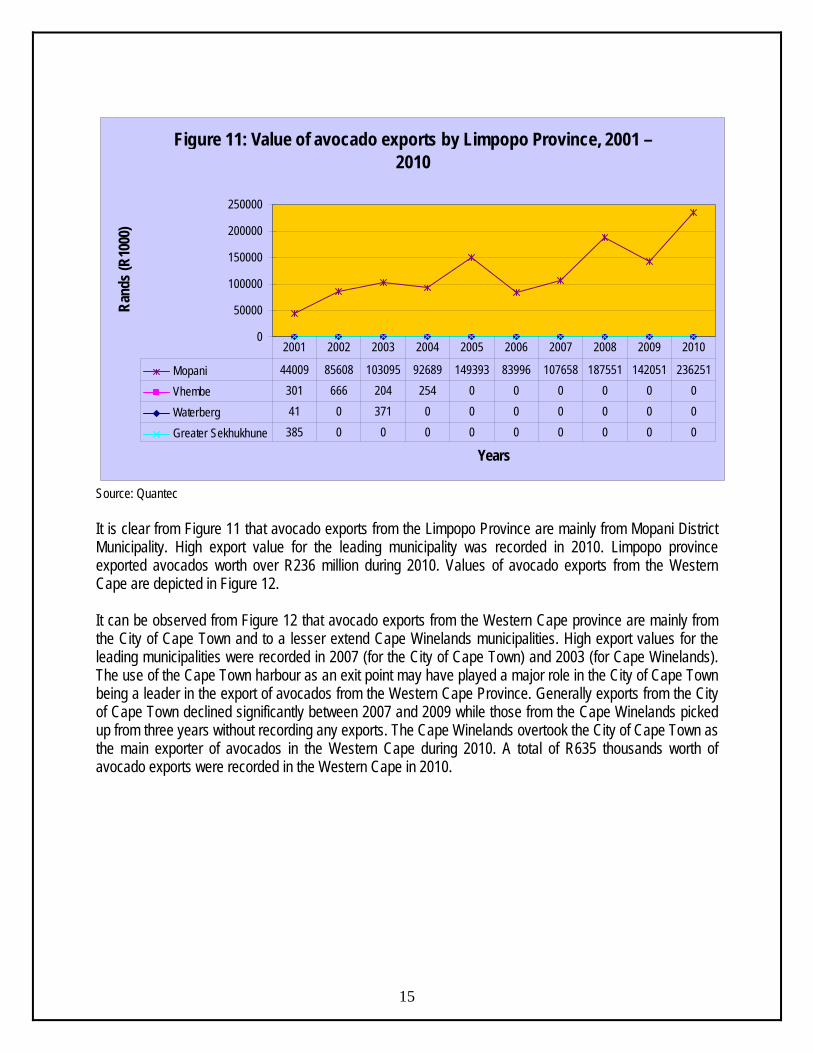
Figure 11: Value of avocado exports by Limpopo Province, 2001 – 2010
0
50000
100000
150000
200000
250000
Years
Rand
s (R1
000)
Mopani 44009 85608 103095 92689 149393 83996 107658 187551 142051 236251
Vhembe 301 666 204 254 0 0 0 0 0 0
Waterberg 41 0 371 0 0 0 0 0 0 0
Greater Sekhukhune 385 0 0 0 0 0 0 0 0 0
2001 2002 2003 2004 2005 2006 2007 2008 2009 2010
Source: Quantec It is clear from Figure 11 that avocado exports from the Limpopo Province are mainly from Mopani District Municipality. High export value for the leading municipality was recorded in 2010. Limpopo province exported avocados worth over R236 million during 2010. Values of avocado exports from the Western Cape are depicted in Figure 12. It can be observed from Figure 12 that avocado exports from the Western Cape province are mainly from the City of Cape Town and to a lesser extend Cape Winelands municipalities. High export values for the leading municipalities were recorded in 2007 (for the City of Cape Town) and 2003 (for Cape Winelands). The use of the Cape Town harbour as an exit point may have played a major role in the City of Cape Town being a leader in the export of avocados from the Western Cape Province. Generally exports from the City of Cape Town declined significantly between 2007 and 2009 while those from the Cape Winelands picked up from three years without recording any exports. The Cape Winelands overtook the City of Cape Town as the main exporter of avocados in the Western Cape during 2010. A total of R635 thousands worth of avocado exports were recorded in the Western Cape in 2010.
15
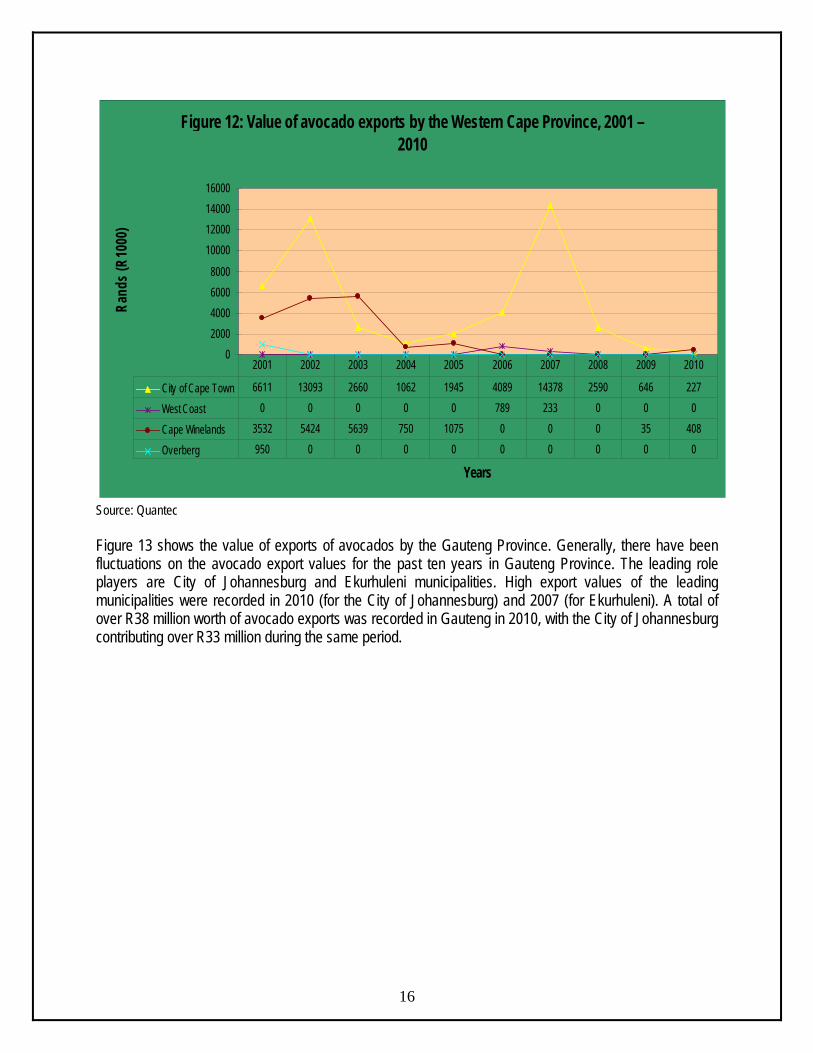
Figure 12: Value of avocado exports by the Western Cape Province, 2001 – 2010
02000400060008000
10000120001400016000
Years
Rand
s (R1
000)
City of Cape Town 6611 13093 2660 1062 1945 4089 14378 2590 646 227
West Coast 0 0 0 0 0 789 233 0 0 0
Cape Winelands 3532 5424 5639 750 1075 0 0 0 35 408
Overberg 950 0 0 0 0 0 0 0 0 0
2001 2002 2003 2004 2005 2006 2007 2008 2009 2010
Source: Quantec Figure 13 shows the value of exports of avocados by the Gauteng Province. Generally, there have been fluctuations on the avocado export values for the past ten years in Gauteng Province. The leading role players are City of Johannesburg and Ekurhuleni municipalities. High export values of the leading municipalities were recorded in 2010 (for the City of Johannesburg) and 2007 (for Ekurhuleni). A total of over R38 million worth of avocado exports was recorded in Gauteng in 2010, with the City of Johannesburg contributing over R33 million during the same period.
16
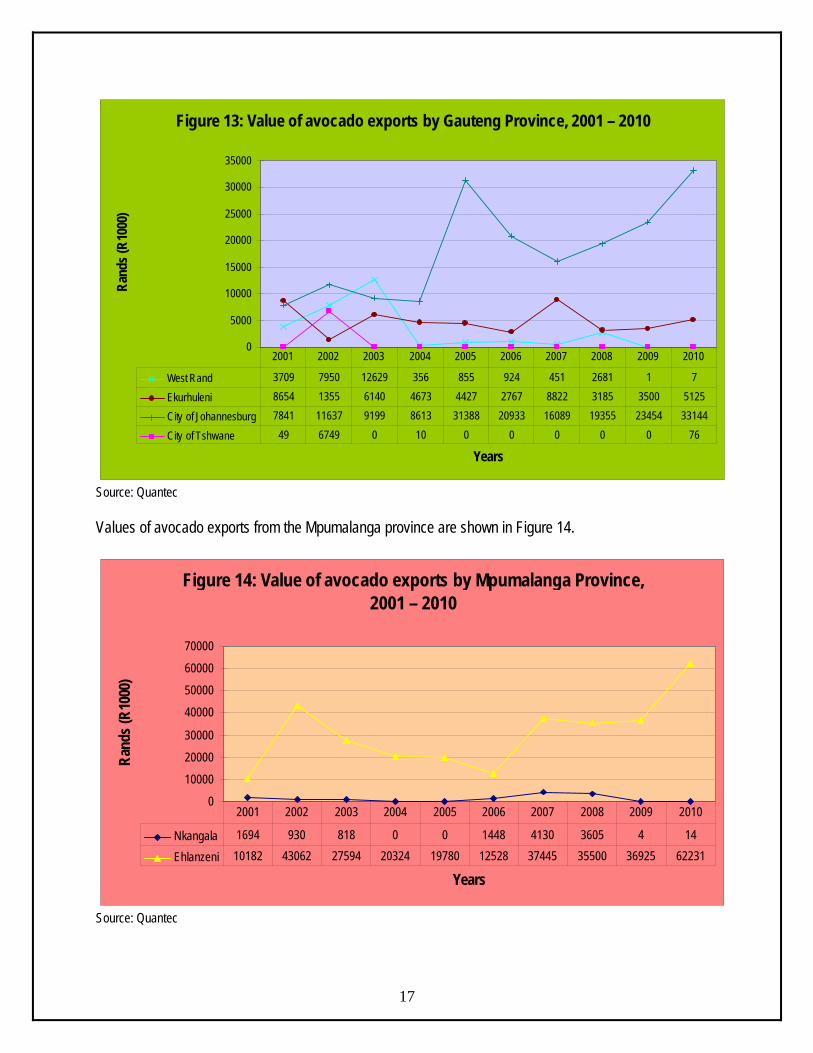
Figure 13: Value of avocado exports by Gauteng Province, 2001 – 2010
0
5000
10000
15000
20000
25000
30000
35000
Years
Rand
s (R1
000)
West Rand 3709 7950 12629 356 855 924 451 2681 1 7
Ekurhuleni 8654 1355 6140 4673 4427 2767 8822 3185 3500 5125
City of Johannesburg 7841 11637 9199 8613 31388 20933 16089 19355 23454 33144
City of Tshwane 49 6749 0 10 0 0 0 0 0 76
2001 2002 2003 2004 2005 2006 2007 2008 2009 2010
Source: Quantec Values of avocado exports from the Mpumalanga province are shown in Figure 14.
Figure 14: Value of avocado exports by Mpumalanga Province, 2001 – 2010
0
10000
20000
30000
40000
50000
60000
70000
Years
Rand
s (R1
000)
Nkangala 1694 930 818 0 0 1448 4130 3605 4 14
Ehlanzeni 10182 43062 27594 20324 19780 12528 37445 35500 36925 62231
2001 2002 2003 2004 2005 2006 2007 2008 2009 2010
17
Source: Quantec
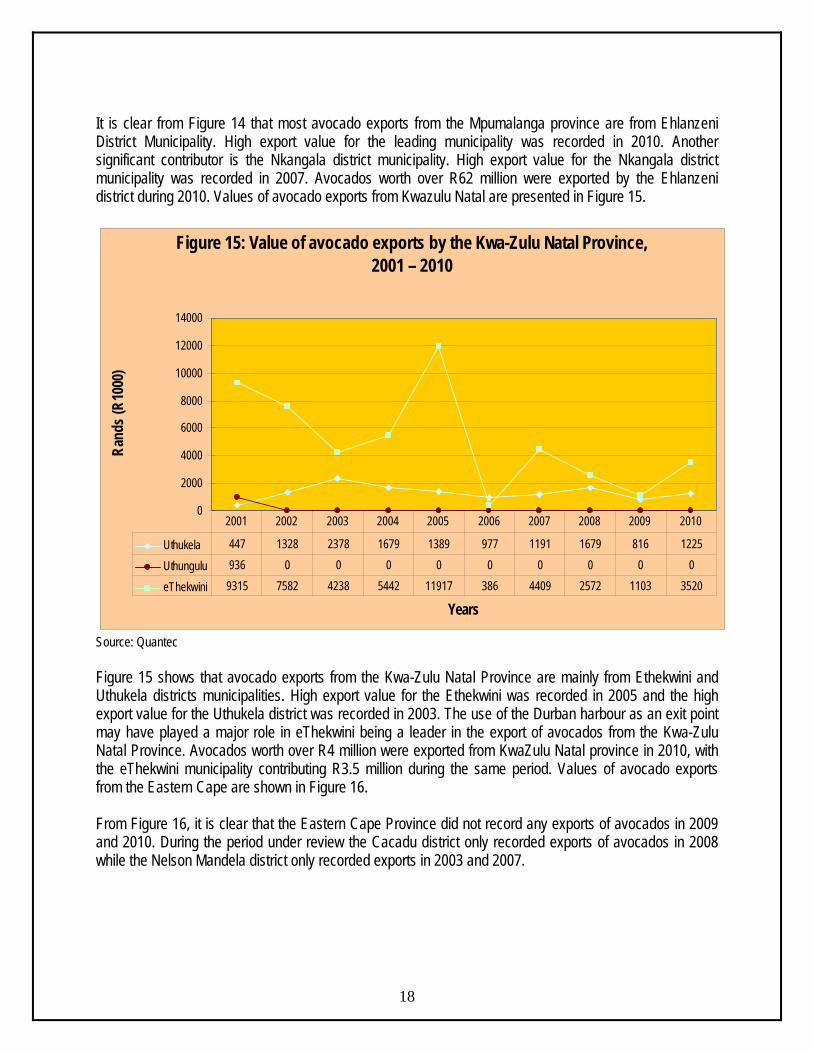
It is clear from Figure 14 that most avocado exports from the Mpumalanga province are from Ehlanzeni District Municipality. High export value for the leading municipality was recorded in 2010. Another significant contributor is the Nkangala district municipality. High export value for the Nkangala district municipality was recorded in 2007. Avocados worth over R62 million were exported by the Ehlanzeni district during 2010. Values of avocado exports from Kwazulu Natal are presented in Figure 15.
Figure 15: Value of avocado exports by the Kwa-Zulu Natal Province, 2001 – 2010
0
2000
4000
6000
8000
10000
12000
14000
Years
Rand
s (R1
000)
Uthukela 447 1328 2378 1679 1389 977 1191 1679 816 1225
Uthungulu 936 0 0 0 0 0 0 0 0 0
eThekwini 9315 7582 4238 5442 11917 386 4409 2572 1103 3520
2001 2002 2003 2004 2005 2006 2007 2008 2009 2010
Source: Quantec Figure 15 shows that avocado exports from the Kwa-Zulu Natal Province are mainly from Ethekwini and Uthukela districts municipalities. High export value for the Ethekwini was recorded in 2005 and the high export value for the Uthukela district was recorded in 2003. The use of the Durban harbour as an exit point may have played a major role in eThekwini being a leader in the export of avocados from the Kwa-Zulu Natal Province. Avocados worth over R4 million were exported from KwaZulu Natal province in 2010, with the eThekwini municipality contributing R3.5 million during the same period. Values of avocado exports from the Eastern Cape are shown in Figure 16. From Figure 16, it is clear that the Eastern Cape Province did not record any exports of avocados in 2009 and 2010. During the period under review the Cacadu district only recorded exports of avocados in 2008 while the Nelson Mandela district only recorded exports in 2003 and 2007.
18
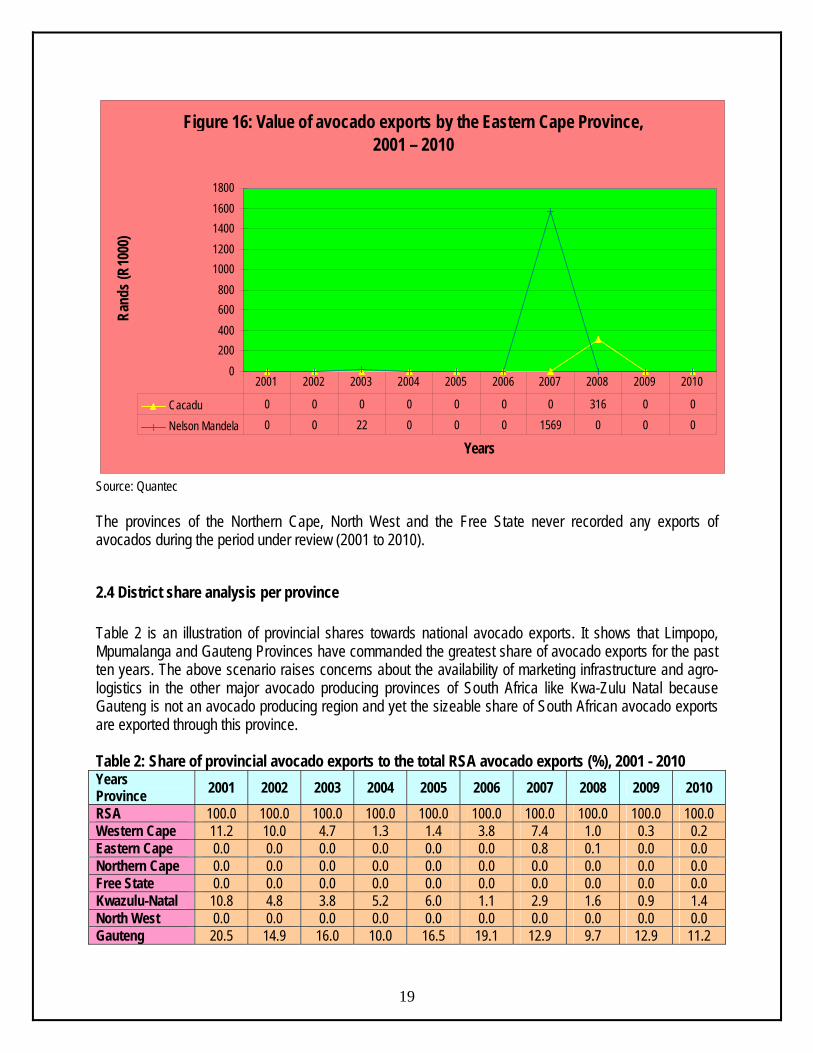
Figure 16: Value of avocado exports by the Eastern Cape Province, 2001 – 2010
0200400600800
10001200140016001800
Years
Rand
s (R1
000)
Cacadu 0 0 0 0 0 0 0 316 0 0
Nelson Mandela 0 0 22 0 0 0 1569 0 0 0
2001 2002 2003 2004 2005 2006 2007 2008 2009 2010
Source: Quantec The provinces of the Northern Cape, North West and the Free State never recorded any exports of avocados during the period under review (2001 to 2010).
2.4 District share analysis per province Table 2 is an illustration of provincial shares towards national avocado exports. It shows that Limpopo, Mpumalanga and Gauteng Provinces have commanded the greatest share of avocado exports for the past ten years. The above scenario raises concerns about the availability of marketing infrastructure and agro-logistics in the other major avocado producing provinces of South Africa like Kwa-Zulu Natal because Gauteng is not an avocado producing region and yet the sizeable share of South African avocado exports are exported through this province. Table 2: Share of provincial avocado exports to the total RSA avocado exports (%), 2001 - 2010
19
Years Province 2001 2002 2003 2004 2005 2006 2007 2008 2009 2010
RSA 100.0 100.0 100.0 100.0 100.0 100.0 100.0 100.0 100.0 100.0 Western Cape 11.2 10.0 4.7 1.3 1.4 3.8 7.4 1.0 0.3 0.2 Eastern Cape 0.0 0.0 0.0 0.0 0.0 0.0 0.8 0.1 0.0 0.0 Northern Cape 0.0 0.0 0.0 0.0 0.0 0.0 0.0 0.0 0.0 0.0 Free State 0.0 0.0 0.0 0.0 0.0 0.0 0.0 0.0 0.0 0.0 Kwazulu-Natal 10.8 4.8 3.8 5.2 6.0 1.1 2.9 1.6 0.9 1.4 North West 0.0 0.0 0.0 0.0 0.0 0.0 0.0 0.0 0.0 0.0 Gauteng 20.5 14.9 16.0 10.0 16.5 19.1 12.9 9.7 12.9 11.2
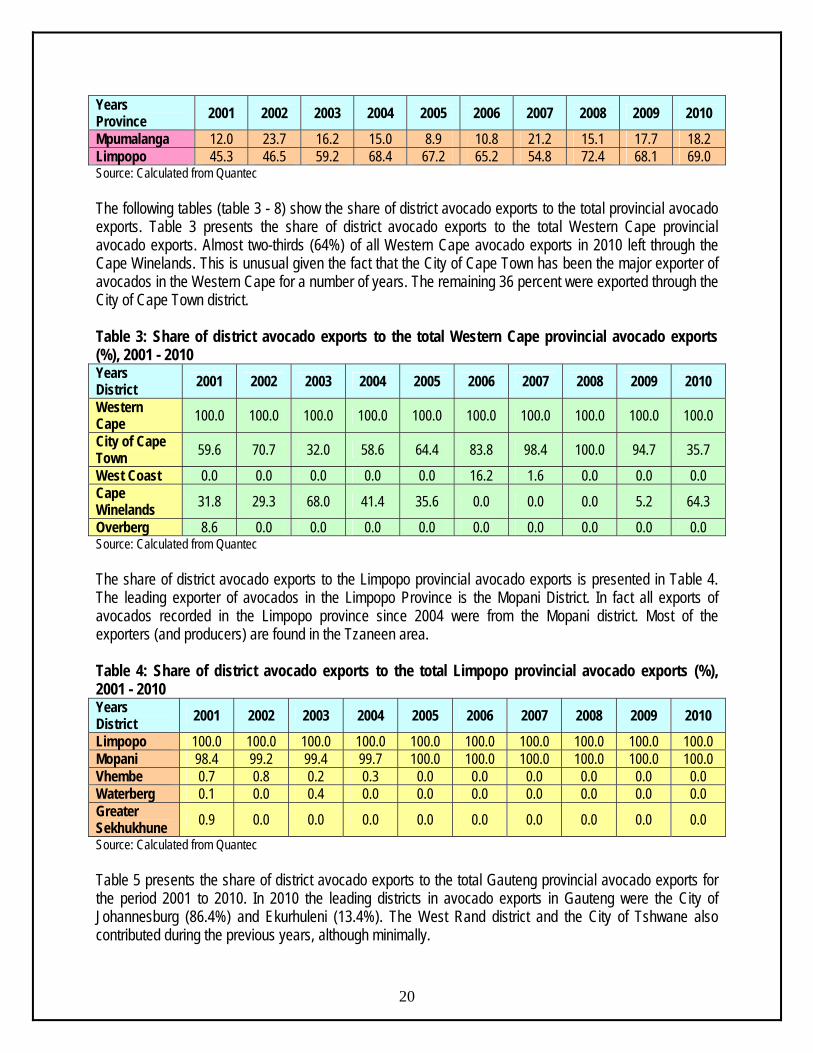
Years Province 2001 2002 2003 2004 2005 2006 2007 2008 2009 2010
Mpumalanga 12.0 23.7 16.2 15.0 8.9 10.8 21.2 15.1 17.7 18.2 Limpopo 45.3 46.5 59.2 68.4 67.2 65.2 54.8 72.4 68.1 69.0 Source: Calculated from Quantec The following tables (table 3 - 8) show the share of district avocado exports to the total provincial avocado exports. Table 3 presents the share of district avocado exports to the total Western Cape provincial avocado exports. Almost two-thirds (64%) of all Western Cape avocado exports in 2010 left through the Cape Winelands. This is unusual given the fact that the City of Cape Town has been the major exporter of avocados in the Western Cape for a number of years. The remaining 36 percent were exported through the City of Cape Town district. Table 3: Share of district avocado exports to the total Western Cape provincial avocado exports (%), 2001 - 2010 Years District 2001 2002 2003 2004 2005 2006 2007 2008 2009 2010
Western Cape 100.0 100.0 100.0 100.0 100.0 100.0 100.0 100.0 100.0 100.0
City of Cape Town 59.6 70.7 32.0 58.6 64.4 83.8 98.4 100.0 94.7 35.7
West Coast 0.0 0.0 0.0 0.0 0.0 16.2 1.6 0.0 0.0 0.0 Cape Winelands 31.8 29.3 68.0 41.4 35.6 0.0 0.0 0.0 5.2 64.3
Overberg 8.6 0.0 0.0 0.0 0.0 0.0 0.0 0.0 0.0 0.0 Source: Calculated from Quantec The share of district avocado exports to the Limpopo provincial avocado exports is presented in Table 4. The leading exporter of avocados in the Limpopo Province is the Mopani District. In fact all exports of avocados recorded in the Limpopo province since 2004 were from the Mopani district. Most of the exporters (and producers) are found in the Tzaneen area. Table 4: Share of district avocado exports to the total Limpopo provincial avocado exports (%), 2001 - 2010 Years District 2001 2002 2003 2004 2005 2006 2007 2008 2009 2010
Limpopo 100.0 100.0 100.0 100.0 100.0 100.0 100.0 100.0 100.0 100.0 Mopani 98.4 99.2 99.4 99.7 100.0 100.0 100.0 100.0 100.0 100.0 Vhembe 0.7 0.8 0.2 0.3 0.0 0.0 0.0 0.0 0.0 0.0 Waterberg 0.1 0.0 0.4 0.0 0.0 0.0 0.0 0.0 0.0 0.0 Greater Sekhukhune 0.9 0.0 0.0 0.0 0.0 0.0 0.0 0.0 0.0 0.0 Source: Calculated from Quantec
20
Table 5 presents the share of district avocado exports to the total Gauteng provincial avocado exports for the period 2001 to 2010. In 2010 the leading districts in avocado exports in Gauteng were the City of Johannesburg (86.4%) and Ekurhuleni (13.4%). The West Rand district and the City of Tshwane also contributed during the previous years, although minimally.
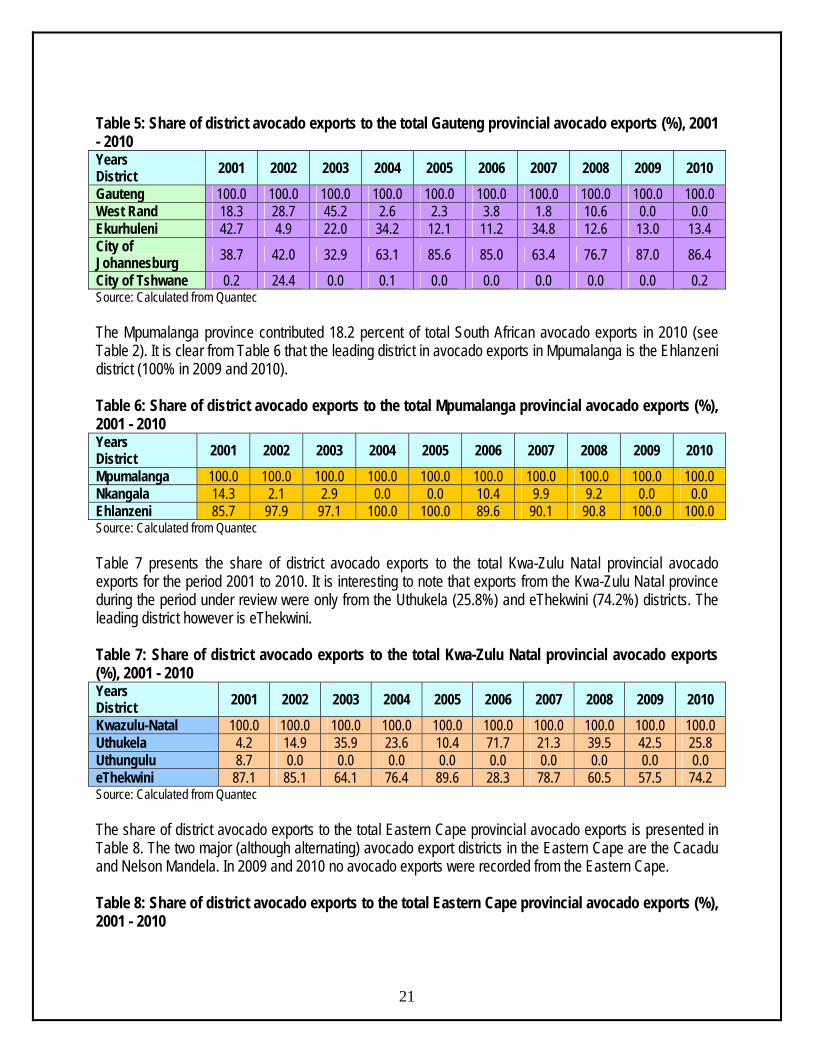
Table 5: Share of district avocado exports to the total Gauteng provincial avocado exports (%), 2001 - 2010 Years District 2001 2002 2003 2004 2005 2006 2007 2008 2009 2010
Gauteng 100.0 100.0 100.0 100.0 100.0 100.0 100.0 100.0 100.0 100.0 West Rand 18.3 28.7 45.2 2.6 2.3 3.8 1.8 10.6 0.0 0.0 Ekurhuleni 42.7 4.9 22.0 34.2 12.1 11.2 34.8 12.6 13.0 13.4 City of Johannesburg 38.7 42.0 32.9 63.1 85.6 85.0 63.4 76.7 87.0 86.4
City of Tshwane 0.2 24.4 0.0 0.1 0.0 0.0 0.0 0.0 0.0 0.2 Source: Calculated from Quantec The Mpumalanga province contributed 18.2 percent of total South African avocado exports in 2010 (see Table 2). It is clear from Table 6 that the leading district in avocado exports in Mpumalanga is the Ehlanzeni district (100% in 2009 and 2010). Table 6: Share of district avocado exports to the total Mpumalanga provincial avocado exports (%), 2001 - 2010 Years District 2001 2002 2003 2004 2005 2006 2007 2008 2009 2010
Mpumalanga 100.0 100.0 100.0 100.0 100.0 100.0 100.0 100.0 100.0 100.0 Nkangala 14.3 2.1 2.9 0.0 0.0 10.4 9.9 9.2 0.0 0.0 Ehlanzeni 85.7 97.9 97.1 100.0 100.0 89.6 90.1 90.8 100.0 100.0 Source: Calculated from Quantec Table 7 presents the share of district avocado exports to the total Kwa-Zulu Natal provincial avocado exports for the period 2001 to 2010. It is interesting to note that exports from the Kwa-Zulu Natal province during the period under review were only from the Uthukela (25.8%) and eThekwini (74.2%) districts. The leading district however is eThekwini. Table 7: Share of district avocado exports to the total Kwa-Zulu Natal provincial avocado exports (%), 2001 - 2010 Years District 2001 2002 2003 2004 2005 2006 2007 2008 2009 2010
Kwazulu-Natal 100.0 100.0 100.0 100.0 100.0 100.0 100.0 100.0 100.0 100.0 Uthukela 4.2 14.9 35.9 23.6 10.4 71.7 21.3 39.5 42.5 25.8 Uthungulu 8.7 0.0 0.0 0.0 0.0 0.0 0.0 0.0 0.0 0.0 eThekwini 87.1 85.1 64.1 76.4 89.6 28.3 78.7 60.5 57.5 74.2 Source: Calculated from Quantec The share of district avocado exports to the total Eastern Cape provincial avocado exports is presented in Table 8. The two major (although alternating) avocado export districts in the Eastern Cape are the Cacadu and Nelson Mandela. In 2009 and 2010 no avocado exports were recorded from the Eastern Cape.
21
Table 8: Share of district avocado exports to the total Eastern Cape provincial avocado exports (%), 2001 - 2010
Years District 2001 2002 2003 2004 2005 2006 2007 2008 2009 2010
Eastern Cape 0.0 0.0 100.0 0.0 0.0 0.0 100.0 100.0 0.0 0.0
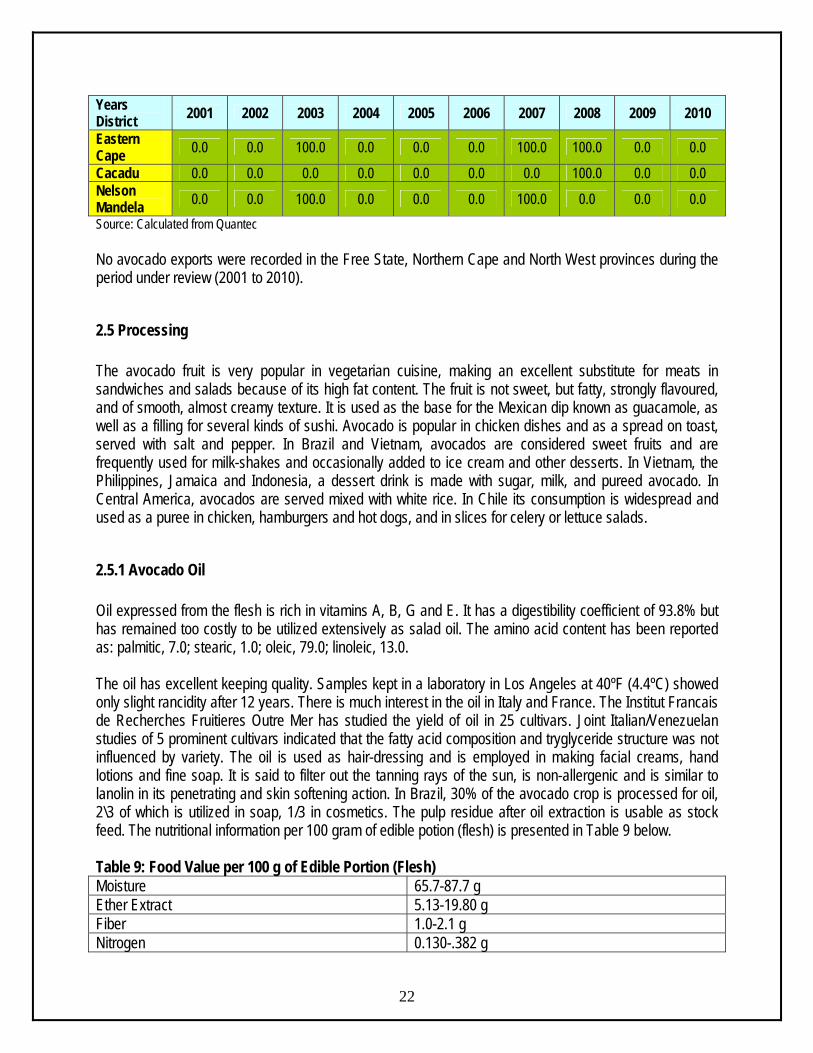
Cacadu 0.0 0.0 0.0 0.0 0.0 0.0 0.0 100.0 0.0 0.0 Nelson Mandela 0.0 0.0 100.0 0.0 0.0 0.0 100.0 0.0 0.0 0.0 Source: Calculated from Quantec No avocado exports were recorded in the Free State, Northern Cape and North West provinces during the period under review (2001 to 2010).
2.5 Processing The avocado fruit is very popular in vegetarian cuisine, making an excellent substitute for meats in sandwiches and salads because of its high fat content. The fruit is not sweet, but fatty, strongly flavoured, and of smooth, almost creamy texture. It is used as the base for the Mexican dip known as guacamole, as well as a filling for several kinds of sushi. Avocado is popular in chicken dishes and as a spread on toast, served with salt and pepper. In Brazil and Vietnam, avocados are considered sweet fruits and are frequently used for milk-shakes and occasionally added to ice cream and other desserts. In Vietnam, the Philippines, Jamaica and Indonesia, a dessert drink is made with sugar, milk, and pureed avocado. In Central America, avocados are served mixed with white rice. In Chile its consumption is widespread and used as a puree in chicken, hamburgers and hot dogs, and in slices for celery or lettuce salads.
2.5.1 Avocado Oil Oil expressed from the flesh is rich in vitamins A, B, G and E. It has a digestibility coefficient of 93.8% but has remained too costly to be utilized extensively as salad oil. The amino acid content has been reported as: palmitic, 7.0; stearic, 1.0; oleic, 79.0; linoleic, 13.0. The oil has excellent keeping quality. Samples kept in a laboratory in Los Angeles at 40ºF (4.4ºC) showed only slight rancidity after 12 years. There is much interest in the oil in Italy and France. The Institut Francais de Recherches Fruitieres Outre Mer has studied the yield of oil in 25 cultivars. Joint Italian/Venezuelan studies of 5 prominent cultivars indicated that the fatty acid composition and tryglyceride structure was not influenced by variety. The oil is used as hair-dressing and is employed in making facial creams, hand lotions and fine soap. It is said to filter out the tanning rays of the sun, is non-allergenic and is similar to lanolin in its penetrating and skin softening action. In Brazil, 30% of the avocado crop is processed for oil, 2\3 of which is utilized in soap, 1/3 in cosmetics. The pulp residue after oil extraction is usable as stock feed. The nutritional information per 100 gram of edible potion (flesh) is presented in Table 9 below. Table 9: Food Value per 100 g of Edible Portion (Flesh)
22
Moisture 65.7-87.7 g Ether Extract 5.13-19.80 g Fiber 1.0-2.1 g Nitrogen 0.130-.382 g
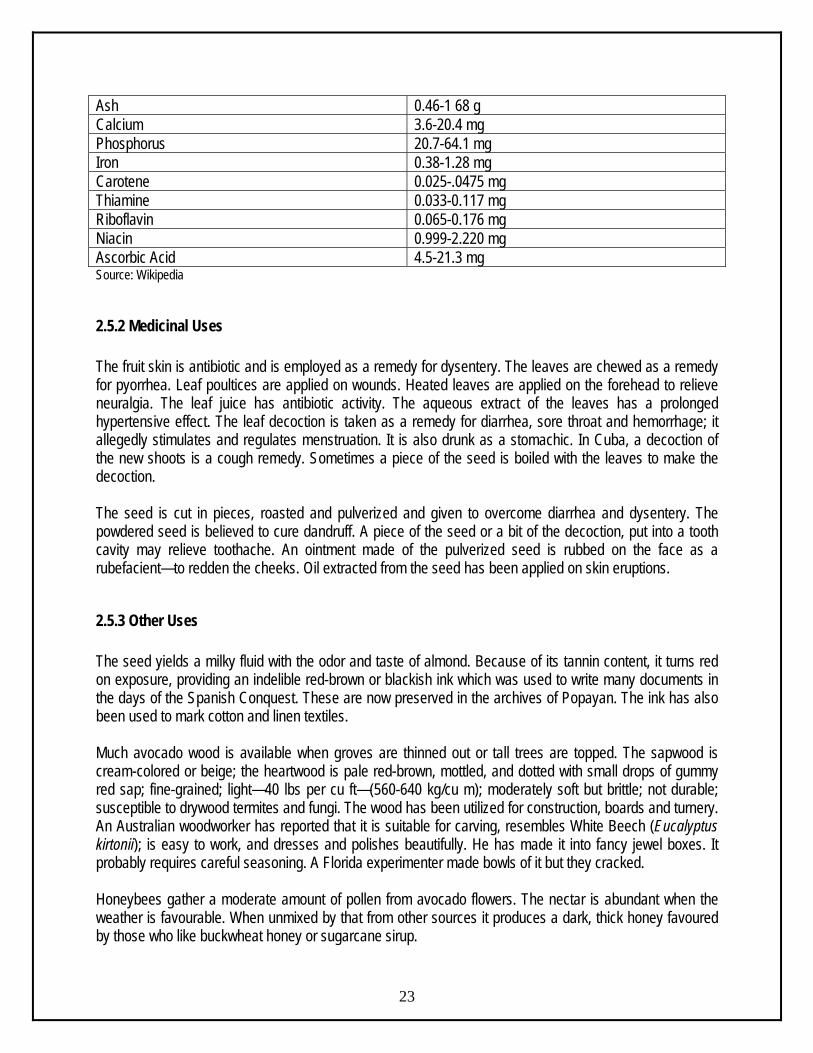
Ash 0.46-1 68 g Calcium 3.6-20.4 mg Phosphorus 20.7-64.1 mg Iron 0.38-1.28 mg Carotene 0.025-.0475 mg Thiamine 0.033-0.117 mg Riboflavin 0.065-0.176 mg Niacin 0.999-2.220 mg Ascorbic Acid 4.5-21.3 mg Source: Wikipedia
2.5.2 Medicinal Uses The fruit skin is antibiotic and is employed as a remedy for dysentery. The leaves are chewed as a remedy for pyorrhea. Leaf poultices are applied on wounds. Heated leaves are applied on the forehead to relieve neuralgia. The leaf juice has antibiotic activity. The aqueous extract of the leaves has a prolonged hypertensive effect. The leaf decoction is taken as a remedy for diarrhea, sore throat and hemorrhage; it allegedly stimulates and regulates menstruation. It is also drunk as a stomachic. In Cuba, a decoction of the new shoots is a cough remedy. Sometimes a piece of the seed is boiled with the leaves to make the decoction. The seed is cut in pieces, roasted and pulverized and given to overcome diarrhea and dysentery. The powdered seed is believed to cure dandruff. A piece of the seed or a bit of the decoction, put into a tooth cavity may relieve toothache. An ointment made of the pulverized seed is rubbed on the face as a rubefacient—to redden the cheeks. Oil extracted from the seed has been applied on skin eruptions.
2.5.3 Other Uses The seed yields a milky fluid with the odor and taste of almond. Because of its tannin content, it turns red on exposure, providing an indelible red-brown or blackish ink which was used to write many documents in the days of the Spanish Conquest. These are now preserved in the archives of Popayan. The ink has also been used to mark cotton and linen textiles. Much avocado wood is available when groves are thinned out or tall trees are topped. The sapwood is cream-colored or beige; the heartwood is pale red-brown, mottled, and dotted with small drops of gummy red sap; fine-grained; light—40 lbs per cu ft—(560-640 kg/cu m); moderately soft but brittle; not durable; susceptible to drywood termites and fungi. The wood has been utilized for construction, boards and turnery. An Australian woodworker has reported that it is suitable for carving, resembles White Beech (Eucalyptus kirtonii); is easy to work, and dresses and polishes beautifully. He has made it into fancy jewel boxes. It probably requires careful seasoning. A Florida experimenter made bowls of it but they cracked.
23
Honeybees gather a moderate amount of pollen from avocado flowers. The nectar is abundant when the weather is favourable. When unmixed by that from other sources it produces a dark, thick honey favoured by those who like buckwheat honey or sugarcane sirup.
24
3. MARKET INTELIGENCE
3.1 Competitiveness of South African avocado exports Competitiveness is described as an industry’s capacity to create superior value for its customers and improved profits for the stakeholders in the value chain. The driving force in sustaining a competitive position is productivity that is output efficiency in relation to specific inputs with regard to human, capital and natural resources. In 2010 South Africa’s avocado exports represented 3.07% of world exports and its ranking in world exports was position 8. As depicted on the Figure 17 below, South African avocado exports are growing faster than the world imports in Zimbabwe, Singapore, Mozambique, and Mauritius markets. South Africa’s performance in these markets can be regarded as gains in dynamic markets. South African avocado exports are growing while the world imports are declining in France and the United Kingdom markets. South Africa’s performance in those markets can be regarded as gains in declining markets and should be viewed as achievement in adversity. At the same time South African avocado exports have declined faster than the world imports in Angola and Spain markets. South Africa’s performance in those markets can be regarded as loss in the declining markets. South African avocado exports are declining while world imports are growing in the Netherlands, Hong Kong and the United Arab Emirates markets. These markets are dynamic and South Africa’s performance is these markets should be viewed as an underachievement.
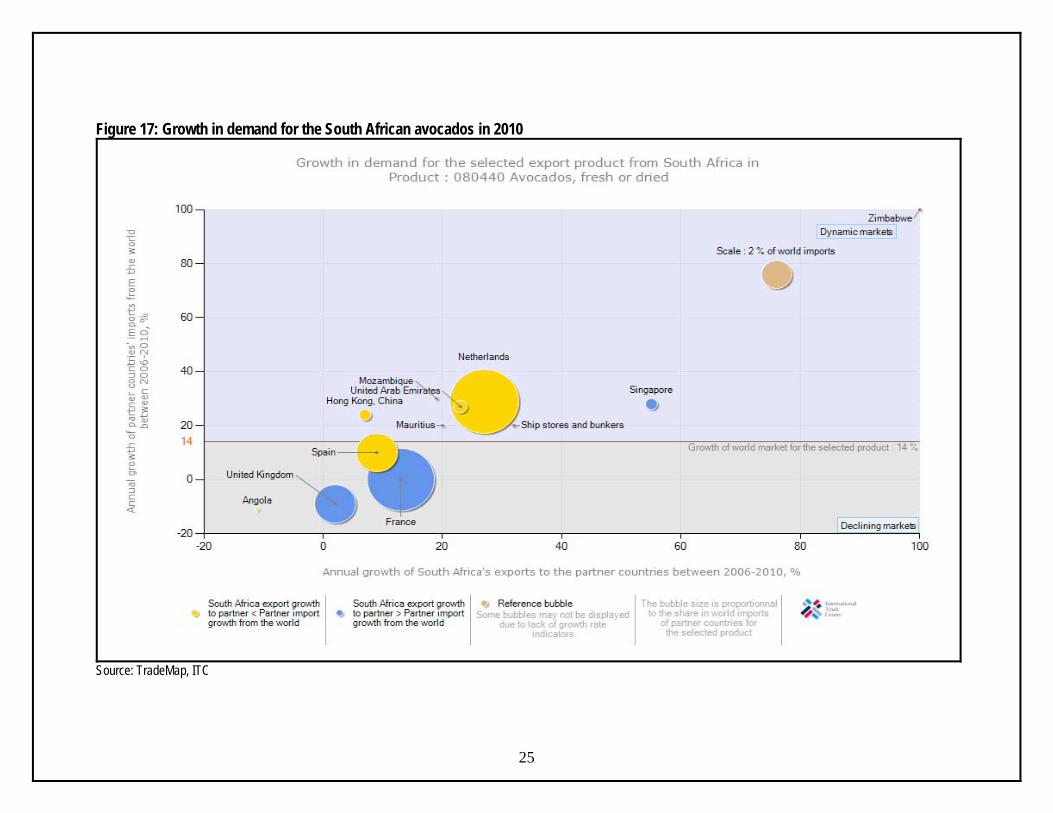
Figure 17: Growth in demand for the South African avocados in 2010
25
Source: TradeMap, ITC
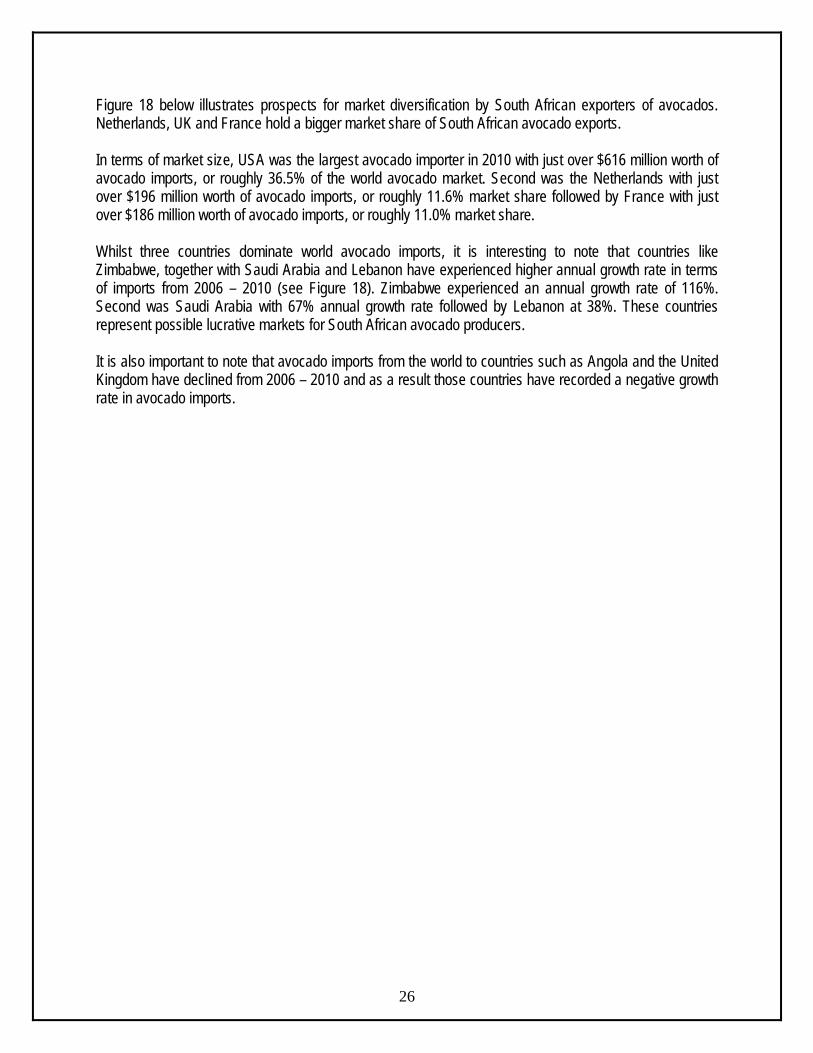
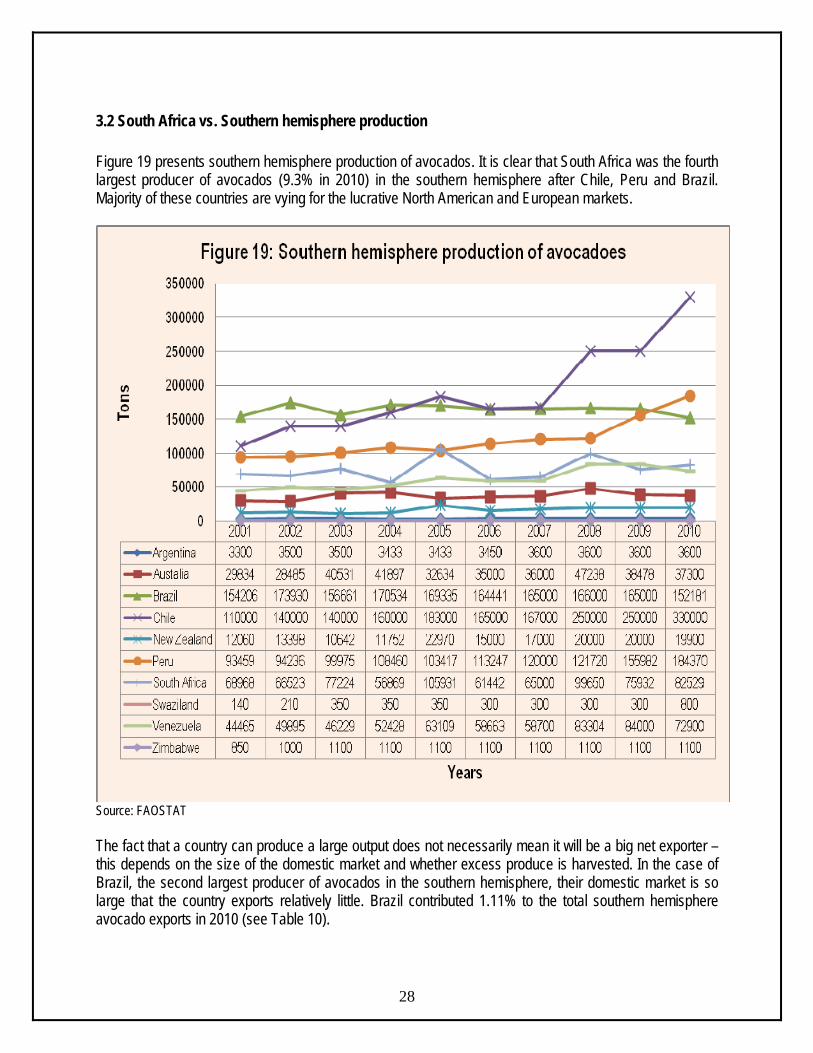
Figure 18 below illustrates prospects for market diversification by South African exporters of avocados. Netherlands, UK and France hold a bigger market share of South African avocado exports. In terms of market size, USA was the largest avocado importer in 2010 with just over $616 million worth of avocado imports, or roughly 36.5% of the world avocado market. Second was the Netherlands with just over $196 million worth of avocado imports, or roughly 11.6% market share followed by France with just over $186 million worth of avocado imports, or roughly 11.0% market share. Whilst three countries dominate world avocado imports, it is interesting to note that countries like Zimbabwe, together with Saudi Arabia and Lebanon have experienced higher annual growth rate in terms of imports from 2006 – 2010 (see Figure 18). Zimbabwe experienced an annual growth rate of 116%. Second was Saudi Arabia with 67% annual growth rate followed by Lebanon at 38%. These countries represent possible lucrative markets for South African avocado producers. It is also important to note that avocado imports from the world to countries such as Angola and the United Kingdom have declined from 2006 – 2010 and as a result those countries have recorded a negative growth rate in avocado imports.
26
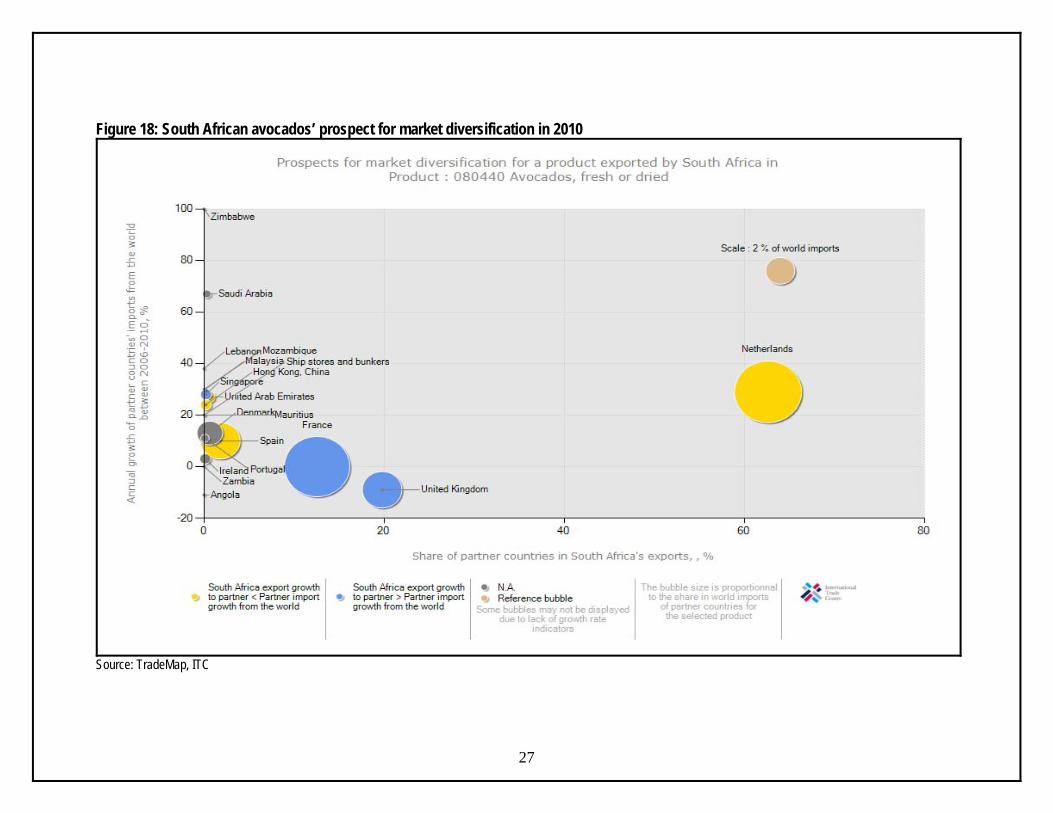
Figure 18: South African avocados’ prospect for market diversification in 2010
27
Source: TradeMap, ITC
3.2 South Africa vs. Southern hemisphere production Figure 19 presents southern hemisphere production of avocados. It is clear that South Africa was the fourth largest producer of avocados (9.3% in 2010) in the southern hemisphere after Chile, Peru and Brazil. Majority of these countries are vying for the lucrative North American and European markets.
Source: FAOSTAT The fact that a country can produce a large output does not necessarily mean it will be a big net exporter – this depends on the size of the domestic market and whether excess produce is harvested. In the case of Brazil, the second largest producer of avocados in the southern hemisphere, their domestic market is so large that the country exports relatively little. Brazil contributed 1.11% to the total southern hemisphere avocado exports in 2010 (see Table 10).
28
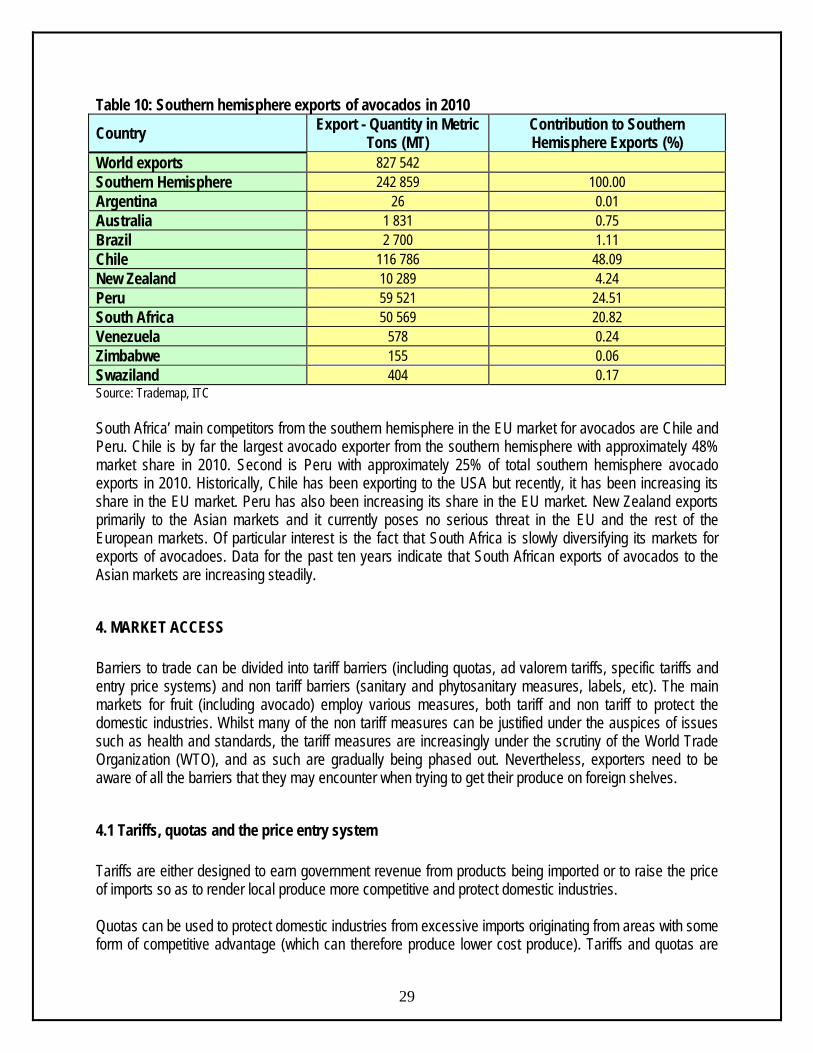
Table 10: Southern hemisphere exports of avocados in 2010
Country Export - Quantity in Metric Tons (MT)
Contribution to Southern Hemisphere Exports (%)
World exports 827 542 Southern Hemisphere 242 859 100.00 Argentina 26 0.01 Australia 1 831 0.75 Brazil 2 700 1.11 Chile 116 786 48.09 New Zealand 10 289 4.24 Peru 59 521 24.51 South Africa 50 569 20.82 Venezuela 578 0.24 Zimbabwe 155 0.06 Swaziland 404 0.17 Source: Trademap, ITC South Africa’ main competitors from the southern hemisphere in the EU market for avocados are Chile and Peru. Chile is by far the largest avocado exporter from the southern hemisphere with approximately 48% market share in 2010. Second is Peru with approximately 25% of total southern hemisphere avocado exports in 2010. Historically, Chile has been exporting to the USA but recently, it has been increasing its share in the EU market. Peru has also been increasing its share in the EU market. New Zealand exports primarily to the Asian markets and it currently poses no serious threat in the EU and the rest of the European markets. Of particular interest is the fact that South Africa is slowly diversifying its markets for exports of avocadoes. Data for the past ten years indicate that South African exports of avocados to the Asian markets are increasing steadily.
4. MARKET ACCESS Barriers to trade can be divided into tariff barriers (including quotas, ad valorem tariffs, specific tariffs and entry price systems) and non tariff barriers (sanitary and phytosanitary measures, labels, etc). The main markets for fruit (including avocado) employ various measures, both tariff and non tariff to protect the domestic industries. Whilst many of the non tariff measures can be justified under the auspices of issues such as health and standards, the tariff measures are increasingly under the scrutiny of the World Trade Organization (WTO), and as such are gradually being phased out. Nevertheless, exporters need to be aware of all the barriers that they may encounter when trying to get their produce on foreign shelves.
4.1 Tariffs, quotas and the price entry system Tariffs are either designed to earn government revenue from products being imported or to raise the price of imports so as to render local produce more competitive and protect domestic industries.
29
Quotas can be used to protect domestic industries from excessive imports originating from areas with some form of competitive advantage (which can therefore produce lower cost produce). Tariffs and quotas are
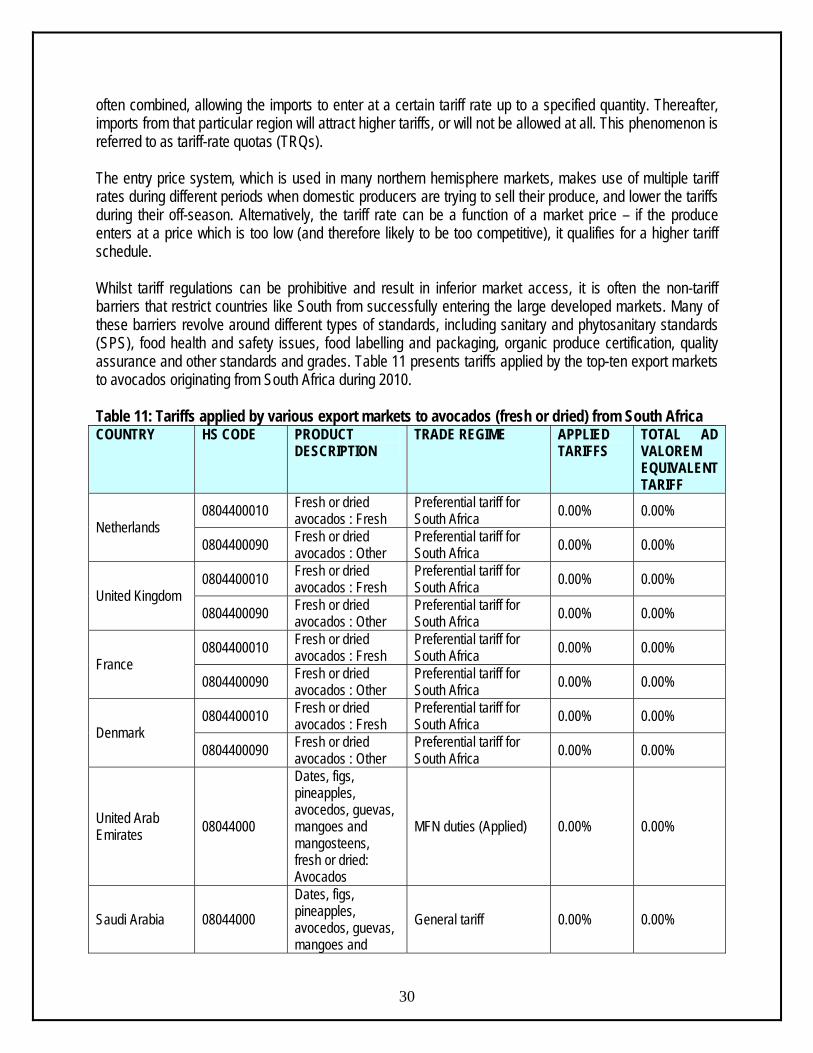
often combined, allowing the imports to enter at a certain tariff rate up to a specified quantity. Thereafter, imports from that particular region will attract higher tariffs, or will not be allowed at all. This phenomenon is referred to as tariff-rate quotas (TRQs). The entry price system, which is used in many northern hemisphere markets, makes use of multiple tariff rates during different periods when domestic producers are trying to sell their produce, and lower the tariffs during their off-season. Alternatively, the tariff rate can be a function of a market price – if the produce enters at a price which is too low (and therefore likely to be too competitive), it qualifies for a higher tariff schedule. Whilst tariff regulations can be prohibitive and result in inferior market access, it is often the non-tariff barriers that restrict countries like South from successfully entering the large developed markets. Many of these barriers revolve around different types of standards, including sanitary and phytosanitary standards (SPS), food health and safety issues, food labelling and packaging, organic produce certification, quality assurance and other standards and grades. Table 11 presents tariffs applied by the top-ten export markets to avocados originating from South Africa during 2010. Table 11: Tariffs applied by various export markets to avocados (fresh or dried) from South Africa
30
COUNTRY HS CODE PRODUCT DESCRIPTION
TRADE REGIME APPLIED TARIFFS
TOTAL AD VALOREM EQUIVALENT TARIFF
0804400010 Fresh or dried avocados : Fresh
Preferential tariff for South Africa 0.00% 0.00%
Netherlands 0804400090 Fresh or dried
avocados : Other Preferential tariff for South Africa 0.00% 0.00%
0804400010 Fresh or dried avocados : Fresh
Preferential tariff for South Africa 0.00% 0.00%
United Kingdom 0804400090 Fresh or dried
avocados : Other Preferential tariff for South Africa 0.00% 0.00%
0804400010 Fresh or dried avocados : Fresh
Preferential tariff for South Africa 0.00% 0.00%
France 0804400090 Fresh or dried
avocados : Other Preferential tariff for South Africa 0.00% 0.00%
0804400010 Fresh or dried avocados : Fresh
Preferential tariff for South Africa 0.00% 0.00%
Denmark 0804400090 Fresh or dried
avocados : Other Preferential tariff for South Africa 0.00% 0.00%
United Arab Emirates 08044000
Dates, figs, pineapples, avocedos, guevas, mangoes and mangosteens, fresh or dried: Avocados
MFN duties (Applied) 0.00% 0.00%
Saudi Arabia 08044000 Dates, figs, pineapples, avocedos, guevas, mangoes and
General tariff 0.00% 0.00%
COUNTRY HS CODE PRODUCT DESCRIPTION
TRADE REGIME APPLIED TOTAL AD TARIFFS VALOREM
EQUIVALENT TARIFF
mangosteens, fresh or dried: Avocados
08044010 Fresh or dried avocados : fresh MFN duties (Applied)
85.00% or 505.42 $/Ton whichever is the lower
27.54% Israel
08044020 Fresh or dried avocados : dried MFN duties (Applied) 25.00% 25.00%
Singapore 08044000 AVOCADOS FRESH OR DRIED (TNE)
MFN duties (Applied) 0.00% 0.00%
Hong Kong 08044000
Dates, figs, pineapples, avocados, guavas, mangoes and mangosteens, fresh or dried: Avocados
MFN duties (Applied) 0.00% 0.00%
Malaysia 08044000 Fresh or dried avocados MFN duties (Applied) 5.00% 5.00%
0804400010 Fresh or dried avocados : Fresh
Preferential tariff for South Africa 0.00% 0.00%
Ireland 0804400090 Fresh or dried
avocados : Other Preferential tariff for South Africa 0.00% 0.00%
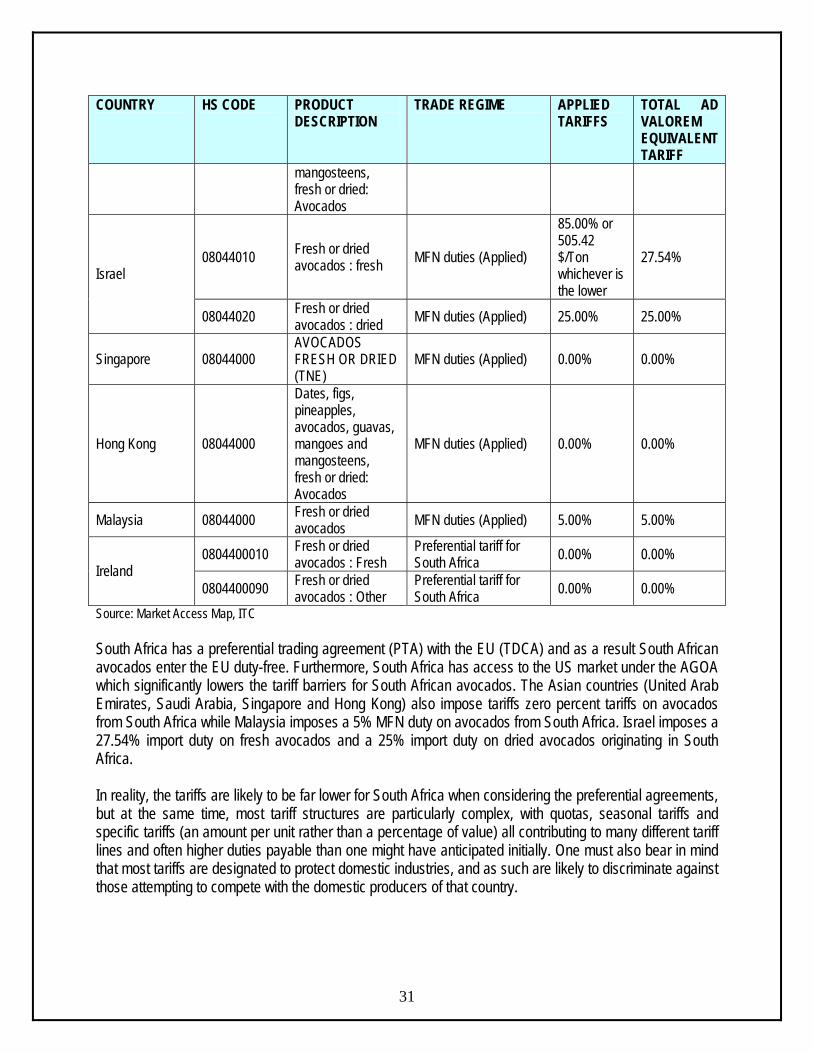
Source: Market Access Map, ITC South Africa has a preferential trading agreement (PTA) with the EU (TDCA) and as a result South African avocados enter the EU duty-free. Furthermore, South Africa has access to the US market under the AGOA which significantly lowers the tariff barriers for South African avocados. The Asian countries (United Arab Emirates, Saudi Arabia, Singapore and Hong Kong) also impose tariffs zero percent tariffs on avocados from South Africa while Malaysia imposes a 5% MFN duty on avocados from South Africa. Israel imposes a 27.54% import duty on fresh avocados and a 25% import duty on dried avocados originating in South Africa. In reality, the tariffs are likely to be far lower for South Africa when considering the preferential agreements, but at the same time, most tariff structures are particularly complex, with quotas, seasonal tariffs and specific tariffs (an amount per unit rather than a percentage of value) all contributing to many different tariff lines and often higher duties payable than one might have anticipated initially. One must also bear in mind that most tariffs are designated to protect domestic industries, and as such are likely to discriminate against those attempting to compete with the domestic producers of that country.
31
4.2 European Union (EU) The EU has a seasonal tariff structures which are highest during the European peak harvesting seasons (the price entry system), quotas and specific tariffs, and various policies that allow, amongst other things, government organizations to purchase produce should supply rise too quickly (and thereby maintain prices), and then release this excess back onto the market as and when supply drops again. The immediate implication of these policies for South Africa is that an opportunity exists to supply avocados to the European market in the off season periods, as the produce will not compete directly with the European producers and thus would not be liable to a whole array of tariffs and other protective mechanisms. There are other non-tariff barriers, including the phytosanitary and food health regulations laid down by the EU legislation, marketing standards and certificates of conformity, and the ever changing demand patterns of the EU consumers.
4.2.1 Tariff barriers The EU applies a system known as entry price system. With this system, the EU establishes an ‘entry price’ at which produce may enter the EU market, which is not only based on the market price for the current year (demand and supply) and for previous years, but also on the prices of the domestic producers (prices they need to maintain profitability). It is calculated by the regulatory authorities so that it can be used in combination with tariffs and quotas to aid EU’s attempts at protecting its agricultural system. The entry price is the minimum price at which produce may enter the market. If the price of the produce is lower than its calculated price, it is liable to have duties imposed upon it over and above any duties/quotas it might originally attract. Agricultural duties are applied as follows:
• When the value of the imported party is between 92% and 94% of the entry price, 8% of the entry price will be added to the normal customs duty.
• When the value of the imported party is between 94% and 96% of the entry price, 6% of the entry price will be added to the normal customs duty.
• When the value of the imported party is between 96% and 98% of the entry price, 4% of the entry price will be added to the normal customs duty.
• When the value of the imported party is between 98% and 100% of the entry price, 2% of the entry price will be added to the normal customs duty.
The entry price system applies to apples, pears and lemons year-round and to citrus fruit, table grapes, apricots, cherries, peaches, nectarines and plums during their peak seasons. There are tariffs applicable over and above the entry price tariffs, depending on the produce, where it originates from and whether that country has any preferential trading agreements with the EU.
4.2.2 Non tariff barriers Non tariff barriers can be divided into those that are mandatory and laid out in the EU Commission’s legislature and those that are a result of consumers, retailers, importers and other distributors’ preferences.
32
4.2.2.1 Legal requirements i) Product legislation: quality and marketing There are number of pieces of EU legislation that govern the quality of produce that may be imported, marketed and sold within the EU. They are as follows: General Food Law which covers matters in procedures of food safety and hygiene (micro-biological and chemical), including provisions on the traceability of food (for example, Hazard Analysis and Critical Control Points, or HACCP), and it is laid out under regulation EC 178/2002. EU Marketing Standards which govern the quality and labelling of fruit are laid out in the Common Agricultural Policy (CAP) framework under regulation EC 2200/96. These regulations include diameter, weight and class specifications, and any produce that does not comply with these standards will not be sold on the EU markets. Certificate of Conformity must be obtained by anyone wishing to export and sell fruits in the EU, if that fruit falls under the jurisdiction of the EU marketing standards. Certificate of Industrial Use must be obtained if the fruit is to be used in further processing. Maximum Residue Limits (MRL) of various pesticides allowed. ii) Product legislation: phytosanitary regulations The international standard for phytosanitary measures was set up by the International Plant Protection Committee (IPPC) to protect against spreading of diseases or insects through the importation of certain agricultural goods. The EU has its own particular rules formalized under EC 2002/89, which attempts to prevent contact of EU of crops with harmful organisms from elsewhere in the world. The crux of the directive is that it authorizes the Plant Protection Services to inspect a large number of fruit products upon arrival in the EU This inspection consist of physical examination of a consignment deemed to have a level of phytosanitary risk, identification of any harmful organisms and certification of the validity of any phytosanitary certificate covering the consignment. If the consignment does not comply with the requirements, it may not enter the EU although certain organisms can be fumigated at the expense of the exporter. iii) Product legislation: packaging The EU Commission lays down rules for materials that come into contact with food and which may endanger people’s health or bring about an unacceptable change in the composition of the foodstuffs. The framework legislation for this is EC 1935/2004. Recycling packaging materials are also emphasized under 94/62/EC, whereby member states are required to recycle between 50% and 65% of packaging waste. If exporters do not ship produce in packaging which is reusable, they may be liable for the costs incurred by the importing companies. Wood packaging is subject to phytosanitary controls and may need to undergo heat treatment, fumigation, etc.
33
4.2.2.2 Non-legal requirements: social and environmental accountability To access the market, importers must not only comply with legal requirements set out above, but must also with market requirements and demands. For the most part, these revolve around quality and the perception of European consumers about environmental, social, health and safety aspects of both the products and the production techniques. Whilst supplying fruit that complies with these issues may not be mandatory in the legal sense, they are becoming increasingly important in Europe and cannot be ignored by existing or potential exporters. i) Social accountability is becoming important in the industry, not only amongst consumers, but also for retail outlets and wholesalers. The Social Accountability 8000 (SA 8000) certification is a management system based on International Labour Organization (ILO) conventions, and deals with issues such as child labour, health and safety, and freedom of association, and requires an on-site audit to be performed annually. The certificate is seen as necessary tool for accessing any European market successfully. ii) Environmental issues are becoming increasingly important with European consumers. Consumer movements are lobbying against purchasing non-environmentally friendly or non-sustainable produce. To this end, both governments and private partners have created standards (such as ISO 14001 and EUREGAP) and labels to ensure that produce adhere to particular specifications. Although eco-labels (for example, the EU Eco-label, the Netherlands Milieukeur, the German Blue Angel and the Scandinavian White Swan) are voluntary, they can afford an exporter a marketing edge, as consumers wishing to purchase environmentally sound produce demand products that are easily recognizable. Another important emerging label is Fairtrade, and includes those labels offered by Max Haavelaar Foundation, TransFair International and the FLO (Fairtrade Labelling Organization). Recently a ‘universal’ logo was adopted based on international fair trade standards developed by FLO, which covers amongst other things, minimum quality and price, various processing requirements, compensation of small farmers that covers sustainable production and living standards, and contracts that allow for long term planning and development.
4.2.2.3 Consumer health and safety requirements Increasing consumer conscience about health and safety issues has prompted a number of safety initiatives in Europe, such as EUREPGAP on good agricultural practices (GAP) by the main European retailers, the international management system of HACCP, which is independently certified and required by legislation for European producers as well as food imported into Europe (EC 852/2004), and the ISO 9000 management standards system (for producers and working methods) which is certified by the International Standards Organization (ISO).
34
The development of public and private standards involves interventions at multiple points along the value chain. An illustration of the multiple points and multiple standards that are applied for fresh fruit and vegetables and for fish is shown in Figure 20. There are controls by different agents carried out in different ways at different points along the value chain in response to the requirements of private sector companies,
35
coalitions of private-sector standards setters and public agencies. Standards in agribusiness value chains operate, by definition, at multiple points. They are created, adopted, applied and verified by different actors (enterprises and institutions) at different points in the value chain.
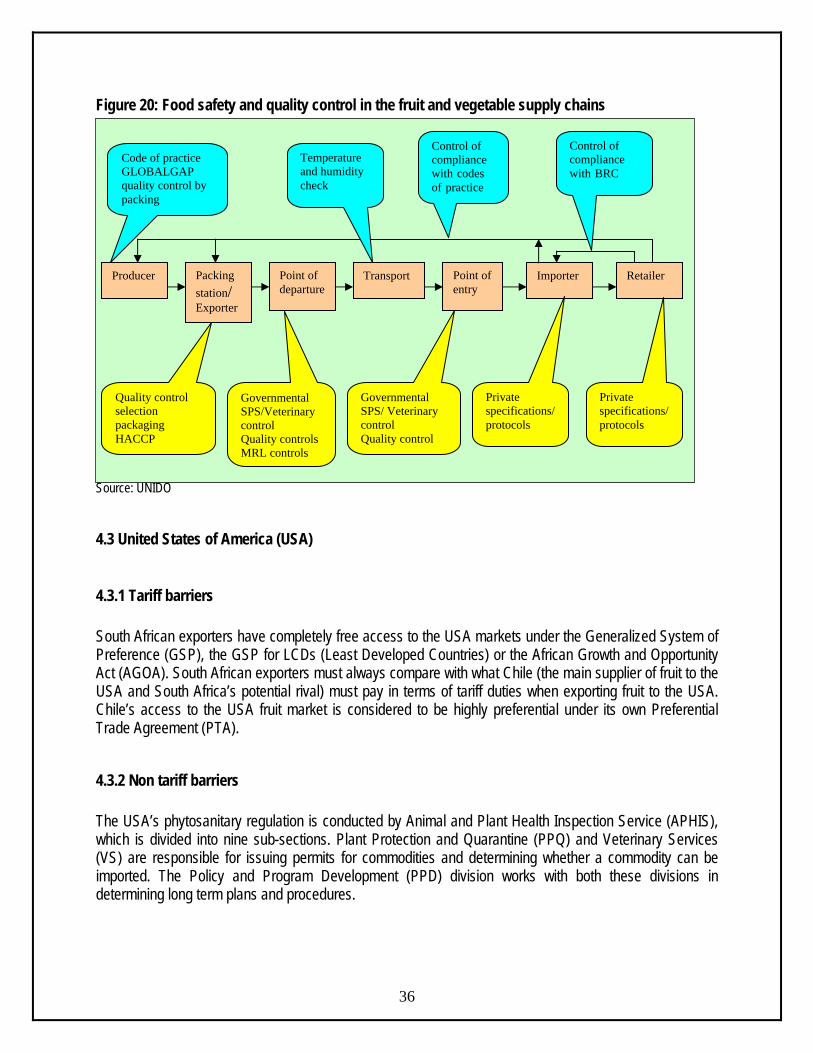
Figure 20: Food safety and quality control in the fruit and vegetable supply chains Source: UNIDO
4.3 United States of America (USA)
4.3.1 Tariff barriers South African exporters have completely free access to the USA markets under the Generalized System of Preference (GSP), the GSP for LCDs (Least Developed Countries) or the African Growth and Opportunity Act (AGOA). South African exporters must always compare with what Chile (the main supplier of fruit to the USA and South Africa’s potential rival) must pay in terms of tariff duties when exporting fruit to the USA. Chile’s access to the USA fruit market is considered to be highly preferential under its own Preferential Trade Agreement (PTA).
4.3.2 Non tariff barriers The USA’s phytosanitary regulation is conducted by Animal and Plant Health Inspection Service (APHIS), which is divided into nine sub-sections. Plant Protection and Quarantine (PPQ) and Veterinary Services (VS) are responsible for issuing permits for commodities and determining whether a commodity can be imported. The Policy and Program Development (PPD) division works with both these divisions in determining long term plans and procedures.
36
Producer Packing station/ Exporter
Point of departure
Transport Point of entry
Importer Retailer
Code of practice GLOBALGAP quality control by packing
Temperature and humidity check
Control of compliance with codes of practice
Control of compliance with BRC
Quality control selection packaging HACCP
Governmental SPS/Veterinary control Quality controls MRL controls
Governmental SPS/ Veterinary control Quality control
Private specifications/ protocols
Private specifications/protocols
Some products can get pre-clearance from International Services (IS) personnel stationed in the country of origin, either at exporting terminals of site inspections. The PPQ’s main focus is to prevent the spread of diseases and pests into the USA’s agriculture resources, and it has personnel stationed at all airports, seaports and border stations that check imported cargo and oversee the quarantine process. Exporters or importers must make a request to export/import a commodity, provide as much information as possible on the product, its region of origin and its status that is whether there are restrictions or regulations governing that particular product from that particular region before a permit is issued, along with the conditions of importation (disinfestations treatment) or mitigation measures. Denials can be challenged and governments and companies can request a change in the status of a prohibited commodity (an investigation must be performed by the PPQ scientific team), as long as sufficient conditions have changed or a risk assessment has not been conducted within the last 10 years. Most approved commodities can enter with inspection alone, but some may have to undergo mitigating measures including post-harvest treatments (hot/cold temperature treatments, irradiation or fumigation, depending on the requirements and which particular treatment is least harmful). The establishment of specifically and maintained pest-free areas in a country (which obviously requires extensive co-operation between the country’s plant health services and APHIS IS division) or systems approaches (field surveys, random inspections or various on site treatments. In addition to phytosanitary regulations, the USDA Food Safety Inspection Services (FSIS) regulates sanitary practices in the packing of food products, while the Food and Drug Administration (FDA), which is part of the US Department of Health, regulates packaging and labelling. The HACCP protocol is used extensively. The USDA quality standards for fruits and vegetables provide basis for domestic and international trade and aims to promote efficiency in marketing and procurement of fruits and vegetables.
4.4 Japan Japan’s agricultural sector is heavily protected, with calculations from the Organization for Economic Co-operation and Development (OECD) estimating that almost 60% of the value of Japan’s farm production comes from trade barriers or domestic subsidies. Japan uses tariff rate quotas (TRQ) to protect its most sensitive products, and reserves the right for trading many of these products (within the quota) for one or two state trading enterprises. However, these extremely protective measures apply only to some products; others are able to compete more effectively with outside competition, often on the grounds of higher quality. Perhaps the biggest barrier to trade with Japan in fruit markets is its strict phytosanitary requirements, which have often been challenged in the WTO as having little or no scientific justification. Other measures that are being challenged include Japan’s use of fumigation on agricultural products when cosmopolitan pests (already found in Japan) are detected. Japan is also increasing its labelling requirements. It now requires fresh food, including fruit, to be labelled with the place of origin, whilst new technological (‘smart’) labels that have embedded semi-conductors and information on just about everything are being adopted in various agricultural sectors.
37
Food containing genetically modified organisms (GMOs) need to be assessed for environmental food safety by the MAFF or the Ministry of Health, Labour and Welfare (MHLW). At the same time, the MHLW
tests food imports for maximum residue levels from pesticides and as of May 2006, any food with pesticides not on approved list, regardless of the residue levels, are not allowed entry. Japanese organic definitions changed in 2001 (they roughly corresponded to world standard definitions), and any foreign producers wishing to enter the Japanese market must be certified under the Japanese standards (not general world standards).
4.5 China China has a massive system of government support for farmers and generally rural dwellers (who are lagging behind urban dwellers). To this end, most of the agricultural sectors are protected and promoted through a series of subsidies, tax cuts and infrastructure spending policies (as well as low cost loans, research, land use protection, market stabilization measures, etc). Part of the protection of its massive farming population, which for most part consists of small farmers not benefiting from economies of scale, necessarily occurs in the form of high tariffs and other restrictions. However China is obliged to reduce tariff levels as a condition of being a member of WTO. It therefore remains to be seen just what policies will be adopted going forward, but the general consensus is that it is a vitally important market to watch, and endeavour to enter.
5. DISTRIBUTION CHANNELS There are roughly three distinct sales channels for exporting fruits. One can sell directly to an importer with or without the assistance of an agent (usually larger, more established commercial operations). One can supply a fruit combine, which will then contract out importers/marketers and try to take advantage of economies of scale and increased bargaining power. At the same time fruit combines might also supply large retail chains. One can also be a member of a private or cooperative export organization which will find agents or importers and market the produce collectively. Similar to a fruit combine, an export organization can either supply wholesale market or retail chains, depending on particular circumstances. Export organizations will wash, sort and package the produce. They will also market the goods under their own name or on behalf of the member, which includes taking care of labelling, bar-coding, etc. Most of the time, export organizations will enter into collective agreements with freight forwarders, negotiating better prices and services (more regular transport, lower peak season prices, etc). Some countries have institutions that handle all the produce (membership compulsory) and sell only to a restricted number of selected importers. Agents will establish contacts between producers/export organizations and buyers in the importing country, and will usually take between 2% and 3% commission. In contrast, an importer will buy and sell his/her own capacity, assuming the full risk (unless on consignment). They will also be responsible for clearing the produce through customs, packaging and assuring label/quality compliance and distribution of the produce. Their margins lie between 5% and 10%. The contract importers of fruit combines market and distribute the produce of the combines, clear it through customs and in some cases treat and package it.
38
Only few exporters have long term contracts with wholesale grocers who deliver directly to retail shops, but with the increasing importance of standards (EUREGAP, etc) and the year round availability of fruit, the planning of long term contractual relationship is expected to increase. Finally, a new medium of e-commerce is expected to have a significant impact on potential exporters or suppliers and their ability to supply directly to wholesalers or distributors in the target markets.
6. LOGISTICS
6.1 Mode of transport The transport of fruits falls into two categories namely ocean cargo and air cargo. Ocean cargo takes much longer to reach the desired location but costing considerably less. The choice of transportation method depends, for most parts on the fragility of the produce and how long it can remain relatively fresh. With the advent of technology and container improvements, the feasibility, cost and attractiveness of sea transport have improved considerably. With the increased exports by South Africa, the number and the regularity of maritime routes have increased. These economies of scale could benefit South Africa if more producers were to become exporters and take advantage of the various ports which have special capabilities in handling fruit produce (for example Durban’s new fruit terminal). The majority of avocados are exported by sea in refrigerated containers under controlled atmosphere (CA). 1-MCP treatment is used as an alternative to CA for fruit destined for markets where avocados are not ripened prior to retail. Fruit exported by sea is packed and cooled in the production regions. It is either loaded directly into refrigerated trucks at the pack house or into refrigerated containers for transport by road or rail to the port of exit. Avocados transported in refrigerated trucks are containerised in the port prior to shipping. The Cape Town port is the major export port for avocados and is located approximately 1 800 km from the production regions. The sea trip from Cape Town to Europe takes 12 to 14 days.
6.2 Cold chain management Cold chain management is crucial when handling perishable products, from the initial packing houses to the refrigerated container trucks that transport the produce to the shipping terminals, through to the storage facilities at these terminals, onto actual shipping vessels and containers, and finally on to the importers and distributors that must clear the produce and transport it to the markets/retail outlets. For every 10 Degree Celsius increase above the recommended temperature, the rate of respiration and ripening of produce can increase twice or even thrice. Related to this are increasing important traceability standards which require an efficient controlled supply chain and internationally accepted business standards. Because it takes about 25 days from packing to reach the European retailer, strict control of all links in the cold chain is important in order to maintain high standards of avocado quality.
6.3 Packaging
39
40
Packaging can also play an important role in ensuring safe and efficient transport of a product and conforming to handling requirements, uniformity, recyclable material specifications, phytosanitary requirements, proper storage needs and even attractiveness for marketing purposes. The business panel of any carton (including printed carton labels) should comply with the requirements as established by the EU or any other regulations that are specified by a target market. Producers are advised to present their designs to the Perishable Products Export Control Board (PPECB) before they can order any cartons from a manufacturer. The following is normally required:
• Class I or II • Fruit type • Carton depth • Country of Origin: “Produce of South Africa” • Complete address of exporter or producer • Name of variety • Content of carton: “14 x punnets or bags” • PUC or PHC code: Registered producer – or Pack House Code with DAFF • Date code • Food safety accreditation number: Global Gap, Nature’s Choice registration number, etc
7. ORGANIZATIONAL ANALYSIS
7.1 The South African Avocado Growers’ Association The South African Avocado Growers’ Association (SAAGA) has a voluntary membership that accounts for 85% of South African avocado exports. Activities of the association are funded by its grower members through levies on local and export sales. The aim of SAAGA is to improve the profitability and sustain the viability of growing avocados in South Africa. To this end, the association is involved in the following activities:
• Technical support and advisory services to its growers • Funding of appropriate technical and market research • Provision of relevant market information • Local and export market development through generic promotion • Liaison with government and other bodies both locally and abroad.
Although SAAGA is funded by growers other role players such as export companies, are also members.
7.2 Strength, Weakness, Opportunities and Threats (SWOT) analysis Some of the strengths, weaknesses, threats and opportunities of the avocado production sector in South Africa are the following:
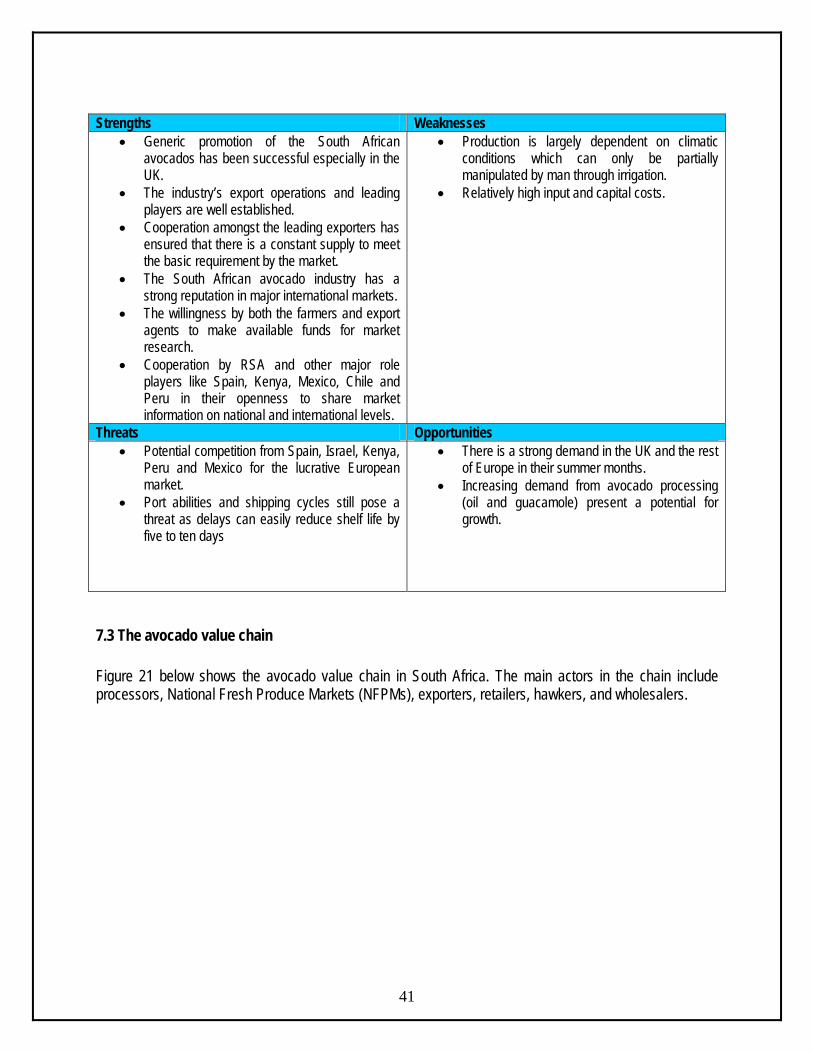
Strengths Weaknesses
• Generic promotion of the South African avocados has been successful especially in the UK.
• The industry’s export operations and leading players are well established.
• Cooperation amongst the leading exporters has ensured that there is a constant supply to meet the basic requirement by the market.
• The South African avocado industry has a strong reputation in major international markets.
• The willingness by both the farmers and export agents to make available funds for market research.
• Cooperation by RSA and other major role players like Spain, Kenya, Mexico, Chile and Peru in their openness to share market information on national and international levels.
• Production is largely dependent on climatic conditions which can only be partially manipulated by man through irrigation.
• Relatively high input and capital costs.
Threats Opportunities • Potential competition from Spain, Israel, Kenya,
Peru and Mexico for the lucrative European market.
• Port abilities and shipping cycles still pose a threat as delays can easily reduce shelf life by five to ten days
• There is a strong demand in the UK and the rest of Europe in their summer months.
• Increasing demand from avocado processing (oil and guacamole) present a potential for growth.
7.3 The avocado value chain Figure 21 below shows the avocado value chain in South Africa. The main actors in the chain include processors, National Fresh Produce Markets (NFPMs), exporters, retailers, hawkers, and wholesalers.
41
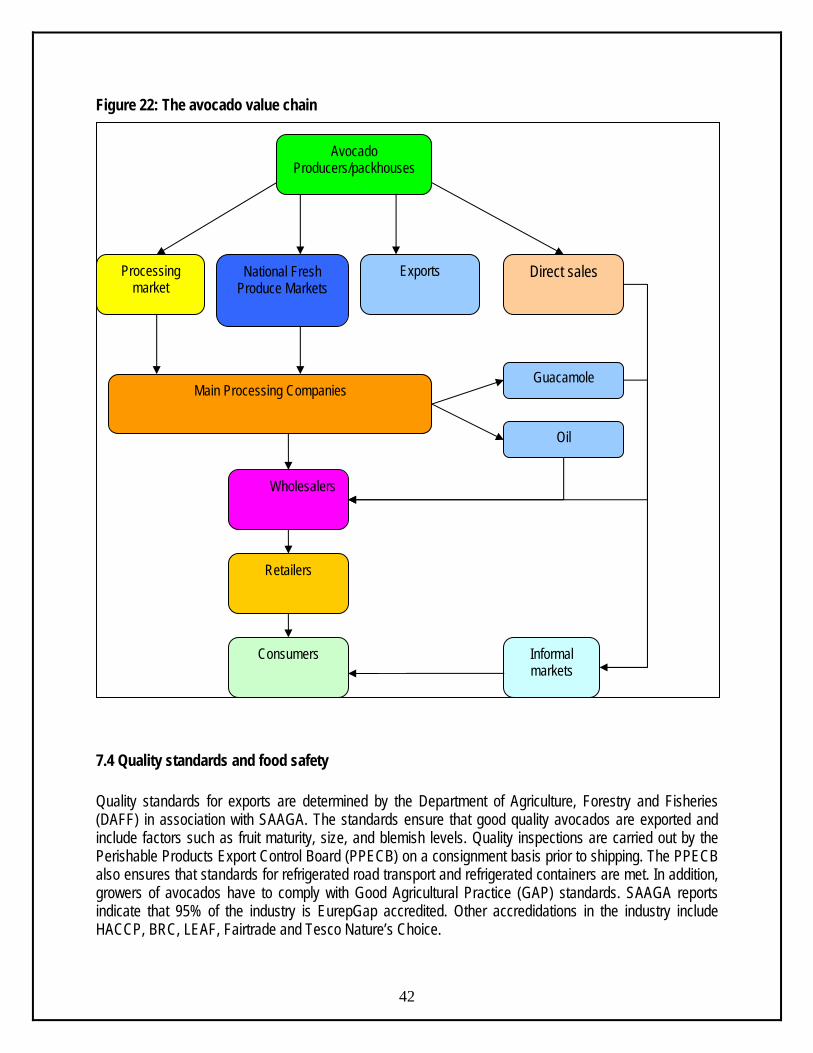
Figure 22: The avocado value chain
7.4 Quality standards and food safety Quality standards for exports are determined by the Department of Agriculture, Forestry and Fisheries (DAFF) in association with SAAGA. The standards ensure that good quality avocados are exported and include factors such as fruit maturity, size, and blemish levels. Quality inspections are carried out by the Perishable Products Export Control Board (PPECB) on a consignment basis prior to shipping. The PPECB also ensures that standards for refrigerated road transport and refrigerated containers are met. In addition, growers of avocados have to comply with Good Agricultural Practice (GAP) standards. SAAGA reports indicate that 95% of the industry is EurepGap accredited. Other accredidations in the industry include HACCP, BRC, LEAF, Fairtrade and Tesco Nature’s Choice.
42
Avocado Producers/packhouses
Processing market
National Fresh Produce Markets
Exports
Main Processing Companies
Wholesalers
Retailers
Consumers Informal markets
Direct sales
Guacamole
Oil
43
7.5 Producers and packhouses The core business of producers is to produce a high quality crop within “Good Agricultural Practice” protocols. Consistency, reliability of supply and producing varieties as demanded by the markets at affordable prices are also important facets of the producer’s responsibility and business activities.
7.6 Cold storage Cold storage operators are responsible for receiving, handling, cooling the avocados to the required temperature and for ensuring that the correct fruit is loaded out according to the exporter’s specifications into a truck or container that has been approved or registered by Perishable Produce Export Control Board (PPECB).
7.7 Exporters The core business of exporters is to market and sell the fruit of primary producers at the best market price that they are able to negotiate. In order to realize this, the exporter needs to communicate with many of the role players in the logistics chain (cold stores, transporters, shipping lines, port terminals, clearing and forwarding agents, PPECB, regional producers associations and special market inspectors, etc). It is the exporters’ responsibility to manage the cold chain, handle the fruit in an acceptable manner and, they are accountable for the quality of fruit that reaches the destination market. The main organisation that handles the export of fruits in South Africa is the Fresh Produce Exporters’ Forum (FPEF). The FPEF was registered in 1998 as a non-profit organisation and its membership is voluntary and open to all companies that export fresh fruit from South Africa. The FPEF’s mission is to create, within free market principles and a deregulated environment, a prosperous but disciplined fruit export sector. It was established mainly to provide leadership and services to its members and the international buying community. The forum sees itself as the international community’s gateway to providing South Africa’s finest quality produce from highly reputable South African exporters.
8. ACKNOWLEDGEMENTS 8.1 Acknowledgment is given to the following institutions: 8.1.1 South African Avocado Growers’ Association
Private Bag X866 Tzaneen 0850 Tel (015) 307 3676 Fax (015) 307 1564 www.avocado.co.za
8.1.2 National Agricultural Marketing Council (NAMC)
Private Bag X 935 Pretoria 0001 Tel (012) 341 1115 Fax (012) 341 1811 Web: www.namc.co.za
8.1.3 National Department of Agriculture, Forestry and Fisheries Directorate: Statistics and Economic Analysis Private X246 Pretoria 0001 Tel (012) 319 84 54 Fax (012) 319 8031
Web: www.daff.gov.za 8.1.4 Trade and Industrial Policy Strategies (TIPS)
P. O. Box 11214 Hatfield 0028 Tel (012) 431 7900 Fax (012) 431 7910
Web: www.tips.org.za 8.1.5 International Trade Centre (ITC) www.intracen.org 8.2 Avocado processors 8.2.1 Da Gama
Product: Oil
44
Tel (013) 7642181
45
Fax (013) 7642194 Cell (083) 294 0816
8.2.2 Del Avo Product: Oil Tel (083) 263 4899 Fax (083) 4572885 Email [email protected]
8.2.3 Spring Valley
Product: Puree Tel (011) 571 7800 Fax (011) 571 7834 Cell (082) 920 5271
8.2.4 U no me
Product: Oil Tel (015) 583 0043 Fax (015) 516 4668 Cell (082) 892 8806 Email [email protected]
8.2.5 West Falia
Product: Oil and Puree Tel (015) 305 3208 Fax (015) 305 3141 Cell (082) 491 7319 Email [email protected]
Disclaimer: This document and its contents have been compiled by the Department of Agriculture, Forestry and Fisheries for the purpose of detailing avocado industry. Anyone who uses this information does so at his/her own risk. The views expressed in this document are those of the Department of Agriculture, Forestry and Fisheries with regard to agricultural industry, unless otherwise stated. The Department of Agriculture, Forestry and Fisheries therefore, accepts no liability that can be incurred resulting from the use of this information.