Embed Size (px)
Citation preview

1
A PROFILE OF THE SOUTH AFRICAN OSTRICH MARKET VALUE CHAIN
2012
Directorate Marketing Private Bag X 15
Arcadia 0007
Tel: 012 319 8455/6 Fax: 012 319 8131
Email: [email protected]

2
TABLE OF CONTENTS 1. DESCRIPTION OF THE INDUSTRY 4
1.1. PRODUCTION AREAS 4
1.2. PRODUCTION TRENDS 5
1.3. LOCAL CONSUMPTION 6
1.4. EMPLOYMENT 7
2. MARKET STRUCTURE 7
2.1. DOMESTIC MARKET 7
2.2 IMPORT- EXPORT ANALYSIS OF OSTRICH 8
2.2.1 EXPORTS OF OSTRICH MEAT 8
2.2.2. SHARE ANALYSIS 16
2.2.3. IMPORTS OF OSTRICH MEAT 19
3. OSTRICH PRODUCTS VALUE CHAIN 21
4. ORGANISATIONAL ISSUES 23
4.1. THREATS AND CONCERNS 23
5. CHALLENGES FACING EMERGING FARMERS 23
6. MEAT QUALITY STANDARDS 24
7. BLACK ECONOMIC EMPOWERMENT PROJECTS 24
7.1. Western Cape 24
7.1.1. Klein Karoo Agri Business Centre (Klein Karoo Region) 24
7.1.2. SCOT: Southern Cape Ostrich Tanning 25
7.1.3. Mosstrich BEE Trust (Mossel bay) 25
7.2. Eastern Cape 25
7.2.1. Integrated Meat Processors of the Eastern Cape (IMPEC) 25
7.2.2. Middleton - Ostrich Development Project 25
7.3. Northern Cape 26
7.4. ALL OSTRICH PRODUCTION AREAS: COUNTRY-WIDE 26
7.5. OSTRI-BEE QUICK FACTS 26
8. MARKET INTELLIGENCE 26
8.1. EXPORT TARIFFS OF OSTRICH MEAT 26
8.2 IMPORT TARIFFS 27
9. PERFORMANCE OF SOUTH AFRICAN OSTRICH INDUSTRY IN 2011 29
9.1. Exports 29
9.2. Imports 35

3
10. ACKNOWLEDGEMENTS/REFERENCES 41

4
1. DESCRIPTION OF THE INDUSTRY
South Africa is the world leader in ostrich production with 75% of global market share. Ostrich is characterized by three product phases, i.e meat, leather and feathers and the current main source of income is meat and leather. The value of a slaughtered ostrich is broken down into 45% skin, 45% meat and 10% feather. This contrasts with Europe, where the breakdown is 75% meat and 25% skin, this is because of the popular healthy aspects that ostrich meat contains the lowest fat and cholesterol and rich in protein and iron. In South Africa Ostriches require dry climates, especially for breeding. Therefore Ostrich farming is more suitable in the western drier parts of the country or in winter rainfall regions. The industry dominates in the Western Cape in the Klein Karoo and Southern Cape regions. Oudsthoorn district in Western Cape is called the ostrich capital due to the number of ostriches slaughtered and the value added products from this area. The gross value of production of ostrich products is dependent on the quantity produced and the prices received by producers. The average gross value over of ostrich production amounted to R 161, 218, 409 over the past 10 years. The contribution of ostrich production to the gross value of agricultural production increased in 2002/03 due to an outbreak of BSE (mad cow disease) in Britain and the weaker South African rand, and declined in 2003/04 due to an outbreak of Avian Influenza (AI) during August 2004 in South Africa. It over-recovered in 2006/07 due to increasing prices but declined again in 2007/08 due to economic crisis and reached a peak in 2009/10. The drastic decrease experienced in 2010/11 was due to another outbreak of AI in April 2011. Figure 1 below show the gross value of ostrich production over the past 10 years.
Source: Statistics and Economic Analysis, DAFF
1.1. PRODUCTION AREAS
Ostriches are produced throughout South Africa except in Kwazulu–Natal. Approximately 77% of ostriches are found in the Western Cape. The balance 23% is found in the Eastern Cape, Free State, Gauteng, Limpopo, Mpumalanga, North-West and Northern Cape. Oudtshoorn in the Klein Karoo of the Western Cape is regarded as the ostrich capital of the world. Figure 1 below show the production areas of ostriches in South Africa.
0
50 000 000
100 000 000
150 000 000
200 000 000
250 000 000
300 000 000
350 000 000
Ra
nd
s
Years
Figure 1: Gross value of ostrich meat

5
Source: Statistics and Economic Analysis, DAFF
Figure 2 above shows that Western Cape commands the greatest share of ostrich production accounting for 77% followed by Eastern Cape (17%) and the balance of 6% is shared by 6 provinces.
1.2. PRODUCTION TRENDS
Local ostrich activities have spread from the Klein Karoo region (which maintains its prominent role) into the Western Cape, as well as to the Free State, Gauteng, Limpopo, Mpumalanga, North-West and Northern Cape. South Africa has about 588 registered export farms of which 453 farms are in the Western Cape, 102 in the Eastern Cape and 33 farms in the rest of the country. There are 10 European Union approved export abattoirs, the 10 tanneries for exotic leather like crocodile, snake, game and ostrich, two are dedicated to ostrich. Most ostriches go to slaughter at 10 –14 months of age, produce about 27 kg of meat, 4.2 m2 of leather and 1 kg of feathers. Figure 3 below indicate slaughtering and production of ostrich meat.
Western Cape 77%
Eastern Cape 17%
Other Provinces 6%
Figure 2: Production areas of ostrich meat

6
Source: Statistics and Economic Analysis, DAFF
The number of ostriches slaughtered and production followed the same trend throughout the decade. They both started high in 2002/03 and decreased continuously to 2008/09 before increasing in 2009/10. Due to the outbreak of AI in 2011, which lead to the culling of 40 000 ostriches, the number of ostrich slaughtered decline and obviously affected production. There is a decrease of 31% for both production and slaughters during 2001/11 relative 2002/03 and when compared to 2009/10 which was the highest there is a decrease of 38% on production. The decrease experienced in 2007/08 was due to the economic crisis which lowered the demand of ostrich meat as it is classified as luxury goods.
1.3. LOCAL CONSUMPTION
Figure 4 below depicts local consumption of ostrich meat compared to the total production for each year to determine if the country is self–sufficient.
Source: Statistics and Economic Analysis and Quantec
0
50
100
150
200
250
300
350
0 1 000 2 000 3 000 4 000 5 000 6 000 7 000 8 000 9 000
10 000
No
. of
Ost
rich
es s
lau
ghte
red
('0
00
)
Tho
usa
nd
Kilo
gram
s
Years
Figure 3: Production and slaughters of ostriches
Production Slaughtering figures
0
1 000 000
2 000 000
3 000 000
4 000 000
5 000 000
6 000 000
7 000 000
8 000 000
9 000 000
10 000 000
Kilo
gra
ms
Years
Figure 4: Ostrich meat production and consumption
Production Consumption

7
There is a drastic increase of 72% of ostrich meat consumed and 33% decrease of ostrich produced during 2010/11 compared to 2002/03 but figure 4 indicates that there is still more ostrich meat produced than consumed in South Africa and this makes the industry to be export oriented. The drastic increase experienced on local consumption was due to the fact that ostrich producers decided to explore the local market because as the ban of ostrich meat to EU is still continuing. Local consumption comes in all sorts of forms, with wors (sausage) and biltong (dried and spiced meat) being among the favourites. Production of ostrich meat constituted 65% of income derived from an ostrich.
1.4. EMPLOYMENT
The industry creates approximately 20 000 direct jobs in South Africa’s rural areas.
2. MARKET STRUCTURE
2.1. DOMESTIC MARKET
Ostrich products were sold through the Klein Karoo Co-operative in “one channel marketing system” until November 1993. The farmers promoted this system to ensure protection and a satisfactory income since the industry was not governed by a Control Board. In November 1997 the “one channel marketing system” was replaced by a free market system. The prices are determined by forces of demand and supply. Since deregulation 9 new abattoirs were built, namely; Mosstrich, Grahamstown Ostrich Abattoir, Swartland Ostriches, Camdeboo Meat Processors Ltd, Exon, Marowe (Pty) Ltd, Philippe Genuine Ostrich Products and Camexo. Figure 5 below show the average ostrich meat prices by abattoirs.
Source: Statistics and Economic Analysis, DAFF
The producer price of ostrich meat have been moving at an increasing trend from 2002/03 to 2008/09 and started moving at a decreasing trend from 2009/10 to 2010/11. Domestic ostrich meat price decreased from R35/kg in 2009/10 to R32/Kg in 2010/12 but still experienced an increase of R6/kg in 2010/11 relative to 2002/03. A drastic decrease was experienced during
0.00
5.00
10.00
15.00
20.00
25.00
30.00
35.00
40.00
Ran
ds
/Kg
Years
Figure 5: Average producer price of ostrich meat

8
2010/11, this is due to the fact that domestic demand of ostrich meat is low and unfortunately domestic market turns out to be the target market for ostrich meat until the ban in lifted.
2.2 IMPORT- EXPORT ANALYSIS OF OSTRICH
Figure 6 below compares the quantities of imports and exports for ostrich from 2002 to 2011.
Source: Quantec EasyData
It is clearly indicated from figure 6 above that South Africa used to be the net exporter of ostrich since exports quantities are far higher than imports quantities although experienced a drastic decrease in 2011 due to the ban of ostrich meat in the EU market. The exports reached the peak in 2009 by 7.4 million Kg of ostrich; this was due to the increased production reaching 8.3 million kg of ostrich during the same period. There is an extreme decline of ostrich meat exports in 2011 of 70% relative 2002 and during the same periods ostrich meat imported increased by 155%.
2.2.1 EXPORTS OF OSTRICH MEAT
The ostrich industry is an important earner of foreign exchange through the export of ostrich meat, leather and feathers. Ostrich meat is exotic and seasonal and approximately 90% is exported. Ostrich meat and product exports contribute approximately R1.2 billion annually. Approximately R 700 million is from the ostrich meat alone. The emphasis in this chapter is on ostrich meat and most of the ostrich meat exported is fillet. The European Union is the largest consumer of South Africa's ostrich meat (98 %) is a major export destination. Ostrich meat is extremely popular in Europe due to its heath characteristics (low in cholesterol and fat). The balance (2%) is exported to the Far East, including Hong Kong. Figure 7 below show the export destinations of ostrich during 2011.
0
1 000
2 000
3 000
4 000
5 000
6 000
7 000
8 000
2002 2003 2004 2005 2006 2007 2008 2009 2010 2011
Tho
usa
nd
Kilo
gram
s
Years
Figure 6: Ostrich export and import quantities
Exports Imports

9
Source: Quantec EasyData
European Union (Belgium, Germany, United Kingdom & Netherlands) is the main ostrich importer commanding 96% of South African ostrich meat, followed by SADC (Zimbabwe and Zambia) by 2% each. Most of the ostrich meat exported to EU in 2011 was processed meat.
Source: Quantec EasyData
Figures 8 shows that, ostrich meat exports quantity and value followed the same trend during the periods 2002 to 2011, although export value has been below export quantity throughout the period under review. Exports started high in 2002 and continued at a decreasing trend until 2005 before changing to an increasing trend from 2006 to 2009. Drastic decrease experienced in 2005 and 2011 was due to the prevalence of the Avian Influenza and the resultant ban on ostrich imports into the European Union (EU). The second decrease was experienced in 2008 due to the world-wide recession which lowered the demand for ostrich meat and leather. During the same period the exports value were above the quantity which
Belgium 28%
Germany 40%
United Kingdom 2%
Mozambique 2%
Netherlands 26%
Zambia 2%
Figure 7: Ostrich meat destinations during 2011
0
100
200
300
400
500
600
0
1
2
3
4
5
6
7
8
2002 2003 2004 2005 2006 2007 2008 2009 2010 2011
Mill
ion
Ran
ds
Mill
ion
Kilo
gram
s
Years
Figure 8: Ostrich meat exports
Quantity Value

10
indicates that exports of ostrich were profitable. The peak was reached during 2009 due to an increased production during the same period.
Source: Quantec Easy data
European Union is the main importer of South African ostrich meat and countries competing for the greatest market share were Germany (2003 – 2004, 2006 – 2007 & 2009 -2011), Belgium (2002, 2005 & 2008) and Netherlands was the second greatest commander of South African ostrich meat during the past decade. . Germany dominated the market with an export share of 13 million kilograms followed by Belgium with 11 million kilograms then Netherlands by R8 million Kilograms.
Source: Quantec EasyData
Figure 10 indicate that from Asia, Hong Kong has been the greatest importer of ostrich meat from South Africa from 2002 to 2011 and it has been fluctuating at a deteriorating rate throughout the period under analysis. Its highest imports from South Africa were experienced during 2002 and the lowest was in 2005. Intermittent exports to United Arab Emirates were recorded during the periods 2004, 2006 to 2009 and 2011.
0
500 000
1 000 000
1 500 000
2 000 000
2 500 000
2002 2003 2004 2005 2006 2007 2008 2009 2010 2011
Kilo
gram
s
Years
Figure 9: Export quantities of ostrich meat to European Union
Belgium Germany Spain France United Kingdom Italy
0
100 000
200 000
300 000
400 000
500 000
600 000
2002 2003 2004 2005 2006 2007 2008 2009 2010 2011
Kilo
gram
s
Years
Figure 10: Export quantities of ostrich meat to Asia
United Arab Emirates Hong Kong Special Administrative Region of China

11
Source: Quantec EasyData
Generally Zimbabwe commanded the highest share of 421 419 Kilograms of South African ostrich meat during the period under review, followed by Mozambique (195 839 Kilograms then Democratic Republic of Congo by 163 425 kilograms. Values of ostrich meat exports from various provinces of South Africa are presented in Figure12:
Source: Quantec EasyData
It is clearly indicated on Figure 12 above that the highest exports of ostrich meat originate from Western Cape Province. This is due to the fact that approximately 90% of the industry’s primary production and ostrich product output emanates from it. The second largest exporter is Eastern Cape and the third largest exporter was Gauteng Province. Intermittent exports were recorded from the other six provinces. The drastic decrease of exports in 2005 and 2011 is due to the
0
50 000
100 000
150 000
200 000
250 000
300 000
2002 2003 2004 2005 2006 2007 2008 2009 2010 2011
Kilo
gram
s
Years
Figure 11: Export quantities of ostrich meat to SADC
Angola DRC Mauritius Malawi Mozambique Seychelles Tanzania Zambia Zimbabwe
2002 2003 2004 2005 2006 2007 2008 2009 2010 2011
Western Cape 266 458 203 770 145 049 59 849 214 254 297 422 410 179 378 605 423 281 103 351
Eastern Cape 45 291 37 965 26 800 17 507 43 539 79 000 64 321 43 566 14 098 21 093
Northern Cape 4 705 8 103 3 255 0 0 0 124 0 0 0
Free State 0 25 0 0 0 0 0 0 0 0
Kwazulu-Natal 30 41 25 3 8 17 282 91 9 93
North West 4 272 192 0 0 0 0 0 1 049 1 172 7
Gauteng 16 603 10 567 3 826 4 103 8 789 15 220 12 365 16 098 10 709 7 776
Mpumalanga 424 58 479 0 0 35 31 14 4 18
Limpopo 0 0 0 816 320 1 196 1 951 1 170 527 0
0
50 000
100 000
150 000
200 000
250 000
300 000
350 000
400 000
450 000
Tho
usa
nd
Ran
ds
Figure 12: Values of ostrich meat exported by Provinces

12
exports suspension of ostrich meat from South Africa due to AI outbreak and a decrease in 2008-09 was due to the world economic meltdown. The following figures (Figures 13 - 21) show the value of ostrich meat exports from the various district municipalities in the nine provinces of South Africa.
Source: Quantec EasyData
From the Western Cape Province, Eden district municipality was the main exporter of ostrich meat followed by City of Cape Town Metropolitan municipality. Cape Winelands and West Coast district municipalities were the smallest exporters of ostrich meat during the period under review.
Source: Quantec EasyData
Nelson Mandela district municipality dominated the export market of ostrich meat exported from Eastern Cape Province. It commanded the greatest share from 2003 to 2010. Cacadu district municipality commanded the greatest share of ostrich exports value in 2002 and 2011.
2002 2003 2004 2005 2006 2007 2008 2009 2010 2011
City of Cape Town 65 877 20 444 13 110 1 516 1 260 22 017 1 458 3 048 6 001 22
West Coast 118 0 274 6 326 5 473 7 199 7 618 5 723 3 185 1 249
Cape Winelands 0 0 0 0 0 0 2 0 0 0
Eden 200 462 183 326 131 665 52 007 207 521 268 205 401 101 369 835 414 096 102 080
0 50 000
100 000 150 000 200 000 250 000 300 000 350 000 400 000 450 000
Tho
usa
nd
Ran
ds
Figure 13: Values of ostrich meat exported by Western Cape Province
2002 2003 2004 2005 2006 2007 2008 2009 2010 2011
Cacadu 45 15 5 3 9 12 20 16 14 21
Nelson Mandela 1 23 22 14 34 67 44 28 0 0
0
10
20
30
40
50
60
70
Mill
ion
Ran
ds
Figure 14: Values of ostrich meat exported by Eastern Cape Province

13
Source: Quantec EasyData
Figure 15 above shows that Pixlely ka Seme district municipality was the only municipality exporting ostrich meat in the Northern Cape Province. It exported from 2002 to 2004 and diminished during the following years. Siyanda district municipality recorded a value of R 124 000 in 2009 only.
Source: Quantec EasyData
From Free State Province, Thabo Mofutsanyane district municipality exported the ostrich meat in 2003 worth R 24 780 and diminished thereafter.
2002 2003 2004 2005 2006 2007 2008 2009 2010 2011
Pixley ka Seme 4 705 8 103 3 255 0 0 0 0 0 0 0
Siyanda 0 0 0 0 0 0 124 0 0 0
0
1 000
2 000
3 000
4 000
5 000
6 000
7 000
8 000
9 000
Tho
usa
nd
Ran
ds
Figure 15: Values of ostrich meat exported by Northern Cape Province
2002 2003 2004 2005 2006 2007 2008 2009 2010 2011
Thabo Mofutsanyane 0 24 780 0 0 0 0 0 0 0 0
0
5000
10000
15000
20000
25000
30000
Ran
ds
Figure 16: Values of ostrich meat exported by Free State Province

14
Source: Quantec EasyData
The eThekwini district municipality from KwaZulu-Natal Province commanded the greatest share of ostrich meat value from 2002 to 2010 and diminished during 2011. Ugu and iLembe reported some exports during 2008 and 2011 respectively.
Source: Quantec EasyData
Figure 18 above indicate that from North West Province, Bojanala district municipality exported ostrich meat value from 2002 to 2003 and diminished thereafter. Bojanala and Bophirima district municipalities reported some exports during 2009 and 2010 only. Generally the exports from North West province is low due to the fact that North West Province is a summer rain region and the establishment of Ostrich farms in this province was triggered by the good price of ostrich meat and the weaker rand during the early 2000’s and currently all 30 registered ostrich farms are non functional.
2002 2003 2004 2005 2006 2007 2008 2009 2010 2011
Ugu 0 0 0 0 0 0 0 0 0 93 142
iLembe 0 0 0 0 0 0 274 297 0 0 0
eThekwini 30 003 41 374 25 278 3 297 7 769 17 029 7 721 91 208 8 652 0
0
50 000
100 000
150 000
200 000
250 000
300 000 R
and
s
Figure 17: Values of ostrich meat exported bu KwaZulu-Natal Province
2002 2003 2004 2005 2006 2007 2008 2009 2010 2011
Bojanala 4 272 192 0 0 0 0 0 0 0 0
Bophirima 0 0 0 0 0 0 0 264 1 002 0
Southern 0 0 0 0 0 0 0 785 170 7
0
1 000
2 000
3 000
4 000
5 000
Tho
usa
nd
Ran
ds
Figure 18: Values of ostrich meat exported by North West
Province

15
Source: Quantec EasyData
Figure 19 indicates that West Rand district municipality was the greatest commander of ostrich meat value during the period under review. West Rand district municipality commanded the greatest value during 2005 to 2006 and in 2008 to 2010; City of Johannesburg commanded the greatest values of ostrich meat value during the periods 2002 to 2003 and 2011 while Ekurhuleni district municipality commanded the highest value during 2007 only.
Source: Quantec EasyData
Intermittent exports were recorded from Gert Sibande, Nkangala and Ehlanzeni district municipalities. Gert Sibande district municipality reported the highest exports value during the periods 2002 to 2004, 2007 and 2009. The ostrich meat exports from this municipality diminished during the periods 2005 to 2006, 2008 and 2010 to 2011. Ehlanzeni district municipality was the second greatest exported from 2002 to 2003 and 2011. Nkangala was the least commander of ostrich meat exports value.
2002 2003 2004 2005 2006 2007 2008 2009 2010 2011
Sedibeng 0 0 0 0 0 0 139 200 0 0
West Rand 4 235 1 747 1 499 2 833 5 173 5 047 7 385 8 630 9 038 645
Ekurhuleni 3 140 367 715 47 1 732 8 805 945 2 149 457 1 319
City of Johannesburg 9 120 8 447 1 604 1 223 1 884 1 347 3 896 1 467 874 4 944
City of Tshwane 109 7 8 0 0 21 0 3 652 340 867
0 1 000 2 000 3 000 4 000 5 000 6 000 7 000 8 000 9 000
10 000
Tho
usa
nd
Ran
ds
Figure 19: Values of ostrich meat exported by Gauteng Province
2002 2003 2004 2005 2006 2007 2008 2009 2010 2011
Gert Sibande 392 165 40 078 478 898 0 0 35 104 0 14 263 0 0
Nkangala 0 0 0 0 0 0 30 722 0 3 604 0
Ehlanzeni 32 184 18 042 0 0 0 0 0 0 0 17 620
0
100 000
200 000
300 000
400 000
500 000
600 000
Ran
ds
Figure 20: Values of ostrich meat exported by Mpumalanga Province

16
Source: Quantec EasyData
From Limpopo province, Waterberg district municipality was the main exporter of ostrich meat during the periods 2005 to 2010. Vhembe and Capricorn district municipalities reported ostrich meat exports in 2007, 2009 and 2010. The highest exports value of R 1,950,861 were recorded in 2008 from Waterberg district municipality followed by R 338,467 in 2009 from Capricorn district municipality then R 525,994 in 2010 from Waterberg district municipality. There were no exports of ostrich meat from Limpopo province in 2011.
2.2.2. SHARE ANALYSIS
The shares of various provinces to the total value of South African exports of ostrich meat during the past ten years are presented in Table 1. Table 1: Share of provincial ostrich meat exports by South Africa (%).
Years Province 2002 2003 2004 2005 2006 2007 2008 2009 2010 2011
Western Cape 78.88 78.16 80.84 72.74 80.27 75.70 83.84 85.93 94.10 78.10
Eastern Cape 13.41 14.56 14.94 21.28 16.31 20.11 13.15 9.89 3.13 15.94
Northern Cape 1.39 3.11 1.81 0 0 0 0.03 0 0 0
Free State 0 0.01 0 0 0 0 0 0 0 0
Kwazulu-Natal 0.01 0.02 0.01 0 0 0 0.06 0.02 0 0.07
North West 1.26 0.07 0 0 0 0 0 0.24 0.26 0
Gauteng 4.92 4.05 2.13 4.99 3.29 3.87 2.53 3.65 2.38 5.88
Mpumalanga 0.13 0.02 0.27 0 0 0.01 0.01 0 0 0.01
Limpopo 0 0 0 0.99 0.12 0.30 0.40 0.27 0.12 0
Total 100 100 100 100 100 100 100 100 100 100
Source: Calculated from Quantec EasyData
Table 1 indicates that Western Cape Province commanded the highest share of ostrich meat exported by South Africa followed by Eastern Cape. This is mainly due to the fact that the industry’s primary production emanates from these areas. Gauteng Province also shows regular exports throughout the period under analysis. Other six Provinces reported intermittent exports from the year 2002 to 2011.
2002 2003 2004 2005 2006 2007 2008 2009 2010 2011
Vhembe 0 0 0 0 0 66 866 0 0 132 0
Capricorn 0 0 0 0 0 0 0 831 136 654 0
Waterberg 0 0 0 816 142 319 730 1 129 16 1 950 86 338 467 525 994 0
0
500 000
1 000 000
1 500 000
2 000 000
2 500 000 Th
ou
san
d R
and
s
Figure 21: Values of ostrich meat exported by Limpopo Province

17
The accompanying Tables 2 to 10 show a share of the various district municipalities’ ostrich meat exports. Table 2: Share of district ostrich meat exports to the total Western Cape provincial ostrich meat exports (%). Years District 2002 2003 2004 2005 2006 2007 2008 2009 2010 2011
City of Cape Town 24.72 10.03 9.04 2.53 0.59 7.40 0.36 0.80 1.42 0.02
West Coast 0.04 0.00 0.19 10.57 2.55 2.42 1.86 1.51 0.75 1.21
Cape Winelands 0.00 0.00 0.00 0.00 0.00 0.00 0.00 0.00 0.00 0.00
Eden 75.23 89.97 90.77 86.90 96.86 90.18 97.79 97.68 97.83 98.77
Total 100 100 100 100 100 100 100 100 100 100 Source: Calculated from Quantec EasyData
Table 2 clearly indicates that Eden district municipality is the main exporter of ostrich meat from the Western Cape Province. This is because the main production within the Province originates from Eden district municipality. City of Cape Town metropolitan municipality also recorded regular exports of Ostrich meat. Irregular exports were recorded from West Coast and Cape Winelands district municipalities during the period under analysis. Table 3: Share of district beef exports to the total Eastern Cape provincial ostrich meat exports (%). Years District 2002 2003 2004 2005 2006 2007 2008 2009 2010 2011
Cacadu 98.61 39.44 17.92 17.40 21.57 15.76 31.18 36.19 100 100
Nelson Mandela 1.39 60.56 82.08 82.60 78.43 84.24 68.82 63.81 0 0
Total 100 100 100 100 100 100 100 100 100 100 Source: Calculated from Quantec EasyData
Cacadu district municipality commanded the highest share of ostrich meat exports from the Eastern Cape Province, followed by Nelson Mandela metropolitan municipality which recorded exports from 2002 to 2009 and diminished during the last two years. Table 4: Share of district ostrich meat exports to the total Northern Cape provincial ostrich meat exports (%). Years District 2002 2003 2004 2005 2006 2007 2008 2009 2010 2011
Pixley ka Seme 100 100 100 0 0 0 0 0 0 0
Siyanda 0 0 0 0 0 0 100 0 0 0
Total 100 100 100 0 0 0 100 0 0 0 Source: Calculated from Quantec EasyData
Pixley ka Seme district municipality within the Northern Cape Province recorded 100 % of ostrich meat exports from 2002 to 2004 while Siyanda district municipality commanded 10% share in 2008.There were no ostrich meat exports from Northern Cape Province during the periods 2005 to 2007 and 2019 to 2011. Table 5: Share of district ostrich meat exports to the total Free State provincial ostrich meat exports (%). Years 2002 2003 2004 2005 2006 2007 2008 2009 2010 2011

18
District
Thabo Mofutsanyane 0 100 0 0 0 0 0 0 0 0 Source: Calculated from Quantec EasyData
Thabo Mofutsanyane district municipality commanded a 100% share of ostrich meat exports from Free State Province in 2003. There were no exports of Ostrich meat from Free State Province during the periods 2002 and from 2004 to 2011. Table 6: Share of district ostrich meat exports to the total Kwazulu-Natal provincial ostrich meat exports (%). Years District 2002 2003 2004 2005 2006 2007 2008 2009 2010 2011
Ugu 0 0 0 0 0 0 0 0 0 100
iLembe 0 0 0 0 0 0 97.26 0 0 0
eThekwini 100 100 100 100 100 100 2.74 100 100 0
Total 100 100 100 100 100 100 100 100 100 100 Source: Calculated from Quantec EasyData
From KwaZulu-Natal Province eThekwini district municipality commanded the greatest share of ostrich meat exports from 2002 to 2010 and diminished in 2011. Ugu district municipality commanded 100% share of ostrich meat exports in 2011 while iLembe district municipality commanded the greatest share in 2008. Table 7: Share of district ostrich meat exports to the total North West provincial ostrich meat exports (%). Years District 2002 2003 2004 2005 2006 2007 2008 2009 2010 2011
Bojanala 100 100 0 0 0 0 0 0 0 0
Bophirima 0 0 0 0 0 0 0 25.19 85.50 0
Southern 0 0 0 0 0 0 0 74.81 14.50 100
Total 100 100 0 0 0 0 0 100 100 100 Source: Calculated from Quantec EasyData
Table 7 shows that Bojanala district municipality within North West Province commanded 100% of ostrich meat exports from 2002 to 2003 and diminished until 2011. Southern and Bophirima shared the 100% share from 2009 to 2010. There were no exports of ostrich meat from North West Province during 2004 to 2008 due to the bankruptcy of the Ostrich farms in the Province. Table 8: Share of district ostrich meat exports to the total Gauteng provincial ostrich meat exports (%). Years District 2002 2003 2004 2005 2006 2007 2008 2009 2010 2011
Sedibeng 0 0 0 0 0 0 1.13 1.24 0 0
West Rand 25.51 16.53 39.18 69.06 58.85 33.16 59.73 53.61 84.40 8.30
Ekurhuleni 18.91 3.47 18.68 1.15 19.71 57.85 7.64 13.35 4.26 16.97
City of Johannesburg 54.93 79.94 41.92 29.80 21.44 8.85 31.51 9.11 8.16 63.58
City of Tshwane 0.66 0.06 0.21 0.00 0.00 0.14 0.00 22.69 3.18 11.15
Total 100 100 100 100 100 100 100 100 100 100 Source: Calculated from Quantec EasyData
City of Johannesburg metropolitan municipality commanded the greatest share of ostrich meat exports from Gauteng Province from 2002 to 2004 and again in 2011 followed by West Rand
19
district municipality which commanded the greatest share from 2005 to 2010 then Ekurhuleni district municipality. Sedibeng district municipality and City of Tshwane metropolitan municipality recorded irregular exports of ostrich meat during the past decade. Table 9: Share of district ostrich meat exports to the total Mpumalanga provincial ostrich meat exports (%). Years District 2002 2003 2004 2005 2006 2007 2008 2009 2010 2011
Gert Sibande 92.42 68.96 100 0 0 100 0 100 0 0
Nkangala 0 0 0 0 0 0 100 0 100 0
Ehlanzeni 7.58 31.04 0 0 0 0 0 0 0 100
Total 100 100 100 0 0 100 100 100 100 100 Source: Calculated from Quantec EasyData
Table 9 above shows that Mpumalanga province reported exports of ostrich meat during the periods 2002 to 2004, diminished from 2005 to 2007 and exported again from 2007 to 2011. Gert Sibande district municipality exported during the periods 2002 to 2004, 2007 and 2009. During those periods it commanded 100% share of ostrich meat exports in 204, 2007 and 2009. Nkangala district municipality recorded exports for two years only during the past decade and it the only district in Mpumalanga province exporting during 2008 and 2010. Ehlanzeni district municipality recorded exports of ostrich meat during the periods 2002 to 2003 and commanded 100% share in 2011. Table 10: Share of district ostrich meat exports to the total Limpopo provincial ostrich meat exports (%). Years District 2002 2003 2004 2005 2006 2007 2008 2009 2010 2011
Vhembe 0 0 0 0 0 5.59 0 0 0.03 0
Capricorn 0 0 0 0 0 0 0 71.06 0.12 0
Waterberg 0 0 0 100 100 94.41 100 28.94 99.85 0
Total 0 0 0 100 100 100 100 100 100 0 Source: Calculated from Quantec EasyData
Waterberg district municipality from Limpopo Province commanded 100% share of Ostrich meat exports during the periods 2005 to 2006 and again in 2008. Capricorn and Vhembe district municipalities recorded intermitted exports from 2007 to 2010. There were no exports recorded from Limpopo Province during the periods 2002 to 2004 and 2011.
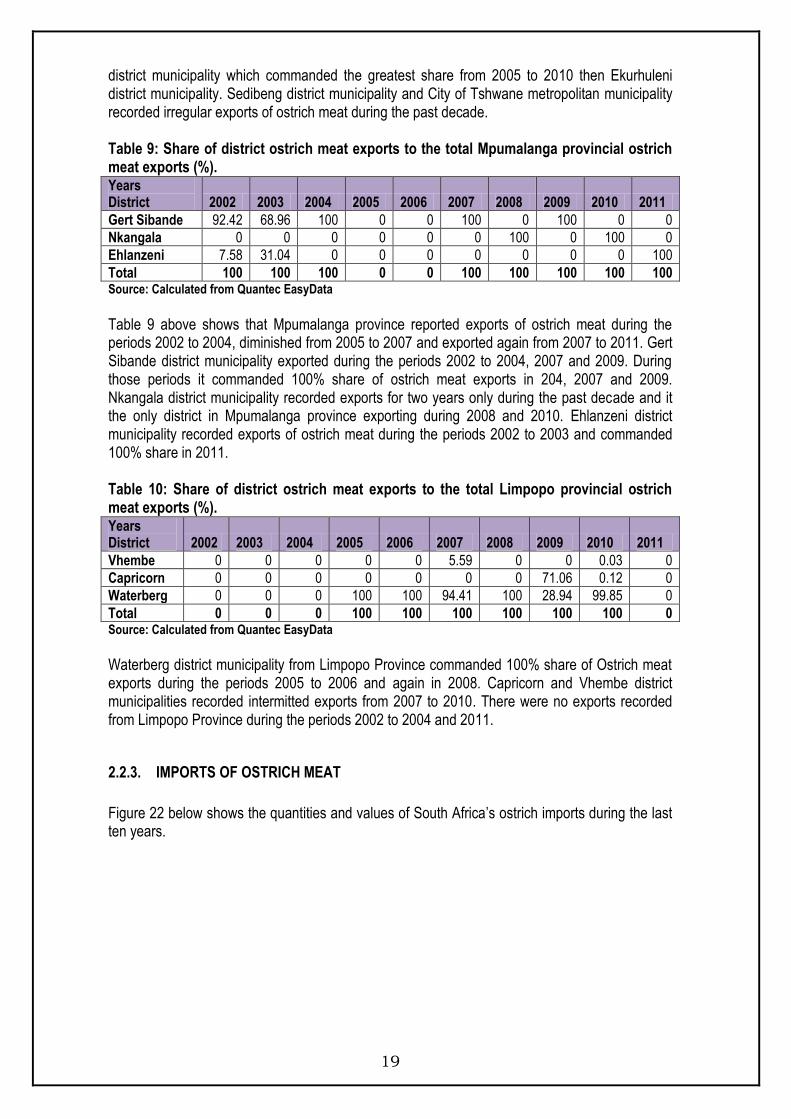
2.2.3. IMPORTS OF OSTRICH MEAT
Figure 22 below shows the quantities and values of South Africa’s ostrich imports during the last ten years.
20
Source: Quantec EasyData
Import quantities and value has been fluctuating throughout the period under review following the same trend. During the periods 2002 to 2005 imports were generally low which meant that South Africa was not a net importer of Ostrich meat when compared to its exports. During 2006 to 2011 imports were generally high. The increase in 2006 was a response for the lack of supply during 2005.
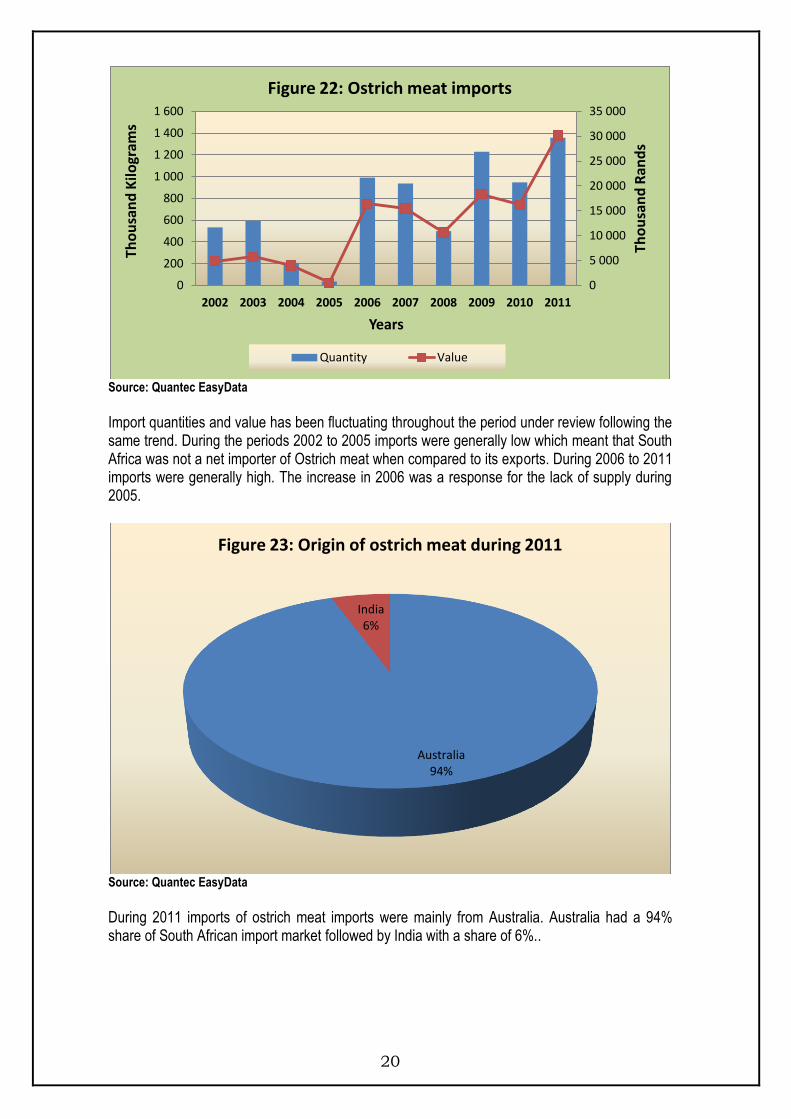
Source: Quantec EasyData
During 2011 imports of ostrich meat imports were mainly from Australia. Australia had a 94% share of South African import market followed by India with a share of 6%..
0
5 000
10 000
15 000
20 000
25 000
30 000
35 000
0
200
400
600
800
1 000
1 200
1 400
1 600
2002 2003 2004 2005 2006 2007 2008 2009 2010 2011
Tho
usa
nd
Ran
ds
Tho
usa
nd
Kilo
gram
s
Years
Figure 22: Ostrich meat imports
Quantity Value
Australia 94%
India 6%
Figure 23: Origin of ostrich meat during 2011

21
3. OSTRICH PRODUCTS VALUE CHAIN
Ostrich products (leather, meat, feathers and curios) are marketed locally and exported through a free market system. The main market for ostrich meat is restaurants, wholesalers, supermarkets and foodservice suppliers, the market for ostrich leather includes the clothing, fashion and upholstery industries and for feathers the household, fashion and carnival markets. South Africa has a large number of independent role–players in its ostrich industry. Fierce competition prevails amongst them in order to market their products. Due to the fact that ostrich products are regarded as niche products, the industry as a whole and the different role-players individually has an approach to protect the industry in different ways. This inter alia led to an “each for himself”- approach. Unfortunately it also resulted that there is no coordinated approach to work together or to provide important functions for the benefit of the whole industry, e.g. functions relating to product development, generic marketing, research, etc. On the international market each processor sells its ostrich products independently of other processors. This led to the undercutting of prices in order to sell larger volumes. It has also a negative effect on monitoring of quality standards, which led to reduction of optimum income levels realized for ostrich products. Since deregulation 9 new abattoirs were built. Approximately 70% of ostrich products are in the hands of a few players namely Klein Karoo International (Pty) Ltd, Mosstrich, Grahamstown Ostrich Abattoir, Swartland Ostriches, Camdeboo Meat Processors Ltd, Exon, Marowe (Pty) Ltd, Philippe Genuine Ostrich Products and Camexo. The ostrich products value chain is represented in Figure 24.

Figure 24: OSTRICH PRODUCTS VALUE CHAIN
Primary Producers – Farmers (588 registered farms) R 2.1 billion per annum: Exports (meat, leather, feathers)
16 000 workers 10 abattoirs, 10 tanneries- 2 dedicated to ostrich
Abattoirs
Butcheries/ Retail Outlets / Restaurants
Infertile Eggs
(Baking industry)
Hides & skins
Feathers
Tanneries (2)
(Leather)
Meat
Infertile Eggs (Arts
and crafts)
EXPORTS
CONSUMERS
EU APPROVED 1. Klein Karoo International
1.1 Oudsthoorn 1.2 Swellendam
1.3 Graaf Reinet 2. Grahamstown Ostrich 3. Makwe/ Oryx.
4. Mosstrich (Mossel Bay).
5. Roelcor (Mamelsbury) Local Processor
s

23
4. ORGANISATIONAL ISSUES
The local ostrich industry is structured as follows: Producers belong to ostrich producer organisations according to provinces. These provincial organisations are members of the South African Ostrich Producers Organisation (SAOPO). The processors (ostrich abattoirs and ostrich leather tanneries) are represented in the National Ostrich Processors Organisation of South Africa (NOPSA). The South African Ostrich Business Chamber (SAOBC), representing both NOPSA and SAOPO, was established in 1998. The SAOBC is regarded as the umbrella body for the South African ostrich industry.
4.1. THREATS AND CONCERNS
A stronger Rand decreases the profit as 90% of ostrich meat and products are exported. Smaller margins and labour legislation as well as the Avian Influenza led to producers leaving the
industry. An increase in Environmental awareness is being experienced on veld utilization. Research and development in the industry was previously managed and financed by the Klein
Karoo Co-operative but since deregulation this function has to be funded by the industry in collaboration with the Department of Agriculture.
While South Africa is the world leader proper Government Veterinary Services are needed to ensure that South Africa maintains this position.
For new entrants into the industry new markets need to be explored as the existing markets are saturated.
There must be an adequate skilled staff to provide regulatory service at all times.
5. CHALLENGES FACING EMERGING FARMERS
Because ostrich farming does not lend itself towards subsistence farming, there are few emerging farmers in the industry. The learning curve for new farmers is steep, as they grapple with the intricacies of general farm management and the industry-specific pitfalls of ostrich farming. Some of the challenges faced by emerging farmers and new entrants are as follows:
Capital intensive farming, processing etc. High start-up and running costs. High Risk Industry - It takes 30 months before money can be obtained from the business. The
mortalities can be extremely high during chick raisings and chicks are born without immunity to diseases. Birds are sensitive to temperature changes. The information on diseases is difficult to access.
Inexperience. The absence of guaranteed markets. Lack of export expertise. Abattoirs and tanneries – Standards are high. Feed consumption: 2.5 kg per ostrich per day Consumer guarantees on animal welfare and food safety must be given because of the strict
requirements of the export market. The supply and quality must be consistent. The prices are market related and the profit is dictated by and large the rate of exchange. Quality cannot be compromised and must adhere to the same worldwide standards.

24
6. MEAT QUALITY STANDARDS
The export of ostrich meat is predominantly to Europe which requires that the industry must comply with the phyto-sanitary requirements of the EU. (Although Switzerland is not part of the EU, they are applying the same phyto-sanitary standards). The EU requirements are: Abattoirs and de-boning and packaging plants must be approved by the EU for the export of ostrich meat
to the EU. The State as the recognised competent authority must provide meat inspection services at abattoirs
approved for export of meat to the EU and must certify the meat prior to export. Residue testing of the meat must be done by the competent authority. Prior to slaughter, ostriches must placed in quarantine for at least 14 days. The quarantine camps must be
tick free, have no vegetation and must have a 3 metre cleaned area around the camp. Birds must be inspected and treated for tick infection when entering the quarantine camp. A record of the tick control measures must accompany the bird when presented for slaughter. The tick control is required to avoid the possible transmission of Congo fever.
No growth stimulants or hormonal treatment is allowed. Inoculation against Newcastle disease is compulsory. An abattoir is also closed for export to the EU if an
outbreak of Newcastle disease occurs within 10 kilometres of the abattoir. A bird that is presented for slaughter must be accompanied by a Newcastle inoculation certificate.
No sand, hay or other organic material are allowed on vehicles used for transporting birds to the abattoir and the vehicles must be disinfected before leaving the abattoir site.
The Avian Influenza (AI) status of the farm of origin must be indicated when birds are presented for slaughter. The incidence of AI in South Africa during 2007 has caused the closure of the EU for the import of ostrich meat from South Africa. The EU applies strict control measures in this regard.
All ostriches must have an identification tag that allows the meat to be traced to the farm of origin. Slaughter ostriches must originate from a registered farm and must have been on a registered farm for at least 3 months prior to slaughter. A farm must be registered for at least 6 months before birds can be presented for slaughter.
7. BLACK ECONOMIC EMPOWERMENT PROJECTS
7.1. Western Cape
7.1.1. Klein Karoo Agri Business Centre (Klein Karoo Region)
KLEIN KAROO International Ltd (KKI) is the sponsor of the Klein Karoo Agri Business Centre (KKABC). The aim of the KKABC is to advise new entrants on their business plans and to assist them with funding applications. 286 new jobs have already been created and the aim is to reach 440 new jobs. Some of the KKABC’s successful projects:
- A manufacturing unit for ostrich leather items sold at the Klein Karoo Ostrich Boutique in Oudtshoorn.
- At De Hoop (10 km outside Oudtshoorn) a group of previously disadvantaged rural women manufactures ostrich feather and ostrich egg shell products. They ship two containers with products to Germany every six months.

25
- The Klein Karoo Feather Sorting Project in Dysselsdorp provides jobs for 100 people and is run independently by its members. KLEIN KAROO International supplies the ostrich feathers, which are sorted and sold back to KKI.
- Various other projects are being established at the ten agricultural societies in the Klein Karoo region.
- Study grants are provided to ten students from previously disadvantaged communities. This enables them to enter their first year of degree studies at the Free State University.
7.1.2. SCOT: Southern Cape Ostrich Tanning - (Member of the Mosstrich Group, Mossel Bay)
SCOT has established joint ventures with Transnet and Eskom. SCOT provides ostrich leather product manufacturing training to unemployed women in the Mossel Bay area and sells the products via SCOT’s marketing channels. On occasion SCOT also donates leather for worthy developmental projects.
7.1.3. Mosstrich BEE Trust (Mossel bay)
Mosstrich is owned by 180 ostrich producers. The company has implemented a project whereby 6 000 preferential shares, representing 6.5% of the issued shares capital, were given to 250 employees. The employees share in the company profits and a total of R1 815 million was paid out to the employees in the form of dividends. The next step is to extend this programme to farm labourers working on some of the farms of the ostrich producers.
7.2. Eastern Cape
7.2.1. Integrated Meat Processors of the Eastern Cape (IMPEC)
Integrated Meat Processors of the Eastern Cape (IMPEC) is fully BEE-compliant. Facilitates the economic empowerment of previously disadvantaged individuals through this integrated project where beneficiaries are included in the entire value chain and proper business training is provided to ensure sustainability – with the individual ownership.
The Salem Project, which forms part of IMPEC, focuses on community development. It has trained more than 100 small-scale rural black farmers to raise 7 000 ostriches per annum for slaughter in Grahamstown.
7.2.2. Middleton - Ostrich Development Project
This project creates the opportunity for the upliftment of various previously disadvantaged role players and farm employees.

26
7.3. Northern Cape
7.3.1. Kuruman
The Kuruman Project is a Black-owned enterprise comprising 30 members who are involved in ostrich production.
The SAOBC’s ostrich production training booklet is used extensively by the members of this group.
7.4. ALL OSTRICH PRODUCTION AREAS: COUNTRY-WIDE
Donating ostrich chicks to workers. The producers then assist with raising the chicks and obtaining feed. After the ostriches have reached maturity (slaughter age), the producers buy the birds from their workers.
Mentorship programmes exist on numerous farms.
There are also ostrich producers who have founded co-operatives for the benefit of their workers who are now also shareholders.
7.5. OSTRI-BEE QUICK FACTS
BEE Expenditure: R12 Million per year.
BEE Active Farms: 600 in Eastern, Western, Northern and Southern Cape.
BEE Beneficiaries: 15 000 (Direct and indirect)
The SAOBC commissioned the publication of The Ostrich Farm – How to Get Started. This booklet is given free of charge to new small-scale ostrich farmers.
8. MARKET INTELLIGENCE
8.1. EXPORT TARIFFS OF OSTRICH MEAT
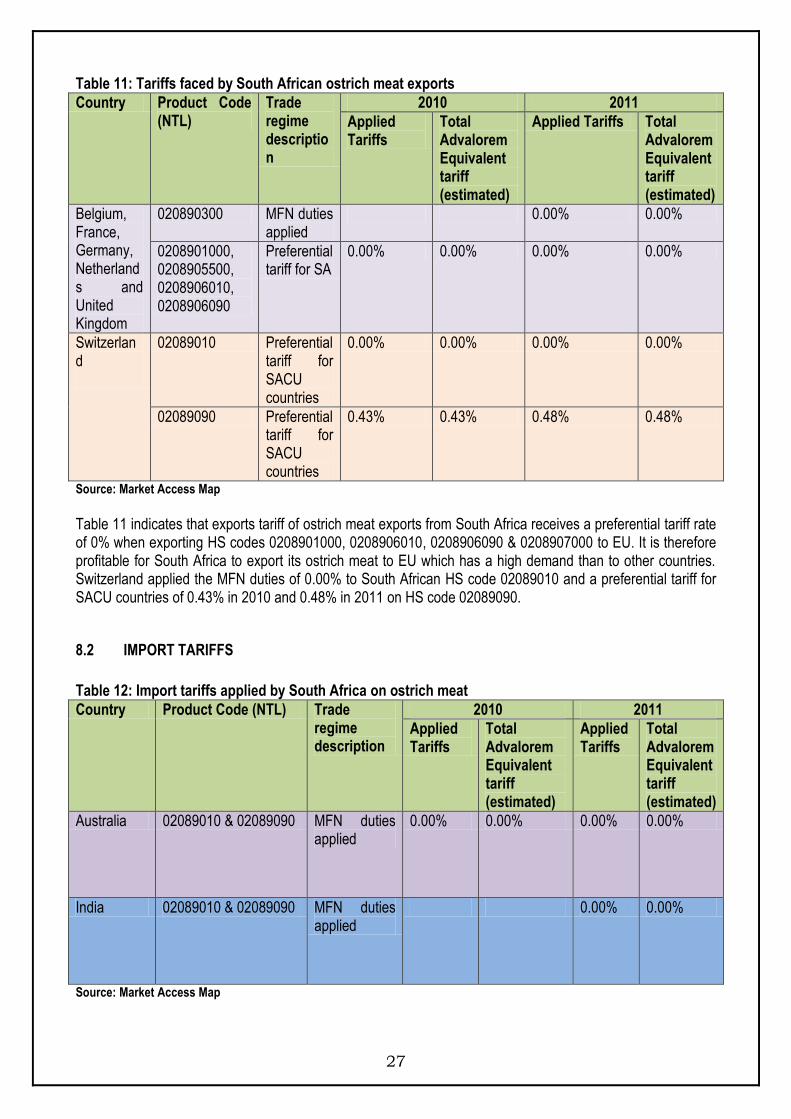
Table 11 show tariffs faced by ostrich meat originating from South Africa during 2010 and 2011.
27
Table 11: Tariffs faced by South African ostrich meat exports
Country Product Code (NTL)
Trade regime description
2010 2011
Applied Tariffs
Total Advalorem Equivalent tariff (estimated)
Applied Tariffs Total Advalorem Equivalent tariff (estimated)
Belgium, France, Germany, Netherlands and United Kingdom
020890300 MFN duties applied
0.00% 0.00%
0208901000, 0208905500, 0208906010, 0208906090
Preferential tariff for SA
0.00% 0.00% 0.00% 0.00%
Switzerland
02089010 Preferential tariff for SACU countries
0.00% 0.00% 0.00% 0.00%
02089090 Preferential tariff for SACU countries
0.43% 0.43% 0.48% 0.48%
Source: Market Access Map
Table 11 indicates that exports tariff of ostrich meat exports from South Africa receives a preferential tariff rate of 0% when exporting HS codes 0208901000, 0208906010, 0208906090 & 0208907000 to EU. It is therefore profitable for South Africa to export its ostrich meat to EU which has a high demand than to other countries. Switzerland applied the MFN duties of 0.00% to South African HS code 02089010 and a preferential tariff for SACU countries of 0.43% in 2010 and 0.48% in 2011 on HS code 02089090.
8.2 IMPORT TARIFFS
Table 12: Import tariffs applied by South Africa on ostrich meat
Country Product Code (NTL) Trade regime description
2010 2011
Applied Tariffs
Total Advalorem Equivalent tariff (estimated)
Applied Tariffs
Total Advalorem Equivalent tariff (estimated)
Australia 02089010 & 02089090 MFN duties applied
0.00% 0.00% 0.00% 0.00%
India 02089010 & 02089090 MFN duties applied
0.00% 0.00%
Source: Market Access Map

28
Table 12 clearly indicates that South Africa is charging 0% tariff rate to Australia which is the only supplier for South African ostrich meat. South Africa is also applying 0% rate to ostrich meat originating from India. India was the second supplier of ostrich meat to South Africa.

29
9. PERFORMANCE OF SOUTH AFRICAN OSTRICH INDUSTRY IN 2011
9.1. Exports
Table 13: List of importing markets for ostrich meat (fresh, chilled or frozen) exported by South Africa in 2011
Importers
Trade Indicators
Tariff (estimated) faced by South
Africa (%)
Exported value 2011 (USD thousand)
Trade balance 2011 (USD thousand)
Share in South Africa's
exports (%)
Exported quantity
2011
Quantity unit
Unit value (USD/unit)
Exported growth in value between
2007-2011 (%, p.a.)
Exported growth in quantity
between 2007-2011 (%, p.a.)
Exported growth in value between
2010-2011 (%, p.a.)
Ranking of partner countries in world imports
Share of partner countries in world
imports (%)
Total import growth in value of partner countries
between 2007-2011 (%, p.a.)
World 17938 13787 100 1738 Tons 10321 -20 -21 -71
100 -1
Germany 5691 5691 31.7 468 Tons 12160 -18 -23 -70 1 23.2 -2 0
Belgium 3273 3273 18.2 326 Tons 10040 -24 -23 -74 3 11.8 -4 0
Netherlands 2665 2665 14.9 306 Tons 8709 -28 -22 -70 4 10.2 4 0
Switzerland 2598 2598 14.5 239 Tons 10870 -9 -13 -74 5 8.6 -1 0.2
France 2372 2372 13.2 195 Tons 12164 -14 -17 -72 2 12.1 -2 0
United Kingdom 471 471 2.6 28 Tons 16821 9 -15 64 11 1.7 -9 0
Nigeria 435 435 2.4 48 Tons 9063 -1 -11 6114 45 0.1 0 20
Zambia 106 106 0.6 28 Tons 3786 11 63 279 64 0
0
Ghana 77 77 0.4 25 Tons 3080 14 124
75 0 -4 20
Mozambique 67 67 0.4 25 Tons 2680 41 11
78 0 41 0
Hong Kong, China 53 53 0.3 14 Tons 3786 -36 -34 -87 14 1 4 0
Viet Nam 47 47 0.3 14 Tons 3357
27 0.2 23 7.5
United Arab Emirates 44 44 0.2 12 Tons 3667 -41 -19
30 0.1 -11 3.8
Zimbabwe 13 13 0.1 7 Tons 1857 1 54 -76 95 0 1 40
Uganda 8 8 0 1 Tons 8000
-50
25
Democratic Republic of the Congo 7 7 0 1 Tons 7000 -34 -47 -91 52 0 51 20
Source: ITC calculations based on COMTRADE statistics.

30
In 2011, South Africa’s export represented 2.72% of world export for ostrich meat (fresh, chilled or frozen) and its ranking in world exports was 11. Table 13 shows that during 2011 South Africa exported a total of 1 738 tons of ostrich meat at an average value of US$ 10 321/unit and the total value exported in 201 is US$ 17 938. The major export destinations for ostrich meat originating from South Africa during 2011 were Germany, Belgium, Switzerland, Netherlands and France. Germany, Belgium and France are the leading markets for ostrich meat, accounting for 31.7%, 18.2%, 14.9%,14.5% and 13.2% respectively of South Africa’s export market. Together they constitute 92.5% of South African Ostrich meat export market. On average during the periods 2007 and 2011 South Africa’s exports for ostrich meat decreased by 20% in value and 21% in quantity. During the same period Germany experienced a decrease of 18% and 23% in value and quantity respectively per annum. All top importers of South African ostrich meat experienced a drastic decline due to the AI outbreak in South Africa. South Africa’s exports for ostrich meat to the world increased in value by 71% during the period 2010 to 2011 and Germany, Belgium, Netherlands, Switzerland and France decreased by 70%, 74%, 70%, 74% & 72% respectively in value during the same periods.

31
Figure 25: Growth in demand for ostrich meat exported by South Africa in 2011
Source: ITC Trademap

32
Figure 25 shows that between 2007 and 2011 South Africa’s ostrich meat exports to Hong Kong, Belgium, Netherlands, Democratic Republic of the Congo (DRC), Germany, France, Switzerland, United Arab Emirates, Nigeria, Zimbabwe, Mozambique and Congo were growing at a rate that is less than their imports from the rest of the world. During the same period, South Africa’s ostrich meat exports to Ghana and United Kingdom (UK) were growing at a rate that is greater than their imports from the rest of the world. Further analysis indicates that Ghana, UK, UAE, Belgium, Germany, France, Switzerland and Nigeria represent losses in declining market. The most growing import markets of ostrich meat are Zimbabwe and Mozambique annual import growth of 51% and 41% respectively.

33
Figure 26: Prospects for market diversification for ostrich meat exported by South Africa in 2011
Sources: ITC Trademap

34
Figure 26 shows that if South Africa wishes to diversify its ostrich meat exports, the biggest market exist in Germany which has a share of 23.2% of the world’s import market. Germany’s annual growth of imports decreased by 2% during 2011. This might be a challenge to South African to penetrate its market. Therefore, the most attractive market although small will be Saudi Arabia because its annual growth of imports has increased by 81% in 2011. South Africa might develop a new market in Saudi Arabia.

35
9.2. Imports
Table 14: List of exporting markets for the ostrich meat (fresh, chilled or frozen) exported by South Africa in 2011
Exporters
Trade Indicators
Tariff (estimated) applied by South
Africa (%)
Imported value 2011 (USD thousand)
Trade balance 2011 (USD thousand)
Share in South Africa's
imports (%)
Imported quantity
2011
Quantity unit
Unit value (USD/unit)
Imported growth in value between
2007-2011 (%, p.a.)
Imported growth in quantity
between 2007-2011 (%, p.a.)
Imported growth in value between
2010-2011 (%, p.a.)
Ranking of partner countries in world exports
Share of partner countries in world
exports (%)
Total export growth in value of partner countries
between 2007-2011 (%, p.a.)
World 4151 13787 100 1357 Tons 3059 20 15 87 100 -5
Australia 4095 -4095 98.7 1282 Tons 3194 21 14 85 9 3.4 -23 0
India 56 -56 1.3 75 Tons 747 55 0 -18 0
Austria 8 5 -7 0
Hungary 13 2.6 0
Indonesia 10 3.1 0
New Zealand 1 19.7 -9 0
Poland 6 5.5 -5 0
Spain 7 5.1 14 0
Belgium 3273 2 9.7 -4 0
Congo 2 0
Democratic Republic of the Congo 7 0
France 2372 5 6.4 -2 0
Germany 5691 4 8.7 -3 0
Ghana 77 0
Hong Kong, China 53 40 0.1 33 0
Malawi 2 0
Source: ITC calculations based on COMTRADE statistics.

36
In 2011, South Africa’s export represented 0.57% of world import for ostrich meat (fresh, chilled or frozen)) and its ranking in world exports was 18. Table 14 shows that during 2011 South Africa imported a total of 1 357 tons of ostrich meat at an average value of US$ 3 059/unit. The major origin for ostrich meat imported by South Africa during 2011 was Australia. South Africa exported a total of 4 095 tons (98.7 %) from Australia out of the world’s total of 4 151 tons. This makes Australia the greatest sharer of South African ostrich meat imports. South Africa’s imports of ostrich meat increased by 20% in value and increased by 15% in quantity between the periods 2007 and 2011. During the same period, imports of ostrich meat from Australia increased by 21% in value and 14% in quantity. Between the periods 2010 and 2011, South Africa’s imports for ostrich meat increased by 87% in value and Australia increased by 85% in value. This indicates that South Africa’s imports growth in value from the world is growing at a lower rate than Australia’s exports growth value to South Africa

37
Figure 27: Competitiveness of suppliers to South Africa for ostrich meat imports in 2011
Source: Trademap, ITC

38
Figure 27 above proves that Australia is the only competitive supplier of ostrich meat to South Africa. The annual growth of South Africa’s imports from Australia is 21%, its exports are declining at a rate of 23% and its world share of ostrich meat exports is 3.4%. It is also noted that during the period 2007 to 2011 Australia’s export growth to the world was less than South Africa’s import growth from Australia.

39
Figure 28: Prospects for diversification of suppliers for ostrich meat imported by South Africa in 2011
Source: Trademap, ITC

40
Figure 28 shows that if South Africa wishes to diversify its ostrich meat from its main supplier (Australia), New Zealand is the biggest world supplier, which can be considered. New Zealand’s world export share is 19.7% and it was disappointing that during 2011 its annual growth of exports declined by 9 A declining annual export growth will be restrictive to the new market like South Africa. Hong Kong, China is a small market (0.1% world share) but attractive to South Africa because its annual export growth is the highest by 33% during the period 2011. This makes these countries to be biggest possible prospective markets for South African ostrich meat imports.

41
10. ACKNOWLEDGEMENTS/REFERENCES
a. Statistics and Economic Analysis
www.daff.gov.za.
b. Buanewsonline www.buanews.co.za
c. CAMDEBOO MEAT PROCESSORS LTD (CAMEXO) P.O. Box 72 Graaf-Reinet 6280 Tel: 049 - 891 0622 www.camdeboomeatprocessors.co.za
d. EXOTAN (CAMEXO)
P.O. Box 2526 Port Elizabeth 6056 Tel: 041 - 402 8000 www.camexo.co.za
e. GRAHAMSTOWN OSTRICH ABATTOIR
Postnet Suite 100 Private Bag X1672 Grahamstown, 6140 Tel: 046 – 636 1315 Fax: 046 – 636 1316 www.goea.co.za
f. National Agricultural Marketing Council
www.namc.co.za g. KLEIN KAROO INTERNATIONAL – Leather, Meat, Feathers
P.O. Box 241 Oudtshoorn 6620 Tel: 044-203 5250/6205/5234 www.kleinkaroo.com
h. MOSSTRICH
P.O. Box 2629 Mossel Bay 6500 Tel: 044- 606 4400 Fax: 044-6097 7055 www.mosstrich.co.za
i. OASIS TANNING
P.O. Box 5577 Krugersdorp-West 1742 Tel: 011 – 416 2270 Fax: 011 – 416 2265
42
www.oasistanning.co.za j. South African Exporter
www.bdexporter.co.za k. South Africa info
www.SouthAfrica.info/doingbusiness.
l. South African Ostrich Business Chamber (SAOBC) Tel: 044 -272 3336 www.saobc.co.za
m. OSTRIMARK SA (PTY) LTD
P.O. Box 7074 Grahamstown, 6140 Tel: 046 – 603 5300 Fax: 046 – 603 5301 www.ostrimark.co.za/
Disclaimer: This document and its contents have been compiled by the Directorate: Marketing of the Department of Agriculture, Forestry and Fisheries for the purpose of detailing the ostrich industry. The views expressed in this document are those of the Department of Agriculture, Forestry and Fisheries with regard to agricultural industry, unless otherwise stated and, therefore the Department of Agriculture, Forestry and Fisheries does not accept responsibility for any errors in such information and anyone acting on such information does so entirely at his or her own risk.