Embed Size (px)
Citation preview

1
A PROFILE OF THE SOUTH AFRICAN POTATO MARKET VALUE CHAIN
2019
Directorate Marketing Tel: 012 319 8455 Private Bag X 15 Fax: 012 319 8131 Arcadia E-mail:[email protected] 0007 www.daff.gov.za

2
TABLE OF CONTENTS 1. DESCRIPTION OF THE INDUSTRY 3
1.1 Production areas 3
1.2 Total production 4
1.3 Potato production vs. consumption 5
2. MARKET STRUCTURE 6
2.1 Domestic market 6
2.2 Exports 7
2.3 Provincial and district export values of South African potatoes. 14
2.4 Share analysis 24
2.5 South Africa’s potato imports 31
2.5 Processing 34
3. MARKET INTELIGENCE 36
3.1 Competitiveness of South African potato exports 36
4. MARKET ACCESS 42
4.1 Tariff, quotas and the price entry system 42
5. DISTRIBUTION CHANNELS 48
6. LOGISTICS 48
6.1 Mode of transport 48
6.2 Cold chain management 49
6.3 Packaging 49
6.4 Quality control 49
7. TRANSFORMATION 49
8 BUSINESS OPPORTUNITIES AND CHALLENGES 50
8.1 Business opportunities 50
8.2 Challenges 50
9. SOUTH AFRICAN POTATO MARKET VALUE CHAIN 52
9.1 Informal sector 52
9.2 Formal sector 52
10. ACKNOWLEDGEMENTS 53

3
1. DESCRIPTION OF THE INDUSTRY
Potatoes are the most important vegetable crop in South Africa and the world’s recognized stable food consumed by many people. It is grown in more than 125 countries and consumed almost daily by more than a billion people. In 2018, potato industry contributed approximately 50% to the total gross value of vegetable production 9.7% of horticultural products and 2.6% of total agricultural products. Processing of potatoes has grown at a rapid rate over the past ten years, but it is still behind in size when compared to the potato processing industries in the developed countries. According to Potatoes South Africa, the processing industry represented 20% of the total potato crop. The rapid increase in potato processing can be attributed to consumer need for convenience ready to eat foods. The domestic processing sector uses potatoes primarily for, French fries, crisps, and frozen products. Potatoes are also fat and cholesterol free and high in fibre, Vitamin C and essential minerals like potassium, phosphorus and calcium. In most parts of the world, potatoes are a staple food since they are used in preparation of a diverse variety of meals from chips to mashed cuisine.
Source: Statistics and Economic Analysis, DAFF
Depicted in the Figure 1 above is the contribution of the potato industry to the gross value of agricultural production from 2009 to 2018. The lowest gross value of production was recorded in 2009, due to a record low production output recorded in the same season. The contribution increased steadily from 2008 and the increase in 2010 was 17% compared to the previous year. In 2011, potato industry contribution increased by 7%, in comparison to 2010 production year. During 2012, gross value of production grew by 4.7%, when compared to gross value of the previous years. This can be attributed to the 2.5% increase in production output and favourable producer prices in the same year. In 2013, potato gross value grew by 13.4% when compared to the previous year gross value and this can be directly attributed to 16.9% increase in producer price in the same year. During 2014, the gross value grew by 7% in comparison to the 2013 and this can be ascribed to increase in production output and favourable producer price. There was a slight increment of 4.9% in potato gross value during 2015, when compared to 2014 gross value. During 2016, potato gross value increased by 19% in comparison to the 2015 gross value, which can be attributed to favourable producer prices
0
1000000000
2000000000
3000000000
4000000000
5000000000
6000000000
7000000000
8000000000
9000000000
Val
ue
(Ran
d)
Years
Figure 1: Gross value of potato production

4
in the same year. As of 2017, potato gross value decreased by 11.9% relative to the previous year (2016) gross value, which can be ascribed to unfavourable producer price that occurred in the same season. In 2018, South Africa potato gross value grew by 9.6% relative to 2017 gross value and this can be attributed a slight increase of 0.7% increment in production output and favourable producer prices. 1.1 Production areas
Potatoes are produced from sixteen production regions, which are spread throughout South Africa. The main producing regions are situated in the Limpopo, Free State, Western Cape, Mpumalanga, KwaZulu Natal and Eastern Cape. In 2018, Limpopo province was still the leading in the number of hectares planted which accounts for 22% of hectares of the total national production (Potatoes SA). Eastern Free State in the second place with 11 562 hectares, Western Free State in third place with 7 372 hectares and Sandveld comes fourth with 5 498 hectares. Potatoes are planted at different times due to climatic differences in the production areas. This has resulted in fresh potatoes being available throughout the year. A total of 53 011 hectares were planted during the 2018 production year. This represents a 1.9% increment in area under production when compared to the 2017 production year. The crop is produced all year round both in dry land and under irrigation. There has been a major shift for the past two decades from dry land production to production under irrigation. Today, almost 75% of the area is planted under irrigation. Plantings in dry land thrive well in areas where there is reliable summer rainfall such as Eastern Free State, Mpumalanga and Eastern Cape. A successful potato production, which is to a large extend dependent on quality planting material obtained from seed producers. Globally, China is still the biggest potato producer, followed by India, Russian Federation, Ukraine, United States, Germany and Bangladesh are the top countries producing potatoes. According to FAO, a third of all potatoes are harvested in China and India. 1.2 Total production
According to Potatoes South Africa, in 2017 there were 532 commercial table potato farmers. This represents a 1.5% decrement in the number of producers compared to the previous production season. There are approximately 220 registered potato seed growers under the supervision and administration of potato certification services. From a production perspective, the input cost for potato production has been high and escalating international fuel and input prices. From a Marketing perspective, the strength of the South African currency negatively affected the export of potatoes, including to destinations in the Southern African Development Community (SADC) region. Total potato production from 2009 to 2018 is illustrated in figure 2 below. Figure 2 below shows that, in 2009, potato production volume was just above 1 862 600 tons. From 2010, production output increased steadily and the total production of 2 250 085 tons were produced during 2012. This represents a 2.5% increase in production output compared to the tons produced in 2011. During 2013, production volumes slightly dropped by 3% when compared to the previous year production output. There was a 2.9% increment in production output in comparison to the previous year. A record high production volume of 2 486 645 tons were produced during 2015 and the production output was 10.7% higher when compared to 2014 production output. During 2016, production volume dropped notably by 13.7% in comparison to 2015 production season and this can be ascribed to unfavourable climate conditions experienced in the same season. In 2017, potato production output notably grew by 16% relative to 2016 production output. As of 2018, South Africa’s potato production increased slightly 0.7% in comparison to 2017 production output.

5
Source: Statistics and Economic Analysis, DAFF 1.3 Potato production vs. consumption Figure 3 below depicts local consumption of potatoes compared to the production over the period of ten years. The figure indicates that the production of potatoes was fairly higher compared to fresh consumption. This indicates that South Africa is self-sufficient in terms of potato production and surplus potatoes are exported to other countries. South Africa’s average potato consumption was approximately 1 553 940 tons per annum.
Source: Statistics and Economic Analysis, DAFF
0
500000
1000000
1500000
2000000
2500000
3000000V
olu
me
(to
ns)
Years
Figure 2: Total potato production
0
500000
1000000
1500000
2000000
2500000
3000000
Vo
lum
e (t
on
s)
Years
Figure 3: Production vs Consumption
Production (Tons) Consumption (Tons)

6
2. MARKET STRUCTURE In South Africa potatoes are sold through different marketing channels such as national fresh produce market, informal trade (street hawkers), directly to retailers and processors for manufacturing of dry, frozen and fresh chips. Lastly, potatoes are also exported to other countries through export agents and marketing companies.
2.1 Domestic market Sales of potatoes at the National Fresh Produce Markets (NFPMs) have been declining over the years, but NFPMs remain an important channel for the sale of fresh potatoes in South Africa. In 2018, Johannesburg fresh produce market with 38% share is the biggest potato market, followed by Tshwane with 18%, Durban with 9% and Cape Town with 8% share. Johannesburg market share has decreased from 39% to 38%, while Tshwane and Durban market shares have remained the same at 18% and 9% respectively. According to Potatoes South Africa, 33% of potatoes were distributed through formal market, 31% through informal markets (hawkers), 20% were processed, 8% were seed and 8% was exported in 2017.
Source: Statistics and Economic Analysis, DAFF
As indicated in Figure 5 below, there have been fluctuations in the quantities of potatoes sold in the major fresh produce markets over the last ten years. The main reason for the lack of growth in potato sales has been the departure from the National Fresh Produce Markets (NFPMs) by the potato producers because they now sell directly to the potato chips companies, processors, wholesalers and retailers.
0 10 20 30 40 50
Johannesburg
Tshwane
Durban
Cape Town
Springs
Port Elizabeth
Pietermaritzburg
East London
Klerksdorp
Bloemfontein
Other
Percentage (%) of total share
Mar
kets
Figure 4: Potato market share by the major NFPMs

7
Potato prices in the NFPMs are primarily determined by market forces of supply and demand, which is the preferred way of marketing channel for potatoes. Product grading is a critical component of price determination in the market and as a result, potatoes are still officially graded at the NFPMs. The price received by the primary producers on the NFPMs is a basis for the determination of the price for direct purchases from the producers. As of 2010 to 2011, the supplied volume has increased steadily, which resulted in a steady drop in market prices during the same years. In 2012, there was a 5.5% increase in quantities of potatoes supplied to the NFPMs and at the same time the prevailing price in the NFPMs increased by 2%, which can be attributed to a strong potato uptake in the markets. During 2013, quantities of potatoes supplied to the NFPMs dropped by 2%, which resulted in the 27.6% increase in the market price. The other factor that influences the price in the NFPMs is the quality of produce. In 2014, there was a slight increase in volume supplied at the NFPMs and the price was favourable, as it has gone up by 1.5%, when compared to the 2013 season. Potato price has dropped by 17% during 2015, and this can be ascribed to 13.8% increase in the volume supplied at the market. During 2016, there was a 14.7% decrement in potato volume supplied at the fresh produce markets and this has resulted in a surge of 64% in potato prices in comparison to 2015 market price. There was a 16% increment in volumes supplied at the fresh produce markets in 2017 and as a result, the market price has notably dropped by 26.6% relative to 2016 price. As of 2018, market price increased by 7.3%, despite 3.4% increment in potato volume supplied at the national fresh produce markets and this can be attested to strong potato uptake during the same season.
Source: Statistics and Economic Analysis, DAFF
2.2 Exports Potatoes are probably the most suitable vegetables for the export market (easy to grade and pack an under correct conditions, their shelf life is much longer than most other vegetables). However, South Africa is not considered a major exporter of potatoes, primarily because it contributes 1.3% and it is ranked number 17 in the world potato exports. In 2018, South Africa position in the world potato export has slightly changed in terms of competitiveness and its was ranked number 15. During
R 0R 500R 1 000R 1 500R 2 000R 2 500R 3 000R 3 500R 4 000R 4 500R 5 000
0
200000
400000
600000
800000
1000000
1200000
1400000
Ran
d/t
on
Ton
s
Years
Figure 5: Sales of potatoes at major national fresh produce markets
Volume (Tons) Price (Rand/ton)

8
2018, Mozambique is still the leading recipient of South Africa potato exports with 37.5% share, followed by Namibia with 17.7%, Botswana share has increased to 17.4%, Lesotho has received 7.6% and Angola export share dropped to 5.4%. The bulkiness of potatoes, perishability and associated transport costs make the export of potatoes prohibitively expensive and for this reason, South Africa’s primary export markets are located within the Southern Africa (Mozambique, Namibia, Botswana, Angola, Eswatini and Lesotho). Table 1 show that, South Africa, potato exports to Mozambique has increased by 17% in value and 12% in quantity between 2014-2018 periods. South Africa export to Namibia has decreased by 5% in value and 3% in quantity between 2014-2018 periods. Potato export to Botswana grew by 6% in value and 2% in quantity whilst the export destined to Angola has dropped by 32% in value and 35% in quantity during 2014-2018 period. France, Germany, China, Netherlands, United States of America, Canada, Iran and Egypt are the top countries exporting potatoes. Egypt, with 6% share is the only African country, which is among the top ten potato exporters in the world. Table 1 and figure 6 illustrates South Africa’s potato export markets during 2018.
Importers
Value exported in 2018 (USD thousand)
Trade balance 2018 (USD thousand)
Share in South Africa's exports (%)
Quantity exported in 2018 (tons)
Growth in exported value between 2014-2018 (%, p.a.)
Growth in exported quantity between 2014-2018 (%, p.a.)
Growth in exported value between 2017-2018 (%, p.a.)
World 43066 43037 100 145673 1 1 -8
Mozambique 16134 16134 37.5 70161 17 12 -21
Namibia 7630 7610 17.7 19490 -5 -3 -11
Botswana 7499 7499 17.4 18537 6 2 38
Lesotho 3290 3290 7.6 10290 3 7 0
Angola 2329 2329 5.4 5736 -32 -35 -42
Eswatini 1941 1932 4.5 11414 2 4 15
Zambia 1212 1212 2.8 3372 5 3 -11
United Arab Emirates 686 686 1.6 1163 47 33 111
Area Nes 676 675 1.6 1595
Saudi Arabia 446 446 1 1115
Malawi 309 309 0.7 633 16 12 -29
Zimbabwe 304 304 0.7 779 84 112 -46
Congo 189 189 0.4 444 4 5 26 Source: ITC Trade Map
Figure 6 below illustrates South Africa’s potato export destinations during 2018. Southern African Development Community (SADC) and SACU countries such as, Namibia, Mozambique, Angola, Botswana, Lesotho and Eswatini still hold a bigger market share of South African potato exports according to figure 6 above. Together they constitute approximately 93% of South African potato exports. There should be attempting to expand other markets like the Middle East. That will enable the South African potato exports to grow. In 2018, South African potato exports that remained in the

9
ship stores and bunkers (This is the place where products without proper documents are held) was still 1.6% of potato exports, but the volume has notably increased.
Source: International Trade Centre (ITC)
Figure 7 below illustrates South Africa’s potato exports from 2009 to 2018.
Source: Quantec Easydata *Potato export data were adjusted from 2010 to reflect SACU export data.
0 5 10 15 20 25 30 35 40
MozambiqueNamibia
BotswanaLesothoAngola
EswatiniZambia
United Arab EmiratesArea Nes
Saudi ArabiaMalawi
ZimbabweCongoOthers
Co
un
trie
s
Figure 6: South Africa's potato export destinations in 2018
Share in South Africa's exports (%)
0
100000000
200000000
300000000
400000000
500000000
600000000
700000000
0
100000
200000
300000
400000
500000
600000
2009 2010 2011 2012 2013 2014 2015 2016 2017 2018
Val
ue
( R
and
)
Vo
lum
e (
ton
)
Figure 7: South Africa potato exports
Volume (tons) Value ( Rand)

10
As indicated on the figure 7 above, there have been fluctuations in the real value of potatoes exported. In 2009, South Africa’s potato export was just above 26 300 tons and it was a record low volume in a ten year period. The export volumes were incomparably higher in 2010, when compared with 2009 export and the high increase can be attributed to 11% increase in production volumes in the same year. During 2011, the export volume has drastically dropped by 54.7%, despite a 5% increase in domestic production. It was more profitable to export potatoes in 2005 and 2009, since higher values were recorded for volumes exported. During 2012, South Africa’s potato exports have surged by 122%, which can be attributed to 2.5% increase in domestic production output. In 2013, South Africa exported less volume of potatoes by 79.6% in comparison to the 2012 potato export, which can be ascribed to a 3% drop in the domestic potato output in the same year. During 2014, South Africa potato export has gone up by 28.6%, in comparison to 2013 exports. It was also more profitable to export potatoes in 2012 and 2014, when compared to the other years. The export volume has gone up by 12% in 2015, and this can be attested to 10.7% increase in the potato domestic output. During the same year, it was also less profitable to export potatoes when compared to 2014 export values. There was a 25% decrement in potato export during 2016 and this can be ascribed to 13.7% drop in domestic potato production output. At the same time, the value of potato export was 2.2% higher in comparison to 2015 export value. In 2017, potato export volume grew by 26% relative to 2016 export volume and this can be attested to 16% increase in domestic production output. As of 2018, South Africa potato exports dropped slightly by 1.3% relative to 2017 export volumes.
Source: International Trade Centre (ITC) According to Figure 8 above and Table 2 below, Southern African Development Community (SADC) countries such as, Zimbabwe and Namibia hold a bigger market share of South African potato seed exports. Together they constitute approximately 66.5% of South African potato seed exports. South Africa has also exported considerable share of seed potatoes to Botswana, Zambia, Mozambique and Angola. There should be attempting to expand other markets like the Middle East. That will enable the South African potato exports to grow. In 2018, there was a 1.1% share of South African potato seed exports that remained in the ship stores and bunkers (This is the place where products without proper documents are held).Table 2 shows that South Africa, potato seed exports to
0 10 20 30 40 50 60
Zimbabwe
Namibia
Botswana
Zambia
Mozambique
Angola
Eswatini
Area Nes
Lesotho
DRC
Uruguay
Co
un
trie
s
Figure 8: South Africa's seed export destinations in 2018
Share in South Africa's exports (%)

11
Zimbabwe has increased by 35% in value and 29% in quantity between 2014 -2018 period. South African potato seeds to Zambia have decreased by 31% in value and 44% in quantity between 2014 and 2018 period.
Importers
Value exported in 2018 (USD thousand)
Trade balance 2018 (USD thousand)
Share in South Africa's exports (%)
Quantity exported in 2018 (tons)
Growth in exported value between 2014-2018 (%, p.a.)
Growth in exported quantity between 2014-2018 (%, p.a.)
Growth in exported value between 2017-2018 (%, p.a.)
World 8318 8311 100 11876 1 -5 5
Zimbabwe 4487 4487 53.9 6341 35 29 11
Namibia 1049 1049 12.6 1762 0 2 20
Botswana 778 778 9.4 1017 -3 -11 75
Zambia 645 645 7.8 894 -23 -31 -44
Mozambique 485 485 5.8 832 -24 -25 13
Angola 421 421 5.1 480 -10 -14 -12
Eswatini 122 122 1.5 221 -4 -5 42
Area Nes 91 91 1.1 25
Lesotho 75 75 0.9 199 -18 -33 -41
DRC 68 68 0.8 90 -17 -18 -29 Source: International Trade Centre (ITC)
Figure 9 is an illustration of South Africa’s potato export to the various regions.
Source: Quantec Easydata
2009 2010 2011 2012 2013 2014 2015 2016 2017 2018
Africa 25800415 516989628 234124097 519891381 105084286 134376729 15482234 115739461 145887613 141440248
Americas 2060 0 66311 93700 33010 6000 475 0 0 35330
Asia 80380 5842 8498 16942 601322 1487715 30446 538998 706833 2560421
Europe 26000 28448 26000 36361 52670 0 163 18 106 1
Oceania 39000 13838 132000 33828 45220 11820 27 6645 3800 2100
Antarctica 260 43 0 0 0 0 0 35 0 0
Not allocated 396495 266348 1908 500242 140822 459354 7000 319577 964388 1601911
0
100000000
200000000
300000000
400000000
500000000
600000000
Vo
lum
e (K
g)
Years
Figure 9 :South Africa's potato exports to various regions

12
Figure 9 above shows that South Africa exported high quantities of potatoes to the African region followed by Europe and Oceania. South Africa also exported notable volumes of potatoes to Asia, and Americas regions. In 2010, there was a significant increase in exports to the African region, at the same time, there were no export to the Americas region. In 2009 and 2010, a substantial volume of South African potato exports were not allocated to any region and in 2011, the unallocated exports have dropped significantly. In 2011, considerable volumes of South African were exported to Oceania and Americas regions. During 2012, African region continued to be the preferred export market for potatoes originating from South Africa. African region continued to be the primary market for potato exports from South Africa in 2013. In the same year, the exports to the Asia and Europe has notably increased and the exports to the Americas has dropped by 64.7% in comparison to 2012 potato exports. During 2014, exports to Africa and Asia regions have notably increased and export to the Americas and Oceania have significantly dropped. In the same year, Europe and Antarctica regions have recorded zero trade for potatoes. In 2015, Africa region is still the leading recipient of potato exports from South Africa, followed by Asia. At the same time, a notable 7 000 kg was not allocated to any region, while exports to America, Europe and Oceania were trivial. During 2016, Africa region was still the primary export market for potato originating from South Africa, there was also a significant increase in potato export destined for Asia region and unallocated potatoes has surged in comparison to 2015 export volume. In 2017, Africa region has remained the main recipient of South Africa’s potato export, followed by Asia and the unallocated volume has notably increased. As of 2018, Africa region was still the main recipient of South Africa potato exports, however the export volume declined slightly by 3%, export to Europe region declined by 99%, Oceania export fell by 44% and potato exports destined for Asia region was incomparably higher when compared to 2017 exports. In the same year, unallocated exports have considerably increased by 66% relative to 2017 export volume.
Source: Quantec Easydata
2009 2010 2011 2012 2013 2014 2015 2016 2017 2018
Africa 74230790 319611985 295981080 323478031 372161918 490187624 483780864 612143211 616251740 538645810
Americas 25015 0 482877 263029 118840 11400 2800 0 0 239737
Asia 561750 60392 14074 177196 3251037 8101545 3713320 4454636 6034546 16955543
Europe 52000 140710 136937 237836 258572 0 0 310 8473 50
Oceania 102690 37808 326100 126440 80324 31120 169160 34872 9540 6818
Antarctica 4370 1063 0 0 0 0 0 227 0 0
Not allocated 2454384 1548869 5354 1489770 532535 1794403 1468450 1677824 3387732 8889247
0
100000000
200000000
300000000
400000000
500000000
600000000
700000000
Val
ue
(Ran
d)
Years
Figure 10: Value of potato exports to various regions

13
Figure 10 above shows the value of South Africa’s potato exports earned from the regions. African region has recorded high export value than the other regions as high quantities of potatoes were exported to this region during the period under review. In 2011, it was more profitable to export potatoes to the European region, followed by America region then African region. It was less profitable to export potatoes to the Asian region during 2011. During 2012, it was more profitable to export to Asia followed by Europe, while Americas and African regions were less profitable markets during the same year. In 2013, potato export has fetched higher value, followed by Europe and America regions. In the same year, potato exports to Oceania were less profitable. During 2014, it was more profitable to export potatoes to the Americas, followed by Oceania and Africa regions. Oceania was the least profitable export market. In 2015, it was relatively more profitable to export potatoes to Oceania region, followed by Asia and Africa region. During 2016, Asia was the most profitable market for potato originating from South Africa, followed by Africa and Oceania regions. At the same time, unallocated potato export has recorded a higher value in comparison to 2015 export value. In 2017, Asia region was still the most profitable market for potato exports originating from South Africa followed by Africa region. As of 2018, it was more profitable to export potatoes to Americas region, followed by Asia and Africa region whilst Oceania was the least profitable market. In the same season, the unallocated potato export has registered a higher value.
Source: Quantec Easydata
Figure 11 above, shows that in Africa region, SADC countries (Mozambique, Zimbabwe, Angola, Zambia, Congo and Democratic Republic of Congo) were the primary potato export market for South African potatoes in 2009. South Africa exported considerable quantities to West African countries), Eastern Africa and Middle Africa (Congo and Gabon). South Africa’s potato exports to Northern Africa were 2009 and were less significant. In 2010, exports to Africa region have been divided into SADC and SACU. From 2010 to 2013, SACU followed by SADC regions were the primary export markets for potato export originating from South Africa Considerable volumes were also exported to Middle
2009 2010 2011 2012 2013 2014 2015 2016 2017 2018
Eastern Africa 5670 5411 3202 9111 48538 928 32672 18650 0 8674
Middle Africa 339423 351652 753633 318869 306779 401736 688035 504408 32300 472143
Northern Africa 6300 0 0 0 7 0 0 0 0 0
Western Africa 220781 157931 235045 126398 364200 168435 252779 160022 10261758 283563
SADC 25228241 39603454 46019951 62963308 63763185 80488466 85108358 64742234 3160517 80970571
SACU 0 476871177 187112267 456473698 40601575 53317165 68418118 50314147 50314147 59705296
0
100000000
200000000
300000000
400000000
500000000
600000000
Vo
lum
e (K
g)
Years
Figure 11: South Africa's potato exports to Africa region

14
Africa and West Africa during 2011 while in 2012; the exports to these regions have dropped by half. Export to Eastern Africa (Kenya and Uganda) region has slightly increased during 2012. In 2013, SADC and SACU region continued to be the preferred potato export market. High percentages of exports were destined to Namibia and there was a notable volume of exports to Botswana, Lesotho and Swaziland. In the same year, potato exports to Western Africa (Ghana, Togo, Senegal, Cote devoir and Nigeria) has notably increased when compared to the previous year exports. During 2014, potatoes were mainly exported to SADC and SACU region. At the same time exports to Middle Africa has notably increased. SADC countries (Mozambique, Angola and Zambia) followed by SACU (Namibia, Botswana, Lesotho and Swaziland) countries were the main recipients of South Africa potato exports in 2015. Considerable volumes of potatoes were also exported to Middle African countries. During 2016, SADC (Mozambique and Angola) and SACU (Namibia, Botswana, Lesotho and Swaziland) countries were still the primary recipients of potato exports originating from South Africa. In the same year, notable volumes of potatoes were also exported to Middle Africa and West Africa. In 2017, SACU, SADC and West Africa countries were the primary export markets for South Africa’s potato exports. In the same time, there was a significant decrease in potato exports destined to Middle Africa relative to 2016 export volume. As of 2018, SADC (Mozambique, Angola and Zambia) and SACU (Namibia, Botswana, Lesotho and Eswatini) were still the main export market for South Africa. Notable volume was also exported to middle Africa and Western Africa. 2.3 Provincial and district export values of South African potatoes A review of provincial level trade data presents an interesting but somewhat misleading view of the source of potatoes destined for the export markets. Firstly, the fact that 58.41% of potatoes exported in 2018 were from the Gauteng province does not imply that the potatoes were produced there but that the registered exporters were based in the Gauteng. Secondly, provinces the Western Cape and KwaZulu Natal serves as exit points for potato exports through the Cape Town and Durban harbour respectively. Figure 12 below depicts the value of potato exports from each province of South Africa from 2009 to 2018. Highlights of the potato exports were that the provinces of the Western Cape, Gauteng and to a lesser extend KwaZulu Natal were consistently the top exporting provinces of South Africa over the last decade. In 2016 and 2017, Mpumalanga has contributed significantly to South Africa’s potato exports. During 2009, Gauteng and Western Cape provinces were mainly the preferred exit points for South Africa’s potato exports and KwaZulu Natal has contributed to a lesser extent. In 2010, a record high export value was recorded for Gauteng province. At the same time, Limpopo and Mpumalanga provinces have also recorded a significant increase in export values. Export values for Gauteng Limpopo and KwaZulu Natal have significantly increased during 2011, while the Western Cape export value has notably increased. In 2012, Eastern Cape and Free State have recorded export values after eight years of recording zero trade. During 2013, Western Cape and Gauteng provinces continued to be major role players in potato exports from South Africa and their export value has notably increased. In the same year, Northern Cape and North West and Free State exports have notable increased. This can be ascribed to increased potato exports to the neighbouring Namibia, Lesotho and Botswana. During 2014, all nine provinces have recorded export values, however Gauteng export value has slightly dropped when compared to the 2013 export value. In 2015, Gauteng province was still the leading exit point for South Africa’s potato exports and the export value has gone up by 11.4%, while the Western Cape export value has experienced a sharp decrement of 31%. In the same year,

15
Eastern Cape, Free State, KwaZulu Natal, North West, Mpumalanga and Limpopo provinces have substantially increased their potato export values in comparison to 2014 export values. During 2016, Gauteng province was still by far the primary exit point for potatoes exported from South Africa, followed by Western Cape. At the same time, Mpumalanga potato export value surged, which can be ascribed to a notable increase of potato exports destined to the neighbouring Mozambique. Limpopo, North West, Eastern Cape and Northern Cape potato export values have also notably increased. In 2017, Gauteng province was still the main role-player in South Africa’s potato exports, however the export value dropped by 10.8% relative to 2016 export value. At the same time, Mpumalanga export value has notably increased by 42%, Western Cape export value decreased by 9%, Eastern Cape export value has gone down by 27.5% and Limpopo export value has dropped by 24%. As of 2018, Gauteng was still by far the primary exit point for South Africa potato export, and the export value grew by 32%, Western Cape was the second exit point but the export value has declined by 24.8%. During the same season, North West potato export grew by 15%, which can be ascribed to 38% increment in export value of the neighbouring Botswana and there was notable decrement in Eastern Cape, Northern Cape, Mpumalanga and KwaZulu Natal.
Source: Quantec Easydata
The following figures (Figures 13 – 21) show the value of potato exports from the various districts in the nine provinces of South Africa.
2009 2010 2011 2012 2013 2014 2015 2016 2017 2018
Western Cape 45582395 21506362 40786255 79151297 9685309521663869414838664813425322312402328093170036
Eastern Cape 0 0 0 10383 9090 224690 287657 1005707 876881 540806
Northern Cape 0 0 0 0 135300 520016 21676 336573 243892 109453
Free State 0 0 0 7580513 9584540 27153673 33593458 28960272 27460437 26434618
KwaZulu-Natal 693595 1253580 321363 479818 563077 2026451 2427768 2359677 2251675 1185004
North West 0 635 0 0 508028 5159575 15157707 18283411 20014097 23026040
Gauteng 31107834285380834255792204231283595257269193228179907254207957280408939249918121329858635
Mpumalanga 0 6275452 7345 7256832 11446854 16387358 2138724712813403118231976265370681
Limpopo 47175 6984364 39255 9865 34046 3835738 13680540 24569248 18565486 25041932
0
50000000
100000000
150000000
200000000
250000000
300000000
350000000
Val
ue
(Ran
d)
Years
Figure 12: Value of potato exports by South African Provinces

16
Source: Quantec Easydata
From Figure 13 above, it is clear that potato exports from the Western Cape province were mainly from the City of Cape Town Metropolitan Municipality. West Coast, Cape Winelands and Eden municipalities contributed to a lesser extent. In 2010, there was a significant drop in export value recorded for the City of Cape Town. The use of the Cape Town harbour as an exit point may have played a major role in the metropolitan municipality being a leader in the export of potatoes from the Western Cape province. City of Cape Town, West Coast and Eden municipalities have recorded high export values during 2011, while the export value for Cape Winelands has notably dropped. In 2012, the City of Cape Town remained the leading municipality in potato exports and export values for West Coast, Cape Winelands and Eden has also increased significantly when compared to the previous year. During 2013, the City of Cape Town was by far still the leading municipality in terms of potato export from the Western Cape. In the same year, Cape Winelands and Overberg municipalities have notably increased their export values in comparison to 2012 export values. The highest export value for the leading municipality was recorded in 2014. West Coast and Eden export values have significantly gone up. City of Cape Town has continued to lead in Western Cape potato export during 2015. However, the export value has sharply dropped by 30% in comparison to 2014 export value. At the same time, Western Cape has also exported potatoes through West Coast, Cape Winelands and Eden, but the export values for these municipalities have experienced notable declines. In 2016, City of Cape Town was still the primary exit point for the Western Cape Province, however the export value has dropped by 5% in comparison to 2015 export value. In the same year, West Coast export value has notably decreased, whilst Eden has substantially increased its potato export value. During 2017, City of Cape Town potato export value has dropped by 14%, West Coast export value surged by 104% and Cape Winelands export value has notably increased by 44% relative to 2016. As of 2018, City of Cape Town was still by far the exist point of Western Cape potato export , however the export value declined by 22%, West Coast export value dropped by 50%, whereas Cape Winelands notably increased by 56% relative to 2017 export values.
2009 2010 2011 2012 2013 2014 2015 2016 2017 2018
City of Cape Town 44962883 111942516 98790878 108791122129966269179545617132099871121300572103803047 80625411
West Coast 0 9153930 10125724 12016347 11231650 16620778 13792532 8766874 17894209 8940488
Cape Winelands 273978 1669865 1966428 559735 6620859 5152275 1519326 1612243 2326023 3648473
Overberg 0 561000 842710 0 82280 99000 0 0 0 525
Eden 345534 2978 0 21205 15306 286950 36866 337379 0 0
020000000400000006000000080000000
100000000120000000140000000160000000180000000200000000
Val
ue
(Ran
d)
Years
Figure 13: Value of potato exports by Western Cape Province

17
Figure 14 below illustrates the potato exports from Gauteng province from 2009 to 2018.
Source: Quantec Easydata
In Gauteng province, there has been fluctuation on the potato export values for the past ten years (see Figure 14). The leading role players are City of Johannesburg, City of Tshwane and Ekurhuleni to a lesser extent. High export values were recorded in 2010 for the City of Johannesburg, Sedibeng, West Rand and City of Tshwane. In 2011, export values for the City of Tshwane has notably increased, whilst Ekurhuleni have notably dropped. During 2012, West Rand and City of Tshwane municipalities have recorded notable potato export values while at the same time export value for the City of Johannesburg had significantly dropped. In 2013, City of Johannesburg continued to lead in potato export from Gauteng province. Ekurhuleni and City of Tshwane have notably increased their export value during the same year. In 2014, City of Johannesburg, Ekurhuleni and City of Tshwane have notably contributed to the Gauteng provincial potato exports. City of Johannesburg has continued to be the leading exit point for Gauteng potato exports in 2015, and the export value has risen by 28.9% and Tshwane export value has gone up by 25%. In the same year, Ekurhuleni has experienced a sharp decrease of 55.6% in export value. During 2016, City of Johannesburg potato export value has significantly gone up by 51%, whilst City of Tshwane export value declined by 50% in comparison to 2015 export value. City of Johannesburg was still by far the primary role player in Gauteng potato export value, however the export value has decreased by 10%. At the same time, City of Tshwane export value dropped by 20%, West Rand export value drastically dropped by 71% whilst Ekurhuleni export share has gone up by 12.6%. As for 2018, City of Johannesburg export value notably increased by 35%, West Rand has contributed notably to Gauteng potato exports, Ekurhuleni export value and Tshwane export value grew by 22% relative to 2017 export value.
2009 2010 2011 2012 2013 2014 2015 2016 2017 2018
Sedibeng 0 22720 0 0 0 600 0 3750 1604702 2261822
West Rand 0 5985825 56124 315528 734122 995710 1245606 474370 136028 467496
Ekurhuleni 1401437 9789227 8199244 7498745 11067317 39832671 18004429 19494028 21966943 26671662
City of Johannesburg 2685306813303807113333437799009989 96939199121572771136459952207253919185522786250611103
City of Tshwane 1900251 21201821 33728429 66054390 69610670 76356305 94125381 51110362 40687662 49785397
0
50000000
100000000
150000000
200000000
250000000
300000000V
alu
e (R
and
)
Years
Figure 14: Value of potato exports by Gauteng Province

18
Source: Quantec Easydata
From Figure 15 above, it is clear that potato exports from the KwaZulu Natal province are primarily from Ethekwini Municipality. In 2009, Ugu district recorded its first potato export value in a 10 year period. In 2010, Ethekwini potato export value surged and Umgungundlovu has recorded a notable export value relative to 2009. During 2011, export value for the leading municipality has declined by 4.9% when compared to 2010 export value. During 2012, Ethekwini municipality continued to lead in KwaZulu Natal potato exports and Uthungulu also contributed significantly to KwaZulu Natal exports after four years of recording a zero trade. As of 2013. Ethekwini continued to lead in potato exports from KwaZulu Natal, Umgungundlovu export value has notably increased, whereas Uthungulu has significantly dropped in comparison to 2012 export values. In the same year, Umzinyathi, Zululand, Sisonke and Uthungulu districts have registered insignificant export values. The use of the Durban harbour as an exit point may have played a major role in the Ethekwini municipality being a leader in the export of potatoes from the KwaZulu Natal province. During 2014, Uthungulu and Uthukela district have notably contributed to KwaZulu Natal potato exports and Ethekwini export has significantly increased in comparison to the previous year export values. In 2015, Ethekwini district has continued to lead in KwaZulu Natal potato exports and the export value has notably increased by 16%. ILembe has also recorded a notable export value of R186 980. At the same time, Umgungundlovu, Zululand and Sisonke potato export values were less significant. Ethekwini, Zululand and Uthungulu potato export values eased lower by in 2016, whereas Sisonke has notably increased its potato export value in comparison to 2015 export value. Ethekwini was still by far the main roleplayer in KwaZulu Natal potato export; however, the export value has eased lower by 14.9% relative to 2016 export value. At the same time, Umgungundlovu and Ugu
2009 2010 2011 2012 2013 2014 2015 2016 2017 2018
Ugu 119739 0 0 0 0 0 0 0 36300 0
UMgungundlovu 0 346048 40 35314 118400 0 17700 360 422229 22027
Uthukela 0 0 0 1960 0 158530 0 0 0 0
Umzinyathi 0 0 0 0 2640 0 0 750 0 0
Amajuba 0 0 0 0 0 0 0 0 509 0
Zululand 0 0 0 0 1150 0 30390 20800 19450 31034
Uthungulu 0 0 0 114412 9400 208300 92380 12500 27500 12400
Ilembe 0 632 0 0 0 0 186980 0 0 0
Sisonke 0 0 0 0 1140 0 8700 273855 0 1520
Ethekwini 573855 4183793 3976654 4184917 3206231 1784609 2077515 2051566 1745688 1118577
0500000
10000001500000200000025000003000000350000040000004500000
Val
ue
(Ran
d)
Year
Figure 15: Value of potato exports by KwaZulu Natal Province

19
export values have significantly increased, whilst Zululand has experienced 6.5% decrement in export value. As of 2018, Ethekwini potato export value has notably decline by 35%, Uthungulu export value dropped significantly by 55% and Umgungundlovu has eased lower by 94%. The overall export value for KwaZulu Natal potato export has declined by 47% relative to 2017 export value.
Source: Quantec Easydata
Figure 16 above shows that, from 2009 to 2011, there was no potato exports recorded from Free State province despite being one of provinces producing high volumes of potatoes. During 2012, Xhariep recorded a significant export value for the first time in a ten year period. This was a good development as it shows that the Free State is producing and exporting its own potatoes. In 2013, Free State province exported potatoes through Xhariep and Lejweleputswa districts, and the export value for both districts have surged when compared to the previous year. During 2014, Thabo Mofutsanyane was the main contributor to Free State potatoes exports, Fezile Dabi export value has notably gone up while Xhariep export value has slightly decreased. Overall Free State export value had a positive growth, which can be attributed to an increase in potato exports to the neighbouring Lesotho. Thabo Mofutsanyane has contributed significantly to Free State provincial potato exports in 2015. At the same time, Mangaung and Lejweleputswa have also recorded notable increases in potato export values, while Xhariep export value has dropped by 11.7% in comparison to 2014 export value. During 2016, Thabo Mofutsanyane continued to be the primary exit point of potato export from Free State province and the export value has increased by 26% in comparison to 2015 export value. In the same year, Fezile Dabi export value increased sharply, whilst Xhariep and Lejweleputswa export values have notably decreased. In 2017, Thabo Mofutsanyane is still the primary exit point for Free State potato export, however the export value has slightly dropped by 15.9%. At the same time, Mangaung potato export share has notably increased by 39%, Lejweleputswa export value has gone up by 33% whereas Fizile Dabi has registered an insignificant export value. As of 2018,
2009 2010 2011 2012 2013 2014 2015 2016 2017 2018
Xhariep 0 0 0 7786304 9724583 8349408 7345091 1290339 1179309 734891
Lejweleputswa 0 207 236007 1647236 3279171 4613456 6388571 3678719 4897627 11514806
Thabo Mofutsanyane 0 22170 21859 4298906 1168070914298355168122892110365617743398 8090971
Fezile Dabi 0 41250 0 0 8600 40430 72870 260002 510 0
Mangaung 0 257962 25154 244151 482381 2247563 2970841 2617929 3639593 6111875
0
5000000
10000000
15000000
20000000
25000000
Val
ue
(Ran
d)
Years
Figure 16: Value of potato exports by Free State Province

20
Lwejeleputswa was the primary exit point for Free State potato export and the export value surged by 135% , Mangaung export value grew notably by 68%, Thabo Mofutsanyane export value declined by 54% , whereas Xhariep has experienced 38% decrement. Figure 17 below illustrates the potato exports from Limpopo province from 2009 to 2018.
Source: Quantec Easydata
Figure 17 above shows that, in 2009, Limpopo province has exported potatoes solely through Capricorn district. In 2010, the high export value was recorded for Capricorn district municipality. During 2011, Limpopo province potato exports were exported through Vhembe and Capricorn districts. In 2012, Waterberg district recorded its first export value, Vhembe export value was incomparably higher when compared to 2011 export value. In 2013, Limpopo province exported potatoes through Vhembe, Capricorn, Mopani and Waterberg districts. During 2014, Capricorn district was the main contributor to Limpopo provincial potato exports, followed by Waterberg and Mopani districts. In 2015, Limpopo province has exported potatoes through Mopani, Vhembe, Capricorn, Waterberg and Greater Sekhukhune. This is a good development as Limpopo is one of the provinces with high potato production. The highest export value was also recorded during 2015 and it was recorded for Capricorn district. In 2016, Capricorn district was still the primary exit point for Limpopo provincial potato export; there was also a notable increment in Waterberg potato export values, whilst Mopani and Vhembe export values have experienced a notable decrement. During 2017, there was a sharp decrement of 25% in Capricorn potato export value, Vhembe export value dropped by 10.9%, Waterberg experienced 11.7% decrement in export value and Mopani has registered an insignificant export value. As of 2018, Capricorn district was still the primary exit point for Limpopo potato export. At the same time, Waterberg export value surged and Vhembe has significantly contributed to Limpopo potato export value.
2009 2010 2011 2012 2013 2014 2015 2016 2017 2018
Mopani 0 0 107640 46920 59461 1042752 110967 6533 1400 6000
Vhembe 0 33170 42746 237940 80912 59014 100678 36755 32731 345646
Capricorn 47175 7649599 186074 1233975 1264057 1563453 11879594215278851610702218267411
Waterberg 0 0 0 342734 341503 1391817 1550025 2746796 2424334 6422104
Greater Sekhukhune 0 0 0 0 0 9450 126446 0 0 0
0
5000000
10000000
15000000
20000000
25000000
Val
ue
(Ran
d)
Years
Figure 17: Value of potato exports by Limpopo Province

21
From Figure 18 below, it is clear that potato exports from the Mpumalanga province were mainly from Ehlanzeni and Nkangala District Municipalities. High export values for the leading municipalities were recorded in 2010 (for Nkangala) and 2012 (for Ehlanzeni). However, there has been fluctuation in terms of export values from the leading municipalities in the past ten years. In 2008, the province has recorded a zero trade for potatoes. In 2011, export values for both Nkangala and Ehlanzeni has dropped significantly when compared to 2010 export values. During 2012, Mpumalanga exported potatoes mainly from Ehlanzeni district and the value has surged when compared to the 2011 export value. In 2013, Gert Sibande contributed notably to Mpumalanga potato exports, Nkangala export value has increased while the export value for the Ehlanzeni has surged when compared to 2012 export values. In 2014, Ehlanzeni continued to lead in Mpumalanga potato exports and Gert Sibande has recorded high export value compared to the previous year. During 2015, Ehlanzeni potato export value has sharply increased by 32% and Nkangala export value was incomparably higher when compared to 2014 export value. In the same year, Gert Sibande export value has experienced a 5% decrement. In 2016, Ehlanzeni was still by far the main exit point of potato exports from Mpumalanga province, Nkangala value of export surged whilst Gert Sibande export value has declined by 72% when compared to 2015 value. During 2017, Ehlanzeni potato export value grew by 40.5%, Nkangala, Gert Sibande export value has gone down by 30% and Nkangala export value has declined by 25% relative to 2016 export values. In 2018, Ehlanzeni potato export value declined significantly by 65.5%, Nkangala export value has dropped by 30.7%, whereas Gert Sibande export value has notably increased by 54.9% relative t0 2017 export value.
Source: Quantec Easydata
Figure 19 below illustrates the value of potato exports from Eastern Cape province from 2009 to 2018.
2009 2010 2011 2012 2013 2014 2015 2016 2017 2018
Gert Sibande 953080 172360 0 3500 1944749 2276820 3070405 834257 580007 898894
Nkangala 0 7234001 4446510 3115971 3802593 4133923 3894692 5521674 4126725 3272351
Ehlanzeni 0 182752 54989 7363619 11508363 14833606 1961712712635178917761303061197654
0
20000000
40000000
60000000
80000000
100000000
120000000
140000000
160000000
180000000
200000000
Val
ue
(Ran
d)
Years
Figure 18: Value of potato exports by Mpumalanga Province

22
Source: Quantec Easydata
Figure 19 above shows that, in 2009, Eastern Cape province has recorded a zero trade for potatoes. In 2010 and 2011, Eastern Cape potato exports were sourced from Buffalo City district. In 2012, Chris Hani district municipality has recorded considerable export value after four years of zero potato trade. During 2013, Alfred Nzo contributed notably to Eastern Cape potato exports for the first time in a 10 year period. In 2014, Eastern Cape exported potatoes primarily through Alfred Nzo, Nelson Mandela, Joe Gqabi and Buffalo City districts. Exports from Joe Gqabi and Nelson Mandela districts were less significant. During 2015, Nelson Mandela district potato exports have substantially increased and Alfred Nzo export value has notably increased by 59% in comparison to 2014 values. At the same time, Cacadu export value has notably improved while Chris Hani and Joe Gqabi export values were trivial. In 2016, Buffalo City was the main contributor in potato exports from Eastern Cape province, Alfred Nzo and Nelson Mandela export values have notably eased higher when compared to 2015 values. Alfred Nzo district potato export value has surged during 2017, whilst Buffalo City and Chris Hani export values have substantially decreased relative to 2016 export values. In 2018, Alfred Nzo district was still the primary exit point for Eastern Cape potato exports, however the export value declined notably by 36% relative to 2017 exports. Figure 20 below, illustrates potato exports from the North West province from 2009 to 2018. As of 2009, the province has recorded a zero trade for potatoes. During 2010, North West has exported potatoes mainly through Ngaka Modiri Molema, Bojanala and Dr Ruth Segomotsi Mompati district have contributed to a lesser extent. In 2011 and 2012, North West potato exports were primarily from Bojanala and Dr Ruth Segomotsi Mompati districts. During 2014, North West potato exports were sourced from Bojanala, Dr Ruth Segomotsi Mompati and Ngaka Modiri Molema. In 2015, the overall export value for North West continued to increase and all districts export values have experienced significant increments when compared to previous year values. This can be attributed to 17.3% of South Africa’s potato exports destined to the neighbouring Botswana. There was a notable increase in potato export values recorded for Bojanala and Ngaka Modiri Molema during 2016, whilst Dr Ruth
2009 2010 2011 2012 2013 2014 2015 2016 2017 2018
Cacadu 0 0 0 0 9100 0 24474 20815 0 0
Chris Hani 0 0 0 170712 39206 0 120 0 3650 0
Joe Gqabi 0 0 0 0 0 5419 220 0 0 0
Alfred Nzo 0 0 0 8113 150456 105469 167913 258678 851781 540947
Nelson Mandela 0 0 0 18456 25349 16990 94920 146490 0 225
Buffalo City 0 418848 87611 0 0 37400 0 581615 21450 0
0100000200000300000400000500000600000700000800000900000
Val
ue
(Ran
d)
Years
Figure 19: Value of potato exports by Eastern Cape Province

23
Segomotsi Mompati and Dr Kenneth Kaunda potato export values have experienced sharp declines. In 2017, Bojanala was still by far the primary exit point for North West potato export, Dr Ruth Segomotsi Mompati, Ngaka Modiri Molema and Dr Kenneth Kaunda district export values have experienced substantial increment relative to 2016 export values. There was a 29% increment in Bojanala potato export value, Ngaka Modiri Molema export value has surged, Dr Ruth Segomotsi Mompati export has drastically dropped by 84% and Dr Kenneth Kaunda export value eased lower by 58% relative to 2017 export values.
Source: Quantec Easydata
Figure 21 below illustrates the value of potato exports from Northern Cape province from 2009 to 2018.
Source: Quantec Easydata
2009 2010 2011 2012 2013 2014 2015 2016 2017 2018
Bojanala 0 386375 488332 289937 272119 1107374 13812909 16638366 14886741 19217663
Ngaka Modiri Molema 0 6801084 150352 0 570847 138834 388621 1277907 1615098 3236136
Dr Ruth SegomotsiMompati
0 280335 78540 282461 901751 792828 891159 308951 3384238 518974
Dr Kenneth Kaunda 0 0 0 8800 64700 0 93150 51860 128020 53267
0
5000000
10000000
15000000
20000000
25000000
Val
ue
(Ran
d)
Years
Figure 20: Value of Potato exports by North West Province
2009 2010 2011 2012 2013 2014 2015 2016 2017 2018
Namakwa 0 0 0 0 135300 223016 14440 330045 208302 70925
Siyanda 0 0 0 0 0 297000 7236 6528 35590 38528
0
50000
100000
150000
200000
250000
300000
350000
Val
ue
(Ran
d)
Years
Figure 21: Value of potato exports by Northern Cape Province

24
Figure 21 above shows that from 2009 to 2012, the Northern Cape province has recorded a zero potato trade. During 2013, Namakwa district contributed for the first time to Northern Cape potato exports and the export value was notable. In 2014, Northern Cape exports were exported through Namakwa and Siyanda districts. The high export value by Northern Cape can be attributed to an increase in potato exports to neighbouring Namibia. During 2015, Namakwa and Siyanda have dramatically dropped and this can be attested to 28% decrement in value of exports destined for Namibia. There was a surge in Namakwa potato export value during 2016, whereas Siyanda export value dropped by 9.7% compared to 2015 export value. Siyanda potato export value was incomparably higher relative to 2016 export value, whereas Namakwa export value has decreased by 36.8%. As of 2018, Namakwa export value drastically dropped by 65%, whereas Siyanda export value increased by 8% in comparison to the previous year (2017) export value. 2.4 Share analysis Table 3 is an illustration of provincial shares towards national potato exports. It shows that Western Cape and Gauteng provinces have commanded the greatest share of potato exports for the past ten years. In 2009, Western Cape has commanded more than 58% and Gauteng export share was 40% of South Africa potato export shares. This is in spite of the fact that Free State and Limpopo together with the Western Cape are the leading producers of potatoes. As explained earlier, this means that the leading export provinces (Western Cape and Gauteng) derive their advantage from the fact that the registered exporters are based in their provinces and they also have exit points for potato exports. In 2010, Gauteng has commanded the greatest share of 86.14% of potato export share. During 2011, Gauteng continued to lead in potato export share and it has commanded 86.14%, while export shares for Western Cape has recorded low export share of 13.74%. During 2012, Western Cape has increased its export share to 24.30% and Gauteng export share has dropped to 71% in comparison to 2011 export share. In the same year, Free State province has commanded 2.33% of South Africa’s potato export share. This is a positive development considering that the province has commanded zero shares for that past seven years, despite being one of the top provinces producing potatoes. In 2013, Gauteng province continued to command high potato export share, but the export share has dropped to 68.35%. At the same time, Western Cape export share has slightly gone up to 25.73%, while Mpumalanga export share has gone up to 3.04% when compared to 2012 export shares. During 2014, Western Cape export share has notably increased to 43.32%, Gauteng export share has dropped from 68.35% to 45.62%, while Free State export share has gone up to 5.43%. During 2015, Western Cape export share has dropped to 30.34% and Gauteng share has increased to 51.97%. Limpopo export share has increased to 2.80%, Free State share has gone up to 6.87% and Mpumalanga province has recorded 4% share. In 2016, Gauteng was still the primary exit point for South Africa’s potato exports, however the export share has dropped to 45.35%, Western Cape has commanded 21.71% share and Mpumalanga export share has risen from 4.37% to 20.72%. In 2017, Gauteng export share has dropped further to 39.94%, Western Cape export share has also dropped to 19.82%, whereas Mpumalanga export share has increased notably to 29.14% relative to 2016 export shares. As of 2018, Gauteng potato export share grew to 58.41%, Mpumalanga export share dropped notably to 11.58%, Western Cape has commanded 16.50%, North West export share increase to 4.08% and Limpopo export share increased to 4.43%.

25
The above scenario raises concerns about the availability of marketing infrastructure and agro-logistics in the other major potato producing provinces of South Africa like Free State and Limpopo because Gauteng not a potato producing region and yet above 58% share of South African potato exports in (2017) are exported through this province. In 2017, there was a good development as 29.14% of potatoes were exported from Mpumalanga, which is one of the provinces with notable high potato production. However, in 2018 Mpumalanga export share has declined notably to 11.58% share. Table 3: Share of provincial potato exports to the total RSA potato exports (%)
Years Province
2009 2010 2011 2012 2013 2014 2015 2016 2017 2018
Western Cape 58.87 6.69 13.74 24.30 25.73 43.32 30.34 21.71 19.82 16.50
Eastern Cape 0 0 0 0 0 0.04 0.06 0.16 0.14 0.10
Northern Cape 0 0 0 0 0.04 0.10 0 0.05 0.04 0.02
Free State 0 0 0 2.33 2.55 5.43 6.87 4.68 4.39 4.68
KwaZulu-Natal 0.90 0.39 0.11 0.15 0.15 0.41 0.50 0.38 0.36 0.21
North West 0 0 0 0 0.13 1.03 3.10 2.96 3.20 4.08
Gauteng 40.17 88.79 86.14 71.00 68.35 45.62 51.97 45.35 39.94 58.41
Mpumalanga 0 1.95 0 2.23 3.04 3.28 4.37 20.72 29.14 11.58
Limpopo 0.06 2.17 0.01 0 0.01 0.77 2.80 3.97 2.97 4.43
South Africa 100 100 100 100 100 100 100 100 100 100
Source: Calculated from Quantec Easydata
The following tables (Table 4 – 12) show the share of provincial potato exports to the total national potato exports. Table 4: Share of district potato exports to total Western Cape provincial potato exports (%)
Year
District
2009 2010 2011 2012 2013 2014 2015 2016 2017 2018
City of Cape Town 98.64 90.77 88.42 89.62 87.86 89.01 89.59 91.88 83.70 86.49
West Coast 0 7.42 9.06 9.90 7.59 8.24 9.35 6.64 14.43 9.59
Cape Winelands 0.60 1.35 1.76 0.46 4.48 2.55 1.03 1.22 1.88 3.91
Overberg 0 0.45 0.75 0 0.06 0 0 0 0 0
Eden 0.75 0 0 0.02 0.01 0.14 0.03 0.26 0 0
Western Cape 100 100 100 100 100 100 100 100 100 100 Source: Calculated from Quantec Easydata
Table 4, above indicates that the City of Cape Town municipality commanded the greatest share of potato exports from Western Cape Province. In 2009 and 2010, City of Cape Town has commanded more than 90% of Western Cape potato export shares. The City of Cape has continued to command

26
high export shares and during 2012, it commanded 89.62% share of exports and West Coast export share has increased to 9.90%. In 2013, City of Cape commanded 87.86% of Western Cape potato export share. At the same time Cape Winelands has slightly increased its export share to 4.48%, West Coast has registered 7.59%, and Eden export shares were insignificant. Cape Town Harbour renders exit point for exports from this province. During 2014, City of Cape Town export share has increased slightly to 89.01% and West Coast export share has gone up to 8.24% share. City of Cape Town has continued to lead in Western Cape potato exports and in 2015, the district has increased its export share to 85.75%, while other districts have experienced slightly decrement in their export shares. City of Cape Town export share has increased to 91.88% during 2016, West Coast export share dropped to 6.64%, whereas Eden export share has gone up to 1.91%. In 2017, City of Cape Town has registered a 83.70% share of Western Cape potato exports and West Coast has commanded 14.43% share of exports. As of 2018, City of Cape Town potato export share increased to 86.49%, Cape Winelands export share has gone up to 3.91% whereas West Coast export share declined to 9.59% share. Table 5: Share of district potato exports to the total Gauteng provincial potato exports (%)
Year
District
2009 2010 2011 2012 2013 2014 2015 2016 2017 2018
Sedibeng 0 0 0 0 0 0 0 0 0.64 0.69
West Rand 0 0 0 0.18 0.01 0.41 0.50 0.17 0.05 0.14
Ekurhuleni 4.65 5.76 4.68 4.34 0.88 16.68 7.21 7.00 8.79 8.09
City of Johannesburg 89.04 78.24 76.05 57.27 79.79 50.92 54.62 74.46 74.23 75.99
City of Tshwane 6.30 12.47 19.24 38.21 19.32 31.98 37.67 18.36 16.28 15.10
Gauteng 100 100 100 100 100 100 100 100 100 100
Source: Calculated from Quantec Easydata
Table 5 above shows that the City of Johannesburg has commanded the greatest shares of potato exports from Gauteng province. During 2009, City of Johannesburg has commanded more than 89% of Gauteng export share. In 2010, City of Johannesburg commanded export share has dropped to 78.24% and City of Tshwane export share has gone up to 12.47%. During 2012, City of Johannesburg has commanded the greatest share in Gauteng and the City of Tshwane has increased its export share to 12.47%. During 2013, City of Johannesburg was still the highest contributor to Gauteng potato export shares. It has commanded 76.05%, followed by the City of Tshwane with 19.24% and Ekurhuleni export share was 4.34%. OR Tambo International Airport renders exit point for exports from these municipalities. In 2014, there was a severe drop in the City of Johannesburg export share, which was 57.27%. At the same time, City of Tshwane, Ekurhuleni, and West Rand have notably increased their export shares to 38.21%. City of Johannesburg has continued to lead in Gauteng potato exports and in 2015, it has commanded 54.62% share of exports. At the same time, City of Tshwane export share has increased to 37.67% share, while Ekurhuleni has dropped its export share from 16.68% to 7.21%. In 2016, City of Johannesburg has advanced its lead as a primary exit point of potatoes exported from Gauteng province by commanding 74.46%, whilst City of Tshwane export share has notably dropped from 37.67% to 18.36%. In 2017, City of Johannesburg has registered 74.23% share of Guateng potato

27
export, followed by City of Tshwane with 16.28% share and Ekurhuleni with 8.79% share. As of 2018, City of Johannesburg was still in the lead in Gauteng export share and it has commanded 75.99%, City of Tshwane has registered 15.10% and Ekurhuleni has recorded 8.09% share. Table 6: Share of district potato exports to the total Limpopo provincial potato exports (%)
Year
District
2009 2010 2011 2012 2013 2014
2015 2016 2017 2018
Mopani 0 0 31.99 2.52 3.41 25.64 0.81 0.03 0.01 0.02
Vhembe 0 0.47 12.70 12.78 4.63 1.45 0.73 0.15 0.18 1.38
Capricorn 100 99.57 55.30 66.29 72.40 38.45 86.29 88.53 86.76 72.95
Waterberg 0 0 0 18.41 19.56 34.23 11.26 11.30 13.06 25.65
Greater Sekhukhune 0 0 0 0 0 0 0.92 0
0 0
Limpopo 100 100 100 100 100 100 100 100 100 100 Source: Calculated from Quantec Easydata
Table 6 illustrates that, Capricorn commanded the greatest share of potato exports from Limpopo province. During 2009, Capricorn has commanded 100% share of Limpopo provincial export share. Capricorn continued to dominate in Limpopo export and it has commanded a 99.57% share during 2010. In 2011, Vhembe commanded a 100% share of potato exports from Limpopo province. During 2012, Capricorn has commanded 66.29%, Waterberg contributed to Limpopo potato export share for the first time in a ten year period and it has commanded 18.41% share and Vhembe has recorded 12.78% share. In 2013, Capricorn has advanced its export share to 72.40% share while Waterberg export share has slightly increased to 19.56%. During 2014, Mopani export share has increased to 25.64% and Capricorn export share has significantly dropped to 38.45%. At the same year, Waterberg export share has gone up from 19.56% to 34.23% share. In 2015, Capricorn has commanded a greatest share of 86.29% for Limpopo potato export while Waterberg district export share has dropped from 34.23% to 11.26%. During 2016, Capricorn continued to lead in Limpopo potato export share by commanding 88 53%, followed by Waterberg with 11.30% share. As of 2017,Capricorn was still the primary exit point for Limpopo potato export share by commanding 86.76% and Waterberg has commanded 13.06%. During 2018, Capricorn potato export share dropped slightly to 72.95% and Waterberg export share grew to 25.65%. Table 7: Share of district potato exports to the total KwaZulu provincial potato exports (%)
Years
District
2009 2010 2011 2012 2013 2014 2015 2016 2017 2018
Ugu District 17.26 0 0 0 0 0 0 0 1.61 0
Umgungundlovu 0 7.64 0 0.81 3.55 0 0.73 0.02 18.75 2.62
Uthukela 0 0 0 0.05 0 7.37 0 0 0 0
Umzinyathi 0 0 0 0 0.08 0 0 0 0 0
Amajuba 0 0 0 0 0 0 0 0.03 0.02 0
Zululand 0 0 0 0 0.03 0 1.26 0.88 0.86 0
Uthungulu 0 0 0 2.64 0.28 9.68 3.83 0.53 1.22 1.05
Ilembe 0 0.01 0 0 0 0 7.75 0 0 0

28
Years
District
2009 2010 2011 2012 2013 2014 2015 2016 2017 2018
Sisonke 0 0 0 0 0.03 0 0.36 11.60 0 0.13
Ethekwini 82.74 92.35 100 96.50 96.02 82.95 86.07 86.94 77.53 94.35
KwaZulu Natal 100 100 100 100 100 100 100 100 100 100
Source: Calculated from Quantec Easydata
Table 7 above indicates that Ethekwini district municipalities commanded the greatest share of potato exports from KwaZulu Natal province. In 2011, Ethekwini commanded a 100% share of potato exports from KwaZulu Natal province . The greatest share by Ethekwini can be attributed to Durban harbour which renders export exit point. Ugu district has contributed to KwaZulu Natal export share in 2009 and it has commanded 17.26%. In 2012, the Ethekwini continued to lead in potato exports, but the export share has decreased to 96.50% and Uthungulu has registered 2.64% share. During 2013, Ethekwini district has registered 96.02% export share and Ungungundlovu has commanded 3.55% export share. During 2014, Ethekwinin was still leading in KwaZulu Natal potato export share by commanding 86.07% and Uthungulu has increased its export share to 9.68%. In 2015 and 2016, EThekwini has commanded more than 85% of KwaZulu Natal, and Sisonke has commanded 11.60% potato export share in 2016. During 2017, Ethekwini was still the primary export market for potato exports from KwaZulu Natal, however the export share has dropped to 77.53% and Umgungundlovu export share has eased higher to 18.75%. As of 2018, Ethekwini potato export share increased notably to 94.35% and other municipalities have registered less significant shares. Table 8: Share of district potato exports to the total Free State provincial potato exports (%)
Year
District
2009 2010 2011 2012 2013 2014 2015 2016 2017 2018
Xhariep 0 0 0 55.71 38.63 28.26 21.87 4.46 4.29 2.78
Lejweleputswa 0 0 0 11.79 13.03 15.61 19.02 12.71 17.84 43.53
Thabo
Mofutsanyane 0 0 0 30.76 46.40 48.39 50.05 72.90
64.61 30.59
Fezile Dabi 0 0 0 0 0.03 0.14 0.22 0.90 0 0
Mangaung 0 0 0 1.75 1.92 7.61 8.84 9.04 13.25 23.11
Free State 0 0 0 100 100 100 100 100 100 100
Source: Calculated from Quantec Easydata
Table 8 shows that, from 2009 to 2011, the province has recorded a zero trade for potatoes. Xhariep commanded 55.71% of potato exports in the Free State province in 2012 and Thabo Mofutsanyane has registered 30.76%. During 2014, Xhariep export share has dropped 28.26% and Thabo Mofutsanyane has recorded a greatest share of 48.39% of Free State potato exports. At the same time, Mangaung export share has gone up to 7.61% share when compared to 1.92% in the previous year. In 2015, Thabo Mofutsanyane has commanded 50.05% potato export share, Lejweleputswa export share has notably increased to 19.02%, while Xhariep export share has dropped to 21.90% in comparison to the 2014 export share. During 2016, Thabo Mofutsanyane has notably increased its export share to 72.90%, while Xhariep export share dropped to 4.46%. In 2017, Thabo Mofutsanyane export share dropped slightly to 64.61% and Lejweleputswa export share has eased

29
higher to 17.84%. As of 2018, there was a notable increment in Lejweleputswa potato export share and it has registered 43.53% of Free State potato export share, Thabo Mofutsanyane export share declined to 30.59% share and Mangaung export share increased to 23.11% relative to 2017 share. Table 9: Share of district potato exports to the total Mpumalanga provincial potato exports (%)
Year District
2009 2010 2011 2012 2013 2014 2015 2016 2017 2018
Gert Sibande 0 2.27 0 0.03 11.27 10.72 11.55 0.63 0.32 1.38
Nkangala 0 95.32 98.78 29.72 22.04 19.46 14.65 4.16 2.26 5.01
Ehlanzeni 0 2.41 1.22 70.24 66.69 66.82 73.80 95.21 97.42 93.62
Mpumalanga 0 100 100 100 100 100 100 100 100 100
Source: Calculated from Quantec Easydata
Table 9 above illustrates, that in 2009, Mpumalanga province has recorded a zero potato trade. In 2010, Nkangala district commanded a 95.32% share of potato exports and 2011, Nkangala commanded a 98.78% share. During 2012, Ehlanzeni commanded 70.24% whereas Nkangala has registered 29.72% export share. In 2013 and 2014, Ehlanzeni continued to dominate in Mpumalanga export share and it has commanded more than 66% share of potato export from Mpumalanga province. Ehlanzeni has continued to lead in Mpumalanga potato export and during 2015, it has commanded 73.80%, while Nkangala export share has dropped to 14.65%. During 2016, Ehlanzeni continued to be the primary exit point for Mpumalanga province by commanding 95.21%, whereas Gert Sibande and Nkangala districts have recorded trivial export shares. In 2017, Ehlanzeni export share has increase to 97.42% share of Mpumalanga potato export share and Nkangala has registered 2.265 share. As of 2018, Ehlanzeni potato export share dropped slightly to 93.62% and Nkangala has commanded 5.01% share. Table 10: Share of district potato exports to total Eastern Cape provincial potato exports (%)
Year
District
2009 2010 2011 2012 2013 2014 2015 2016 2017 2018
Cacadu 0 0 0 0 4.06 0 8.51 2.07 0 0
Chris Hani 0 0 0 86.53 17.49 0 0.04 0 0.42 0
Joe Gqabi 0 0 0 0 0 3.28 0.08 0 0 0
Alfred Nzo 0 0 0 4.11 67.13 63.81 58.37 25.67 97.14 99.96
Nelson
Mandela 0 0 0 9.36 11.31 10.28 33.00 14.54 0 0.04
Buffalo City 0 100 100 0 0 22.63 0 57.72 2.45 0
Eastern Cape 0 100 100 100 100 100 100 100 100 100
Source: Calculated from Quantec Easydata Table 10 shows that, in 2009, the province has recorded a zero potato trade and in 2010 and 2011, Buffalo City district commanded a 100% share of potato exports from Eastern Cape Province. In 2012, Chris Hani district has recorded 86.53% share and Nelson Mandela district municipality has commanded 9.36% share of Eastern Cape potato export. During 2013, Alfred Nzo registered 67.13% and Chris Hani district has commanded 17.49% share of Eastern Cape potato export. During 2014,

30
Alfred Nzo has commanded the greatest share of 63.81% of Eastern Cape, Buffalo City has commanded 22.63% share and Nelson Mandela district has registered 10.28% export shares. In 2015, Alfred Nzo potato export share was down from 63.81% to 58.37%, whilst Nelson Mandela and Cacadu districts have increased their export shares to 33%. During 2016, Buffalo City has commanded the greatest share of 57.72% of Eastern Cape potato export share and Alfred Nzo and Nelson Mandela export shares have dropped to 25.67% and 14.54% respectively. Alfred Nzo district has commanded the greatest share of 97.14% of Eastern Cape potato export, whilst Buffalo City export share has dropped to 2.45%. As of 2018, Alfred Nzo district was still in the lead in Eastern Cape potato export share and it has commanded 99.95% share of export, whereas Nelson Mandela district has registered a trivial export share. Table 11: Share of district potato exports to total North West provincial potato exports (%)
Year
Districts
2009 2010 2011 2012 2013 2014 2015 2016 2017 2018
Bojanala 0 5.17 68.09 49.89 15.04 54.31 90.96 91.03 74.38 83.46
Ngaka Modiri Molema 0 91.07 20.96 0 1.55 6.81 2.56 6.99 8.07 14.05
Dr Ruth S. Mompati 0 3.75 10.95 48.60 49.84 38.88 5.87 1.69 16.91 2.25
Dr K Kaunda 0 0 0 1.51 3.58 0 0.61 0.28 0.64 0.23
North West 0 100 100 0 100 100 100 100 100 100
Source: Calculated from Quantec Easydata
Table 11 above illustrates that, from 2009, North West has recorded a zero potato trade. During 2010, Ngaka Modiri Molema has commanded 91.07% share of North West potato export share. In 2011, Bojanala district has commanded 68.09% share and Ngaka Modiri Molema has registered 20.96%
share of North West potato export share. In 2013, Dr Ruth Segomotsi Mompati district has commanded the greatest share of 49.84% of potato exports from North West province. In 2014 and 2015, Bojanala was the main role player in North West potato export share, whereas Dr Ruth Segomotsi Mompati district export share has sharply dropped to 38.88% and 5.87% respectively. During 2016, Bojanala increased its potato export share to 91.03% and Ngaka Modiri Molema export share has gone up to 6.99% share in comparison to 2015 export shares. In 2017, Bojanala potato export share has dropped to 74.38% and Dr Ruth Segomotsi Mompati district export share has notably increased to 16.91%. As of 2018, Bojanala potato export share increased to 83.46%, Ngaka Modiri Molema export share increased to 14.05% and Dr Ruth Segomotsi Mompati export share declined significantly to 2.25% share. Table 12: Share of district potato exports to the total Northern Cape provincial potato exports (%)
Year
District
2009 2010 2011 2012 2013 2014 2015 2016 2017 2018
Namakwa 0 0 0 0 100 42.89 66.62 98.06 85.41 64.80
Siyanda 0 0 0 0 0 57.11 33.38 1.94 14.59 35.20
Northern Cape 0 0 0 0 100 100 100 100 100 100
Source: Calculated from Quantec Easydata

31
Table 12 above shows that from 2009 to 2012, Northern Cape province has recorded a zero trade for potatoes. During 2013, Namakwa has commanded the 100% share of potato exports from Northern Cape province. During 2014, Namakwa potato export share has dropped to 42.89% and Siyanda has recorded 57.11% of Northern Cape province and, this was the first export share recorded for this district municipality. In 2015, Namakwa export share has gone up from 42.89% to 66.62%, whilst Siyanda export share has dropped to 33.38%. Namakwa has increased its potato export share to 98.06%, while Siyanda export share has sharply dropped from 33.38% to 1.94%. During 2017, Namakwa has continued to lead by commanding 85.41% share and Siyanda export share grew to 14.59%. As of 2018, Namakwa potato export share declined to 64.80% and Siyanda export share grew further to 35.20% share. 2.5 South Africa’s potato imports South Africa is self-sufficient in terms of potato production; this is attested by low potato imports by South Africa. During 2018, South Africa’s potato imports still represent 0% of world imports for potatoes and its ranking in the world is 181. There was a notable change in South Africa potato imports ranking as they were ranked number 187 in 2017. In 2010, South Africa imported potatoes from Namibia and Eswatini. During 2011, Zambia was the sole supplier of potato imported from by South Africa. In 2012, South Africa imported potatoes from Ghana. In 2013, South Africa imported 70.1% of potatoes from Swaziland, 22.1% from Namibia and 2.6% from Botswana. During 2014, South Africa has sourced potatoes from Swaziland (70.8%), Namibia (25%) and Botswana (3.3%). In 2015, South Africa has imported insignificant 2.72 tons of potatoes. During 2016, South Africa potato import surged to 273 tons compared to 2.72 tons in 2015 and this can be attested to 13.7% decline in the domestic production output. In 2017, South Africa has imported potatoes from Swaziland, India and Lesotho. Import from Swaziland has decreased by 62 in value and 40 in quantity between 2013 and 2016 period. As of 2018, Namibia has supplied 69% of South Africa potato imports and Eswatini has supplied 31% of imports.
Source: Quantec Easydata
0
200000
400000
600000
800000
1000000
1200000
1400000
1600000
0
100
200
300
400
500
600
Val
ue
(Ran
d)
Vo
lum
e (t
on
s)
Years
Figure 22: Potato imports by South Africa
Volume (tons) Value (Rand)

32
Figure 22 above illustrates South Africa’s potato imports in a period of 10 years. In 2009, potato import was just above 53 tons and a record low in a ten year period, despite the low domestic production output in the same year. During 2011, potato import has increased by 10% despite a 5% increase in the domestic output. In 2012, South Africa potato imports increased by 81% despite a 2.5% increase in the domestic production output. It was more expensive to import potatoes in 2007, since high values were recorded for lower volumes imported. It was cheaper to import potatoes during 2012. During 2013, South Africa potato imports surged by 144% and this can be ascribed to 3% decline in potato output in the same year. South Africa paid lower value for 2013 potato imports in comparison to 2012 import value. South Africa’s potato import volume has dropped by 25% in 2014 in comparison to 2013. It was also cheaper to import potatoes when compared to 2013 imports. In 2015, South Africa potato import has sharply dropped from 357 tons to 2.72 tons, and it was fairly cheaper to import potatoes when compared to 2014 export value. During 2016, South Africa’s potato imports surged to 272 tons and this can be attributed to 13.7% decline in the domestic potato production output during the same year. It was relatively more expensive to import potatoes in comparison to the other years. In 2017, South Africa potato imports have dropped drastically by 77% relative to 2016 import volume. It was also more expensive to import potatoes relative to 2016 import value. As of 2018, South Africa potato imports surged by 139% in comparison to 2017 imports. During the same season, it was relatively cheaper to import potatoes relative to the previous year imports.
Source: Quantec Easydata
Figure 23 above shows South Africa’s potato seed imports in the period of 10 years. According to Potato Certification Service, it was not permitted for South African farmers to import potato seeds, however Trade Map has trade data on South Africa’s potato seed imports. South Africa’s potato seed imports are generally low, because South Africa is self-sufficient in producing its own potato seeds. However, in 2011, South Africa’s potato seed imports surged higher when compared to other years. In 2010, South Africa imported seeds from Germany and Netherlands. During 2013, South Africa’s seed imports represented 0% of world imports and it is ranked number 142. In 2011, South African seed imports were sourced from Zimbabwe and Netherlands. During 2012, South Africa imported
0
500000
1000000
1500000
2000000
2500000
3000000
3500000
4000000
4500000
0
100
200
300
400
500
Val
ue
(Ran
d)
Vo
lum
e (t
on
s)
Years
Figure 23: Potato seeds imports by South Africa
Volume (tons) Value (Rand)

33
potato seeds from the Netherlands, Germany and Japan. Netherlands supplied 54.5% and the United States of America supplied 45.5% of South Africa’s potato seed imports in 2013. South Africa has imported 5 tons of potato seeds during 2014. As of 2015, South Africa’s potato has surged to 76% and the imports were cheaper when compared to 2014 imports. Netherlands with 77.1% share is the leading supplier of South Africa’s potato seeds, followed by China with 14.3%. In 2016, South Africa, potato seed imports surged to 407 tons when compared to 76 tons imported in 2015. Netherlands supplied 88.2% of the potato seed imports, whilst Germany supplied 10.7% of the imports. During 2017, South Africa’s potato seed imports dropped by 60.5% relative to 2016 imports. As of 2018, South Africa’s potato seed imports were incomparably lower relative to 2017 and high value was recorded for the imported seeds. France and Germany were the primary supplier of South Africa’s potato seed. Globally, Egypt, Algeria, Belgium, Germany, Netherlands, Spain, Morocco and Italy were still the top countries importing potato seeds during 2017. As of 2018, South Africa potato seed imports represent 0% of the world seed imports and it was ranked 146. The 2018 seed imports originated from United Kingdom (85.7%) and United States of America (14.3%).
Source: Quantec Easydata Figure 24 above, illustrates South Africa’s provincial potato imports in a ten year period. South Africa imported potato primarily through Gauteng province. Free State province has recorded an import value during 2010, but the value was insignificant. KwaZulu Natal province has imported potatoes in 2008 and 2009, however the import values were less significant. High import value for Gauteng was recorded in 2013. In 2014, high import values were registered for KwaZulu Natal and Mpumalanga however Gauteng import value has drastically dropped in comparison to 2013 import value. In 2015, South Africa has imported potatoes mainly through Mpumalanga and Free State. Other provinces have recorded trivial values. In 2016, South Africa’s imported potatoes mainly through Western Cape, notable import values have also been recorded for Gauteng and Limpopo. During 2017, Gauteng province was the primary entry point for South Africa’s potato imports. KwaZulu Natal import
2009 2010 2011 2012 2013 2014 2015 2016 2017 2018
Western Cape 0 0 0 83160 331592 322044 195 1433796 2077 261421
Free State 0 83 0 0 8829 3861 2000 4648 10808 0
KwaZulu-Natal 4120 0 0 0 104885 351000 12 0 96800 124850
Gauteng 131369 264879 227875 362949 939264 51752 167 32822 297940 2069
Mpumalanga 0 0 0 0 102000 574262 4940 0 7200 10150
North West 0 0 0 0 0 0 28 0 0
Limpopo 0 0 0 0 0 0 0 21360 0 0
0
200000
400000
600000
800000
1000000
1200000
1400000
1600000
Val
ue
(Ran
d)
Years
Figure 24: South Africa's provincial potato imports

34
has also recorded a notable import value. As of 2018, Western Cape was the primary entry point of South Africa’s potato imports, followed by KwaZulu Natal. These two provinces borders Namibia and Eswatini, which were the primary source of South Africa potato imports. Figure 25 below illustrates the value of South Africa’s provincial potato seed imports from 2009 to 2018.
Source: Quantec Easydata
Figure 25 shows the value of South Africa’s potato seed imports in a ten year period. South Africa potato seeds were mainly imported through Gauteng and Western Cape provinces. In 2009, high import value was recorded for Northern Cape province. High import value for Gauteng was recorded in 2010, 2011 and 2013. Western Cape has recorded a high seed import value during 2013. Seed import values for North West and KwaZulu Natal were insignificant. During 2014, seed import value was recorded only in Free State province, but the import value was less significant. A notable import value was recorded for KwaZulu Natal and Gauteng provinces during 2015. At the same time, Western Cape import value was less significant. In 2016, a higher potato seed import value was recorded for KwaZulu Natal, whereas there was a sharp decline in Gauteng potato seed import value. During 2017, Gauteng province was the primary entry point for South Africa’s potato seed import and Western Cape import value was less significant. As of 2018, Western Cape and Gauteng were the entry point for South Africa’s potato seed import.
2009 2010 2011 2012 2013 2014 2015 2016 2017 2018
Western Cape 12659 10960 8625 25407 38064 0 16822 0 30275 78007
Northern Cape 32823 0 10087 5250 19535 0 0 0 0 0
Free State 0 0 0 0 0 1850 0 0 0 0
KwaZulu-Natal 0 0 0 0 269 0 330291 3966670 0 0
North West 0 248 0 0 0 0 0 0 0 0
Gauteng 250 73461 53896 9077 48587 0 81204 15177 1562959 18173
0500000
10000001500000200000025000003000000350000040000004500000
Val
ue
(Ran
d)
Years
Figure 25: Value of South Africa's potato seed imports

35
2.5 Processing Apart from being consumed fresh, potatoes are processed into a number of products. According to Potatoes South Africa, 20% of South Africa’s total table potatoes production was processed in 2016. The industry development comes mainly from frozen fries, dry crisp and fresh chips. The manufacturing of dry, frozen and fresh chips comprise 98% of processed potato products while the remaining 2% was used for canned and mixed vegetables. As depicted in Figure 27, the quantity of potatoes taken in for processing has been stable in the past decade. In 2009, there was a 3.5% increase in quantity taken for processing. This growth was mainly due to the expansion in the fast-food industry; the higher average income of the population, rapid rate of urbanization and the influx of international processing companies. A major shift in the value of processed potatoes was a 60% increase in 2009. In 2010, processed volumes increased by 9.9%, while the value of processed potatoes increased by 7.5%. There was a 5.6% drop in potatoes volumes that were processed during 2011. In 2012, the processed volume dropped by 3.6% when compared to 2011 processed potatoes. During 2013, volumes that were processed declined further by 4.3% and the value of processed potatoes has dropped by 15% when compared to 2012. There was a 14% increase in the volumes that were processed during 2014 in comparison to the previous year. In 2015, processed volume went up by 11% in comparison to 2014 processed volume and at the same time the value of processed potatoes has also increased by 11.5%. During 2016, a processed potato dropped by 14% in comparison to 2015 processed volume and the processed value has increased by 12%. South Africa has processed 15% more potato volumes relative to 2016 processed volume and the processed value have dropped slightly by 6.7%. There was a 0.69% increment in processed potatoes and the value of processed potatoes has increased notably by 19.7% relative to 2017 value.
Source: Statistics, and Economic Analysis, DAFF
0
200000000
400000000
600000000
800000000
1000000000
1200000000
1400000000
1600000000
0
50000
100000
150000
200000
250000
300000
350000
400000
450000
500000
Ran
d
Ton
s
Years
Figure 26: Total processed potatoes
Volume (Tons) Value (Rands)

36
3. MARKET INTELIGENCE
3.1 Competitiveness of South African potato exports Competitiveness is described as an industry’s capacity to create superior value for its customers and improved profits for the stakeholders in the value chain. The driving force in sustaining a competitive position is productivity that is output efficiency in relation to specific inputs with regard to human, capital and natural resources. In 2018, South African potato exports represented 1.3% of world exports and its ranking in the world export was number 17. South Africa competitiveness in terms of potato exports has declined as in 2017, it was ranked number 15. In 2018, South African potato seed exports represented 0.8% of world exports and it was still ranked number 11. South Africa’s competitiveness has declined in terms of ranking in the world potato seed exports as it was ranked number 10 during 2017. As depicted in Figure 27 below, South African potato exports are growing faster than the world imports into Congo market. South Africa’s performance in this market can be regarded as gains in dynamic markets. South African potato exports are growing slower than the world imports into Zimbabwe, Mozambique, Qatar, Lesotho and Eswatini. These markets are dynamic and South Africa’s performance should be regarded as an underachievement. South African potato exports are growing while the world imports are declining in United Arab Emirates , Botswana, Saint Helena and Democratic Republic of Congo. South Africa’s performance in those markets can be regarded as gains in declining markets and should be viewed as an achievement in adversity. South Africa exports are declining faster than the world imports into Gabon, Namibia and Angola.

37
Figure 27: Growth in demand for potatoes exported by South Africa in 2018
Source: ITC Trade Map

38
Figure 28: Growth in demand for potato seed exported by South Africa in 2018
Source: ITC Trade Map

39
As depicted in Figure 28 above South African potato seed exports are growing slower than the world imports into Botswana, Angola, Zimbabwe, United States of America, Namibia, Netherlands and Botswana markets. These markets are dynamic and South Africa’s performance should be regarded as an underachievement. South African potato seed exports are declining faster than the world imports into Eswatini and Zambia. South Africa’s performance in those markets can be regarded as a loss in declining markets. South African potato seed exports are growing while the world imports are declining in Mozambique, Lesotho and Democratic Republic of Congo. South Africa’s performance in those markets can be regarded as gains in declining markets and should be viewed as an achievement in adversity. Figure 29 below illustrates prospects for market diversification by South African exporters of potatoes. In 2018, Mozambique held a bigger market share of South African potato exports. In terms of the market size Belgium, Netherlands, United States of America, Spain, Russian Federation, Germany, Italy and Iraq are the leading markets/importers of potatoes. Whilst eight countries dominate world fresh potato imports, it is interesting to note that countries like Zimbabwe has a higher annual growth rate growth rate between 2014 – 2018. Zimbabwe has experienced an annual growth rate of 94%. Second was Malawi with 16% annual growth rate. These countries represent possible lucrative markets for South African potato producers. Potatoes imports from the world to Angola, Kuwait and United Arab Emirates have declined between 2014 – 2018 and as a result, these countries have recorded a negative growth rate of 3%, 8% and 7% respectively. Figure 30 below illustrates prospects for market diversification by South African exporters of potato seed. In 2018, Zimbabwe held a bigger market share of South African potato seed exports. In terms of market size Egypt, Algeria, Belgium, Germany, Netherlands, Italy, Spain and Morocco are the leading markets/importers of potato seed. Whilst eight countries dominate world potato imports, it is interesting to note that countries like Tanzania has experienced a higher annual growth rate in value from 2014 to 2018. Tanzania has experienced an annual growth rate of 35%. This country represents possible a lucrative market for South African potato seed producers. Potato seed imports from the world to United Kingdom, Mozambique, Lesotho and Egypt have declined from 20143 to 2018 and as a result, those countries have recorded a negative growth rate of 23%, 25%, 19% and 5% respectively.

40
Figure 29: Prospects for market diversification for potatoes exported by South Africa in 2018
Source: ITC Trade Map

41
Figure 30: Prospects for market diversification for potato seeds exported by South Africa in 2018
Source: ITC Trade Map

42
4. MARKET ACCESS Barriers to trade can be divided into tariff barriers (including quotas, ad valorem tariffs, specific tariffs and entry price systems) and non-tariff barriers (sanitary and phytosanitary measures, labels, etc.). The main markets for vegetables (including potatoes) employ various measures, both tariff and non-tariff to protect the domestic industries. Whilst many of the non-tariff measures can be justified under the auspices of issues such as health and standards, the tariff measures are increasingly under the scrutiny of the World Trade Organization (WTO), and as such are gradually being phased out. Nevertheless, exporters need to be aware of all the barriers that they may encounter when trying to get their produce on foreign shelves. 4.1 Tariff, quotas and the price entry system Tariffs are either designed to earn government revenue from products being imported or to raise the price of imports so as to render local produce more competitive and protect domestic industries. Quotas can be used to protect domestic industries from excessive imports originating from areas with some form of competitive advantage (which can therefore produce lower cost produce). Tariffs and quotas are often combined, allowing the imports to enter at a certain tariff rate up to a specified quantity. Thereafter, imports from that particular region will attract higher tariffs, or will not be allowed at all. The entry price system, which is used in many northern hemisphere markets, makes use of multiple tariff rates during different periods when domestic producers are trying to sell their produce, and lower the tariffs during their off-season. Alternatively, the tariff rate can be a function of a market price – if the produce enters at a price which is too low (and therefore likely to be too competitive), it qualifies for a higher tariff schedule. Whilst tariff regulations can be prohibitive and result in inferior market access, it is often the non-tariff barriers that restrict countries like South from successfully entering the large developed markets. Many of these barriers revolve around different types of standards, including sanitary and phytosanitary standards (SPS), food health and safety issues, food labelling and packaging, organic produce certification, quality assurance and other standards and grades. Tariffs applied by various markets to potatoes originating from South Africa during 2017 and 2018 are presented in Table 13.

43
Table 13: Tariffs applied by various export markets to potatoes from South Africa
COUNTRY
PRODUCT DESCRIPTION ( H070190)
TRADE REGIME APPLIED TARIFFS
TOTAL AD VALOREM EQUIVALENT TARIFF
APPLIED TARIFFS
TOTAL AD VALOREM EQUIVALENT TARIFF
2017 2018
Angola Potatoes fresh or chilled MFN duties (Applied) 50.00% 50.00% 50.00% 50.00%
Botswana Potatoes fresh or chilled Intra SACU rate 0.00% 0.00% 0.00% 0.00%
Canada Fresh or chilled potatoes (excluding seed)
MFN duties (Applied) 4.94$/Ton 0.47% 4.94$/Ton 0.47%
Congo Potatoes fresh or chilled MFN duties (Applied) 35.00% 35.00% 35.00% 35.00%
China Fresh or chilled potatoes (excluding seed)
MFN duties (Applied) 13.00% 13.00% 13.00% 13.00%
DRC Potatoes fresh or chilled MFN duties (Applied) 10.00% 10.00% 10.00% 10.00%
EU Potatoes for manufacture of starch, fresh or chilled
Preferential tariff for South Africa 0.00% 0.00% 0.00% 0.00%
Egypt Potatoes fresh or chilled MFN duties (Applied) 5.00% 5.00% 5.00% 5.00%
EU Fresh or chilled potatoes from 1 January to 30 June
Preferential tariff for South Africa 0.00% 0.00% 0.00% 0.00%
Ghana Potatoes fresh or chilled Preferential tariff for South Africa 35.00% 35.00% 0.00% 0.00%
India Potatoes fresh or chilled MFN duties (Applied) 30.00% 30.00% 30.00% 30.00%
Philippines Potatoes fresh or chilled MFN duties (Applied) 40.00% 40.00% 40.00% 40.00%
Malawi Potatoes fresh or chilled Preferential tariff for South Africa 0.00% 0.00% 0.00% 0.00%
Eswatini Fresh or chilled potatoes Intra SACU rate 0.00% 0.00% 0.00% 0.00%
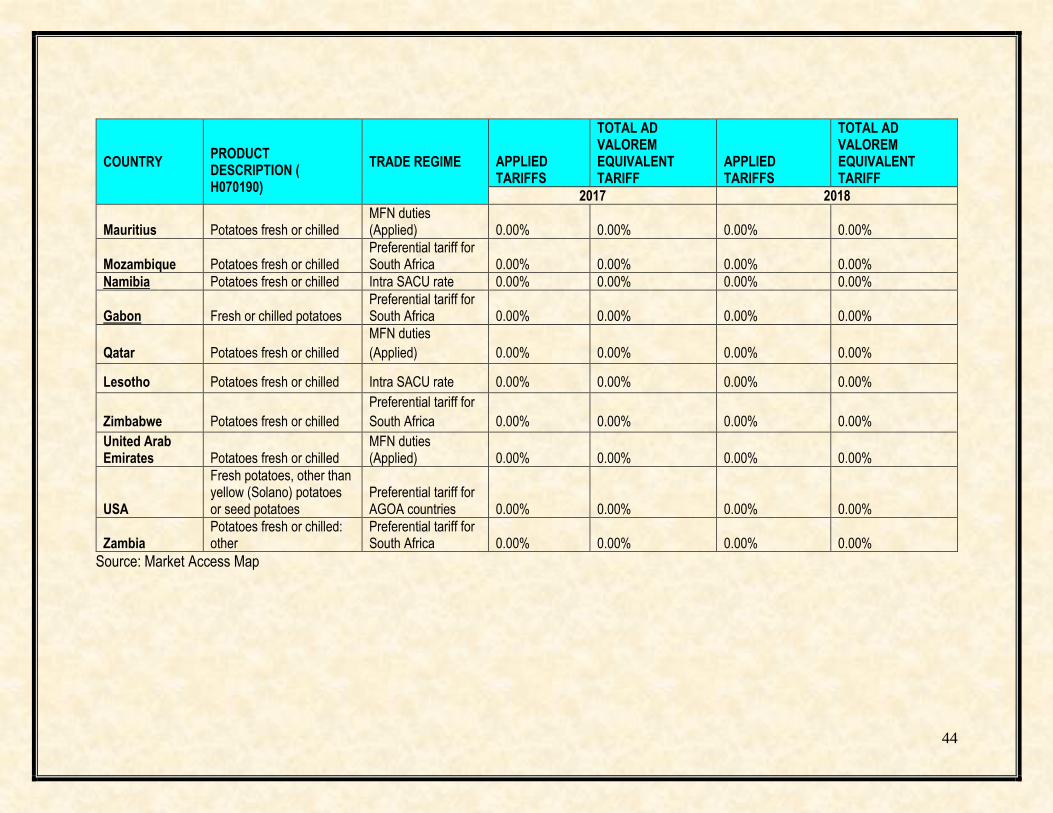
44
COUNTRY
PRODUCT DESCRIPTION ( H070190)
TRADE REGIME APPLIED TARIFFS
TOTAL AD VALOREM EQUIVALENT TARIFF
APPLIED TARIFFS
TOTAL AD VALOREM EQUIVALENT TARIFF
2017 2018
Mauritius Potatoes fresh or chilled MFN duties (Applied) 0.00% 0.00% 0.00% 0.00%
Mozambique Potatoes fresh or chilled Preferential tariff for South Africa 0.00% 0.00% 0.00% 0.00%
Namibia Potatoes fresh or chilled Intra SACU rate 0.00% 0.00% 0.00% 0.00%
Gabon Fresh or chilled potatoes Preferential tariff for South Africa 0.00% 0.00% 0.00% 0.00%
Qatar Potatoes fresh or chilled
MFN duties
(Applied) 0.00% 0.00% 0.00% 0.00%
Lesotho Potatoes fresh or chilled Intra SACU rate 0.00% 0.00% 0.00% 0.00%
Zimbabwe Potatoes fresh or chilled
Preferential tariff for
South Africa 0.00% 0.00% 0.00% 0.00%
United Arab Emirates Potatoes fresh or chilled
MFN duties (Applied) 0.00% 0.00% 0.00% 0.00%
USA
Fresh potatoes, other than yellow (Solano) potatoes or seed potatoes
Preferential tariff for AGOA countries 0.00% 0.00% 0.00% 0.00%
Zambia Potatoes fresh or chilled: other
Preferential tariff for South Africa 0.00% 0.00% 0.00% 0.00%
Source: Market Access Map
45
South Africa has a preferential trading agreement (PTA) with the EU and they apply zero tariffs to potatoes originating from South Africa. Furthermore, South Africa has access to the US market under the AGOA, which significantly lowers the tariff barriers for South African potatoes. In reality, the tariffs are likely to be far lower for South Africa when considering the preferential agreements, but at the same time, most tariff structures are particularly complex, with quotas, seasonal tariffs and specific tariffs (an amount per unit than rather than a percentage of value) all contributing to many different tariff lines and often higher duties payable than one might have anticipated initially. One must also bear in mind that most tariffs are designed to protect domestic industries, and as such are likely to discriminate against those attempting to compete with the domestic producers of that country. One can also see that certain countries wishing to protect their local industries (presumably in which they feel vulnerable or where a large number of farmers are employed) will raise prohibitive levels. China is the largest potato producer and it still applies 13% tariff for potatoes originating from South Africa. India is the second largest potato producer and it still applies a high tariff of 30% to potatoes originating from South Africa. During 2018, a notable 37.5% of South Africa’s potato exports were exported to Mozambique, 17.7% to Namibia, 17.4% to Botswana and 7.6% to Lesotho. Namibia, Lesotho and Botswana apply 0.00% Intra-SACU tariff, to potatoes originating from South Africa. Angola is still highly protected by a tariff of 50%, despite SADC- Free Trade Agreement (FTA). Mozambique and Zimbabwe have reduced their tariff to 0%, thereby complying with SADC- Free Trade Agreement (FTA). Tariffs applied by various markets to potato seeds originating from South Africa during 2017 and 2018 are presented in Table 14. South Africa has a preferential trade agreement (PTA) with the EU and no tariff is applied for potato seeds from South Africa. Furthermore, South Africa has access to the US market under the AGOA, which significantly lowers the tariff barriers for South African potato seed. During 2018, South Africa exported potato seeds mainly to Zimbabwe (53.9 %), Namibia (12.6 %), Botswana (9.4 %) and Zambia (7.8 %). Zambia and Zimbabwe apply 0.00% preferential tariff due to SADC- Free Trade Agreement (FTA). Namibia and Botswana apply 0.00% Intra-SACU rate, to seed potatoes originating from South Africa. Mozambique has reduced its tariff from 2.50% tariff to 0.00% tariff to potato seed originating from South Africa. Tanzania has experienced annual growth of 35% imports and this market is protected by 40% tariff. In reality, the tariffs are likely to be far lower for South Africa when considering the preferential agreements, but at the same time, most tariff structures are particularly complex, with quotas, seasonal tariffs and specific tariffs (an amount per unit rather than a percentage of value) all contributing to many different tariff lines and often higher duties payable than one might have anticipated initially. One must also bear in mind that most tariffs are designed to protect domestic industries, and as such are likely to discriminate against those attempting to compete with the domestic producers of that country. One can also see that certain countries wishing to protect their local industries (presumably in which they feel vulnerable or where a large number of farmers are employed) will raise prohibitive levels. India still has reasonably high tariffs of 30% for potato seed originating from South Africa.

46
Table 14: Tariffs applied by various export markets to potato seed from South Africa
COUNTRY PRODUCT DESCRIPTION (070110)
TRADE REGIME
APPLIED TARIFFS
TOTAL AD VALOREM EQUIVALENT TARIFF
APPLIED TARIFFS
TOTAL AD VALOREM EQUIVALENT TARIFF
2017 2018
Algeria Seed potatoes: fresh or chilled General tariff 5.00% 5.00% 5.00% 5.00%
Angola Seed potatoes: fresh or chilled MFN duties (Applied) 50.00% 50.00% 50.00% 50.00%
Canada Seed potatoes: fresh or chilled MFN duties (Applied) 4.94$/ton 0.48% 4.94$/ton 0.48%
Botswana Seed potatoes Intra SACU rate 0.00% 0.00% 0.00% 0.00%
DRC Seed potatoes: fresh or chilled MFN duties (Applied) 5.00% 5.00% 5.00% 5.00%
EU Seed potatoes Preferential tariff for South Africa 0.00% 0.00% 0.00% 0.00%
Ghana Seed potatoes MFN duties (Applied) 5.00% 5.00% 5.00% 5.00%
Democratic Republic of
the Congo Seed potatoes MFN duties (Applied) 5.00% 5.00% 5.00% 5.00%
Malawi Seed potatoes
Preferential tariff for South
Africa 0.00% 0.00% 0.00% 0.00%
Egypt Seed potatoes MFN duties (Applied) 2.00% 2.00% 2.00% 2.00%
Malaysia Seed potatoes MFN duties (Applied) 2.50% 2.50% 2.50% 2.50%
Morocco Seed potatoes MFN duties (Applied) 0.00% 0.00% 0.00% 0.00%
Lesotho Seed potatoes Intra SACU rate 13.00% 13.00% 13.00% 13.00%
Mozambique Seed potatoes
Preferential tariff for South
Africa 0.00% 0.00% 0.00% 0.00%
India Seed potatoes MFN duties (Applied) 30.00% 30.00% 30.00% 30.00%
China Seed potatoes MFN duties (Applied) 0.00% 0.00% 0.00% 0.00%

47
COUNTRY PRODUCT DESCRIPTION (070110)
TRADE REGIME
APPLIED TARIFFS
TOTAL AD VALOREM EQUIVALENT TARIFF
APPLIED TARIFFS
TOTAL AD VALOREM EQUIVALENT TARIFF
2017 2018 Namibia Seed potatoes Intra SACU rate 5.00% 5.00% 5.00% 5.00%
Swaziland Seed potatoes Intra SACU rate 19.30% 19.30% 19.30% 19.30%
Senegal Seed potatoes MFN duties (Applied) 0.00% 0.00% 0.00% 0.00%
Turkey Seed potatoes MFN duties (Applied) 0.00% 0.00% 0.00% 0.00%
USA Seed potatoes: fresh or chilled
Preferential tariff for AGOA countries 0.00% 0.00% 0.00% 0.00%
Zambia Seed Potatoes Preferential tariff for South Africa 0.00% 0.00% 0.00% 0.00%
Zimbabwe Seed Potatoes
Preferential tariff for South
Africa 0.00% 0.00% 0.00% 0.00%
Source: Market Access Map

48
5. DISTRIBUTION CHANNELS There are roughly three distinct sales channels for exporting vegetables. One can sell directly to an importer with or without the assistance of an agent. One can supply vegetables combined, which will then contract out importers/marketers and try to take advantage of economies of scale and increased bargaining power. At the same time combined vegetables might also supply large retail chains. One can also be a member of a private or cooperative export organization which will find agents or importers and market the produce collectively. Similar to combined vegetables, an export organization can either supply wholesale market or retail chains, depending on particular circumstances. Export organizations will wash, sort and package the produce. They will also market the goods under their own name or on behalf of the member, which includes taking care of labelling, bar-coding, etc. Most of the time, export organizations will enter into a collective agreements with freight forwarders, negotiating better prices and services (more regular transport, lower peak season prices, etc.). Some countries have institutions that handle all the produce (membership compulsory) and sell only to a restricted number of selected importers. Agents will establish contacts between producers/export organizations and buyers in the importing country, and will usually take between 2% and 3% commission. In contrast, an importer will buy and sell his/her own capacity, assuming the full risk (unless on consignment). They will also be responsible for clearing the produce through customs, packaging and assuring label/quality compliance and distribution of the produce. Their margins lie between 5% and 10%. The contract importers of fruit combines market and distribute the produce of the combines, clear it through customs and in some cases treat and package it. Only few exporters have long term contracts with wholesale grocers who deliver directly to retail shops, but with the increasing importance of standards (EurepGap, Global Gap, etc.) and the year round availability of fruit, the planning of long term contractual relationship is expected to increase. 6. LOGISTICS
6.1 Mode of transport The transport of vegetables falls into two categories, namely ocean cargo and air cargo. Ocean cargo takes much longer to reach the desired, location but costing considerably less. The choice of transportation method depends, for most parts on the fragility of the produce and how long it can remain relatively fresh. With the advent of technology and container improvements, the feasibility, cost and attractiveness of sea transport have improved considerably. With the increased exports by South Africa, the number and the regularity of maritime routes have increased. These economies of scale could benefit South Africa if more producers were to become exporters and take advantage of the various ports which have special capabilities in handling fruit produce (Durban new fruit terminal). Potato South Africa has held several transformation Symposiums, with an aim to create a platform for emerging Black potato producers and community project leaders to meet, discuss challenges, find solutions and to plan ahead. It also create a platform for industry role players in the potato value chain to meet and be part of the solution in assisting emerging Black potato producers to progress to fully fledged commercial potato producers.

49
6.2 Cold chain management
Cold chain management is crucial when handling perishable products, from the initial packing houses to the refrigerated container trucks that transport the produce to the shipping terminals, through to the storage facilities at these terminals, onto actual shipping vessels and containers, and finally on to the importers and distributors that must clear the produce and transport it to the markets/retail outlets. For every 10 Degree Celsius increase above the recommended temperature, the rate of respiration and ripening of produce can increase twice or even thrice. Related to this are increasing important traceability standards which require an efficient controlled supply chain and internationally accepted business standards. 6.3 Packaging Packaging can also play an important role in ensuring safe and efficient transport of a product and conforming to handling requirements, uniformity recyclable material specifications, phytosanitary requirements, proper storage needs and even attractiveness for marketing purposes. The potato industry currently relies on two suppliers of paper for packaging of potatoes. The local producer of paper namely Sappi, supplies the bulk of the paper with Gerber Paper Products importing the balance mostly from Scandinavian countries and from Brazil. All the paper complies with the strict specifications of the Department of Agriculture, Forestry and Fisheries. The Packaging Forum takes care of the supply of paper and packaging to the industry and also ensures that the packaging is manufactures according to the specifications prescribed by Department of Agriculture, Forestry and Fisheries. 6.4 Quality control The potato industry is one the few fresh produce industries currently in South Africa, which has a full quality assurance service at all the fresh produce markets in the country. The potato industry acknowledges the importance of this service and recognizes the added benefit that results from this, such as traceability of the product. The quality assurance is provided to the potato industry by PROKON (Product Control for Agriculture) an article 21 company. PROKON is charged with establishing and maintaining product quality for the benefit of all, from farmers to the potato consumer. 7. TRANSFORMATION Potatoes South Africa has been involved in transformation projects over the years and the results are slowly beginning to bear fruits. The number of hectares of potatoes planted by black farmers is on the rise and there are farmers who have potential to farm commercially and they are currently receiving support from Potatoes South Africa. During the past years, Potatoes South Africa focused on the following projects in contribution to potato industry transformation: Enterprise development, small grower development program, tertiary skills pipeline, farm based training and Black Economic Empowerment (BEE) Baseline study.

50
8 BUSINESS OPPORTUNITIES AND CHALLENGES
8.1 Business opportunities Two major shifts in production and processing of potatoes are expected to have a significant impact on the South African potato industry in the future. The first is the continuation of the shift from the dry land production to the irrigated production. Over and under production during good and poor seasons will be eliminated, a more and constant supply and, therefore, greater price stability within the subsector are anticipated. The second shift is that over the years, the demand for potatoes locally has grown and manifested by the increase in the sales of potatoes on the fresh produce markets, as well as the increase in the volume of potatoes taken in for processing. This growth could imply a move away from traditional staple food such as maize, especially in the urban areas. An increasing number of countries in sub-Saharan Africa are reportedly also turning to South Africa as a reliable source of food. This may therefore considerably increase the possible market size for South African potatoes. 8.2 Challenges The constraints and market failures hinders investment, growth and employment in the industry. The main challenge facing the industry is to maintain the quality of the produce for exports so that quantities reach destinations in a desired form. It is also very expensive to keep fresh potatoes on refrigerated transport especially where the distance is very long. Other challenges for the industry include:
Increased production for the supply of international markets while at the same time to decrease production cost and to make profit.
Protection of the local potato industry against dumping practices and protection against imports from subsidized countries.
Phyto-sanitary requirements for the European markets.
Climatic conditions that affect production.
Packaging paper price on the world market.
Rapid escalation in production costs especially fuel.
Lack of infrastructure in remote rural areas in accessing markets, especially for small-scale producers.
Water for agriculture. South Africa is located in semi-arid part of the world with an average rainfall of 450mm per annum – well below the world average of approximately 860mm per year. As a result, South Africa’s water resources are, in global terms, extremely limited. This is of special importance to the potato sector, which is heavily dependent on water for irrigation given that 70% to 80% of all potatoes are produced under irrigation.
Cheap imports have the potential to jeopardize domestic processing industry.
Frequent labour unrest.
New exotic pest (Tomato Leaf Miner, Tuta absoluta and Fall Army Worm)

51
Figure 31: South Africa potato value chain
Source: Potatoes South Africa

52
9. SOUTH AFRICAN POTATO MARKET VALUE CHAIN The following discussion will focus on the main segments of the potato value chain (see Figure 31) which are the informal sector and the formal sector. 9.1 Informal sector According to Potatoes South Africa, during 2017 informal traders were responsible for the distribution of 66% of all fresh potatoes sold on the fresh produce markets and for 23% of all potatoes sold, including informal trade from fresh produce markets, urban and rural sales. Currently an unknown number of informal traders purchase 10kg pockets from fresh produce markets, or directly from producers, repackage them into 1kg or 2kg plastic bags and sell these (or just sell the potatoes loose) in a number of settings in both rural and urban areas. This form of trading in urban areas has reportedly emerged as a direct result of changes in urban eating habits and urbanization. 9.2 Formal sector The formal sector consists primarily of the large retailers in South Africa, such as Fruit and Veg City; Pick ‘n Pay, Shoprite-Checkers, Spar and Woolworths, and small retailers such as greengrocers and independent stores. During 2018, 36% of all produced potatoes were distributed through formal markets, excluding any processed potatoes products that also go through normal trading channels. The formal trade in potatoes generally concentrates on the sale of high quality fresh potatoes, either loose or in smaller packaging. Some of the formal traders undertake their own packaging, branding, advertising and sometimes even semi-processing of fresh potatoes through direct purchases from producers, through dedicated wholesalers and from fresh produce markets.

53
10. ACKNOWLEDGEMENTS 10.1 The following industries are acknowledged: 10.1.1 Potato South Africa Private Bag X 135
Pretoria 0001 Tel (012) 349 1906/7 Fax: (012)349 2641/7 www.potatoes.co.za
10.1.2 National Department of Agriculture, Forestry and Fisheries
Directorate: Statistics and Economic Analysis Private X 246 Pretoria 0001 Tel (012) 319 8454 Fax (012) 319 8031 www.daff.gov.za
10.1.3 Perishable Export Control Board
P. O. Box 15289 Panorama 7506 Tel (021) 930 1134 Fax (021) 930 6868 www.ppecb.com
10.1.4 Trade and Industrial Policy Strategies (TIPS)
P. O. Box 11214 Hatfield 0028 Tel (012) 431 7900 Fax (012) 431 7910 www.tips.org.za
10.1.5 National Agricultural Marketing Council (NAMC)
Private Bag X 935 Pretoria 0001 Tel (012) 341 1115 Fax: (086) 626 4769 www.namc.co.za
10.1.6 International Trade Centre (ITC)
www.trademap.org

54
10.1.7 Product Control for Agriculture P.O. Box 24026 Gezina 0031 Tel (012) 325 4579 Fax (012) 325 4585 www.prokonsa.co.za
10.2 The main mixed vegetable manufacturers. 10.2.1 Dimpho Fresh Food
P. O. Box 3746 Vereeniging 1930 Tel (016) 421 3840 Fax (021) 422 1400
10.2.2 Golden Harvest
P. O. Box 1206 George 6530 Tel (044) 873 3716 Fax (044) 873 3917
10.2.3 McCains
P. O. Box 231 Springs 1560 Tel (011) 365 3000 Fax (044) 818 4096
10.3 The main French fries (fresh) manufacturers. 10.3.1 Dimpho Fresh Food
P. O. Box 3746 Vereeniging 1930 Tel (016) 421 3840 Fax (021) 422 1400
10.3.2 Errol Veg (direct)
P. O. Box 44294 Jeppes Town Tel (011) 365 3000 Fax (044) 818 4096

55
10.3.3 Mannic Chips Edenvale Tel (011) 452 6894
10.3.4 Rooipoort Fresh Products
P. O. Box 25212 Monument Park 0181 Tel (012) 326 1388 Fax (021) 326 3724
10.3.5 Super Chip
P. O. Box 150 Kraaifontein 7569 Tel (021) 884 4708 Fax (021) 884 4102
10.4 The main French fries (frozen) manufacturers. 10.4.1 McCains
P. O. Box 231 Delmas 2210 Tel (013) 665 1690 Fax (013) 665 1275
10.4.2 Lamberts Bay Canning Co.
P. O. Box 1 Lambertsbay 8130 Tel (027) 432 1101 Fax (027) 432 2002
10.4.3 Mine Corp Services
P. O. Box 69 Kliprivier 1871 Tel (011) 903 8963 Fax (011) 903 8910
10.5 The main canned food manufacturers. 10.5.1 Langeberg Koop
P. O. Box 1460 Boksburg 1460

56
Tel (011) 914 221 Fax (011) 899 8498
10.5.2 Giants Foods
P. O. Box 2007 Makhado 0920 Fax (015) 894 8261
10.6 The main crisps manufacturers. 10.6.1 Dowmont Foods
P. O. Box 1386 New Germany 3620 Tel (031) 700 5129 Fax (031) 700 4749
10.6.2 Frimax
P. O. Box 1047 Pietermaritzburg 3209 Tel (032) 233 8616 Fax (032) 233 8622
10.6.3 Kavalier Foods
P. O. Box 1627 Germiston 1400 Tel (011) 873 2113 Fax (011) 825 2932
10.6.4 L & C Messaris
P. O. Box 105 Elsiesrivier 7480 Tel (021) 592 5300 Fax (021) 591 4018
10.6.5 Willards
P. O. Box 251 Rosslyn 0200 Tel (012) 529 5300 Fax (012) 541 1928

57
10.6.6 Poco Foods P. O. Box 251 Bethal 2310 Tel (017) 647 1081 Fax (017) 647 6107
10.6.7 Simba Quix
P. O. Box 99 Isando 1600 Tel (011) 974 5435 Fax (011) 392 1294
Disclaimer: This document and its contents have been compiled by the Department of Agriculture, Forestry and Fisheries for the purpose of detailing the potato industry. Anyone who uses this information does so at his/her own risk. The views expressed in this document are those of the Department of Agriculture, Forestry and Fisheries with regard to the agricultural industry, unless otherwise stated. The Department of Agriculture, Forestry and Fisheries therefore, accepts no liability that can be incurred resulting from the use of this information.