Embed Size (px)
Citation preview
i
A PROGRAMMATIC ANALYSIS OF A
NEWBORN HEARING SCREENING PROGRAM
FOR EVALUATION AND IMPROVEMENT
by
VICKIE RAE THOMSON
B.S. University of Northern Colorado, 1977
M.A. University of Northern Colorado, 1979
A theses submitted to the Faculty of the Graduate School of the
University of Colorado in partial fulfillment of the requirements for the degree of
Doctor of Philosophy Department of Speech, Language and Hearing Sciences
2007
ii
This thesis entitled:
A Programmatic Analysis of a Newborn Hearing Screening Program
for Evaluation and Improvement
written by Vickie Rae Thomson
has been approved for the
Department of Speech, Language and Hearing Sciences
Christine Yoshinaga-Itano, Ph.D.
Committee Chairperson
Kathryn H.Arehart, Ph.D. Committee Member
Date:
The final copy of this thesis has been examined by the signatories, and we find that both the content and the form meet acceptable presentation
standards of scholarly work in the above mentioned discipline.
UC HRC Protocol #0207.5
iii
Thomson, Vickie Rae
A Programmatic Analysis of a Newborn Hearing Screening Program for
Evaluation and Improvement
Thesis directed by Professor Christine Yoshinaga-Itano
ABSTRACT
Detailed analysis of the Colorado Newborn Hearing Screening was performed to
identify factors that were related to infants not obtaining the follow-up outpatient
rescreen for the birth cohort in 2005. This analysis has shown that infants who
are born in hospitals with rescreen rates <79% are as much 7 times less likely to
receive the outpatient rescreen and infants born in hospitals with rescreen rates
between 80-90% are twice as likely not receive the outpatient rescreen as
compared to infants born in hospitals with rescreen rates >90%. Infants born in
hospitals that have an audiologist involved with the program are 27% more likely
to receive the outpatient rescreen.
Twenty-six percent of infants confirmed with a hearing loss between 2002 and
2005 were not identified until after the age of six months despite research that
identification before six months is critical to the development of normal
language. High risk factors, gender, ethnicity, mothers education, mothers age at
birth, nursery level, degree, and type of hearing loss did not yield any significant
results.
Providing audiology support may improve newborn hearing screening programs
to decrease the rescreen rates and improve the age of identification.
iv
DEDICATION
This work is dedicated to my loving and supportive family, George,
Aubree and Valerie. They made this journey possible with their love,
encouragement, and patience. I am forever grateful to them.
I also would like to dedicate this to my mother, Phyllis Rahe. I was
lucky to be born on her birthday. She is a wonderful mother and she inspired me
to preserve through this challenge.
v
ACKNOWLEDGMENTS
Sincere appreciation is given to all my committee members for their
contributions, support, time, and encouragement. Marion Downs is an inspiration
professionally and personally. Her devotion to newborn hearing screening for
over 50 years instilled in me strength to see her dream come true. Her positive
attitude about life inspires me to get out of bed every morning and walk! Christie
Yoshinaga-Itano provided ceaseless encouragement and support which gave me
the spirit to get through those days when I was sure I would not be able to finish.
Sandy has been a true friend and colleague who taught me to believe in myself
and that I could make it through this journey with work and a family. Deborah
Hayes has been my mentor as a student and a clinical audiologist. Her dedication
to the profession raises the bar to make us the best audiologists we can be.
Kathryn Arehart provided the encouragement to pursue a Ph.D. to make newborn
hearing screening a program that demonstrated evidence based practices. Bill
Letson, my public health mentor who saw the big picture of data integration.
Together we pursued CDC funding to make data integration a reality in public
health. Finally, Matthew Christensen spent many hours teaching me statistics and
SAS software. Without his patience and commitment I would never have been
able to accomplish this analysis.
I am grateful to Kathy Watters and Al Mehl, my friends and colleagues
who had an idea that newborn hearing screening was feasible. They encouraged
vi
me to start the first program at Boulder Community Hospital and my life has
changed since that day.
To Karen Carpenter, my longtime audiology colleague and best friend
who thought I should pursue a Ph.D. 20 years ago. Her encouragement and
support over the years of my career can not be expressed with enough gratitude.
I am so blessed to have so many colleagues and friends that encouraged
my work over the years that this acknowledgment could be as long as the
dissertation itself.
vii
CONTENTS
CHAPTER
I. INTRODUCTION ………………………………………….1
Incidence of Hearing Loss in Children……………2
Historical Perspective of Universal Newborn
Hearing Screening………………………………....3
The Importance of Early Identification……………4
The Colorado Infant Hearing Program…………… 5
Purpose of this Study………………………………9
II. REVIEW OF THE LITERATURE………………………... 10
Principles of Screening and the Rationale for
Newborn Hearing Screening…………………….. 12
The Development of Early Hearing and Detection
Programs …………………………………………23
The Colorado Infant Hearing Program………… 30
III. METHODS AND ANALYSIS …………………………… 37
Question 1……………………………………….. 37
Subjects…………………………………38
Procedure……………………………….38
Data Collection…………………………40
Data Analysis………………………….. 42
Question 2………………………………………...43
Subjects…………………………………44
viii
Procedure……………………………….44
Data Analysis………………………….. 45
IV. RESULTS…………………………………………………..48
Question 1………………………………………...48
Demographic Variables………………...48
Hospital Variables……………………...51
Analysis………………….……………..55
Question 2
Demographic Variables………………...74
Analysis………………….……………..77
V. DISCUSSION………………………………………………80
VI. APPENDIX ……………………………………………….100
VII. BIBLIOGRAPHY…………………………………………108
ix
LIST OF TABLES
Table
1. Coding for EBC demographic data…………………………….40
2. Hospital variables obtained from the Colorado Infant
Hearing database …………………………………………..41
3. Characteristics of hospital programs for analysis …………41
4. Coding for level of nursery, audiologist affiliated,
level of audiology involvement……………………………42
5. Coding for who provides the screen, type of equipment
used, determination of location of outpatient rescreen……..43
6. Coding for setting up the appt for the rescreen and
the charge for the rescreen………………………………….43
7. Coding for the analysis of age of ID, presence of a
high risk factor, mother’s age, mother’s education and
level of hospital care………………………………………..46
8. Coding for ICD 9 Codes……………………………………46
9. Ethnicity and race by cohort by percent and N……………..49
10. Infant variables by cohort by percentage and N…………….50
11. Mother variables by cohort in percentages and N…………..50
12. Hospital by births and nursery level………………………...51
13. Cohort by audiologist and level of audiology involvement.. 52
14. Technology, refer rates, and who performed the screens by
cohort………………………………………………………..53
x
15. Follow-up appointment by cohort………………………….54
16. Analysis of Variance for Entire Birth Cohort and Failed
Screen Cohort by Demographic Variable…………………. 55
17. Variables and Coding for the Logistic Regression Model… 56
18. Logistic regression odds ratios and confidence intervals for
each variable predicting whether an infant receives the
outpatient follow-up screen…………………………………58
19. Explanation of the Odds Ratio for Variables in the
Regression Model…………………………………………...59
20. Hospital birth rate by variables in percentage and N for
infants who failed the to receive the outpatient rescreen….. 61
21. Regression Models with Odds Ratios, 95% CI,
and P Values………………………………………………...73
22. Means for the variables in the regression model……………74
23. Percentage and N for degree and type of hearing loss……...74
24. Percentage and N by High Risk Factors………………………… 75
25. Percentage and N by risk factors and laterality..................... 75
26. Coding for age of identification…………………………….76
27. Risk factor by age of identification…………………………76
28. Degree, type and laterality by age of identification……….. 77
29. Logistic regression odds ratios and confidence intervals for
each variable predicting age of identification before and after
six months of age………………………………………… 78

xi
30. Means for age of identification by month and variable…….79
xii
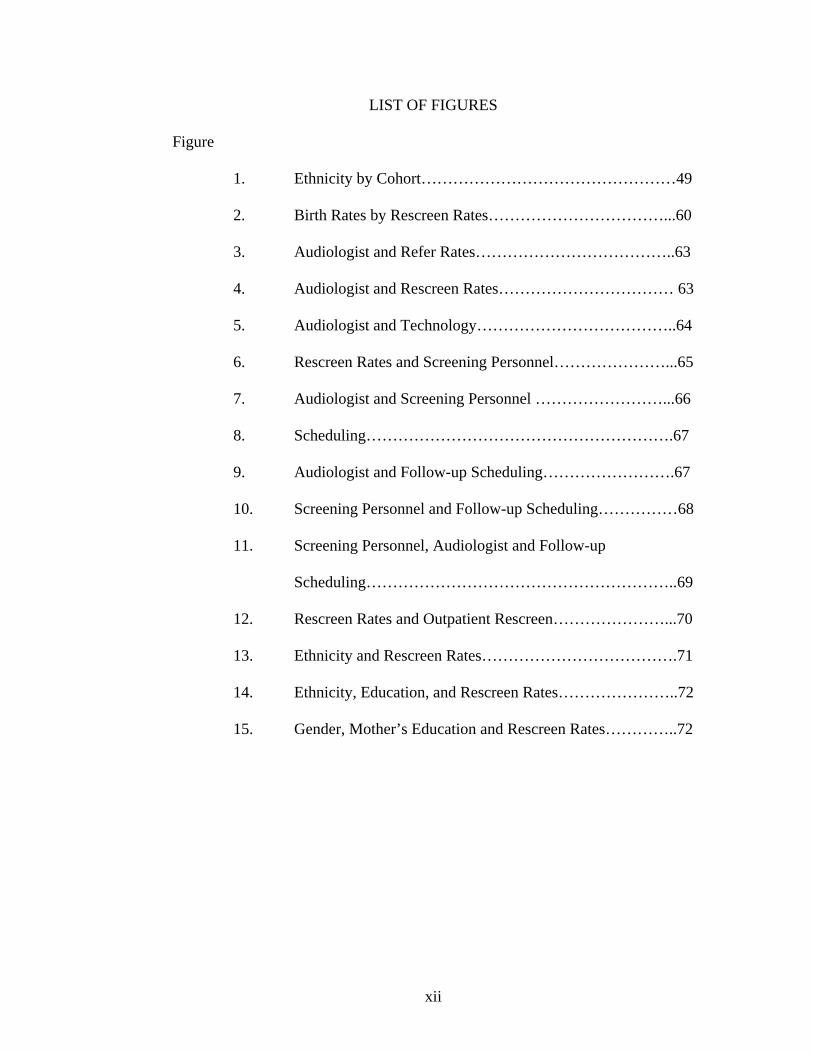
LIST OF FIGURES
Figure
1. Ethnicity by Cohort…………………………………………49
2. Birth Rates by Rescreen Rates……………………………...60
3. Audiologist and Refer Rates………………………………..63
4. Audiologist and Rescreen Rates…………………………… 63
5. Audiologist and Technology………………………………..64
6. Rescreen Rates and Screening Personnel…………………...65
7. Audiologist and Screening Personnel ……………………...66
8. Scheduling………………………………………………….67
9. Audiologist and Follow-up Scheduling…………………….67
10. Screening Personnel and Follow-up Scheduling……………68
11. Screening Personnel, Audiologist and Follow-up
Scheduling…………………………………………………..69
12. Rescreen Rates and Outpatient Rescreen…………………...70
13. Ethnicity and Rescreen Rates……………………………….71
14. Ethnicity, Education, and Rescreen Rates…………………..72
15. Gender, Mother’s Education and Rescreen Rates…………..72
1
CHAPTER 1
Introduction
The principles of screening hearing at birth have proven to be the most
effective means to ensure early identification, habilitation, and a satisfactory outcome
for normal language development in children. In 1967 Downs and Sterritt described a
universal newborn hearing screening program in seven Denver hospitals using a signal
generator and observing the behavioral responses of infants. Such subjective
techniques were replaced when electro-physiological instrumentation became
available in the 1980’s. In 1998 all 54 of Colorado birthing hospitals had
implemented a universal newborn hearing screening program using objective
screening technology (either automated auditory brain stem response or otoacoustic
emissions screening). Thirty-nine states have mandated universal newborn hearing
screening, and all states and territories have an Early Hearing Detection and
Intervention (EHDI) program in place (National Center for Hearing Assessment and
Management, 2006), thus making universal newborn hearing screening the standard of
care in the United States.
Public health departments manage EHDI programs. The role of public health
for population-based screening is to ensure comprehensive systems from screening
and into appropriate and timely interventions. The purpose of this research is to
identify what factors may be associated with infants who are not receiving a follow-up
rescreen and who are not getting into diagnosis, by the recommended time of three
2
months of age. Identifying potential factors that are related to these questions will
assist in improving the EDHI program for infants and their families.
Incidence of Hearing Loss in Children
Congenital hearing loss has recently been recognized as one of the most
common birth defect present in newborns, with a prevalence of permanent hearing loss
ranging from 2-3/1000 live births (Vohr, 2003). The Centers for Disease Control
found an incidence of 1.09/1000 with permanent hearing loss based on data submitted
from 44 state EHDI programs (Centers for Disease Control, 2006). The latter lower
incidence of hearing loss utilized in this study is attributed to evolving data
management systems that more accurately can follow and track infants. The definition
of permanent hearing loss identified in newborn screening programs varies from a
minimum level of 40dBHL in the United Kingdom (Kennedy, McCann, Campbell,
Kimm, and Thornton, 2005) to 35dBHL in the United States (Morton and Nance,
2006). The Joint Committee on Infant Hearing (JCIH, 2000) defines the target
population for infant screening programs as unilateral or bilateral permanent hearing
loss averaging 30-40dB in the speech frequency range. Conductive hearing losses, as
a result of anomalies to the outer or middle ear, are also included in the targeted
screening population.
In a 2001 report by the Colorado Department of Education, “A Blueprint for
Closing the Gap,” 1,385 children were deaf or hard-of-hearing, age’s birth to 21 in
Colorado. Age of onset was less than 12 months for 75% of the children (CDE, 2001).
This would indicate that 346 children were identified after the newborn period. The
discrepancy between those identified from newborn hearing screening and those in the
3
school population is two-fold. Some infants who pass the newborn hearing screen may
have mild or atypical audiometric configurations not detected by current screening
technologies. In a recent article by Johnson et al. (2005) the authors suggested that a
two-stage screening with otoacoustic emissions (OAE) followed by automated
auditory brainstem response (AABR) may be missing 23% of mild and unilateral
congenital hearing loss. The NIH study (Norton, Gorga, Widen et al., 2000) also
concluded that some hearing losses are missed with any of the available technologies.
In addition there are infants who pass and will develop late onset hearing loss. The
JCIH (2000) recommends the continued use of high-risk criteria to capture late onset
hearing loss. Cytomegalovirus and recessive genetic factors, which are typically not
screened for at birth, can also result in a significant cause of late onset hearing loss.
Historical Perspective of Universal Newborn Hearing Screening
Hearing loss is not observable and in the past was often not detected until the
speech and language was significantly delayed. Severe hearing losses were not
typically detected until age two and milder forms not until school age. National
efforts to ameliorate the delay in the identification of hearing loss began in 1969
(Northern and Downs, 1991) when a national committee was formed that later became
the Joint Committee on Infant Hearing (JCIH). Initially, the committee recommended
screening newborns for hearing loss by using high-risk criteria. The JCIH expanded
the high-risk criteria from five factors (JCIH, 1973) to seven factors (JCIH, 1982) and
then to ten factors (JCIH, 1990). High-risk criteria included family history of
childhood hearing impairment, congenital perinatal infection, anatomic malformations
involving the head or neck, birth weight less than 1500 grams, hyperbilirubinemia at a
4
level exceeding indication for exchange transfusion, ototoxic medications, bacterial
meningitis, low apgar scores at 5 minutes, prolonged mechanical ventilation, and
stigmata associated with a syndrome known to include sensorineural hearing loss.
Infants identified with any of these criteria were to be referred for audiologic
evaluation to achieve an accurate assessment. The use of a high-risk register was later
proved to have high error rates, as 50% of congenital hearing losses were missed, and
the average age of identification was two years of age. This screening method did not
support optimal early intervention with hearing aids and appropriate therapy due to
late identification. The challenges of high-risk registries are further addressed in the
literature review.
In 1989 the Maternal and Child Health Bureau and the Department of
Education funded a demonstration project in Rhode Island and Hawaii using
otoacoustic emissions screening (White and Behrens, 1993). The findings of this
project resulted in the National Institutes of Health Consensus Development
Conference and its endorsement of universal newborn hearing screening. The U.S.
Department of Health and Human Services released the Healthy People 2000 initiative
in 1990 and objective 17.16 was to reduce the age at which children with significant
hearing impairment were identified at 12 months of age or less. The Joint Committee
on Infant Hearing 1994 Position Statement also endorsed the goal of universal
detection of infants with hearing loss as early as possible. The current recommended
protocol by the Joint Committee Year 2000 Position Statement is defined as universal
screening with objective technology by one month of age, identification by three
months of age, leading to intervention by 6 months of age. Healthy People 2010
5
Objective 28-11 states “Increase the number of infants who are screened for hearing
loss by one month, have audiologic evaluation by 3 months, and are enrolled in
appropriate early intervention by six months.”
The Importance of Early Identification
A number of infants identified through early universal newborn hearing
screening programs provided the evidence to demonstrate that early identification and
intervention of children who were deaf or hard of hearing could actually achieve
nearly normal language acquisition by three years of age (Yoshinaga-Itano, Sedey,
Coulter and Mehl, 1998). The researchers analyzed many demographic factors (e.g.
degree of hearing loss, race/ethnicity, SES, gender, and mode of communication) and
found early identification was the key to improved language outcomes. Six months of
age was the critical cutoff period for early identification that would achieve normal
speech and language development.
Moeller (2000) has described outcomes related to early or late intervention in a
metropolitan program prior to universal newborn hearing screening. Children were
identified through high-risk registries, child find programs, and parent self-referral.
The cohort of 112, between the ages of two days and 54 months were enrolled in a
comprehensive intervention program. Retrospective analysis of outcomes in language
development related to time of diagnosis and intervention revealed that children
enrolled in intervention prior to 11 months of age had superior vocabulary and verbal
reasoning at 5 years of age than counterparts receiving intervention at later ages. A
recent study from the United Kingdom reported higher language scores for a group of
children identified at birth with bilateral permanent congenital hearing loss than a
6
group with similar hearing loss who had not been screened at birth. The children in
this study were tested at approximately 8 years of age (Kennedy, McCann, Campbell
et al, 2006).
In 1996 the Maternal and Child Health Bureau awarded a grant to the
University of Colorado to establish the Marion Downs National Center. The Center
provided technical assistance to state health departments to develop comprehensive
systems from screening to early intervention. Currently all EHDI programs are
managed by State Departments of Public Health. It is the role of these agencies to
ensure that all infants are screened, and for those who fail, that they receive
appropriate and timely follow-up. The success of an Early Hearing Detection and
Intervention Program (EHDI) determined by the benchmarks recommended by state
and federal policy to ensure early identification and intervention of hearing loss.
The Colorado Infant Hearing Program
The Colorado Infant Hearing Program began as a pilot project in 1992 to
determine if newborn hearing screening was feasible prior to hospital discharge. The
Colorado Department of Public Health and Environment (CDPHE), Children and
Youth with Special Health Care Needs (HCP) sponsored this effort in collaboration
with The Children’s Hospital and the University Colorado Health Sciences Center.
Research on this pilot effort was conducted by the University of Colorado and
demonstrated that infants with congenital hearing loss born in pilot hospitals providing
newborn hearing screens were being identified and receiving early intervention by six
months of age, compared to infants identified with hearing loss at age 24 months born
in non-pilot hospitals. The language outcomes for those children who were screened
7
and received early intervention had low normal language outcomes at age three
(Yoshinaga-Itano, Coulter and Thomson, 2000).
As a result of the emerging data from the University of Colorado, the 1997
Colorado legislature mandated that all hospitals offer a newborn hearing screen.
CDPHE was named as the organization responsible for the legislation requirements. If
the statewide screening rate fell below 85% then rules and regulations would be
promulgated to insure a higher hospital-screening rate. The legislation also required
that an advisory committee be developed to provide guidance to hospitals and
providers to assure a comprehensive system from screening through early intervention.
The Colorado Infant Hearing Advisory Committee developed guidelines for screening,
diagnosis, and early intervention. In 2005 the Colorado legislature passed an
amendment to increase the mandated screening rate to 95% and maintain the advisory
committee.
Initially in the Colorado pilot project, hospitals provided monthly summary
reports that included the number of infants born, the number screened, the number not
screened, and the number who failed the screen. Aggregate data were collected in a
paper report form and voluntarily submitted by participating hospitals, and results
were entered into an Access database. Because only monthly totals were reported, this
manual system did not allow for tracking of individual children. One of the over-
riding goals in a hearing-screening program is to ensure that infants who fail the
screen receive timely and appropriate follow-up (audiologic diagnostic assessment,
amplification and early intervention). In collaboration with Colorado Vital Records at
CDPHE, individual hearing screening results were added to the electronic birth
8
certificate in 1998. A data management system was developed that provided more
accurate reporting, but still did not allow tracking children through screening and into
early intervention. In 2000 the Centers for Disease Control, awarded a Data
Integration Grant for Early Hearing Detection and Intervention (EHDI) to the CDPHE.
This grant allowed CDPHE to hire information technology personnel to develop a
fully integrated data system so individual infants could be tracked from screening to
diagnosis and to enrollment into early intervention.
During early implementation of universal infant screening programs, there
were concerns in the medical community regarding high false positive rates at hospital
discharge (Bess and Paradise, 1994). These concerns prompted Colorado to develop a
protocol guiding hospitals to re-screen infants prior to hospital discharge. For infants
who failed the initial inpatient screen and re-screen in one or both ears, the hospital
was to request the infant to return within two weeks of discharge for an outpatient re-
screen. Infants who failed an outpatient re-screen were then referred to an audiologist
for confirmatory diagnostic evaluations. This protocol has become the standard of care
in Colorado and has decreased the fail rate at hospital discharge to less than 4%. This
strategy has further decreased the number of infants who are referred to audiologists
for more costly diagnostic evaluation to less than 1%.
A fully integrated tracking system coupled with low fail rates at hospital
discharge has assisted the Colorado Infant Hearing Program to eventually achieve high
outpatient follow-up screening rates (86% in 2004). This improvement has enhanced
communication between hospitals and CDPHE. In addition a newly adopted system
contacts families when there is no record of an initial or follow-up screen.
9
The use of demographic data from the electronic birth certificate has allowed
the identification of specific factors correlated with infants who failed to receive an
initial or follow-up screen. Colorado has developed a comprehensive surveillance
system that allows critical epidemiological analysis and evaluation of screening,
diagnosis, and treatment activities. This research project presents analyses of such data
from 2002 to 2005.
Purpose of this Study
The present research will analyze the demographic and hospital factors
associated with infants not receiving the follow-up rescreen after hospital discharge.
Demographic factors will be ascertained for those infants who are not diagnosed by
three months of age and those who were diagnosed by three months of age. These
statistical analyses will allow the Colorado Infant Hearing Program to take full
advantage of its extensive hearing-screening data infrastructure. More specifically,
these analyses will provide the Program with the capacity to develop evidence-based
strategies to improve statewide and hospital-specific screening system performance.
10
CHAPTER 2
Review of the Literature
Introduction
This chapter’s purpose is to review literature that provides information relevant
to achieving quality indicators for Early Hearing Detection and Intervention Programs.
The capacity to develop a truly comprehensive statewide system of newborn
screening, diagnosis, and early intervention is the role of public health. Multiple
community linkages as described by Vohr, Simon, and Letourneau (2000) must be
established to ensure that community based programs are culturally sensitive and
seamless for families. Thomson, Rose, O’Neal and Finitzo (1998) noted that for states
to be effective in developing statewide systems, public health agencies must
collaborate with other public and private agencies such as Departments of Education,
Audiologists, Hospitals, Physicians, and Community Health Centers. CDC states their
mission for EHDI Programs “is for every state and territory to have a complete EHDI
tracking and surveillance system that ensures children with hearing loss achieve
communication and social skills commensurate with their cognitive abilities. To do
this, it is essential that infants with hearing loss are identified early, and appropriate
intervention services are initiated. Without early identification and intervention,
children with hearing loss may experience delays in the development of language,
cognitive, and social skills that may prevent success in academic and occupational
achievement”.
11
The Joint Committee on Infant Hearing (2000) established four principles for
EHDI programs to ensure that infants with hearing loss reach their “maximum
potential”. Those principles are defined as:
1. All infants should have access to hearing screening using a physiologic measure
before one month of age.
2. All infants who do not pass the initial hearing screen and the subsequent rescreening
should have appropriate audiologic and medical evaluation to confirm the presence of
hearing loss before 3 months of age.
3. All infants with confirmed permanent hearing loss should receive intervention
services before 6 months of age.
4. All infants who pass newborn hearing screening but who have risk indicators for
other auditory disorders and/or speech and language delay receive ongoing audiologic
and medical surveillance and monitoring for communication developments. Infants
with indicators associated with late-onset, progressive, or fluctuating hearing loss as
well as auditory neural conduction disorders and/or brainstem auditory pathway
dysfunction should be monitored.
The purpose of the present epidemiological study is to take advantage of
Colorado’s well-developed EHDI data tracking and surveillance system in order to
examine if the Colorado Infant Hearing Program is meeting the JCIH principles.
Specifically, this research will aim to discover why all infants are not meeting the
JCIH benchmarks of screening by one month and diagnosis by three months. This
study will analyze what factors are associated with infants not receiving a timely
follow-up screen and a confirmed diagnostic assessment by three months of age. The
12
principles of screening will be discussed in this literature review as they led to the
development of Early Hearing Detection and Intervention benchmarks.
Principles of Screening and the Rationale for Newborn Hearing Screening
The rationale for instituting newborn screening is to identify a population that
may have a disorder with no obvious symptoms at birth. In 1968, Wilson and Jungner
(as cited in Coughlin, 2006) proposed 10 principles for public health mass screening
programs. These principles included planning and evaluating population screening
programs based on: the scientific evidence; the balance of risks and benefits; the
availability of an effective treatment program; the acceptability of the screening test to
the population; and the costs and resources required.
Vohr (2003) and the American Academy of Pediatrics (1999) state that for
justification of universal newborn hearing screening for congenital hearing loss it must
meet the following public health criteria: 1. Easy to use screen tests are available that
possess a high degree of sensitivity and specificity to minimize unnecessary referrals
for additional diagnostic assessments. 2. The condition being screened for is not
otherwise detectable by clinical means. 3. Interventions are available to correct the
condition once detected. 4. Early screening, detection, and intervention result in
improved outcomes. 5. The screening program is documented to be an acceptable cost
effective range.
The following literature review will demonstrate how these public health criteria have
been achieved.
1. Easy to use screen tests are available that possess a high degree of
sensitivity and specificity to minimize unnecessary referrals for additional diagnostic
13
assessments. To understand the different screening tests that are currently being
used, it is essential to consider the concepts of sensitivity, specificity and positive
predictive value. Sensitivity is the probability of a positive test when an infant has a
hearing loss. Specificity is the probability of a negative test among infants who do not
have a hearing loss. A true positive is when a hearing loss is correctly identified and a
true negative is when there is no hearing loss present and the screen is also negative. A
false positive is when the screening results suggest further evaluation and there is no
hearing loss, and a false negative is when the screening results indicate a pass even
though a hearing loss is present. The positive predictive value is the proportion of
infants who are correctly diagnosed through newborn hearing screening. The positive
predictive value is defined at the true positives/true positives + number of false
positives. An ideal screening program would have a high sensitivity, specificity, and
positive predictive value. The evolution of auditory brainstem response technology
and of otoacoustic emissions has been determined to meet the criteria for sensitivity
and specificity to be used in newborn hearing screening programs. These technologies
are discussed in detail to provide information pertinent to the understanding of
sensitivity, specificity, and positive predicative value.
Auditory Brainstem Response. Auditory brainstem response (ABR) is a test of
auditory function in response to auditory stimuli such as clicks, tone pips, and tone
bursts. Jewett and Williston first described the ABR in 1971 (Hall, 1992). Hecox and
Galambos (1974) documented the reliability and validity of the ABR to measure
hearing sensitivity in infants. Surface electrodes are placed on the scalp to record the
evoked potential. Typically a click stimulus is used. As the stimulus is present the
14
evoked potential is elicited from the cochlea to the cortex. The ABR response has a
distinct, repeatable wave pattern. At high intensities there are 5 peaks beginning with
Wave I, which originates in the 8th nerve to wave V in the auditory brainstem. Wave
V is the most prominent peak, and as the intensity is decreased it can be traced down
to the level of audiometric threshold in the 1-4000Hz ranges within 10-15dB HL. The
infant ABR is very similar to that of adults with the exception of prolongation of the
response. As the infant matures the ABR becomes adult like by 18 months of age. As
a result there are age specific norms for infants. Conventional ABR was used for
screening infants in the 1980’s (Stach and Santilli, 1998; Hayes, 2003). Screenings
were primarily limited to infants who were high risk due to costs of the equipment,
time necessary to complete the test, and the required skills of a pediatric audiologist.
Engineers from Bell Laboratories in collaboration with the Infant Hearing
Foundation and the Telephone Pioneers developed the Synap (Amochaev, 1987). The
Synap was a modified ABR that allowed a volunteer organization, the Telephone
Pioneers, to perform an ABR screen on high-risk infants. The screen response
required an interpretation from a skilled audiologist. The Telephone Pioneers used the
high-risk register recommended by the JCIH to screen 100,000 infants and perform
over 10,000 ABR screens. Amochaev reported a 15% false positive rate. This
equipment provided an opportunity to screen high-risk infants before hospital
discharge and eliminated the need for an audiologist to be on site or the use of
expensive conventional diagnostic ABR equipment. This technology did not allow for
rapid growth in universal newborn hearing screening programs due to the need of an
15
audiologist to interpret the results. However, a 15% false positive rate was too high of
a rate for a universal newborn screening program.
The development of the Automated ABR (AABR) allowed greater potential
for screening all newborns. Hermann, Thornton and Joseph (1995) developed the first
AABR, which led to the development of the ALGO -1 Infant Hearing Screener by
Natus Medical. The ALGO-1 consisted of a signal averaging microprocessor and an
artifact rejection system for myogenic, electrical, and environmental noise interference
(Erenberg, 1999). The stimulus consists of a 35dBHL click stimulus with a frequency
spectrum of 750-5000Hz at a rate of 37 pulses per second. The clicks are presented
through disposable ear couplers. Disposable electrodes are placed on the head, nape
of the neck and shoulder of the infant. The myogenic and ambient noise detectors
alert the screener if there is an increase in the infant’s activity or noise in the room.
The screen can be paused until troubleshooting techniques resolve the issues of
ambient or myogenic activity. The template is based on an averaged response from 35
infant ABR’s to detect the Wave V response using a 35dB HL signal. The algorithm-
matching template provides a statistical comparison for either a pass or ‘refer’. There
were a number of validation studies performed on the Algo (cited by Erenberg, 1999;
Hayes, 2003) that demonstrated a sensitivity ranging from 93% to 100% and a
specificity ranging from 78% to 98%. Van Straaten (1999) found the AABR in
agreement with the conventional ABR up to 98%. Jacobson, Jacobson, Spahr (1990)
compared the Algo-1 to conventional ABR and found comparable results between the
two techniques.
16
The advantage of the automated screener is that the pass/refer criteria
algorithm requires no interpretation, allowing for a variety of trained non-professional
personnel to perform the screen. Although many of the validation studies determined
that there was 100% sensitivity and 96% specificity it is known that the ABR
technique using click stimuli will miss mild, low frequency, and high frequency
hearing losses (Johnson, White, Widen, Gravel, et al., 2005). The positive predictive
value has been reported to be near 19% (Mehl and Thomson, 1998) and 14%
(Boshuizen, van der Lem, Kauffman-deBoer, van Zanten, Oudesluys-Murphy, and
Verkerk, 2001). The advantages of using the AABR are that the response measures
both cochlear and neural pathways disorders. This ability allows for disorders such as
auditory neuropathy to be identified. The refer rate is relatively low, with reports of
4% to <2% (Stewart, Mehl, Hall, Thomson, Carroll, Hamlett, 2000; Mason and
Herrmann, 1998). The AABR also eliminated the observer bias seen with behavioral
observation. The disadvantages are that the disposables are costly and the length of
time to perform the screen takes longer as the infant must be in a sleep state to
eliminate myogenic artifact.
Otoacoustic Emissions. Otoacoustic Emissions (OAE) are low-intensity sounds
generated within the cochlea, specifically the outer hair cells, in response to acoustic
stimuli (Hall, 2000). OAE’s were first postulated by Thomas Gold in 1948 and then
demonstrated by David Kemp in 1978 (Kemp and Ryan, 1993; Kemp, Ryan and Bray,
1990; Kemp and Ryan, 1991). OAE’s have become an important tool for screening
infants as well as a part of the audiological diagnostic test battery. It is still being
researched on how OAE’s are generated in the cochlea (Lonsbury-Martin, 2005).
17
OAE is an objective response that is measured via a small microphone that is
placed in the infant’s ear canal. Transient Evoked Otoacoustic Emissions (TEOAE)
and Distortion product Otoacoustic Emissions (DPOAE) are the most common forms
of OAE used in infant hearing screening. TEOAE stimulus is broadband click and
thus is not frequency specific. TEOAE’s used for screening, use intensity signals of
80db SPL or greater. TEOAES are absent in infants who have hearing loss greater
than 30 to 40dB. DPOAEs are frequency-specific signals and there is good reliability
between the DPOAE response and the pure tone audiograms (Kemp and Ryan, 1993;
Lonsbury-Martin, 2005). The intensity of the two tones used in the DPOAE stimulus
is set at 75/75dB SPL or 65/50dB SPL. Norton, et al.,(2000) found that higher
intensity DPOAEs were present in ears with as much as a 50dB hearing loss. By
using the higher 75/75dB SPL this would increase the false negative rate by passing
babies who had a moderate hearing loss. Several studies (Vohr, Carty, Moore and
Letourneau 1998; Aidan, Avan, and Bonfils, 1999) reported TEOAE sensitivity to be
95% and specificity to be 85%. There are disadvantages to using OAE’s for newborn
screening. OAE failure is higher during the first 24 hours of life due to debris in the
ear canal or fluid behind the tympanic membrane (Hall, 2000; Doyle, Burggraaff,
Fujikawa, and Kim, 1997). The fail rate is higher with OAEs (7% to10%) than AABR
(less than 2 % to 4%) due to the sensitivity of OAEs to outer and middle ear problems.
Also the fitting of the small probe must have a tight seal and requires tester
experience. In addition environmental and physiologic low frequency noise will
increase the fail rate. The advantages of OAE’s are that newer technology eliminates
using low frequencies and thus reduces the dilemma of interference with low
18
frequency environmental noise. OAE screeners are now automated using a pass/fail
criterion, which allows trained non-professional personnel to perform the screen. The
costs of the disposable probe tips are $1/baby as compared to the AABR disposables
at $10/baby.
Neither technology achieves 100% sensitivity or specificity however the goal
should be to achieve a high level of sensitivity (identifying those infants who have
hearing loss) and specificity (passing those infants who do not have hearing loss). The
JCIH 2000 Position Statement recommended a referral rate from screening to
audiological assessment of 4% or less. The issue of false negative results will be
discussed next to understand which populations of children with hearing loss will pass
a newborn hearing screen and potentially have a significant hearing loss.
False Negative Results with AABR and OAE Screening. There are very few
studies that have demonstrated the percentage of false negatives with OAE or AABR
screening. Norton, Gorga, Widen, et al. (2000) through a large multisite study found
that mild hearing losses were less likely to be identified with either AABR or OAE.
The false negatives decreased as the hearing loss increased. Johnson, White, Widen, et
al, (2005) suggested that a two-stage screening with otoacoustic emissions (OAE)
followed by automated auditory brainstem response (AABR) may be missing 23% of
mild congenital hearing loss cases. Both of these studies had the infants return at 8 to
12 months after the newborn hearing screen. The potential that some of the “missed”
hearing loss cases were actually infants with normal hearing at the time of the screen
who acquired hearing loss after birth was not considered. Potential causes of late
onset hearing loss were not fully discussed. It was therefore not clear from data
19
presented that those infants who passed their newborn hearing screen and were later
estimated as having hearing loss were truly missed by screening or if they were
perhaps among a group of infants that present with late onset hearing losses from
causes such as asymptomatic perinatal cytomegalovirus (CMV) infection or recessive
genetic traits.
Meyer, Wittee, Hildmann, et al. (1999) studied 464 and identified 7 infants
who failed their AABR screening who had passed their OAE screen. All of these
infants were in the NICU and had JCIH high-risk criteria and the authors
recommended that OAE screening not be used in this high-risk population. Lutman,
Davis, Fortnum, and Wood (1997) found 11 of 47 children with confirmed hearing
loss who had passed their TEOAE newborn hearing screen. Two of the children had
documentation of acquired hearing loss with the other nine labeled as false negatives,
giving the test sensitivity 80%. The authors admitted that the false negative results
may be due to acquired hearing loss or progressive loss of unknown origin since the
confirmation of the hearing losses were up to 9 years of age. Mason, Davis, Wood and
Farnsworth (1998) found 5 infants with hearing loss out of 51 who had passed their
ABR newborn hearing screen. As in Lutman, et al. study, 2 of the 5 had documented
progressive hearing loss. The authors concluded that the false negatives may be due to
audiometric configuration or acquired hearing loss. Cullington and Brown (1998)
describe a case study of an infant who had robust OAE’s with Mondini dysplasia and
profound hearing loss. The disorder of auditory neuropathy/dysnchrony (AN/AD) will
not be detected by otoacoustic emissions and will result in a false negative. Berg,
Spitzer et al. (2005) found 115 of the 477 NICU infants who had failed ABR and
20
passed OAE screening in one or both ears who had an auditory neuropathy profile.
The researchers did not have confirmed audiologic assessments completed on this
cohort to determine if in fact all 115 infants did have AN/AD.
To reduce the incidence of false negatives the screening equipment would need
to be more sensitive to milder forms of hearing loss, thus increasing the number of
false positives. Infants with hearing loss caused by temporary fluid would fail the
newborn hearing screen and require additional follow-up increasing the costs and
burden on hospital and state EHDI systems. Children with hearing loss caused by a
temporary medical condition, i.e. fluid, are considered false positives despite the fact
that the children at the time of the screen did have a hearing loss. Currently the
sensitivity and specificity of OAE and AABR technology have reached acceptable
levels. This research will address the issue of false negatives versus late onset in those
infants identified through the Colorado Infant Hearing Program.
2. The condition being screened for is not otherwise detectable by clinical
means. As described in the historical perspectives of newborn hearing screening
(Appendix A) behavioral observation, the crib-o-gram, the auditory response cradle
and high-risk registries failed to identify the majority of hearing losses at birth. In
addition primary care physicians do non use objective technology to routinely screen
for hearing loss at well baby visits.
3. Interventions are available to correct the condition once detected and (4)
early screening, detection, and intervention result in improved outcomes. Several
researchers have published the evidence for early intervention of hearing loss
(Yoshinaga-Itano, Sedey, Coulter and Mehl, 1998; Sininger, Doyle, and Moore, 1999;
21
Moeller, 2000). Yoshinaga-Itano, Sedey, Coulter and Mehl (1998) demonstrated that
children with all degrees of hearing loss who had intervention by six months of age
had language scores comparable to their normal hearing peers. This research also
provided evidence that language scores for children identified after six months of age
through 25 months of age were not significantly different. This meant that infants
identified at nine months of age had similar language scores as children identified at
25 months of age and were not comparable to normal language levels. These data
would suggest that early identification and intervention by six months of age is the
critical time period for learning language.
Yoshinaga-Itano, Coulter and Thomson (2001) showed infants that are
screened in birthing hospitals were identified earlier and had better outcomes than
children born in non-screening hospitals. Recent research from the UK (Kennedy,
McCann, Campbell, et al., 2006) also demonstrated an association between early
identification and higher language scores. The researchers studied 120 children, of
which 61 were born during the period that universal newborn hearing screening was
available and the remaining 59 were born without screening. Children who were
confirmed by nine months of age had significantly higher receptive language scores
than children who were identified later.
5. The screening program is documented to be an acceptable cost effective
range. Costs studies began to emerge as well as the debate over which
technology should be used. Downs (1994) justified early identification at birth based
on the costs to lost income for the deaf and the cost of education alone. Proponents of
the AABR were concerned about the high refer rates and costs associated with the
22
follow-up. TEOAE advocates argued that the much lower costs of the disposables
(probe tips vs. electrodes and ear cuffs) made OAE a better choice. The costs of
universal newborn screening using TEOAE were determined to be about $26 per
infant and $4,376 to identify a child with sensorineural hearing loss (Maxon,White,
Behrens,Vohr,1995). Mehl and Thomson (1998) compared the costs of newborn
hearing screening to the costs of routine newborn screens (metabolic blood spot
screen) and found the costs to be on average, $25 per infant screened and diagnosis
around $9,600 per infant diagnosed, using AABR as the screening technology. This
included costs predictions for early intervention with hearing aids. This outlay was
still favorable in comparison to the other common genetic/metabolic
(e.g.,hypothyroidism, phenylketonuria, cystic fibrosis, hemoglobinopathy) disorders
commonly screened for in the newborn period. Mason and Herrmann (1998) gave
figures of $17 per infant to screen and $17,750 to identify a true bilateral hearing loss
using AABR. Kemper and Downs (2000) found the screening cost to be $15 per
infant with an identified case costing $18,990 using TEOAE as the first screen
followed by AABR. Vohr, Oh, Stewart, Bentkoven, Gabbard, Lemons, Papile, and
Pye (2001) compared the cost between OAE only, AABR only, and a two step with
TEOAE followed by AABR. Their results found that AABR alone had the lowest
refer rate at discharge and the highest cost per screen. The AABR costs were $32.81
per infant. The two-step protocol costs $33.05 per infant and the TEOAE only costs
$28.69. The costs to identify an infant were $16,405, $16, 527 and $14,347 for the
AABR, TEOAE/AABR, TEOAE respectively.
23
The American Academy of Pediatrics, Task Force on Newborn and Infant
Hearing (1999) endorsed universal newborn hearing screening due to the published
and unpublished data indicating that all of the screening criteria (as outlined above in
Principles of Screening) were met. The movement from hospital based newborn
hearing screening programs to the development of statewide comprehensive systems
was critical to ensure that all infants are screened by one month, diagnosed by three
months and enrolled into early intervention by six months, to achieve the outcome of
normal speech and language.
The Development of Early Hearing Detection and Intervention Programs
Although the previous discussion demonstrated that the screening technologies
were safe, effective and cost efficient, the most compelling research was the evidence
for early intervention. The process of screening and ultimately enrollment into early
intervention by six months of age required the development of comprehensive
statewide systems that would ensure an infant who failed his/her newborn hearing
screening received timely and appropriate follow-up. Many individual hospital and
state programs were successful at completing the screening but infants were not being
identified until after six months of age. To provide this vital technical assistance, The
Marion Downs National Center (MDNC) for Infant Hearing was established in 1996
through a Maternal and Child Health (MCH) Grant awarded to the University of
Colorado. The goals of the grant were to implement statewide systems of newborn
hearing screening, audiologic assessment, and early intervention in 19 states. The
goals set forth were: (1) States will achieve universal newborn hearing screening. (2)
States will achieve diagnosis of hearing loss by 4 months of age and begin
24
intervention by 6 months of age. (3) States will document the developmental profiles
of infants and toddlers with hearing loss through their early intervention programs. (4)
State Maternal and Child Health Programs will have coordinated systems for newborn
hearing screening, diagnosis and early intervention.
The effort of the MDNC promoted the idea that Directors of Speech and
Hearing Programs in State Health and Welfare Agencies (DSHPSHWA) take the lead
in developing comprehensive, statewide systems of care, from screening through early
intervention. The Centers for Disease Control, the Maternal Child and Health Bureau,
and the Joint Committee on Infant Hearing (2000) have adopted the MDNC goals of
screening by one month of age, diagnosis by three months of age, and enrollment into
early intervention by six months of age. The term EHDI, Early Hearing Detection and
Intervention was becoming the acronym to describe a system that went beyond
universal newborn hearing screening and included the assessments and early
intervention processes.
The MDNC promoted a data-driven approach to provide families with
objective information about their child’s development and to achieve goal three for the
early intervention programs (Thomson, et al., 1999). The MDNC also promoted the
role of parent input into the development of EHDI system. Parent participation at the
national, state and local levels are encouraged to ensure that the materials, protocols,
and systems being developed were meeting parents’ needs. Surveys of the 17 states
showed that less than 15% of early intervention programs had parents serving in any
capacity (DesGeorges, 2003). The Centers for Disease Control (CDC) has issued
National Goals and Program Objectives (2006) that includes the development of state
25
advisory boards with the inclusion of parents who have children who are deaf or hard
of hearing. The Joint Committee on Infant Hearing in their 2000 Position Statement
acknowledged the importance of parental input into developing the EHDI system.
There has been little research to determine the effects of newborn hearing
screening, diagnosis and early identification on parents. Bess and Paradise (1994)
stated that the recommendation of universal newborn hearing screening would
potentially cause “parental anxiety, distraction, and potential misunderstanding, of
disturbance of family function, and of unnecessary or harmful procedures or
treatments carried out on children…” Thompson, et al., (2001) also expressed concern
in their paper about parent anxiety due to false positive screens. In 1997, results of two
surveys of parents’ perceptions regarding hospital-based screening were published by
Utah (Barringer, et al.) and Colorado (Abdala and Yoshinaga-Itano). Both papers
came to the conclusion that the benefits of early detection far outweigh any anxiety
that a parent may experience from their baby not passing a hearing screening.
Clemens, et al (2000) surveyed families after a positive screen and then following a
negative rescreen and found that there was not any lasting anxiety with false-positive
hearing screening. Luterman and Kurtzer-White (1999) found that 83% of parents
who had a child who was deaf wanted to know at the time of birth that they should
begin the early intervention process. A study in Sweden (Magnuson and Hergils,
1999; Hergils and Hergils, 2000) found that 91% of parents had a positive attitude
toward screening and found the screening reassuring. In contrast Hergils (1999)
reported that parents of children who were late identified (after age two) all wished
26
they were given the opportunity to participate in a newborn hearing screening program
to prevent the grief and anxiety they experienced due to late identification.
An investigation by Stewart, Moretz, and Yang (2000) looked at the level of
stress mothers’ experienced following a positive screen outcome and found no
difference between those mothers whose infants failed a screen and those whose
infants had passed. Vohr (2001) found that by decreasing the false positive rate, and
the interval of time between an inpatient screen and an outpatient screen, significantly
reduced the mother’s anxiety levels. The most recent study by Danhauer and Johnson
(2006) had 36 parents responding to questionnaires about the hearing screening and
referral process. The parents were generally positive and a failed screen did not have a
negative impact on bonding with their baby. A recent survey project completed by
Thomson and DesGeorges (2006) found that generally parents were satisfied with the
services they received from screening through early intervention. Parents did
comment they wish they had someone explain the screening results verbally so they
better understood the recommendations for follow-up and this potentially would have
decreased the process into diagnosis and ultimately intervention.
Despite efforts to build comprehensive EHDI systems that meet the needs of
families there are remaining issues regarding follow-up from newborn hearing
screening. This present research will be addressing factors that are correlated to infants
who fail the newborn hearing screen in the Colorado Infant Hearing Program and who
are late identified.
Newborn Hearing Screening Follow-up. One of the major concerns for EHDI
programs is ensuring that infants who fail the screen receive timely and appropriate
27
follow-up. The benchmark for follow-up from newborn screening is diagnosis by 3
months of age. Downs and Sterritt (1967) had the foresight 40 years ago to suggest a
data tracking system that utilized the PKU blood spot cards for infants who failed the
screen. During the evolution of newborn hearing screening in the early 1990’s there
was more of a focus on the number of infants being screened rather than those that
actually received follow-up. In 2003 CDC (Nemes, 2006) reported that only 55.2% of
newborns who failed their hearing screen had documentation of an audiological
evaluation. Mehl and Thomson (1998, 2002) analyzed the Colorado Infant Hearing
Program that showed a decrease over a seven-year period (1992-1999) in the fail rate
at hospital discharge and an increase in rescreen rate. Only 50% of infants who failed
had documentation of either an outpatient rescreen at the hospital or evaluation by an
audiologist. In 1999 the percentage of infants who failed initial screening and who
received a follow-up screen increased to 70%. In a multisite investigation (Stewart, et
al., 2000) the authors found that using AABR technology for screening reduced the
refer rates and thus decreased the lost to follow-up rate. Colorado has developed a data
tracking system linked to the electronic birth certificate that has increased the
documented follow-up rate to 82%. In a recent analysis by Christensen,Thomson, and
Letson (2007) 82% of infants, between 2002-2004, received a follow-up rescreen after
a failed inpatient screen. This analysis also found one Denver hospital that has a high
fail rate (9%) at hospital discharge coupled with a very high (98%) return rate due to
their follow-up protocol of having infants return for the rescreen at the time of the first
well baby visit. Interestingly the primary care physicians are located on the same floor
as the outpatient audiology department where a screener is available during well baby
28
visits. Finitzo, Albright, and O’Neal (1998) report a 31.55% lost to follow-up in 1996,
with a decrease to 20% in 1997. The authors attribute increase in follow-up to
improvements in screening technology, providing education to physicians on the
importance of follow-up, improving service coordination to families, and automating
the data management system to track infants from screening into diagnosis.
Parkland Memorial Hospital in Dallas, Texas, with 17,000 births, had an
initial 40-50% lost to follow-up rate (Shoup, Owen, Jackson, and Laptook, 2005). The
hospital used AABR technology and adopted a protocol, which required infants to be
rescreened with AABR by a technician. If the infant still failed then an audiologist
performed a third screen prior to discharge and also performed the outpatient
rescreens. This decreased the lost to follow-up rate to 10%. The authors concluded
that this protocol significantly reduced the false positives and allowed greater
resources for following those infants who failed at discharge.
As programs improve the false positive screens and subsequently improve the
rescreen there are still concerns whether those infants who fail the rescreen obtain a
diagnosis by three months of age. Mehl and Thomson (1998) reported that 75 of 94
(80%) infants had completed diagnosis and were enrolled into early intervention
between 3-6 months of age. In a later study by Mehl and Thomson (2002) 148,240
infants were screened and 291 infants were identified with hearing loss. The median
age of diagnosis was 2.1 months, with 92% of the infants diagnosed by 5 months of
age. Dalzell, Orlando, MacDonald et al. (2000) report the median age of identification
at 3 months of age for 85 infants identified with permanent hearing loss, out of 43,331
screened. Kennedy, McCann, et al. (2005) performed an 8 year follow-up study. They
29
found that children who were in the universal newborn hearing screening program
were more likely to be referred to an audiologist by six months of age than those not in
the UNHS cohort (74% vs. 34%). Uus and Bamford (2006) report out of 169,487
screens, 169 infants were identified with permanent bilateral moderate or greater
hearing loss. The median age of identification for well baby vs. NICU infants was 10
weeks and 13 weeks of age, respectively.
In contrast, White (2003) surveyed the EHDI coordinators who estimated that
only 56% of infants who failed a screen received a diagnostic evaluation by 3 months
of age. The EHDI coordinators attributed this to the lack of pediatric audiologists.
Only 57% of the states have written guidelines for pediatric assessments. EHDI
coordinators also attributed poor follow-up to inadequate reimbursement for follow-up
services, physician attitudes about the importance of follow-up, families not
understanding the consequences of late identification, and the need for state integrated
data management systems to track infants who fail the screen. Moeller, White and
Shisler (2006) disseminated 12,211 surveys to primary care physicians in 21 states and
1 territory regarding their knowledge, practices, and attitudes about newborn hearing
screening. They found that overall physicians were knowledgeable about newborn
hearing screening and recognize the benefits of early identification and intervention.
The researchers did find gaps in physicians’ knowledge about what to do when an
infant fails a screen or is diagnosed with permanent hearing loss. In the survey
conducted by Thomson and DesGeorges (2006) several parents commented that their
physician did not feel a newborn hearing rescreen was important. These issues along
with the previous studies cited would also indicate that hospital screening programs
30
play a significant role in achieving low fail rates and a follow-up protocol, which
ensures the families receive a follow-up rescreen. Follow-up from newborn screening
and into diagnosis and early interventions are critical for the success of an EHDI
program.
The Colorado Infant Hearing Program
In 1991, the Colorado Newborn Hearing Screening Project was founded as a
collaborative effort between the Health Care Program for Children with Special Needs
(HCP), the Colorado Responds to Children with Special Needs (birth defects registry)
at the Colorado Department of Public Health, The Children’s Hospital, and the
University of Colorado Health Sciences Center (Thomson, 1997). The Colorado
Project started with a plan to implement universal screening in 10 large birthing
hospitals, expanding over the next 5 years to include all hospitals. Although the
project did not promote either AABR or TEOAE technology, admittedly most of the
audiologists involved in the Project felt more comfortable with the AABR due to the
well-understood ABR technology and its validity of detecting hearing loss in infants.
The initial results of the Rhode Island Hearing Assessment Program (RIHAP) using
OAE’s had a fail rate of 26.9% at hospital discharge (White, Vohr, Behrens, 1993).
The low specificity with OAE vs. AABR also provided impetus to primarily use
AABR in the Colorado pilot hospitals.
Colorado passed legislation in 1997 requiring all birthing hospitals to
implement a newborn hearing-screening program. House Bill 97-1095 requires the
Colorado Infant Hearing Advisory Committee to develop guidelines for reporting and
31
for assuring that identified children receive referral for appropriate follow-up. In 2005
the Colorado legislature passed an amendment to increase the mandated screening rate
to 95% and maintain the advisory committee. Colorado has successfully reached the
benchmark of screening 95% or greater for since 2002, due in part to the data
management and tracking system.
There are many challenges in developing a comprehensive statewide Early
Hearing Detection and Intervention (EHDI) program. Effective tracking of infants
from screening through diagnosis and then to early intervention was and remains the
most difficult task. In 1998 the Health Care Program for Children with Special Needs
(HCP) developed a data management system that was populated by data from
Colorado’s electronic birth certificate (EBC) data. Fields were added to the Genesis™
EBC application that included specific ear results of pass or fail, and the reasons if
there was not a screen completed (e.g. missed, transferred, deceased, parent refusal).
Colorado was awarded a Center for Disease Control and Prevention (CDC) Early
Hearing Detection and Intervention (EHDI) data integration cooperative agreement in
2000. This cooperative agreement allowed HCP to develop and implement a more
comprehensive application to manage the EHDI follow-up program. This agreement
has greatly improved the data integrity for the program. The EHDI data management
program also has the capability to build capacity and to enhance the processes of
reporting by other providers. The next step was to design, develop, and implement the
NEST (Newborn Evaluation, Screening and Tracking), which is a centralized database
and application. NEST integrates newborn hearing screening, Colorado Responds to
Children with Special Needs (CRCSN, Colorado’s birth defects surveillance registry),
32
and the newborn metabolic screening program (blood spot). This data integration
allows HCP to integrate referral services and makes those referrals more efficient and
timely. NEST has the capability to report individual identifiable data on screening
results including child’s date of birth, infant gender, maternal race, maternal ethnicity,
and maternal education level, date of screen, and results of the screen or reason not
screened. The NEST provides comprehensive data for surveillance of newborn
screens, which allows the EHDI program to use a data driven approach for strategic
planning. The data in the EHDI CHIRP can be analyzed to monitor hospital-screening
activities, racial disparities in screening and follow-up, and clusters of hearing loss
that may indicate genetic disorders.
In addition, HCP hired a full time EHDI Follow-up Coordinator. The
Follow-up Coordinator has been instrumental in monitoring hospital and provider data
that allows tracking and surveillance activities for newborn hearing. Every hospital
has a designated EHDI Hospital Coordinator. Each month the EHDI Follow-up
Coordinator disseminates a report to the hospitals with a list of infants born in their
hospital that either failed the screen in one or both ears or were not screened. The
hospital coordinator then updates the information on any new screens or rescreens.
This data entry process is not automated.
Audiologists submit an Audiological Assessment report on every child from
birth to seven years of age who has a confirmed hearing loss. These reports include
demographic information, screening results and high risk factors. Audiologists also
submit this report on infants who are referred to them from screening and
subsequently pass an evaluation. These reports are submitted on paper and entered
33
manually into the data system. At 3 months after birth, if the EHDI CHIRP database
indicates that a baby has failed the hospital screen and failed an outpatient screen but
has not been seen by an audiologist, a report is generated and the local HCP Regional
office contacts the family via letter or telephone call. At 3 months after birth, the
EHDI Follow-up Coordinator sends a letter to all infants who failed the hospital screen
in one or both ears, or were missed, or were home-birthed, and with no indication of
subsequent follow-up, and encourages them to obtain a screen or rescreen. This
notification also gives the family the opportunity to report results or gives the family
information on how to obtain a screen. This process has increased the percentage of
infants born at home who receive a hearing screen from 10% in 2003 to 30% in 2005.
The data management system has been essential in providing the demographic
information to increase the rescreen rate and home births screens.
Colorado has developed a system of referral from diagnosis to early
intervention. When an audiologist identifies an infant with a hearing loss they notify
the EHDI program with the Audiological Assessment report and refers the family to a
local Colorado Hearing Resource (CO-Hear) Coordinator. Each CO-Hear
Coordinator is an expert in deafness and holds a master’s degree in speech pathology,
audiology, or deaf education. They work collaboratively with Part C of the
Individuals with Disabilities Education Act (IDEA) to assure that families receive
unbiased information and referrals to resources on early intervention programs for
their infant. The CO-Hear Coordinators input information directly into the EHDI
CHIRP. This is currently being accomplished with virtual private network software
CITRIX. The Follow-up Report form and the Intake form completed by the
34
audiologists and the CO-Hears provide individual data on the degree of hearing loss,
type of hearing loss, age of amplification, type of amplification, high risk factors
associated with hearing loss, name of medical home/primary care provider, age of
enrollment into early intervention and types of services families are choosing. This
information also serves as a safety net when there is not an Audiological Follow-up
form. The Follow-up Coordinator contacts the audiologist to obtain their report. Data,
however continue to either not be reported by these two groups or are delayed in
reporting.
Implications for Research
The Colorado EHDI program has been in development and refinement for 15
years. The advantage of an active (data collected directly from the electronic birth
certificate) and passive (data collected from providers) management system allows the
opportunity to analyze factors that prevent an infant from receiving a newborn hearing
screen by one month, diagnosis by three months and enrollment into early intervention
by six months. In a study of the Colorado Infant Hearing Program, Christensen,
Thomson, and Letson (2007) looked at which factors may be associated with
receiving/not receiving the initial or outpatient follow-up screen. Variables in the
database included maternal demographics and birth-related characteristics as well as
hospital of birth. Demographic factors include mother’s age at delivery, infant gender,
marital status, mother’s who smoke, maternal education, birth hospital, race/ethnicity,
birth weight, and APGAR score at 5 minutes. Descriptive, bivariate and logistic
regression analyses were performed using SAS statistical software version 9.1.
Variables were selected for the logistic regression model if Pearson correlation
35
coefficients with the outcome variable reached statistical significance of <.05.
Multicolinearity diagnostics were performed and results showed all variables shared
small correlations below Pearson’s r < .33. Missing values on some demographic
characteristics reduced the population totals about 2% for the statistical analysis
procedures. For example, infants who had high risk factors of low birth weight (less
than 2500 grams) and APGAR scores of less than 7 at 5 minutes were most likely not
to receive the initial screen. The average follow-up screening rate from 2002-2004
across 57 hospitals was 82%. Some hospitals have follow-up rates above 95%, and
other hospitals have follow-up rates around 60%. Findings showed that hospital
screening rates were influenced by maternal education, and that Latina mothers were
much more likely than non-Latina mothers to report low education levels. The
variables (e.g. gender, mother’s age, race/ethnicity) in this research did not yield other
potential hospital factors (e.g. what is the hospital follow-up protocols, who provides
the outpatient screen, is there a charge for the screen?) that could explain the
differences in the follow-up rate after screening or the delay in obtaining a
confirmatory diagnosis by three months of age.
Purpose for Current Research
These current research hypotheses will investigate further the factors
associated with not receiving a follow-up screen and failure to achieve diagnosis by
three months of age. The first hypothesis will determine if the hospital protocol for the
outpatient rescreen yields a higher return rate. In other words, do hospitals that have a
follow-up protocol for failed screens, which require the family to return to the hospital
nursery (vs. an outpatient audiology facility or private audiologist), have a higher
36
return rate for follow-up. As noted in the literature review above hospitals play an
important role in the refer rates and the outpatient rescreen rates. If the null
hypothesis is that the hospital follow-up protocol does not impact the return rate for
follow-up, then the Colorado Infant Hearing Program can begin to identify what other
factors explain why a hospital has a higher return rate. Models of best practices can
then be developed and their use encouraged throughout the statewide screening
program.
The second hypothesis will look at why infants who fail their newborn hearing
screen are not identified by the three-month benchmark. Are infants who have
comorbidities less likely to receive their diagnostic evaluations by three months of
age? Are there factors such as race/ethnicity, mother’s age, and mother’s education
that influences the follow-up into diagnosis? As identified in the literature review
other factors such as physician referral, parents not understanding the urgency for
follow-up, and costs may be associated with delayed identification.
This research will also enhance the role of public health in evaluation to
identify how EHDI programs can ensure a comprehensive system that will identify
hearing loss in infants by three months of age to allow enrollment into early
intervention by six months of age to achieve the outcome of normal speech and
language.
37
CHAPTER 3
Methods and Analysis
Introduction
The Colorado Infant Hearing Program has improved its follow-up rates from
screening significantly from 76% in 2001 to 83% in 2005. Important improvements
were made to the Colorado system that improved the follow-through rates. These
improvements included: 1) the development of the data management system that
tracks individual infants from birth through the screening and rescreening processes,
2) better reporting from diagnostic facilities, 3) the ability of the CO-Hear
Coordinators to directly access of the data management system for documenting
intervention programming. In 2005 there were 69,474 births and 67,446 (97%) were
screened. Of those infants there were 3,154 (4.6%) who failed the screen and there
was documentation that 2,615 (82.9%) received an outpatient rescreen. Reducing the
failure to follow-through rate requires a further in-depth analysis of other potential
causes. This proposal will discuss the methods used to analyze variables that are
associated with two critical questions: 1) factors associated with higher outpatient
rescreen rates following a failed screen at hospital discharge and, 2) factors associated
with failed screens that are identified with permanent hearing loss by 3 months of age
versus later.
Question 1
What factors are associated with higher rescreen rates? The hypothesis for this
question is that hospitals that have a follow-up protocol for a failed screen, which
38
requires the family to return to the hospital nursery (vs. an outpatient audiology
facility or private audiologist), have a higher return rate for follow-up of 83% or
greater.
Subjects
In 2005 there were 56 birthing hospitals ranging from 9 to 4,954 births. The
data analyzed for this hypothesis will be birthing hospital outpatient rescreen rates
during January 1, 2005 through December 31, 2005. There were 69,479 live births and
68,450 were born in birthing hospitals. The remaining 1,029 infants were born at
home, in route to the hospital, non-birthing hospitals, or Colorado residents born out-
of-state. Only birthing hospitals will be included in this analysis.
The Colorado Infant Hearing Program for 2005 data documented that 97%
(n=67,446) of infants were screened. Fifty-three of the 56 birthing hospitals achieved a
screening rate of 95% or greater meeting the JCIH recommendations and Colorado
Guidelines. The statewide total fail/refer rate at hospital discharge was 4.6%
(n=3,154). The individual hospital fail rates varied from .5% to 18%. The percent of
those infants who failed the initial screen and returned for follow-up was 83%. The
individual hospital return for follow-up rates varied from 100% to 48%.
Procedure
Demographic data for Colorado’s newborn hearing screening program are
populated by the state’s electronic birth certificate (EBC). Hospital birth clerks enter
the final hearing screen results prior to hospital discharge in a file that is downloaded
to Vital Records at the Colorado Department of Public Health and Environment
(CDPHE). Designated Hospital Coordinators receive a Monthly Report from the
39
Colorado Infant Hearing Follow-up Coordinator. This report lists all the names of
infants who were missed, were screened after the EBC was downloaded, or failed the
screen in one or both ears. The Hospital Coordinator completes any updated screening
results on the Monthly Report Form and submits this back to the Follow-up
Coordinator, within the following month. The Follow-up Coordinator inputs any new
screening results into the Infant Hearing Database (EHDI CHIRP).
Infants who were missed at the birth hospital and those receiving follow-up
failed screens receive hearing screenings on an outpatient basis. The Hospital
Coordinators and audiologists submit outpatient-screening results to the Colorado
Infant Hearing Program via Monthly Report forms, Audiology Follow-up forms, or
directly to the Follow-up Coordinator by phone or email.
Data will be analyzed for the birth cohort in 2005 to identify factors that may
be associated with receiving/not receiving the outpatient rescreen. Variables in the
database obtained from the EBC include maternal demographics and birth-related
characteristics as well as hospital of birth. The Infant Hearing database collects the
screening results on individual infants, and the results on infants who obtained follow-
up screening.
Hospitals that have families return for follow-up to the same birthing unit or
facility do have the advantage of familiarity. In addition there may be factors between
hospitals such as making the appointment before discharge or not charging for the
rescreen. If families have to return to a different facility there may be additional
charges, lack of transportation, and issues with medical referral. Hospital surveys were
obtained in 2005 from 45 hospitals. The remaining hospitals will be surveyed via
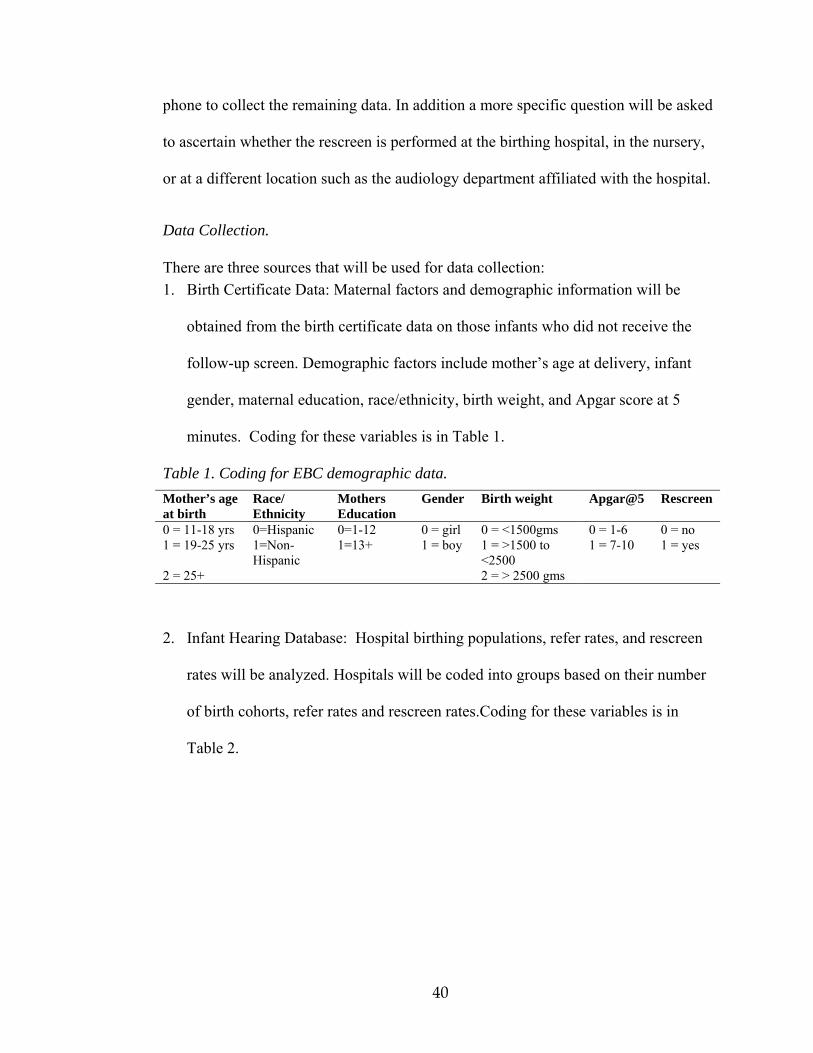
40
phone to collect the remaining data. In addition a more specific question will be asked
to ascertain whether the rescreen is performed at the birthing hospital, in the nursery,
or at a different location such as the audiology department affiliated with the hospital.
Data Collection.
There are three sources that will be used for data collection: 1. Birth Certificate Data: Maternal factors and demographic information will be
obtained from the birth certificate data on those infants who did not receive the
follow-up screen. Demographic factors include mother’s age at delivery, infant
gender, maternal education, race/ethnicity, birth weight, and Apgar score at 5
minutes. Coding for these variables is in Table 1.
Table 1. Coding for EBC demographic data. Mother’s age at birth
Race/ Ethnicity
Mothers Education
Gender Birth weight Apgar@5 Rescreen
0 = 11-18 yrs 0=Hispanic 0=1-12 0 = girl 0 = <1500gms 0 = 1-6 0 = no 1 = 19-25 yrs 1=Non-
Hispanic 1=13+ 1 = boy 1 = >1500 to
<2500 1 = 7-10 1 = yes
2 = 25+ 2 = > 2500 gms
2. Infant Hearing Database: Hospital birthing populations, refer rates, and rescreen
rates will be analyzed. Hospitals will be coded into groups based on their number
of birth cohorts, refer rates and rescreen rates.Coding for these variables is in
Table 2.
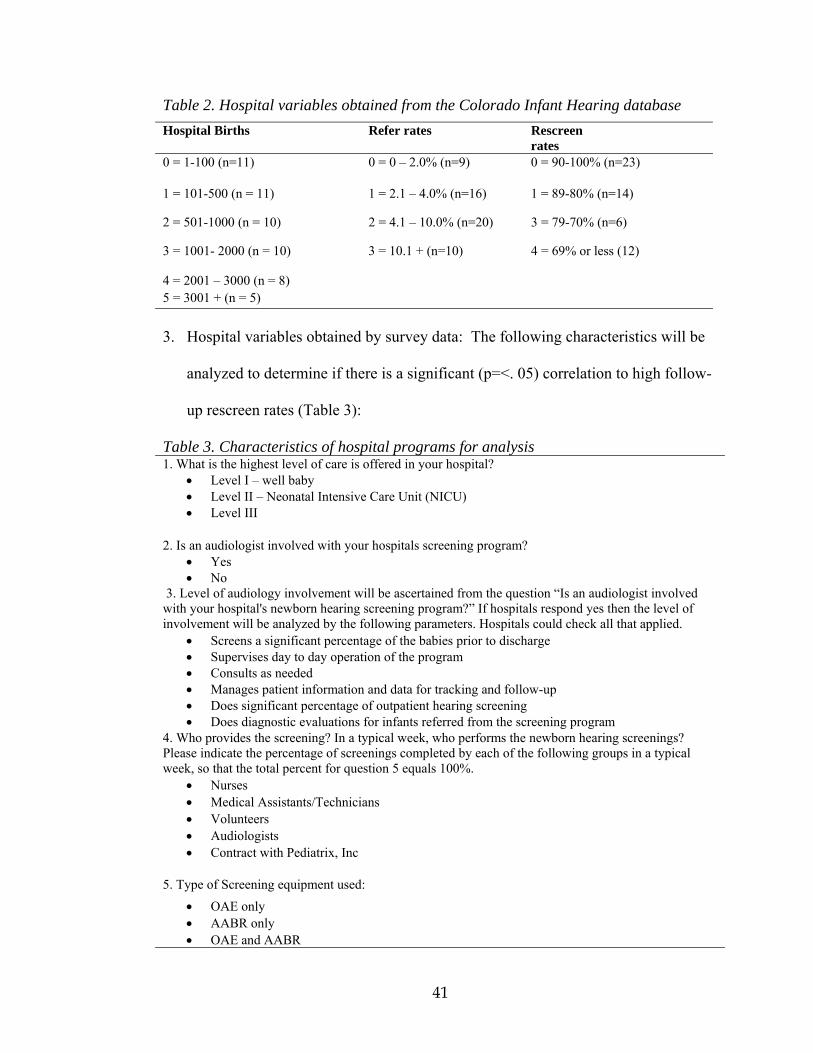
41
Table 2. Hospital variables obtained from the Colorado Infant Hearing database Hospital Births Refer rates Rescreen
rates 0 = 1-100 (n=11)
0 = 0 – 2.0% (n=9) 0 = 90-100% (n=23)
1 = 101-500 (n = 11) 1 = 2.1 – 4.0% (n=16) 1 = 89-80% (n=14)
2 = 501-1000 (n = 10) 2 = 4.1 – 10.0% (n=20) 3 = 79-70% (n=6)
3 = 1001- 2000 (n = 10) 3 = 10.1 + (n=10) 4 = 69% or less (12)
4 = 2001 – 3000 (n = 8) 5 = 3001 + (n = 5) 3. Hospital variables obtained by survey data: The following characteristics will be
analyzed to determine if there is a significant (p=<. 05) correlation to high follow-
up rescreen rates (Table 3):
Table 3. Characteristics of hospital programs for analysis 1. What is the highest level of care is offered in your hospital?
• Level I – well baby • Level II – Neonatal Intensive Care Unit (NICU) • Level III
2. Is an audiologist involved with your hospitals screening program? • Yes • No
3. Level of audiology involvement will be ascertained from the question “Is an audiologist involved with your hospital's newborn hearing screening program?” If hospitals respond yes then the level of involvement will be analyzed by the following parameters. Hospitals could check all that applied.
• Screens a significant percentage of the babies prior to discharge • Supervises day to day operation of the program • Consults as needed • Manages patient information and data for tracking and follow-up • Does significant percentage of outpatient hearing screening • Does diagnostic evaluations for infants referred from the screening program
4. Who provides the screening? In a typical week, who performs the newborn hearing screenings? Please indicate the percentage of screenings completed by each of the following groups in a typical week, so that the total percent for question 5 equals 100%.
• Nurses • Medical Assistants/Technicians • Volunteers • Audiologists • Contract with Pediatrix, Inc
5. Type of Screening equipment used:
• OAE only • AABR only • OAE and AABR
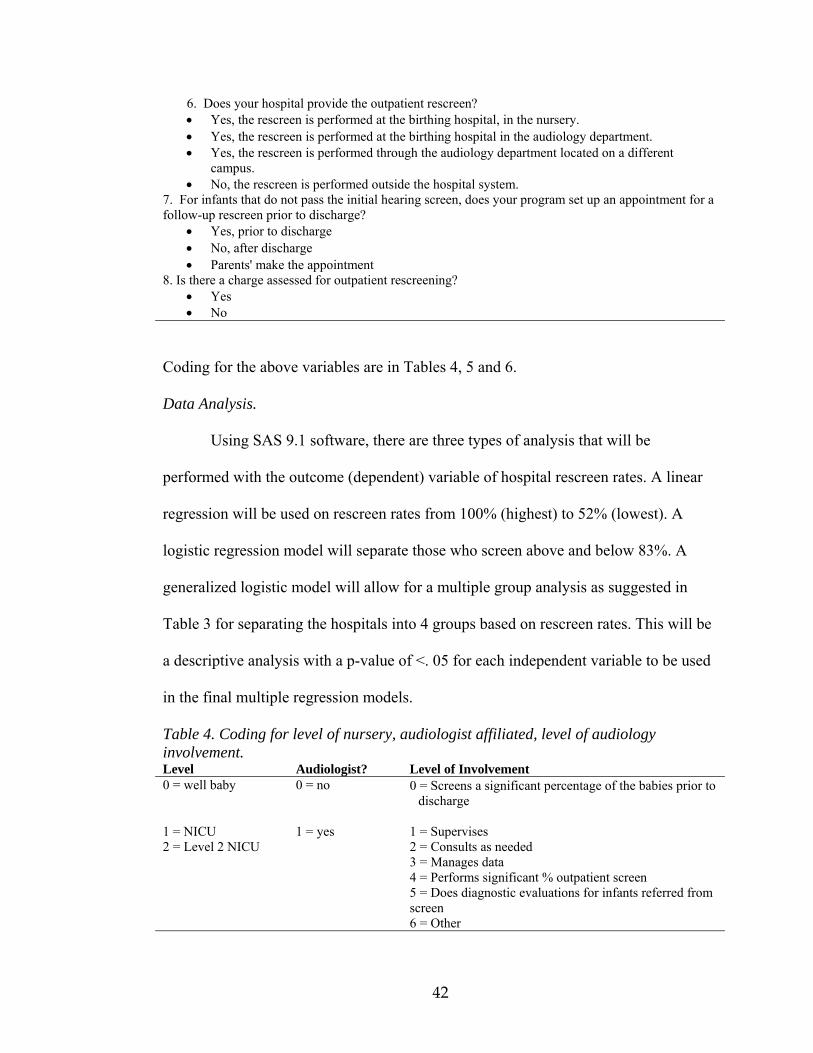
42
6. Does your hospital provide the outpatient rescreen? • Yes, the rescreen is performed at the birthing hospital, in the nursery. • Yes, the rescreen is performed at the birthing hospital in the audiology department. • Yes, the rescreen is performed through the audiology department located on a different
campus. • No, the rescreen is performed outside the hospital system.
7. For infants that do not pass the initial hearing screen, does your program set up an appointment for a follow-up rescreen prior to discharge?
• Yes, prior to discharge • No, after discharge • Parents' make the appointment
8. Is there a charge assessed for outpatient rescreening? • Yes • No
Coding for the above variables are in Tables 4, 5 and 6.
Data Analysis.
Using SAS 9.1 software, there are three types of analysis that will be
performed with the outcome (dependent) variable of hospital rescreen rates. A linear
regression will be used on rescreen rates from 100% (highest) to 52% (lowest). A
logistic regression model will separate those who screen above and below 83%. A
generalized logistic model will allow for a multiple group analysis as suggested in
Table 3 for separating the hospitals into 4 groups based on rescreen rates. This will be
a descriptive analysis with a p-value of <. 05 for each independent variable to be used
in the final multiple regression models.
Table 4. Coding for level of nursery, audiologist affiliated, level of audiology involvement. Level Audiologist? Level of Involvement 0 = well baby 0 = no 0 = Screens a significant percentage of the babies prior to
discharge
1 = NICU 1 = yes 1 = Supervises 2 = Level 2 NICU 2 = Consults as needed 3 = Manages data 4 = Performs significant % outpatient screen 5 = Does diagnostic evaluations for infants referred from
screen 6 = Other
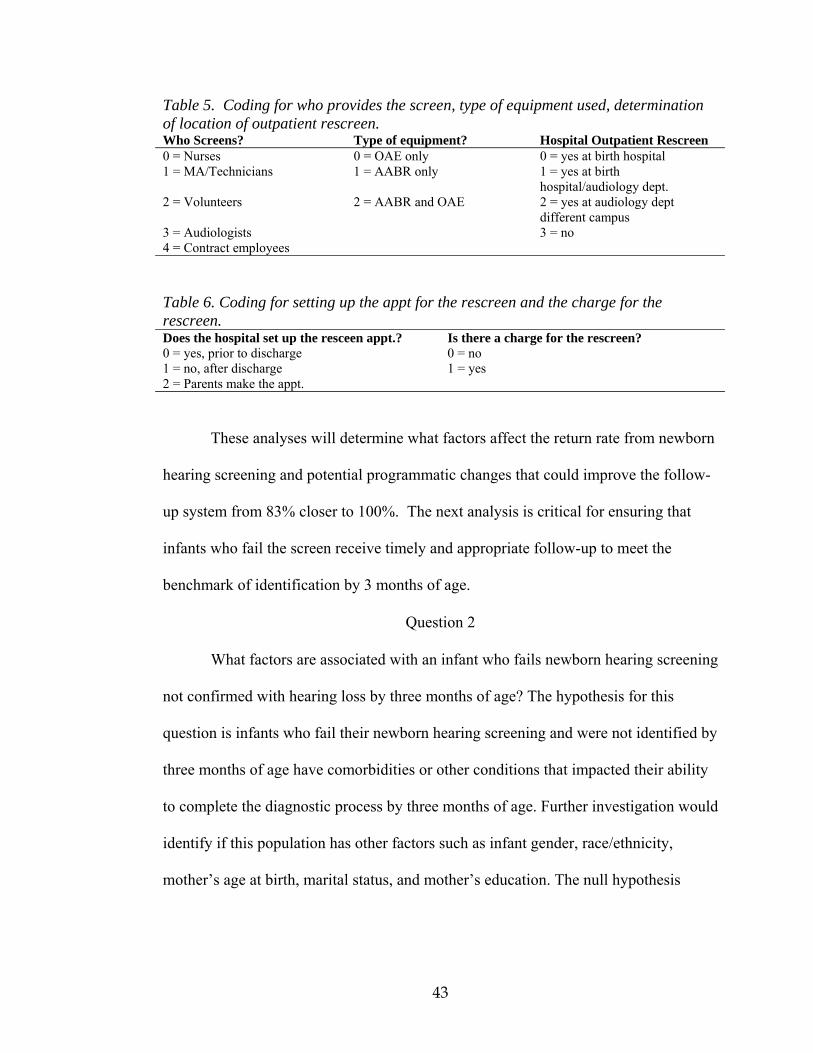
43
Table 5. Coding for who provides the screen, type of equipment used, determination of location of outpatient rescreen. Who Screens? Type of equipment? Hospital Outpatient Rescreen 0 = Nurses 0 = OAE only 0 = yes at birth hospital 1 = MA/Technicians 1 = AABR only 1 = yes at birth
hospital/audiology dept. 2 = Volunteers 2 = AABR and OAE 2 = yes at audiology dept
different campus 3 = Audiologists 3 = no 4 = Contract employees Table 6. Coding for setting up the appt for the rescreen and the charge for the rescreen. Does the hospital set up the resceen appt.? Is there a charge for the rescreen? 0 = yes, prior to discharge 0 = no 1 = no, after discharge 1 = yes 2 = Parents make the appt.
These analyses will determine what factors affect the return rate from newborn
hearing screening and potential programmatic changes that could improve the follow-
up system from 83% closer to 100%. The next analysis is critical for ensuring that
infants who fail the screen receive timely and appropriate follow-up to meet the
benchmark of identification by 3 months of age.
Question 2
What factors are associated with an infant who fails newborn hearing screening
not confirmed with hearing loss by three months of age? The hypothesis for this
question is infants who fail their newborn hearing screening and were not identified by
three months of age have comorbidities or other conditions that impacted their ability
to complete the diagnostic process by three months of age. Further investigation would
identify if this population has other factors such as infant gender, race/ethnicity,
mother’s age at birth, marital status, and mother’s education. The null hypothesis
44
would be there is no difference between this cohort of infants and those who were
identified by three months of age.
Subjects
There are 386 infants who have a confirmed permanent hearing loss between
2002 and 2005. The degrees of hearing losses range from mild to profound.
Procedure
Variables in the database obtained from the EBC include maternal
demographics and birth-related characteristics as well as hospital of birth. The Infant
Hearing database collects the number of births, the individual infants screened, infants
who failed the screen, and the infants who obtained follow-up screening. The
Colorado Responds to Children with Special Needs (CRCSN), Colorado’s birth
defects registry contains reportable hospital discharge data. Hospitals use the
International Classification for Diseases, 9th Version (ICD-9) codes to report
conditions that are associated with hearing loss such as stigmata and other findings
associated with a syndrome known to include sensorineural hearing loss, craniofacial
anomalies, in utero infection such as cytomegalovirus, herpes, toxoplasmosis, or
rubella. In addition the length of hospital stay is included. Individual case records for
the Infant Hearing database will be compared to the CRCSN database for ICD 9
codes. Audiologists report additional risk factors that are not included in the ICD 9
codes such as family history and progression from unilateral to bilateral. This
information is obtained from the Audiological Follow-up Form and entered into the
Infant Hearing database. These to categories (ICD 9 Codes and Risk Factors) will be
combined for independent variable of “comorbidity.”
45
Data Analysis
Using SAS 9.1 software, there are three types of analysis that will be
performed with the outcome (dependent) variable of high risk factors (ICD 9 Codes
and risks reported on Audiological Follow-up Form). A linear regression will be used
on the outcome variable month of identification from 1 month (lowest) to 50 (highest)
months of age. A logistic regression model will allow for a multiple group analysis as
suggested in Table 7 for separating age of identification into smaller groups.
A descriptive analysis of ICD 9 codes associated with hearing loss and
demographic data will be conducted to determine if there is an association between
these variables and late identification for a failed screen. This analysis may also
predict if specific factors are correlated to a later identification date. For example does
hospital length of stay significantly correlate to a later identification date as compared
to craniofacial anomalies? Coding for the variable ‘hospital length of stay’ will be
determined after the data is collected from CRCSN. Coding for the hospital rescreen
rates will be determined after the analysis is complete for the first hypothesis. All data
analyses will be performed using SAS 9.1 to identify strong/significant correlations,
associations and confounding variables using a logistic regression model. This will
be a descriptive analysis with a p-value of <.05 for each variable in the final multiple
regression model.
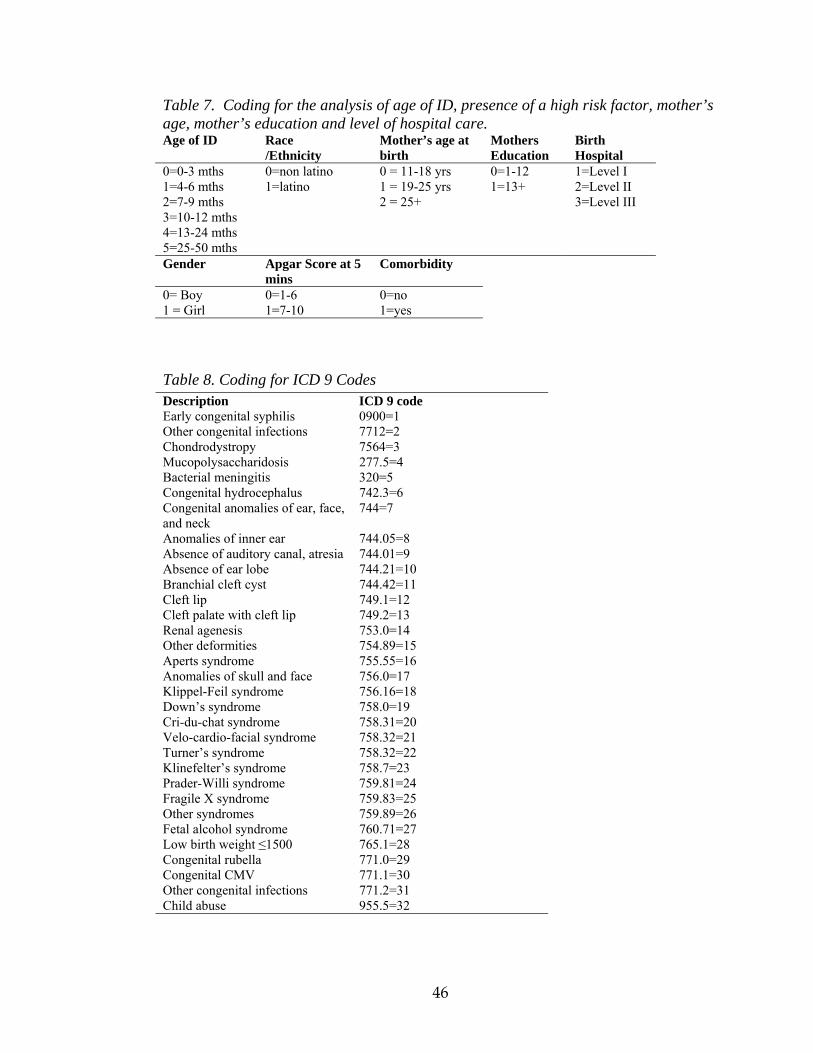
46
Table 7. Coding for the analysis of age of ID, presence of a high risk factor, mother’s age, mother’s education and level of hospital care. Age of ID Race
/Ethnicity Mother’s age at birth
Mothers Education
Birth Hospital
0=0-3 mths 0=non latino 0 = 11-18 yrs 0=1-12 1=Level I 1=4-6 mths 1=latino 1 = 19-25 yrs 1=13+ 2=Level II 2=7-9 mths 2 = 25+ 3=Level III 3=10-12 mths 4=13-24 mths 5=25-50 mths Gender Apgar Score at 5
mins Comorbidity
0= Boy 0=1-6 0=no 1 = Girl 1=7-10 1=yes
Table 8. Coding for ICD 9 Codes Description ICD 9 code Early congenital syphilis 0900=1 Other congenital infections 7712=2 Chondrodystropy 7564=3 Mucopolysaccharidosis 277.5=4 Bacterial meningitis 320=5 Congenital hydrocephalus 742.3=6 Congenital anomalies of ear, face, and neck
744=7
Anomalies of inner ear 744.05=8 Absence of auditory canal, atresia 744.01=9 Absence of ear lobe 744.21=10 Branchial cleft cyst 744.42=11 Cleft lip 749.1=12 Cleft palate with cleft lip 749.2=13 Renal agenesis 753.0=14 Other deformities 754.89=15 Aperts syndrome 755.55=16 Anomalies of skull and face 756.0=17 Klippel-Feil syndrome 756.16=18 Down’s syndrome 758.0=19 Cri-du-chat syndrome 758.31=20 Velo-cardio-facial syndrome 758.32=21 Turner’s syndrome 758.32=22 Klinefelter’s syndrome 758.7=23 Prader-Willi syndrome 759.81=24 Fragile X syndrome 759.83=25 Other syndromes 759.89=26 Fetal alcohol syndrome 760.71=27 Low birth weight ≤1500 765.1=28 Congenital rubella 771.0=29 Congenital CMV 771.1=30 Other congenital infections 771.2=31 Child abuse 955.5=32
47
These analyses will determine if late confirmation of hearing loss is associated
with comorbidities or other factors. These analyses will provide guidance to the
Colorado Infant Hearing Program to plan and implement new protocols at the state
and local levels to ensure that infants receive timely diagnostic confirmation of
hearing loss.
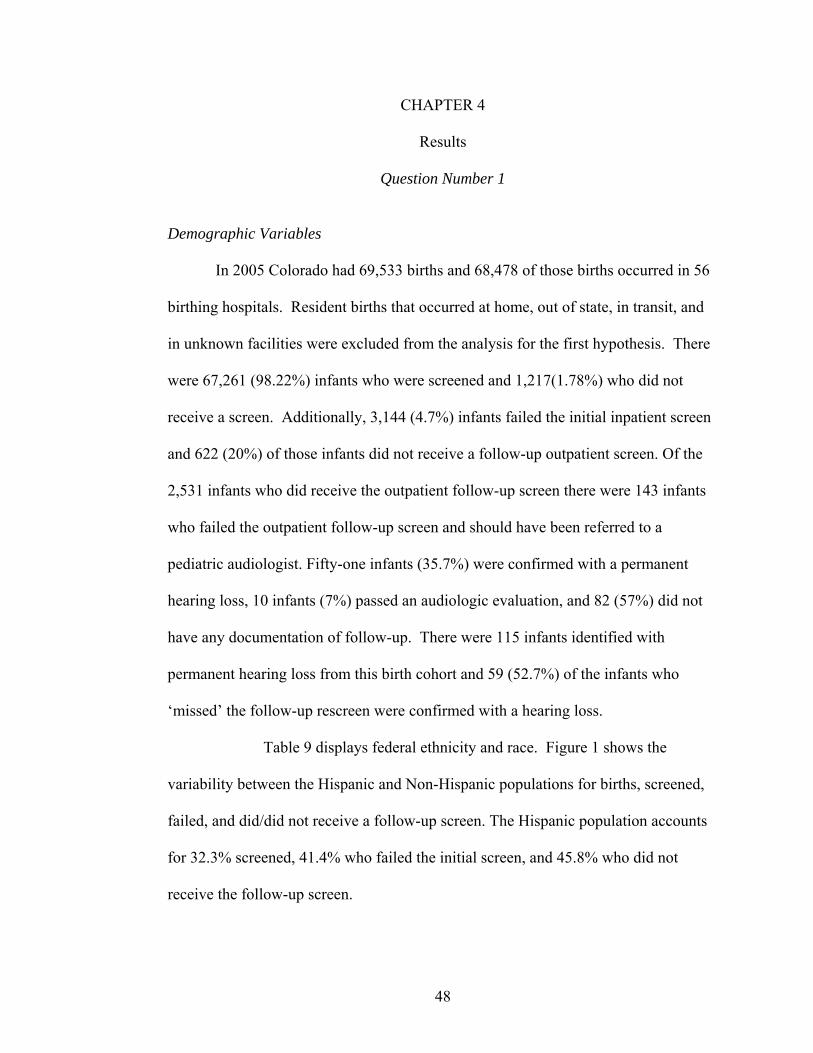
48
CHAPTER 4
Results
Question Number 1
Demographic Variables
In 2005 Colorado had 69,533 births and 68,478 of those births occurred in 56
birthing hospitals. Resident births that occurred at home, out of state, in transit, and
in unknown facilities were excluded from the analysis for the first hypothesis. There
were 67,261 (98.22%) infants who were screened and 1,217(1.78%) who did not
receive a screen. Additionally, 3,144 (4.7%) infants failed the initial inpatient screen
and 622 (20%) of those infants did not receive a follow-up outpatient screen. Of the
2,531 infants who did receive the outpatient follow-up screen there were 143 infants
who failed the outpatient follow-up screen and should have been referred to a
pediatric audiologist. Fifty-one infants (35.7%) were confirmed with a permanent
hearing loss, 10 infants (7%) passed an audiologic evaluation, and 82 (57%) did not
have any documentation of follow-up. There were 115 infants identified with
permanent hearing loss from this birth cohort and 59 (52.7%) of the infants who
‘missed’ the follow-up rescreen were confirmed with a hearing loss.
Table 9 displays federal ethnicity and race. Figure 1 shows the
variability between the Hispanic and Non-Hispanic populations for births, screened,
failed, and did/did not receive a follow-up screen. The Hispanic population accounts
for 32.3% screened, 41.4% who failed the initial screen, and 45.8% who did not
receive the follow-up screen.
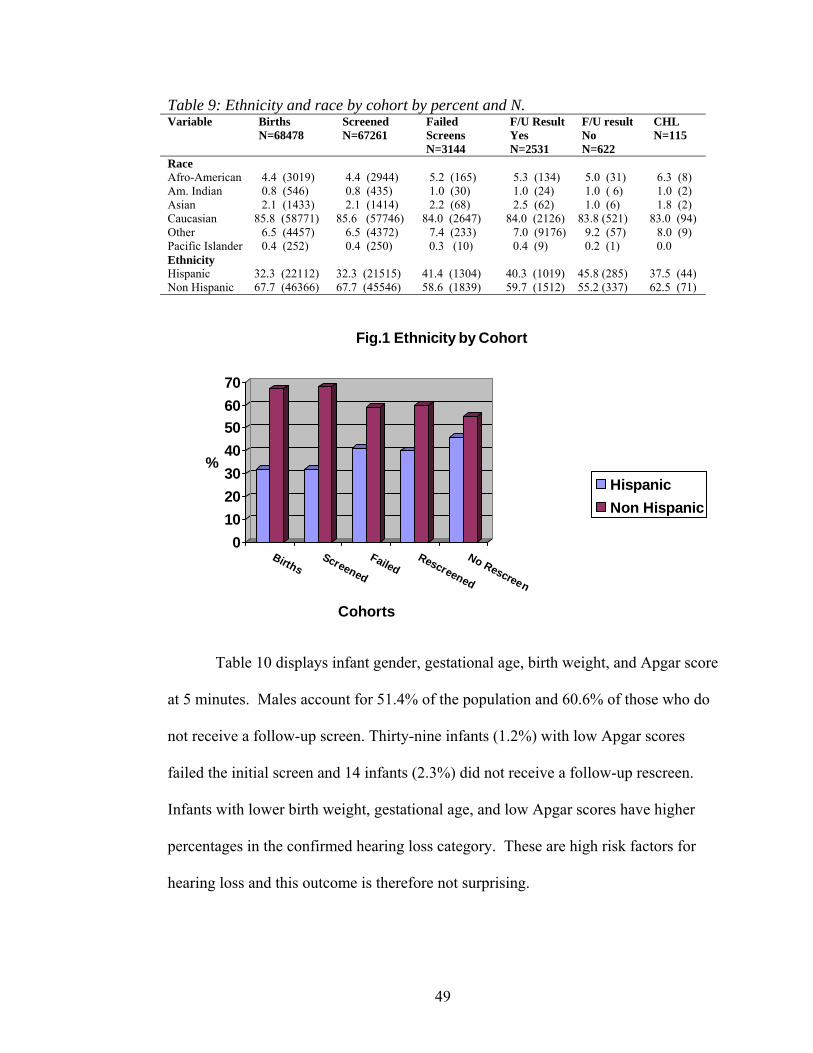
49
Table 9: Ethnicity and race by cohort by percent and N. Variable Births
N=68478 Screened N=67261
Failed Screens N=3144
F/U Result Yes N=2531
F/U result No N=622
CHL N=115
Race Afro-American 4.4 (3019) 4.4 (2944) 5.2 (165) 5.3 (134) 5.0 (31) 6.3 (8) Am. Indian 0.8 (546) 0.8 (435) 1.0 (30) 1.0 (24) 1.0 ( 6) 1.0 (2) Asian 2.1 (1433) 2.1 (1414) 2.2 (68) 2.5 (62) 1.0 (6) 1.8 (2) Caucasian 85.8 (58771) 85.6 (57746) 84.0 (2647) 84.0 (2126) 83.8 (521) 83.0 (94) Other 6.5 (4457) 6.5 (4372) 7.4 (233) 7.0 (9176) 9.2 (57) 8.0 (9) Pacific Islander 0.4 (252) 0.4 (250) 0.3 (10) 0.4 (9) 0.2 (1) 0.0 Ethnicity Hispanic 32.3 (22112) 32.3 (21515) 41.4 (1304) 40.3 (1019) 45.8 (285) 37.5 (44) Non Hispanic 67.7 (46366) 67.7 (45546) 58.6 (1839) 59.7 (1512) 55.2 (337) 62.5 (71)
010203040506070
%
BirthsScreened
FailedRescreened
No Rescreen
Cohorts
Fig.1 Ethnicity by Cohort
HispanicNon Hispanic
Table 10 displays infant gender, gestational age, birth weight, and Apgar score
at 5 minutes. Males account for 51.4% of the population and 60.6% of those who do
not receive a follow-up screen. Thirty-nine infants (1.2%) with low Apgar scores
failed the initial screen and 14 infants (2.3%) did not receive a follow-up rescreen.
Infants with lower birth weight, gestational age, and low Apgar scores have higher
percentages in the confirmed hearing loss category. These are high risk factors for
hearing loss and this outcome is therefore not surprising.
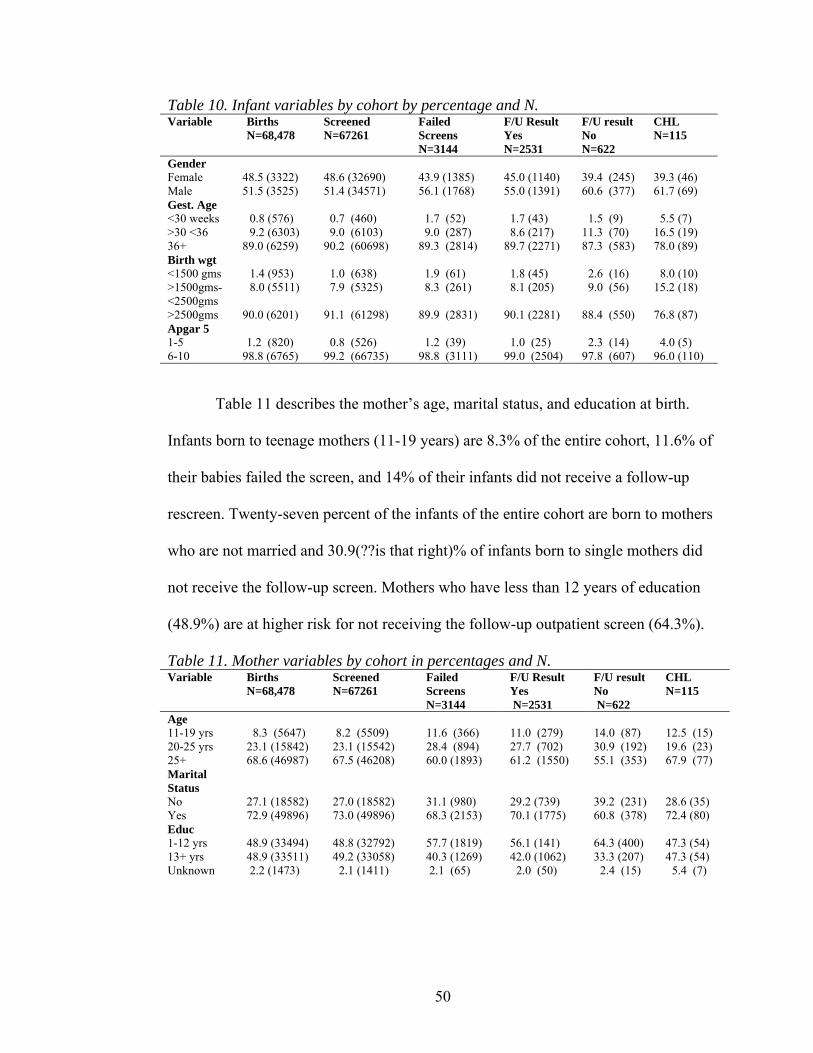
50
Table 10. Infant variables by cohort by percentage and N. Variable Births
N=68,478 Screened N=67261
Failed Screens N=3144
F/U Result Yes N=2531
F/U result No N=622
CHL N=115
Gender Female 48.5 (3322) 48.6 (32690) 43.9 (1385) 45.0 (1140) 39.4 (245) 39.3 (46) Male 51.5 (3525) 51.4 (34571) 56.1 (1768) 55.0 (1391) 60.6 (377) 61.7 (69) Gest. Age <30 weeks 0.8 (576) 0.7 (460) 1.7 (52) 1.7 (43) 1.5 (9) 5.5 (7) >30 <36 9.2 (6303) 9.0 (6103) 9.0 (287) 8.6 (217) 11.3 (70) 16.5 (19) 36+ 89.0 (6259) 90.2 (60698) 89.3 (2814) 89.7 (2271) 87.3 (583) 78.0 (89) Birth wgt <1500 gms 1.4 (953) 1.0 (638) 1.9 (61) 1.8 (45) 2.6 (16) 8.0 (10) >1500gms-<2500gms
8.0 (5511) 7.9 (5325) 8.3 (261) 8.1 (205) 9.0 (56) 15.2 (18)
>2500gms 90.0 (6201) 91.1 (61298) 89.9 (2831) 90.1 (2281) 88.4 (550) 76.8 (87) Apgar 5 1-5 1.2 (820) 0.8 (526) 1.2 (39) 1.0 (25) 2.3 (14) 4.0 (5) 6-10 98.8 (6765) 99.2 (66735) 98.8 (3111) 99.0 (2504) 97.8 (607) 96.0 (110) Table 11 describes the mother’s age, marital status, and education at birth.
Infants born to teenage mothers (11-19 years) are 8.3% of the entire cohort, 11.6% of
their babies failed the screen, and 14% of their infants did not receive a follow-up
rescreen. Twenty-seven percent of the infants of the entire cohort are born to mothers
who are not married and 30.9(??is that right)% of infants born to single mothers did
not receive the follow-up screen. Mothers who have less than 12 years of education
(48.9%) are at higher risk for not receiving the follow-up outpatient screen (64.3%).
Table 11. Mother variables by cohort in percentages and N. Variable Births
N=68,478 Screened N=67261
Failed Screens N=3144
F/U Result Yes N=2531
F/U result No N=622
CHL N=115
Age 11-19 yrs 8.3 (5647) 8.2 (5509) 11.6 (366) 11.0 (279) 14.0 (87) 12.5 (15) 20-25 yrs 23.1 (15842) 23.1 (15542) 28.4 (894) 27.7 (702) 30.9 (192) 19.6 (23) 25+ 68.6 (46987) 67.5 (46208) 60.0 (1893) 61.2 (1550) 55.1 (353) 67.9 (77) Marital Status
No 27.1 (18582) 27.0 (18582) 31.1 (980) 29.2 (739) 39.2 (231) 28.6 (35) Yes 72.9 (49896) 73.0 (49896) 68.3 (2153) 70.1 (1775) 60.8 (378) 72.4 (80) Educ 1-12 yrs 48.9 (33494) 48.8 (32792) 57.7 (1819) 56.1 (141) 64.3 (400) 47.3 (54) 13+ yrs 48.9 (33511) 49.2 (33058) 40.3 (1269) 42.0 (1062) 33.3 (207) 47.3 (54) Unknown 2.2 (1473) 2.1 (1411) 2.1 (65) 2.0 (50) 2.4 (15) 5.4 (7)
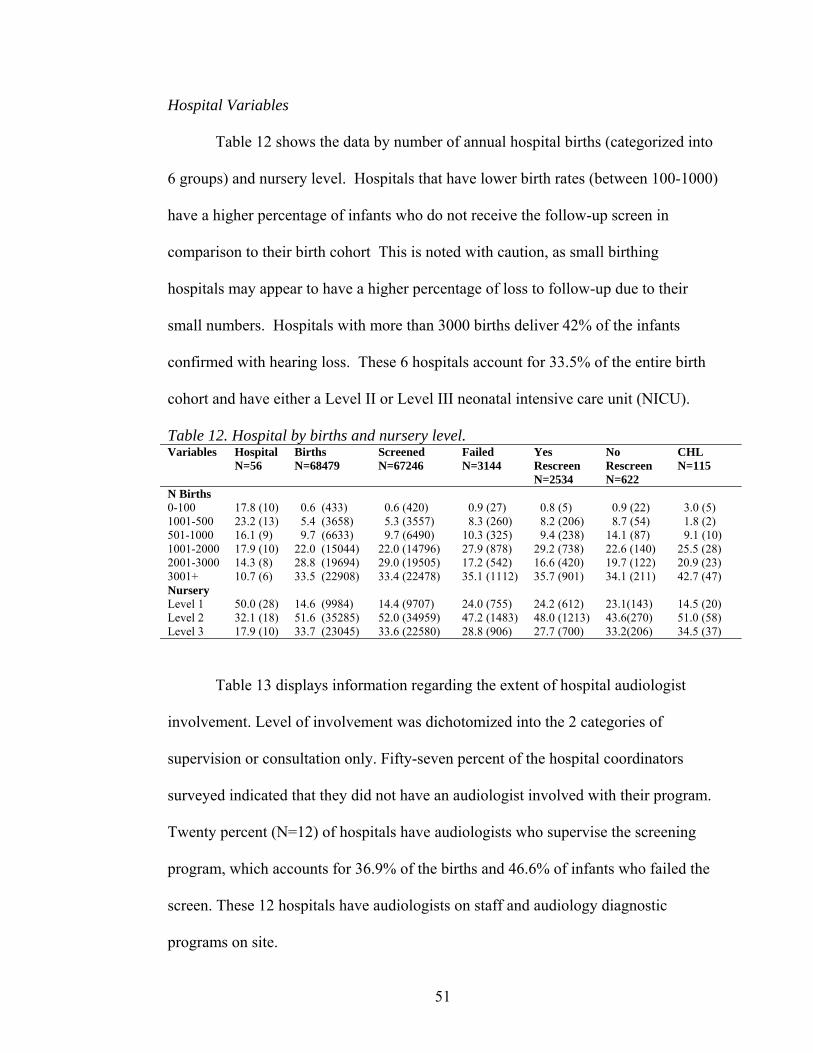
51
Hospital Variables Table 12 shows the data by number of annual hospital births (categorized into
6 groups) and nursery level. Hospitals that have lower birth rates (between 100-1000)
have a higher percentage of infants who do not receive the follow-up screen in
comparison to their birth cohort This is noted with caution, as small birthing
hospitals may appear to have a higher percentage of loss to follow-up due to their
small numbers. Hospitals with more than 3000 births deliver 42% of the infants
confirmed with hearing loss. These 6 hospitals account for 33.5% of the entire birth
cohort and have either a Level II or Level III neonatal intensive care unit (NICU).
Table 12. Hospital by births and nursery level. Variables Hospital
N=56 Births N=68479
Screened N=67246
Failed N=3144
Yes Rescreen N=2534
No Rescreen N=622
CHL N=115
N Births 0-100 17.8 (10) 0.6 (433) 0.6 (420) 0.9 (27) 0.8 (5) 0.9 (22) 3.0 (5) 1001-500 23.2 (13) 5.4 (3658) 5.3 (3557) 8.3 (260) 8.2 (206) 8.7 (54) 1.8 (2) 501-1000 16.1 (9) 9.7 (6633) 9.7 (6490) 10.3 (325) 9.4 (238) 14.1 (87) 9.1 (10) 1001-2000 17.9 (10) 22.0 (15044) 22.0 (14796) 27.9 (878) 29.2 (738) 22.6 (140) 25.5 (28) 2001-3000 14.3 (8) 28.8 (19694) 29.0 (19505) 17.2 (542) 16.6 (420) 19.7 (122) 20.9 (23) 3001+ 10.7 (6) 33.5 (22908) 33.4 (22478) 35.1 (1112) 35.7 (901) 34.1 (211) 42.7 (47) Nursery Level 1 50.0 (28) 14.6 (9984) 14.4 (9707) 24.0 (755) 24.2 (612) 23.1(143) 14.5 (20) Level 2 32.1 (18) 51.6 (35285) 52.0 (34959) 47.2 (1483) 48.0 (1213) 43.6(270) 51.0 (58) Level 3 17.9 (10) 33.7 (23045) 33.6 (22580) 28.8 (906) 27.7 (700) 33.2(206) 34.5 (37)
Table 13 displays information regarding the extent of hospital audiologist
involvement. Level of involvement was dichotomized into the 2 categories of
supervision or consultation only. Fifty-seven percent of the hospital coordinators
surveyed indicated that they did not have an audiologist involved with their program.
Twenty percent (N=12) of hospitals have audiologists who supervise the screening
program, which accounts for 36.9% of the births and 46.6% of infants who failed the
screen. These 12 hospitals have audiologists on staff and audiology diagnostic
programs on site.
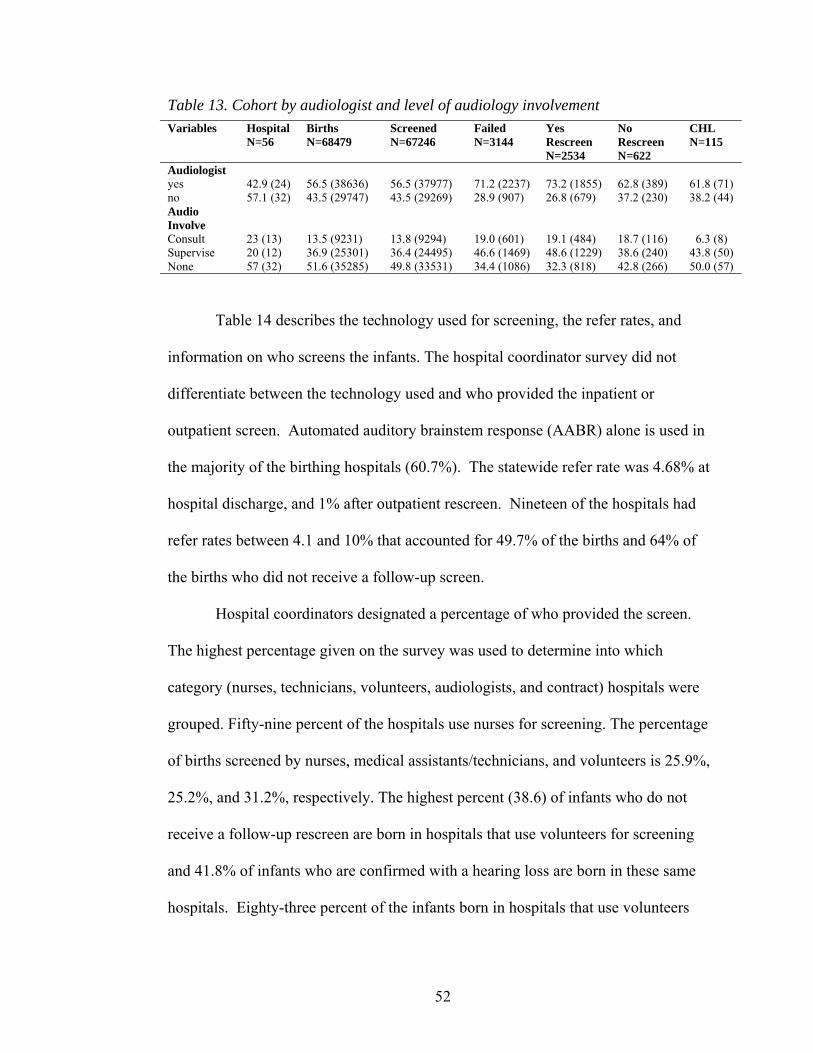
52
Table 13. Cohort by audiologist and level of audiology involvement
Table 14 describes the technology used for screening, the refer rates, and
information on who screens the infants. The hospital coordinator survey did not
differentiate between the technology used and who provided the inpatient or
outpatient screen. Automated auditory brainstem response (AABR) alone is used in
the majority of the birthing hospitals (60.7%). The statewide refer rate was 4.68% at
hospital discharge, and 1% after outpatient rescreen. Nineteen of the hospitals had
refer rates between 4.1 and 10% that accounted for 49.7% of the births and 64% of
the births who did not receive a follow-up screen.
Hospital coordinators designated a percentage of who provided the screen.
The highest percentage given on the survey was used to determine into which
category (nurses, technicians, volunteers, audiologists, and contract) hospitals were
grouped. Fifty-nine percent of the hospitals use nurses for screening. The percentage
of births screened by nurses, medical assistants/technicians, and volunteers is 25.9%,
25.2%, and 31.2%, respectively. The highest percent (38.6) of infants who do not
receive a follow-up rescreen are born in hospitals that use volunteers for screening
and 41.8% of infants who are confirmed with a hearing loss are born in these same
hospitals. Eighty-three percent of the infants born in hospitals that use volunteers
Variables Hospital N=56
Births N=68479
Screened N=67246
Failed N=3144
Yes Rescreen N=2534
No Rescreen N=622
CHL N=115
Audiologist yes 42.9 (24) 56.5 (38636) 56.5 (37977) 71.2 (2237) 73.2 (1855) 62.8 (389) 61.8 (71) no 57.1 (32) 43.5 (29747) 43.5 (29269) 28.9 (907) 26.8 (679) 37.2 (230) 38.2 (44) Audio Involve
Consult 23 (13) 13.5 (9231) 13.8 (9294) 19.0 (601) 19.1 (484) 18.7 (116) 6.3 (8) Supervise 20 (12) 36.9 (25301) 36.4 (24495) 46.6 (1469) 48.6 (1229) 38.6 (240) 43.8 (50) None 57 (32) 51.6 (35285) 49.8 (33531) 34.4 (1086) 32.3 (818) 42.8 (266) 50.0 (57)
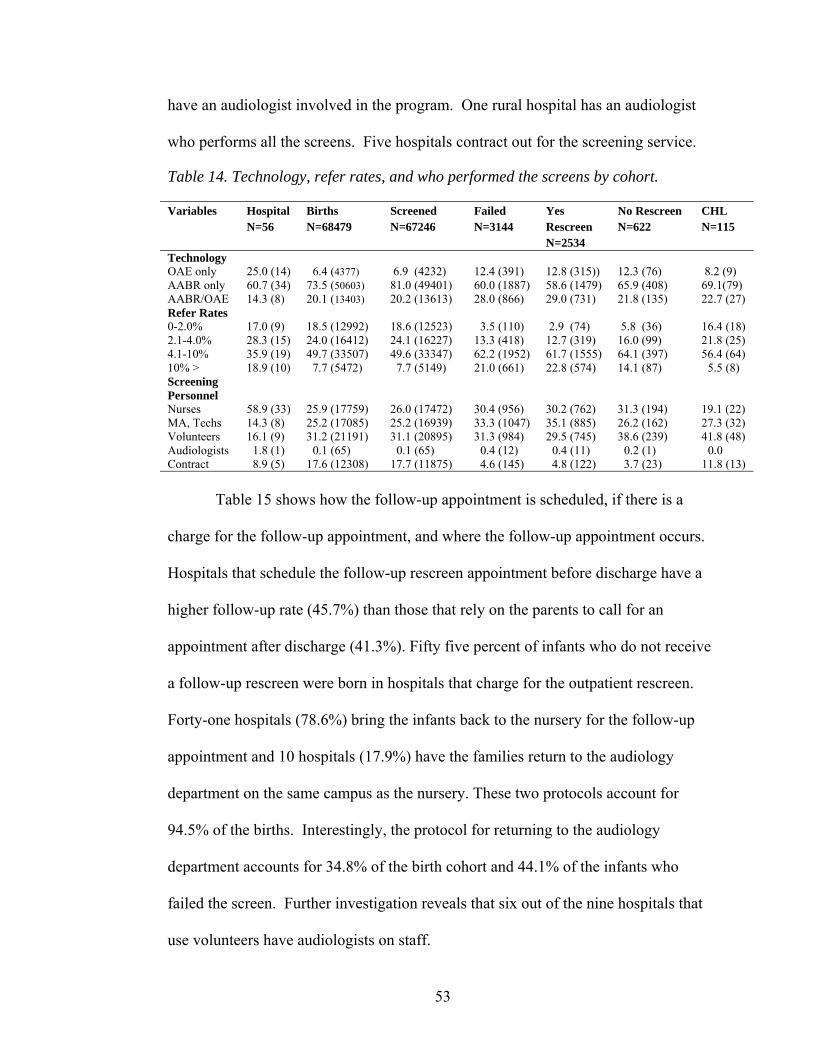
53
have an audiologist involved in the program. One rural hospital has an audiologist
who performs all the screens. Five hospitals contract out for the screening service.
Table 14. Technology, refer rates, and who performed the screens by cohort.
Table 15 shows how the follow-up appointment is scheduled, if there is a
charge for the follow-up appointment, and where the follow-up appointment occurs.
Hospitals that schedule the follow-up rescreen appointment before discharge have a
higher follow-up rate (45.7%) than those that rely on the parents to call for an
appointment after discharge (41.3%). Fifty five percent of infants who do not receive
a follow-up rescreen were born in hospitals that charge for the outpatient rescreen.
Forty-one hospitals (78.6%) bring the infants back to the nursery for the follow-up
appointment and 10 hospitals (17.9%) have the families return to the audiology
department on the same campus as the nursery. These two protocols account for
94.5% of the births. Interestingly, the protocol for returning to the audiology
department accounts for 34.8% of the birth cohort and 44.1% of the infants who
failed the screen. Further investigation reveals that six out of the nine hospitals that
use volunteers have audiologists on staff.
Variables Hospital N=56
Births N=68479
Screened N=67246
Failed N=3144
Yes Rescreen N=2534
No Rescreen N=622
CHL N=115
Technology OAE only 25.0 (14) 6.4 (4377) 6.9 (4232) 12.4 (391) 12.8 (315)) 12.3 (76) 8.2 (9) AABR only 60.7 (34) 73.5 (50603) 81.0 (49401) 60.0 (1887) 58.6 (1479) 65.9 (408) 69.1(79) AABR/OAE 14.3 (8) 20.1 (13403) 20.2 (13613) 28.0 (866) 29.0 (731) 21.8 (135) 22.7 (27) Refer Rates 0-2.0% 17.0 (9) 18.5 (12992) 18.6 (12523) 3.5 (110) 2.9 (74) 5.8 (36) 16.4 (18) 2.1-4.0% 28.3 (15) 24.0 (16412) 24.1 (16227) 13.3 (418) 12.7 (319) 16.0 (99) 21.8 (25) 4.1-10% 35.9 (19) 49.7 (33507) 49.6 (33347) 62.2 (1952) 61.7 (1555) 64.1 (397) 56.4 (64) 10% > 18.9 (10) 7.7 (5472) 7.7 (5149) 21.0 (661) 22.8 (574) 14.1 (87) 5.5 (8) Screening Personnel
Nurses 58.9 (33) 25.9 (17759) 26.0 (17472) 30.4 (956) 30.2 (762) 31.3 (194) 19.1 (22) MA, Techs 14.3 (8) 25.2 (17085) 25.2 (16939) 33.3 (1047) 35.1 (885) 26.2 (162) 27.3 (32) Volunteers 16.1 (9) 31.2 (21191) 31.1 (20895) 31.3 (984) 29.5 (745) 38.6 (239) 41.8 (48) Audiologists 1.8 (1) 0.1 (65) 0.1 (65) 0.4 (12) 0.4 (11) 0.2 (1) 0.0 Contract 8.9 (5) 17.6 (12308) 17.7 (11875) 4.6 (145) 4.8 (122) 3.7 (23) 11.8 (13)
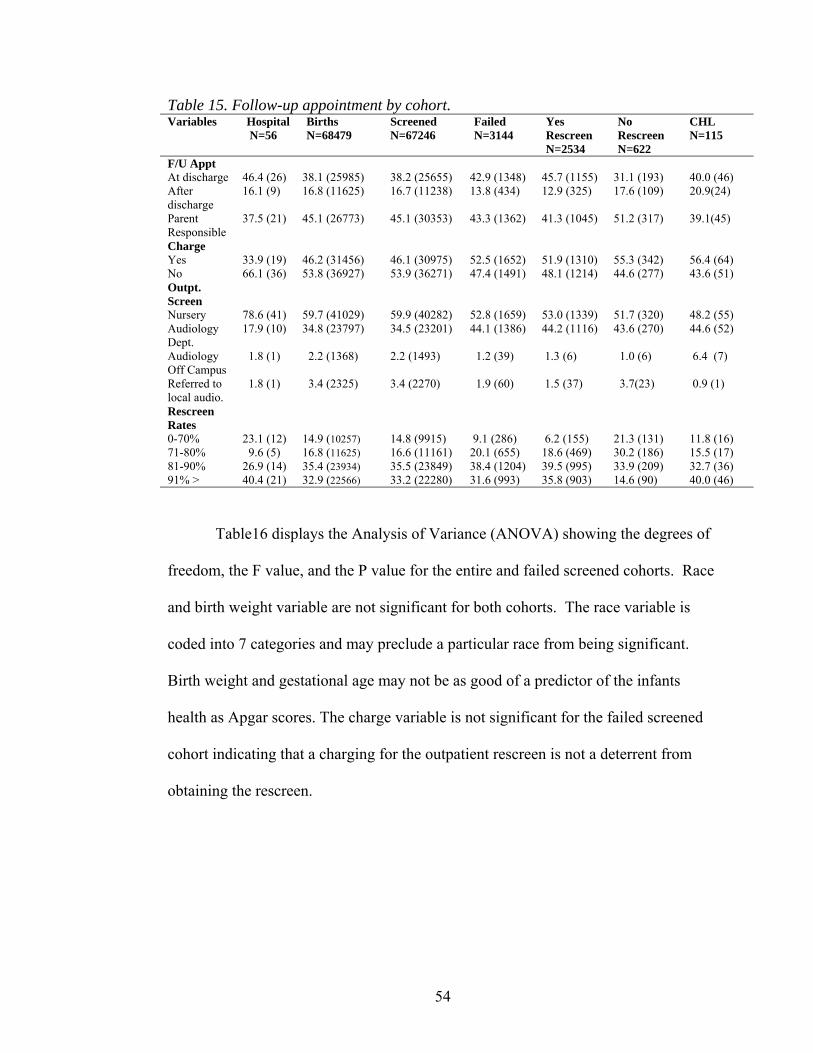
54
Table 15. Follow-up appointment by cohort. Variables Hospital
N=56 Births N=68479
Screened N=67246
Failed N=3144
Yes Rescreen N=2534
No Rescreen N=622
CHL N=115
F/U Appt At discharge 46.4 (26) 38.1 (25985) 38.2 (25655) 42.9 (1348) 45.7 (1155) 31.1 (193) 40.0 (46) After discharge
16.1 (9) 16.8 (11625) 16.7 (11238) 13.8 (434) 12.9 (325) 17.6 (109) 20.9(24)
Parent Responsible
37.5 (21) 45.1 (26773) 45.1 (30353) 43.3 (1362) 41.3 (1045) 51.2 (317) 39.1(45)
Charge Yes 33.9 (19) 46.2 (31456) 46.1 (30975) 52.5 (1652) 51.9 (1310) 55.3 (342) 56.4 (64) No 66.1 (36) 53.8 (36927) 53.9 (36271) 47.4 (1491) 48.1 (1214) 44.6 (277) 43.6 (51) Outpt. Screen
Nursery 78.6 (41) 59.7 (41029) 59.9 (40282) 52.8 (1659) 53.0 (1339) 51.7 (320) 48.2 (55) Audiology Dept.
17.9 (10) 34.8 (23797) 34.5 (23201) 44.1 (1386) 44.2 (1116) 43.6 (270) 44.6 (52)
Audiology Off Campus
1.8 (1) 2.2 (1368) 2.2 (1493) 1.2 (39) 1.3 (6) 1.0 (6) 6.4 (7)
Referred to local audio.
1.8 (1) 3.4 (2325) 3.4 (2270) 1.9 (60) 1.5 (37) 3.7(23) 0.9 (1)
Rescreen Rates
0-70% 23.1 (12) 14.9 (10257) 14.8 (9915) 9.1 (286) 6.2 (155) 21.3 (131) 11.8 (16) 71-80% 9.6 (5) 16.8 (11625) 16.6 (11161) 20.1 (655) 18.6 (469) 30.2 (186) 15.5 (17) 81-90% 26.9 (14) 35.4 (23934) 35.5 (23849) 38.4 (1204) 39.5 (995) 33.9 (209) 32.7 (36) 91% > 40.4 (21) 32.9 (22566) 33.2 (22280) 31.6 (993) 35.8 (903) 14.6 (90) 40.0 (46)
Table16 displays the Analysis of Variance (ANOVA) showing the degrees of
freedom, the F value, and the P value for the entire and failed screened cohorts. Race
and birth weight variable are not significant for both cohorts. The race variable is
coded into 7 categories and may preclude a particular race from being significant.
Birth weight and gestational age may not be as good of a predictor of the infants
health as Apgar scores. The charge variable is not significant for the failed screened
cohort indicating that a charging for the outpatient rescreen is not a deterrent from
obtaining the rescreen.
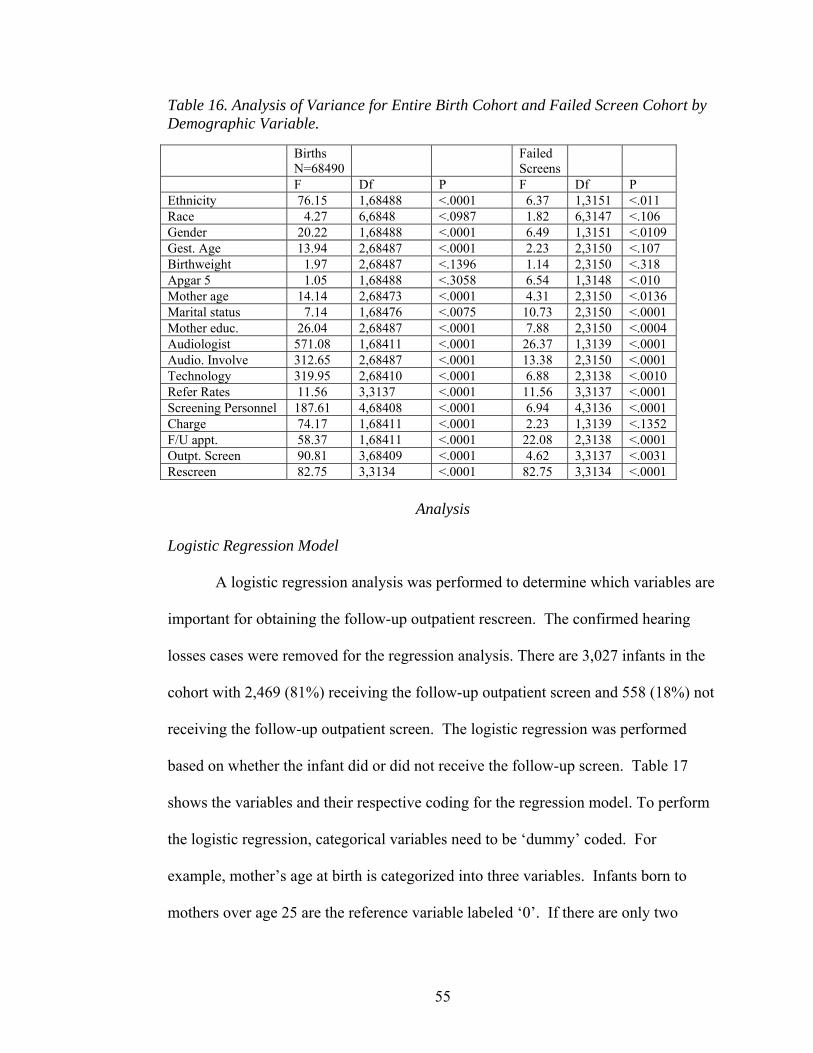
55
Table 16. Analysis of Variance for Entire Birth Cohort and Failed Screen Cohort by Demographic Variable.
Analysis
Logistic Regression Model
A logistic regression analysis was performed to determine which variables are
important for obtaining the follow-up outpatient rescreen. The confirmed hearing
losses cases were removed for the regression analysis. There are 3,027 infants in the
cohort with 2,469 (81%) receiving the follow-up outpatient screen and 558 (18%) not
receiving the follow-up outpatient screen. The logistic regression was performed
based on whether the infant did or did not receive the follow-up screen. Table 17
shows the variables and their respective coding for the regression model. To perform
the logistic regression, categorical variables need to be ‘dummy’ coded. For
example, mother’s age at birth is categorized into three variables. Infants born to
mothers over age 25 are the reference variable labeled ‘0’. If there are only two
Births N=68490
Failed Screens
F Df P F Df P Ethnicity 76.15 1,68488 <.0001 6.37 1,3151 <.011 Race 4.27 6,6848 <.0987 1.82 6,3147 <.106 Gender 20.22 1,68488 <.0001 6.49 1,3151 <.0109 Gest. Age 13.94 2,68487 <.0001 2.23 2,3150 <.107 Birthweight 1.97 2,68487 <.1396 1.14 2,3150 <.318 Apgar 5 1.05 1,68488 <.3058 6.54 1,3148 <.010 Mother age 14.14 2,68473 <.0001 4.31 2,3150 <.0136 Marital status 7.14 1,68476 <.0075 10.73 2,3150 <.0001 Mother educ. 26.04 2,68487 <.0001 7.88 2,3150 <.0004 Audiologist 571.08 1,68411 <.0001 26.37 1,3139 <.0001 Audio. Involve 312.65 2,68487 <.0001 13.38 2,3150 <.0001 Technology 319.95 2,68410 <.0001 6.88 2,3138 <.0010 Refer Rates 11.56 3,3137 <.0001 11.56 3,3137 <.0001 Screening Personnel 187.61 4,68408 <.0001 6.94 4,3136 <.0001 Charge 74.17 1,68411 <.0001 2.23 1,3139 <.1352 F/U appt. 58.37 1,68411 <.0001 22.08 2,3138 <.0001 Outpt. Screen 90.81 3,68409 <.0001 4.62 3,3137 <.0031 Rescreen 82.75 3,3134 <.0001 82.75 3,3134 <.0001
56
categories then the regression is based on the larger number (1). Ethnicity is
categorized into Hispanic and Non-Hispanic so the regression is based on the Non-
Hispanic population.
Table 17. Variables and Coding for the Logistic Regression Model. Variable Coding Ethnicity 1=Hispanic, 2=Non-Hispanic Gender 1=Female, 2 =Male Gestational age 0=>36 weeks, 1=<36 weeks Birth weight 0=>2500 gms, 1=<2500gms APGAR 5 0=>7, 1=<7 Mother’s age 0=25+, 1=20 – 24, 1=11 – 19 Marital Status 0=yes, 1=no Mothers Education 0=>12, 1=<12 Birthrate 0=>3001, 1=2001-3000, 1=1001-2000, 1=<1000 Nursery Level 0=Well baby, 1=Level 2, 1=Level 3 Audiologist 1=yes, 2=no Technology 0=AABR only, 1=OAE only, 1=Both Refer Rates 0=0-5%, 1=5.1-10%, 1=>10% Screening Personnel 0=Nurses, 1=Techs, 1=Volunteers, v Follow-up Appt. scheduling 0=prior to discharge, 1=after discharge, 1=parent
responsible Charge 1=yes, 2= no Outpatient Screen 0=nursery, 1=audiology dept, 1=Refer out Rescreen Rates 0=90-100%, 1=80-90%, 1=>79%
Variables were recoded into smaller groups to make the groups more evenly
distributed. Gestational age was recoded from 3 groups into two groups above or
below 36 week of age. Birth weight was recoded into two groups above or below
2500 grams at birth. Apgar score at 5 minutes was recoded into above or below an
Apgar score of 7 (versus 6). Hospitals with less than 500 births were added to those
with 500-1000 births decreasing the number of groups from 5 to 4. The variable
determining the level of audiology involvement was removed due to the variety of
options hospital coordinators could choose from (e.g. consultation only, supervise,
manage the data) which resulted in 18 different categories. The variable of whether
there was or was not an audiologist involved with the program was kept in the
regression. Refer rates were recoded into 3 groups. The reference group includes
57
hospitals with rates between 4 and 5%, which includes the statewide average refer
rate of 4.68%. In the screening personnel variable, the cohort screened by the
audiologist was combined with the cohort screened by technicians since this
accounted for only 12 infants and one hospital. Contract employees were also
combined with technicians since the number was small (N=145) in comparison to the
other groups. The variable for how the follow-up appointment is scheduled was
combined into two groups based on when the appointment is scheduled (prior to or
after discharge) and whether the parents are responsible for scheduling the rescreen
appointment after discharge. The variable describing where the outpatient screen
occurred combined the audiology department on a campus different from the nursery
with the audiology department on the same campus as the nursery. Lastly, the
rescreen rate was reorganized into 3 groups with 90-100% as the reference group.
Table 18 displays the variables and their respective odds ratios, 95% confidence
intervals, and p values. Table 19 provides an explanation of the odds ratios for each
of the variables.
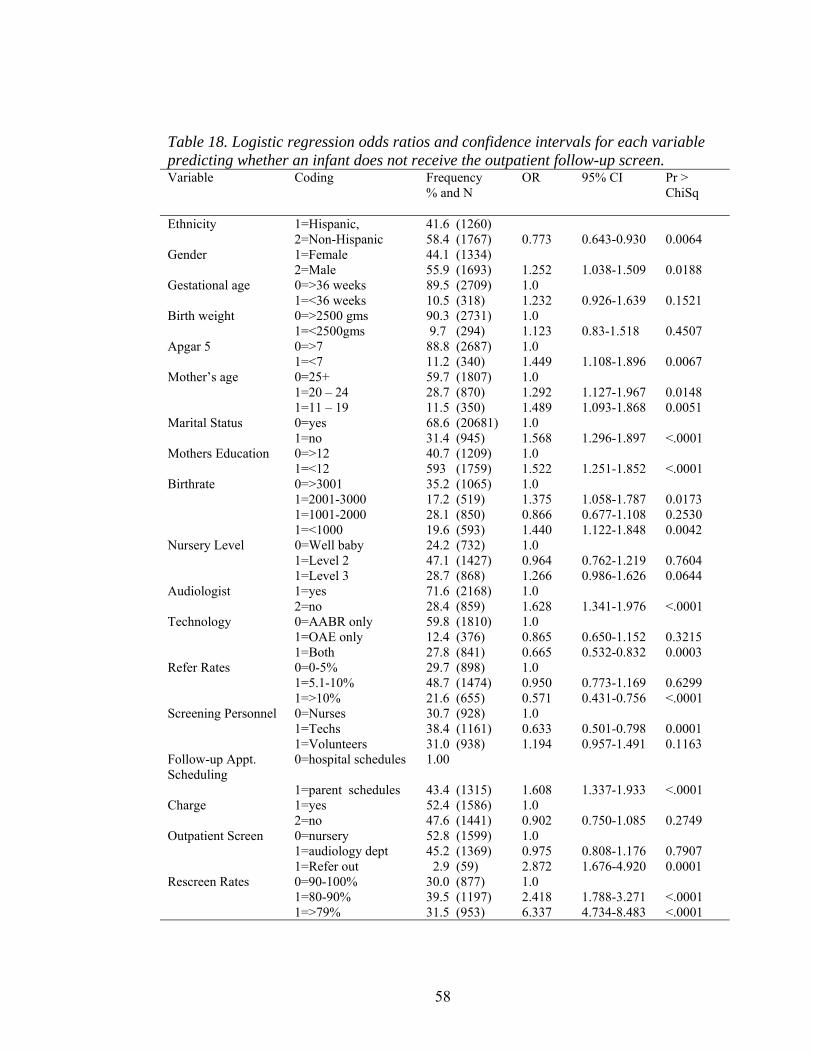
58
Table 18. Logistic regression odds ratios and confidence intervals for each variable predicting whether an infant does not receive the outpatient follow-up screen. Variable Coding Frequency
% and N OR 95% CI Pr >
ChiSq
Ethnicity 1=Hispanic, 2=Non-Hispanic
41.6 (1260) 58.4 (1767)
0.773
0.643-0.930
0.0064
Gender 1=Female 2=Male
44.1 (1334) 55.9 (1693)
1.252
1.038-1.509
0.0188
Gestational age 0=>36 weeks 89.5 (2709) 1.0 1=<36 weeks 10.5 (318) 1.232 0.926-1.639 0.1521 Birth weight 0=>2500 gms 90.3 (2731) 1.0 1=<2500gms 9.7 (294) 1.123 0.83-1.518 0.4507 Apgar 5 0=>7 88.8 (2687) 1.0 1=<7 11.2 (340) 1.449 1.108-1.896 0.0067 Mother’s age 0=25+ 59.7 (1807) 1.0 1=20 – 24 28.7 (870) 1.292 1.127-1.967 0.0148 1=11 – 19 11.5 (350) 1.489 1.093-1.868 0.0051 Marital Status 0=yes 68.6 (20681) 1.0 1=no 31.4 (945) 1.568 1.296-1.897 <.0001 Mothers Education 0=>12 40.7 (1209) 1.0 1=<12 593 (1759) 1.522 1.251-1.852 <.0001 Birthrate 0=>3001 35.2 (1065) 1.0 1=2001-3000 17.2 (519) 1.375 1.058-1.787 0.0173 1=1001-2000 28.1 (850) 0.866 0.677-1.108 0.2530 1=<1000 19.6 (593) 1.440 1.122-1.848 0.0042 Nursery Level 0=Well baby 24.2 (732) 1.0 1=Level 2 47.1 (1427) 0.964 0.762-1.219 0.7604 1=Level 3 28.7 (868) 1.266 0.986-1.626 0.0644 Audiologist 1=yes 71.6 (2168) 1.0 2=no 28.4 (859) 1.628 1.341-1.976 <.0001 Technology 0=AABR only 59.8 (1810) 1.0 1=OAE only 12.4 (376) 0.865 0.650-1.152 0.3215 1=Both 27.8 (841) 0.665 0.532-0.832 0.0003 Refer Rates 0=0-5% 29.7 (898) 1.0 1=5.1-10% 48.7 (1474) 0.950 0.773-1.169 0.6299 1=>10% 21.6 (655) 0.571 0.431-0.756 <.0001 Screening Personnel 0=Nurses 30.7 (928) 1.0 1=Techs 38.4 (1161) 0.633 0.501-0.798 0.0001 1=Volunteers 31.0 (938) 1.194 0.957-1.491 0.1163 Follow-up Appt. Scheduling
0=hospital schedules 1.00
1=parent schedules 43.4 (1315) 1.608 1.337-1.933 <.0001 Charge 1=yes 52.4 (1586) 1.0 2=no 47.6 (1441) 0.902 0.750-1.085 0.2749 Outpatient Screen 0=nursery 52.8 (1599) 1.0 1=audiology dept 45.2 (1369) 0.975 0.808-1.176 0.7907 1=Refer out 2.9 (59) 2.872 1.676-4.920 0.0001 Rescreen Rates 0=90-100% 30.0 (877) 1.0 1=80-90% 39.5 (1197) 2.418 1.788-3.271 <.0001 1=>79% 31.5 (953) 6.337 4.734-8.483 <.0001
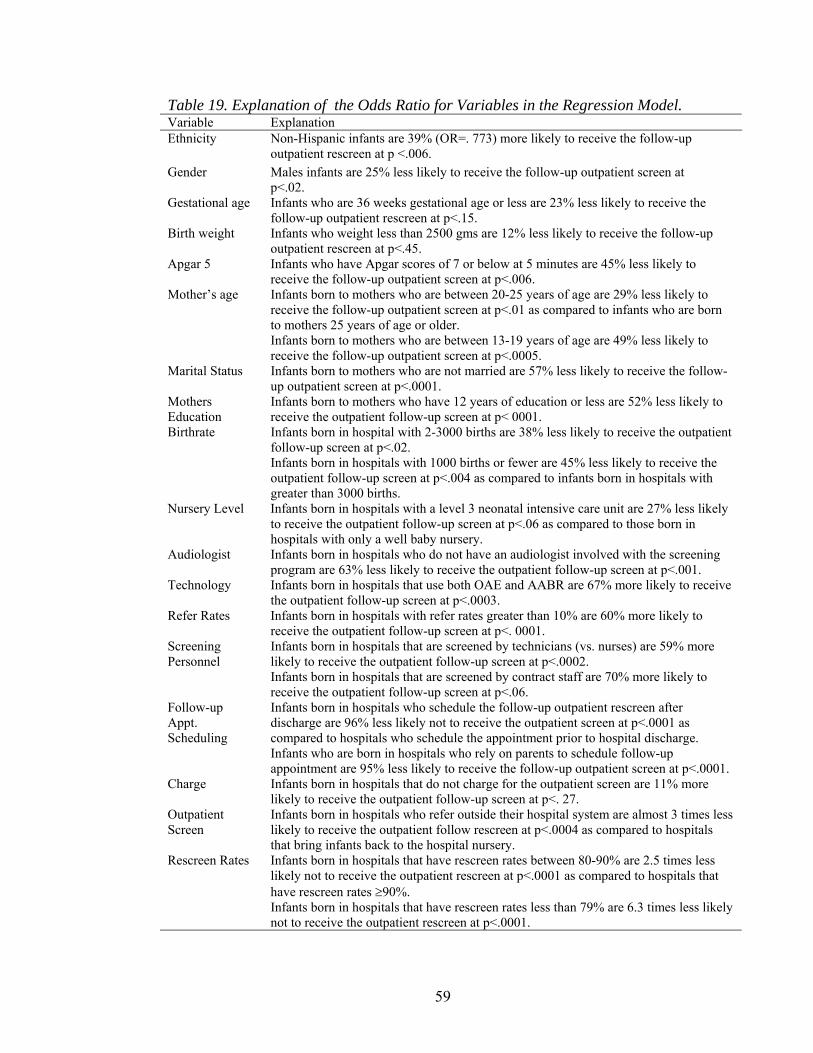
59
Table 19. Explanation of the Odds Ratio for Variables in the Regression Model. Variable Explanation Ethnicity Non-Hispanic infants are 39% (OR=. 773) more likely to receive the follow-up
outpatient rescreen at p <.006. Gender Males infants are 25% less likely to receive the follow-up outpatient screen at
p<.02. Gestational age Infants who are 36 weeks gestational age or less are 23% less likely to receive the
follow-up outpatient rescreen at p<.15. Birth weight Infants who weight less than 2500 gms are 12% less likely to receive the follow-up
outpatient rescreen at p<.45. Apgar 5 Infants who have Apgar scores of 7 or below at 5 minutes are 45% less likely to
receive the follow-up outpatient screen at p<.006. Mother’s age Infants born to mothers who are between 20-25 years of age are 29% less likely to
receive the follow-up outpatient screen at p<.01 as compared to infants who are born to mothers 25 years of age or older.
Infants born to mothers who are between 13-19 years of age are 49% less likely to receive the follow-up outpatient screen at p<.0005.
Marital Status Infants born to mothers who are not married are 57% less likely to receive the follow-up outpatient screen at p<.0001.
Mothers Education
Infants born to mothers who have 12 years of education or less are 52% less likely to receive the outpatient follow-up screen at p< 0001.
Birthrate Infants born in hospital with 2-3000 births are 38% less likely to receive the outpatient follow-up screen at p<.02. Infants born in hospitals with 1000 births or fewer are 45% less likely to receive the outpatient follow-up screen at p<.004 as compared to infants born in hospitals with greater than 3000 births.
Nursery Level Infants born in hospitals with a level 3 neonatal intensive care unit are 27% less likely to receive the outpatient follow-up screen at p<.06 as compared to those born in hospitals with only a well baby nursery.
Audiologist Infants born in hospitals who do not have an audiologist involved with the screening program are 63% less likely to receive the outpatient follow-up screen at p<.001.
Technology Infants born in hospitals that use both OAE and AABR are 67% more likely to receive the outpatient follow-up screen at p<.0003.
Refer Rates Infants born in hospitals with refer rates greater than 10% are 60% more likely to receive the outpatient follow-up screen at p<. 0001.
Screening Personnel
Infants born in hospitals that are screened by technicians (vs. nurses) are 59% more likely to receive the outpatient follow-up screen at p<.0002. Infants born in hospitals that are screened by contract staff are 70% more likely to receive the outpatient follow-up screen at p<.06.
Follow-up Appt. Scheduling
Infants born in hospitals who schedule the follow-up outpatient rescreen after discharge are 96% less likely not to receive the outpatient screen at p<.0001 as compared to hospitals who schedule the appointment prior to hospital discharge. Infants who are born in hospitals who rely on parents to schedule follow-up appointment are 95% less likely to receive the follow-up outpatient screen at p<.0001.
Charge Infants born in hospitals that do not charge for the outpatient screen are 11% more likely to receive the outpatient follow-up screen at p<. 27.
Outpatient Screen
Infants born in hospitals who refer outside their hospital system are almost 3 times less likely to receive the outpatient follow rescreen at p<.0004 as compared to hospitals that bring infants back to the hospital nursery.
Rescreen Rates Infants born in hospitals that have rescreen rates between 80-90% are 2.5 times less likely not to receive the outpatient rescreen at p<.0001 as compared to hospitals that have rescreen rates ≥90%.
Infants born in hospitals that have rescreen rates less than 79% are 6.3 times less likely not to receive the outpatient rescreen at p<.0001.
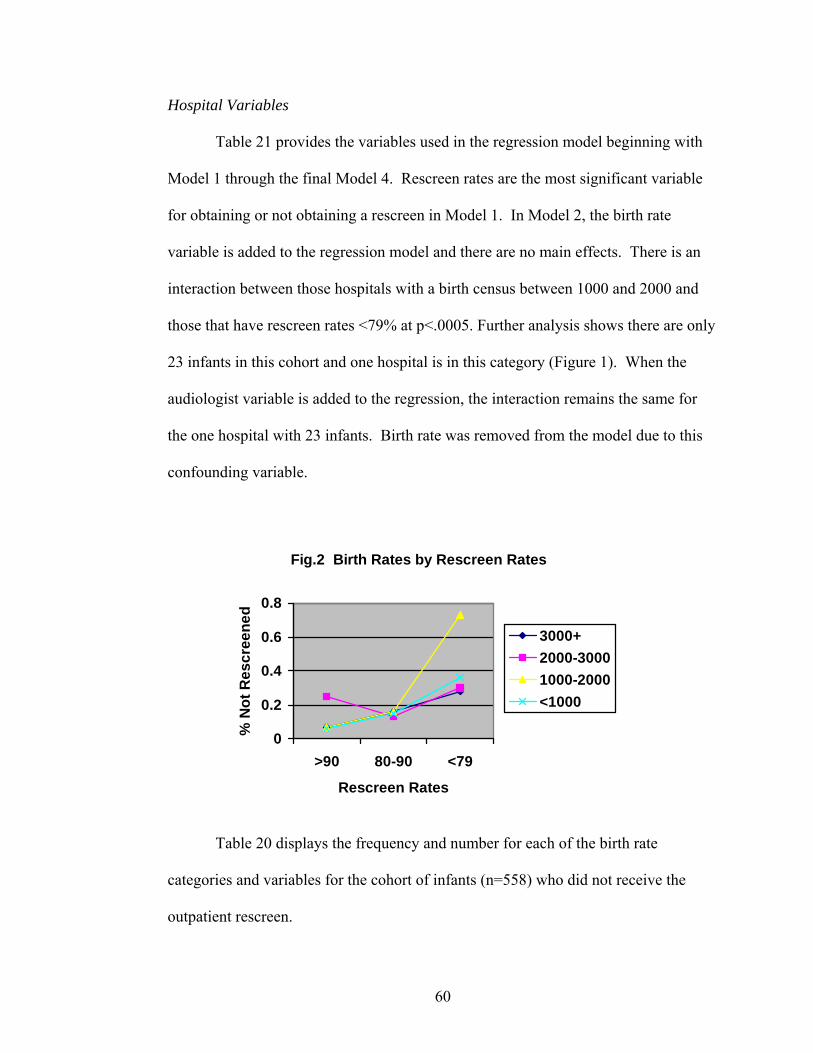
60
Hospital Variables
Table 21 provides the variables used in the regression model beginning with
Model 1 through the final Model 4. Rescreen rates are the most significant variable
for obtaining or not obtaining a rescreen in Model 1. In Model 2, the birth rate
variable is added to the regression model and there are no main effects. There is an
interaction between those hospitals with a birth census between 1000 and 2000 and
those that have rescreen rates <79% at p<.0005. Further analysis shows there are only
23 infants in this cohort and one hospital is in this category (Figure 1). When the
audiologist variable is added to the regression, the interaction remains the same for
the one hospital with 23 infants. Birth rate was removed from the model due to this
confounding variable.
Fig.2 Birth Rates by Rescreen Rates
0
0.2
0.4
0.6
0.8
>90 80-90 <79
Rescreen Rates
% N
ot R
escr
eene
d
3000+2000-30001000-2000<1000
Table 20 displays the frequency and number for each of the birth rate
categories and variables for the cohort of infants (n=558) who did not receive the
outpatient rescreen.
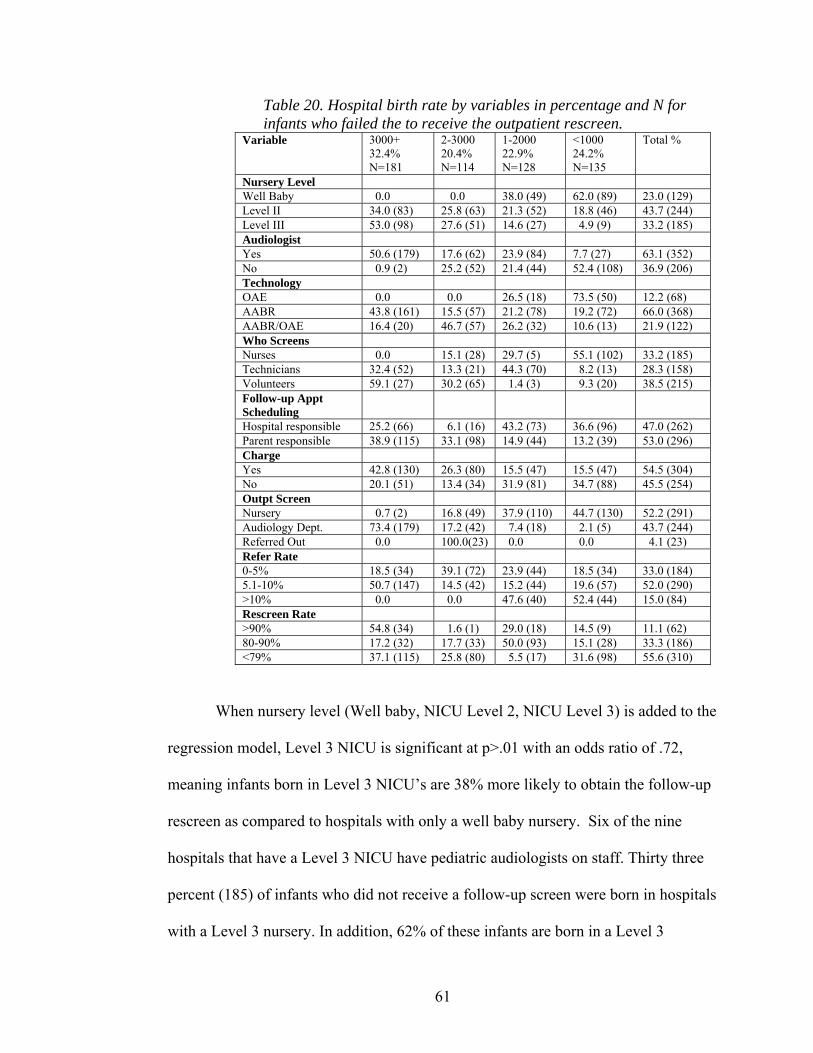
61
Table 20. Hospital birth rate by variables in percentage and N for infants who failed the to receive the outpatient rescreen.
Variable
3000+ 32.4% N=181
2-3000 20.4% N=114
1-2000 22.9% N=128
<1000 24.2% N=135
Total %
Nursery Level Well Baby 0.0 0.0 38.0 (49) 62.0 (89) 23.0 (129) Level II 34.0 (83) 25.8 (63) 21.3 (52) 18.8 (46) 43.7 (244) Level III 53.0 (98) 27.6 (51) 14.6 (27) 4.9 (9) 33.2 (185) Audiologist Yes 50.6 (179) 17.6 (62) 23.9 (84) 7.7 (27) 63.1 (352) No 0.9 (2) 25.2 (52) 21.4 (44) 52.4 (108) 36.9 (206) Technology OAE 0.0 0.0 26.5 (18) 73.5 (50) 12.2 (68) AABR 43.8 (161) 15.5 (57) 21.2 (78) 19.2 (72) 66.0 (368) AABR/OAE 16.4 (20) 46.7 (57) 26.2 (32) 10.6 (13) 21.9 (122) Who Screens Nurses 0.0 15.1 (28) 29.7 (5) 55.1 (102) 33.2 (185) Technicians 32.4 (52) 13.3 (21) 44.3 (70) 8.2 (13) 28.3 (158) Volunteers 59.1 (27) 30.2 (65) 1.4 (3) 9.3 (20) 38.5 (215) Follow-up Appt Scheduling
Hospital responsible 25.2 (66) 6.1 (16) 43.2 (73) 36.6 (96) 47.0 (262) Parent responsible 38.9 (115) 33.1 (98) 14.9 (44) 13.2 (39) 53.0 (296) Charge Yes 42.8 (130) 26.3 (80) 15.5 (47) 15.5 (47) 54.5 (304) No 20.1 (51) 13.4 (34) 31.9 (81) 34.7 (88) 45.5 (254) Outpt Screen Nursery 0.7 (2) 16.8 (49) 37.9 (110) 44.7 (130) 52.2 (291) Audiology Dept. 73.4 (179) 17.2 (42) 7.4 (18) 2.1 (5) 43.7 (244) Referred Out 0.0 100.0(23) 0.0 0.0 4.1 (23) Refer Rate 0-5% 18.5 (34) 39.1 (72) 23.9 (44) 18.5 (34) 33.0 (184) 5.1-10% 50.7 (147) 14.5 (42) 15.2 (44) 19.6 (57) 52.0 (290) >10% 0.0 0.0 47.6 (40) 52.4 (44) 15.0 (84) Rescreen Rate >90% 54.8 (34) 1.6 (1) 29.0 (18) 14.5 (9) 11.1 (62) 80-90% 17.2 (32) 17.7 (33) 50.0 (93) 15.1 (28) 33.3 (186) <79% 37.1 (115) 25.8 (80) 5.5 (17) 31.6 (98) 55.6 (310)
When nursery level (Well baby, NICU Level 2, NICU Level 3) is added to the
regression model, Level 3 NICU is significant at p>.01 with an odds ratio of .72,
meaning infants born in Level 3 NICU’s are 38% more likely to obtain the follow-up
rescreen as compared to hospitals with only a well baby nursery. Six of the nine
hospitals that have a Level 3 NICU have pediatric audiologists on staff. Thirty three
percent (185) of infants who did not receive a follow-up screen were born in hospitals
with a Level 3 nursery. In addition, 62% of these infants are born in a Level 3
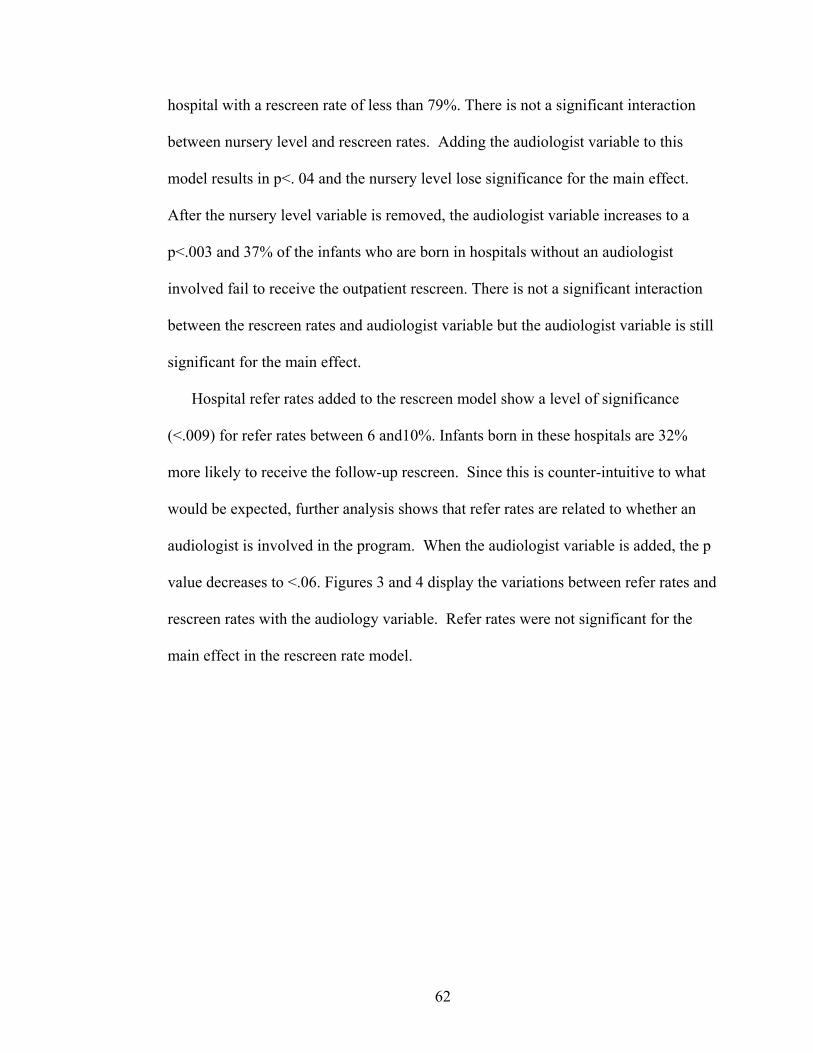
62
hospital with a rescreen rate of less than 79%. There is not a significant interaction
between nursery level and rescreen rates. Adding the audiologist variable to this
model results in p<. 04 and the nursery level lose significance for the main effect.
After the nursery level variable is removed, the audiologist variable increases to a
p<.003 and 37% of the infants who are born in hospitals without an audiologist
involved fail to receive the outpatient rescreen. There is not a significant interaction
between the rescreen rates and audiologist variable but the audiologist variable is still
significant for the main effect.
Hospital refer rates added to the rescreen model show a level of significance
(<.009) for refer rates between 6 and10%. Infants born in these hospitals are 32%
more likely to receive the follow-up rescreen. Since this is counter-intuitive to what
would be expected, further analysis shows that refer rates are related to whether an
audiologist is involved in the program. When the audiologist variable is added, the p
value decreases to <.06. Figures 3 and 4 display the variations between refer rates and
rescreen rates with the audiology variable. Refer rates were not significant for the
main effect in the rescreen rate model.
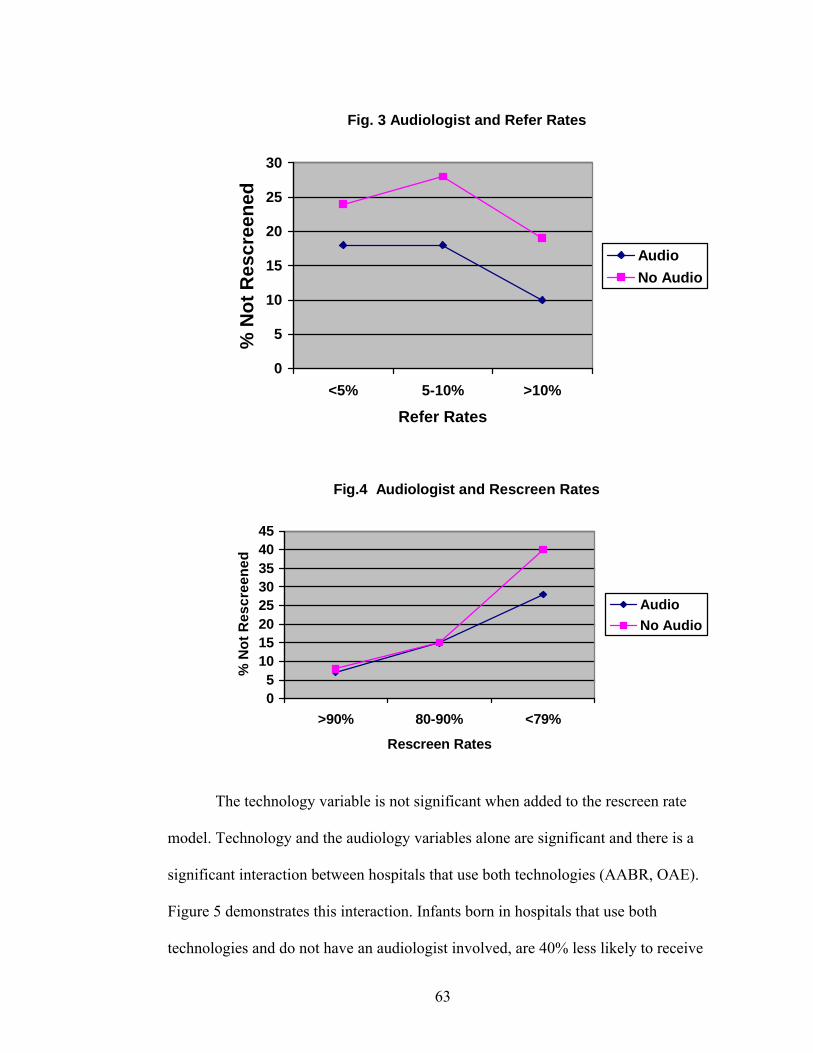
63
Fig. 3 Audiologist and Refer Rates
0
5
10
15
20
25
30
<5% 5-10% >10%
Refer Rates
% N
ot R
escr
eene
dAudioNo Audio
Fig.4 Audiologist and Rescreen Rates
05
1015202530354045
>90% 80-90% <79%
Rescreen Rates
% N
ot R
escr
eene
d
AudioNo Audio
The technology variable is not significant when added to the rescreen rate
model. Technology and the audiology variables alone are significant and there is a
significant interaction between hospitals that use both technologies (AABR, OAE).
Figure 5 demonstrates this interaction. Infants born in hospitals that use both
technologies and do not have an audiologist involved, are 40% less likely to receive
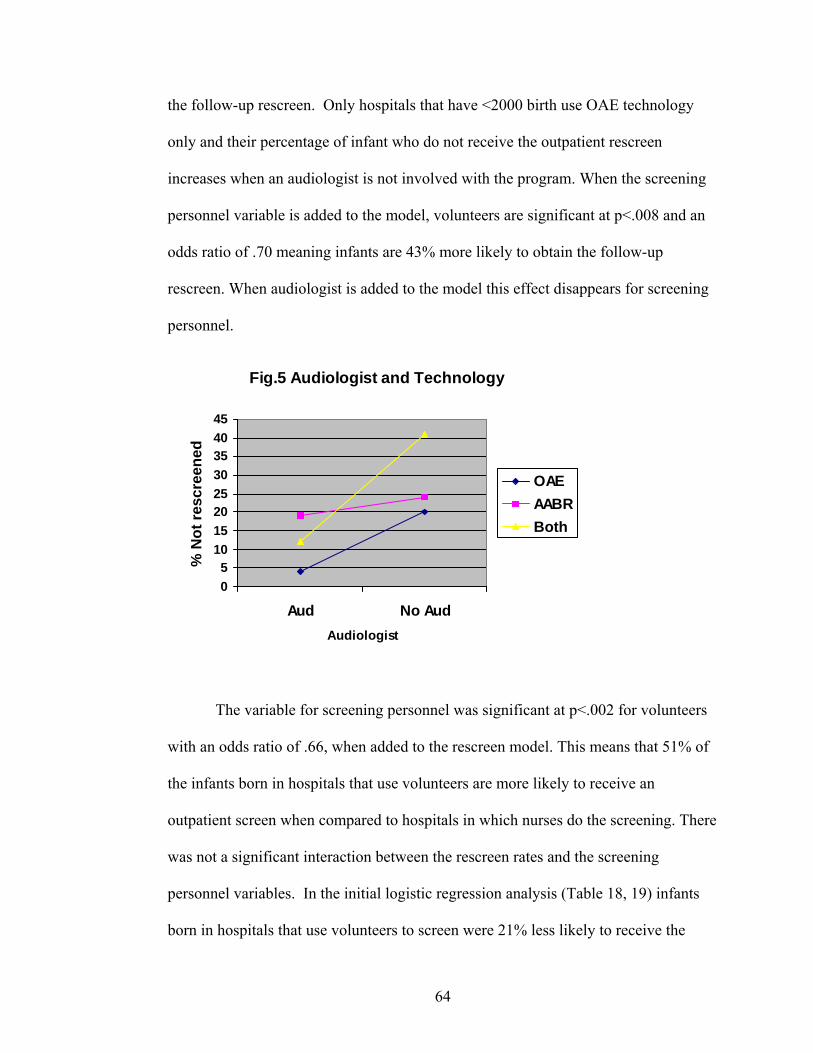
64
the follow-up rescreen. Only hospitals that have <2000 birth use OAE technology
only and their percentage of infant who do not receive the outpatient rescreen
increases when an audiologist is not involved with the program. When the screening
personnel variable is added to the model, volunteers are significant at p<.008 and an
odds ratio of .70 meaning infants are 43% more likely to obtain the follow-up
rescreen. When audiologist is added to the model this effect disappears for screening
personnel.
Fig.5 Audiologist and Technology
05
1015202530354045
Aud No AudAudiologist
% N
ot re
scre
ened
OAEAABRBoth
The variable for screening personnel was significant at p<.002 for volunteers
with an odds ratio of .66, when added to the rescreen model. This means that 51% of
the infants born in hospitals that use volunteers are more likely to receive an
outpatient screen when compared to hospitals in which nurses do the screening. There
was not a significant interaction between the rescreen rates and the screening
personnel variables. In the initial logistic regression analysis (Table 18, 19) infants
born in hospitals that use volunteers to screen were 21% less likely to receive the
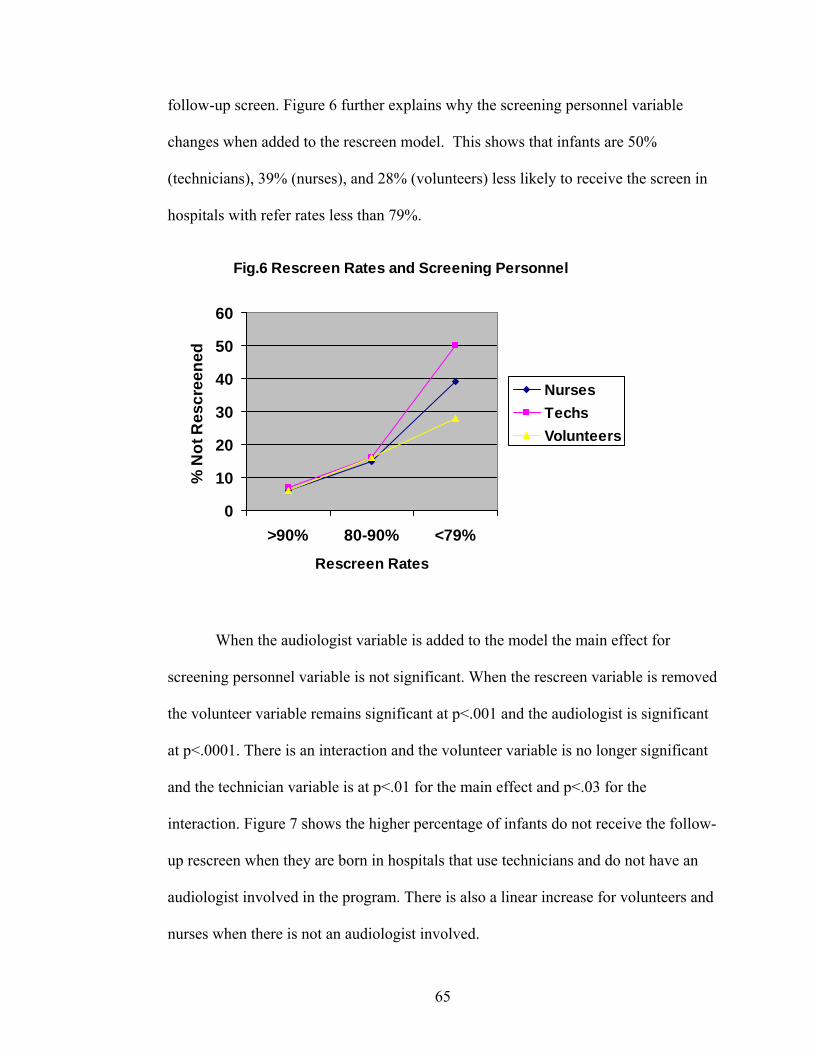
65
follow-up screen. Figure 6 further explains why the screening personnel variable
changes when added to the rescreen model. This shows that infants are 50%
(technicians), 39% (nurses), and 28% (volunteers) less likely to receive the screen in
hospitals with refer rates less than 79%.
Fig.6 Rescreen Rates and Screening Personnel
0
10
20
30
40
50
60
>90% 80-90% <79%
Rescreen Rates
% N
ot R
escr
eene
d
NursesTechsVolunteers
When the audiologist variable is added to the model the main effect for
screening personnel variable is not significant. When the rescreen variable is removed
the volunteer variable remains significant at p<.001 and the audiologist is significant
at p<.0001. There is an interaction and the volunteer variable is no longer significant
and the technician variable is at p<.01 for the main effect and p<.03 for the
interaction. Figure 7 shows the higher percentage of infants do not receive the follow-
up rescreen when they are born in hospitals that use technicians and do not have an
audiologist involved in the program. There is also a linear increase for volunteers and
nurses when there is not an audiologist involved.
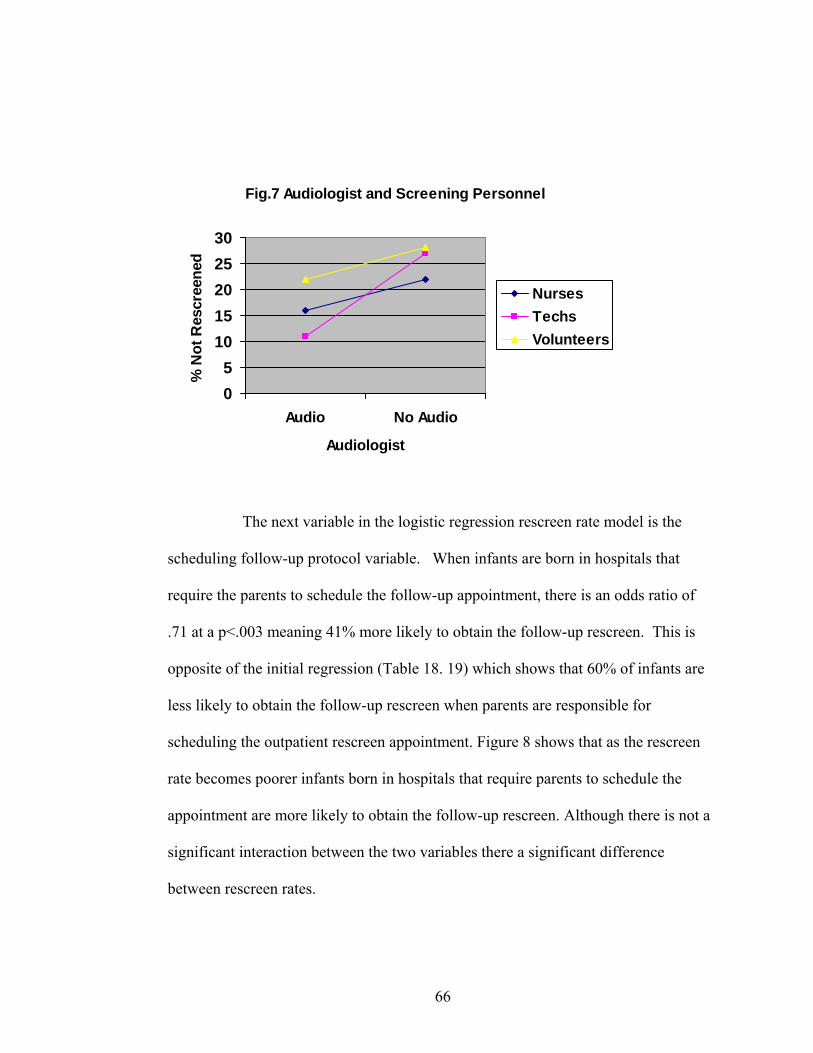
66
Fig.7 Audiologist and Screening Personnel
05
1015202530
Audio No Audio
Audiologist
% N
ot R
escr
eene
d
NursesTechsVolunteers
The next variable in the logistic regression rescreen rate model is the
scheduling follow-up protocol variable. When infants are born in hospitals that
require the parents to schedule the follow-up appointment, there is an odds ratio of
.71 at a p<.003 meaning 41% more likely to obtain the follow-up rescreen. This is
opposite of the initial regression (Table 18. 19) which shows that 60% of infants are
less likely to obtain the follow-up rescreen when parents are responsible for
scheduling the outpatient rescreen appointment. Figure 8 shows that as the rescreen
rate becomes poorer infants born in hospitals that require parents to schedule the
appointment are more likely to obtain the follow-up rescreen. Although there is not a
significant interaction between the two variables there a significant difference
between rescreen rates.
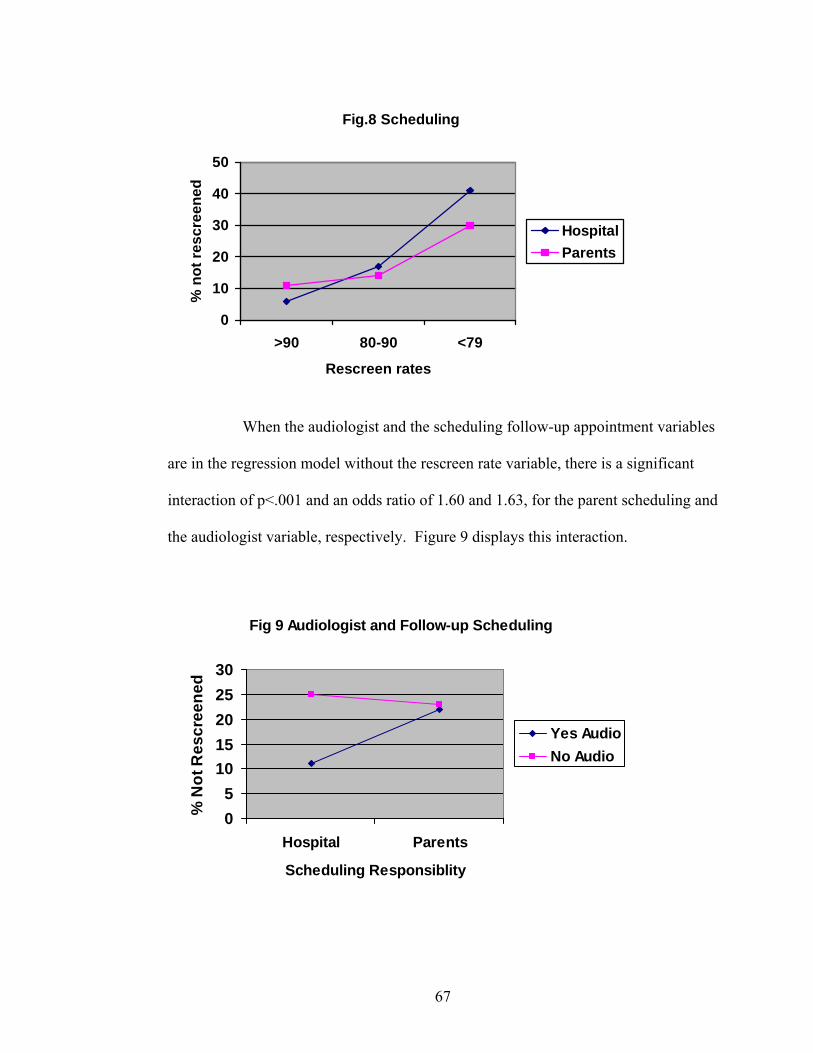
67
Fig.8 Scheduling
0
10
20
30
40
50
>90 80-90 <79
Rescreen rates
% n
ot re
scre
ened
HospitalParents
When the audiologist and the scheduling follow-up appointment variables
are in the regression model without the rescreen rate variable, there is a significant
interaction of p<.001 and an odds ratio of 1.60 and 1.63, for the parent scheduling and
the audiologist variable, respectively. Figure 9 displays this interaction.
Fig 9 Audiologist and Follow-up Scheduling
05
1015202530
Hospital Parents
Scheduling Responsiblity
% N
ot R
escr
eene
d
Yes AudioNo Audio
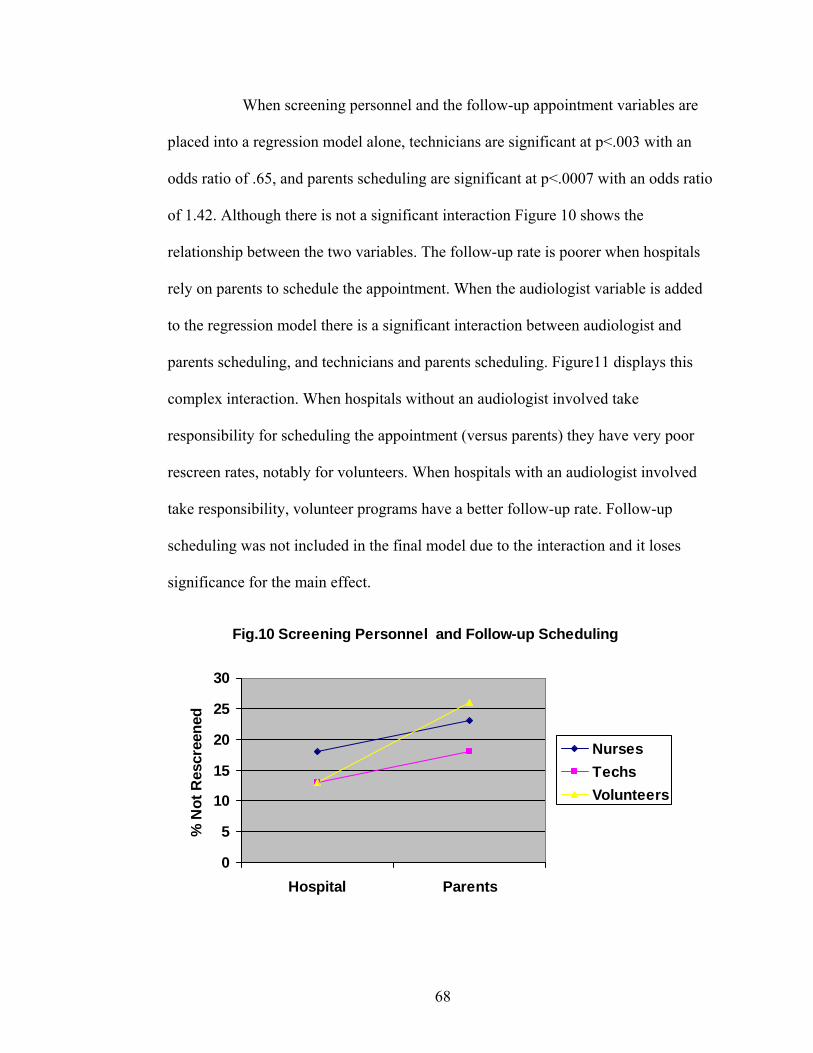
68
When screening personnel and the follow-up appointment variables are
placed into a regression model alone, technicians are significant at p<.003 with an
odds ratio of .65, and parents scheduling are significant at p<.0007 with an odds ratio
of 1.42. Although there is not a significant interaction Figure 10 shows the
relationship between the two variables. The follow-up rate is poorer when hospitals
rely on parents to schedule the appointment. When the audiologist variable is added
to the regression model there is a significant interaction between audiologist and
parents scheduling, and technicians and parents scheduling. Figure11 displays this
complex interaction. When hospitals without an audiologist involved take
responsibility for scheduling the appointment (versus parents) they have very poor
rescreen rates, notably for volunteers. When hospitals with an audiologist involved
take responsibility, volunteer programs have a better follow-up rate. Follow-up
scheduling was not included in the final model due to the interaction and it loses
significance for the main effect.
Fig.10 Screening Personnel and Follow-up Scheduling
0
5
10
15
20
25
30
Hospital Parents
% N
ot R
escr
eene
d
NursesTechsVolunteers
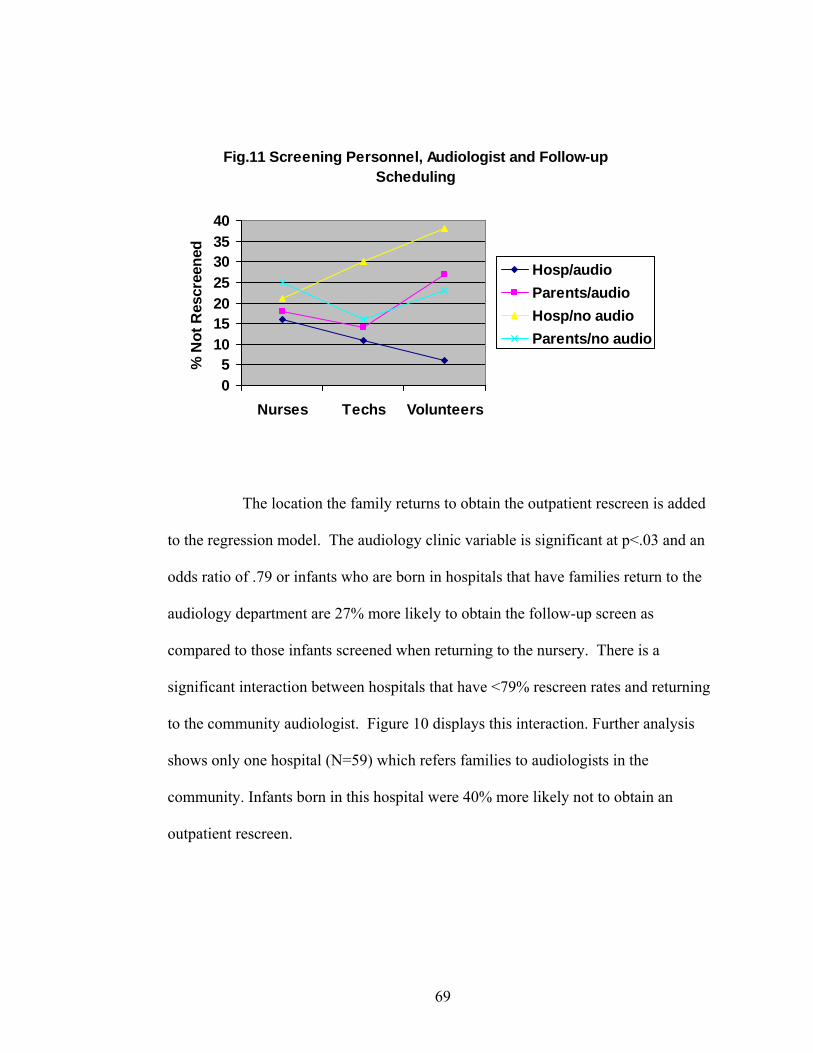
69
Fig.11 Screening Personnel, Audiologist and Follow-up Scheduling
05
10152025303540
Nurses Techs Volunteers
% N
ot R
escr
eene
d
Hosp/audioParents/audioHosp/no audioParents/no audio
The location the family returns to obtain the outpatient rescreen is added
to the regression model. The audiology clinic variable is significant at p<.03 and an
odds ratio of .79 or infants who are born in hospitals that have families return to the
audiology department are 27% more likely to obtain the follow-up screen as
compared to those infants screened when returning to the nursery. There is a
significant interaction between hospitals that have <79% rescreen rates and returning
to the community audiologist. Figure 10 displays this interaction. Further analysis
shows only one hospital (N=59) which refers families to audiologists in the
community. Infants born in this hospital were 40% more likely not to obtain an
outpatient rescreen.
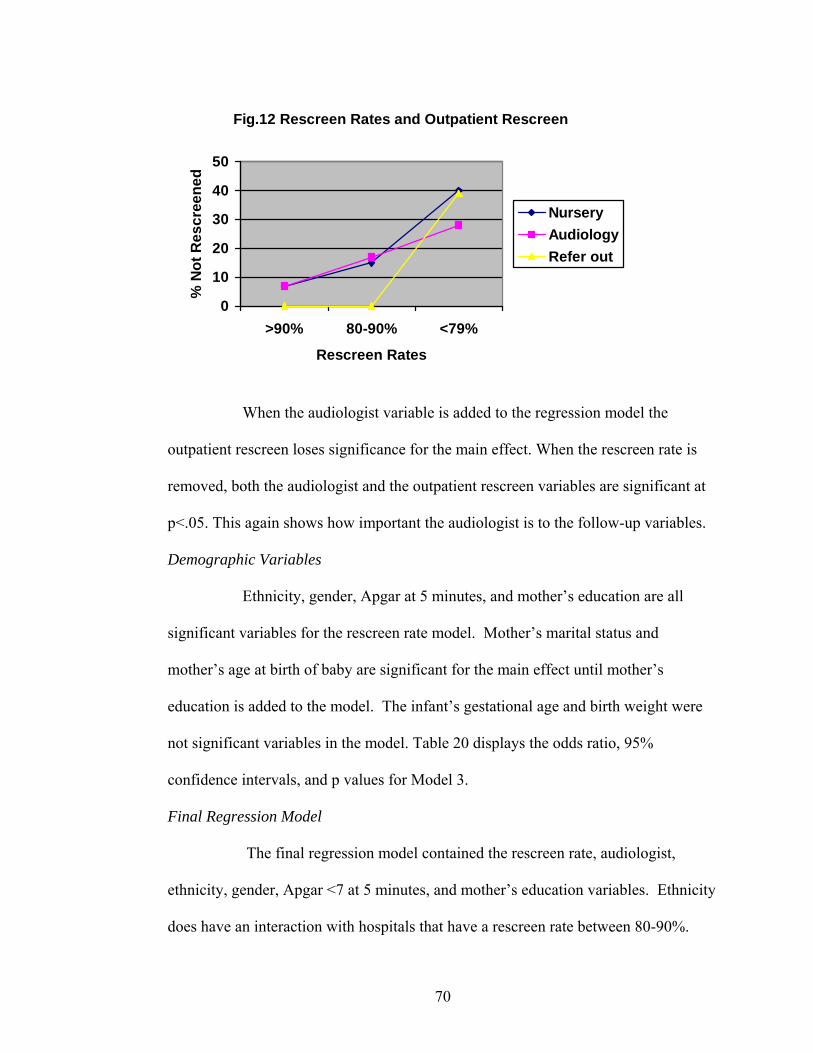
70
Fig.12 Rescreen Rates and Outpatient Rescreen
0
10
20
30
40
50
>90% 80-90% <79%
Rescreen Rates
% N
ot R
escr
eene
dNurseryAudiologyRefer out
When the audiologist variable is added to the regression model the
outpatient rescreen loses significance for the main effect. When the rescreen rate is
removed, both the audiologist and the outpatient rescreen variables are significant at
p<.05. This again shows how important the audiologist is to the follow-up variables.
Demographic Variables
Ethnicity, gender, Apgar at 5 minutes, and mother’s education are all
significant variables for the rescreen rate model. Mother’s marital status and
mother’s age at birth of baby are significant for the main effect until mother’s
education is added to the model. The infant’s gestational age and birth weight were
not significant variables in the model. Table 20 displays the odds ratio, 95%
confidence intervals, and p values for Model 3.
Final Regression Model
The final regression model contained the rescreen rate, audiologist,
ethnicity, gender, Apgar <7 at 5 minutes, and mother’s education variables. Ethnicity
does have an interaction with hospitals that have a rescreen rate between 80-90%.
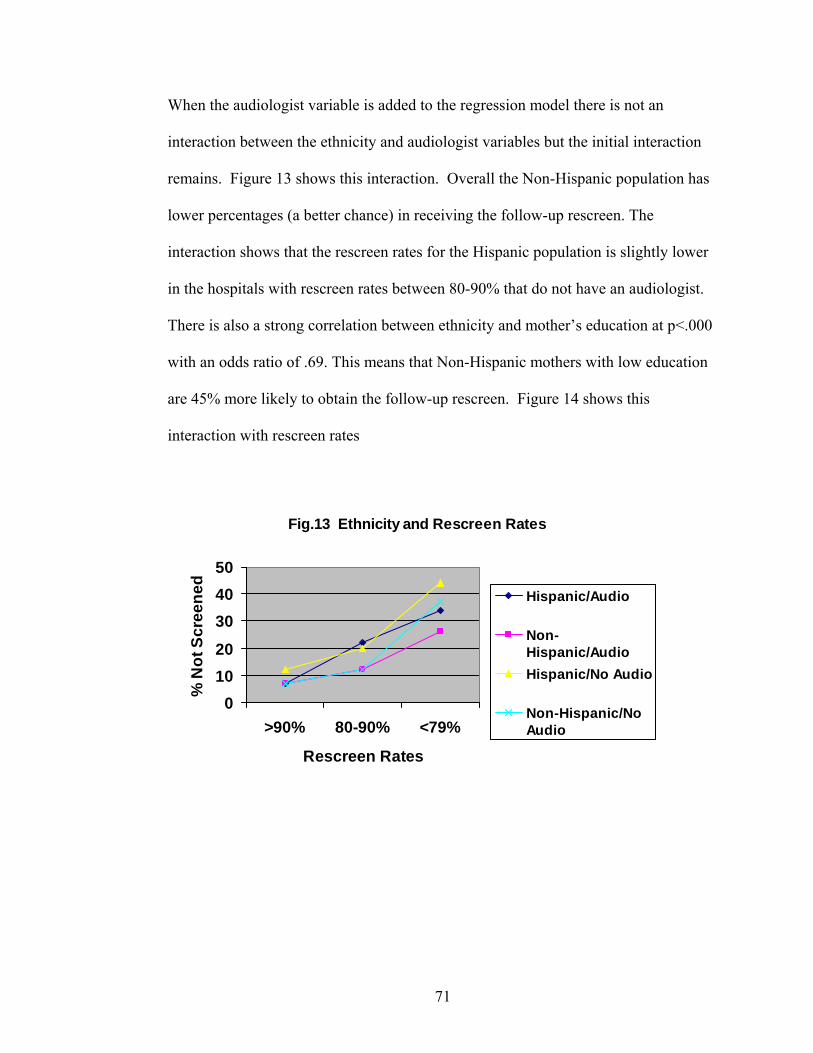
71
When the audiologist variable is added to the regression model there is not an
interaction between the ethnicity and audiologist variables but the initial interaction
remains. Figure 13 shows this interaction. Overall the Non-Hispanic population has
lower percentages (a better chance) in receiving the follow-up rescreen. The
interaction shows that the rescreen rates for the Hispanic population is slightly lower
in the hospitals with rescreen rates between 80-90% that do not have an audiologist.
There is also a strong correlation between ethnicity and mother’s education at p<.000
with an odds ratio of .69. This means that Non-Hispanic mothers with low education
are 45% more likely to obtain the follow-up rescreen. Figure 14 shows this
interaction with rescreen rates
Fig.13 Ethnicity and Rescreen Rates
01020
304050
>90% 80-90% <79%
Rescreen Rates
% N
ot S
cree
ned
Hispanic/Audio
Non-Hispanic/AudioHispanic/No Audio
Non-Hispanic/NoAudio
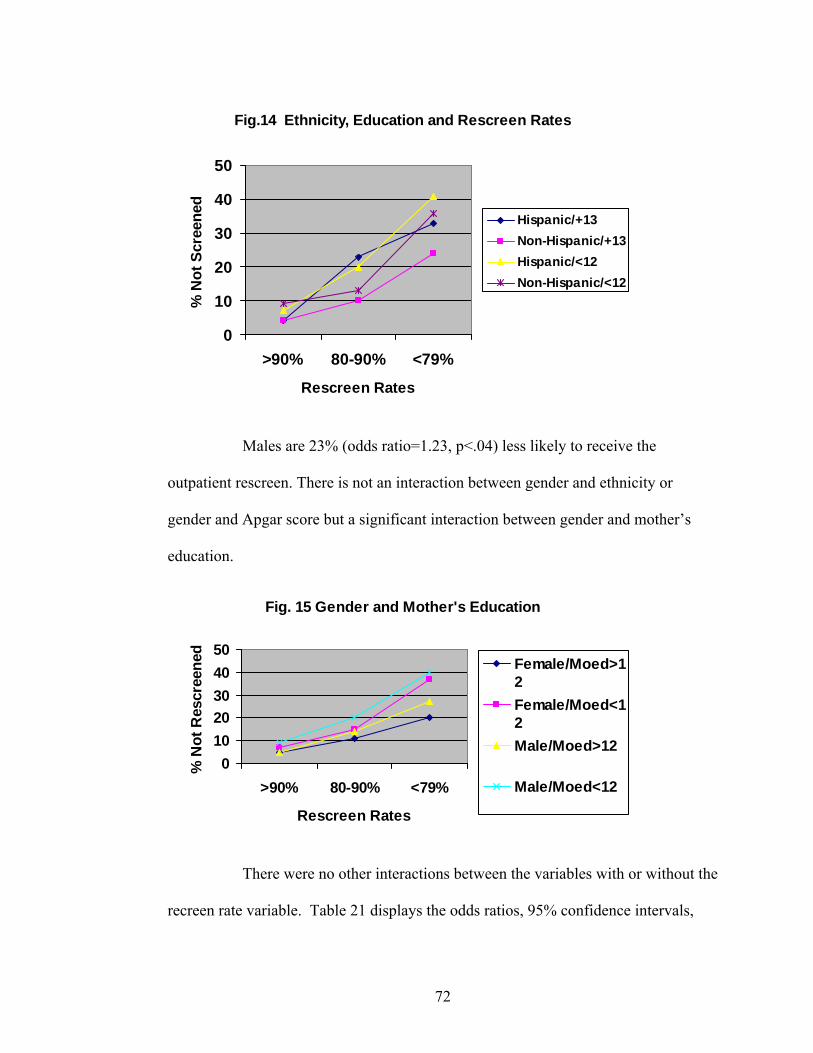
72
Fig.14 Ethnicity, Education and Rescreen Rates
0
10
20
30
40
50
>90% 80-90% <79%
Rescreen Rates
% N
ot S
cree
ned
Hispanic/+13Non-Hispanic/+13Hispanic/<12Non-Hispanic/<12
Males are 23% (odds ratio=1.23, p<.04) less likely to receive the
outpatient rescreen. There is not an interaction between gender and ethnicity or
gender and Apgar score but a significant interaction between gender and mother’s
education.
Fig. 15 Gender and Mother's Education
01020304050
>90% 80-90% <79%
Rescreen Rates
% N
ot R
escr
eene
d
Female/Moed>12Female/Moed<12Male/Moed>12
Male/Moed<12
There were no other interactions between the variables with or without the
recreen rate variable. Table 21 displays the odds ratios, 95% confidence intervals,
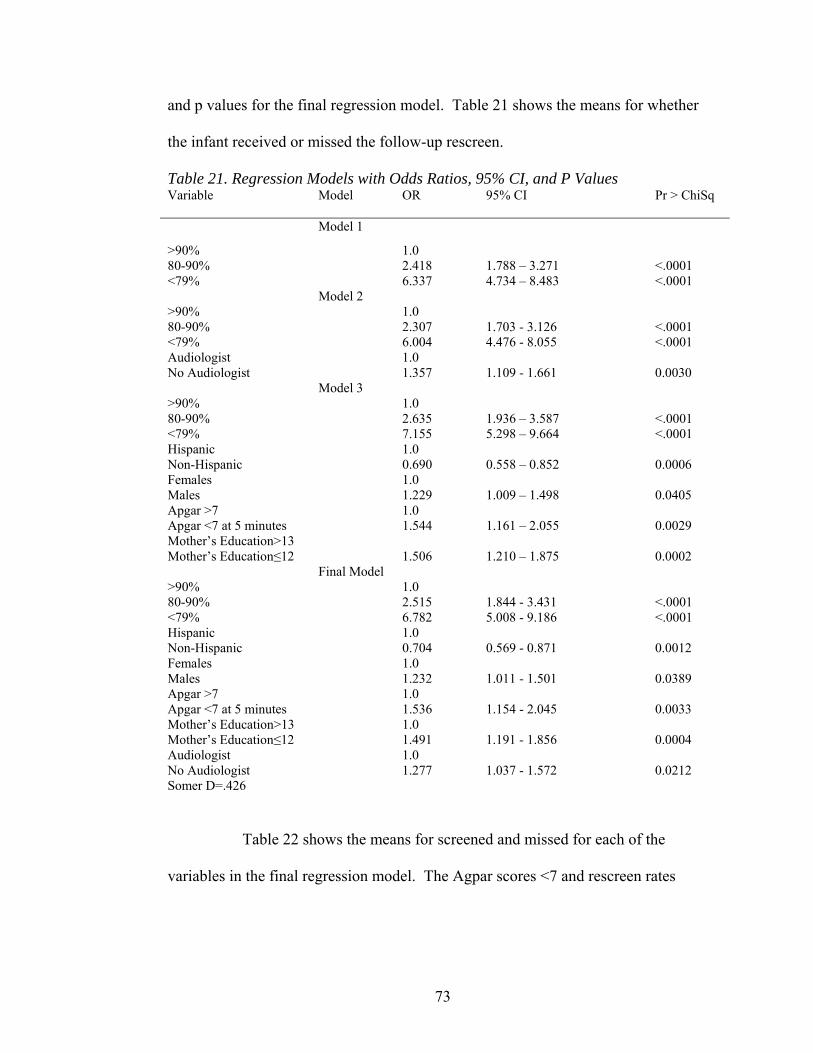
73
and p values for the final regression model. Table 21 shows the means for whether
the infant received or missed the follow-up rescreen.
Table 21. Regression Models with Odds Ratios, 95% CI, and P Values Variable Model
OR 95% CI Pr > ChiSq
Model 1
>90% 1.0 80-90% 2.418 1.788 – 3.271 <.0001 <79% 6.337 4.734 – 8.483 <.0001 Model 2 >90% 1.0 80-90% 2.307 1.703 - 3.126 <.0001 <79% 6.004 4.476 - 8.055 <.0001 Audiologist 1.0 No Audiologist 1.357 1.109 - 1.661 0.0030 Model 3 >90% 1.0 80-90% 2.635 1.936 – 3.587 <.0001 <79% 7.155 5.298 – 9.664 <.0001 Hispanic 1.0 Non-Hispanic 0.690 0.558 – 0.852 0.0006 Females 1.0 Males 1.229 1.009 – 1.498 0.0405 Apgar >7 1.0 Apgar <7 at 5 minutes 1.544 1.161 – 2.055 0.0029 Mother’s Education>13 Mother’s Education≤12 1.506 1.210 – 1.875 0.0002 Final Model >90% 1.0 80-90% 2.515 1.844 - 3.431 <.0001 <79% 6.782 5.008 - 9.186 <.0001 Hispanic 1.0 Non-Hispanic 0.704 0.569 - 0.871 0.0012 Females 1.0 Males 1.232 1.011 - 1.501 0.0389 Apgar >7 1.0 Apgar <7 at 5 minutes 1.536 1.154 - 2.045 0.0033 Mother’s Education>13 1.0 Mother’s Education≤12 1.491 1.191 - 1.856 0.0004 Audiologist 1.0 No Audiologist 1.277 1.037 - 1.572 0.0212 Somer D=.426
Table 22 shows the means for screened and missed for each of the
variables in the final regression model. The Agpar scores <7 and rescreen rates
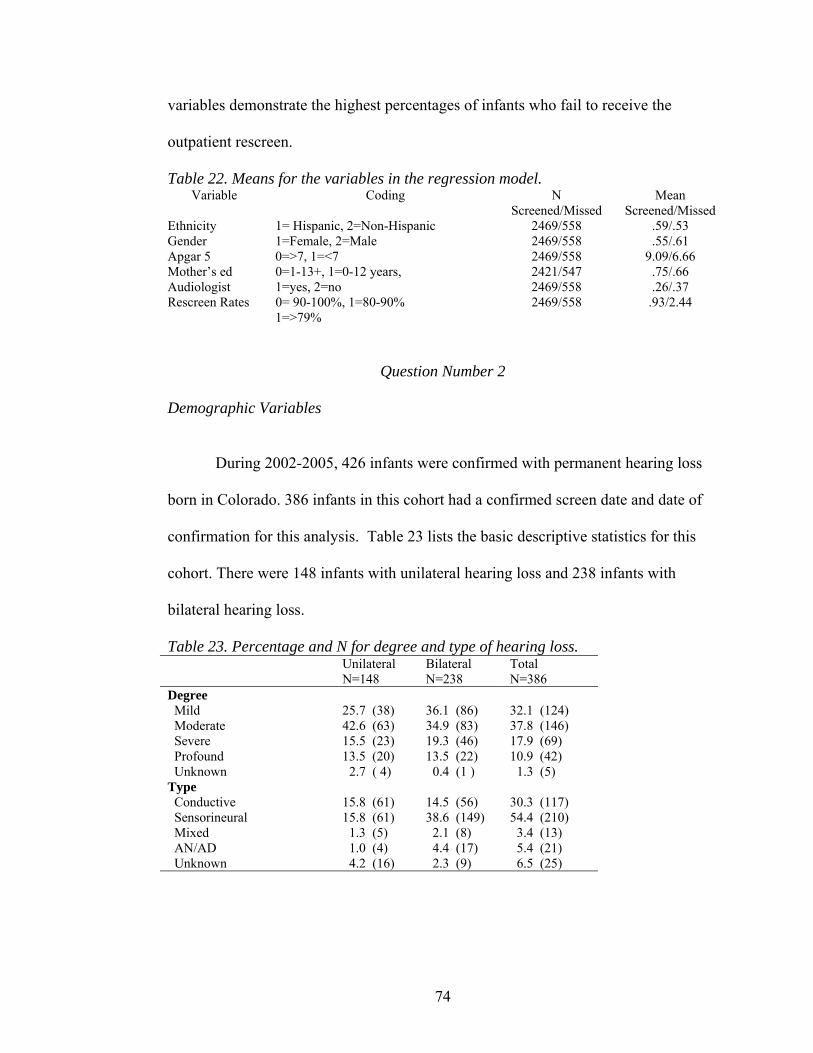
74
variables demonstrate the highest percentages of infants who fail to receive the
outpatient rescreen.
Table 22. Means for the variables in the regression model. Variable Coding N
Screened/Missed Mean
Screened/Missed Ethnicity 1= Hispanic, 2=Non-Hispanic 2469/558 .59/.53 Gender 1=Female, 2=Male 2469/558 .55/.61 Apgar 5 0=>7, 1=<7 2469/558 9.09/6.66 Mother’s ed 0=1-13+, 1=0-12 years, 2421/547 .75/.66 Audiologist 1=yes, 2=no 2469/558 .26/.37 Rescreen Rates 0= 90-100%, 1=80-90% 2469/558 .93/2.44 1=>79%
Question Number 2
Demographic Variables
During 2002-2005, 426 infants were confirmed with permanent hearing loss
born in Colorado. 386 infants in this cohort had a confirmed screen date and date of
confirmation for this analysis. Table 23 lists the basic descriptive statistics for this
cohort. There were 148 infants with unilateral hearing loss and 238 infants with
bilateral hearing loss.
Table 23. Percentage and N for degree and type of hearing loss. Unilateral
N=148 Bilateral N=238
Total N=386
Degree Mild 25.7 (38) 36.1 (86) 32.1 (124) Moderate 42.6 (63) 34.9 (83) 37.8 (146) Severe 15.5 (23) 19.3 (46) 17.9 (69) Profound 13.5 (20) 13.5 (22) 10.9 (42) Unknown 2.7 ( 4) 0.4 (1 ) 1.3 (5) Type Conductive 15.8 (61) 14.5 (56) 30.3 (117) Sensorineural 15.8 (61) 38.6 (149) 54.4 (210) Mixed 1.3 (5) 2.1 (8) 3.4 (13) AN/AD 1.0 (4) 4.4 (17) 5.4 (21) Unknown 4.2 (16) 2.3 (9) 6.5 (25)
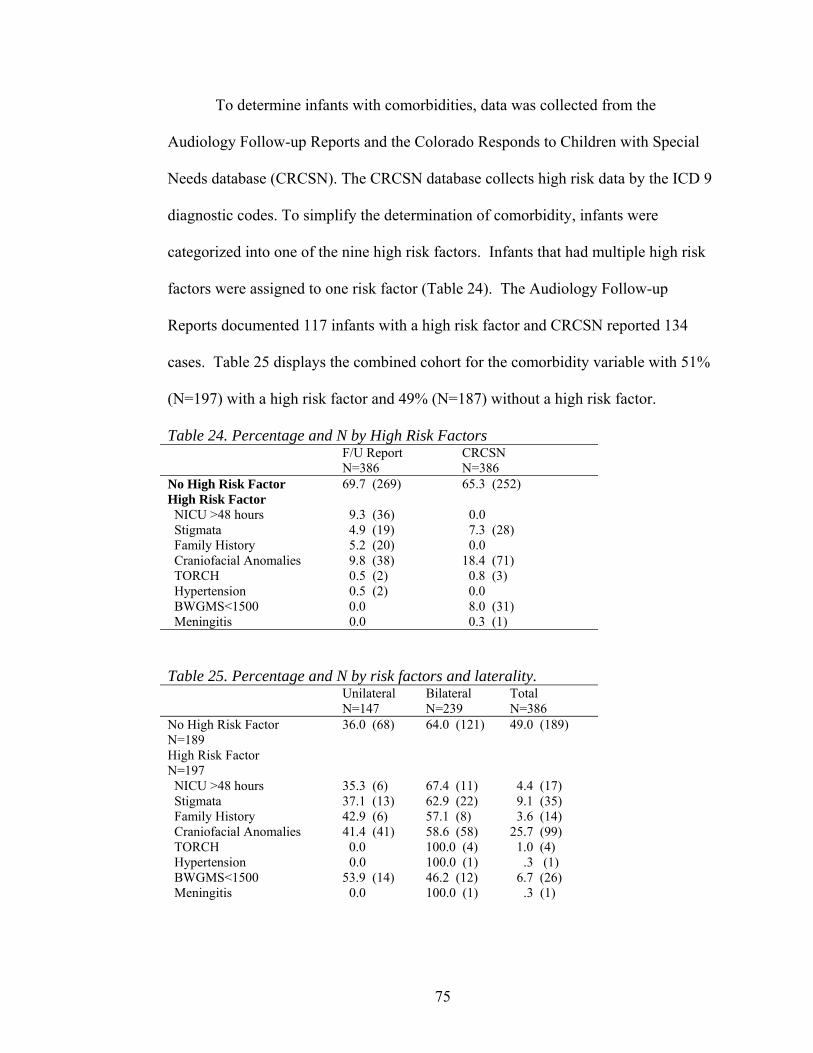
75
To determine infants with comorbidities, data was collected from the
Audiology Follow-up Reports and the Colorado Responds to Children with Special
Needs database (CRCSN). The CRCSN database collects high risk data by the ICD 9
diagnostic codes. To simplify the determination of comorbidity, infants were
categorized into one of the nine high risk factors. Infants that had multiple high risk
factors were assigned to one risk factor (Table 24). The Audiology Follow-up
Reports documented 117 infants with a high risk factor and CRCSN reported 134
cases. Table 25 displays the combined cohort for the comorbidity variable with 51%
(N=197) with a high risk factor and 49% (N=187) without a high risk factor.
Table 24. Percentage and N by High Risk Factors F/U Report
N=386 CRCSN N=386
No High Risk Factor 69.7 (269) 65.3 (252) High Risk Factor NICU >48 hours 9.3 (36) 0.0 Stigmata 4.9 (19) 7.3 (28) Family History 5.2 (20) 0.0 Craniofacial Anomalies 9.8 (38) 18.4 (71) TORCH 0.5 (2) 0.8 (3) Hypertension 0.5 (2) 0.0 BWGMS<1500 0.0 8.0 (31) Meningitis 0.0 0.3 (1)
Table 25. Percentage and N by risk factors and laterality. Unilateral
N=147 Bilateral N=239
Total N=386
No High Risk Factor N=189
36.0 (68) 64.0 (121) 49.0 (189)
High Risk Factor N=197
NICU >48 hours 35.3 (6) 67.4 (11) 4.4 (17) Stigmata 37.1 (13) 62.9 (22) 9.1 (35) Family History 42.9 (6) 57.1 (8) 3.6 (14) Craniofacial Anomalies 41.4 (41) 58.6 (58) 25.7 (99) TORCH 0.0 100.0 (4) 1.0 (4) Hypertension 0.0 100.0 (1) .3 (1) BWGMS<1500 53.9 (14) 46.2 (12) 6.7 (26) Meningitis 0.0 100.0 (1) .3 (1)
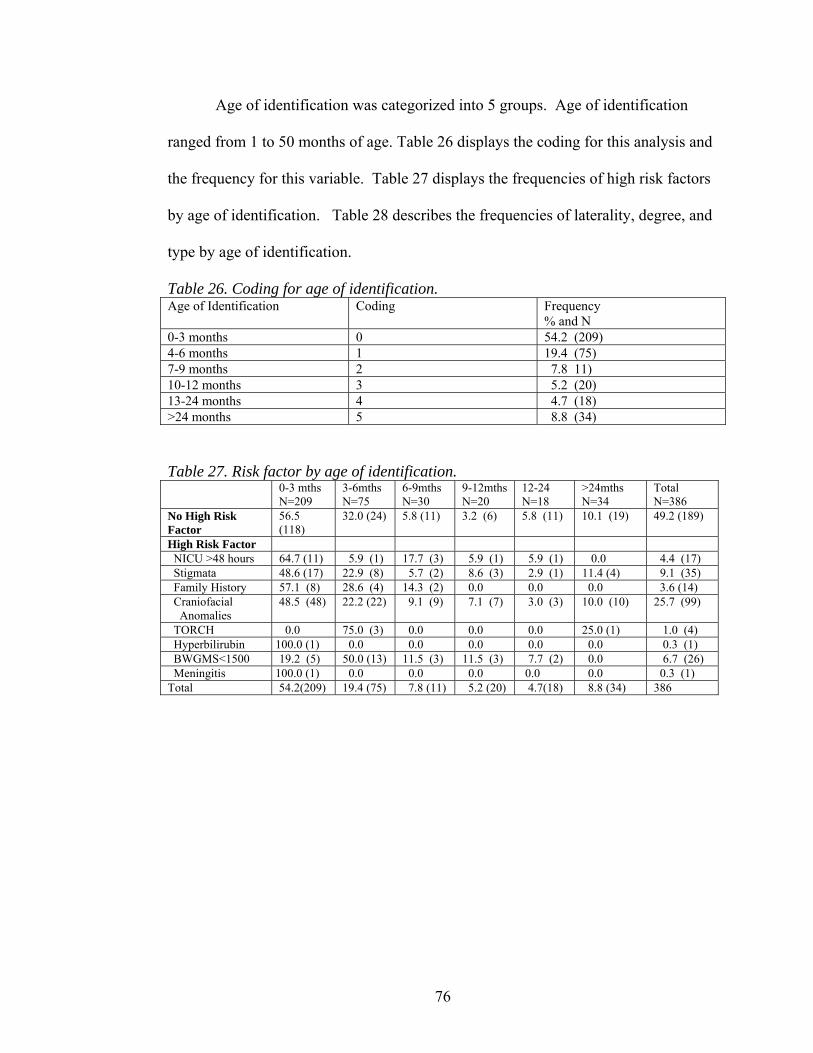
76
Age of identification was categorized into 5 groups. Age of identification
ranged from 1 to 50 months of age. Table 26 displays the coding for this analysis and
the frequency for this variable. Table 27 displays the frequencies of high risk factors
by age of identification. Table 28 describes the frequencies of laterality, degree, and
type by age of identification.
Table 26. Coding for age of identification. Age of Identification Coding Frequency
% and N 0-3 months 0 54.2 (209) 4-6 months 1 19.4 (75) 7-9 months 2 7.8 11) 10-12 months 3 5.2 (20) 13-24 months 4 4.7 (18) >24 months 5 8.8 (34) Table 27. Risk factor by age of identification. 0-3 mths
N=209 3-6mths N=75
6-9mths N=30
9-12mths N=20
12-24 N=18
>24mths N=34
Total N=386
No High Risk Factor
56.5 (118)
32.0 (24) 5.8 (11) 3.2 (6) 5.8 (11) 10.1 (19) 49.2 (189)
High Risk Factor NICU >48 hours 64.7 (11) 5.9 (1) 17.7 (3) 5.9 (1) 5.9 (1) 0.0 4.4 (17) Stigmata 48.6 (17) 22.9 (8) 5.7 (2) 8.6 (3) 2.9 (1) 11.4 (4) 9.1 (35) Family History 57.1 (8) 28.6 (4) 14.3 (2) 0.0 0.0 0.0 3.6 (14) Craniofacial
Anomalies 48.5 (48) 22.2 (22) 9.1 (9) 7.1 (7) 3.0 (3) 10.0 (10) 25.7 (99)
TORCH 0.0 75.0 (3) 0.0 0.0 0.0 25.0 (1) 1.0 (4) Hyperbilirubin 100.0 (1) 0.0 0.0 0.0 0.0 0.0 0.3 (1) BWGMS<1500 19.2 (5) 50.0 (13) 11.5 (3) 11.5 (3) 7.7 (2) 0.0 6.7 (26) Meningitis 100.0 (1) 0.0 0.0 0.0 0.0 0.0 0.3 (1) Total 54.2(209) 19.4 (75) 7.8 (11) 5.2 (20) 4.7(18) 8.8 (34) 386
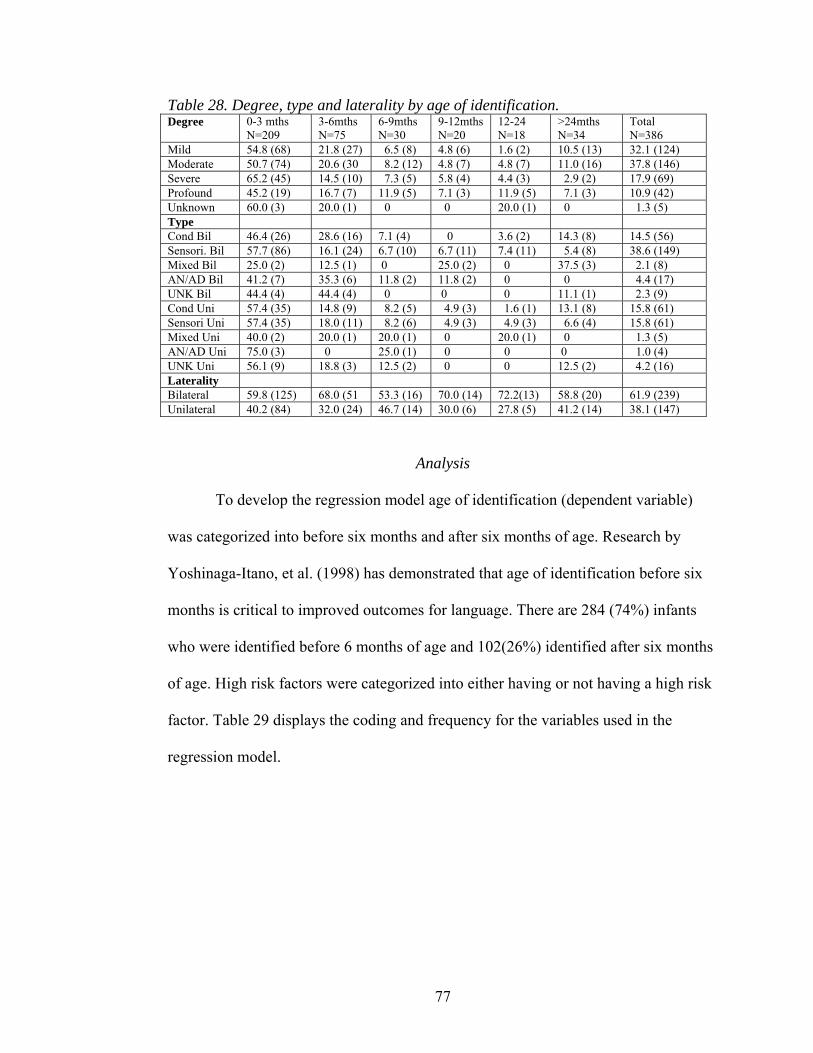
77
Table 28. Degree, type and laterality by age of identification. Degree 0-3 mths
N=209 3-6mths N=75
6-9mths N=30
9-12mths N=20
12-24 N=18
>24mths N=34
Total N=386
Mild 54.8 (68) 21.8 (27) 6.5 (8) 4.8 (6) 1.6 (2) 10.5 (13) 32.1 (124) Moderate 50.7 (74) 20.6 (30 8.2 (12) 4.8 (7) 4.8 (7) 11.0 (16) 37.8 (146) Severe 65.2 (45) 14.5 (10) 7.3 (5) 5.8 (4) 4.4 (3) 2.9 (2) 17.9 (69) Profound 45.2 (19) 16.7 (7) 11.9 (5) 7.1 (3) 11.9 (5) 7.1 (3) 10.9 (42) Unknown 60.0 (3) 20.0 (1) 0 0 20.0 (1) 0 1.3 (5) Type Cond Bil 46.4 (26) 28.6 (16) 7.1 (4) 0 3.6 (2) 14.3 (8) 14.5 (56) Sensori. Bil 57.7 (86) 16.1 (24) 6.7 (10) 6.7 (11) 7.4 (11) 5.4 (8) 38.6 (149) Mixed Bil 25.0 (2) 12.5 (1) 0 25.0 (2) 0 37.5 (3) 2.1 (8) AN/AD Bil 41.2 (7) 35.3 (6) 11.8 (2) 11.8 (2) 0 0 4.4 (17) UNK Bil 44.4 (4) 44.4 (4) 0 0 0 11.1 (1) 2.3 (9) Cond Uni 57.4 (35) 14.8 (9) 8.2 (5) 4.9 (3) 1.6 (1) 13.1 (8) 15.8 (61) Sensori Uni 57.4 (35) 18.0 (11) 8.2 (6) 4.9 (3) 4.9 (3) 6.6 (4) 15.8 (61) Mixed Uni 40.0 (2) 20.0 (1) 20.0 (1) 0 20.0 (1) 0 1.3 (5) AN/AD Uni 75.0 (3) 0 25.0 (1) 0 0 0 1.0 (4) UNK Uni 56.1 (9) 18.8 (3) 12.5 (2) 0 0 12.5 (2) 4.2 (16) Laterality Bilateral 59.8 (125) 68.0 (51 53.3 (16) 70.0 (14) 72.2(13) 58.8 (20) 61.9 (239) Unilateral 40.2 (84) 32.0 (24) 46.7 (14) 30.0 (6) 27.8 (5) 41.2 (14) 38.1 (147)
Analysis
To develop the regression model age of identification (dependent variable)
was categorized into before six months and after six months of age. Research by
Yoshinaga-Itano, et al. (1998) has demonstrated that age of identification before six
months is critical to improved outcomes for language. There are 284 (74%) infants
who were identified before 6 months of age and 102(26%) identified after six months
of age. High risk factors were categorized into either having or not having a high risk
factor. Table 29 displays the coding and frequency for the variables used in the
regression model.
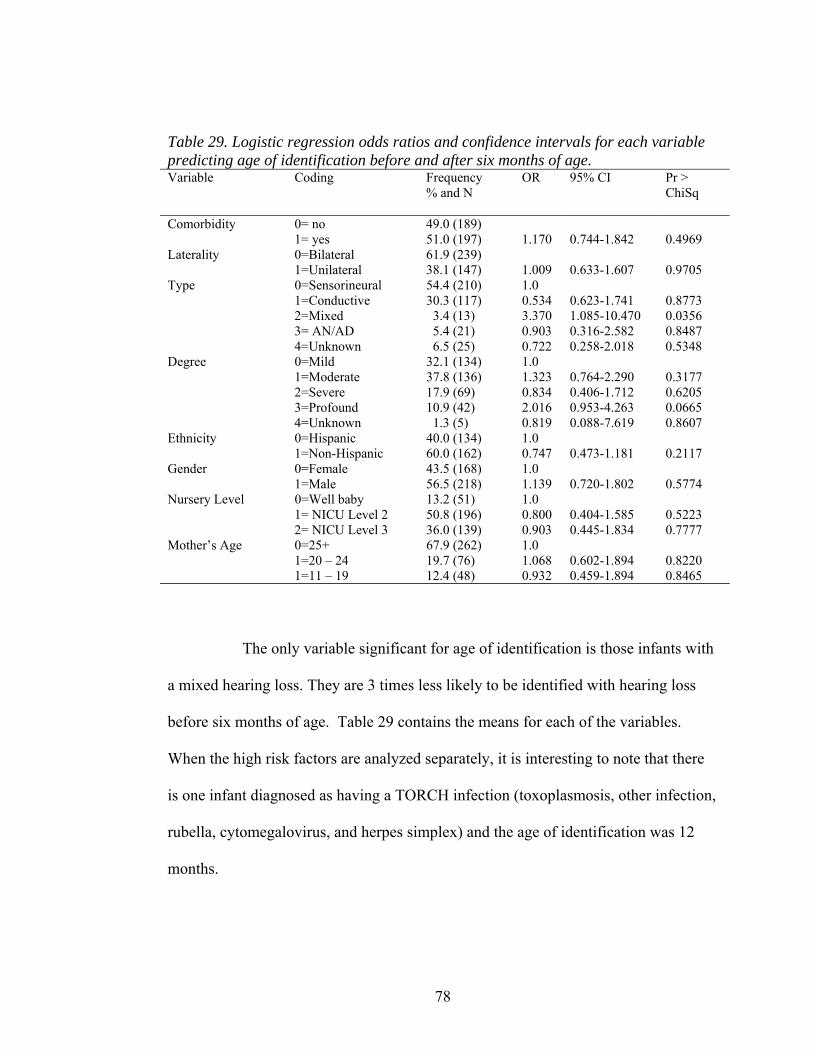
78
Table 29. Logistic regression odds ratios and confidence intervals for each variable predicting age of identification before and after six months of age. Variable Coding Frequency
% and N OR 95% CI Pr >
ChiSq
Comorbidity 0= no 1= yes
49.0 (189) 51.0 (197)
1.170
0.744-1.842
0.4969
Laterality 0=Bilateral 1=Unilateral
61.9 (239) 38.1 (147)
1.009
0.633-1.607
0.9705
Type 0=Sensorineural 54.4 (210) 1.0 1=Conductive 30.3 (117) 0.534 0.623-1.741 0.8773 2=Mixed 3.4 (13) 3.370 1.085-10.470 0.0356 3= AN/AD 5.4 (21) 0.903 0.316-2.582 0.8487 4=Unknown 6.5 (25) 0.722 0.258-2.018 0.5348 Degree 0=Mild 32.1 (134) 1.0 1=Moderate 37.8 (136) 1.323 0.764-2.290 0.3177 2=Severe 17.9 (69) 0.834 0.406-1.712 0.6205 3=Profound 10.9 (42) 2.016 0.953-4.263 0.0665 4=Unknown 1.3 (5) 0.819 0.088-7.619 0.8607 Ethnicity 0=Hispanic 40.0 (134) 1.0 1=Non-Hispanic 60.0 (162) 0.747 0.473-1.181 0.2117 Gender 0=Female 43.5 (168) 1.0 1=Male 56.5 (218) 1.139 0.720-1.802 0.5774 Nursery Level 0=Well baby 13.2 (51) 1.0 1= NICU Level 2 50.8 (196) 0.800 0.404-1.585 0.5223 2= NICU Level 3 36.0 (139) 0.903 0.445-1.834 0.7777 Mother’s Age 0=25+ 67.9 (262) 1.0 1=20 – 24 19.7 (76) 1.068 0.602-1.894 0.8220
1=11 – 19 12.4 (48) 0.932 0.459-1.894 0.8465 The only variable significant for age of identification is those infants with
a mixed hearing loss. They are 3 times less likely to be identified with hearing loss
before six months of age. Table 29 contains the means for each of the variables.
When the high risk factors are analyzed separately, it is interesting to note that there
is one infant diagnosed as having a TORCH infection (toxoplasmosis, other infection,
rubella, cytomegalovirus, and herpes simplex) and the age of identification was 12
months.
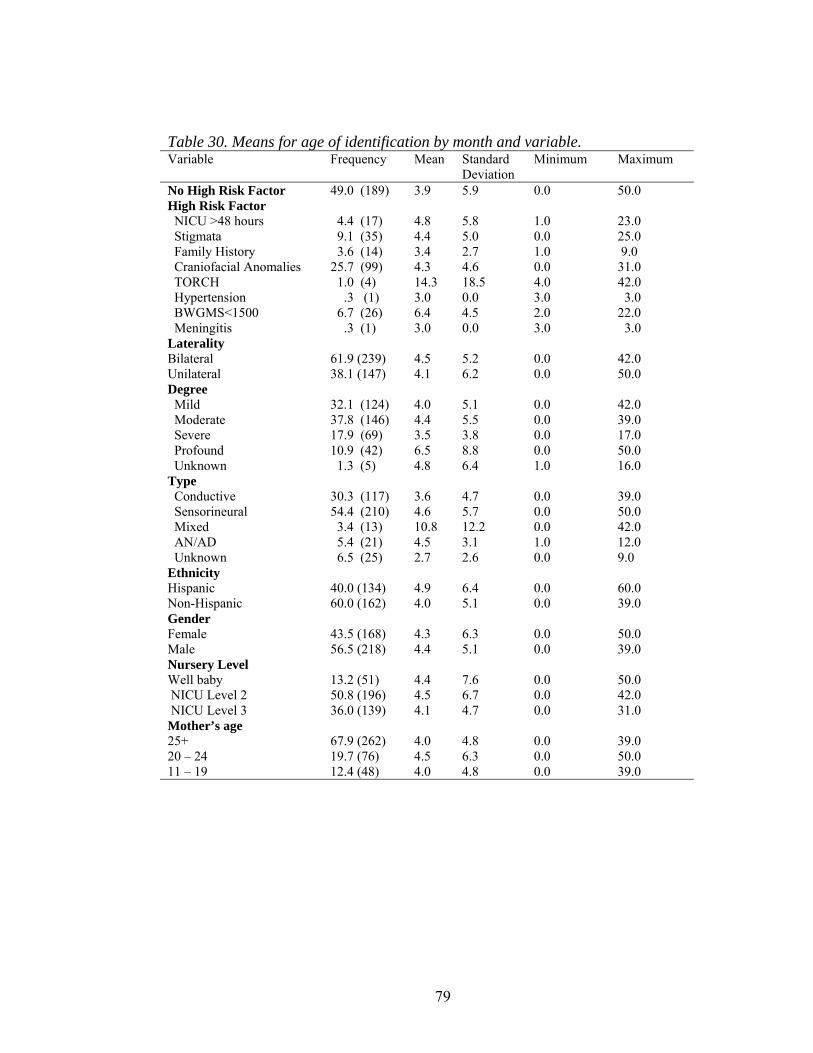
79
Table 30. Means for age of identification by month and variable. Variable Frequency Mean Standard
Deviation Minimum Maximum
No High Risk Factor 49.0 (189) 3.9 5.9 0.0 50.0 High Risk Factor NICU >48 hours 4.4 (17) 4.8 5.8 1.0 23.0 Stigmata 9.1 (35) 4.4 5.0 0.0 25.0 Family History 3.6 (14) 3.4 2.7 1.0 9.0 Craniofacial Anomalies 25.7 (99) 4.3 4.6 0.0 31.0 TORCH 1.0 (4) 14.3 18.5 4.0 42.0 Hypertension .3 (1) 3.0 0.0 3.0 3.0 BWGMS<1500 6.7 (26) 6.4 4.5 2.0 22.0 Meningitis .3 (1) 3.0 0.0 3.0 3.0 Laterality Bilateral 61.9 (239) 4.5 5.2 0.0 42.0 Unilateral 38.1 (147) 4.1 6.2 0.0 50.0 Degree Mild 32.1 (124) 4.0 5.1 0.0 42.0 Moderate 37.8 (146) 4.4 5.5 0.0 39.0 Severe 17.9 (69) 3.5 3.8 0.0 17.0 Profound 10.9 (42) 6.5 8.8 0.0 50.0 Unknown 1.3 (5) 4.8 6.4 1.0 16.0 Type Conductive 30.3 (117) 3.6 4.7 0.0 39.0 Sensorineural 54.4 (210) 4.6 5.7 0.0 50.0 Mixed 3.4 (13) 10.8 12.2 0.0 42.0 AN/AD 5.4 (21) 4.5 3.1 1.0 12.0 Unknown 6.5 (25) 2.7 2.6 0.0 9.0 Ethnicity Hispanic 40.0 (134) 4.9 6.4 0.0 60.0 Non-Hispanic 60.0 (162) 4.0 5.1 0.0 39.0 Gender Female 43.5 (168) 4.3 6.3 0.0 50.0 Male 56.5 (218) 4.4 5.1 0.0 39.0 Nursery Level Well baby 13.2 (51) 4.4 7.6 0.0 50.0 NICU Level 2 50.8 (196) 4.5 6.7 0.0 42.0 NICU Level 3 36.0 (139) 4.1 4.7 0.0 31.0 Mother’s age 25+ 67.9 (262) 4.0 4.8 0.0 39.0 20 – 24 19.7 (76) 4.5 6.3 0.0 50.0 11 – 19 12.4 (48) 4.0 4.8 0.0 39.0
80
DISCUSSION
The purpose of this study was to identify hospital and demographic factors
that are associated with an infant not receiving a follow-up outpatient rescreen. A
second purpose was to identify factors that are associated with infants who fail the
newborn hearing screen but are not identified until after six months of age. This study
was designed to evaluate the Colorado Infant Hearing Program and identify areas that
need improvement in developing systems to ensure timely and appropriate follow-up.
Question 1
In 2005 Colorado had 69,533 births and 68,478 of those births occurred in
56 birthing hospitals. Resident births that occurred at home, out of state, in transit,
and in unknown facilities were excluded from the analysis for the first hypothesis.
Infants who were confirmed with a permanent hearing loss were also removed. For the
regression analysis there were 3,027 infants who failed the initial screen and 558
infants who did not have documentation of receiving follow-up for either an outpatient
rescreen or an audiological evaluation. The Colorado Infant Hearing Advisory
Committee has implemented guidelines recommending that hospitals offer an
outpatient rescreen rather than refer directly to an audiologist for infants who fail the
inpatient rescreen. This protocol was established to decrease the number of infants
who are referred for more costly evaluations. Colorado has rural and frontier areas that
do not have a pediatric audiologist located near the birthing facilities. Pediatric
assessments require special diagnostic equipment (ABR, OAE) and expertise.
Pediatric audiologists are located primarily in large urban facilities.
81
The dependent variable was whether the infant received the outpatient
rescreen. The independent hospital variables included birth rate, nursery level, if an
audiologist was involved in the hospital program, technology used for screening,
screening personnel, how the outpatient screen was scheduled, and location of the
outpatient rescreen, if there is a charge for the rescreen, refer rates at discharge, and
rescreen rates. The independent demographic variables included ethnicity, gender,
gestational age, birth weight, Apgar score at 5 minutes, marital status, and mother’s
level of education.
This analysis failed to reject the first hypothesis that infants who return to
the nursery for the follow-up outpatient rescreen are more likely to receive the
rescreen. In fact the analysis shows that infants who return to audiology departments
are 27% more likely to receive the follow-up outpatient screen then returning to the
nursery. The most significant variables were the rescreen rates, audiology
involvement, ethnicity, gender, Apgar score at 5 minutes and mother’s education.
Discussion of the individual variables will assist the reader in understanding the
complexity of this issue.
Hospital Variables
Audiologist
An audiologist involved with the program was one of the most significant
variables in the regression model at p<. 003 with an odds ratio of 1.357, meaning
infants born in hospitals without audiology support were 36% less likely to receive the
rescreen. Infants who were born in hospitals with an audiologist involved accounted
for 71% (N=2,168) of the 3,027 infants who failed the initial screen. There were 84%
82
(N=1816) of this cohort who received a resceen and 16% (N=352) who did not receive
the rescreen. Hospitals without an audiologist accounted for 28% (N=859) who failed
the initial screen. There were 76% (N=653) who received the rescreen and 24%
(N=209) that did not receive the rescreen. The audiology variable was significant in
the regression model with the other hospital variables.
It is challenging to develop community-based systems of care for newborn
hearing screening when a community is too small to support a pediatric audiologist.
The Colorado Infant Hearing Program has enlisted local audiologists, called
Audiology Regional Coordinators, to provide technical support to smaller hospitals.
Audiology Regional Coordinators are assigned to each hospital to provide technical
assistance. Only 24 (43%) of the birthing hospital coordinators marked on their survey
they had an audiologist involved in their program. This data indicates that over 50% of
the birthing hospitals do not view the Audiology Regional Coordinator as ‘involved’
in their program. Their scope of work is to monitor hospital screening outcomes and
provide technical assistance. One solution will be to increase their funding and time to
support hospitals in providing technical assistance in every aspect of the program. The
Audiology Regional Coordinators can assist hospitals and physicians with identifying
the closest pediatric audiologist to ensure infants receive timely and appropriate
follow-up.
Rescreen Rates
Rescreen rates were the most significant variable in the regression analysis
for obtaining a follow-up rescreen. Although this is intuitive, the significance was
powerful. Infants who are born in hospitals with rescreen rates between 80-90% are
83
2.5 times less likely to receive the outpatient rescreen as compared to hospitals that
have rescreen rates >90%. Infants who are born in hospitals with rates <79% are
almost 7 times more likely not to receive the outpatient rescreen. When the audiologist
variable is added to the regression the effect is noticed for hospitals that have <79%
rescreen rates. For the cohort of infants who failed the initial screen born in hospitals
with an audiologist involved, 28% (N= 619) were born in hospitals with rescreen rates
of <79%. Infants who failed the initial screen born in hospitals without an audiologist
accounted for 40% (N=334) of the infants who did not receive the follow-up screen
for this cohort.
Hospital Birth Rate
Hospital birth rates were grouped into 4 categories. The initial regression
analysis on hospital birth rates shows infants born in hospitals that have 2-3000 births
are 38% less likely to receive the rescreen at p<.01. Of the 558 infants who did not
receive the rescreen this population accounts for 20.4% (N=114). Although the
logistic regression analysis did not have interactions with the other variables the
hospitals in this cohort do have a higher percentage of volunteers for screening and
they require the parents to take responsibility for scheduling the outpatient
appointment. Hospitals with <1000 births are 44% less likely to receive the rescreen at
p<004. Of the 558 infants who did not receive the rescreen this population accounts
for 24.2% (N=135) that were born in hospitals with fewer than 1000 births. These
hospitals have refer rates >10% and rescreen rates <79%. These hospitals are located
in the rural and frontier areas of Colorado and typically do not have an audiologist
involved in the program to provide technical assistance with technology and follow-up
84
protocols. Increasing the role of the Audiology Regional Coordinator should assist in
decreasing refer rates and increasing rescreen rates.
Level of NICU
The regression analysis shows that infants born in hospitals with a Level 3
NICU are 38% more likely, than infants born in well baby hospitals, to receive the
rescreen. Looking at the rescreen rates alone show that some of the hospitals that have
Level 3 NICU’s have rescreen rates <79%. Thirty three percent (185) of infants who
did not receive a follow-up screen were born in hospitals with a Level 3 nursery and
62% of these infants are born in a Level 3 hospital with a rescreen rate of less than
79%. These hospitals have the most vulnerable infants that are high risk for hearing
loss. In addition, infants with low Apgar scores are 54% less likely not to receive the
follow-up rescreen. Christensen, et al. (2007) found that infants who had low Apgar
scores at 5 minutes were also less likely to receive the initial screen. The researchers
suspected that Level 3 NICU’s have a significant proportion of out of state residents
and after further investigation this was not the issue. The poor follow-up rate for
NICU infants has been a concern expressed at national meetings. Most hospitals defer
the screening until just before discharge when the infant’s health is most improved.
Physicians may discharge the infant sooner than expected. It is often more difficult for
families to return for an outpatient screen when infants have other complex problems.
Current efforts are underway by the Program to meet with audiologist, hospitals, and
physician groups to strengthen the protocol for NICU infants to ensure the hearing
screen is obtained prior to discharge. There is the potential to provide diagnostic
evaluations in the NICU prior to discharge for 3 of the 10 hospitals that have a Level 3
85
NICU. Although this may be a goal of many professionals it is important that the
infants and the family needs are considered first.
Technology
Colorado’s newborn hearing legislation does not mandate the type of
screening technology hospitals should use in their programs. When Colorado started
the newborn screening program most hospitals were encouraged to use AABR due to
the lower refer rate and at the time OAE’s were not automated. In 2005 60% of
Colorado birthing hospitals used AABR only. Hospitals began to replace old
technology with new technology that contained both AABR and OAE. This newer
technology has the advantages of decreasing the cost of disposables associated with
the AABR and using OAE in the well baby nursery. It also provides the hospitals with
meeting the recommendations set forth by the Colorado Infant Hearing Advisory
Committee and the JCIH for AABR screening in the NICU where there is a higher
incidence of auditory neuropathy that can only be detected by AABR.
As evidence in the analysis the recreen rates are poorer when an
audiologist is not involved with the programs that use both OAE and AABR. The new
technologies were initially wrought with problems. Manufacturers had problems with
OAE probes, AABR algorithms, and there was not the technical support present as had
been with the original Natus Algo AABR or the Otodynamics OAE equipment.
Audiologists who are involved in screening programs have the expertise to work
directly with the manufacturers to solve these issues and provide technical assistance
to the screening staff. The obvious solution to this problem is increasing the
86
audiology support to every hospital for technical assistance and training on screening
equipment.
Refer Rates
The analysis shows that infants born in hospitals with higher refer rates at
discharge are more likely to receive the outpatient rescreen as compared to hospitals
that have refer rates <5%. This is not what would be expected. Further investigation
found that this was directly correlated to the audiology variable. Hospitals that have an
audiologist involved in the program have higher percentages of infants who obtain the
rescreen.
The debate over the importance of refer rates have been ongoing since the
inception of newborn hearing screening. Colorado prefers to report refer rates based
on hospital discharge rather than refer rates based on the outpatient rescreen. In 2005
the average statewide refer rate at hospital discharge was 4.7%. If we calculated those
infants who failed the outpatient rescreen that need to be referred to an audiologist for
a diagnostic evaluation the ‘refer’ rate would appear to be only .2% (143 infants who
failed the outpatient rescreen/by the entire screened cohort of 67,261). It is this
author’s opinion that deflating the refer rates only causes harm to newborn hearing
screening programs. In this analysis poor rescreen rates were highly related to the
whether the infant received the rescreen. To achieve screening programs that meet
quality benchmarks requires resources at the hospital, local, and state levels. In
Colorado there are no general state funds to support the newborn hearing program.
Many states have increased the newborn screening fee to provide funding to the
newborn hearing programs. Additional funding would provide audiology support for
87
hospitals and improve the data management system to track infants more quickly
through refer, rescreen, and diagnostic processes. If state or national legislatures
perceive that follow-up is not an issue then they will not be interested in funding
programs for improvement through grants or state general monies.
Screening Personnel
The screening personnel variable was also directly correlated with whether
an audiologist is involved in the program. Since hospitals are not funded to provide the
newborn hearing screen it is the hospitals discretion who they choose to use for
screening. Of the infants who did not receive the follow-up rescreen 33% (N=185),
28% (N=158), and 39% (215) were born in hospitals that use nurses, technicians, and
volunteers, respectively. The initial regression analysis on the follow-up result show
that infants born in hospitals that use technicians are 52% (odd ratio=.66) more likely
than nurses to receive the rescreen. This would make sense if the responsibility for
screening were the technician’s job responsibility, as a lab technician’s job
responsibility is to draw the blood for the newborn metabolic screen. Volunteers were
recommended as the choice of screener in the beginning stages of newborn hearing
screening. The advent of automated technology did not require an audiologist to
perform the screen. There are several hospitals that have been successful with using
volunteers if they have an audiologist on site who provides direct supervision and
training. The regression analysis shows that there is not a difference in rescreen rates
for the screening personnel when rescreen rates are at 80% or greater but when
rescreen rates are <79%, hospitals that use volunteers do better in comparison because
they typically have an audiologist on staff who has responsibility for the program.
88
Nurses are the primary screeners in hospitals with lower births and
technicians and volunteers are used in the higher birthing hospitals. Again, increasing
the support with local audiologists for the smaller or more rural hospitals will be
implemented to improve the follow-up outpatient rescreen.
The author is working closely with the National Center for Hearing
Assessment and Management to develop training materials for screening personnel.
The materials include the importance of early identification and intervention of
hearing loss in infants, trouble shooting techniques for screening equipment, how to
give parents the results, and the importance of follow-up recommendations.
Scheduling the Outpatient Rescreen
Forty-seven percent (N=262) of the infants who did not receive a rescreen
were born in hospitals that schedule the appointment prior to or after discharge. The
remaining 53% (N=296) are born in hospitals that ask the parents to call for an
outpatient rescreen appointment. The initial regression analysis shows that infants
born in hospitals who ask parents to take responsibility for scheduling the outpatient
rescreen are 60% less likely to receive the rescreen than if the hospitals takes
responsibility. This variable was directly related to the audiologist variable. When
infants are born in hospitals without an audiologist involved they are 62% more likely
not to receive the outpatient screen.
This is an area for dramatic improvement. Screening programs need to
make the recommendation for the follow-up appointment in a manner that families
understand the importance of the outpatient rescreens. The Colorado Infant Hearing
Program is working with Hands and Voices to develop materials that can be given to
89
families at discharge that will explain the importance of follow-up from the parents’
perspective. Utilizing the Audiology Regional Coordinators to work with hospital staff
on protocols and materials for the outpatient screen will also be implemented.
Location of the Outpatient Rescreen
Of the 558 infants who did not receive the outpatient rescreen 52%
(N=291) should have returned to the nursery, 44% (N=244) to the audiology
department, and 4% (N=23) to local audiologists. This variable was the crux of the
hypothesis. Although this analysis failed to reject the null hypothesis it did prove that
hospitals which bring families back to the nursery or to the audiology department are
far more likely to have higher rescreen rates and this is further strengthened when an
audiologist is involved in the program. When hospitals have an audiology department,
infants are 27% more likely to receive the outpatient rescreen than returning to the
nursery. In these situations the audiologist is on staff and also supervises and
coordinates the screening program. When hospitals refer families outside the hospital
system for the follow-up rescreen there is a 40% chance the family will not return.
Currently the standard of care and recommendations by the Colorado
Infant Hearing Advisory is to bring families back to the hospital. Several large
hospitals have recently closed their audiology departments and are considering
referring families out to local audiologists. This is of grave concern to the Program as
evidenced by the one hospital that chose this option and had very poor rescreen rates.
There are many issues with this protocol. Families may not obtain a referral from their
PCP for an audiologist who has the capability to appropriately assess infants. Families
will not be familiar with another system and may be less likely for follow through.
90
Audiologists do not always report their findings even though reporting of hearing loss
is required in state statute.
The outpatient rescreens need to be accessible to families without barriers
such as language, transportation, or ability to pay. The variable for whether a charge
is incurred was not significant but the Colorado Infant Hearing Program does receive
phone calls from parents requesting alternatives to the outpatient rescreen when the
ability to pay is an issue. Fortunately all of the educational audiologists have OAE
equipment and are willing to see these families. Without this option many families
would not have been able to receive a rescreen for their infant.
Involving the primary care physicians is a top priority for the Program. As
with the newborn metabolic screen, the PCP should be notified when their patient fails
the screen or misses the screen. Engaging the PCP to take responsibility for follow-up
may improve the rescreen outcomes.
Demographic Variables
Ethnicity
The Hispanic population is most likely not to receive the outpatient
rescreen. Hispanic infants accounted for 47.7% (N=261) of the infants who did not
receive the outpatient rescreen and Non-Hispanics were 53.2% (N=297) of this cohort.
Non-Hispanics are 45% more likely to receive the outpatient rescreen than the
Hispanic population. The Program will need to identify ways to improve this process.
One Colorado Health Department program improved the weight gain for Hispanic
mothers through public service announcements on Spanish-speaking radio stations and
91
television. The Colorado Infant Hearing brochure is in Spanish but this alone is not
enough. Families need to be given the results verbally and in a variety of ways.
Christensen, et al. (2007) found that one Denver hospital had a very high
Hispanic population and a very high rescreen rate. Interviews with the audiology staff
found that the majority of the families returned to the Denver Health campus for
primary care. The primary care physician would send the family directly over to the
audiology department for the outpatient rescreen at the two-week well child visit.
Although this is a unique situation, providing easier access for rescreens for this
population could be made available. A pilot program with one federally qualified
health center in Boulder has a trained staff person to perform otoacoustic emissions on
infants when they come in for their well baby check. Data has not been obtained to
date to determine if this is a successful model for capturing the rescreen on infants
who are born to Hispanic or low income families.
Gender
Infant boys are 25% less likely to receive the follow-up rescreen. This
analysis demonstrated that gender was correlated to mother’s education. At the
rescreen rate decreases, males in both mother’s education level are more likely to miss
the screen. It is important to note that 60% of males did not receive the outpatient
screen as compared to 40% of females. This could not be explained by nursery level or
ethnicity.
Mother’s Education
Thirty-two percent (N=179) and 67.3% (N=368) of infants were born to
mothers with > 12 years of education and <12 years of education, respectively. Infants
92
born to mothers who have 12 years of education or less were 49% less likely to obtain
the rescreen. This variable is used to estimate socioeconomic status. As noted in the
initial regression 11% of this population was born to teenage mothers. Mother’s
education and ethnicity shows the Hispanic populations have poorer rescreen rates
than Non-Hispanic populations for both levels of education.
The Program must identify resources to ensure that all families have
access to the services they need and families understand the follow-up
recommendations and the importance. The Boulder County Health Department is
targeting teen mothers to ensure their infants receive all the newborn screens and
immunizations. The Colorado Infant Hearing Program is going to collaborate with the
nurse home visiting program, EPSDT, and local public health nurses to develop
strategies for improving the follow-up in these vulnerable populations.
Hypothesis Number 2
Identification of hearing loss by six months of age has proven to be the
benchmark for successful language outcomes. This analysis failed to reject the null
hypothesis that infants with comorbidities are less likely to be identified early. The
regression analysis shows only infants diagnosed with a mixed hearing loss are
significant at p<.03. They are 3 times more likely to be diagnosed after 6 months of
age. This is probably due to challenge of being able to confirm the diagnosis if there
is a conductive loss that may be fluctuating and confounding the issue. The average
age of diagnosis, for an infant weighing less than 1500gms, is 6.4 months. This is not
surprising since these infants are very premature and in the neonatal intensive care unit
93
for many months. With the exception of the one infant with cytomegalovirus, the
remaining variables have a means of less than six months.
Although the analysis failed to reject the null hypothesis there were 102
infants (26%) who were not identified by six months of age. Further research must be
completed to identify the reasons for late identification. As noted in the previous
hypothesis rescreen rates and the role of the audiologist play a significant part in
successful screening programs. The Colorado Infant Hearing Program will need to
ensure that infants who fail the newborn hearing screen receive appropriate and timely
follow-up with a pediatric audiologist. Enhancing the role of the Audiology Regional
Coordinators may provide the additional support to achieve community-based systems
for families. The Regional Coordinators and State EHDI staff must work with local
hospitals, health departments, audiologists, the CO-Hear Coordinators, and primary
care physicians to develop protocols that refer infants only to pediatric audiologists
that have the equipment and expertise to diagnose infants effectively and efficiently.
Resources must be made available to ensure that every family regardless of ethnic
background or income can receive optimal services.
Age of identification for unilateral hearing loss did not show a significant
difference when compared to bilateral hearing loss. Yet we know that unilateral
hearing loss is often under reported or not referred for a rescreen. The importance of
early identification and intervention of unilateral hearing loss is known and further
education to audiologists and physicians will be needed to ensure these infants also
receive timely and appropriate follow-up.
94
Conclusion
This research failed to reject the null hypothesis for both questions. The
first question postulated there would be higher rescreen rates for hospitals that had a
follow-up protocol where families returned to the nursery for the outpatient rescreen
appointment. The analysis has shown that rescreens rates and whether an audiologist is
involved with the screening program is the most significant factors for families
returning for the follow-up appointment. Hospitals have higher rescreen rates when
they implement a protocol requesting the families return to either the nursery or
audiology facility on site. Hospitals that have an audiologist involved in the program
have better rescreen rates for technology, screening personnel, nursery level, refer
rates and rescreen rates.
The second question was to determine if infants with comorbidities were
more likely not to be identified by three months of age. The analysis failed to reject
the null hypothesis and found there was not a significant difference between age of
identification for infants with comorbidities, degree of hearing loss, type of hearing
loss, ethnicity, gender, nursery level, and mother’s age at birth. The analysis did show
that 26% of the infants in the cohort of 386 were identified after six months of age.
Further research needs to investigate the factors associated with late identification.
The Colorado Infant Hearing Program has been a model nationally and
internationally. This has been achieved by the dedication and collaboration of strong
leaders in audiology, pediatrics, early intervention, parents and state agencies.
Hospitals have achieved a high screening rate considering there are no state funds to
95
support their programs. The issue is screening alone will not provide the positive
outcome of early identification.
Developing a comprehensive system from screening through diagnosis
requires a data management system that can monitor hospital, audiology, and early
intervention outcomes to identify gaps in every aspect of the process. The current
analysis was only possible by the data integration efforts with the electronic birth
certificate though funding from the CDC. There needs to be continued efforts and
resources to enhance data integration efforts. Automating the reports between
hospitals and the Program will increase efficiencies and decrease paper and FTE for
both the hospital and the State. Obtaining the screening results electronically will
expedite the results to the State and then directly to primary care physicians who can
help with ensuring their patients receive follow-up, as they do for the newborn
metabolic screens. Automation between audiologists and the State will make the
reporting processes more efficient and provide better data. As noted on the first page
of the results there were 59 (52%) of the infants confirmed with a hearing loss
designated as missing the rescreen. There is a high probability that these infants
skipped the rescreen and were evaluated by an audiologist after discharge, but the data
is unclear.
This research has shown the importance in achieving high rescreens rates
by establishing a protocol that brings the family back to the hospital for a rescreen.
This analysis has demonstrated that rescreen rates are critical for ensuring that infants
receive a follow-up screen. We can not be content with an 80% rescreen rate that will
96
make it twice as likely an infant will not receive follow-up. Our goal should be to
achieve 95% or greater.
This research also confirms that having an audiologist involved with the
program is significant to hospital outcomes. Providing technical assistance from a
trained audiologist will give the hospital staff the expertise in improving follow-up
outpatient rescreen rates and eventually led to earlier diagnosis. Audiologists can
provide consistent training to new screening staff on how to troubleshoot equipment.
They can work with the staff and primary care physicians to establish follow-up
protocols for families when the infant fails the outpatient rescreen to ensure they are
referred to a pediatric audiologist.
Several hospitals have the audiology capability to provide diagnostic
evaluations and early interventions for these infants prior to discharge. Nance and
Dodson (2007) suggest that all infants should be diagnosed at birth and begin early
interventions (including genetic testing and counseling) immediately before discharge.
Although this may be the future goal of some professionals it is important that we
always consider the needs of the family and the infant first. This is also not a realistic
goal for the majority of Colorado hospitals that do not have an audiology department
or a pediatric audiologist in their community. The future of technology in diagnostic
equipment and telemedicine may provide real solutions for the concept of diagnosis
before discharge.
This research focused on hospital births but home births also need to be
addressed. Currently in-services are provided to midwives about the importance of
newborn screening and where their families can obtain a newborn hearing screen. The
97
State has purchased OAE equipment for every health department so families have an
option for obtaining a free rescreen. The screening of home births has improved over
the years from 0 to 17.6% in 2005. Additional OAE equipment was recently purchased
to train midwives with the assistance of the Audiology Regional Coordinators. Future
data will demonstrate if this is a feasible model.
Engaging the medical home or primary care physician is the next
important step to ensure families receive the follow-up recommendations from
screening to diagnosis. The Colorado legislature recently passed an immunization
registry bill that has the potential to notify the primary care physician of the newborn
metabolic and newborn hearing screening results. Until the logistics of this can be
figured out the Program is going to send letters to primary care physicians notifying
them when an infant fails or misses a newborn hearing screen. The Follow-up
Coordinator is going to call families for all infants who fail the outpatient screen and
assist them in obtaining a diagnostic evaluation.
Future considerations at the national and state level are looking into the
feasibility of using the newborn blood spot screen to diagnosis infants with CMV.
Fowler et al. (1999) have demonstrated CMV is the most common cause of non-
genetic deafness. CMV may account for a high proportion of infants who pass the
newborn hearing screen and are later identified with hearing loss. The technology is
currently available on the blood spot screen but there needs to be more research to
discern how positive CMV results will be followed since many infants will not
develop hearing loss.
98
The advancement in genetic research also provides families the
opportunities to further identify the cause of their infants hearing loss. Currently
Colorado has a genetic counselor who provides families with counseling and
information. Additional funding resources are needed to implement the capacity for all
families to receive this valuable information and genetic testing if they choose.
The social and economic disparities for newborn hearing screening must
be addressed. Hispanic families are at much higher risk for not obtaining a rescreen.
There are many opportunities to improve the follow-up rescreen rates by targeting
Hispanic families and low socioeconomic families with materials and resources. Local
Healthcare Programs for Children with Special Needs (HCP) are available to provide
care coordination to families. They can assist the family with enrolling the infant into
Medicaid and referring families to services that accept Medicaid reimbursement.
Cultural competency is an issue in every aspect of public and private health.
Resources are needed at every level from screening through early intervention to have
professionals who can speak the language of the family and understand their culture.
The CDPHE is developing classes on ethnic disparities and cultural competency.
These and other trainings can be offered to professionals that work with these
populations to improve the outcomes in screening, diagnosis and early intervention.
Newborn hearing screening has improved the lives of families and children
who are deaf and hard of hearing. It has been the greatest achievement in public health
over the past ten years. This research has shown we still have a long way to go to
develop truly comprehensive systems of care that are community based and culturally
competent for all the families we serve. The importance of an audiologist intimately

99
involved with screening programs will undoubtedly help to improve the rescreen rates
and ensure infants are identified three months of age.
100
APPENDIX A
Historical Perspectives of Newborn Hearing Screening
This appendix provides the reader with a detailed history of previous screening
technologies and recommendations that paved the path for the current Early Hearing
Detection and Intervention Programs.
Behavioral Observation. Ewing and Ewing (1944) described the quality of a
deaf infants voice using gramophone recordings is indistinguishable from a hearing
infants voice during the first year of life. They stressed the importance of identifying
deafness in early infancy to begin early intervention such as lip-reading while the
infant is in close proximity to care-givers, before the infant begins walking and
expanding their world. The authors categorized infant responses to speech and noise
maker stimuli using behavioral observation such as eye widening and blinking
graduating to head turns as the infant became six months or older. Froeschels and
Beebe (as cited by Downs, 2000 and Hayes, 2003) first describe the auropalprebral
reflex to sound.
Downs and Sterritt (1967) promoted the early identification of infants
optimally before six months of age to provide the opportunity for medical and
educational intervention. They trained volunteers in seven Denver hospitals to
observe newborns responses to auditory stimuli. They used sound generators, also
know as Warblets, that produced an acoustic signal around 3000Hz at high intensity
levels of 70-100dB. The sound was presented 4-10 inches from the infant’s ears. The
goal was to identify hearing loss in infants who had moderate to severe hearing losses.
The trained observers worked in pairs with one holding the Warblet while the other
101
observer looked for an eye blink response or auropalpebral reflex, cessation of activity
or arousal response. The responses were recorded on a five-point scale from no
response to more response. If the response was questionable, slight or not present the
screen was repeated. The results were placed in the infants chart. If there were no
responses to the second screen the infant was referred to the audiologist for an
auditory electroencephalographic evaluation (the precursor to the auditory brainstem
response). If there was not an audiologist on site the physician was notified and the
volunteer contacted the physician at six weeks to determine the outcome of any
follow-up testing. The authors suggested that for tracking purposes the hearing
screens should be placed on the same card as the PKU screens. The similarities
between the universal hearing screening programs then and today are astounding.
Many hospitals today are using either the PKU (newborn blood spot screen) or
electronic birth certificate to track hearing screening results. Downs and Hemenway
(1969) published screening results of 17,000 infants and found 17 with hearing loss.
Bergstrom, Hemenway and Downs (1971) discuss the disadvantages of behavioral
observation screening associated with false negatives due to high frequency
configurations or permanent conductive hearing losses. Their findings of 1/1000
infants with hearing loss are similar to the incidence figures cited in the literature
today from statewide screening programs (Centers for Disease Control, 2006). It is no
wonder that Marion Downs is considered the ‘godmother’ of infant hearing screening.
Crib-O-Gram. The Crib-O-Gram was developed by Simmons and Russ
(1974) to decrease the observer error associated with behavioral testing using the
warblet. The equipment was designed to present a 3000Hz sound at 92dB SPL to the
102
infant. A motion sensitive transducer was placed under the mattress to detect a startle
response. A strip chart recorder printed out the infant’s activity prior to and following
the stimulus presentation and was manually. Cox (1988) describes the false positive
rate as being 8% in the well baby and 20% in the Neonatal Intensive Care Unit
(NICU). Although the Crib-O-Gram became more automated, eliminating the manual
scoring, there were later concerns about the validity of the equipment when compared
to auditory brain stem response (ABR) testing (Durieux-Smith, Picton, Edwards,
Goodman, and MacMurray, 1985). The researchers found that one-third of the infants
with normal ABR responses failed the Crib-O-Gram and that only severe to profound
losses were identified. The Crib-O-Gram also failed to detect unilateral hearing
losses.
Auditory Response Cradle. Tucker and Bhattacharya (1992) describe the use
of Auditory Response Cradle (ARC) on 6000 infants. The ARC is a fully automatic
microprocessor that was designed in Great Britain. The ARC has a pressure sensitive
mattress and headrest that monitors head turn, head startle and body activity. The
baby’s respiration activity is monitored using a polyethylene band over the abdomen.
A high pass band noise is presented bilaterally via earphones at 85dB SPL. The high
pass band noise was used to detect the more common congenital hearing losses in the
high frequency regions. The infants motor and respiration responses are detected
automatically and stored in the microprocessor. The ARC also has the capability to
present an equal number of silent trials to determine if the baby’s responses are to the
stimuli rather than spontaneous movement. The baby is considered a ‘pass’ when
97% of the responses, within 10 trials, are not by chance. The baby ‘refers’ when this
103
criteria is not met. The screening procedure ranged from 2-10 minutes. Infants who
failed 2 screens were referred for an audiometric evaluation consisting of ABR, OAE,
and acoustic reflex testing. The results of this research showed an initial 8.1% fail rate
that was reduced 1.7% (N=102) after the second screen. Seventy-nine (1.3%) were
determined to have normal hearing following the audiolologic evaluations indicating
the false positive rate of the ARC screening procedure. Twenty infants were found to
have hearing loss, which included 5 with conductive hearing loss. The cohort was
followed for three years and an additional 7 children were found to have permanent
hearing loss. This technique showed great promise but the objective measures of
otoacoustic emissions and auditory brainstem response techniques that were emerging
simultaneously based on physiologic responses are considered more reliable.
High Risk Registries. A national committee on neonatal hearing screening,
chaired by Marion Downs was formed in 1968 (Northern and Downs, 1991, and
Downs, 2000), and lead to the development of the Joint Committee on Infant Hearing
(JCIH). The JCIH has had an international influence on the screening of newborns.
Originally the committee was comprised of members from the American Speech and
Hearing Association, the American Academy of Ophthalmology and Otolaryngology,
and the American Academy of Pediatrics. Later, the American Academy of
Audiology, the Council on Education of the Deaf, and the Directors of Speech and
Hearing Programs in State Health and Welfare Agencies joined this prestigious group.
In 1973 (JCIH, 1982) the Joint Committee on Infant Hearing Screening recommended
using five criteria for identifying infants at risk for hearing loss. The Committee did
not recommend universal screening of all infants using ‘acoustic testing’ due to the
104
high false positive and false-negatives. In 1975, Mencher (as cited in Mahoney,
1984) recommended that all infants should be universally screened using the JCIH
five criteria. He also recommended that the World Health Organizations, national and
local governments legalize a program of infant screening. In 1982 the JCIH expanded
the criteria to six criteria (family history of childhood hearing loss, congenital
perinatal infections, anatomical malformations involving the head or neck, birth
weight less than 1500 grams, hyperbilirubinemia at level exceeding indications for
exchange transfusion and bacterial meningitis). In addition the Committee
recommended the use of auditory evoked potentials, as part of the audiometric
evaluation, for those infants who were identified as high risk. This began the
evolution of screening infants with electrophysiological measures rather than
behavioral testing.
In 1982 the Directors of Speech and Hearing in State Health and Welfare
Agencies (DSHPSHWA) convened in Toronto, Ontario (Mahoney, 1984). Various
states and territories presented their high-risk programs. The Colorado Department of
Public Health was cited as having a statewide program implemented by the Colorado
Department of Health, Hearing and Speech Services. Twenty participating hospitals
reported infants that were high risk to the Health Department. When the infant turned
six months of age the parents were sent a letter that described speech and language
milestones and appropriate behaviors. If an infant was not demonstrating these
behaviors a free hearing screening was offered. Due to the lack of statewide pediatric
audiologists, Hal Weber developed a portable visual reinforcement unit that was used
in the Health Department Otology Clinics across the state. Infants who were
105
identified with “serious” hearing losses were enrolled in the Home Intervention
Program. The health department program though did not document tracking and
follow. DSHPSHWA members met again in 1984 and recommended the universal
implementation of the 1982 JCIH position statement. They also stressed the need for
more training in pediatric audiology.
Mahoney and Eichwald (1987) estimated that 15% of infants were subjected to
the high risk register but less than half actually were tested for hearing. High risk
registries were also plagued with high false-positive information on family history.
Research demonstrated that the high risk register criteria recommended by the JCIH
identifies only 50% of infants with significant hearing loss (Mahoney and Eichwald,
1987; Mauk and Behrens, 1993; Mehl and Thomson, 2002). Mauk, White, Mortensen
and Behrens (1991) studied a cohort of 70 children ages 6-9 years of age enrolled in
the Utah School for the Deaf. Utah had implemented high risk criteria into the birth
certificate this allowed the researchers to retrieve data regarding the neonatal high risk
status. Data was collected from parents/guardians using a telephone survey on the
auditory related behaviors during the early months of life; actions of the professionals
who parents first contacted because of concern for their child’s hearing; age of
suspicion of hearing loss; age of confirmation of hearing loss; age of amplification;
and age of habilitation. Results supported other findings, that 50% would not have
been identified through the high risk register. Only 33% of parents whose children
were contacted as having risk factors at birth requested an appointment for an
audiological evaluation and only one third of those parents followed through with an
appointment. Most of the parents did not respond or responded that they had no

106
concerns. The age of suspicion of hearing problems and age of confirmation was as
high as eight months. This corroborates with findings from Harrison and Roush (1996)
when they revealed that there is a substantial delay between parent suspicions of
hearing loss and the identification and early intervention of hearing loss.
The JCIH 1990 Position Statement once again expanded the high-risk criteria
to include stigmata or findings associated with a syndrome known to include
sensorienural hearing loss and prolonged mechanical ventilation for duration equal to
or greater than 10 days.
Federal initiatives to support newborn hearing screening began as early as
1965 with the Babbige Report, which recommended “universally applied procedures
for early identification and evaluation of hearing impairment” (CDC, 2006). The
Babbige Report was in response to the poor educational outcomes of children who
were deaf. The National Conference on Education of the Deaf was held in 1967 and
recommended a high risk register be implemented and the cost-effectiveness of
screening all children ages 5-12 months should be investigated. Twenty years later, the
Commission on Education for the Deaf reported that the average age of identification
was still 2.5 years and “the Department of Education and the Department of Health
and Human Services should issue federal guidelines to assist states in implementing
improved screening procedures for live births” (Mauk and Behrens, 1993). As a result
an advisory group on early identification of children with hearing impairment
convened and recommended that demonstration projects on the feasibility of universal
newborn hearing screening be implemented. In the same year, 1988, General
107
Surgeon, C. Everett Koop issued the Healthy People 2000 Initiatives that stated all
children with significant hearing loss should be identified by 12 months of age.
Johnson, Mauk, Takekawa, Simon, et al. (1993) detailed the status of state
sponsored early identification programs in the late 1980’s. They acknowledge that
programs must go beyond screening to include a system of early intervention, family
support, audiological and medical services. The authors used the findings from Blake
and Hall (1990) on the status of statewide hearing screening programs and updated the
information with telephone interviews. Sixteen states had a legislative mandate for
newborn hearing screening but only 9 of those states were actually operating some
form of a program. An addition 14 states had programs without a mandate but only six
had any aspect of an operational program. The majority of the programs focused only
on NICU infants or if an infant had one of the JCIH (1982) risk criteria. In the 1980’s,
20 Colorado hospitals reported high risk factors to the Colorado Department of Pubic
Health and Environment (CDPHE), Health Care Program for Children with Special
Needs (HCP). There was not a system to track these infants to assure they received
any form of follow-up or an audiological evaluation. It was estimated that nationally,
only 3% of the total population was being screened using the high risk register and
receiving subsequent follow-up. This indicated the United States had a long way to go
to reach the challenge put forth by Dr. C. Everett Koop.
108
BIBLIOGRAPHY Abdala de Uzcatequi, C., Yoshinaga-Itano, C. (1997). Clinical report II: parents’
reactions to newborn hearing screening. Audiology Today, 9, 24-25. Aidan, D., Avan, P., & Bonfils, P. (1999). Auditory screening in neonates by means of
transient evoked otoacoustic emissions: a report of 2,842 recordings. Annals of Otology, Rhinology and Laryngology, 108, 525-531.
American Academy of Pediatrics Task Force on Newborn and Infant Hearing. (1999). Newborn and infant hearing loss: detection and intervention. Pediatrics, 103, 527-530.
Amochaev, A. (1987). The infant hearing foundation – a unique approach to hearing screening of newborns. Seminars in Hearing, 8, 165-168. Barringer, D. G., Mauk, G. W., Jensen, S., Woods-Kerschner, N. (1997). Clinical
report I: survey of parents’ perceptions regarding hospital-based newborn hearing screening. Audiology Today, 9, 18-19.
Berg, A.L., Spitzer, J.B., Towers, H.M., Bartosiewicz, C., & Diamond, B.E. (2005). Newborn hearing screening in the NICU: profile of failed auditory brainstem response/passed otoacoustic emission. Pediatrics, 116, 933-938.
Bergstrom, L., Hemenway, W. G., Downs, M. P. (1971). A high risk registry to find congenital deafness. Otolaryngologic Clinics of North America, 4, 369-399
Bess, F.H., Paradise, J.L. (1994). Universal screening for infant hearing: not simple, not risk-free, not necessarily beneficial, and not presently justified. Pediatrics, 958, 330-334.
Blake, P.E. & Hall, J.W. (1990). The status of state-wide policies for neonatal hearing screening. Journal of the American Academy of Audiology, 1, 67-64.
Boshuizen, H.C., van der Lenn, G.J., Kauffman-deBoer, M.A., van Zanten, G.A., Oudesluys-Murphy, A., M., & Verkerk, P.H. (2001). Cost of different strategies for neonatal hearing screening: a modeling approach. Archives Disorders of Child Fetal Neonatal, 85, 177-181.
Centers for Disease Control, National Center on Birth Defects and Disabilities, Early Hearing Detection and Intervention website http://www.cdc.gov/ncbddd/ehdi/FAQ/questionsgeneralHL.htm.
Centers for Disease Control, National Center on Birth Defects and Disabilities, Early hearing Detection and Intervention website (2006). http://0- ww.cdc.gov.mill1.sjlibrary.org/ncbddd/ehdi/history.htm.
Centers for Disease Control (2005). An introduction to program evaluation for public health programs; a self-study guide. http://www.cdc.gov/eval/evalguide.pdf
Chen, S.J., Yang, E.Y., Kwan, M.L., Chang, P., Shiau, A.S., & Lien, C.F. (1996). Infant hearing screening with an automated auditory brainstem response screener and the auditory brainstem response. Acta Paediatrics, 85, 14-18.
Christensen, M., Thomson, V., Letson, G.W. (2007). Evaluating universal newborn hearing screening in Colorado: From population determinants to system-improvement actions. In review.
109
Clemens, C.J., Davis, S. A., Bailey, A.R. (2000). The false-positive in universal newborn hearing screening. Pediatrics, 106, e7.
Colorado Department of Education (2001). A blueprint for closing the gap. http://www.cde.state.co.us/cdesped/download/pdf/dhh-blueprint.pdf
Coughlin, S. (2006). Ethical issues in epidemiologic research and public health practice. Emerging Themes in Epidemiology, 3, 16.
Cox, L.C. (1988). Screening the high-risk newborn for hearing loss: The crib-o-gram v the auditory brainstem response. Infants and Young Children, 1, 71-81.
Cullington, HE, Brown, EJ. (1998). Bilateral otacoustic emissions pass in a baby with Mondini deformity and subsequently confirmed profound bilateral hearing loss. British Journal of Audiology, 32, 249-53.
Danhauer, J.L., Johnson, C. E. (2006). Parents’ perceptions of an emerging community-based newborn hearing screening program: a case study. Journal of the American Academy of Audiology, 17, 202-220.
Dalzell, L., Orlando, M., MacDonald, M., Berg, A., Bradley, M., Cacace A., Campbell, D., DeCristofaro, J., Gravel, J., Greenberg, E., Gross, S., Pinheiro, J., Regan, J., Spivak, L., Stevens, F., & Prieve, B. (2000). The New York State universal newborn hearing screening demonstration project: ages of hearing loss identification, hearing aid fitting, and enrollment in early intervention. Ear and Hearing, 21, 118-30.
Dievler, A., Grason, H.A., & Guyer, B. (1997). MCH functions framework: a guide to the role of government in maternal and child health in the 21st century. Maternal and Child Health Journal, 1, 5-13.
DesGeorges, J. (2003). Family perception so f early hearing, detection, and intervention systems: listening to and learning from families. Mental Retardation and Developmental Disabilities Research Reviews, 9, 89-93.
Downs, M.P. (1995). Universal newborn hearing screening – the Colorado story. International Journal of Pediatric Otorhinolaryngology, 32, 257-259.
Downs, M.P., & Hemenway, W.G. (1969). Report on the hearing screening of 17,000 neonates. International Audiology, 8,72-76.
Downs, M.P. (1994). The case for detection and intervention at birth. Seminars in Hearing, 19, 76-84.
Downs, M.P. (2000). The quest for early identification and intervention. Seminars in Hearing, 21, 285-294.
Downs, M.P. & Sterritt, G.M. (1967). A guide to newborn and infant hearing screening programs. Archives of Otolaryngology, 85, 38-44.
Doyle, K.J., Burggraaff, B., Fujikawa, S., and Kim, J. (1997). Newborn hearing screening by otoacoustic emissions and automated auditory brainstem response. International Journal of Pediatric Otorhinolaryngology, 41, 111-119.
Durieux-Smith, A., Picton, T., Edwards, C., Goodman, J., MacMurray, B. (1985). The crib-o-gram in the NICU: an evaluation based on brain stem electric response audiometry. Ear and Hearing, 6, 20-4.
Erenberg, S. (1999). Automated auditory brainstem response testing for universal newborn hearing screening. The Otolaryngologic Clinics of North America, 32, 999-1007.
110
Ewing, I.R., & Ewing, A.W.G. (1944). The ascertainment of deafness in infancy and early childhood. The Journal of Laryngology and Otology, 309-333.
Finitzo, T., Albright, K., & O’Neal, J. (1998). The newborn with hearing loss: Detection in the nursery. Pediatrics, 102, 1452-1460.
Fowler KB, Dahle AJ, Boppana SB, Pass RF. (1999). Newborn hearing screening: Will children with hearing loss caused by congenital cytomegalovirus infection be missed? Journal of Pediatrics, 136, 60-4. Fortnum, H.M, Summerfield, A.Q, Marshall, D.H., Davis, A.C., & Bamford, J.M.
(2001). Prevalence of permanent childhood hearing impairment in the United Kingdom and implications for universal neonatal hearing screening: questionnaire based ascertainment study. British Medical Journal, 323, 1-6.
Gorga, M.P, & Neeley, S.T. (2003). Cost-effectiveness and test-performance factors interrelation to universal newborn hearing screening. Mental Retardation and Developmental Disabilities Research Reviews, 9, 103-108.
Hall, J.W. (1992). Handbook of Auditory Evoked Responses. Needham Heights, MA, Allyn and Bacon.
Hall, J.W. (2000). Infant hearing impairment and universal hearing screening: screening for and assessment of infant hearing impairment. Journal of Perinatology, 20, S113-121.
Harrison, M. & Roush, J. (1996). Age of suspicion, identification and intervention for infants and young children with hearing loss: a national study. Ear and Hearing, 17, 55-62.
Hayes, D.(2003). Screening Methods: current status. Mental Retardation and Developmental Disabilities Research Reviews, 9, 65-72.
Hecox, K. & Galambos, R. (1974). Brainstem auditory evoked response in human infants and adults. Archives of Otolaryngologoy, 99, 30-33.
Hergils, L., Hergils, A. (2000). Universal neonatal hearing screening – parental attitudes and concerns. British Journal of Audiology, 34, 321-327.
Hermann, B., Thornton, A., & Joseph, J. (1995). Automated infant hearing screening using the ABR: Development and validation. American Journal of Audiology, 4, 6-14.
Jacobson, J.T., Jacobsen, C. A., & Spahr, R. C. (1990). Automated and conventional ABR screening techniques in high-risk infants. Journal of the American Academy of Audiology, 1, 187-195.
Johnson, J.L., Mauk, G. W., Takekawa, K. M., Simon, P. R., Calvin, C., J., & Blackwell, P. M. (1993). Implementing a statewide system of services for infants and toddlers with hearing disabilities. Seminars in Hearing, 14, 105-122.
Johnson, J.L., White, K.R., Widen, J. E., Gravel, J. S., James, M., Kennalley, T., Maxon, A. B., Spivak, L., Sullivan-Mahoney, M., Vohr, B. R., Weirather, Y., & Holstrum, J. (2005). A multicenter evaluation of how many infants with permanent hearing loss pass a two-stage otoacoustic emissions/automated auditory brainstem response newborn hearing screening protocol. Pediatrics, 116, 663-672.
111
Joint Committee on Infant Hearing (2000). JCIH 2000 statement: Principles and Guidelines for Early Hearing Detection and Intervention Programs. Pediatrics, 106, 798-817.
Joint Committee on Infant Hearing (1995). Joint committee on infant hearing 1994 position statement. Pediatrics, 95, 152-156.
Joint Committee on Infant Hearing (1990). Joint committee on infant hearing 1990 position statement. ASHA, 33, 3-6.
Joint Committee on Infant Hearing (1982). Joint committee on infant hearing position statement 1982. Ear and Hearing, 4, 3-4.
Joint Committee on Infant Hearing (1973) Joint committee on infant hearing position statement 1973. http://www.jcih.org/JCIH1973.pdf
Kemp, D. Understanding and using otoacoustic emissions. http://www.est-med.com/OAE/understanding-using_OAE%20von%20Kemp.pdf
Kemp, D.T., & Ryan, S. (1993). The use of transient evoked otoacoustic emission in neonatal hearing screening programs. Seminars in Hearing, 14, 30-45.
Kemp, D.T., Ryan, S., & Bray, P. A guide to the effective use of otoacoustic emissions. Ear and Hearing, 11, 93-105.
Kemp, D. T., & Ryan, S. (1991). Otoacoustic emission tests in neonatal Screening Programmes. Acta Otolaryngology, 482, 73-84.
Kemper, A.R., Downs, S.M. (2000). A cost-effectiveness analysis of newborn hearing screening strategies. Archives of Pediatric Adolescent Medicine, 154, 484-488.
Kennedy, C. R., Hall, D., Davis, A.(2000). Neonatal screening for hearing impairment. Archives of Disease in Childhood, 83,377-383.
Kennedy, C., McCann, D., Campbell, M., Kimm, L., & Thornton, R.(2005). Universal newborn screening for permanent childhood hearing impairment: an 8-year follow-up of a controlled trial. Lancet, 366, 660-662.
Kennedy, C.R., McCann, D.C., Campbell M.J. et al. (2006). Language ability after early detection of permanent childhood hearing impairment. New England Journal of Medicine, 35, 2131-41.
Kennedy, C., McCann, D. (2004). Universal neonatal hearing screening moving from evidence to practice. Archives of Childhood Disease, Fetal Neonatal Edition, 89, 378-383.
Lonsbury-Martin, B.L., (2005). Otoacoustic emissions: where are we today? The ASHA Leader, 19, 1-6.
Lutman, M.E., Davis, A.C., Fortnum, H.M, & Wood, S. (1997). Field sensitivity of targeted neonatal hearing screening by transient-evoked ototacoustic emissions. Ear and Hearing, 18, 265-76.
Luterman, D., Kurtzer-White, E. (1999). Identifying hearing loss: parents’ needs. Journal of the American Academy of Audiology, 8, 13-18.
Magnuson, M., Hergils, L. (1999). The parents’ view on newborn hearing screening. Scandinavian Audiology, 28, 47-56.
Magnuson, M., Hergils, L. (2000). Late diagnosis of congenital hearing impairment in children: the parents’ experiences and opinions. Parent Education and Counseling, 41, 285-294.
Mahoney, T. (1984). High-risk hearing screening of large general newborn populations. Seminars in Hearing, 5, 25-37.
112
Mahoney, T.M., & Eichwald, J.G. (1987). The ups and “Downs” of high-risk hearing screening: the Utah statewide program. Seminars in Hearing, 8, 155-163.
Marlowe, J. A. (1993). Screening all newborns for hearing impairment in a community hospital. American Journal of Audiology, 2, 22-25.
Mason, J.A., & Herrmann, K. R. (1998). Universal infant hearing screening by automated auditory brainstem response measurement. Pediatrics, 101, 221-228.
Mason, S., Davis, A., Wood, S., & Farnsworth, A. (1998). Field sensitivity of targeted neonatal hearing screening using the Nottingham ABR Screener. Ear and Hearing, 19, 91-102.
Maternal and Child Health Bureau, U.S. Department of Health and Human Services (2000). Healthy People 2010: National Health Promotion and Disease Prevention Objectives. Washington, D.C.: Public Health Service Objective 28.11.
Mauk, G.W., White, K. R., Mortensen, L.B., & Behrens, T. R. (1991). The effectiveness of screening programs based on high-risk characteristics in early identification of hearing impairment. Ear and Hearing, 12, 312-319.
Mauk, G.W., & Behrens, T.R. (1993). Historical, political, and technological context associated with early identification of hearing loss. Seminars in Hearing, 14, 1- 17.
Maxon, A.B., White, K.R., Behrens, T. R., & Vohr, B.R. (1995). Referral rates and cost efficiency in a universal newborn hearing screening program using transient evoked otoacoustic emissions. Journal of the American Academy of Audiology, 6, 271-277,
Mehl, A.L., & Thomson, V. (2002). The Colorado newborn hearing screening project,1992-1999: on the threshold of effective population-based universal newborn hearing screening. Pediatrics, 109, www.pediatrics.org/cgi/content/full/109/e7/1-8.
Mehl, A.L, & Thomson, V. (1998). Newborn hearing screening: the great omission. Pediatrics, 101, 1-6. http://www.pediatrics.org/cgi/content/full/101/1/e4.
Meyer, C., Witte, J., Hildmann, A., Hennecke, K., Schunck, K., Maul, K., Franke, U., Fahnenstich, Hl., Rabe, H., Rossi, R., Hartmann, S., & Gortner, L.(1999). Pediatrics, 104, 900-904.
Moeller, M.P. (2000). Early intervention and language development in children who are deaf and hard of hearing. Pediatrics, 106, e43.
Moeller, M.P., White, K.R., Shisler, L. (2006). Primary care physicians’ knowledge, attitudes and practices related to newborn hearing screening. Pediatrics, 118, 1357-1370.
Morton, C.C., Nance, W.E. (2006). Newborn hearing screening – a silent revolution. New England Journal of Medicine, 354, 2151-2164.
Nance, W.E., Dodson, K. (2007). Part 1. How can newborn hearing screening be improved? Audiology Today,19, 14-19.
National Center for Hearing Assessment and Management (NCHAM) (2006). http://www.infanthearing.org/legislative/index.html
National Institutes of Health (1993). NIH Consensus Statement. Early identification of hearing impairment in infants and young children. Online 1993 Mar 1-3 [cited 2006, October, 23] 11,1-24.
113
National Institutes of Health. Report and recommendations: National Institutes on Deafness and Other Communication Disorders (NIDCD) workshop on congenital cytomegalovirus infection and hearing loss. March 19-20, 2002.
Nault , M. (2005). Progression from unilateral to bilateral loss. Proceedings of the National Workshop on Mild and Unilateral Hearing Loss, 30-31.
Nemes, J. (2006). Success of infant screening creates urgent need for better follow-up. The Hearing Journal, 59, 21-28.
Northern J.L. & Downs M.P. (1991) Screening for hearing disorders. Hearing in Children, 4th Edition (pp 231-283). Baltimore: Williams &Wilkins.
Northern, J.L., & Hayes, D.(1994). Universal screening for infant hearing impairment: necessary, beneficial and justifiable. American Academy of Audiology, 6, 1-4.
Norton, S.J., Gorga, M.P., Widen, J.E., Folsom, R.C., Sininger, Y., Cone-Wesson, B., Vohr, B. R., Mascher, K., Fletcher, K. (2000). Identification of neonatal hearing impairment: evaluation of transient evoked otoacoustic emission, distortion product otoacoustic emission, and auditory brain stem response test performance. Ear and Hearing, 21, 508-528.
Sedey, A., Stredler Brown, A., & Carpenter, K. (2005). Language outcomes in young children with unilateral hearing loss. Proceedings of the National Workshop on Mild and Unilateral Hearing Loss, 28-29.
Shoup, A., Owen, K., Jackson, G., & Laptook, A. (2005). The Parkland Memorial hospital experience in ensuring compliance with universal newborn hearing screening follow-up. The Journal of Pediatrics, 66-72.
Simmons, G.B., Russ, F.W. (1974). Automated newborn hearing screening: The crib-o-gram. Archives of Otolaryngology, 100, 1-7.
Sininger, Y.S., Doyle, K. J., Moore, J.K. (1999). The case for early identification of hearing loss in children. Pediatric Clinics of North America, 46, 1-14.
Stach, B.A., & Santilli, C.L. (1998). Technology in newborn hearing screening. Seminars in hearing, 19, 247-261.
Stuart, A., Moretz, M., Yang, E. Y., (2000). An investigation of maternal stress after neonatal hearing screening. American Journal of Audiology, 9, 135-141.
Stewart, D. L., Mehl, A., Hall, J.W., Thomson, V., Carroll, M., and Hamlett, J. Infant hearing impairment and universal hearing screening: universal newborn hearing screening with automated auditory brainstem response: a multisite investigation. Journal of Perinatology, 20, s128-s131.
Thompson, D.L., McPhillips, H., Davis, R. L, Lieu, T. L., Homer C.J., Helfand, V. (2001). Universal newborn hearing screening: summary of evidence. Journal of the American Medical Association, 286, 2000-2010.
Thomson, V. (1997). The Colorado newborn hearing screening project. American Journal of Audiology, 6, 74-77.
Thomson, V., Arehart, K. H.., Gabbard, S.A., brown, A.S., DesGeorges, J., Pruitt, A., Mehl, A.L., Feehs, R. (1999). The Marion Downs national center for infant hearing: developing comprehensive state systems. The Otolaryngology Clinics of North America, 32, 969-986.
Thomson, V., Rose, L.B., O’Neal, J., & Finitzo, T. (1998). Statewide implementation of universal newborn hearing screening. Seminars in Hearing, 19, 287-289.
114
Thomson, V., DesGeorges, J. (2006). Evaluating a State Early Hearing Detection and Intervention (EHDI) Program; Utilizing a Parent Satisfaction Survey. Unpublished manuscript.
Tucker, S. M., Bhattacharya, J. (1991). Screening of hearing impairment in the newborn using the auditory response cradle. Archives of Disease in Childhood, 67, 911-919.
Uus, K., Bamford, J. (2006). Effectiveness of population-based newborn hearing screening in England: ages of interventions and profile of cases. Pediatrics, 117, 887-893.
Van Straaten, H.L. (1999). Automated auditory brainstem response in neonatal hearing screening. Acta Paediatrica, 88, 76-79.
Vohr, B.R., Simon, P., Letourneau, K. (2000). Public health implications of universal hearing screening. Seminars in Hearing, 21, 295-307.
Vohr, B. R., Letourneau, K. S., McDermott, C. (2001). Maternal worry about neonatal hearing screening. Journal of Perinatology, 21, 15-20.
Vohr B. (2003) Overview: Infants and children with hearing loss – part I. Mental Retardation and Developmental Disabilities Research Reviews, 9, 62-64.
Vohr, B.R., Oh, W., Stewart, E.J., Bentkoven, J.D., Gabbard, S., Lemons, J., Papile, L., Pye, R. (2001). Comparison of costs and referral rates of 3 universal newborn hearing screening protocols. The Journal of Pediatrics, 139, 238-244.
Vohr, B.R., Carty, L.M., Moore, P.E., & Letournearu, K. The Rhode Island Hearing Assessment Program: experience with statewide hearing screening (1993-1996). Journal of Pediatrics, 133, 353-357.
Yoshinaga-Itano, C., Sedey A.L., Coulter D.K., & Mehl A.L. (1998) Language of early and later-identified children with hearing loss. Pediatrics, 102, 1161- 1171.
Yoshinaga-Itano, C., Coulter, D., & Thomson V. (2000) The Colorado newborn Hearing Screening project: effects on speech and language development for children with hearing loss. Journal of Perinatology, 20, S132-S137.
Yoshinaga-Itano, C., Coulter, D., & Thomson, V. (1991). Developmental outcomes of children with hearing loss born in Colorado hospitals with and without universal newborn hearing screening programs. Seminars in Neonatology, 6, 521-529.
Tucker, S.M., & Bhattacharya, J. (1992). Screening of hearing impairment in the newborn using the auditory response cradle. Archives of Disease in Children, 67, 911-919.
U.S. Department of Health and Human Services (1990). Healthy people 2000. National health promotion and disease prevention objectives. Washington DC, Public Health Service. http://www.healthypeople.gov.
U.S. Department of Health and Human Services (2006). Healthy people 2010. http://www.healthypeople.gov.
Wada, T., Kubo, T., Aiba, T., Yamane, H. (2004). Further examination of infants referred from newborn hearing screening. Acta Otolaryngology Supplement, 554, 17-25.
White, K. (2003). The current status of EHDI programs in the United States. Mental Retardation and Developmental Disabilities Research Reviews, 9, 79-88.
115
White, K.R., Behrens, T.R. editors. (1993). The Rhode Island hearing assessment project: Implications for universal newborn hearing screening. Seminars in Hearing, 14, 1-122.
White, K.R., Vohr, B.R., Behrens, T.R. (1993).Universal newborn hearing screening using transient evoked ototacoustic emissions: results of the Rhode Island hearing assessment project. Seminars in Hearing, 14, 18-29.
White, K.R., Maxon, A.B. (1995). Universal screening for infant hearing impairment: simple, beneficial, and presently justified. International Journal of Pediatric Otorhinolaryngology, 32, 201-211.