Embed Size (px)
Citation preview

Oecologia Australis24(2):505-523, 2020https://doi.org/10.4257/oeco.2020.2402.19
A PROTECTION AREA IN A SUBTROPICAL FLOODPLAIN INFLUENCED THE PHYTOPLANKTON TAXONOMIC AND FUNCTIONAL DIVERSITY
Alfonso Pineda1*, Aline Caroline Magro de Paula2, Patrícia Iatskiu2, Geovani Arnhold Moresco2, Yasmin Rodrigues Souza2, Laura Andrea Ortega Corredor2, Felipe Morais Zanon3, Bárbara Furrigo Zanco2, Susicley Jati4, Jascieli Carla Bortolini5 & Luzia Cleide Rodrigues2,4
1 Universidade Estadual de Maringá, Centro de Ciências Biológicas, Programa de Pós-graduação em Biologia Comparada, Av. Colombo, 5790, CEP: 87020-900, Maringá, PR, Brazil
2 Universidade Estadual de Maringá, Centro de Ciências Biológicas, Programa de Pós-graduação em Ecologia de Ambientes Aquáticos Continentais, Av. Colombo, 5790, CEP: 87020-900, Maringá, PR, Brazil
3 Universidade Estadual de Maringá, Centro de Ciências Biológicas, Av. Colombo, 5790, CEP: 87020-900, Maringá, PR, Brazil
4 Universidade Estadual de Maringá, Centro de Ciências Biológicas, Núcleo de Pesquisas em Limnologia e Aquicultura, Av. Colombo, 5790, CEP: 87020-900, Maringá, PR, Brazil
5 Universidade Federal de Goiás, Instituto de Ciências Biológicas, Departamento de Botânica, Chácaras Califórnia, CEP: 74045-155, Goiânia, GO, Brazil.
E-mails: [email protected] (*corresponding author); [email protected]; [email protected]; [email protected]; [email protected]; [email protected]; [email protected]; [email protected]; [email protected]; [email protected]; [email protected]
Abstract: Protection areas favor diversity as they decrease the impact of anthropic disturbance on biological communities. Testing its effects on diverse biological communities is a pivotal step to understand how different trophic levels react to such management and conservation strategies. Here, we used data collected from 1993 to 2018 from a subtropical floodplain to evaluate the effect of the installation of a protection zone on the taxonomic and functional diversity of the phytoplankton community. We showed that the installation of the park had a positive effect on the aquatic community, mainly related to the decrease of cyanobacteria dominance and to the increase of phytoplankton functional groups. However, our results also suggested that dynamics occurring in a scale beyond the park seemed to influence key factors for the phytoplankton community, such as transparency and nutrient concentrations. Thus, although we showed that a compensatory measure had a positive effect on biodiversity, we believe that the establishment of protection zones must also consider and integrate the management of the river basin where the areas to be protected are located.
Keywords: damming; freshwater ecosystems; functional traits; natural park; temporal series.
INTRODUCTION
Biodiversity loss is increasing worldwide due to the rise of anthropogenic disturbances (e. g.
habitat fragmentation, overexploitation of natural resources, and introduction of exotic species), affecting natural environments (Tockner & Stanford 2002, Dudgeon et al. 2006). This reduction
Oecol. Aust. 24(2): 505–523, 2020
506 | Protection area influenced phytoplankton diversity
of biodiversity is related to the loss of both species and genetic variability (Olden et al. 2004, Petsch 2016), what consequently debilitate human well-being, since loss of biodiversity decreases the food stocks and increases the occurrence of pests and diseases (Hooper et al. 2005).
The loss of biodiversity and the consequent loss of ecosystem services (e.g. food supply) highlight the importance of actions to prevent environmental degradation and the extinction of the species (Berkes 2009). In this way, the creation of environmental protection areas is essential to the conservation of biodiversity (Di Minin et al. 2017). These areas can range from exclusive research areas with restricted access to areas subjected to sustainable use by local communities and tourism (Shahabuddin & Rao 2010). In any case, protection areas aim to protect the natural dynamics of diverse ecosystems around the world.
Floodplains are ecological systems with high environmental heterogeneity that favor high biodiversity (Thomaz et al. 2004, Thoms et al. 2005, Lansac-Tôha et al. 2016, Junk et al. 2014). However, most of these ecosystems suffer from environmental degradation (Tockner & Stanford 2002, Junk et al. 2014). One of the greatest anthropogenic impacts presented in this ecosystem is the habitat fragmentation, mainly caused by dam construction (Nilsson et al. 2005, Winemiller et al. 2016). Dams alter river flow, modify environmental conditions (e.g. shifts from lotic to lentic conditions), and reduce the connectivity between floodplain environments (Poff 1997, Ward et al. 1999, Stanford & Ward 2001, Oliver & Merrick 2006, Thomaz et al. 2007, Agostinho et al. 2008, Souza-Filho 2009).
In this regard, areas of environmental protection have been proposed as an ecological compensation for dam construction. Protected areas play a pivotal role in biodiversity conservation, and they are a valid and measurable indicator of the progress toward conserving the world’s remaining biodiversity, or, at least, reducing the loss rates (Chape et al. 2005). Indeed, these areas have shown a positive effect on the diversity of trees, mammals and birds (Lees & Peres 2008). However, little is known about how the implementation of such areas could affect the diversity of aquatic microorganisms.
In the case of phytoplankton, understanding the effect of conservation areas is of foremost importance, since this community is the main
responsible for primary productivity and it is the base of trophic cascade in several freshwater ecosystems. In addition, as the phytoplankton community is composed of small species with short generation time, this community responds fast to environmental variation, with fluctuations in community structure (e.g. changes in composition and biomass) over time, thus, being excellent indicators of environmental changes (Reynolds 2006).
A growing approach to understand the ecological processes that influence the phytoplankton community (e.g. Beamud et al. 2015, Rodrigues et al. 2018) is the usage of the functional characteristics of the phytoplankton species (Reynolds et al. 2002, Litchman & Klausmeier 2008, Padisák et al. 2009). According to their functional features and response to environmental variation, phytoplankton species can be classified in functional groups to decrease the variation of the community and enhance the association with environmental processes (Reynolds et al. 2002, Beamud et al. 2015, Mutshinda et al. 2016). In this sense, while, at species level, communities can be strongly affected by neutral processes, such as random dispersion and ecological drift (extinctions related to demographic stochasticity) (e. g. Fukami et al. 2005), functional characteristics respond at a greater degree to the environment (Mutshinda et al. 2016), as environmental processes act over the species functional traits (Kraft et al. 2015). Besides, each functional group relates to different ecological functions (e.g. nitrogen fixing), and understanding its response to natural and anthropic disturbances could help us to assess the resilience capacity of the ecosystems (Elmqvist et al. 2003, Chillo et al. 2011) and the risk of losing ecological functions (Walker et al. 1999, Chillo et al. 2011).
Here, we aimed to test how the implementation of a protected area affects the functional and taxonomic attributes of the phytoplankton community. For this, we used a long time series (24 years) of data derived from a Long-Term Ecological Research (PELD - site 6), which includes biovolume data of phytoplankton species and environmental data. The data were collected in an area of biodiversity protection, created as a compensation for the construction of reservoirs upstream Upper Paraná River floodplain. We tested the hypothesis that the implementation of a protection

Pineda et al. | 507
Oecol. Aust. 24(2): 505–523, 2020
area changes the environmental conditions and alters the structure of the phytoplankton community, acting positively on the number of species and functional groups. Thus, we were interested in evaluating changes in the number of phytoplankton species and functional groups, its biomass, composition, and diversity (Shannon and dominance as the effective number of species) in a subtropical river-lake flood system, both before and after being made into a protected area.
MATERIAL AND METHODS
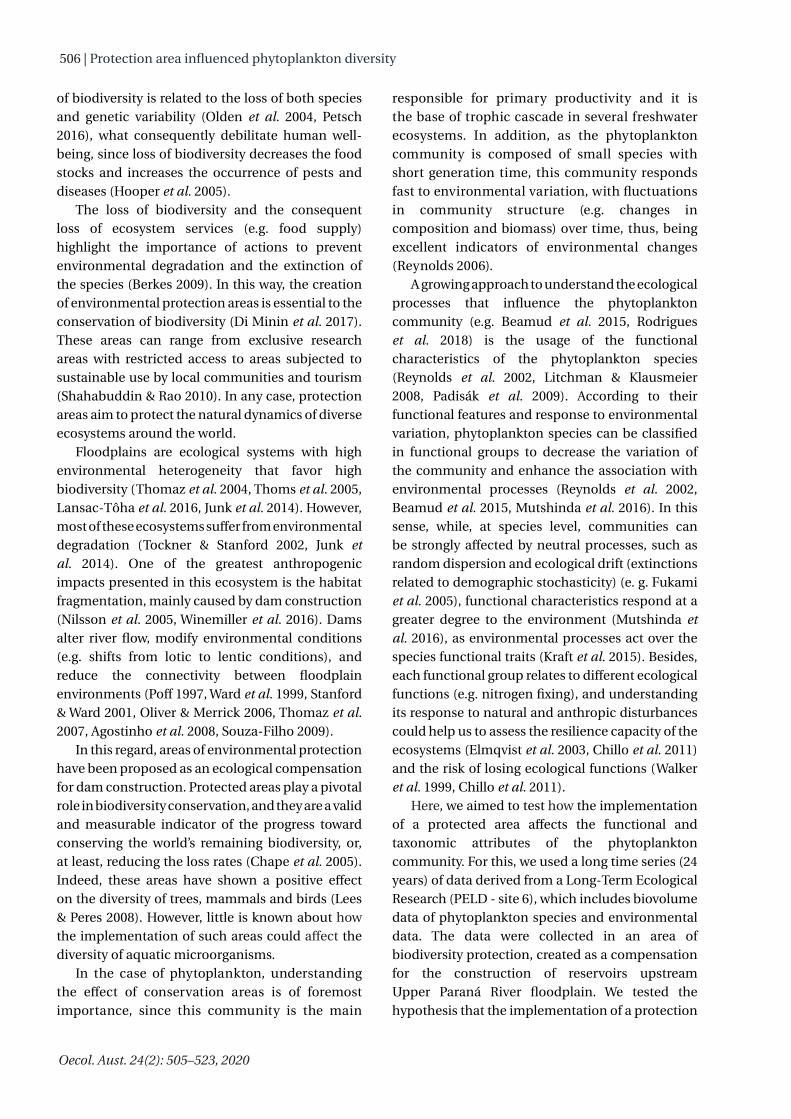
Study areaThe study area is located at the Upper Paraná River floodplain (Figure 1 and 2 - 22°37’S 53°6’W and 24°03’S 54°15’W), within the boundaries of Ivinhema State Park (PEVRI), a state conservation unit created as compensation (Law nº 9985/00, Mato Grosso do Sul) for the upstream construction, in the
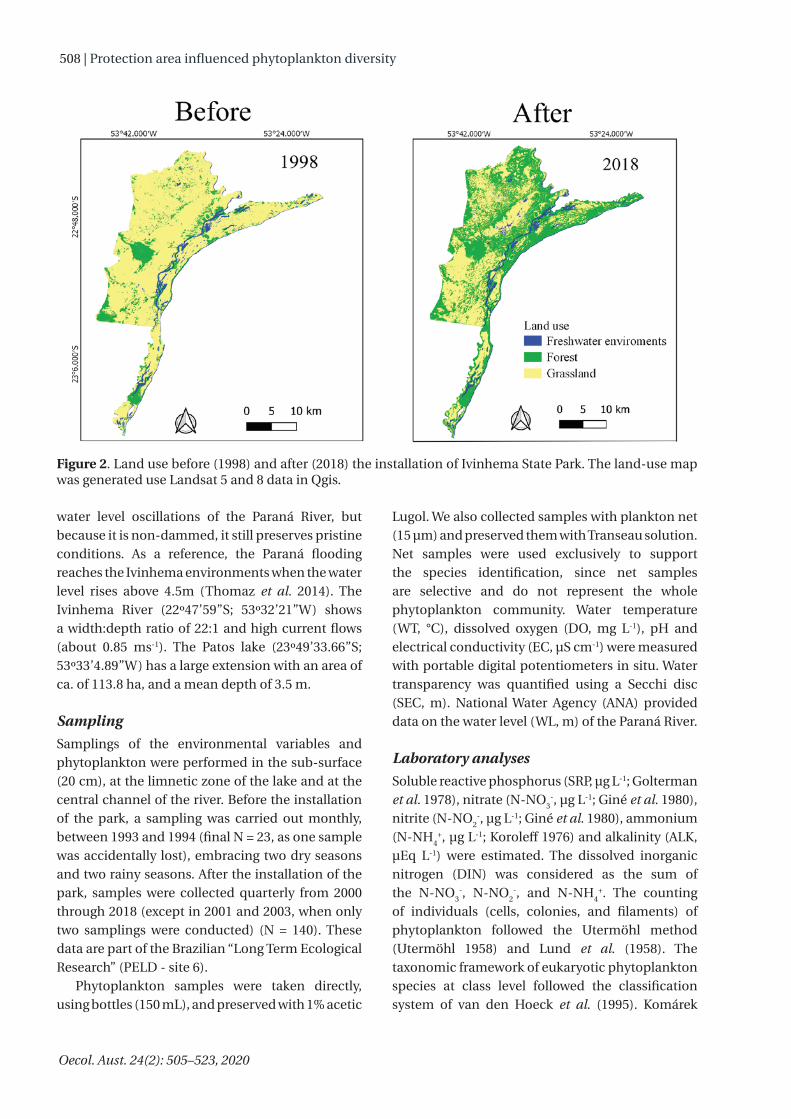
Paraná River, of the hydroelectric dam Engenheiro Sérgio Motta reservoir (Porto Primavera). Created in the year 2000, the Park covers much of the lower Ivinhema River’s course to its mouth on the Paraná River, where numerous lagoons, canals, and rivers are found, with a total area of 73.345,15 hectares. After the installation of the park the forest cover had an important recovery (Figure 2). The hydrological regime is characterized by a high-water season (October–February) and a low-water season (June–September). However, the frequency, duration, and intensity of the floods have changed due to the construction of several dams upstream in the Paraná River (Souza Filho et al. 2004). These dams have caused nutrients and sediment retention that affects this floodplain negatively (Roberto et al. 2009, Oliveira et al. 2018).
The samples were collected in the Ivinhema River and in one lake with permanent connection to the river. The Ivinhema River is influenced by
Figure 1. Map and location of the study area showing the sampling sites.
Oecol. Aust. 24(2): 505–523, 2020
508 | Protection area influenced phytoplankton diversity
water level oscillations of the Paraná River, but because it is non-dammed, it still preserves pristine conditions. As a reference, the Paraná flooding reaches the Ivinhema environments when the water level rises above 4.5m (Thomaz et al. 2014). The Ivinhema River (22º47’59”S; 53º32’21”W) shows a width:depth ratio of 22:1 and high current flows (about 0.85 ms-1). The Patos lake (23º49’33.66”S; 53º33’4.89”W) has a large extension with an area of ca. of 113.8 ha, and a mean depth of 3.5 m.
SamplingSamplings of the environmental variables and phytoplankton were performed in the sub-surface (20 cm), at the limnetic zone of the lake and at the central channel of the river. Before the installation of the park, a sampling was carried out monthly, between 1993 and 1994 (final N = 23, as one sample was accidentally lost), embracing two dry seasons and two rainy seasons. After the installation of the park, samples were collected quarterly from 2000 through 2018 (except in 2001 and 2003, when only two samplings were conducted) (N = 140). These data are part of the Brazilian “Long Term Ecological Research” (PELD - site 6).
Phytoplankton samples were taken directly, using bottles (150 mL), and preserved with 1% acetic
Figure 2. Land use before (1998) and after (2018) the installation of Ivinhema State Park. The land-use map was generated use Landsat 5 and 8 data in Qgis.
Lugol. We also collected samples with plankton net (15 µm) and preserved them with Transeau solution. Net samples were used exclusively to support the species identification, since net samples are selective and do not represent the whole phytoplankton community. Water temperature (WT, °C), dissolved oxygen (DO, mg L-1), pH and electrical conductivity (EC, µS cm-1) were measured with portable digital potentiometers in situ. Water transparency was quantified using a Secchi disc (SEC, m). National Water Agency (ANA) provided data on the water level (WL, m) of the Paraná River.
Laboratory analysesSoluble reactive phosphorus (SRP, µg L-1; Golterman et al. 1978), nitrate (N-NO3
-, µg L-1; Giné et al. 1980), nitrite (N-NO2
-, µg L-1; Giné et al. 1980), ammonium (N-NH4
+, µg L-1; Koroleff 1976) and alkalinity (ALK, µEq L-1) were estimated. The dissolved inorganic nitrogen (DIN) was considered as the sum of the N-NO3
-, N-NO2-, and N-NH4
+. The counting of individuals (cells, colonies, and filaments) of phytoplankton followed the Utermöhl method (Utermöhl 1958) and Lund et al. (1958). The taxonomic framework of eukaryotic phytoplankton species at class level followed the classification system of van den Hoeck et al. (1995). Komárek

Pineda et al. | 509
Oecol. Aust. 24(2): 505–523, 2020
and Anagnostidis (2005, 1998, 1989) were used for the Cyanobacteria classification. The biomass was considered as biovolume, which was estimated by multiplying the density of each taxon by its volume. We estimated the cell volume by calculating the volume of the geometric shape that was the most similar to each cell form (Sun & Liu 2003). The composition was based on the presence vs. absence of the species and functional groups.
All species of phytoplankton were categorized into Reynolds Functional Groups – RFGs (Reynolds et al. 2002, Padisák et al. 2009). Reynolds Functional Groups uses 41 assemblages, identified by alpha-numeric codes according to their sensitivities and tolerances (Padisák et al. 2009). Species within a functional group share adaptive features (e.g, morphological, physiological, and ecological attributes) and enhance the response of the phytoplankton community to environmental variations, as relationships can be established between morphological and/or functional features and several niche aspects of phytoplankters (e.g. availability of resources and turbulence) (Reynolds et al. 2002, Litchman & Klausmeier 2008, Padisák et al. 2009, Kruk et al. 2017).
For the discussion of the values of richness and biomass at the species level, we considered five groups of algae-based on taxonomic and ecological characteristics. 1. Mixotrophic flagellates (Chlamydophyceae, Chrysophyceae, Cryptophyceae, Dinophyceae, Euglenophyceae and Raphidophyceae classes): include potentially heterotrophic flagellate organisms that can incorporate organic forms of carbon into their metabolism (Reynolds 2006; Bellinger & Sigee 2011). 2. Diatoms (Bacillariophyceae, Coscinodiscophyceae and Mediophyceae classes): include organisms with silica carapace, which are favored in environments with high water column mixing (Bellinger & Sigee 2011). 3. Greens (Chlorophyceae, Klebsormidiophyceae, Oedogoniophyceae, Trebouxiophyceae, Ulvophyceae and Zygnematophyceae classes): include organisms that are favored by environments with high light availability and water column mixing at a medium level (Jensen et al. 1994). 4. Blue-greens (Cyanobacteria division): composed of prokaryotic organisms (without true cell nucleus) with the potential to produce toxins (Whitton & Potts 2002), which are adapted
to environments with low water column mixing and high nutrient concentration (Bellinger & Sigee 2011). 5. Xanthophyceans (Xanthophyceae class): comprise unicellular or colonial organisms without mobility, poorly represented in the phytoplankton community, associated with temporary pools and wet mud (Bellinger & Sigee 2011). To calculate the richness, we considered the total number of taxa (species richness) and RFG (number of functional groups) present in each quantitative sample.
Statistical analysesThe spatial and temporal environmental variation was summarized with a Principal Component Analysis (PCA). We were interested in verifying the existence of environmental differences between the samples collected before and after the installation of the park. Axes for interpretation were selected according to the Broken stick method (Jackson 1993).
We performed Permutational Multivariate Analysis of Variance (PERMANOVA) (Anderson 2001) to verify the effect of the installation of the park (before vs. after) on the composition (presence – absence) and biomass of the species and RFGs. PERMANOVA was performed on all the data and in each environment (lake and river), considering the Bray-Curtis dissimilarity index (for biomass) and the Jaccard index (for composition).
To analyze the biomass distribution of species and RFGs before and after the creation of the park, as well as its relationship with the environmental variables, we conducted a Redundancy Analysis (RDA) (Legendre & Legendre 1998). We performed RDA for the entire period of study (1993 to 2018) and, separately, for the phase before and after the installation of the park. As a response, we used Hellinger-transformed matrices of biomass of species and RFGs. The environmental variables (logarithmized except pH) used in the analysis were water temperature (WT - °C), dissolved oxygen (DO - mg L-1), dissolved inorganic nitrogen (DIN - µg L-1, as the sum of nitrate, nitrite, and ammonia), soluble reactive phosphorus (SRP - µg L-1), alkalinity (Alk - mEq L−1), Secchi disc (m), Paraná water level (WL - m), electric conductivity at 25 °C (EC - µS cm-1), and pH. We tested the collinearity of the variables with the variance inflation factor (VIF) and removed variables with VIF > 10. The significance of variables included in the final models was considered with p < 0.05. We considered the adjusted R2 to evaluate the

Oecol. Aust. 24(2): 505–523, 2020
510 | Protection area influenced phytoplankton diversity
relationship between environment and community variation, since the number of predictive factors do not affect these values and make the results comparable.
For each sampling, we calculated the Shannon and Simpson diversity indexes (based on a matrix of presence vs absence of species and RGFs) to obtain the entropy value at both regional and local scales. Then, the entropy values were transformed into an effective number of species. Thus, we obtained the total richness, as well as the number of typical and abundant species. These three measures of diversity as effective number of species are derived from:
λ = ∑(pi)q
, wherepi = ni/N
, where ni = the abundance of species i, and N = the total number of individuals in a sample, only to change the coefficient q (which controls the weights of common and rare species) (Jost 2007). For instance, when q = 0, the species abundance is not considered for the diversity calculation, only its presence, so that this measure can simply represent the species richness. For q = 1, the diversity represents the number of “typical species” (Chao et al. 2010) and can be calculated using the traditional Shannon index (H) as the exp (H). When q = 2, the diversity refers to the number of dominant species, as it gives more importance to the abundant species in a community and severely discounts the contribution of rare species (Gotelli & Chao 2013). In the last case, the value can be obtained using the Simpson index (D), as the 1/1-D. The traditional measures used to evaluate diversity (e.g. Shannon index) represent entropy and to compare derived values from different communities is something difficult. Thus, by converting and analyzing the effective number of species (or groups), we can verify differences among communities that the analysis of entropy measures hide (Jost 2006).
We analyzed the temporal variation of the number of species and RFGs (q = 0, q = 1, q = 2) in two ways. On one hand, with Generalized Additive Models (GAM) and using a Poisson error structure, we analyzed the temporal pattern considering the species (groups) recorded at each sampling. On the other hand, we used sample-size-based
rarefaction (Chao et al. 2014) to compare the number of species and groups (total, typical, and abundant) recorded before and after the installation of the park.
RESULTS
Environmental scenario before and afterThe first two PCA axes summarized 50 % of the environmental variation. The second axis showed spatial separation between the studied environments. In general, the lake was related to higher transparency (Sec) whereas the River was positively associated with the pH. Both the river and the lake showed a high variation of nutrient concentrations (SRP, TP, DIN) and low variability of pH and alkalinity. The other variables showed a coefficient of variation < 30 % (Table 1).
Phytoplankton CommunityBefore the installation of the park, we registered 251 species and 22 RFGs (88 species and 19 RFGs in the river, and 222 species and 22 RFGs in the lake). After the installation of the park, we recorded 656 species and 23 RFGs (289 species and 26 RFGs in the river, and 624 species and 25 RFGs in the lake) (Figure 4).
Green algae showed the highest number of species in the lake and river in both phases (120 taxa before and 170 taxa after) (Figure 5). The number of species increased in all groups before the installation of the park, especially in the river. Diatoms showed higher richness in the river (23 taxa before and 72 taxa after) compared to lake (26 taxa before and 66 taxa after).
High values of the phytoplankton biovolume occurred in both environments and were higher in the lake (2.60 mm3.L-1) than river 0.21 mm3.L-1) (Figure 6). The mean values increased after the installation of the park (2.57 mm3.L-1 after and 1.22 mm3.L-1 before). Blue-green algae (especially RFG H1) dominated in biomass before and after the installation of the park in the lake and in the river. Diatoms (mainly the Coscinodiscophyceae, RFGs P and C) showed the highest biovolume. After installation of the park, in the lake, the biovolume of blue-green algae (before: 3.02 mm3.L-1 ; after: 0.93 mm3.L-1) and mixotrophic flagellates (before: 0.27 mm3.L-1 ; after 0.21 mm3.L-1) decreased whereas the biovolume of diatoms increased (before: 0.67

Pineda et al. | 511
Oecol. Aust. 24(2): 505–523, 2020
mm3.L-1; after: 0.96 mm3.L-1). In the river, only blue-green algae decreased after the installation of the park (before: 0.32 mm3.L-1; after: 0.02 mm3.L-1).
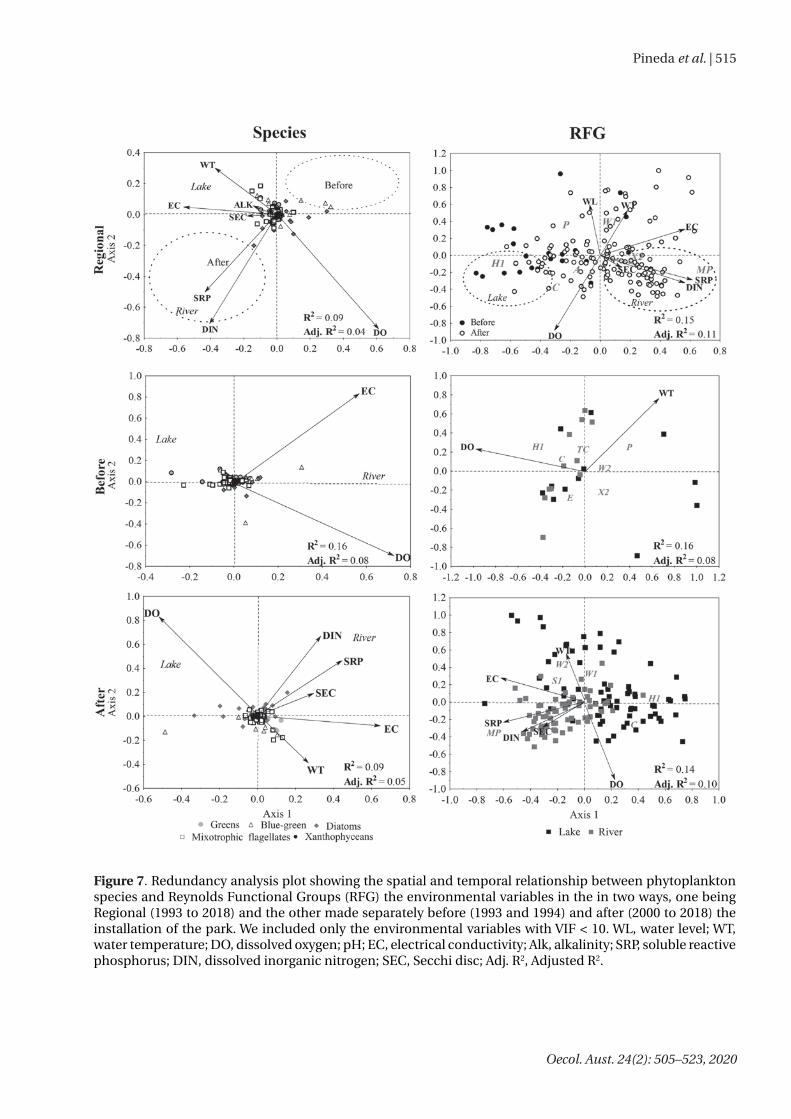
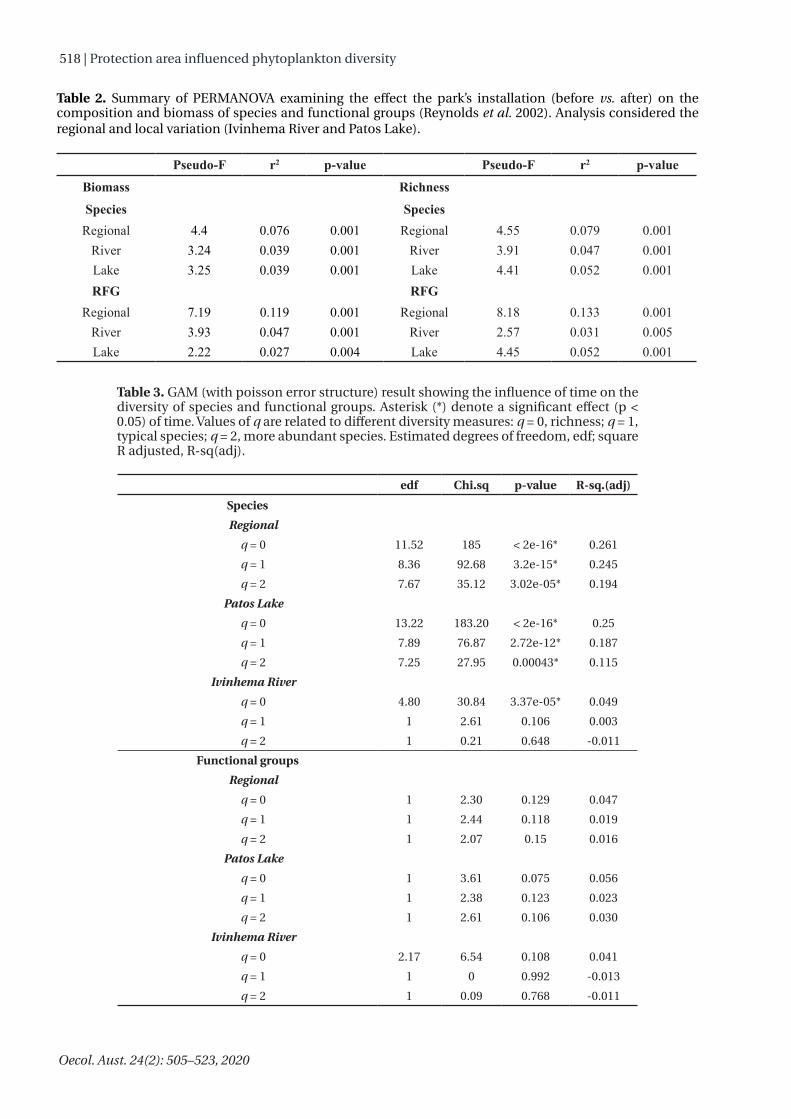
Permanova showed differences in composition and biomass between the phases of the installation of the park for both species and RFGs (Table 2). The RDA indicated that environmental variation, related to the creation of the preservation area, influenced the distribution of the species and RFGs biomass (Figure 7). We evidenced a stronger relationship between the environment and the phytoplankton community when we analyzed RFGs (Adj. R² = 8 % to 11 %), rather than the species (Adj. R² = 4 % to 8 %). Before the installation of the park, the biomass of the cyanobacteria species was positively associated with electrical conductivity and dissolved oxygen. For RFGs, the biomass of nitrogen-fixing cyanobacteria (RFG H1), diatoms (RFG C and P) and desmids (RFG P) were negatively associated with dissolved oxygen before the installation of the park. In the after phase, the
biovolume of the diatom species from RFG MP, was positively associated with dissolved oxygen and nutrient concentrations, dissolved inorganic nitrogen, and soluble reactive phosphorus, respectively.
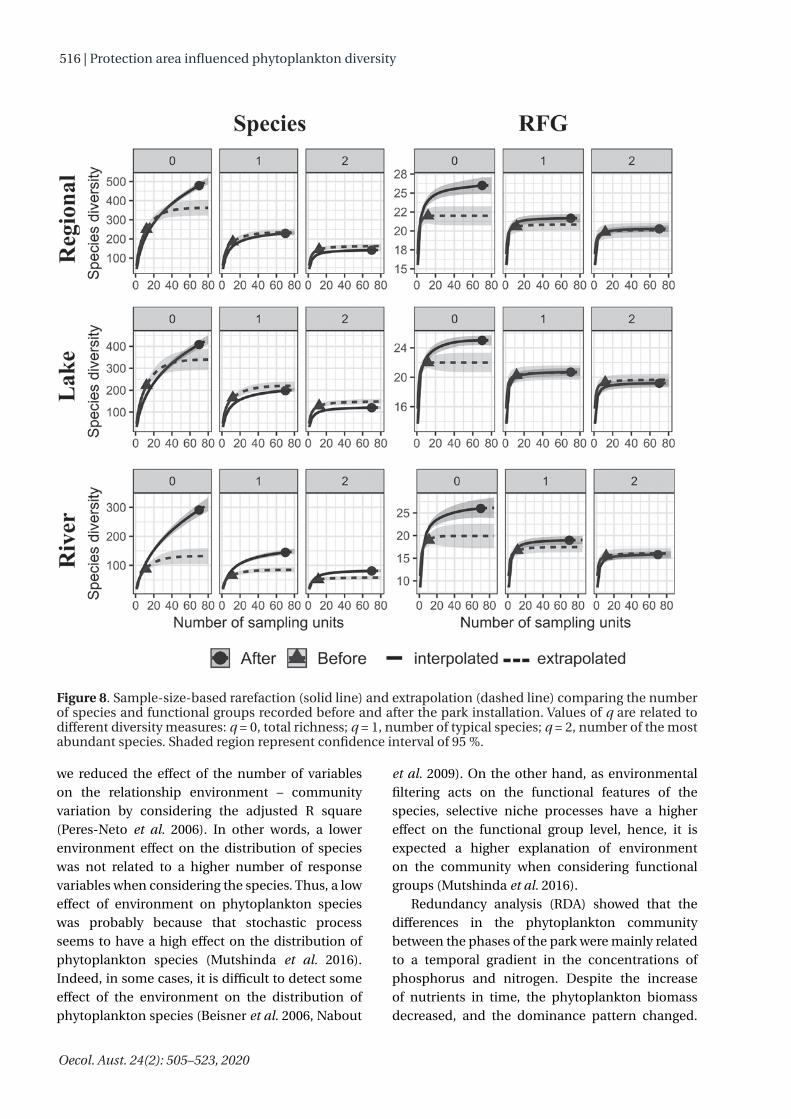
Rarefaction showed that after the installation of the park, the number of species (total, typical, and abundant) increased in the River and decreased in the lake and at regional scale. On the other hand, only the number of total RFGs showed differences between the phases of the park, with the increase in the Ivinhema River and at regional scale (Figure 8). GAM revealed that only the number of species showed a significant temporal pattern (non-linear) at both local and regional scales (Figure 9 and Table 3).
DISCUSSION
Protection areas favor diversity as they decrease the impact of anthropic disturbance on biological
Figure 3. Environmental variation represented in the two first axes of principal components analyses discriminating between environment type and phases of park’s installation. The axes for interpretation were selected based on the Broken Stick criteria. DO dissolved oxygen, DIN dissolved inorganic nitrogen, SRP soluble reactive phosphorus, WT water temperature, WL Paraná water level, Sec secchi disk depth, ALK alkalinity, EC electry conductivity.

Oecol. Aust. 24(2): 505–523, 2020
512 | Protection area influenced phytoplankton diversity
Table 1. Mean values and coefficient of variation in parentheses (%) of the measured environmental factors before and after the installation of the park. WT: Water temperature (°C), DO: dissolved oxygen (mg.L-1), EC: electrical conductivity (µS.cm-1), Sec: Secchi disk (m), Alk: Alkalinity (µg.L-1), DIN: dissolved inorganic nitrogen (µg.L-1), SRP: soluble reactive phosphorus (µg.L-1), TP: total phosphorus (µg.L-1), WL: water level of the Paraná River (m).
VariablesLake River
Before After Before After
WT23.71 25.37 22.91 25.29
(15.57) (15.46) (14.48) (15.39)
DO5.62 5.22 7.6 6.71
(55.18) (50.96) (11.65) (21.9)
pH6.59 6.67 6.93 6.96
(5.91) (9.2) (3.1) (6.51)
EC33.75 38.5 42.09 42.98
(25.27) (20.17) (7.77) (9.87)
Sec1.16 0.69 0.67 0.73
(62.6) (67.44) (30.17) (39.49)
Alk281.67 274.56 367.27 335.76(31.24) (27.3) (9.82) (22.91)
DIN7.49 33.73 5.35 112.6
(91.77) (106.28) (141.54) (49.78)
SRP5.43 11.12 11.65 17.92
(86.32) (64.84) (74.76) (44.36)
TP38.93 47.85 44.3 41.86
(48.46) (43.13) (25.56) (32.61)
WL3.57 2.86 3.4 2.86
(24.23) (29.15) (19.12) (29.21)
Figure 4. Number of species and functional groups (in parentheses) recorded in the Patos Lake and in the Ivinhema River before and after the park installation. Exclusive and shared species (and functional groups) between the phases of the installation of the park are shown.

Pineda et al. | 513
Oecol. Aust. 24(2): 505–523, 2020
Figure 5. Temporal variation of the phytoplankton richness (Taxonomic a, b: and RFGs c, d) in the Patos Lake and in the Ivinhema River before and after the installation of Ivinhema State Park.
communities (Mittermeier et al. 2005). Testing its eff ect on diverse biological communities is a pivotal step to understand how diff erent trophic levels react to such management and conservation strategies. Here, by analyzing data collected from 1993 to 2018, we evidenced that the installation of a protection park in a subtropical fl oodplain infl uenced changes in the aquatic biodiversity, in specifi c, related to the number and biomass of phytoplankton species and functional groups.
In time, we evidenced a non-linear decrease in the total species and typical species richness at the regional scale. The non-linear pattern could be related to the temporal (and cyclic) variation in environmental conditions at the Ivinhema subsystem, which infl uence the number of species that can be established. For instance, fl ood pulse phases can be related to a higher or a lower number of phytoplankton species in accordance with the hydrological period (Train & Rodrigues 1998, Bortolini et al. 2014). Of course, biological communities react to more than one temporal climatic event, some acting on broad and others
on fi ne temporal scales (Pineda et al. 2019). The reduction of species in time was probably infl uenced by the operation of dams upstream which has reduced the frequency and intensity of fl ooding (Souza-Filho et al. 2004, Leira & Cantonati 2008), and henceforward has decreased the eff ect of the fl ood pulse of the Paraná River as promoter of the connectivity and exchange of material and organisms among all the sites in the fl oodplains (Junk et al. 1989, Simões et al. 2012, Rodrigues et al. 2015).
Diff erent from the species richness, the number of functional groups did not show a temporal pattern. The absence of a temporal pattern suggests that functional groups were more resilient to any possible temporal change in environmental conditions, or that the number of functional groups could be more sensible to dynamics acting in temporal scales that were diff erent from the ones we approached. However, as we will show below, changes in the community structure, with variation in the importance (in biomass) of functional groups, were the main changes at the

Oecol. Aust. 24(2): 505–523, 2020
514 | Protection area influenced phytoplankton diversity
functional level of the phytoplankton community at the Ivinhema sub-basin.
Rarefaction showed that, for a similar number of samples, after the installation of the park, fewer species were registered, but with a higher number of functional groups. This result suggests that the environmental conditions after the installation of the park were related to an increase in the number of niches, since each functional group fills different niches (Reynolds et al. 2002, Padisák et al. 2009). This is advantageous for ecological processes like primary productivity, because, with a higher number of functional features, a higher number of resources can be exploited (Loreau et al. 2001, Litchman & Klausmeier 2008). Moreover, a higher number of phytoplankton functional groups increases the resistance and resilience of ecosystems to disturbances, since the negative effect of disturbance on species with particular features can be compensated for the better adaptation to the new disturbed conditions of another group of species (Tilman 1996).
The installation of the park seemed to change
the composition and biomass of the phytoplankton community at both taxonomic and functional levels, and at both local and regional scales. We are aware that we have a higher number of samples collected after the installation of the park, which could represent a higher variability of the phytoplankton community. However, rarefaction (size-based) showed that, before the installation of the park, a high number of species was registered, despite the lower number of samples collected in time. In other words, although a more extensive time could favor the phytoplankton diversity due to a higher number of incoming of species, the results suggested that the differences in the community structure were influenced by changes in the environmental conditions associated to the phases of the park.
However, different processes seemed to drive the phytoplankton patterns at each community level (species and functional groups) and phases of the park. For instance, the environmental factors had a higher effect on the variation of the functional groups than on the species. In this sense,
Figure 6. Temporal variation of the phytoplankton biovolume (Taxonomic a, b: and RFGs c, d) in the Patos Lake and in the Ivinhema River before and after the installation of Ivinhema State Park.
Pineda et al. | 515
Oecol. Aust. 24(2): 505–523, 2020
Figure 7. Redundancy analysis plot showing the spatial and temporal relationship between phytoplankton species and Reynolds Functional Groups (RFG) the environmental variables in the in two ways, one being Regional (1993 to 2018) and the other made separately before (1993 and 1994) and after (2000 to 2018) the installation of the park. We included only the environmental variables with VIF < 10. WL, water level; WT, water temperature; DO, dissolved oxygen; pH; EC, electrical conductivity; Alk, alkalinity; SRP, soluble reactive phosphorus; DIN, dissolved inorganic nitrogen; SEC, Secchi disc; Adj. R2, Adjusted R2.
Oecol. Aust. 24(2): 505–523, 2020
516 | Protection area influenced phytoplankton diversity
Figure 8. Sample-size-based rarefaction (solid line) and extrapolation (dashed line) comparing the number of species and functional groups recorded before and after the park installation. Values of q are related to different diversity measures: q = 0, total richness; q = 1, number of typical species; q = 2, number of the most abundant species. Shaded region represent confidence interval of 95 %.
we reduced the effect of the number of variables on the relationship environment – community variation by considering the adjusted R square (Peres-Neto et al. 2006). In other words, a lower environment effect on the distribution of species was not related to a higher number of response variables when considering the species. Thus, a low effect of environment on phytoplankton species was probably because that stochastic process seems to have a high effect on the distribution of phytoplankton species (Mutshinda et al. 2016). Indeed, in some cases, it is difficult to detect some effect of the environment on the distribution of phytoplankton species (Beisner et al. 2006, Nabout
et al. 2009). On the other hand, as environmental filtering acts on the functional features of the species, selective niche processes have a higher effect on the functional group level, hence, it is expected a higher explanation of environment on the community when considering functional groups (Mutshinda et al. 2016).
Redundancy analysis (RDA) showed that the differences in the phytoplankton community between the phases of the park were mainly related to a temporal gradient in the concentrations of phosphorus and nitrogen. Despite the increase of nutrients in time, the phytoplankton biomass decreased, and the dominance pattern changed.

Pineda et al. | 517
Oecol. Aust. 24(2): 505–523, 2020
Figure 9. Temporal variation of diversity of species based on Hill numbers. q = 0, richness; q = 1, typical species; q = 2, most abundant species. Regression line fitted by GAM. Shaded regions represent 95% confidence interval. Only the temporal variation of species is shown since the number of functional groups did not have a significant temporal pattern.
Before the park, lower concentrations of nutrients were related to a higher biomass of nitrogen-fixing cyanobacteria (RFG H1), whereas after the park it was related to a higher biomass of small-sized phytoplankton species of unicellular diatoms and greens (RFG MP and X2). Thus, the increase of nitrogen concentration after the installation of the park probably decreased the competitive advantage of nitrogen fixers and allowed small algae to have a higher representation in biomass.
RDAs also revealed that the factors driving the phytoplankton variation changed between the phases of the park. For instance, before the park, the electric conductivity, dissolved oxygen, and water temperature influenced the phytoplankton patterns, and there was a low difference between the river and the lake, especially when we considered the distribution of the species. After the park, differences between the river and the lake
increased and were especially related to a gradient of nutrient and transparency (higher in the river). In this sense, the installation of the park probably had a low effect on the increase of nutrient concentration in the river, which probably was caused by the land use of the Ivinhema sub-basin. In this sense, the dynamic of aquatic ecosystems (e.g. changes in nutrient concentrations) must be considered within a landscape context, as the usage of the basin could influence the ecological processes at each environment.
Despite the effective recovery and the preservation of the vegetation in the area of the park (Figure 2), the surrounding area of the park has different land uses ranging from “natural gradient” to “intensively managed” (Hobbs et al. 2006). In this sense, changes in the phytoplankton community may be related not only to the installation of the park, but also to the land use around the river
Oecol. Aust. 24(2): 505–523, 2020
518 | Protection area influenced phytoplankton diversity
Table 2. Summary of PERMANOVA examining the effect the park’s installation (before vs. after) on the composition and biomass of species and functional groups (Reynolds et al. 2002). Analysis considered the regional and local variation (Ivinhema River and Patos Lake).
Pseudo-F r2 p-value Pseudo-F r2 p-value
Biomass Richness
Species SpeciesRegional 4.4 0.076 0.001 Regional 4.55 0.079 0.001
River 3.24 0.039 0.001 River 3.91 0.047 0.001Lake 3.25 0.039 0.001 Lake 4.41 0.052 0.001RFG RFG
Regional 7.19 0.119 0.001 Regional 8.18 0.133 0.001River 3.93 0.047 0.001 River 2.57 0.031 0.005Lake 2.22 0.027 0.004 Lake 4.45 0.052 0.001
Table 3. GAM (with poisson error structure) result showing the influence of time on the diversity of species and functional groups. Asterisk (*) denote a significant effect (p < 0.05) of time. Values of q are related to different diversity measures: q = 0, richness; q = 1, typical species; q = 2, more abundant species. Estimated degrees of freedom, edf; square R adjusted, R-sq(adj).
edf Chi.sq p-value R-sq.(adj)SpeciesRegional
q = 0 11.52 185 < 2e-16* 0.261q = 1 8.36 92.68 3.2e-15* 0.245q = 2 7.67 35.12 3.02e-05* 0.194
Patos Lakeq = 0 13.22 183.20 < 2e-16* 0.25q = 1 7.89 76.87 2.72e-12* 0.187q = 2 7.25 27.95 0.00043* 0.115
Ivinhema Riverq = 0 4.80 30.84 3.37e-05* 0.049q = 1 1 2.61 0.106 0.003q = 2 1 0.21 0.648 -0.011
Functional groupsRegional
q = 0 1 2.30 0.129 0.047q = 1 1 2.44 0.118 0.019q = 2 1 2.07 0.15 0.016
Patos Lakeq = 0 1 3.61 0.075 0.056q = 1 1 2.38 0.123 0.023q = 2 1 2.61 0.106 0.030
Ivinhema Riverq = 0 2.17 6.54 0.108 0.041q = 1 1 0 0.992 -0.013q = 2 1 0.09 0.768 -0.011

Pineda et al. | 519
Oecol. Aust. 24(2): 505–523, 2020
basin, thus evidencing the importance of regional environmental management that considers aspects of the watershed. On the other hand, the decrease in the nutrient concentration in the lake could be a response to the low influence of the Paraná River, which, due to the damming, has lost influence on the adjacent environments (Simões et al. 2012, Rodrigues et al. 2015).
Compensatory actions are necessary to protect and restore dam-affected aquatic ecosystems. Moreover, monitoring programs of long duration are useful tools to understand the temporal dynamics of biological communities and the way compensatory actions influence the diversity patterns. Here, we showed that the installation of the park had a positive effect on the aquatic community, mainly related to the decrease of cyanobacteria dominance and to the increase of phytoplankton functional groups. However, our results also suggested that dynamics occurring in a broad spatial scale seemed to influence key factors for the phytoplankton community, as transparency and nutrient concentration. Thus, although we showed that a compensatory measure had a positive effect on biodiversity, we believe that the establishment of protection zones must also consider and integrate the management of the river basin where the areas to be protected are located, as a way to ensure the best result of protection actions on the aquatic biodiversity.
ACKNOWLEDGEMENTS
This research was supported by PELD-CNPq. A Pineda, G. A. Moresco, A. C. M. Paula, P Iatskiu, L. A. Ortega, Y. R. Souza, L. C. Rodrigues received CNPq and CAPES scholarships. We thank the Programa de Pós-graduação em Ecologia de Ambientes Aquáticos Continentais (PEA), the Programa de Pós-graduação Em Biologia Comparada (PGB) and the Núcleo de Pesquisas em Limnologia, Ictiologia e Aquicultura (Nupélia) from the Universidade Estadual de Maringá (UEM) for supplying infrastructure.
REFERENCES
Agostinho, A. A., Pelicice, F. M., & Gomes, L. C. 2008. Dams and the fish fauna of the Neotropical region: impacts and management related to
diversity and fisheries. Brazilian Journal of Biology, 68, 1119–1132. DOI: 10.1590/S1519-69842008000500019
Anderson, M. J. 2001. A new method for non-parametric multivariate analysis of variance. Austral Ecology, 26(1), 32–46. DOI: 10.1080/13645700903062353
Beamud, S. G., León, J. G., Kruk, C., Pedrozo, F., & Diaz, M. 2015. Using trait-based approaches to study phytoplankton seasonal succession in a subtropical reservoir in arid central western Argentina. Environmental Monitoring and Assessment, (5), 187–271. DOI: 10.1007/s10661-015-4519-1
Beisner, B. E., Peres-Neto, P. R., Lindström, E. S., Barnett, A., & Longhi, M. L. 2006. The role of environmental and spatial processes in structuring lake communities from bacteria to fish. Ecology, 87(12), 2985–2991. DOI: /0012-9658(2006)87[2985:TROEAS]2.0.CO;2
Bellinger, E. G., & Sigee, D. C. 2011. Freshwater Algae: Identification and Use as Bioindicators. L. John Wiley & Sons (Org.), Chichester, UK: WILEY-BLACKWELL.
Berkes, F. 2009. Evolution of co-management: Role of knowledge generation, bridging organizations and social learning. Journal of Environmental Management, 90(5), 1692–1702. DOI: 10.1016/j.jenvman.2008.12.001
Bortolini, J. C., Bovo-Scomparin, V. M., Paula, A. C. M. de, Moresco, G. A., Reis, L. M., Jati, S., & Rodrigues, L. C. 2014. Composition and species richness phytoplankton in a subtropical floodplain lake : a long-term study. Acta Limnologica Brasiliensia, 26(3), 296–305.
Chao, A., Gotelli, N. J., Hsieh, T. C., Sander, E. L., Ma, K. H., Colwell, R. K., & Ellison, A. M. 2014. Rarefaction and extrapolation with Hill numbers: A framework for sampling and estimation in species diversity studies. Ecological Monographs, 84(1), 45–67. DOI: 10.1890/13-0133.1
Chape, S., Harrison, J., Spalding, M., & Lysenko, I. 2005. Measuring the extent and effectiveness of protected areas as an indicator for meeting global biodiversity targets. Philosophical Transactions of the Royal Society B: Biological Sciences, 360(1454), 443–455. DOI: 10.1098/rstb.2004.1592
Chillo, V., Anand, M., & Ojeda, R. A. 2011. Assessing

Oecol. Aust. 24(2): 505–523, 2020
520 | Protection area influenced phytoplankton diversity
the Use of Functional Diversity as a Measure of Ecological Resilience in Arid Rangelands. Ecosystems, 14(7), 1168–1177. DOI: 10.1007/s10021-011-9475-1
Di Minin, E., Soutullo, A., Bartesaghi, L., Rios, M., Szephegyi, M. N., & Moilanen, A. 2017. Integrating biodiversity, ecosystem services and socio-economic data to identify priority areas and landowners for conservation actions at the national scale. Biological Conservation, 206, 56–64. DOI: 10.1016/j.biocon.2016.11.037
Dudgeon, D., Arthington, A. H., Gessner, M. O., Kawabata, Z.-I., Knowler, D. J., Lévêque, C., Naiman, R. J., Prieur-Richard, A.-H., Soto, D., Stiassny, M. L. J., & Sullivan, C. A. 2006. Freshwater biodiversity: importance, threats, status and conservation challenges. Biological Reviews of the Cambridge Philosophical Society, 81(2), 163–82. DOI: 10.1017/S1464793105006950
Elmqvist, T., Folke, C., Nystrom, M., Peterson, G., Bengtsson, J., Walker, B., & Norberg, J. 2003. Response Diversity, Ecosystem Change, and Resilience. Frontiers in Ecology and the Environment, 1(9), 488–494. DOI: 10.2307/3868116
Fukami, T., Bezemer, T. M., Mortimer, S. R., & Van Der Putten, W. H. 2005. Species divergence and trait convergence in experimental plant community assembly. Ecology Letters, 8(12), 1283–1290. DOI: 10.1111/j.1461-0248.2005.00829.x
Giné, M. F., Bergamin F, H., Zagatto, E. A. G., & Reis, B. F. 1980. Simultaneous determination of nitrate and nitrite by flow injection analysis. Analytica Chimica Acta, 114(1), 191–197.
Golterman, H. L., Clymo, R. S., & Ohnstad, M. A. 1978. Methods for physical and chemical analysis of freshwater. 2a ed. Edinburgh, London: NP Handbook, N. 8. p. 213. DOI: https://doi.org/10.1002/iroh.19800650113
Gotelli, N. J., & Chao, A. 2013. Measuring and estimating species richness, species diversity, and biotic similarity from sampling data. In: S. A. Levin (Org.), Encyclopedia of Biodiversity. Second, Vol. 5, p. 195–211. Second ed Waltham, MA: Academic Press.
Hobbs, R. J., Arico, S., Aronson, J., Baron, J. S., Bridgewater, P., Cramer, V. A., Epstein, P. R., Ewel, J. J., Klink, C. A., Lugo, A. E., Norton, D., Ojima, D., Richardson, D. M., Sanderson, E. W., Valladares, F., Vilà, M., Zamora, R., &
Zobel, M. 2006. Novel ecosystems: Theoretical and management aspects of the new ecological world order. Global Ecology and Biogeography, 15(1), 1–7. DOI: 10.1111/j.1466-822X.2006.00212.x
Hooper, D. U., Chapin, F. S., Ewel, J. J., Hector, A., Inchausti, P., Lavorel, S., Lawton, J. H., Lodge, D. M., Loreau, M., Naeem, S., Schmid, B., Setala, H., Symstad, A. J., Vandermeer, J., & Wardle, D. A. 2005. Effects of biodiversity on ecosystem functioning: a consensus of current knowledge. Ecological Monographs, 75, 3–35. DOI: 10.1890/04-0922
Jackson, D. A. 1993. Stopping Rules in Principal Components Analysis: a comparison of Heuristical and Statistical approaches. Ecology, 74(8), 2204–2214. DOI: 10.2307/1939574
Jost, L. 2007. Partitioning diversity into independent alpha and beta components. Ecology, 88(10), 2427–2439. DOI: 10.1890/06-1736.1
Junk, W. J., Bayley, P. B., & Sparks, R. E. 1989. The flood pulse concept in river-floodplain systems. Canadian Special Publication of Fisheries and Aquatic Sciences, 106, 127.
Junk, W. J., Piedade, M. T. F., Lourival, R., Wittmann, F., Kandus, P., Lacerda, L. D., Bozelli, R. L., Esteves, F. A., Nunes da Cunha, C., Maltchik, L., Schöngart, J., Schaeffer-Novelli, Y., & Agostinho, A. A. 2014. Brazilian wetlands: Their definition, delineation, and classification for research, sustainable management, and protection. Aquatic Conservation: Marine and Freshwater Ecosystems, 24(1), 5–22. DOI: 10.1002/aqc.2386
Komárek, J., & Anagnostidis, K. 1989. Modern approach to the classification of cyanophytes. 4. Nostocales.Algolog. Stud. 56: p. 247-345.
Komárek, J., & Anagnostidis, K. 1998. Cyanoprokaryota. 1. Teil Chroococcales. H. Ettl G. Gärtner H. Heynig & D. Möllenhauer (Orgs.),Sübwasserflora von Mitteleuropa.Gustav Fischer Verlag: p. 548.
Komárek, J., & Anagnostidis, K. 2005. Cyanoprokaryota. 2. Teil Oscillatoriales. B. Büdel L. Krienitz G. Gärtner & M. Schagerl (Orgs.), Elsevier: p. 759.
Koroleff, K. J. H. 1976. Determination of ammonia. In: E. Grasshoff & E. Kremling (Orgs.), Methods of seawater analysis. p. 126–133. Verlag Chemie, Weinheim.
Kraft, N. J. B., Adler, P. B., Godoy, O., James, E. C.,

Pineda et al. | 521
Oecol. Aust. 24(2): 505–523, 2020
Fuller, S., & Levine, J. M. 2015. Community assembly, coexistence and the environmental filtering metaphor. Functional Ecology, 29(5), 592–599. DOI: 10.1111/1365-2435.12345
Kruk, C., Devercelli, M., Huszar, V. L. M., Hernández, E., Beamud, G., Diaz, M., Silva, L. H. S., & Segura, A. M. 2017. Classification of Reynolds phytoplankton functional groups using individual traits and machine learning techniques. Freshwater Biology, 62(10), 1681–1692. DOI: 10.1111/fwb.12968
Lansac-Tôha, F. M., Meira, B. R., Segovia, B. T., Lansac-Tôha, F. A., & Velho, L. F. M. 2016. Hydrological connectivity determining metacommunity structure of planktonic heterotrophic flagellates. Hydrobiologia, 781, 81–94. DOI: 10.1007/s10750-016-2824-5
Lees, A. C., & Peres, C. A. 2008. Conservation value of remnant riparian forest corridors of varying quality for Amazonian birds and mammals. Conservation Biology, 22(2), 439–449. DOI: 10.1111/j.1523-1739.2007.00870.x
Legendre, P., & Legendre, L. F. J. 1998. Numerical Ecology. Elsevier. 2nd Ed. Amsterdam: Elsevier Science.
Leira, M., & Cantonati, M. 2008. Effects of water-level fluctuations on lakes: An annotated bibliography. Hydrobiologia, 613, 171–184. DOI: 10.1007/s10750-008-9465-2
Litchman, E., & Klausmeier, C. 2008. Trait-Based Community Ecology of Phytoplankton. Annual Review of Ecology and Systematics, 39(1), 615–639.
Loreau, M., Naeem, S., P. Inchausti J. P. Grime, A. Hector, D. U., J. B., Hooper D. Raffaelli, B. Schmid, D. Tilman, D. A. Wardle, M. A. H., Inchausti, P., Bengtsson, J., Grime, J. P., Hector, A., Hooper, D. U., Huston, M. A., Raffaelli, D., Schmid, B., Tilman, D., & Wardle, D. A. 2001. Biodiversity and Ecosystem Functioning: Current Knowledge and Future Challenges. Science, 294(5543), 804–808. DOI: 10.1126/science.1064088
Lund, J. W. G., Kipling, C., & Le Cren, E. D. E. 1958. The inverted microscope method of estimating algal numbers and the statistical basis of estimations by counting. Hydrobiologia, 11(2), 980–985. DOI: 10.1007/BF00007865
Mittermeier, R. A., Da Fonseca, G. A. B., Rylands, A. B., & Brandon, K. 2005. A brief history of biodiversity conservation in Brazil. Conservation
Biology, 19(3), 601–607. DOI: 10.1111/j.1523-1739.2005.00709.x
Mutshinda, C. M., Finkel, Z. V., Widdicombe, C. E., Irwin, A. J., & Norden, N. 2016. Ecological equivalence of species within phytoplankton functional groups. Functional Ecology, 30(10), 1714–1722. DOI: 10.1111/1365-2435.12641
Nabout, J. C., Siqueira, T., Bini, L. M., & Nogueira, I. D. S. 2009. No evidence for environmental and spatial processes in structuring phytoplankton communities. Acta Oecologica, 35(5), 720–726. DOI: 10.1016/j.actao.2009.07.002
Nilsson, C., Reidy, C. A., Dynesius, C., & Revenga, M. 2005. Fragmentation and flow regulation of the world’s large river systems. Science, 308(5720), 405–408. DOI: 10.1126/science.1107887
Olden, J. D., Poff, N. L. R., Douglas, M. R., Douglas, M. E., & Fausch, K. D. 2004. Ecological and evolutionary consequences of biotic homogenization. Trends in Ecology and Evolution, 19(1), 18–24. DOI: 10.1016/j.tree.2003.09.010
Oliveira, A. G., Baumgartner, M. T., Gomes, L. C., Dias, R. M., & Agostinho, A. A. 2018. Long-term effects of flow regulation by dams simplify fish functional diversity. Freshwater Biology, 63(3), 293–305. DOI: 10.1111/fwb.13064
Oliver, R. L., & Merrick, C. J. 2006. Partitioning of river metabolism identifies phytoplankton as a major contributor in the regulated Murray River (Australia). Freshwater Biology, 51(6), 1131–1148. DOI: 10.1111/j.1365-2427.2006.01562.x
Padisák, J., Crossetti, L. O., & Naselli-Flores, L. 2009. Use and misuse in the application of the phytoplankton functional classification: a critical review with updates. Hydrobiologia, 621(1), 1–19. DOI: 10.1007/s10750-008-9645-0
Peres-Neto, P. R., Legendre, P., Dray, S., & Borcard, D. 2006. Variation partitioning of species data metrices: estimation and comparison of fractions. Ecology, 87(10), 2614–2625. DOI: 10.2307/20069271
Petsch, D. K. 2016. Causes and consequences of biotic homogenization in freshwater ecosystems. International Review of Hydrobiology, 101(3–4), 113–122. DOI: 10.1002/iroh.201601850
Pineda, A., Peláez, Ó., Dias, J. D., Segovia, B. T., Bonecker, C. C., Velho, L. F. M., & Rodrigues, L. C. 2019. The El Niño Southern Oscillation (ENSO) is the main source of variation for the
Oecol. Aust. 24(2): 505–523, 2020
522 | Protection area influenced phytoplankton diversity
gamma diversity of plankton communities in subtropical shallow lakes. Aquatic Sciences, 81(3), 49. DOI: 10.1007/s00027-019-0646-z
Poff, N. L. 1997. Landscape filters and species traits: towards mechanistic understanding and prediction in stream ecology. Journal of the North American Benthological Society, 16(2), 391–409. DOI: 10.2307/1468026
Reynolds, C. S. 2006. The Ecology of phytoplankton. M. Usher D. Saunders R. Peet & A. Dobson (Eds.),Ecology. New York, USA: Cambridge University Press: p. 535. DOI: http://dx.doi.org/10.1017/CBO9780511542145
Reynolds, C. S., Huszar, V., Kruk, C., Naselli-Flores, L., & Melo, S. 2002. Towards a functional classification of the freshwater phytoplankton. Journal of Plankton Research, 24(5), 417–428. DOI: 10.1093/plankt/24.5.417
Roberto, M. C., Santana, N. N. F., & Thomaz, S. M. 2009. Limnology in the Upper Paraná River floodplain: large-scale spatial and temporal patterns, and the influence of reservoirs. Brazilian Journal of Biology, 69(2), 717–725. DOI: 10.1590/S1519-69842009000300025
Rodrigues, L. C., Pivato, B. M., Vieira, L. C. G., Bovo-Scomparin, V. M., Bortolini, J. C., Pineda, A., & Train, S. 2018. Use of phytoplankton functional groups as a model of spatial and temporal patterns in reservoirs: a case study in a reservoir of central Brazil. Hydrobiologia, 805(1), 147–161. DOI: 10.1007/s10750-017-3289-x
Rodrigues, L. C., Simões, N. R., Bovo-scomparin, V. M. V. M., Jati, S., Santana, N. F., Roberto, M. C., & Train, S. 2015. Phytoplankton alpha diversity as an indicator of environmental changes in a neotropical floodplain. Ecological Indicators, 48(1), 334–341. DOI: 10.1016/j.ecolind.2014.08.009
Shahabuddin, G., & Rao, M. 2010. Do community-conserved areas effectively conserve biological diversity? Global insights and the Indian context. Biological Conservation, 143(12), 2926–2936. DOI: 10.1016/j.biocon.2010.04.040
Simões, N. R., Lansac-Tôha, F. A., Velho, L. F. M., & Bonecker, C. C. 2012. Intra and inter-annual structure of zooplankton communities in floodplain lakes: a long-term ecological research study. Revista de Biologia Tropical, 60(4), 1819–1836.
Souza-Filho, E. . 2009. Evaluation of the Upper
Paraná River discharge controlled by reservoirs. Brazilian journal of Biology, 69(2), 707–716.
Souza-Filho, E. E., Rocha, P. C., Comunello, E., & Stevaux, J. C. 2004. Effects of the Porto Primavera Dam on physical environment of the downstream floodplain. In: S. M. . Thomaz, A. Agostinho, & N. S. Hanh (Orgs.), The upper Paraná river and its floodplain: physical aspects, ecology and conservation. p. 55–74. Leiden: Backhuys Pubblishers.
Stanford, J. A., & Ward, J. V. 2001. Revisiting the serial discontinuity concept. Regulated Rivers-Research & Management, 17(4–5), 303–310. DOI: Doi 10.1002/Rrr.659.Abs
Sun, J., & Liu, D. 2003. Geometric models for calculating cell biovolume and surface area for phytoplankton. Journal of Plankton Research, 25(11), 1331–1346. DOI: 10.1093/plankt/fbg096
Thomaz, S. M., Bini, L. M., & Bozelli, R. L. 2007. Floods increase similarity among aquatic habitats in river-floodplain systems. Hydrobiologia, 579(1), 1–13. DOI: 10.1007/s10750-006-0285-y
Thomaz, S. M., Mormul, R. P., & Michelan, T. S. 2014. Propagule pressure, invasibility of freshwater ecosystems by macrophytes and their ecological impacts: a review of tropical freshwater ecosystems. Hydrobiologia, 746, 39–59. DOI: 10.1007/s10750-014-2044-9
Thomaz, S. M., Pagioro, T. A., Bini, L. M., Roberto, M. C., & Rocha, R. R. A. 2004. Limnological characterization of the aquatic environments and the influence of hydrometric levels. In: S. M. Thomaz, A. A. Agostinho, & N. S. Hahn (Eds.), The Upper Paraná River and its floodplain: physical aspects, ecology and conservation. p. 75–102. Leiden: Backhuys Pubblishers.
Thoms, M. C., Southwell, M., & McGinness, H. M. 2005. Floodplain-river ecosystems: Fragmentation and water resources development. Geomorphology, 71, 126–138. DOI: 10.1016/j.geomorph.2004.10.011
Tilman, D. 1996. Biodiversity: population versus ecosystem stability. Ecology, 77(2), 350–363.
Tockner, K., & Stanford, J. A. 2002. Riverine flood plains: present state and future trends. Environmental Conservation, 29(3), 308–330. DOI: 10.1017/S037689290200022X
Train, S., & Rodrigues, L. C. 1998. Temporal fluctuations of the phytoplankton community

Pineda et al. | 523
Oecol. Aust. 24(2): 505–523, 2020
of the Baía River , in the upper Paraná River floodplain , Mato Grosso do Sul , Brazil. Hydrobiologia, 361, 125–134.
Utermöhl, H. 1958. Zur Vervollkommnung der quantitativen Phytoplankton-Methodik. Mitteilungen der Internationalen Vereinigung für Theoretische und Angewandte Limnologie, 9(1), 1–38.
van den Hoeck, C., Mann, D. G., & Jahns, H. M. 1995. Algae: an introduction to phycology. Cambridge, UK: Cambridge University Press.
Walker, B., Kinzig, A., Langridge, J., Walker, B., Kinzig, A., & Langridgel, J. 1999. Plant attribute diversity, resilience, and ecosystem function: the nature and significance of dominant and minor species. Ecosystems, 2(2), 95–113. DOI: 10.1007/s100219900062
Ward, J. V, Tockner, K., & Schiemer, F. 1999. Biodiversity of floodplain river ecosystems: ecotones and connectivity. Regulated Rivers: Research & Management, 15(1–3), 125–139. DOI: 10.1002/(SICI)1099-1 6 4 6 ( 1 9 9 9 0 1 / 0 6 ) 1 5 : 1 / 3 < 1 2 5 : : A I D -RRR523>3.0.CO;2-E
Winemiller, K. O., McIntyre, P. B., Castello, L., Fluet-Chouinard, E., Giarrizzo, T., Nam, S., Baird, I. G., Darwall, W., Lujan, N. K., Harrison, I., Stiassny, M. L. J., Silvano, R. A. M., Fitzgerald, D. B., Pelicice, F. M., Agostinho, A. A., Gomes, L. C., Albert, J. S., Baran, E., Petrere, M., Zarfl, C., Mulligan, M., Sullivan, J. P., Arantes, C. C., Sousa, L. M., Koning, A. A., Hoeinghaus, D. J., Sabaj, M., Lundberg, J. G., Armbruster, J., Thieme, M. L., Petry, P., Zuanon, J., Vilara, G. T., Snoeks, J., Ou, C., Rainboth, W., Pavanelli, C. S., Akama, A., van Soesbergen, A., & Saenz, L. 2016. Balancing hydropower and biodiversity in the Amazon, Congo, and Mekong. Science, 351(6269), 128–129. DOI: 10.1126/science.aac7082
Submitted: 5 September 2019Accepted: 1 April 2020
Published on line: 15 June 2020Associate Editors: Camila Barros and Nuria Pistón