Embed Size (px)
Citation preview

A protocol for conducting 7-day daily renewal testswith Lemna gibbaRichard A Brain1 & Keith R Solomon2
1Department of Environmental Studies, Center for Reservoir and Aquatic Systems Research, Baylor University, One Bear Place #97388, Waco, Texas 76798-7388, USA.2Department of Environmental Biology, Centre for Toxicology, University of Guelph, Guelph, Ontario, Canada N1G 2W1. Correspondence should be addressed to R.A.B.([email protected]).
Published online 19 April 2007; doi:10.1038/nprot.2007.146
Lemna gibba (a duckweed) is a freshwater macrophyte commonly used in toxicity testing, and Lemna spp are currently the only
aquatic higher plants required for evaluation of pesticides under the pesticide registration guidelines of the EPA. The methods
currently available for toxicity testing by various organizations and agencies, including ASTM, OECD, EPA and Environment Canada, are
largely static or semistatic tests with unspecified renewal intervals (OECD) and may not provide a consistent means of exposure owing
to short toxicant half-life in aquatic media, uptake of chemical by plants and evaporation of nutrient media. The procedure outlined
here details a simple and efficient 7-day daily static renewal procedure for conducting toxicity tests with L. gibba, the appropriate
end points to assess, the statistical criteria necessary for analyzing the toxicity data, as well as the steps required to culture and
maintain L. gibba. This protocol is based on a modified version of a widely accepted static method.
INTRODUCTIONL. gibba (a duckweed) is a C3 monocot belonging to a group of fast-growing freshwater aquatic plants (Fig. 1), which serve numerouscritical ecological roles including primary production, nutrientcycling and providing habitat for otheraquatic life1, with worldwide distributionand a key component of aquatic foodwebs2. Commonly used in toxicity testing3,Lemna spp have a high bioconcentrationcapacity for exogenous chemicals, whichare assimilated from the growth medium(or aquatic environment) through theunderside of the leaf 4–6. Assimilationoccurs rapidly and amino acids have beenfound to be incorporated into mature pro-teins after assimilation from growth media inless than 2 min7. Eight distinct transportsystems for organic compounds have alsobeen identified, indicating that a wide varietyof chemicals can be assimilated6,8. Uptake ofnitrite, nitrate, ammonia and phosphates hasalso been extensively studied in Lemna, indi-cating high assimilative capacity for bothorganic and inorganic compounds8–10.A number of advantages of using L. gibbafor ecosystem health assessment have beenproposed by Greenberg et al.6, including(i) assimilation of chemicals from a definedliquid medium directly into the leaf, allowingfor application of toxicant in a highly con-trolled manner; (ii) rapid growth assay fortoxicant assessment, which can be performedwithout special equipment; (iii) Lemna sppare amenable to both in vivo chlorophylland photosynthesis assays; (iv) as plants aresmall, multiple treatments can be performedsimultaneously. Furthermore, among aqua-
tic plants, Lemna spp have intermediate sensitivity when compared toother aquatic macrophytes as well as algae exposed to herbicides11,12
and numerous other contaminants. p
uor
G g
n ih si l
bu
P eru ta
N 700 2©
nat
ure
pro
toco
ls/
moc.er
ut an.
ww
w//:ptt
h
a b
c d
Figure 1 | Visual reference for L. gibba test cultures. L. gibba test cultures propagated in 250-ml culture
flasks (a), 2,800-ml culture flasks (b), culturing setup in a laminar flow hood demonstrating the transfer
of plants from 7- to 10-day-old cultures to new test media (c) and a comparison of growth yield penalty
for L. gibba propagated in culture flasks sealed with parafilm (left-hand side) versus a foam plug
facilitating gas exchange (d).
NATURE PROTOCOLS | VOL.2 NO.4 | 2007 | 979
PROTOCOL

Currently, Lemna spp are the only aquatic higher plants thatrequire toxicity testing of pesticides under the pesticide registrationguidelines of the EPA3, and several toxicity test methods for statictests have been published by various organizations and agencies.Most toxicological studies with aquatic vascular plants expose thetest organism to the toxicant through the exposure medium.Testing procedures can follow the ASTM13, OECD14, EnvironmentCanada15 or EPA16 test method guidelines. The methodologyrecommended for use in pesticide registration is a static test withLemna spp, similar to the flask method for algae. Briefly, the test isinitiated by the introduction of Lemna spp fronds into test vessels.Colonies are inspected for changes in frond number and appear-ance at initial stages of exposure and at the end of exposure; thetotal number of living and/or dead fronds are enumerated. Statictests are entirely appropriate assuming that the toxicant does notdegrade appreciably over the 7-day test period, the medium doesnot evaporate appreciably or the toxicant is not taken up atsignificant concentrations to alter the exposure concentration. Asoutlined in the ASTM standard guide for static tests with L. gibba,static tests may not be applicable for materials that are rapidlybiologically or chemically transformed in aqueous solution, or areremoved from test solutions in substantial quantities by adsorptionto the test chambers or uptake by organisms during the test13.Under these circumstances, a static renewal test is desirable, whichaddresses these issues by renewing the media and correspondingtreatments on a daily basis. Therefore, a 7-day daily static renewalprocedure has been developed17, which is a modification of thestatic method outlined by Greenberg et al.6 and based on the widely
used 7-day static test13. This method is applicable not only toorganic compounds that are susceptible to breakdown, but alsostable organic and inorganic substances as the concentration ofthese compounds in the exposure media can be influenced byevaporative and uptake processes occurring throughout the 7-dayexposure. The one drawback of the static renewal procedure is thatit is more labor- and time-intensive and, given the requirementfor daily formulation of exposure treatments, there is an asso-ciated increased potential for error. However, when a consistentexposure to a chemical of interest is desired, a daily static renewalprocedure affords greater consistency of exposure than a standardstatic test.
This protocol provides the necessary information to set up andconduct a daily static renewal test with L. gibba as well as detailedsteps on how to analyze the toxicity data generated. As a require-ment for laboratory cultures, a detailed procedure for the main-tenance of axenic Lemna cultures is provided. Although this test isoutlined for L. gibba, it can also be applied to other species such asLemna minor and Spirodela spp, although modifications may benecessary. The procedure outlined in this protocol is applicable tomost chemicals, organic or inorganic, exposed either singly or incombination as a mixture. Similar to the ASTM protocol13, theresults of a daily static renewal test can be used to compare thetoxicities of different compounds and assess hazard, as well asevaluate the influence of environmental factors, and for studyingbiological availability and structure–activity relationships.
The procedure described here is modified from Greenberg et al.6
based on the ASTM guideline for 7-day static tests with L. gibba13.
MATERIALSREAGENTS.Hutner’s culture media, see REAGENT SETUP.Compound being evaluated ! CAUTION Special precautions should be taken
if the compound being tested or any solvents used present significant risks tohuman health. This information can be obtained in the material safety datasheets accompanying the substance and any solvents.
.Reagent grade ethanol for sterilization of utensils in the laminar flow bench(Fisher Scientific)
.Reagent grade N,N¢-dimethylformamide or ethanol (for extraction ofpigments) (Fisher Scientific)
.L. gibba plants (see Box 1 for culturing details)EQUIPMENT.500-ml Wheaton graduated media/laboratory bottles with screw top lids (for
Hutner’s media standards; Fisher Scientific, cat. no. 02-940-20).1-liter graduated cylinder (Fisher Scientific, cat no. 08-566-15G).Hot/stir plate (Fisher Scientific, cat no. 11-510-49SHQ)
p
uor
G g
n ih si l
bu
P eru ta
N 700 2©
nat
ure
pro
toco
ls/
moc.er
ut an.
ww
w//:ptt
h
BOX 1 | LEMNA GIBBA LABORATORY CULTURING
General maintenance: the duckweed Lemna gibba (G-3) should be maintained similar to established methods6,13. Propagate cultures in 100 mlhalf-strength Hutner’s media (see Table 1) fortified with 10 g liter�1 of sucrose in 250-ml flasks (see Fig. 1a). Sucrose is used to indicatecontamination in culture flasks, which is indicated by a cloudy appearance. Lemna spp should be introduced into fresh media every 7–10 days;we keep a minimum of four 250-ml flasks at all times. m CRITICAL Cultures should be maintained in a growth chamber at 25 1C (verifytemperature with a thermometer) under 24-h constant uniform cool fluorescent light at 6,800 lux (verify light intensity with a light meter).See Figure 1a for setup.Preparation and dispensing of culture media: all glassware should be clean and free of contaminants and media in culture vessels should beautoclaved before culturing. Once the specified volume of stock solution has been added to 1 liter of water (typically made up in a 4-liter amberglass container), the media should be dispensed into 250-ml flasks (100 ml of media) or 2,800-ml flasks (1,000 ml of media) depending onrequirements. Stoppers made of surgical cloth stuffed with cotton (see Fig. 1b) or foam (Fig. 1a) should be placed in the neck of the flask; thesestoppers facilitate gas exchange while maintaining sterility. Parafilm can also be used; however, there is a growth yield penalty owing todepletion of CO2 as shown in Figure 1d, compared to foam stoppers, which facilitate gas exchange. If using parafilm, autoclave flasks with tinfoil covering the flask opening, then apply parafilm when culturing has been completed. Once autoclaved, place flasks in a laminar flow hooduntil the media cool to room temperature; this typically takes 1–2 h for 100 ml of media and 2–3 h for 1,000 ml of media.Transferring plants to fresh media (Fig. 1c): plants should be transferred into new media in a laminar flow hood to ensure that culturesremain axenic. In the laminar flow hood, remove the stopper or parafilm from the current culture flask and heat the lip of the flask over theBunsen burner to sterilize it. Next, heat a metal scoopula dipped in ethanol and allow it to cool momentarily, then place the scoopula in thecurrent flask and select two plants and transfer them into the flasks containing new media. If using stoppers, place the stopper back in; if usingparafilm, discard the tin foil and cover the flask with parafilm.
980 | VOL.2 NO.4 | 2007 | NATURE PROTOCOLS
PROTOCOL
.Mass balance
.Autoclave
.10-ml pipettes (Fisher Scientific, cat. no. 13-676-33F)
.Pipette ball or auto-pipette (Fisher Scientific,cat. no. 13-681-51 or 13-688-177)
.4-liter amber bottle (Fisher Scientific, cat. no.02-912-276)
.250-ml flasks (Fisher Scientific, cat. no. 10-090B;Fig. 1a)
.2,800-ml flask (Fisher Scientific, cat. no. 10-092; Fig. 1b)
.Cheesecloth and cotton batting or foam stopper (Fisher Scientific,cat. no. 14-127-40)
.Scoopula (Fisher Scientific, cat. no. S50789)
.Bunsen burner with gas hook-up (in the laminar flow hood)
.10-ml polystyrene culture plates (Fisher Scientific, cat. no. 08-757-13A;Figs. 2 and 3)
.Large trays (46 � 35.5 � 2.5 cm; Fisher Scientific, cat. no. 15-239-7;Figs. 2a and 3a)
.Autoclaveable tray (approximately 54 � 44 � 13 cm; Fisher Scientific,cat. no. 13-359-20B)
.Autoclaveable tray (approximately 26 � 16 � 6.4 cm; Fisher Scientific,cat. no. 13-361-20)
.Stainless steel dinner fork
.Dispensette III bottletop dispenser, analog adjustable-volume model; volumerange: 5–50 ml (Fisher Scientific, cat. no. 13-688-231; recommended but notnecessary)
.Appropriate pipettes and pipette tips for delivering treatments to experi-mental units (Eppendorf; Fisher Scientific, cat. nos. 05-402-48 and 05-402-50)
.Analytical instruments capable of analyzing endogenous compounds (chloro-phylls, carotenoids, etc.; at the discretion of the experimenter), if desired
.Oven (if a dry mass measure is desired)
.Growth chamber capable of maintaining 24-h uniform cool fluorescent lightat approximately 6,800 lux and a constant temperature of approximately25 1C. m CRITICAL The growth chamber should be set up for 25 1C underconstant cool white fluorescent light at 6,800 lux (ref. 6). Measure andrecord the temperature and light intensity each day to ensure consistencyof exposure conditions.
.Laminar flow hood (Fig. 1c)REAGENT SETUPHutner’s media The necessary reagents and respective quantities required forhalf-strength Hutner’s culture media are outlined inTable 1 and can be obtained
p
uor
G g
n ih si l
bu
P eru ta
N 700 2©
nat
ure
pro
toco
ls/
moc.er
ut an.
ww
w//:ptt
h
a b
c d
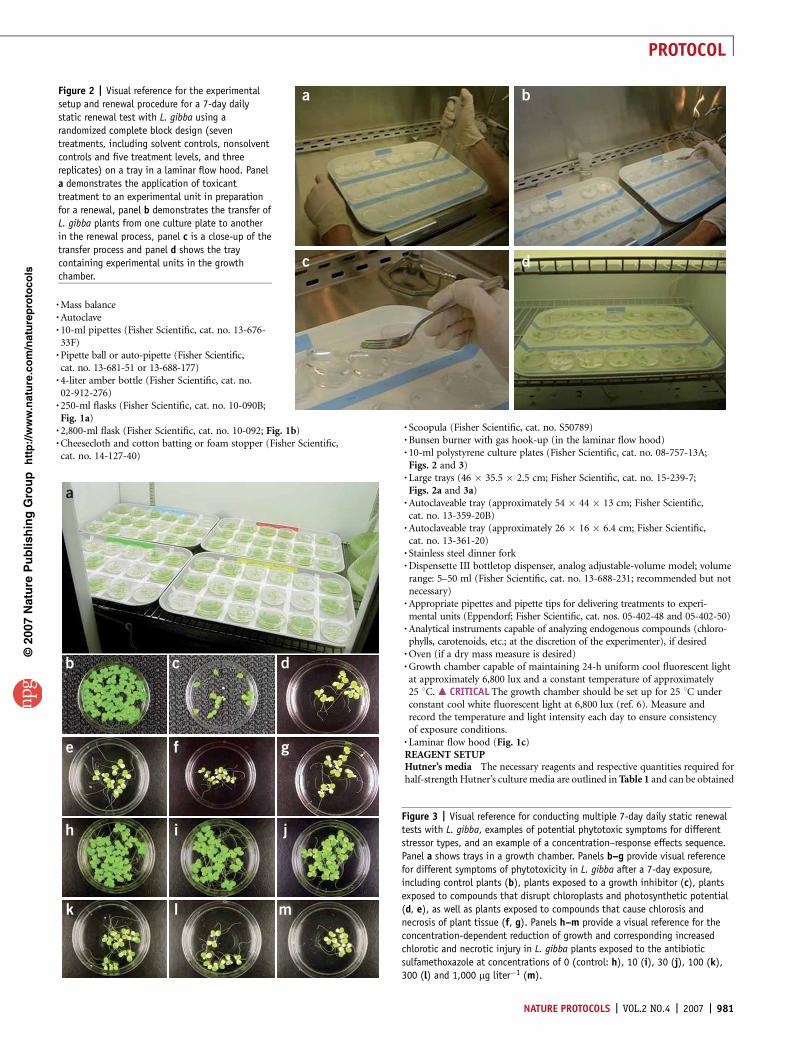
Figure 2 | Visual reference for the experimental
setup and renewal procedure for a 7-day daily
static renewal test with L. gibba using a
randomized complete block design (seven
treatments, including solvent controls, nonsolvent
controls and five treatment levels, and three
replicates) on a tray in a laminar flow hood. Panel
a demonstrates the application of toxicant
treatment to an experimental unit in preparation
for a renewal, panel b demonstrates the transfer of
L. gibba plants from one culture plate to another
in the renewal process, panel c is a close-up of the
transfer process and panel d shows the tray
containing experimental units in the growth
chamber.
a
b
e f g
h i j
k l m
c d
Figure 3 | Visual reference for conducting multiple 7-day daily static renewal
tests with L. gibba, examples of potential phytotoxic symptoms for different
stressor types, and an example of a concentration–response effects sequence.
Panel a shows trays in a growth chamber. Panels b–g provide visual reference
for different symptoms of phytotoxicity in L. gibba after a 7-day exposure,
including control plants (b), plants exposed to a growth inhibitor (c), plants
exposed to compounds that disrupt chloroplasts and photosynthetic potential
(d, e), as well as plants exposed to compounds that cause chlorosis and
necrosis of plant tissue (f, g). Panels h–m provide a visual reference for the
concentration-dependent reduction of growth and corresponding increased
chlorotic and necrotic injury in L. gibba plants exposed to the antibiotic
sulfamethoxazole at concentrations of 0 (control: h), 10 (i), 30 (j), 100 (k),
300 (l) and 1,000 mg liter�1 (m).
NATURE PROTOCOLS | VOL.2 NO.4 | 2007 | 981
PROTOCOL

from Sigma-Aldrich (Sigma-Aldrich). Autoclave stock solutions once all ofthe ingredients have been added to 500 ml distilled water. Stock solutions shouldbe replaced every 3 months. When maintaining cultures add 10 g liter�1 sucroseto media (1 liter water). Do not add sucrose when making media for tests. It isrecommended that Hutner’s media be made up in a 4-liter amber bottle beforethe initiation of an experiment and before each daily renewal. ! CAUTION Thereagents required for Hutner’s growth media (Table 1) present no special riskto human health, although the appropriate precautions should be taken whenhandling reagents as indicated by the reagent label. Use proper safety equipmentincluding laboratory coat, gloves and goggles if necessary. m CRITICAL Hutner’smedia should be autoclaved at least 3 h before test initiation or renewal to allowadequate time to cool to room temperature (25 1C). Autoclaving the mediumthe night before and allowing it to cool in the laminar flow hood will ensure thatthe medium is at room temperature before the test initiation or renewal onthe subsequent day. For a single tray, 2 liters of medium is sufficient forserial dilutions and culture plate additions; for multiple compound tests,additional medium will have to be made up as needed. Using 4-liter amberbottles also facilitates the adaptation of a Dispensette.
Preparation of test concentrations Serial dilutions of the test compound ofinterest should be prepared in growth media, and test culture plates should betreated accordingly. Control culture plates should simply contain 10 ml ofHutner’s media. Treatment culture plates should be made up to an appropriatevolume and spiked with test compound, preferably formulated in Hutner’smedia, although a solvent may be necessary, such that the final volume is equalto the controls (10 ml). It is suggested that for efficient and accurate dispensingof Hutner’s media into the culture dishes, a 5–50 ml Dispensette be used,although standard pipettes will suffice. If the compound of interest has lowsolubility and needs to be made up using a solvent, ensure that each treatment,including the solvent controls, receive the exact same volume of solvent. If asolvent is required to achieve solubility of a compound, it should be reagentgrade or better and its final concentration should not exceed 0.01%, that isr100 mg liter�1, and all treatments should contain the same concentration ofsolvent or dispersant14. Commonly used solvents that do not cause phytotoxi-city at concentrations up to 100 mg liter�1 include acetone, dimethylsulfoxideand dimethylformamide6,13. When a solvent or carrier is used, a second set ofcontrols should contain the same concentration of the solvent or carrier as that
used in the highest concentration of the test substance13,14. A statisticalcomparison (see statistical criteria section) should be made between the solventcontrols and the nonsolvent controls; if there is no statistically significantdifference, then the test is considered valid and both control types can be pooledfor statistical comparisons13,14.
PROCEDURE1| Seven to ten days before conducting a test, transfer 20–40 L. gibba plants to 2,800-ml flasks (1,000 ml growth media) andmaintain the cultures photoautotrophically in growth media without sucrose (see Fig. 1b). This allows all plants used in a giventest to be selected from the same container, thus reducing variations between cultures. More than one test can be run from thecontents of a single 2,800-ml flask as each flask can contain several hundred plants after 7–10 days growth and each testencompassing 18 experimental units requires only 36 plants to initiate.m CRITICAL STEP The following steps should all be carried out in a laminar flow hood to minimize the potential for contamination.
2| Before starting a test or conducting a renewal (renewals occur at 24-h intervals), prepare 2–3 liters (depending on requirements)of sucrose negative growth media as detailed in REAGENT SETUP. Prepare treatment concentrations as described in REAGENT SETUP.m CRITICAL STEP Treatments should be prepared daily for each renewal test.
3| On the day of starting a test, decant the test culture into a sterilized autoclaveable tray (approximately 26 � 16 � 6.4 cm)in a laminar flow hood; Lemna spp will form a uniform layer allowing easy selection of plants. Next, using a sterilized fork,transfer two L. gibba plants, each with four fronds, to each 60 � 15 mm culture dish. Large trays (46 � 35.5 � 2.5 cm; seeFig. 2a) can be used to contain the culture dishes (experimental units) for a test. A randomized complete block design issuggested implementing 18 experimental units, six treatment levels (including controls and five treatment levels) and threereplicates or, if a solvent is required, 21 experimental units are required, seven treatment levels (including solvent controls,nonsolvent controls and five treatment levels) and three replicates. The most effective way to section off a tray is to use10-mm-wide tape, creating a grid of three rows and six columns (see Fig. 3a) or seven columns (if a solvent control is required;Fig. 2a), and then randomly assigning the treatment levels within each of the three rows. The number of concentrations andreplicates can be tailored to individual needs as well as the size of the tray. Within trays, place 18 or 21 10-ml (60 � 15 mm)culture dishes (experimental units) to each section of the grid, again these should be randomly assigned to one of six or seventreatment levels per block with a total of three blocks (replicates) per tray. If the test is intended for the calculation of anEC50, the test concentrations chosen should bracket this value. The suggested range of concentrations should change bytenfold multiples of 1 and 3 in order to be easily amenable to log concentration transformation, for example, 0, 0.1, 0.3, 1, 3,10, 30,y, 1,000 mg liter�1, although smaller intervals can be used at the discretion of the experimenter.
p
uor
G g
n ih si l
bu
P eru ta
N 700 2©
nat
ure
pro
toco
ls/
moc.er
ut an.
ww
w//:ptt
h
TABLE 1 | Composition of half-strength Hutner’s media stock solutionsused for culturing Lemna gibba
Mass of ingredientper 500 mlstock solution (g)
Volume of stocksolution per 1 literof water (ml)
Solution #1 3KNO3 50Ca(NO3)2 . 4H2O 120Solution #2 3MgSO4 . 7H2O 123Solution #3 3KH2PO4 68
Solution #4 1Ferric citrate 0.5Na2EDTA 1.45
Add first, then heat to dissolve, then addH3BO3 0.5MnSO4 .H2O 0.05ZnSO4 . 7H2O 0.5CuSO4 . 5H2O 0.015Na2MoO4 . 2H2O 0.05
The specific ingredients and quantity of each stock solution are given as well as the volume of eachstock solution to be added per liter of water comprising the final media.
982 | VOL.2 NO.4 | 2007 | NATURE PROTOCOLS
PROTOCOL

m CRITICAL STEP Make duplicate trays for the renewal procedure. Two sets of identical trays and culture plates are required foreach test.m CRITICAL STEP Make sure to rinse the fork after each transfer to avoid contamination between experimental units. Testsare conducted with sterile media and culture dishes; however, the culture plates are not sealed with parafilm (the culture platelid is simply placed on top of the respective experimental unit) and therefore the test is not conducted under conditions ofabsolute sterility.
4| After preparing fresh treatment media, using a sterilized fork, transfer the entire plant culture from a given experimentalunit to the corresponding exact experimental unit on the second tray containing fresh nutrient media and toxicant (Fig. 2b,c).m CRITICAL STEP This should be performed in the order of control to the highest concentration, and make sure to rinse the forkafter each transfer to avoid contamination between experimental units.
5| Transfer the tray containing fresh media and treatment back to the growth chamber for 24 h and record the temperatureand light intensity (see Fig. 1a).
6| If the toxicant concentrations are not being validated analytically, discard the media from the test culture dishes from theprevious 24-h exposure period and clean the plates by rinsing several times (at least three times) with distilled water followedby thorough wiping of any remaining droplets inside the polystyrene plate or cap. If analytical validation is required, then thetest culture plates containing media should be retained for subsequent extraction and validation, at the discretion of the experi-menter (see Box 2 for further information).m CRITICAL STEP If there is any concern as to whether the toxicant will stick to the polystyrene plate, then the previous platesshould be discarded and replaced with new plates and labeled accordingly.
7| Repeat Steps 4–6 on a daily basis at the same time each day for 7 days. If appropriate, assess end points on some daysduring the exposure (see Step 8 for details). Frond counts at days 1 and 7 of the experiment are recommended (Step 8A).
8| Once the 7-day exposure is complete, several end points should be evaluated to quantify the phytotoxic effects of thetoxicant. The most commonly measured metrics for Lemna toxicity assays are morphological end points such as number offronds, fresh weight and dry weight6,18. Evaluating morphological end points is described in option A. The photosyntheticcapacity of Lemna plants can also be estimated by measuring the chlorophyll concentration (chlorophyll-a, chlorophyll-b andtotal) of whole plants. Although pigment end points are typically less sensitive than growth end points, pigments are goodcompliments to the growth assay as they indicate damage to processes other than cell division6. Further possible end pointsthat can be evaluated are discussed in ANTICIPATED RESULTS.(A) Morphological end points
(i) Frond number counts: count every frond, regardless of size18. This is a good indicator of inhibition of cell division; how-ever, for cell expansion and explicit increases in biomass, fresh weight provides a more appropriate metric. When a test isinitiated, plants remain in log-phase growth until the surface of the test vessel is covered6. Growth is calculated as theincrease in frond number over time: Ft ¼ F02
n, where F is the number of fronds at time 0 or t, and n is the number ofdoubling events6. Solving for n, n ¼ (log(Ft/F0))/log 2, and dividing n by t yields the growth rate; the doubling time typi-cally ranges from 48 to 96 h (see refs. 6,18). Frond counts can be made visually or by using a digital imaging instrument(LemnaTec GmbH) daily or at set intervals throughout the experiment.
(ii) Wet mass: for wet mass, remove the entire colony from a single experimental unit upon completion of the 7-day exposureand place on a Wipe-all (highly absorbent towels) or Kimwipe, dab dry, transfer to a weigh-boat and place on an analyticalbalance. Repeat this procedure for each experimental unit.
(iii) Dry mass: dry mass can also be evaluated similar to wet mass by thoroughly drying each colony from each experimentalunit in an oven at 80 1C for 24 h.
p
uor
G g
n ih si l
bu
P eru ta
N 700 2©
nat
ure
pro
toco
ls/
moc.er
ut an.
ww
w//:ptt
h
BOX 2 | ANALYSIS OF TOXICANT IN EXPOSURE MEDIA
Concentrations of the toxicant in the media of each experimental unit can be verified at the discretion of the experimenter and should be carriedout if there is evidence that the concentration of the substance being tested is expected to deviate greater than ±20% of the nominal values14.A time-weighted average approach is suggested and outlined by the OECD14. The concentration of the compound used to treat the experimentalunits at the time the fresh medium is made up should be analyzed. After 24 h of exposure, after all of the plants have been transferred to newmedia, the concentration of the individual experimental units (10 ml solution in culture plates) should be analyzed. Once the pre- and post-exposure concentrations are measured, they should be averaged to give a time-weighted exposure for the 24-h period. This can be performeddaily, or just on specified days during the experiment, depending on the capability, needs and interests of the experimenter. Time-weightedaverage concentrations should then be averaged for the three replicates of each treatment level and all days. Measuring the concentration oftoxicant in the media provides appropriate exposure values, which can be used for the treatment control comparisons and nonlinear regressionsof the effects data in place of the nominal exposure values.
NATURE PROTOCOLS | VOL.2 NO.4 | 2007 | 983
PROTOCOL

m CRITICAL STEP If the experimenter wishes to measure chlorophylls, carotenoids or other endogenous compounds,measuring dry weight is not possible.
(B) Pigment end points(i) For chlorophyll determination, remove all plants from the individual 10 ml polystyrene culture plates (experimental unit)
upon completion of the 7-day exposure, dab dry, weigh and subsequently place in individual 10 ml scintillation vialscontaining 5 ml N,N¢-dimethylformamide or ethanol for 24 h in darkness at 4 1C (ref. 6). Extraction times can vary. Planttissue should be completely bleached upon analysis; although maceration of the tissue will facilitate quicker extraction,it is not necessary for pigment extraction.
(ii) Analyze spectrophotometrically at the wavelengths specified below. A clear solvent solution serves as the reference blank,and the absorbance of whole plant extracts is calculated from the ratio of the response of the extract solution to thereference blank according to the equations outlined by Porra et al.19. The concentration of chlorophyll-a in units ofmg ml�1 ¼ 13.71(A664) � 2.85(A647) for extraction in N,N¢-dimethylformamide6 and ¼13.70(A665) � 5.76(A649) forextraction in ethanol20. The concentration of chlorophyll-b in units of mg ml�1 ¼ �5.42(A664) + 22.39(A647) for extractionin N,N¢-dimethylformamide6 and ¼�7.60(A665) + 25.8(A649) for extraction in ethanol20. To mass standardize thechlorophyll concentrations, simply multiply by the extraction volume (5 ml) and divide by the fresh weight of the sample.Note, other solvents are possible for chlorophyll extractions, including acetone, methanol and diethyl ether; however, theequations will vary accordingly and are outlined in Ritchie21.
� TIMINGRenewing Lemna spp maintenance cultures typically takes 3 h, from autoclaving the media (1 h) to letting it cool to roomtemperature (1–1.5 h) to transferring plants into the new media (0.5 h). Renewing solutions for one cycle of the daily staticrenewal procedure typically takes 3 h per day provided that medium has been autoclaved and left to cool overnight in thelaminar flow food. Running multiple tests in tandem will increase the time required to expedite a renewal cycle.
Once a test is complete, processing times for end-point evaluations vary with respect to end-point type. However, for simplyevaluating frond number, wet mass and chlorophylls, allocate approximately 3 h for processing, plus the time required to runthe pigments on the analytical instrument of interest (fluorometer; usually 2 h).
ANTICIPATED RESULTSMaintenance cultures should be healthy and green (Fig. 1) at all times and should not show signs of chlorosis or stuntedgrowth such as underdeveloped fronds. If the monolayer of Lemna spp covers the entire surface area of the liquid in the cultureflask, the culture should be renewed. The doubling time for L. gibba varies between 48 and 96 h (ref. 7).
Typically, upon completion of a 7-day test, control cultures in 10-ml culture plates should cover at least 75% of the surfacearea of the culture plate (see Fig. 3b,h) and have a wet mass between 0.2 and 0.3 g of issue per culture plate.
Controls should appear as healthy as the maintenance cultures (as indicated above) throughout the test period. In orderfor the test to be considered valid, the doubling time of frond number in the control must not be less than 2.5 days (60 h),corresponding to an approximate sevenfold increase over 7 days14. Lemna exposed to toxicants vary with respect to growthrate and health status, although these parameters should vary in a concentration-dependent manner. A visual exampleof a concentration-dependent phytotoxic response for L. gibba exposed to the antibiotic sulfamethoxazole is shown inFigure 3, where the control plates (h) appear healthy and green, the 10 mg liter�1 (i), 30 mg liter�1 (j) treatments arenot visually discernable from the control, the 100 mg liter�1 (k) treatment shows signs of phytotoxic injury, and the300 mg liter�1 (l) and 1,000 mg liter�1 (m) treatments show substantial chlorosis and necrosis. For this example, the averagefresh weights for control, 10, 30, 100, 300 and 1,000 mg liter�1 treatments were 0.29, 0.29, 0.26, 0.10, 0.05 and 0.05 g,respectively.
Time to injury onset of symptoms will vary with toxicant and concentration; however, for highly toxic compounds, effects canbe observed within 24–48 h.
Other end pointsAs outlined by Brain et al.22, there are currently a number of biomarkers that can indicate the type or even the nature of stress,including phase I and phase II detoxification enzymes (e.g., cytochrome P450 oxygenases and glutathione S-transferasemultifunctional enzymes, respectively)23,24, oxidative stress including production of reactive oxygen species25–27, increasedactivity and levels of peroxidase and its isozymes as well as ascorbic acid and glutathione28,29, chlorophyll fluorescence30,flavonoid production31, production of phenolic compounds32 and heat-shock proteins25,33,34. Digital imaging instruments(LemnaTec GmbH) can also be used to provide diagnostic information on toxicity by comparing digital images of individualexperimental unit colonies to set color regimes, indicating the proportion of healthy, chlorotic and necrotic tissue. Evaluationsof pathway-specific responses are also possible by measuring metabolites synthesized downstream of the target enzyme,which have been shown to be 2–3 times more sensitive than measuring gross morphological end points (fresh weight)35,36.
p
uor
G g
n ih si l
bu
P eru ta
N 700 2©
nat
ure
pro
toco
ls/
moc.er
ut an.
ww
w//:ptt
h
984 | VOL.2 NO.4 | 2007 | NATURE PROTOCOLS
PROTOCOL

However, in-depth understanding of the pathway of interest and the target enzyme as well as a logical connection to effects atthe physiological level should accompany these types of end points.
Phytotoxic symptomsSymptomology can vary dramatically with respect to different toxicants, which may warrant further evaluation with morespecific end points. Examples of different phytotoxic injury symptoms are provided in Figure 3b–g. If a compound disruptsgrowth but not cell membranes or chlorophyll, new fronds will appear underdeveloped as growth is arrested, although the planttissue will still remain green (Fig. 3c). If a compound disrupts a component of the photosynthetic apparatus, or the chloroplastitself, a pronounced bleaching of existing and new fronds can be observed (Fig. 3d,e). If a compound has a more general modeof action, for example simply disrupting cell membranes, then plant tissue can take on a yellow-white chlorotic appearance(Fig. 3f,g). Symptomology can indicate a potential organelle, process, pathway or even mode of toxic action and should beused as an indicator for more specific analyses.
STATISTICAL TREATMENT OF DATATreatment control comparisonsExperimental data should be analyzed using a multiple comparisons test, for example Dunnett’s test using proc GLM of SAS v8.2(SAS Institute). For each end point tested, a one-way analysis of variance (ANOVA) should be performed to identify significanteffects (Po0.05). ANOVA assumptions of residual normality and homogeneous variance should be assessed and confirmed usingthe Shapiro–Wilk test (proc univariate normal) and by graphical interpretation of residual plots. Dunnett’s test compares eachtreatment mean with the control by conducting t-test comparisons: t ¼ ui � uc(O(2MSE/nh), where ui is the mean of the ithexperimental group, uc is the mean of the control group, MSE is the mean square error (calculated from the ANOVA) and nh isthe harmonic mean of the sample sizes of the treatment and control groups. Degrees of freedom for the test are calculated asthe total number of experimental units in all groups minus the total number of groups. When significance is found, a lowestobserved effects concentration or no observable effects concentration for that end point should be calculated by comparingthe means of each treatment to the control (a ¼ 0.05).
Nonlinear regressionAll end-point response data should be modeled using nonlinear regression techniques in order to calculate effectiveconcentrations (ECx) required to elicit a specified proportion (x) of effect; Sigmaplot 2000 (SPSS Inc.) is recommended for thisapplication. Models outlined in Table 2 have either been used previously for terrestrial plants37 or have been generated usingthe same methodology for fitting nonlinear regression curves to macrophyte toxicity data. The best-fitting model should beselected based on the mean-corrected coefficient of determination (r2¼1�((error sum of squares)/(corrected sum of squares)))and by graphical interpretation of the model’s fit. Typically, EC10, EC25 and EC50 values and their associated standard errors arecalculated; however, other effect concentrations are possible and at the discretion of the experimenter.
Other statistical criteriaThe following statistical criteria are strongly recommended to supplement the ANOVA and nonlinear regression calculations:It is strongly encouraged that analyses of power (b ¼ 0.2; a ¼ 0.1) be conducted on L. gibba end-point data, particularly incases where treatment–response comparisons indicate that there are no statistically significant differences. Power calculationsindicate the probability of committing a type II error, that two treatments are the same when in fact they are different.Sigmastat 2.0 (SPSS Jandel) statistical package is recommended for this purpose. Hanson et al.38 notes that, in order todetect a r25% change from control with high power, on average 2–21 replicates are required depending on the biometricand plant species.
p
uor
G g
n ih si l
bu
P eru ta
N 700 2©
nat
ure
pro
toco
ls/
moc.er
ut an.
ww
w//:ptt
h
TABLE 2 | Reparameterized equations used to fit linear and nonlinear concentration–responses curves29,31,40.
Regression Equationa Modeling type
Linear y ¼ ((�bp/100)/ECx)x + b DecreaseLogistic y ¼ a/[1 + (p/(1 � p)(x/ECx)
b)] DecreaseGompertz y ¼ ge(ln((100 � p)/100)(x/ECx)) DecreaseExponential y ¼ ae(ln((a � ap/100 – b(100 � x)/100)/a)(x/ECx)) + b DecreaseFour-parameter logistic y ¼ y0 + a/(1 + (x/ECx)
b)((a/(1 � p)(y0 + a) � y0) –1) DecreaseHormetic y ¼ (t � (1 + hx))/(1 + ((p + hx)(1 � p)) � (x/ECx)
b) HormeticLinear y ¼ a + ((ap)/ECx)x) IncreaseSigmoidal y ¼ a/(1 + (p/(1 � (1 + p)e(�ECx/b)))e(�x/b)) IncreaseFour-parameter logistic y ¼ y0 + a/(1 + (x/ECx)
b)((a/(1 + p)(y0 + a) �y0) –1) IncreaseaThe variable ECx is the calculated effective concentration at which proportion p of the end point is affected and x is the actual concentration (i.e., mg liter�1), y is the response or change from control of the endpoint modeled and a, b, g, t, h and y0 are constants.
NATURE PROTOCOLS | VOL.2 NO.4 | 2007 | 985
PROTOCOL

Coefficients of variation (CVs) are useful for characterizing the proportion of variability with respect to mean, whereo20–25% variation is desirable depending on the end point38. CVs are calculated as the ratio of the standard deviation (s.d.)and mean (Y ) for control values of each end point assessed (CV ¼ 100 � (s.d./Y)). CVs are also calculated in order to compareend points and species relative to the ECx values, as well as calculate minimum detectable differences (MDD). The MDD forANOVAs—the size of the difference required between means of two samples in order for the difference to be statisticallysignificant—is calculated using the CV for each end point following the procedures described by Hanson and Solomon39,outlined in Kraufvelin40 from Sokal and Rohlf41: MDD ¼ ((O2(ta,v + tb,v) � CV)/On), where n is the number of replicates, ta,v
is the t-value for a at v degrees of freedom, tb,v is the t-value for b at v degrees of freedom and CV is coefficient of variation.The degrees of freedom are calculated as v ¼ k(n�1), where k is the number of groups, for example control and treatment(s).a is typically set to 0.1 (two-tailed test) and b is typically set to 0.2 (one-tailed test). For L. gibba, we typically experienceCV values of less than 10% corresponding to MDD values of less than 20%, indicating low variability among the controls.
Minimum significant differences (MSDs)—the minimum difference that can exist between a test treatment and control fora particular test and be statistically significant—are calculated as follows for each end point as described by Hanson andSolomon39, using the same MSD equation utilized by the United States Environmental Protection Agency42: (MSD ¼ criticalDunnett value � (s.e.)), where the critical Dunnett value for a two-tailed test at a ¼ 0.1, mean square error degrees of freedomand number of treatments minus control is derived from the SAS output. The s.e. is the standard error of the difference betweentreatments for Dunnett’s test with unequal group sizes and is calculated as follows: s.e. ¼ O(s2(1/2n)), where s2 is the meansquare of the residuals from the ANOVA and n is the number of replicates. MSD values are usually similar in magnitude to theMDD values, although deviations can occur.
Biological effect sizes are calculated as 100 � ((x1/x2)�100), where x1 and x2 represent the treatment and control means,respectively, provided the numerator is greater than the denominator; if this relationship is not true and the treatment mean ishigher than the control mean, simply inverse the ratio. Calculating the biological effect size indicates the actual differencebetween the various treatments and the controls, which can then be compared to the MDD and MSD. If the MDD and MSD arelower than the biological effect size, then it can confidently be stated that the data are statistically ‘‘good enough’’ to makeinferences regarding the differences in spite of low power43. However, it should be noted that the setting of acceptable effectsize criteria is judgmental44 and, although consensus has not been reached by scientists and regulators, the US EPA suggests athreshold of 420% to be ecologically significant45.
ACKNOWLEDGMENTS We acknowledge Dr Bruce Greenberg and Dr Mark Hanson.
COMPETING INTERESTS STATEMENT The authors declare that they have nocompeting financial interests.
Published online at http://www.natureprotocols.comReprints and permissions information is available online at http://npg.nature.com/reprintsandpermissions
1. Hillman, W.S. The lemnaceae or duckweeds: a review of the description andexperimental literature. Bot. Rev. 27, 221–287 (1961).
2. Landolt, E. ‘‘The Family of Lemnaceae: A Monographic Study’’. Volume 1. Ver.Geobotan. 1–566 (Institute ETH, Stiftung Rubel, Zurich, 1986).
3. Davy, M., Petrie, R., Smrchek, J., Kuchnicki, T. & Francois, D. 158 (USEPA,Washington DC, 2001).
4. Ben-Tal, Y. & Cleland, C.F. Uptake and metabolism of [14C]salicylic acid in Lemnagibba G3. Plant Physiol. 70, 291–296 (1982).
5. Gorham, P.R. Measurements of the response of Lemna to growth promotingsubstances. Am. J. Bot. 28, 98–101 (1941).
6. Greenberg, B.M., Huang, X.-D. & Dixon, D.G. Applications of the aquatic higherplant Lemna gibba for ecotoxicological risk assessment. J. Aquatic Ecosyst. Health1, 147–155 (1992).
7. Greenberg, B.M., Gaba, V., Mattoo, A.K. & Edelman, M. Identification of a primaryin vivo degradation product of 32 Kd protein of photosystem II. Eur. Mol. Biol. Org.6, 2865–2869 (1987).
8. Dakta, A.H. & Mudd, S.H. Uptake of amino acids and other organic compounds byLemna paucicostata Heglm 6746. Plant Physiol. 77, 770–778 (1985).
9. Ben-Izhak, M.E., Lost, D., Porath, D. & Tal, M. 15N nuclear magnetic resonancestudy of ammonium ion assimilation by Lernna gibba L. New Phytol 107, 341–345(1987).
10. Ullrich-Eberius, C.I., Novacky, A. & van Bel, A.J.E. Phosphate uptake inLemna gibba G1: energetics and kinetics. Planta (Heidelberg) 161, 46–52(1984).
11. Fairchild, J.F., Ruessler, D.S., Haverland, P.S. & Carlson, A.R. Comparativesensitivity of Selenastrum capricornutum and Lemna minor to sixteen herbicides.Arch. Environ. Contam. Toxicol. 32, 353–357 (1997).
12. Fairchild, J.F., Ruessler, D.S. & Carlson, A.R. Comparative sensitivity of fivespecies of macrophytes and six species of algae to atrazine, metribuzin, alachlor,and metolachlor. Environ. Toxicol. Chem. 17, 1830–1834 (1998).
13. ASTM E. 1415-91 Standard Guide for Conducting Static Toxicity Tests with Lemnagibba G3 (American Society for Testing and Materials, West Conshohocken,PA, 1999).
14. OECD guidelines for the testing of chemicals: revised proposal for a new guideline221: Lemna spp. Growth Inhibition Test. OECD (Organization of EconomicCooperation and Development, Paris, France, 2002).
15. Environment-Canada. Biological Test Method: test for measuring the inhibition ofgrowth using the freshwater macrophyte Lemna minor. (Method development andapplication section, Ottawa, ON: Environmental Technology Centre, EnvironmentCanada, Report EPS, 1999).
16. Ecological effects test guidelines: OPPTS 850.4400 Aquatic plant toxicity testusing Lemna spp., Tiers I and II. Washington D.C. USEPA (United StatesEnvironmental Protection Agency, Prevention, Pesticides and Toxic Substances(7101) EPA712–C–96–156, 1996).
17. Brain, R.A. et al. Effects of 25 pharmaceutical compounds to Lemna gibba using aseven-day static renewal test. Environ. Toxicol. Chem. 23, 371–382 (2004).
18. Wang, W. (ed.) Higher Plants (Common Duckweed, Lettuce, and Rice) for EffluentToxicity Assessment (American Society for Testing and Materials, Philadelphia,1991).
19. Porra, R.J., Thompson, W.A. & Kriedemann, P.E. Determination of accurateextinction coefficients and simultaneous equations for assaying chlorophylls aand b extracted with four different solvents: verification of the concentration ofchlorophyll standards by atomic absorption spectroscopy. Biochim. Biophys. Acta975, 384–394 (1989).
20. Rowan, K.S. Photosynthetic Pigments of Algae (Cambridge University Press,Cambridge, 1989).
21. Ritchie, R.J. Consistent sets of spectrophotometric chlorophyll equations foracetone, methanol and ethanol solvents. Photosynth. Res. 89, 27–41 (2006).
22. Brain, R.A., Hanson, M.L., Solomon, K.R. & Brooks, B.W. Aquatic plants exposed topharmaceuticals: effects and risks. Rev. Environ. Contam. Toxicol. (in the press).
23. Pflugmacher, S., Schwarz, S., Pachur, H.J. & Steinberg, C.E.W. Effects of tributyltinchloride (TBTCl) on detoxication enzymes in aquatic plants. Environ. Toxicol. 15,225–233 (2000).
p
uor
G g
n ih si l
bu
P eru ta
N 700 2©
nat
ure
pro
toco
ls/
moc.er
ut an.
ww
w//:ptt
h
986 | VOL.2 NO.4 | 2007 | NATURE PROTOCOLS
PROTOCOL

24. Roy, S., Lindstrom-Seppa, P., Huuskonen, S. & Hanninen, O. Responses ofbiotransformation and antioxidant enzymes in Lemna minor and Oncorhynchusmykiss exposed simultaneously to hexachlorobenzene. Chemosphere 30,1489–1498 (1995).
25. Akhtar, T.A., Lampi, M.A. & Greenberg, B.M. Identification of six differentiallyexpressed genes in response to copper exposure in the aquatic plant Lemna gibba(duckweed). Environ. Toxicol. Chem. 24, 1705–1715 (2005).
26. Babu, S.T. et al. Similar stress responses are elicited by copper and ultravioletradiation in the aquatic plant Lemna gibba: implication of reactive oxygen speciesas common signals. Plant Cell Physiol. 44, 1320–1329 (2003).
27. Xie, F. et al. Assessment of the toxicity of mixtures of copper, 9,10-phenanthrenequinone, and phenanthrene to Daphnia magna: evidencefor a reactive oxygen mechanism. Environ. Toxicol. Chem. 25, 613–622(2006).
28. Byl, T.D. & Klaine, S.J. in Plants for Toxicity Assessment: Second Volume, ASTM STP1115 (eds. Gorsuch, J.W., Lower, W.R., Wang, W. & Lewis, M.A.) 101–106(Amercian Society for Testing and Materials, Philadelphia, 1991).
29. Lytle, J.S. & Lytle, T.F. Use of plants for toxicity assessment of estuarineecosystems. Environ. Toxicol. Chem. 20, 68–83 (2001).
30. Marwood, C.A., Solomon, K.R. & Greenberg, B.M. Chlorophyll fluorescence as abioindicator of effects on growth in aquatic macrophytes from mixtures ofpolycyclic aromatic hydrocarbons. Environ. Toxicol. Chem. 20, 890–898 (2001).
31. Wilson, K.E., Thompson, J.E., Huner, N.P.A. & Greenberg, B.M. Effects ofultraviolet-A exposure on ultraviolet-B-induced accumulation of specificflavonoids in Brassica napus. Photochem. Photobiol. 73, 678–684 (2001).
32. Ferrat, L., Pergent-Martini, C. & Romeo, M. Assessment of the use of biomarkers inaquatic plants for the evaluation of environmental quality: application toseagrasses. Aquatic Toxicol. 65, 187–204 (2003).
33. Lewis, S., May, S., Donkin, M.E. & Depledge, M.H. The influence of copper andheatshock on the physiology and cellular stress response of Enteromorphaintestinalis. Environ. Res. 46, 421–424 (1998).
34. Lewis, S., Donkin, M.E. & Depledge, M.H. Hsp70 expression in Enteromorphaintestinalis (Chlorophyta) exposed to environmental stressors. Aquatic Toxicol.51, 277–291 (2001).
35. Brain, R.A. et al. Herbicidal effects of statin pharmaceuticals in Lemna gibba.Environ. Sci. Technol. 40, 5116–5123 (2006).
36. Kushwaha, S. & Bhowmik, P.C. Inhibition of pigment biosynthesis in cucumbercotyledons by isoxaflutole. Photosynthetica (Prague) 37, 553–558 (1999).
37. Stephenson, G.L., Koper, N., Atkinson, G.F., Solomon, K.R. & Scroggins, R.P. Useof nonlinear regression techniques for describing concentration–responserelationships of plant species exposed to contaminated site soils. Environ. Toxicol.Chem. 19, 2968–2981 (2000).
38. Hanson, M.L., Sanderson, H. & Solomon, K.R. Variation, replication and poweranalysis of Myriophyllum spp. microcosm toxicity data. Environ. Toxicol. Chem. 22,1318–1329 (2003).
39. Hanson, M.L. & Solomon, K.R. Haloacetic acids in the aquatic environment. Part I:macrophyte toxicity. Environ. Pollut. 130, 371–383 (2004).
40. Kraufvelin, P. Model ecosystem replicability challenged by the ‘‘soft’’: reality of ahard bottom mesocosm. J. Exp. Marine Biol. Ecol. 222, 247–267 (1998).
41. Sokal, R.R. & Rohlf, F.J. Biometry. 3rd edn. (W.H. Freeman and Company,New York, 1995).
42. Warren-Hicks, W.J. & Parkhurst, B.R. Performance characteristics of effluenttoxicity tests: variability and its implications for regulatory policy. Environ.Toxicol. Chem. 11, 793–804 (1992).
43. Brain, R.A. et al. Aquatic microcosm assessment of the effects of tylosin on Lemnagibba and Myriophyllum spicatum. Environ. Pollut. 133, 389–401 (2005).
44. Sanderson, H. & Petersen, S. Power analysis as a reflexive scientific tool forinterpretation and implementation of the precautionary principal in the EuropeanUnion. Environ. Sci. Pollut. Res. 8 Commentary ( 2001).
45. Christman, E.W. et al. in Aquatic Mesocosm Studies in Ecological Risk Assessment(eds. Graney, R.L., Kennedy, J.H. & Rodgers, J.H. Jr) 105–129 (CRC Press Inc.,Lewis Publishers, Boca Raton, FL, 1994).
p
uor
G g
n ih si l
bu
P eru ta
N 700 2©
nat
ure
pro
toco
ls/
moc.er
ut an.
ww
w//:ptt
h
NATURE PROTOCOLS | VOL.2 NO.4 | 2007 | 987
PROTOCOL