Embed Size (px)
Citation preview
1
A Proven Approach to Stress Testing Consumer Loan Portfolios
© Interthinx, Inc. 2013. All rights reserved. Interthinx is a registered trademark of Verisk
Analytics. No part of this publication may be reproduced, stored in a retrieval system or
transmitted, in any form or by any means, electronic, mechanical, photocopying, recording
or otherwise, without prior written permission. The information contained within should not
be construed as a recommendation by Interthinx, Inc. or Verisk Analytics for any course of
action regarding financial, legal or accounting matters.
2©2013. All rights reserved. Interthinx is a registered trademark of Interthinx, Inc., Interthinx is a Verisk Analytics company. Other products or company names are or may be trademarks or registered trademarks and are the property of their respective holders.
interthinx.com 800.333.4510 [email protected]
A Proven Approach to Stress Testing Consumer Loan PortfoliosPredictiveAnalytics
Portfolio Stress Testing in the United States
Portfolio stress testing is receiving unprecedented attention in the US.
In February 2009, federal banking agencies created a stress test using
two economic scenarios — one based on a consensus forecast by pro-
fessionals; the other based on severe but plausible economic conditions
for macro variables such as GDP, unemployment and home prices.
WHY DO A STRESS TEST?
The purpose of the stress test was to assess the amount of capital required
for large financial institutions to remain viable within the adverse scenario.
Under the Federal Reserve Supervisory Capital Assessment Program (SCAP),
the top 19 US bank holding companies (BHCs) were required to stress test
their portfolios and report capital adequacy. Results were made public to en-
able markets to draw their own conclusions about each BHC’s robustness. As
regulation evolves, the list of financial services companies required to submit
results from stress testing continues to grow.
WHO NEEDS A STRESS TEST?
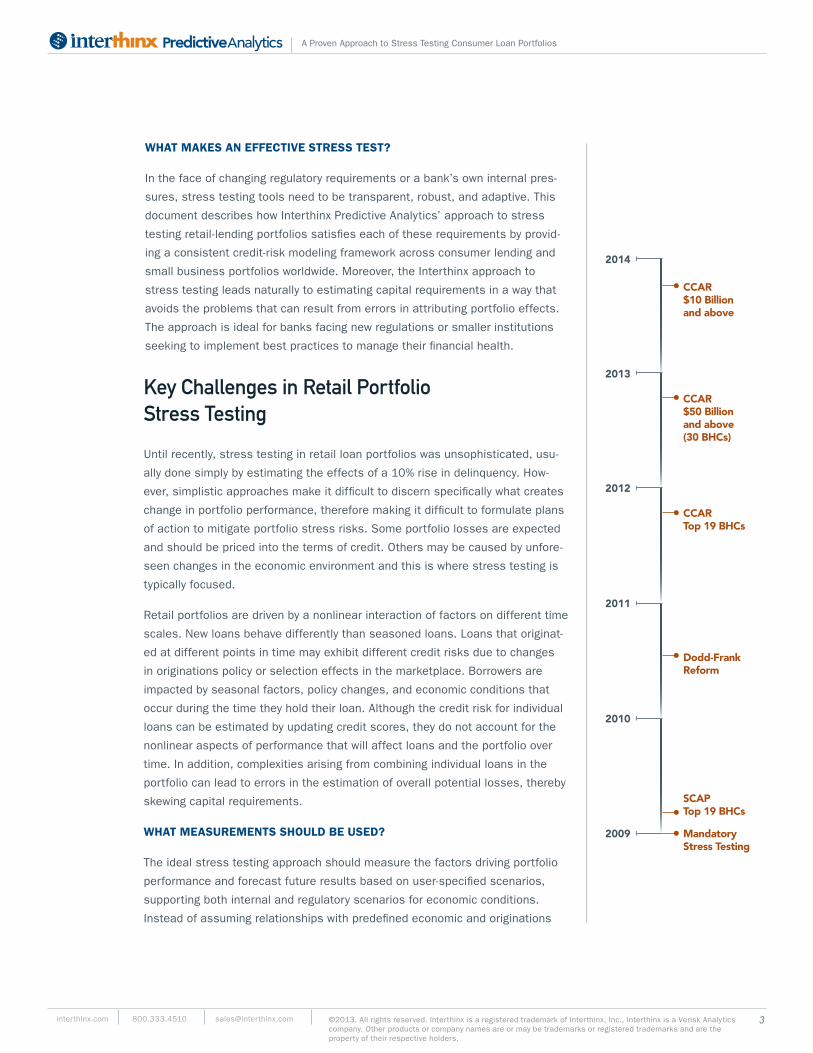
The stress testing process was formalized in the Federal Reserve’s annual
Comprehensive Capital Analysis and Review (CCAR), which made forward-
looking stress tests a requirement of regulatory capital planning under the
Dodd-Frank legislation in 2010. Regulatory guidance in 2012 indicates that
regulatory stress testing requirements will extend beyond large BHCs to include
small and mid-sized banks with assets below $10 billion. Although advanced
financial institutions have used stress testing for years to estimate a range
of possible outcomes due to uncertain events, the industry has not defined a
standard approach to stress testing. There is even a wide variation in model-
ing approaches across portfolios within banks. Many banks are accustomed to
using stress testing to estimate Value-at-Risk (VaR) in trading portfolios and in-
terest rate risks as part of asset and liability management (ALM). The nuances
of consumer lending portfolios pose challenges in developing stress tests that
focus external stress due to economic factors on the aspects of portfolio per-
formance that are driven by economic factors. From a regulatory perspective,
supervision of stress testing is relatively new and the requirements continue to
evolve based on experience. The Federal Reserve continues to develop its own
internal models, using various portfolio-specific modeling approaches across
different consumer lending products.
Regulatory guidance
in 2012 indicates that
regulatory stress
testing requirements
will extend beyond
large BHCs to include
small and mid-sized
banks with assets
below $10 billion.
3©2013. All rights reserved. Interthinx is a registered trademark of Interthinx, Inc., Interthinx is a Verisk Analytics company. Other products or company names are or may be trademarks or registered trademarks and are the property of their respective holders.
interthinx.com 800.333.4510 [email protected]
A Proven Approach to Stress Testing Consumer Loan PortfoliosPredictiveAnalytics
2014
CCAR $10 Billion and above
CCAR $50 Billion and above(30 BHCs)
CCAR Top 19 BHCs
Dodd-FrankReform
SCAPTop 19 BHCs
Mandatory Stress Testing
2013
2012
2011
2010
2009
WHAT MAKES AN EFFECTIVE STRESS TEST?
In the face of changing regulatory requirements or a bank’s own internal pres-
sures, stress testing tools need to be transparent, robust, and adaptive. This
document describes how Interthinx Predictive Analytics’ approach to stress
testing retail-lending portfolios satisfies each of these requirements by provid-
ing a consistent credit-risk modeling framework across consumer lending and
small business portfolios worldwide. Moreover, the Interthinx approach to
stress testing leads naturally to estimating capital requirements in a way that
avoids the problems that can result from errors in attributing portfolio effects.
The approach is ideal for banks facing new regulations or smaller institutions
seeking to implement best practices to manage their financial health.
Key Challenges in Retail Portfolio Stress Testing
Until recently, stress testing in retail loan portfolios was unsophisticated, usu-
ally done simply by estimating the effects of a 10% rise in delinquency. How-
ever, simplistic approaches make it difficult to discern specifically what creates
change in portfolio performance, therefore making it difficult to formulate plans
of action to mitigate portfolio stress risks. Some portfolio losses are expected
and should be priced into the terms of credit. Others may be caused by unfore-
seen changes in the economic environment and this is where stress testing is
typically focused.
Retail portfolios are driven by a nonlinear interaction of factors on different time
scales. New loans behave differently than seasoned loans. Loans that originat-
ed at different points in time may exhibit different credit risks due to changes
in originations policy or selection effects in the marketplace. Borrowers are
impacted by seasonal factors, policy changes, and economic conditions that
occur during the time they hold their loan. Although the credit risk for individual
loans can be estimated by updating credit scores, they do not account for the
nonlinear aspects of performance that will affect loans and the portfolio over
time. In addition, complexities arising from combining individual loans in the
portfolio can lead to errors in the estimation of overall potential losses, thereby
skewing capital requirements.
WHAT MEASUREMENTS SHOULD BE USED?
The ideal stress testing approach should measure the factors driving portfolio
performance and forecast future results based on user-specified scenarios,
supporting both internal and regulatory scenarios for economic conditions.
Instead of assuming relationships with predefined economic and originations

4©2013. All rights reserved. Interthinx is a registered trademark of Interthinx, Inc., Interthinx is a Verisk Analytics company. Other products or company names are or may be trademarks or registered trademarks and are the property of their respective holders.
interthinx.com 800.333.4510 [email protected]
A Proven Approach to Stress Testing Consumer Loan PortfoliosPredictiveAnalytics
factors, it should create a model for each portfolio by quantifying portfolio
dynamics along the dimensions of age, time, and originations to create signals
that can be explained with outside data such as economic factors. This would
enable models to adapt to changing conditions and changing forecast assump-
tions. This type of approach would allow the economic factors to be applied
to the models independently from originations strategies as well as seasonal
and policy-driven factors; focusing the economic forecast only on the economic
component of portfolio performance.
At a high level, portfolio drivers can be described as maturation (age-based),
exogenous (time-based), and origination quality (based on origination date).
Because each of these factors is dependent on time, quantifying each factor’s
impact can be challenging. However, measurement of the factors is essential to
focusing portfolio stress on areas outside of management’s direct control and
avoiding the double counting – or other incorrect distributions of risks – that
can arise in models that fail to control for interaction. Quantifying these factors
provides transparency into the modeling process so that managers can see why
performance changes. This transparency facilitates scenario-based forecasting
with targeted application of economic stress in a way that supports strategic
planning for risk mitigation.
This type of methodology has been proven by Interthinx Predictive Analytics
solutions to be robust across a decade of changing economic conditions. It has
spanned retail lending and small business portfolios in more than 25 countries,
providing a uniform modeling approach across products and regions.
…measurement of the
factors is essential to
focusing portfolio stress
on areas outside of man-
agement’s direct control
and avoiding the double
counting that can arise
in models that fail to
control for interaction.
5©2013. All rights reserved. Interthinx is a registered trademark of Interthinx, Inc., Interthinx is a Verisk Analytics company. Other products or company names are or may be trademarks or registered trademarks and are the property of their respective holders.
interthinx.com 800.333.4510 [email protected]
A Proven Approach to Stress Testing Consumer Loan PortfoliosPredictiveAnalytics
Interthinx Predictive Analytics methodology is the ideal way to help banks with portfolio stress testing
Of the factors driving portfolio performance, the economy is among the most dif-
ficult to quantify. Because movements in economic factors tend to be slow and
cyclical, they can be confused with changes in portfolio growth, portfolio season-
ing, and even other economic factors. Furthermore, it is difficult to reliably forecast
what the economy will look like in the future. However, with the right modeling
approach, the effects of loan seasoning, marketing plans, underwriting criteria,
policy changes and seasonal impacts are relatively straightforward to quantify and
forecast. In addition to quantifying specific factors driving performance, the separa-
tion of portfolio dynamics allows factors to freely vary in the model without creating
unreasonable conditions. In the context of stress testing, separation ensures that
economic scenarios only apply to economic performance factors.
THE INTERTHINX PREDICTIVE ANALYTICS APPROACH
By separating the economic drivers of portfolio performance from other factors so
that economic stress can be focused in the right place for forecasting, there are
no assumptions about which economic variables drive the portfolio until the eco-
nomic component in portfolio performance is measured empirically over time. Other
modeling approaches may struggle with the nonlinear aspects of retail portfolio
performance over time and as a result, inadvertently stress more than economic
conditions in their forecasts. Interthinx uses a portfolio modeling approach specifi-
cally designed to isolate the components of portfolio performance.
Portfolios are characterized based on the states a loan can occupy from the time
it is opened to the time it is closed. For example, a loan may be current, delinquent,
or charged-off – with the charge-off state being a terminal state that closes the
loan. The movement between states is measured by rates of change over time. Roll
rates and probability of default are two common ways of describing the rate
of change in loan states over time.
MEASURING PORTFOLIO FACTORS
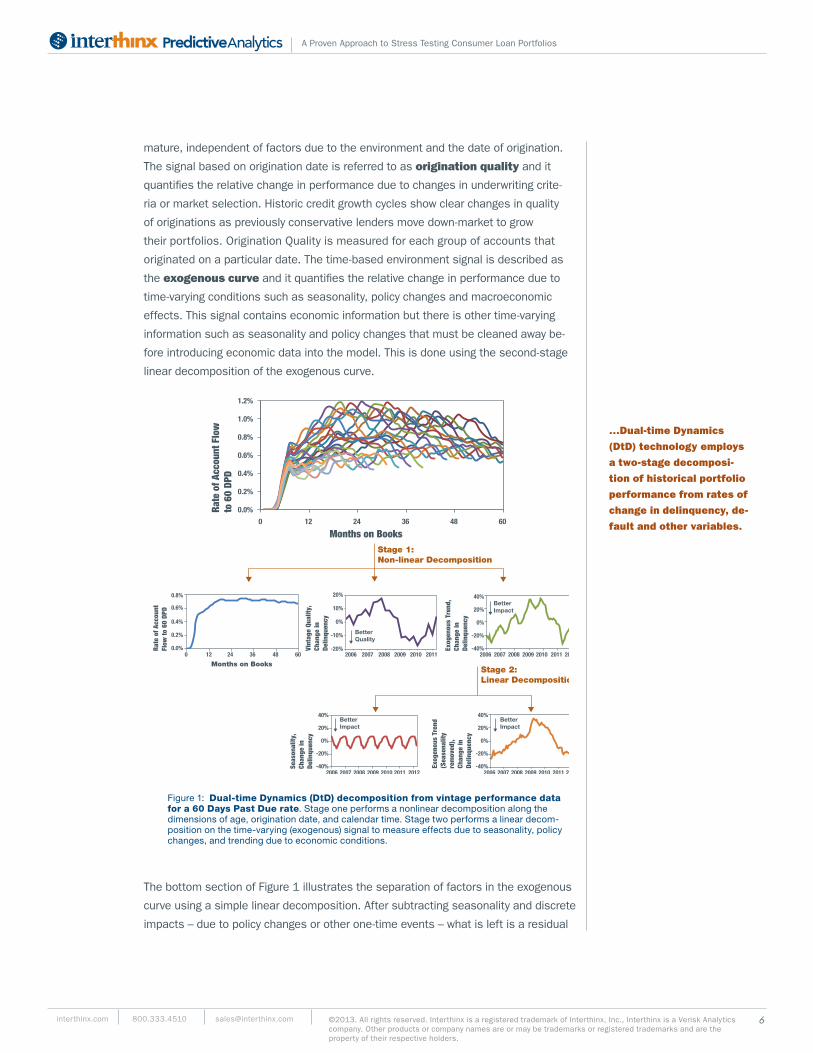
Using its patented Dual-time Dynamics (DtD) technology, Interthinx Predictive
Analytics employs a two-stage decomposition of historical portfolio performance
from rates of change in delinquency, default and other variables. The first stage,
illustrated in the top section of Figure 1 is a nonlinear decomposition along the
aforementioned dimensions of age, origination date and calendar time. Each of
these three measures is independent of the other. The age-based signal is referred
to as maturation or lifecycle. It quantifies the natural performance of loans as they
Interthinx uses a port-
folio modeling approach
specifically designed to
isolate the components
of portfolio performance.
6©2013. All rights reserved. Interthinx is a registered trademark of Interthinx, Inc., Interthinx is a Verisk Analytics company. Other products or company names are or may be trademarks or registered trademarks and are the property of their respective holders.
interthinx.com 800.333.4510 [email protected]
A Proven Approach to Stress Testing Consumer Loan PortfoliosPredictiveAnalytics
mature, independent of factors due to the environment and the date of origination.
The signal based on origination date is referred to as origination quality and it
quantifies the relative change in performance due to changes in underwriting crite-
ria or market selection. Historic credit growth cycles show clear changes in quality
of originations as previously conservative lenders move down-market to grow
their portfolios. Origination Quality is measured for each group of accounts that
originated on a particular date. The time-based environment signal is described as
the exogenous curve and it quantifies the relative change in performance due to
time-varying conditions such as seasonality, policy changes and macroeconomic
effects. This signal contains economic information but there is other time-varying
information such as seasonality and policy changes that must be cleaned away be-
fore introducing economic data into the model. This is done using the second-stage
linear decomposition of the exogenous curve.
Figure 1: Dual-time Dynamics (DtD) decomposition from vintage performance data for a 60 Days Past Due rate. Stage one performs a nonlinear decomposition along the dimensions of age, origination date, and calendar time. Stage two performs a linear decom-position on the time-varying (exogenous) signal to measure effects due to seasonality, policy changes, and trending due to economic conditions.
The bottom section of Figure 1 illustrates the separation of factors in the exogenous
curve using a simple linear decomposition. After subtracting seasonality and discrete
impacts – due to policy changes or other one-time events – what is left is a residual
0.0%
0.2%
0.4%
0.6%
0.8%
1.0%
1.2%
0 12 24 36 48 60
Rate
of A
ccou
nt F
low
to
60
DPD
Months on BooksStage 1: Non-linear Decomposition
Stage 2: Linear Decomposition
0.0%
0.2%
0.4%
0.6%
0.8%
120 24 36 48 60
Rate
of A
ccou
nt
Flow
to 6
0 DP
D
Seas
onal
ity,
Chan
ge in
De
linqu
ency
Exog
enou
s Tr
end
(Sea
sona
lity
rem
oved
),Ch
ange
in
Delin
quen
cy
Months on Books
-20%
-10%
0%
10%
20%
2006
BetterQuality
BetterImpact
2007 2008 2009 2010 2011
Vint
age
Qual
ity,
Chan
ge in
De
linqu
ency
-40%
-20%
0%
20%
40%
2006 2007 2008 2009 2010 2011 2012
2006 2007 2008 2009 2010 2011 2012 2006 2007 2008 2009 2010 2011 2012
Exog
enou
s Tr
end,
Chan
ge in
De
linqu
ency
-40%
-20%
0%
20%
40%
-40%
-20%
0%
20%
40%BetterImpact
BetterImpact
…Dual-time Dynamics
(DtD) technology employs
a two-stage decomposi-
tion of historical portfolio
performance from rates of
change in delinquency, de-
fault and other variables.
7©2013. All rights reserved. Interthinx is a registered trademark of Interthinx, Inc., Interthinx is a Verisk Analytics company. Other products or company names are or may be trademarks or registered trademarks and are the property of their respective holders.
interthinx.com 800.333.4510 [email protected]
A Proven Approach to Stress Testing Consumer Loan PortfoliosPredictiveAnalytics
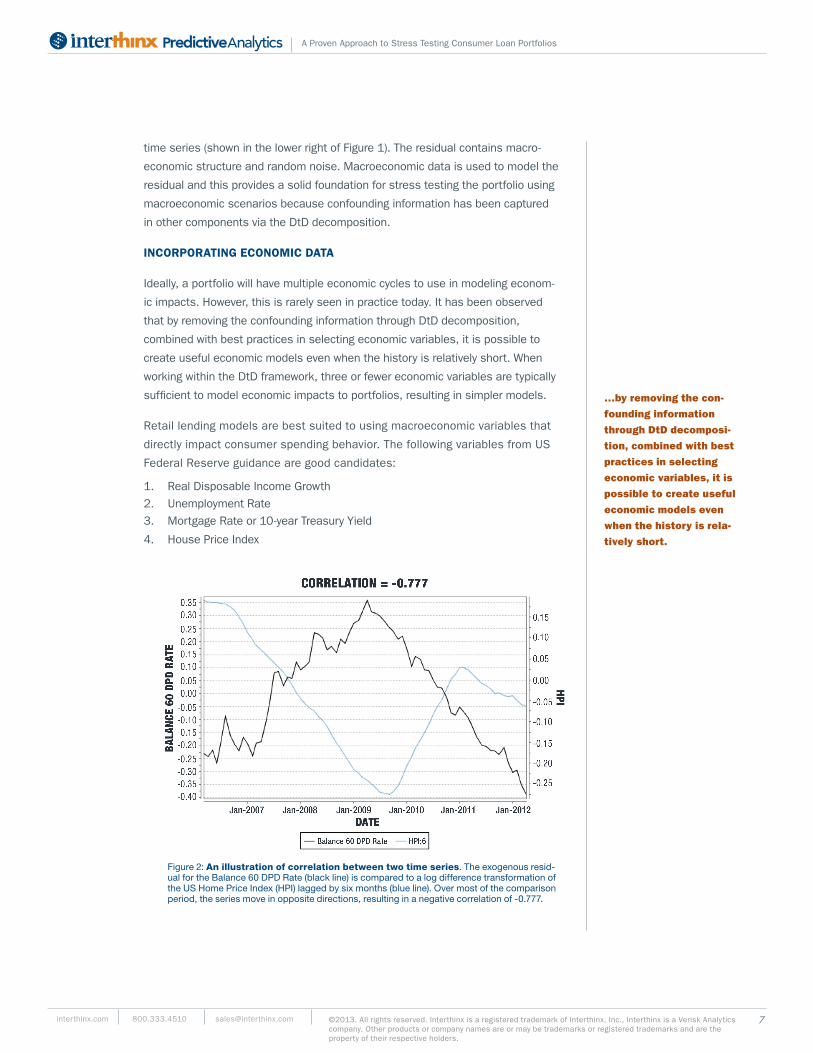
Figure 2: An illustration of correlation between two time series. The exogenous resid-ual for the Balance 60 DPD Rate (black line) is compared to a log difference transformation of the US Home Price Index (HPI) lagged by six months (blue line). Over most of the comparison period, the series move in opposite directions, resulting in a negative correlation of -0.777.
time series (shown in the lower right of Figure 1). The residual contains macro-
economic structure and random noise. Macroeconomic data is used to model the
residual and this provides a solid foundation for stress testing the portfolio using
macroeconomic scenarios because confounding information has been captured
in other components via the DtD decomposition.
INCORPORATING ECONOMIC DATA
Ideally, a portfolio will have multiple economic cycles to use in modeling econom-
ic impacts. However, this is rarely seen in practice today. It has been observed
that by removing the confounding information through DtD decomposition,
combined with best practices in selecting economic variables, it is possible to
create useful economic models even when the history is relatively short. When
working within the DtD framework, three or fewer economic variables are typically
sufficient to model economic impacts to portfolios, resulting in simpler models.
Retail lending models are best suited to using macroeconomic variables that
directly impact consumer spending behavior. The following variables from US
Federal Reserve guidance are good candidates:
1. Real Disposable Income Growth2. Unemployment Rate3. Mortgage Rate or 10-year Treasury Yield
4. House Price Index
…by removing the con-
founding information
through DtD decomposi-
tion, combined with best
practices in selecting
economic variables, it is
possible to create useful
economic models even
when the history is rela-
tively short.
8©2013. All rights reserved. Interthinx is a registered trademark of Interthinx, Inc., Interthinx is a Verisk Analytics company. Other products or company names are or may be trademarks or registered trademarks and are the property of their respective holders.
interthinx.com 800.333.4510 [email protected]
A Proven Approach to Stress Testing Consumer Loan PortfoliosPredictiveAnalytics
Once a suitable correlation is identified, a simple regression model can be used
to calibrate changes in the exogenous residual to changes in the economic series.
Multiple economic series can be used to model a single exogenous residual using
multivariate regression or ensemble univariate models.
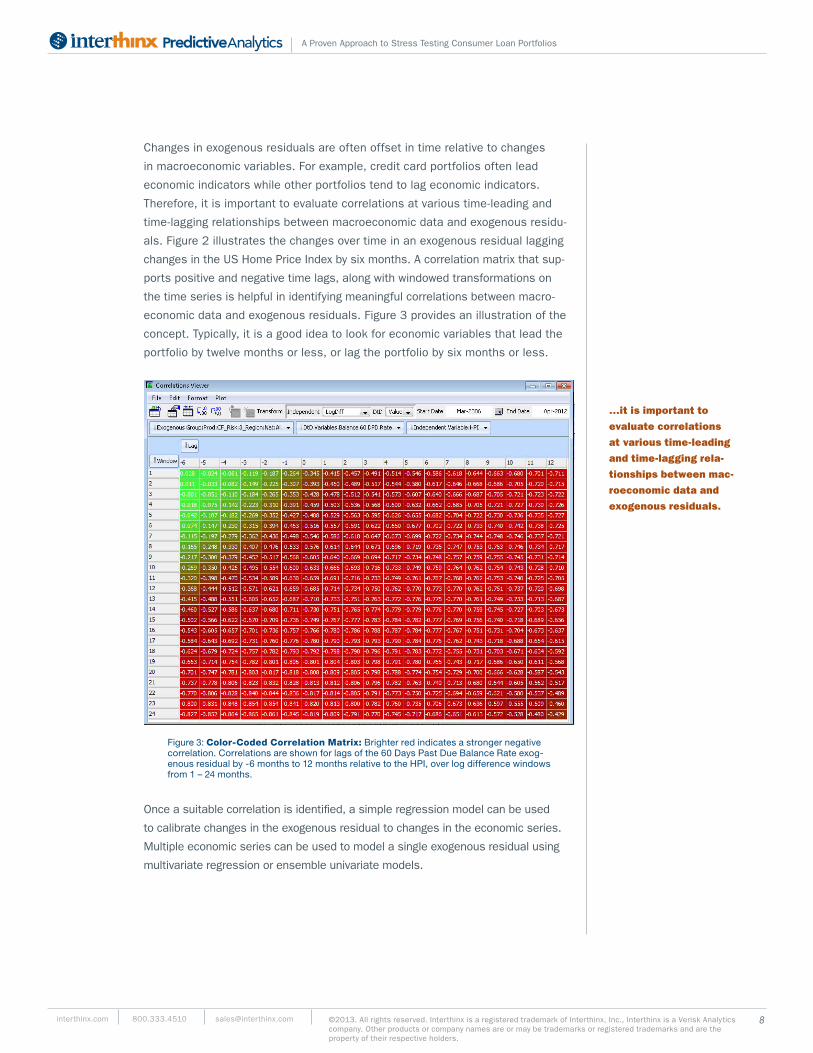
Changes in exogenous residuals are often offset in time relative to changes
in macroeconomic variables. For example, credit card portfolios often lead
economic indicators while other portfolios tend to lag economic indicators.
Therefore, it is important to evaluate correlations at various time-leading and
time-lagging relationships between macroeconomic data and exogenous residu-
als. Figure 2 illustrates the changes over time in an exogenous residual lagging
changes in the US Home Price Index by six months. A correlation matrix that sup-
ports positive and negative time lags, along with windowed transformations on
the time series is helpful in identifying meaningful correlations between macro-
economic data and exogenous residuals. Figure 3 provides an illustration of the
concept. Typically, it is a good idea to look for economic variables that lead the
portfolio by twelve months or less, or lag the portfolio by six months or less.
Figure 3: Color-Coded Correlation Matrix: Brighter red indicates a stronger negative correlation. Correlations are shown for lags of the 60 Days Past Due Balance Rate exog-enous residual by -6 months to 12 months relative to the HPI, over log difference windows from 1 – 24 months.
…it is important to
evaluate correlations
at various time-leading
and time-lagging rela-
tionships between mac-
roeconomic data and
exogenous residuals.
9©2013. All rights reserved. Interthinx is a registered trademark of Interthinx, Inc., Interthinx is a Verisk Analytics company. Other products or company names are or may be trademarks or registered trademarks and are the property of their respective holders.
interthinx.com 800.333.4510 [email protected]
A Proven Approach to Stress Testing Consumer Loan PortfoliosPredictiveAnalytics
CREATING A PORTFOLIO FORECAST
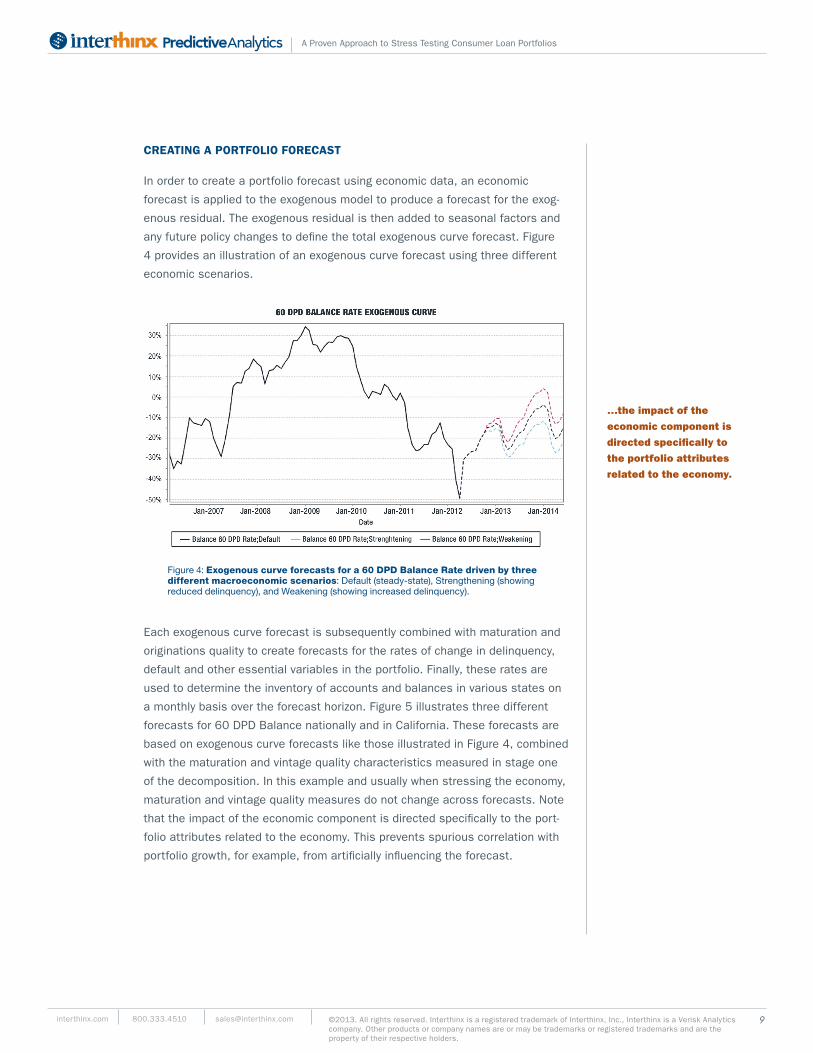
In order to create a portfolio forecast using economic data, an economic
forecast is applied to the exogenous model to produce a forecast for the exog-
enous residual. The exogenous residual is then added to seasonal factors and
any future policy changes to define the total exogenous curve forecast. Figure
4 provides an illustration of an exogenous curve forecast using three different
economic scenarios.
Figure 4: Exogenous curve forecasts for a 60 DPD Balance Rate driven by three different macroeconomic scenarios: Default (steady-state), Strengthening (showing reduced delinquency), and Weakening (showing increased delinquency).
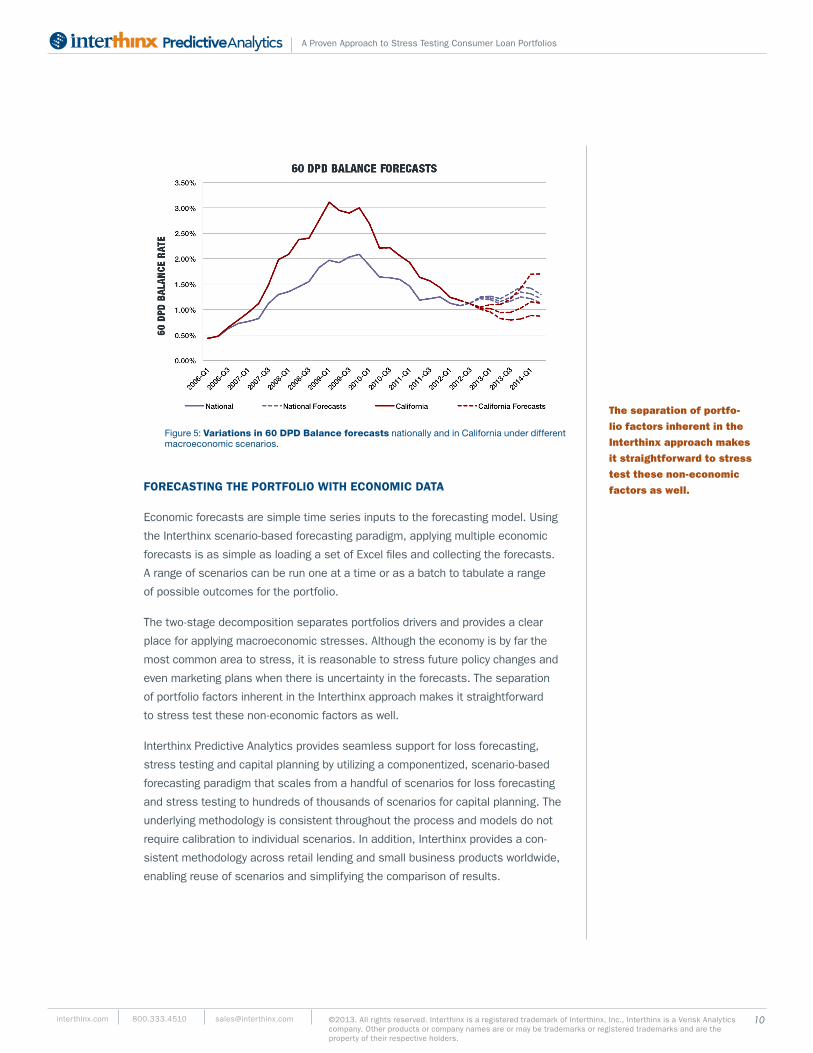
Each exogenous curve forecast is subsequently combined with maturation and
originations quality to create forecasts for the rates of change in delinquency,
default and other essential variables in the portfolio. Finally, these rates are
used to determine the inventory of accounts and balances in various states on
a monthly basis over the forecast horizon. Figure 5 illustrates three different
forecasts for 60 DPD Balance nationally and in California. These forecasts are
based on exogenous curve forecasts like those illustrated in Figure 4, combined
with the maturation and vintage quality characteristics measured in stage one
of the decomposition. In this example and usually when stressing the economy,
maturation and vintage quality measures do not change across forecasts. Note
that the impact of the economic component is directed specifically to the port-
folio attributes related to the economy. This prevents spurious correlation with
portfolio growth, for example, from artificially influencing the forecast.
…the impact of the
economic component is
directed specifically to
the portfolio attributes
related to the economy.
10©2013. All rights reserved. Interthinx is a registered trademark of Interthinx, Inc., Interthinx is a Verisk Analytics company. Other products or company names are or may be trademarks or registered trademarks and are the property of their respective holders.
interthinx.com 800.333.4510 [email protected]
A Proven Approach to Stress Testing Consumer Loan PortfoliosPredictiveAnalytics
FORECASTING THE PORTFOLIO WITH ECONOMIC DATA
Economic forecasts are simple time series inputs to the forecasting model. Using
the Interthinx scenario-based forecasting paradigm, applying multiple economic
forecasts is as simple as loading a set of Excel files and collecting the forecasts.
A range of scenarios can be run one at a time or as a batch to tabulate a range
of possible outcomes for the portfolio.
The two-stage decomposition separates portfolios drivers and provides a clear
place for applying macroeconomic stresses. Although the economy is by far the
most common area to stress, it is reasonable to stress future policy changes and
even marketing plans when there is uncertainty in the forecasts. The separation
of portfolio factors inherent in the Interthinx approach makes it straightforward
to stress test these non-economic factors as well.
Interthinx Predictive Analytics provides seamless support for loss forecasting,
stress testing and capital planning by utilizing a componentized, scenario-based
forecasting paradigm that scales from a handful of scenarios for loss forecasting
and stress testing to hundreds of thousands of scenarios for capital planning. The
underlying methodology is consistent throughout the process and models do not
require calibration to individual scenarios. In addition, Interthinx provides a con-
sistent methodology across retail lending and small business products worldwide,
enabling reuse of scenarios and simplifying the comparison of results.
Figure 5: Variations in 60 DPD Balance forecasts nationally and in California under different macroeconomic scenarios.
The separation of portfo-
lio factors inherent in the
Interthinx approach makes
it straightforward to stress
test these non-economic
factors as well.
11©2013. All rights reserved. Interthinx is a registered trademark of Interthinx, Inc., Interthinx is a Verisk Analytics company. Other products or company names are or may be trademarks or registered trademarks and are the property of their respective holders.
interthinx.com 800.333.4510 [email protected]
A Proven Approach to Stress Testing Consumer Loan PortfoliosPredictiveAnalytics
CONCLUSION
Stress testing requires careful application of portfolio stressors to provide mean-
ingful results. Practitioners and their managers should be mindful of the following
three points when using stress testing models:
1. Understand the structure used by models to represent portfolios. Models
have strengths and weaknesses that determine their fitness for different
applications.
2. Stress forecasts by targeting the stress to the correct model components.
Economic stress should be applied to economic components, for example.
3. Creating a range of forecasts by varying explicit assumptions provides a basis
for taking action in managing the portfolio.
To discuss how Interthinx Predictive Analytics solutions can help with your portfolio
stress testing, email [email protected] or call 800-333-4510.