Embed Size (px)
Citation preview

Acta Poloniae Pharmaceutica ñ Drug Research, Vol. 74 No. 1 pp. 249ñ266, 2017 ISSN 0001-6837Polish Pharmaceutical Society
Hoar and Schulman introduced the idea ofmicroemulsion during 1940s. It is defined as a sys-tem consisting of oil, water and Smix (surfactant andco-surfactant). It is transparent, thermodynamicallystable and optically isotropic liquid microdispersion(1). It increases the drug solubility and therapeuticefficacy for transdermal delivery as compared toconventional formulations (2). It is a promising vehi-cle for both dermal and transdermal application ofdrugs. There were several mechanisms suggested toexplore the significance of microemulsions for der-mal and transdermal delivery of drugs (3). First,there is an incorporation of large amounts of druginto the microemulsion, which then increases the
thermodynamics activity towards the skin. Second,there is partitioning into the skin due to the increasedthermodynamic activity of the drug. Third, there is areduction in diffusion barrier of stratum corneum andenhancement of permeation rate through the skin dueto components of microemulsion, which act as per-meation enhancers (4).
Viscosity can be increased by incorporatingmicroemulsion into the gel base of carbomer 940,which acts as a thickening agent. This MEBG has anideal viscosity and good adherences with the skinfor potential sustained action (5).
BBD (Response Surface Methodology) isemployed to optimize independent variables for esti-
A QUALITY BY DESIGN APPROACH: FABRICATION, CHARACTERIZATIONAND EVALUATION OF OPTIMIZED TRANSDERMAL THERAPEUTIC
SYSTEM FOR ANTIRHEUMATIC LORNOXICAM
MUHAMMAD NAEEM1*, FAHAD PERVAIZ1, ZARQA NAWAZ2, MUHAMMAD YOUSUF3, ATIF ALI4, NAYAB KHALID1 and JAWAD AHMAD KHAN1
1 Department of Pharmacy, Faculty of Pharmacy & Alternative Medicine, The Islamia University of Bahawalpur, Pakistan
2 Department of Chemistry, The Islamia University of Bahawalpur, Bahawalpur Pakistan3 Department of Pharmacy, Peoples University of Medical & Health Sciences for Women,
Nawabshah, Pakistan4 Department of Pharmacy, COMSATS Institute of Information Technology, Abbottabad, 2260 ñ Pakistan
Abstract: Microemulsion was prepared using several concentrations of selected oil (pine oil), surfactant (cre-mophor RH40), co-surfactant (isopropanol) and water to improve bioavailability by increasing solubility andpermeability of lornoxicam, which was then incorporated to carbomer 940 gel base to fabricate microemulsionbased gel (MEBG) to sustained permeability for transdermal delivery. Initially, the formulations were investi-gated for physicochemical characteristics, i.e., pH, conductivity, viscosity, refractive index, zeta size, poly-dis-persity index and Atomic Force Microscopy. Also, the significance of the components on in vitro permeabilitywas observed to find out optimum microemulsion (ME1) using Box-Behnken-Design (BBD). MEBG was com-pared for in vitro permeation, stability, skin irritation and anti-inflammatory studies using control gel and in vivobioavailability study with oral tablet. Microemulsions exhibited the physiological pH (5.35-5.99), oil in waternature (139ñ185 µsiemens/cm), isotropic (1.3390-1.4166), narrow size (62 nm), homogeneity, Newtonian flow(52-160 centipoise) and spherical shape. Predicted values (Q24, flux, lag time) of optimized microemulsionsderived from BBD were in reasonable agreement with experimental values. The formulations were stable andnon-irritating to the skin. Significant difference was investigated when comparing percent inhibition of edemaof MEBG (80%) and control gel (40%) with respect to standard. The MEBG behavior differed significantlyfrom oral tablet formulation in vivo bioavailability. Such BBD based estimation will reduce time and cost indrug designing, delivery and targeting.
Keywords: pine oil, cremophor RH 40, isopropanol, carbomer 940, solubility, permeability, anti-inflammato-ry, bioavailability, targeting
249
* Corresponding author: e-mail: [email protected]; phone: 0923336113804
250 MUHAMMAD NAEEM et al.
mating dependent variables for creation of polyno-mial equations using 1st, 2nd and quadratic models(6). It requires minimum experimentation and timethan required for developing conventional dosageforms. It has dependent (Q24, flux and lag time) andindependent (oil, Smix and water) variables.
Lornoxicam (chloro-tenoxicam, oxicam class)(6-chloro-4-hydroxy-2-methyl-N-2-pyridyl-5H-thieno-(2,3-e)-(1,2)-thiazine-2-carboxamide-1,1-dioxide) is a non-steroidal anti-inflammatory drug.
It decreases prostaglandin synthesis by inhibit-ing cyclooxygenase. It has analgesic, anti-inflamma-tory and antipyretic effects (7). It belongs to bio-pharmaceutical classification system (BCS) II,which has low solubility and high permeability. Ithas the property of low solubility in acidic mediathat results in local toxicity in the stomach.Hemorrhage and gastric mucosal ulceration restrainits oral use and presents it as a good candidate fortransdermal delivery (8, 9). So, lornoxicam is foundto be a suitable drug for transdermal delivery. Butthere is a great challenge and limitations to formu-late it in the transdermal dosage form because ofexcellent barrier function of the skin. This challengecan be solved using microemulsion as a successfulvehicle, which potentially increases solubility ofdrug and skin permeation. BCS II is a suitable classof drugs to be formulated as a microemulsion toincrease solubility and, in turn, enhance permeabili-ty. Oil in water (o/w) and water-in-oil (w/o)microemulsion is used for delivery of lipophilic andhydrophilic drugs, respectively (10).
In the present study a new oil/water MEBG hasbeen fabricated successfully for transdermal deliv-ery of lornoxicam to improve bioavailability byovercoming the problems of solubility, oral gastrictoxicity, and permeability. BBD was used to opti-mize independent variables for estimating depend-ent variables. The formulations were characterizedfor pH, viscosity, conductivity, refractive index, sta-bility, skin irritation, anti-inflammatory, atomicforce microscopy (AFM), zeta potential and size.Further, optimized formulations were compared forin vitro permeation and in vivo bioavailability stud-ies with control.
EXPERIMENTAL
Materials
Lornoxicam was gifted from Hilton, Pakistan.Cremophor RH40, pine oil, sesame oil, soybean oil,sunflower oil, oleic acid, peanut oil, isopropylmyristate, pine oil, almond oil, olive oil, eucalyptusoil, nutmeg oil, coconut oil, Tween 20, Tween 80,
isopropanol, ethanol, propylene glycol were pur-chased from Merck, Germany.
Screening of components for microemulsions
Screening of components for microemulsionwas carried out by the addition of 100 mg oflornoxicam into 6 mL of individual oils, surfactants,co-surfactants and water, separately. Solubility ofdrug in phosphate buffer solution (PBS) pH 7.4 wasalso investigated. Hot plate magnetic stirrer (VELPScientifica, Italy) was used to agitate the mixture for72 h at ambient temperature. Then, centrifugation(Centrifuge Machine, Helttich, Germany) was car-ried out for each mixture at 12000 revolution perminute (rpm) for 12 min and filtered using celluloseacetate membrane filter (Sartorius, Germany) of0.45 µm to obtain supernatant. The amount oflornoxicam solubilized was measured at 374 nmwith UV spectrophotometer (IRMECO GmbH,Germany).
The concentration of lornoxicam was evaluat-ed from calibration curve modeled using linearregression equation (R2 = 0.999).
y = 0.048x + 0.040 (1)where y is absorbance, x is concentration, 0.048 is aslope and 0.040 is an intercept.
Construction of phase diagram for microemul-
sions
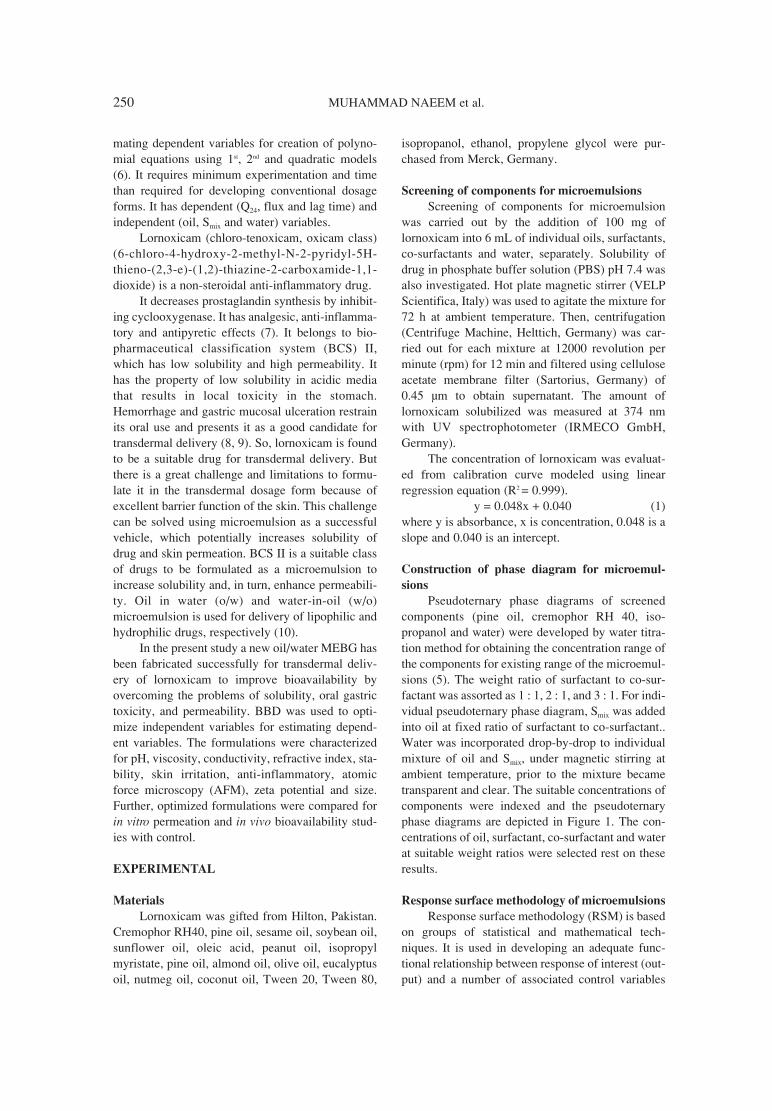
Pseudoternary phase diagrams of screenedcomponents (pine oil, cremophor RH 40, iso-propanol and water) were developed by water titra-tion method for obtaining the concentration range ofthe components for existing range of the microemul-sions (5). The weight ratio of surfactant to co-sur-factant was assorted as 1 : 1, 2 : 1, and 3 : 1. For indi-vidual pseudoternary phase diagram, Smix was addedinto oil at fixed ratio of surfactant to co-surfactant..Water was incorporated drop-by-drop to individualmixture of oil and Smix, under magnetic stirring atambient temperature, prior to the mixture becametransparent and clear. The suitable concentrations ofcomponents were indexed and the pseudoternaryphase diagrams are depicted in Figure 1. The con-centrations of oil, surfactant, co-surfactant and waterat suitable weight ratios were selected rest on theseresults.
Response surface methodology of microemulsions
Response surface methodology (RSM) is basedon groups of statistical and mathematical tech-niques. It is used in developing an adequate func-tional relationship between response of interest (out-put) and a number of associated control variables

A quality by design approach: Fabrication, characterization and... 251
(input). RSM has 1st and 2nd degree two models.The 1st order designs are 2k factorial (k is the num-ber of control variables), Placket Burman and sim-ple design. 3k factorial central composite and BBDare most commonly used 2nd order designs (6).
Box Behnken design of microemulsions
Box and Behnken developed BBD, which isemployed in industrial research. Concentrations ofindependent variables were used at low (-1) andhigh (+1) levels to optimize oil (X1), Smix (X2) andwater (X3) and generate 17 possible runs to preparemicroemulsions. The three dependent variableswere Q24 (Y1), flux (Y2) and lag time (Y3) (11).
Preparation of microemulsions and PBS of
lornoxicam
There was the preparation of microemulsionsof all 17 possible runs with a procedure as follows:Smix was prepared using cremophor RH40 as surfac-tant and isopropanol as co-surfactant. Then, pine oilwas added to Smix mixture. Lornoxicam was dis-solved at a concentration of 0.250% to above oilmixture under ultrasonication (Elma, Germany).Water was added dropwise to oil mixture with mod-erate magnetic stirring at ambient temperature forfabricating oil in water microemulsion.
Control was prepared as follows: In the firststep, PBS, pH 7.4 was prepared by mixing 0.2 Mpotassium dihydrogen phosphate and 0.2 M sodi-um hydroxide solutions. In the second step,lornoxicam was added to prepare lornoxicamloaded PBS under moderate magnetic stirring atambient temperature.
Preparation of MEBG and control gel of lornoxi-
cam
Carbomer 940 was added into the distilledwater at concentrations of 0.50, 0.75 and 1.00% sep-arately to fabricate gel bases. Then, the dispersionwas kept for 24 h so that the polymer swelled intogel network. Triethylamine was added dropwise intoit till a semisolid gel-like consistency was obtained.The pH at gel consistency stage was within 6-8.Afterwards, the optimized microemulsion ME1 oflornoxicam was slowly added into the 0.75% gelbase of carbomer 940 under magnetic stirring. (5).Control gel was also prepared by incorporating PBSof lornoxicam into 0.75% gel base.
Characterization
pH measurement was carried out by pH meter(WTW inoLab, Germany). Viscosities of micro-emulsions were determined by Brookfield RVDVIII ultra, Programmable Rheometer (BrookfieldEngineering Laboratories, Middleboro, MA) at25OC. Conductivities (σ) were determined byConductometer WTW Cond 197i Weilheim,Germany) at 25OC. Refractive index was measuredwith Bellingham and Stanley RFM 330 plus refrac-tometer. The droplet size and polydispersity indexof optimized ME1 formulation was analyzed usingdynamic light scattering method employing a Zetasizer (Malvern Nano-ZS, UK). Shape and surfacemorphology of microemulsions was examined byatomic force microscopy (AFM, XE-100, PSIA,Korea). The analysis was performed in triplicate.
Permeation study
Preparation of skinThe approval of this study was given by the
Advanced Study and Research Board (ASARB),The Islamia University of Bahawalpur, Pakistan. Amale rabbit weighing approximately 2.5 kg wasused to take skin for permeation studies. Hairs werecarefully trimmed with an electric clipper from thedorsal region of the rabbit. The rabbit was sacrificedand skin was isolated at dorsal region. Heat separa-tion technique (11) was used to prepare epidermis.Skin was soaked in PBS, pH 7.4 at 60OC for 45 s toremove adhered tissue. Then, the skin was washed
Figure 1. Pseudoternary phase diagrams of microemulsions usingSmix at weight ratio a) 3 : 1, b) 2 : 1 and c) 1 : 1

252 MUHAMMAD NAEEM et al.
with water, excised in surface area of 1.767 cm2 andused for in vitro permeation studies.
In vitro permeation study microemulsions
The transport of drug across skin is challengingand critical process in the field of transdermal anddermal drug delivery. Franz diffusion cell(PermeGear, USA) has surface area of 1.767 cm2. Itconsists of donor and receiver compartments (5).Excised skin was tightly clamped between two com-partments with stratum corneum facing upper side ofdonor compartment. Donor compartment was filledwith 4 g ME (8 mg lornoxicam) and covered withaluminum foil to prevent evaporation. Receivercompartment (12 mL volume capacity) was filledwith PBS pH 7.4 and 5% propylene glycol (PG) tomaintain sink conditions. It was degassed to preventany bubble formation. It also contained Teflon coat-ed magnetic stirrer to agitate contents of receivercompartment on hot plate magnetic stirrer.Temperature of receiver compartment was main-tained at 37 ± 0.5OC using water bath and peristalticpump was used as a mechanical pump with whichpressure is created by movement of constrictionalong the tube, likewise to a biological peristalsis.Sampling was performed at predetermined timeintervals (0, 1, 2, 3, 4, 5, 6, 8, 10, 12, 14, 16, 20, and24 h) from receiver compartment. The lost quantitywas replenished with an equal quantity of PBS and5% PG. Samples were diluted and analyzed at 374nm on a UV spectrophotometer (IRMECO GmbH,Germany).
Permeation data analysis
The cumulative amount of lornoxicam perme-ated (Q24) was determined and concentration wascorrected for sampling effects according to follow-ing relation (11):
C1n = Cn (VT / VT ñ VS) (C1
n-1 / Cn-1) (2)where C1
n and Cn are the corrected and measuredconcentrations of lornoxicam in nth sample, respec-tively. C1
n-1 is the measured concentration of thelornoxicam in the (n-1)th sample, VT and VS are thevolume of the receiver fluid and sample drawn,respectively.
Permeation profile was calculated by plottinggraph between Q24 and time. Linear regressionanalysis was used as a tool to calculate steady stateflux (Jss, µg/cm2/h) of lornoxicam. The lag time wasmeasured from intercept on time axis in plotbetween Q24 (Y-axis) and time (X-axis).
Permeability coefficient (Kp) was determinedthrough dividing flux by concentration of drug inmicroemulsion. The enhancement ratio (Er) was
determined as ratio of microemulsion flux and con-trol flux (12).
Drug content in skin layers and donor compart-
ment
Drug concentration was determined for opti-mized ME1 and MEBG formulations in skin anddonor compartments. The drug was extracted anddiluted with phosphate buffer solution. Dilutionswere analyzed with UV spectrophotometer at 374nm.
Experimental design
Independent and dependent variables
Franz diffusion cell was used to perform invitro permeation study of suggested 17 runs ofmicroemulsions to calculate values of dependentvariables. BBD was used to evaluate main effects,interaction effects and quadratic effects on depend-ent variables. Design Expert software was used toconstruct 1st, 2nd and quadratic models and explorequadratic responses. This design was particularlyselected because it needs fewer runs than a centralcomposite design in case of three or four variables.This cubic design was distinguished with set ofpoints located at midpoint of each edge and centralpoint of multi-dimensional cube. Design Expertsoftware was used to generate nonlinear quadraticmodel equation and represented as: Y = b0 + b1X1 +b2X2 + b3X3 + b12X1X2 + b13X1X3 + b23X2X3 + b11X2
1
+ b22X22 + b33X2
3.
Checkpoint analysis and optimization model val-
idation of microemulsion
The SPSS software was used to statisticallyvalidate the polynomial equations using ANOVA.The model was assessed for R2, adjusted R2, predict-ed R2 and adequate precision. Feasibility and gridsearches were conducted to find out the optimumparameters. This software was also used to generatevarious 3D response surface plots. Ten optimumcheck-point formulations were used to validatepolynomial equations and experimental models overthe whole experimental region through intensivegrid search. Response properties of ten checkpointformulations were analyzed for each factor.Percentage prediction error was constructed by com-paring experimental and predicted values.
Stability study
The stability studies of optimized ME1 andMEBG were performed. Centrifugation (Helttich,Germany) was conducted at 3500 rpm for 30 min.Ultra-low temperature freezer (Sanyo, Japan) was

A quality by design approach: Fabrication, characterization and... 253
used to perform three freeze thaw cycles.Formulations were also kept in amber colored con-tainers at 40 ± 2OC/75 ± 5% RH (relative humidity)for a period of six months. Sampling was performedat pre-determined time intervals of 1, 2, 3 and 6months. Formulations were checked for visual clar-ity, phase separation, transparency, non-grittiness,color change and drug content (13).
Skin irritation study of MEBG
Mexameter (from Courage and KhazakaElectronic GmbH, Cologne, Germany) was used toquantify the skin erythema. Skin irritation study wasperformed using six rabbits. The hairs were trimmedwith electrical shaver from dorsal side. MEBG wasapplied and affixed with stretch adhesive tape(Paragonô) and evaluated for development of ery-thema for one week (14).
Anti-inflammatory study
Anti-inflammatory study was conducted onrabbits by dividing them into three groups, with sixrabbits present in each group. Group I was taken asstandard (without any treatment). MEBG and con-
trol gel of lornoxicam were applied onto dorsal skinof rabbits present in group II and III, separately.Formalin was used as standard irritant and appliedone hour before the application of MEBG and con-trol gel. Experimentation was continued for 7 daysfor all three groups. MEBG and control gel oflornoxicam were applied once daily repeatedly forperiod of 7 days and applied area was graded andmeasured by Vernier caliper (15) for appearance anddisappearance of edema. In order to take uniformconsequences, the calculations were recorded intriplicate.
In vivo evaluation
Twenty four rabbits were taken and dividedinto two groups (12 each). Commercially availableXika rapid tablets were given to rabbits by syringeto make facilitated administration of tablet in sus-pension form; decreasing retention in mouth andultimate rebuff. It was compared with transdermalMEBG of lornoxicam. The method employed forapplication was in accordance with demonstrated inskin irritation study. Although, regarding in vivoinvestigation, single dose was delivered for 48 h and
Table 1. Solubility of lornoxicam in oils, surfactants and co-surfacatants, values presented are the mean ± SD(n = 3).
ComponentsSolubility (mg/mL)
Mean ± S.D.
Sesame oil 0.0312 ± 0.002
Soybean oil 0.041 ± 0.008
Sunflower oil 0.048 ± 0.006
Oleic acid 0.127 ± 0.024
Peanut oil 0.054 ± 0.005
Isopropyl myristate 0.085 ± 0.003Oils
Pine oil 2.51 ± 0.127
Almond oil 0.035 ± 0.004
Olive oil 0.011 ± 0.007
Eucalyptus oil 0.396 ± 0.011
Nutmeg oil 1.22 ± 0.0106
Coconut oil 0.029 ± 0.003
Tween 20 4.95 ± 0.011
Surfactants Cremophor RH 40 5.05 ± 0.056
Tween 80 3.33 ± 0.037
Isopropanol 0.077 ± 0.002
Ethanol 0.085 ± 0.018Co-surfactants
Propylene glycol 1.245 ± 0.020
Water 0.025 ± 0.008
PBS (pH 7.4) 6.1 ± 0.021
254 MUHAMMAD NAEEM et al.
blood samples were isolated for examination oflornoxicam. Vacuum tube, containing sodiumheparin as anti-coagulant (Vacutainer, BD) wasused to collect blood samples for analysis at partic-ular time intervals. Blood samples were taken byindwelling cannula in the marginal ear vein of rab-bits after delivery of MEBG and oral tablet formula-tions. Blood samples were centrifuged at 3500 rpmfor 15 min. The plasma was shifted into a new cen-trifuge tube and frozen at -20OC prior to further eval-uation. Perchloric acid solution (10%, 100 µL) wasmixed with 1 mL plasma samples to precipitate theproteins. The resulted mixtures were vortexed for 2min and centrifuged at 3000 rpm for 10 min. Thesupernatant was then transfered to Eppendorf 2 mLmicrocentrifuge tube. The clear and transparentsupernatant was kept under nitrogen flux to concen-trate the supernatant and added into the mobilephase. Ten µL of it was used by injection port ofreverse-phase HPLC (Waters alliance 2695 separa-tion module with Waters 486 detectors) to analyzelornoxicam concentration in serum. The limit ofdetection (LOD) and limit of quantification (LOQ)were found as 0.0125 and 0.025 µg/mL, respective-ly. Lornoxicam plasma samples were evaluated bythe new developed HPLC method. Briefly, an HPLCsystem equipped with the binary pump solventtransporting system, reverse phase C-18 (DiscoveryÆ HS, 15 cm 4.6 mm, 5 µm) stainless steel analyti-cal column. Chromatographic peaks of sampleswere detected at a wavelength 374 nm. Solvent sys-tem was degassed before its utilization with a soni-cator (Elma D 78224, Germany). The mobile phasecomprised of a mixture of methanol (60%) andphosphoric acid (1 : 1000 dilution in distilled water,40%). It was filtered through 0.45 µm diametermembranes (Sartorius, Germany) and also degassedprior to use by ultrasonication. The flow rate wasoptimized and fixed at 1 mL/min. Various pharma-cokinetic parameters, i.e., Cmax, Tmax and AUC weremeasured in in vivo studies. The concentration oflornoxicam was evaluated from calibration curvemodeled using linear regression equation (R2 =0.993):
y = 15.03x + 0.303 (3)where y is response ratio for the sample, x is theslope of the regression line, 15.03 is a slope and0.303 is intercept of the regression line with the y-axis.
Statistical analysis
There was use of one way analysis of variance(ANOVA) and paired sample t-test for statisticalanalysis using p < 0.05 as the minimal level of sig-
nificance. Values were investigated repeatedly forthree times. Data were presented as the mean value± S.D.
RESULTS
Selection of components for microemulsions
Solubility data are given in Table 1. Pine oil(oil), cremophor RH 40 (surfactant), isopropanol(co-surfactant) and water were selected as compo-nents of microemulsion because these have compar-atively high solubility and miscibility with othercomponents of microemulsions. Pine oil, cremophorRH 40, isopropanol, water and PBS pH 7.4 has sol-ubility values (mg/mL) of 2.51, 5.05, 0.077, 0.025and 6.1, respectively.
Construction of pseudoternary phase diagrams
The concentrations of oil and Smix weredependent upon water uptake in microemulsionpreparation using trial and error method.Pseudoternary phase diagrams with weight ratios ofSmix 1 : 1, 2 : 1, 3 : 1 are depicted in Figure 1.Translucent ME region was represented with shadedarea. Turbid area was represented towards the left ofthe region. Smix at weight ratio of 1 : 1 showedgreater microemulsion region as compared withratios of 2 : 1 and 3 : 1. All ME formulations wereisotropic, thermodynamically stable and clear. Thepseudoternary phase diagram with weight ratio 1 : 1was selected and loaded with lornoxicam.
Physicochemical characteristics of microemul-
sions
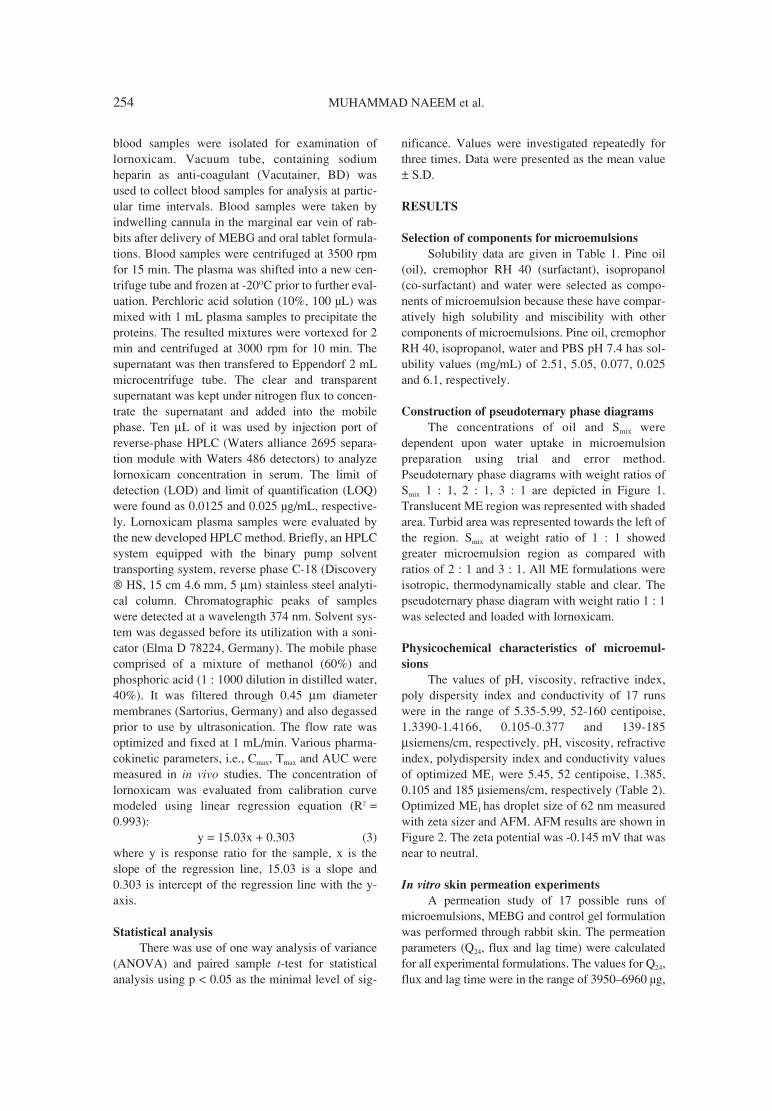
The values of pH, viscosity, refractive index,poly dispersity index and conductivity of 17 runswere in the range of 5.35-5.99, 52-160 centipoise,1.3390-1.4166, 0.105-0.377 and 139-185µsiemens/cm, respectively. pH, viscosity, refractiveindex, polydispersity index and conductivity valuesof optimized ME1 were 5.45, 52 centipoise, 1.385,0.105 and 185 µsiemens/cm, respectively (Table 2).Optimized ME1 has droplet size of 62 nm measuredwith zeta sizer and AFM. AFM results are shown inFigure 2. The zeta potential was -0.145 mV that wasnear to neutral.
In vitro skin permeation experiments
A permeation study of 17 possible runs ofmicroemulsions, MEBG and control gel formulationwas performed through rabbit skin. The permeationparameters (Q24, flux and lag time) were calculatedfor all experimental formulations. The values for Q24,flux and lag time were in the range of 3950ñ6960 µg,

A quality by design approach: Fabrication, characterization and... 255
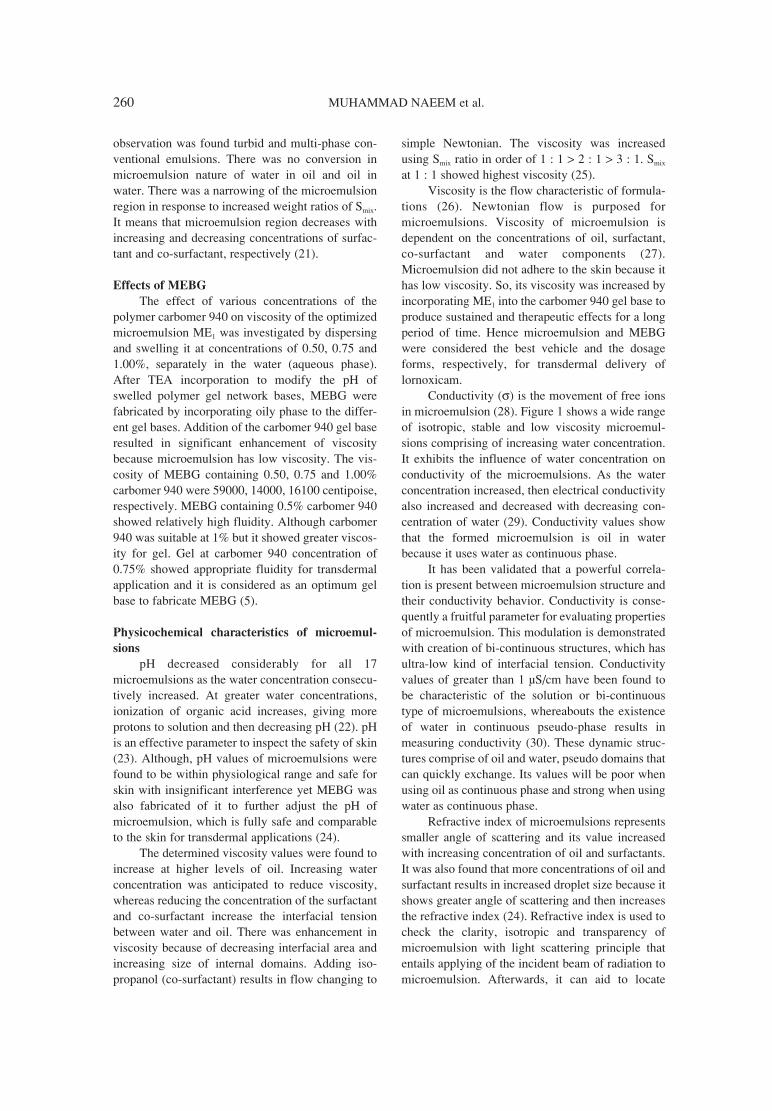
107.6-176 µg/cm2/h and 0.21-0.33 h, respectively,for 17 possible runs. Formulation ME1 showed thehighest values for Q24 (6960 µg) and flux (176µg/cm2/h) and the lowest values for lag time (0.21 h).MEBG showed values of 5220 µg, 135 µg/cm2/h and1.2 h for Q24, flux and lag time, respectively. Controlgel formulation showed values of 1050 µg, 28 µg and1.3 h for Q24, flux and lag time, respectively.
The permeation mechanism is depicted inFigure 3 for ME1, MEBG and control gel. Relativeto the optimum microemulsion of lornoxicam, a sig-nificant reduction in Q24 was noticed after ME1 wasincorporated into carbomer 940 gel base.Additionally, the lag time for fabricating MEBGwas present within the range of 1.2 h that was sig-nificantly higher than lag time of ME1 (0.21 h). Theenhancement ratio of optimized ME1 was 6.3 timeshigher than control formulation. The enhancement
ratio of MEBG was 5 times higher than control for-mulation. In vitro study of ME1, MEBG and controlgel formulations are depicted in Figure 3, whichshows how the parameters of permeation aremarkedly affected by varying composition ofmicroemulsions. The drug concentration in the skinlayer and donor compartments were 928 and 112 µg,respectively, for optimized ME1 and 2170 µg and610 µg, respectively, for MEBG.
Formulation optimization
The independent variables and their responsesare shown in Table 3. The 3D contour and responsesurface plots are depicted in Figure 4. Mathematicalquadratic equations (4-6) were generated with theDesign Expert software.
When concentrations of oil and Smix were usedat 5 or 12.5% and 40 or 50%, respectively, it
Figure 2. AFM image (a, b) of lornoxicam microemulsion
a
b

256 MUHAMMAD NAEEM et al.
describes significantly higher values of Q24 (Y1 =5160ñ6960 µg) and flux (Y2 = 132-176 µg/cm2/h). IfSmix was used at 30-50%, it shows Q24, flux and lagtime in the range of 3950ñ6960 µg, 107.6ñ176µg/cm2/h and 0.21-0.33 h, respectively. Greater per-meation of drug is investigated at low, medium andhigh levels of oil, Smix and water, respectively.Lower permeation of drug is found at high, high andmedium level of oil, Smix and water, respectively.
Formulation variables and their levels with differentcombinations were used to estimate quantitativeeffects on Q24, flux and lag time. Design Expert soft-ware was used to calculate response surface plotswith applying the values of factor levels. The modelwas demonstrated as:
Y1 (Q24) = 5826 - 1123X1 - 235X2 + 156X3 - - 89X1X2 + 123X1X3 - 197X2X3 - 250X1
2
- 278X22 + 37X3
2 (4)
Figure 3. In vitro permeation profiles of lornoxicam (ME1, MEBG and control) (n = 3)
Table 2. Characterization of microemulsions.
Codes pH Conductivity Viscosity Refractive Polydispersityσ (µsiemens/cm) (centipoise) index index
ME1 5.45 185 ± 3.1 52 ± 0.45 1.385 0.105 ± 0.021
ME2 5.41 183 ± 2.1 55 ± 0.34 1.339 0.117 ± 0.027
ME3 5.95 140 ± 1.4 145 ± 0.41 1.4033 0.342 ± 0.016
ME4 5.76 167 ± 1.7 99 ± 0.98 1.374 0.233 ± 0.014
ME5 5.74 165 ± 2.9 101 ± 0.77 1.375 0.241 ± 0.015
ME6 5.79 169 ± 2.5 97 ± 0.80 1.372 0.229 ± 0.028
ME7 5.35 175 ± 3.5 62 ± 0.55 1.345 0.141 ± 0.010
ME8 5.69 160 ± 1.1 110 ± 0.63 1.389 0.269 ± 0.026
ME9 5.73 164 ± 2.6 104 ± 0.70 1.377 0.246 ± 0.024
ME10 5.64 155 ± 2.7 107 ± 0.61 1,391 0.275 ± 0.013
ME11 5.99 149 ± 2.8 140 ± 0.53 1.4030 0.333 ± 0.011
ME12 5.72 163 ± 1.3 106 ± 0.67 3.379 0.256 ± 0.022
ME13 5.92 145 ± 1.6 153 ± 0.36 1.4104 0.357 ± 0.020
ME14 5.70 162 ± 2.5 108 ± 0.65 3.81 0.265 ± 0.019
ME15 5.89 139 ± 3.5 160 ± 0.78 1.4166 0.377 ± 0.017
ME16 5.39 180 ± 1.5 60 ± 0.50 1.342 0.130 ± 0.012
ME17 5.83 171 ± 1.3 90 ± 0.75 1.370 0.215 ± 0.023

A quality by design approach: Fabrication, characterization and... 257
Y2 (flux) = 156 - 26X1 ñ 6X2 + 4X3 - 2.30X1X2
+ 2.25X1X3 - 5.87X2X3 - 7X12 - 10X2
2
- 3.86X32 (5)
Y3 (lag time) = 0.26 + 0.045X1 + 1.0X2 - 5X3
+ 3X1X2 - 2.5X1X3 + 8X2X3 + 4X12 + 0.014X2
2
- 1.25X32 (6)
Thermodynamic stability study
Visual examination showed that optimized for-mulations were stable after centrifugation and freezethaw cycles. The lornoxicam concentration was 98.9and 98.7% in optimized ME1 and MEBG, respec-tively, in samples after 6 months. The resultsshowed that lornoxicam remained stable during thestudy. Optimized ME1 and MEBG showed Q24 of6798 and 5152 µg, respectively, of lornoxicam per-meated for 24 h. The flux values of optimized ME1
and MEBG were 174 and 133 µg/cm2/h, respective-ly. The results did not show significant difference (p
> 0.05) in the permeation release rate with that ofinitial permeation studies indicating that both for-mulations were stable. There was no significantchange observed for visual clarity, phase separation,transparency, non-grittiness, color change and drugcontent.
Skin irritation study
Skin erythema index is an arbitrary unit meas-ured by Mexameter and its values before and afterthe application of MEBG were in the range of 190-280 and 200-300, respectively. No change in skinerythema was observed after the application ofMEBG indicating that MEBG was non-irritant.
Anti-inflammatory study
The edema induced by formalin model wasused to distinguish the anti-inflammatory activity ofMEBG and a conventional gel containing lornoxi-
a d
e
f
b
cFigure 4. Contour plots showing effects (a) Q24 (b) flux (c) lag time corresponding response surface plots (d-f)

258 MUHAMMAD NAEEM et al.
cam. There was a significant difference observedwhen comparing percent inhibition of edema ofMEBG (80%) and control gel (40%) with respect tostandard (without using gel) (Fig. 5).
In vivo study
The results of the in vivo studies are depicted inFigure 6. The Cmax values (µg/mL) of lornoxicamwere found as 0.378 and 0.275 after delivery ofMEBG and oral Xika tablet, respectively. The Tmax
values (h) were found as 2 and 10 h following deliv-ery of MEBG and oral Xika tablet, respectively. Thevalues (µg.h/mL) of AUCtotal and AUClast time were11.14 and 2.035 and 9.637 and 1.483, respectively,following delivery of MEBG and oral Xika tablet.
DISCUSSION
Components of microemulsions
The greater dermal flux was observed mainlybecause of the large solubilizing capacity ofmicroemulsion, which results in a greater concentra-tion gradient across the skin. Solubility study is usedto screen the GRAS (generally regarded as safe)components of microemulsion with respect to highsolubility, which plays a vital role for permeationand systemic absorption of the drug. The compati-bility between individual components is a primaryrequirement with regard to preparation ofmicroemulsion (16). Pine oil was selected because ithas good fragrance, antiseptic, skin safety and
Figure 5. Anti-inflammatory activity of MEBG and control gel
Figure 6. Mean serum profiles of lornoxicam in rabbits, after delivery of MEBG and oral Xika rapid tablet

A quality by design approach: Fabrication, characterization and... 259
antioxidant properties. It shows greater solubility fordrug lornoxicam and is highly miscible with othercomponents of microemulsion (17). Chemically,pine oil is comprised chiefly of cyclic terpenes(alcohols, hydrocarbons, esters and ethers), whichact as permeation enhancers (18). Non ionic surfac-tant was chosen as potential optimal surfactantbecause it is neutral, biocompatible, non-toxic andstable at variable pH (19). It was selected because ithas HLB value greater than 10 for preparing oil inwater microemulsion. Cremophor RH 40 with HLBvalue 15 was used as non-ionic surfactant because itshows high solubility for lornoxicam and high mis-cibility with other components of microemulsion(20). It is an emulsifying agent and non-ionic solu-bilizer, which is made by reacting ethylene oxideand hydrogenated castor oil. It is tasteless in aque-ous solutions with very little odor. It is an appropri-ate solvent for natural resins, gums, polyvinylbutyral, ethyl cellulose, alkaloids, epoxy and acrylic
resins. Isopropanol was selected as co-surfactantbecause it shows high miscibility with other compo-nents of microemulsion. It permits the interfacialfilm with adequate flexibility to take on differentcurvatures, required to form a microemulsion over awide concentration range and reduce bending stressof interfaces. PBS, pH 7.4 was selected because ithas a neutral pH near to that of skin and do not causeskin irritation. The solubility of lornoxicam in PBS,pH 7.4 and water is in accordance with Saleh et al.(15).
Pseudoternary phase diagrams
Pseudoternary phase diagrams were construct-ed to find out the concentration ranges of selectedcomponents for the existence of a microemulsionregion (5). The isotropic, clear and low viscosityarea was presented in phase diagram (Fig. 1) withsingle phase translucent microemulsion region. Therest of the area on the ternary diagrams on visual
Table 3. Variables and observed responses in Box Behnken design for microemulsions.
Independent Dependent variables
Kp ◊ 10-3 Enhancementvariables (/cm) ratio
MicroemulsionX1 X2 X3 Y1 Y2 Y3
(g) (g) (g) (µg) µg/cm2/h (h)
1 -1 0 +1 6960 176 0.21 22.0 6.38
2 0 +1 +1 5160 132 0.29 16.5 4.78
3 0 +1 -1 5484 138 0.28 17.3 5.00
4 0 0 0 5826 156 0.26 19.5 5.65
5 0 0 0 5826 156 0.26 19.5 5.65
6 -1 -1 0 6469 165 0.23 20.6 5.98
7 +1 0 +1 4820 125 0.3 15.6 4.53
8 +1 +1 0 3950 108 0.33 13.5 3.91
9 0 0 0 5826 156 0.26 19.5 5.65
10 +1 -1 0 4540 121 0.31 15.1 4.39
11 -1 0 -1 6653 170 0.22 21.3 6.16
12 0 0 0 5826 156 0.26 19.5 5.65
13 0 -1 -1 5618 140 0.27 17.5 5.07
14 0 0 0 5826 156 0.26 19.5 5.65
15 +1 0 -1 4020 109.7 0.32 20.9 6.07
16 0 -1 +1 6080 157 0.25 19.6 5.69
17 -1 +1 0 6234 161 0.24 20.1 5.84
Independent variablesLevels used, actual (coded)
Low (-1) Medium (0) High (+1)
Oil (g) 5 12.5 20
Smix (g) 30 40 50
Water (g) 40 50 60
260 MUHAMMAD NAEEM et al.
observation was found turbid and multi-phase con-ventional emulsions. There was no conversion inmicroemulsion nature of water in oil and oil inwater. There was a narrowing of the microemulsionregion in response to increased weight ratios of Smix.It means that microemulsion region decreases withincreasing and decreasing concentrations of surfac-tant and co-surfactant, respectively (21).
Effects of MEBG
The effect of various concentrations of thepolymer carbomer 940 on viscosity of the optimizedmicroemulsion ME1 was investigated by dispersingand swelling it at concentrations of 0.50, 0.75 and1.00%, separately in the water (aqueous phase).After TEA incorporation to modify the pH ofswelled polymer gel network bases, MEBG werefabricated by incorporating oily phase to the differ-ent gel bases. Addition of the carbomer 940 gel baseresulted in significant enhancement of viscositybecause microemulsion has low viscosity. The vis-cosity of MEBG containing 0.50, 0.75 and 1.00%carbomer 940 were 59000, 14000, 16100 centipoise,respectively. MEBG containing 0.5% carbomer 940showed relatively high fluidity. Although carbomer940 was suitable at 1% but it showed greater viscos-ity for gel. Gel at carbomer 940 concentration of0.75% showed appropriate fluidity for transdermalapplication and it is considered as an optimum gelbase to fabricate MEBG (5).
Physicochemical characteristics of microemul-
sions
pH decreased considerably for all 17microemulsions as the water concentration consecu-tively increased. At greater water concentrations,ionization of organic acid increases, giving moreprotons to solution and then decreasing pH (22). pHis an effective parameter to inspect the safety of skin(23). Although, pH values of microemulsions werefound to be within physiological range and safe forskin with insignificant interference yet MEBG wasalso fabricated of it to further adjust the pH ofmicroemulsion, which is fully safe and comparableto the skin for transdermal applications (24).
The determined viscosity values were found toincrease at higher levels of oil. Increasing waterconcentration was anticipated to reduce viscosity,whereas reducing the concentration of the surfactantand co-surfactant increase the interfacial tensionbetween water and oil. There was enhancement inviscosity because of decreasing interfacial area andincreasing size of internal domains. Adding iso-propanol (co-surfactant) results in flow changing to
simple Newtonian. The viscosity was increasedusing Smix ratio in order of 1 : 1 > 2 : 1 > 3 : 1. Smix
at 1 : 1 showed highest viscosity (25).Viscosity is the flow characteristic of formula-
tions (26). Newtonian flow is purposed formicroemulsions. Viscosity of microemulsion isdependent on the concentrations of oil, surfactant,co-surfactant and water components (27).Microemulsion did not adhere to the skin because ithas low viscosity. So, its viscosity was increased byincorporating ME1 into the carbomer 940 gel base toproduce sustained and therapeutic effects for a longperiod of time. Hence microemulsion and MEBGwere considered the best vehicle and the dosageforms, respectively, for transdermal delivery oflornoxicam.
Conductivity (σ) is the movement of free ionsin microemulsion (28). Figure 1 shows a wide rangeof isotropic, stable and low viscosity microemul-sions comprising of increasing water concentration.It exhibits the influence of water concentration onconductivity of the microemulsions. As the waterconcentration increased, then electrical conductivityalso increased and decreased with decreasing con-centration of water (29). Conductivity values showthat the formed microemulsion is oil in waterbecause it uses water as continuous phase.
It has been validated that a powerful correla-tion is present between microemulsion structure andtheir conductivity behavior. Conductivity is conse-quently a fruitful parameter for evaluating propertiesof microemulsion. This modulation is demonstratedwith creation of bi-continuous structures, which hasultra-low kind of interfacial tension. Conductivityvalues of greater than 1 µS/cm have been found tobe characteristic of the solution or bi-continuoustype of microemulsions, whereabouts the existenceof water in continuous pseudo-phase results inmeasuring conductivity (30). These dynamic struc-tures comprise of oil and water, pseudo domains thatcan quickly exchange. Its values will be poor whenusing oil as continuous phase and strong when usingwater as continuous phase.
Refractive index of microemulsions representssmaller angle of scattering and its value increasedwith increasing concentration of oil and surfactants.It was also found that more concentrations of oil andsurfactant results in increased droplet size because itshows greater angle of scattering and then increasesthe refractive index (24). Refractive index is used tocheck the clarity, isotropic and transparency ofmicroemulsion with light scattering principle thatentails applying of the incident beam of radiation tomicroemulsion. Afterwards, it can aid to locate

A quality by design approach: Fabrication, characterization and... 261
intensity and angle of scattered beam. Enlarged andsmall droplets of microemulsion have large andsmall angle of scattering, respectively (31).
Droplet size found was smaller, uniformly dis-tributed (deflocculated) and within microemulsionrange. All poly-dispersity index values were foundto be smaller than 0.5, which demonstrates thehomogeneity and narrow size distribution ofdroplets (5). Zeta potential value represents the sta-bility of microemulsion containing non-ionic surfac-tants. Droplet size is independent of zeta potential.Small droplet size gives greater stability against sed-imentation, coalescence and flocculation (32).Values of poly-dispersity index near to one showthat the droplet size come with significant uncer-tainty. If droplets are smaller then it shows negativezeta potential and deflocculation property with uni-form distribution (19).
The droplets found were almost spherical inshape with smooth surface and uniform distribution.There was no adhesion or aggregation amongdroplets of microemulsion because they are uni-formly distributed and deflocculated into the system(Fig. 2) (33). AFM is a basic indicator to distinguishtopographical aspects of droplets submersed in liq-uid by interpreting shape, morphology and size ofmicroemulsion. It is also used to determine themicrostructure of microemulsion (34). The mainadvantage of AFM for droplet characterization is thedirect measurements of volume and 3D display.
In vitro skin permeation experiments
The effects of change in Q24, flux and lag timevalues illustrate that the permeation release parame-ters of lornoxicam from the microemulsions weremarkedly affected by the composition ofmicroemulsions. Oil was selected as it enhances per-meation by modifying solvent nature of stratumcorneum, which, in turn, improves drug partitioninginto viable tissues. It is permeated across skin andlarge quantities of it are present in epidermis aftertransdermal delivery. It also modifies drug diffusiv-ity across membrane. During steady state perme-ation by this penetration enhancer, lag time for per-meation release is usually reduced, representing anincrease in the drug diffusivity across membrane(35). The surfactant was selected because it increas-es permeation with inducing fluidization of lipidstratum corneum and ultimately solubilizing andextracting the lipid components. Its binding andinteraction with keratin filaments results in disrup-tion in corneocyte, which, in turn, increases perme-ation (36). The co-surfactants particularly short-chain alcohols are recognized to increase the flux by
modifying the relative hydrophobicity andhydrophilicity of the system (37). The mechanismpresent behind this phenomenon is more fluidity ofinterfacial film owing to penetration of monolayerof surfactant and then, disruption of the crystallinephases created as a consequence of rigid surfactantfilm. As an enhancer and solubilizer, isopropanolnot only increases the solubility of drug into the sol-vents but also modifies the anatomy of biomem-brane by extracting lipid and increases the perme-ability of the drug. Water concentration increasedpermeation owing to hydration of the stratumcorneum, which results in creation and broadeningof the channels in keratin layer and then, distortionof the lipid bilayer (38). PBS (pH 7.4) was optimalfor conducting in vitro permeability studies. It isnoteworthy that it has near neutral pH value fortransdermal delivery of lornoxicam through rabbitskin and can help for diffusion of drug across lipidbilayer membrane (15). These results show that themicroemulsion has a potent enhancement effect forthe purpose of transdermal delivery. It was noticedthat the concentration of permeated lornoxicam andflux decreased with increasing concentration of sur-factant from medium to high level. The resultsmight be due to a decrease of thermodynamic activ-ity of lornoxicam in microemulsion using high con-centrations of surfactant. The thermodynamic activ-ity of drug plays a significant role for release anddermal permeation of drug into the skin. In this ener-gy rich system, the drug can diffuse through theflexible interfacial film of surfactant between thephases; a thermodynamic process increases diffu-sion and partitioning across the stratum corneum.Although, permeation of drug was decreased usinghigh levels of the Smix, this was owing to attractionof lornoxicam towards surfactant and oil phase. Thelag time decreased with more concentration of drugpermeated in 24 h. There was ameliorating chanceof microemulsion droplets to adhere to skin anddeliver bioactive particle in a more controlled man-ner. The large surface area was available for drugpermeation across the skin due to the very smalldroplet size of microemulsion and greater concen-tration of the drug it the upper layers of skin thatresulted in a greater concentration gradient, which isan ideal driving force for transdermal drug delivery(39). There was a decrease in the permeation rate toincrease in viscosity of microemulsion. The diffu-sion is a rate determining step through double layermicroemulsion. The viscosity plays a major role inthe controlling rate and extent of drug into the recep-tor compartment. The results depict that lornoxicamloaded ME1 has permeation enhancement effect

262 MUHAMMAD NAEEM et al.
through the skin. The high concentration of the usedsurfactants could enhance the permeation releaserate aside from increasing permeation from pine oil.Concisely, MEBG showed sustained permeation oflornoxicam as compared to ME1 (40, 41). Thismechanism could be annotated for the release delay-ing effect of the polymer matrix, primarily becauseof enhanced viscosity originating from carbomergelation (5). Peltola has studied the effect of car-bomer 940 on permeability of estradiol. The incor-poration of carbomer 940 into the microemulsionreduced the permeation of estradiol and it could
attribute to increase the viscosity and then convertfrom the microemulsion to a lamellar structure orgreatly ordered micro-structure (42).
Fitting data to the model
All 17 prepared microemulsions showed sig-nificantly higher values for Q24 and flux. DesignExpert was used simultaneously to fit responses ofall 17 formulations prepared, to 1st, 2nd and quadraticmodels. The quadratic model was evaluated as a bestfit model. The comparative values of R2, standarddeviation and % coefficient of variation (%CV)
Table 4. Composition of checkpoint formulations, the predicted and experimental values of response variables, and percentage predictionerror.
No. Oil Smix WaterResponse Predicted Experimental Percentage variables value value prediction error
1 5 40 49 Y1 6672 6653 0.28
Y2 174 170 2.48
Y3 0.22 0.22 0.17
2 8 34 55 Y1 6475 6469 0.10
Y2 169 165 2.50
Y3 0.23 0.23 1.07
3 11 39 54 Y1 6071 6080 0.16
Y2 161 157 2.64
Y3 0.25 0.25 0.14
4 9 49 53 Y1 5841 5826 0.27
Y2 152 156 2.55
Y3 0.26 0.26 0.52
5 14 40 55 Y1 5670 5618 0.92
Y2 151 145 4.14
Y3 0.27 0.27 1.16
6 12 50 53 Y1 5481 5484 0.05
Y2 144 138 3.93
Y3 0.28 0.28 1.07
7 16 40 43 Y1 5143 5160 0.34
Y2 138 132 4.01
Y3 0.28 0.29 1.87
8 18 41 52 Y1 4837 4820 0.35
Y2 132 125 5.34
Y3 0.30 0.3 1.14
9 18 47 56 Y1 4538 4540 0.05
Y2 121 121 0.15
Y3 0.31 0.31 0.24
10 20 48 46 Y1 4005 4020 0.37
Y2 109 109.7 0.31
Y3 0.33 0.32 2.19

A quality by design approach: Fabrication, characterization and... 263
were generated for each response with regressionequations. A positive and negative values indicatedan effect that favors optimization and inverse rela-tionship between variable and response, respective-ly. It is clear that X3 showed a positive effect onresponse Y1 and Y2. X2 showed a positive effect onresponse Y3. The effects of independent variableswere estimated and optimum formulations wereselected by depicting three dimensional responsesurface plots (Fig. 4d-f) (11).
Data analysis
ME1, ME6, ME11, ME17 showed the higher val-ues for Q24 (Y1) and Y2 (flux). The observed and pre-dicted values of Y1, Y2 and Y3 are depicted in Table4 with residual and percent error of responses for allformulations. The values of dependent variables(obtained at various levels of 3 independent vari-ables) were subjected to multiple regressions to gen-erate quadratic model polynomial equations. Thevalues of correlation coefficient R2 of equation (Eq.4) was 0.986 indicating a good fit. The ìPred R-Squaredî of 0.7780 was in reasonable agreementwith ìAdj R-Squaredî of 0.9683; i.e., the differencewas less than 0.2. ìAdeq Precisionî measures signalto noise ratio. A ratio greater than 4 was desirable.The software generated a ratio of 24.919 indicatingan adequate signal. This model was used to navigatedesign space. The significant variation was presentamong different microemulsion formulations thatranged from 3950 to 6960 µg for ME1 and ME8,
respectively. The results clearly showed that Y1
value could greatly affect variables selected forstudy. The main effects of X1, X2 and X3 showed theaverage result of variable changes from its low tohigh level at a time. The interaction terms X1X2,X1X3, X2X3, X1
2, X22 and X3
2 indicated how Y1 devi-ated when two variables changed simultaneously.The 3 independent variables with negative coeffi-cient represented an unfavorable effect on Y1. Thepositive coefficient represented favorable effect onY1 for variation between two variables. The lowestcoefficient value found to be -235 for X2 amongthree independent variables, which had indicatedthat this variable was insignificant in predicting Y1.The value of R2 of equation (Eq. 5) was 0.9931, indi-cating a good fit. The ìPred R-Squaredî of 0.8889was in reasonable agreement with ìAdj R-Squaredîof 0.9841; i.e., difference was less than 0.2. ìAdeqPrecisionî measured the signal to noise ratio. A ratiogreater than 4 was desirable. The software generat-ed ratio of 34.221, which indicated an adequate sig-nal. This model was used to navigate design space. Y2 values were higher for ME1, ME6, ME11 and
ME17. The flux values increased from medium tolow levels for X1, low to medium levels for X2 andlow to high levels for X3. The Y2 values calculatedfor 17 runs represent significant variation thatranged between 164-290 µg/cm2/h. The terms X1X2,X1X3, X2X3, X1
2, X22 and X3
2 represented how Y2
changed when two variables changed simultaneous-ly. The positive coefficient had indicated a favorableeffect for interaction between two variables. Thelowest coefficient value -26 among three independ-ent variables was for variable X1 that indicated thatthe variable was insignificant in the prediction offlux.
The value of R2 of equation (Eq. 6) was 0.992.The ìPred R-Squaredî of 0.8703 was in reasonableagreement with the ìAdj R-Squaredî of 0.9815; i.e.,the difference was less than 0.2. ìAdeq Precisionîmeasured the signal to noise ratio. A ratio greaterthan 4 was desirable. Design Expert software wasused to generate a ratio of 33.79, indicating an ade-quate signal. This model could be used to navigatedesign space. The lag time values were less amongME1, ME6, ME11, ME17, indicating an insignificantdifference (p > 0.05). The lag time values increasedfrom low to high levels for variables X1, X2 andmedium to low levels for variables X3. The Y3 wasfound to increase with accumulation of drug intolayers of stratum corneum. The Y3 also increasedfrom solubilizing capacity and affinity of drug invariable X2. The interaction terms X1X2, X1X3, X2X3,X1
2, X22 and X3
2 represented how Y3 changed whentwo variables changed simultaneously. The positivecoefficient indicated a favorable effect on Y3 forinteraction between two variables. The lowest coef-ficient value of 5 among three independent variableswas for level X3 indicating that the variable wasinsignificant in predicting Y3 (11).
Contour plots and response surface analysis
The interaction effects of factors on responseswere studied by contour and response surface plots(Fig. 4). At one time, the effects of two variables onthe response were studied with phase plots. In allfigures, third factor was kept at a constant level. Allrelationships were non-linear among three variables,although factor X2 with X1 and X3 exhibited a near-ly linear relationship by forming almost straightlines up to medium level of Smix. When X2 concen-tration became higher, it resulted in a curvilinear ornonlinear relationship. Factors X2 and X3 showed acurvilinear relationship between these factors evenmore clearly at all levels of two variables onresponse Y2. In constant concentration of the oilphase, Y1 and Y2 values were found to increase with

264 MUHAMMAD NAEEM et al.
increasing concentration of either Smix (up to medi-um level) or water (15).
Optimization
The optimum formulations were selected byapplying constraints: Y1 (3000 = Y = 7000), Y2 (140= Y = 300) and Y3 (0.20 = Y = 0.34). Optimum for-mulations of maximum requisite were fulfilled withcriteria of using Y1 and Y2 at maximum and Y3 atminimum value. It showed the composition of oil5%, Smix 35% and water 60% on trading of variousresponse variables. There was a comprehensiveevaluation of feasibility and exhaustive grid search.
Validation of response surface plots
Concentrations of dependent variables wereused to obtain ten checkpoint formulations by RSM.The values of experimental and predicted responsesfor these formulations are depicted in Table 4. Thesewere subjected to in vitro permeation studies to con-firm validity of calculating optimal parameters andpredicted response. It was clear from the results thatpredicted errors are less than 5%. It was observedthat responses are in close agreement with predictedvalues. General equations validity was establishedwith the help of percentage prediction error. Thisresult demonstrated the domain of applicability ofRSM model. The linear correlation plots generatedbetween predicted and experimental values wereused to explain high values of R2, indicating thegoodness of fit (11).
Thermodynamic stability study
The aim of stability testing is to give evidenceon how the content of medicinal products or activepharmaceutical ingredient (API) changes withrespect to time under the influence of a number ofenvironmental factors including light, temperatureand humidity. Stability studies played significantrole for deciding shelf life and re-test period formedicinal product. It also approved the storage con-ditions for API. Stability testing is conducted due toICH-Guideline Q1A (43). Thermodynamic stabilitystudies determine the stability of optimized formula-tions. Microemulsion is stable if it does not show theconcentration change, phase separation and changein the organoleptic characteristics (44). In the pres-ent study, visual examination showed that optimizedformulations were stable after subjected to centrifu-gation and freeze thaw cycles. The results showedthat lornoxicam remained stable during and after thestudy. The results did not show significant differ-ence (p > 0.05) in the permeation release rate withthat of initial permeation studies indicating that both
formulations were stable. The formulations werefound to be thermodynamically stable, clear andisotropic because there was no observation in drugcontent variation, phase separation and color change(45).
Skin irritation study
Although all substances employed for the fab-rication of microemulsions are found underGenerally Regarded as Safe (GRAS) category, allsubstances concentrations are found to be a verycrucial issue for these kinds of formulations. Forexample, large concentration of surfactants causesirritation to the skin. Hence, skin irritation test wasconducted to check concentrations of substances uti-lized for preparation of microemulsion. This testwas performed to find any localized reaction of opti-mized microemulsion on the skin (46).
Skin erythema index indicates skin irritation ofoptimized formulations (47). In the present studythere was an insignificant difference of skin erythe-ma index values measured before and after theapplication of MEBG. Skin was found to be safewith no irritation (48).
Anti-inflammatory study
When MEBG and control gel were applied toskin for curing inflammation, it was observed thatthe edema was comparatively less as compared withcontrol gel, showing that lornoxicam permeatedacross the skin exhibited anti-inflammatory activity.To distinguish anti-inflammatory activity of MEBGand control gel, the percent inhibition of edema isdepicted in Figure 4. The MEBG was found to bemore efficacious and effective as compared withcontrol gel for all time duration, showing that addi-tion of lornoxicam into MEBG improves antiinflammatory activity (49).
Pharmacokinetics
The results of bioavailability study shows thatthe lornoxicam permeated and released in continu-ous sustained manner from the MEBG as contrastedwith oral Xika rapid tablet. The values of CMax, TMax
and AUC were compared. The values of TMax werefound out greater and significant (p < 0.05) for trans-dermal delivery in all the rabbits than for oral deliv-ery. This difference was due to stratum corneum,which could sustained and delayed the release andpermeation of lornoxicam from MEBG as comparedto oral delivery. Generally, the mean value ofAUCtotal was greater for MEBG as compared withoral tablet. This demonstrated the improvedbioavailability of lornoxicam from MEBG. This was

A quality by design approach: Fabrication, characterization and... 265
due to the avoidance of the first pass effect of trans-dermal route. Hence, MEBG was found out aneffective therapy for the management of rheumatoidarthritis and inflammation (11, 47).
CONCLUSION
As solubilizer and enhancer, microemulsioncomponents increased solubility of lipophilic druglornoxicam and modified the biomembrane byextracting lipid and increasing permeability acrossrabbit skin. BBD was used to optimize independentvariables for predicting dependent variables usingquadratic model as best fit. MEBG was fabricatedto increase adhesion of the ME1 to the skin byextending its retention time. The results revealedthat the MEBG was non-irritating and did notinduce any erythema following transdermal deliv-ery. Anti-inflammatory study showed the signifi-cant difference in percent inhibition of edema,when compared with control gel. In vivo bioavail-ability results demonstrated the improved perme-ation of lornoxicam from the MEBG, compared tooral tablet. This system could be evaluated furtherfor other biopharmaceutical classification system(BCS) II.
Acknowledgment
This work is supported by a research grant(106-2277-BM6-093) from Higher EducationCommission of Pakistan.
Conflict of interest
The authors report no conflicts of interest inthis work.
REFERENCES
1. Lawrence M.J., Rees G.D.: Adv. Drug Deliv.Rev. 45, 89 (2000)
2. Gasco M.: Surfactant Sci. Ser. 66, 97 (1997).3. Cevc G., Vierl U.: J. Control. Release 141, 277
(2010).4. Marti-Mestres G., Nielloud F.: J. Disper. Sci.
Technol. 23, 419 (2002).5. Chen H., Mou D., Du D., Chang X., Zhu D. et
al.: Int. J. Pharm. 341, 78 (2007).6. Khuri A.I., Mukhopadhyay S.: Wiley
Interdiscip. Reviews: Comput. Stat. 2, 128(2010).
7. Balfour J., Fitton A., Barradell L.: Drugs 51,639 (1996).
8. Nijhawan M., Santhosh A., Babu P.S.,Subrahmanyam C.: Drug Dev. Ind. Pharm. 40,1163 (2014).
9. Skjodt N.M., Davies N.M.: Clin.Pharmacokinet. 34, 421 (1998).
10. Mizushima Y., Hamano T., Yokoyama K.: J.Pharm. Pharmacol. 34, 49 (1982).
11. Gannu R., Rao Y.M.: J. Disper. Sci. Technol.33, 223 (2012).
12. Idrees M., Rahman N., Ahmad S., Ali M.,Ahmad I.: DARU 19, 433 (2011).
13. Shukla J.B., Patel S.J.: J. Pharm. Pharm. Sci. 2,143 (2010).
14. Bayrak Y., Iscan M.: J. Disper. Sci. Technol.26, 75 (2005).
15. Al-Suwayeh S.A., Taha E.I., Al-Qahtani F.M.,Ahmed M.O., Badran M.M.: Scientific World J.2014, 127495 (2014).
16. Bayrak Y., Iscan M.: Colloid. Surface. A 268,99 (2005).
17. Suntar I., Tumen I., Ustun O., Keles H., AkkolE.K.: J. Ethnopharmacol. 139, 533 (2012).
18. Pathan I.B., Setty C.M.: Trop. J. Pharm. Res. 8,173 (2009).
19. Qu D., He J., Liu C., Zhou J., Chen Y.: Int. J.Nanomedicine 9, 109 (2014).
20. Hu L., Hu Q., Yang J.: Iran. J. Basic Med. Sci.17, 760 (2014).
21. Huang C.-C., Hohn K.L.: J. Phys. Chem. B 114,2685 (2010).
22. Spernath A., Aserin A., Garti N.: J. ColloidInterface Sci. 299, 900 (2006).
23. Hathout R.M., Woodman T.J., Mansour S.,Mortada N.D., Geneidi A.S., Guy R.H.: Eur. J.Pharm. Sci. 40, 88 (2010).
24. Chen H., Chang X., Weng T., Zhao X., Gao Z.et al.: J. Control. Release 98, 427 (2004).
25. El Maghraby G.M.: Int. J. Pharm. 355, 285(2008).
26. Jadhav K., Ambade K., Jadhav S., GambhireM., Kurmi S., Kadam V.: Curr. Drug Deliv. 5,32 (2008).
27. Yuan J.S., Ansari M., Samaan M., Acosta E.J.:Int. J. Pharm. 349, 130 (2008).
28. Talegaonkar S., Azeem A., Ahmad F.J., KharR.K., Pathan S.A., Khan Z.I.: Recent Pat. DrugDeliv. Formul. 2, 238 (2008).
29. Fanun M.: J. Mol. Liq. 139, 14 (2008).30. Graf A., Ablinger E., Peters S., Zimmer A., Hook
S., Rades T.: Int. J. Pharm. 350, 351 (2008).31. Acharya D.P., Hartley P.G.: Curr. Opin. Colloid
Interface Sci. 17, 274 (2012).32. Cho Y.H., Kim S., Bae E., Mok C., Park J.: J.
Food Sci. 73, E115 (2008).

266 MUHAMMAD NAEEM et al.
33. Fanun M.: J. Disper. Sci. Technol. 30, 115(2009).
34. Fanun M., Makharza S., Sowwan M.: J. Disper.Sci. Technol. 31, 501 (2010).
35. Williams A.C., Barry B.W.: Adv. Drug Deliv.Rev. 64, 128 (2012).
36. Pandey A., Mittal A., Chauhan N., Alam S.: J.Mol. Pharm. Org. Process Res. 2, 2 (2014).
37. Patel M.R., Patel R.B., Parikh J.R., SolankiA.B., Patel B.G.: AAPS PharmSciTech. 10, 917(2009).
38. Azeem A., Khan Z.I., Aqil M., Ahmad F.J.,Khar R.K., Talegaonkar S.: Drug Dev. Ind.Pharm. 35, 525 (2009).
39. Sahoo S., Pani N.R., Sahoo S.K.: Colloid. Surf.B 120, 193 (2014).
40. Chen H., Chang X., Du D., Li J., Xu H., YangX.: Int. J. Pharm. 315, 52 (2006).
41. Jana S., Manna S., Nayak A.K., Sen K.K., BasuS.K.: Colloid. Surf. B 114, 36 (2014).
42. Peltola S., Saarinen-Savolainen P., Kiesvaara J.,Suhonen T., Urtti A.: Int. J. Pharm. 254, 99(2003).
43. Carstensen T., Rhodes C.T. Eds.: Drug stabili-ty: principles and practices. Marcel Dekker,New York 2000.
44. Kogan A., Garti N.: Adv. Colloid Interface Sci.123, 369 (2006).
45. Narang A.S., Delmarre D., Gao D.: Int. J.Pharm. 345, 9 (2007).
46. Soliman S.M., Malak N.A., El-Gazayerly O.N.,Rehim A.A.: Drug Discov. Ther. 4, 459 (2010).
47. Gannu R., Palem C.R., Yamsani V.V., YamsaniS.K., Yamsani M.R.: Int. J. Pharm. 388, 231(2010).
48. Kantarc� G., ÷zg¸ney I., Karasulu H.Y., Arz˝kS., G¸neri T.: AAPS PharmSciTech. 8, E91(2007).
49. Lee I.O., Crosby G.: J. Korean Med. Sci. 14, 34(1999).
Received: 5. 03. 2016