Embed Size (px)
Citation preview
1
Bachelor Thesis Electrical Engineering June 2011.
School of Computing Blekinge Institute of Technology 371 79 Karlskrona Sweden.
Ramesh Dhungana (830825-9731)
Deepak Shahi (890830-1396)
Internet : www.bth.se/com Phone : +46 455 38 50 00 Fax : +46 455 38 50 57
A Quantitative Study of Quality of Experience
(QoE) for Decreasing and Increasing Network
Performance.
2
Contact Information:
Authors:
Ramesh Dhungana Address: Lindblomsvagen 98, 372 33 Ronneby, Sweden. E-mail: [email protected]
Deepak Shahi Address: Lindblomsvagen 98 372 33 Ronneby, Sweden. E-mail: [email protected]
Thesis Examiner:
Dr. Markus Fiedler School of Computing, Blekinge Institute of Technology, Karlskrona, Sweden. Email: [email protected]
Thesis Supervisor:
Charlott Lorentzen School of Computing Blekinge Institute of Technology, Karlskrona Sweden. E-mail: [email protected]
3
ABSTRACT
Currently, user satisfaction is becoming one of the major concerns for the service provider in
accommodating user demand. This paper evaluates the user’s perception (Quality of Experience, QoE)
of the increasing and decreasing response times (Quality of Service, QoS), in particular a login to web
login page by the implementation of Mean Opinion Score (MOS). By comparing the results to user
perception of web login performance, we show that the users perceive web login for increasing and
decreasing RTs in different ways. So, we conduct interview among specific users applying increased
and decreased RTs in particular web login to rank the users satisfaction level. Study of the two results
for RTs of the web login page is presented.
Keywords: Quality of Experience (QoE), Network Performance, User perception and Response Time.

4
ACKNOWLEDGEMENT
We would like to express deep and sincere gratitude to our Supervisor Charlott Lorentzen for her
excellent guidance and encouragement which led us to the completion of our thesis. It would not have
been possible our thesis without her support and guidance.
We also would like to special thank to our thesis examiner Markus Fiedler for his invaluable
suggestion and co-operation which helped us to deal with the research matter seriously, otherwise it
would have been more difficult.
We are also thankful to our friends and families for their inspiration, support and encouragement to
complete our thesis.
Last but not least, we have been very grateful and thankful to the Blekinge Institute of Technology for
providing us the comprehensive education which will be definitely fruitful in forthcoming days to
open the doors of opportunities in our career.
5
Table of Contents
1 INTRODUCTION ......................................................................................................................................................... 7
1.1 BACKGROUND ................................................................................................................................................................ 7 1.2 MOTIVATION .................................................................................................................................................................. 7
2 TECHNICAL BACKGROUND ................................................................................................................................... 9
2.1 QUALITY OF EXPERIENCE (QOE) .................................................................................................................................... 9 2.2 PHP .............................................................................................................................................................................. 10 2.3 WEB LOGIN PAGE ......................................................................................................................................................... 11
3 METHODOLOGY ...................................................................................................................................................... 12
3.1 QUANTITATIVE ............................................................................................................................................................. 12 3.2 QUALITATIVE ............................................................................................................................................................... 13 3.3 DATA COLLECTION ....................................................................................................................................................... 13
4 DATA ANALYSIS....................................................................................................................................................... 14
4.1 QUANTITATIVE ANALYSIS ............................................................................................................................................ 14 4.2 QUALITATIVE ANALYSIS .............................................................................................................................................. 19
5 DISCUSSION ............................................................................................................................................................... 20
6 CONCLUSION AND FUTURE WORK ................................................................................................................... 22
7 REFERENCES ............................................................................................................................................................ 23
6
LIST OF ACRONYMS
BTH Blekinge Institute of Technology
ISP Internet Service Provider
ITU International Telecommunication Union
MOS Mean Opinion Square
OS Opinion Score
PHP Hypertext Preprocessor
QoE Quality of Experience
QoS Quality of Service
RT Response Time
WWW World Wide Web
7
1 Introduction
1.1 Background
While communicating web authentication technology, QoE has been major issues on the performance
of network service. More precisely, it is often hard to correlate network- level quality of service to the
QoE perceived by users for any web application.
Ranking user perception itself is a complicated phenomenon which is influenced by different objective
(network quality, device capacity) and subjective parameters (expectations, emotion and location).
These parameters also help to detect service QoE degradation and suitable action to restore better
network quality. From the user point of view, users do not know what delay is but the users notice the
effect of delay in data network for network performance [2].
Research on the area of QoE for analyzing network performance has been done in different ways but
there is no much work on this area for comparative analysis of increasing and decreasing RTs. So, in
our thesis we aim to investigate the QoE estimation for increasing and decreasing RTs.
1.2 Motivation However, defining and measuring QoE is a challenge and involve interdisciplinary research. There are
many influencing factors that come on the way when QoE is discussed. The ITU-T recommendation
G.1010 [9] states the parameters and how they affect user perception with regards to RT and packet
loss. ITU-T recommendation G.1030 [1] provides the result in reference to subjective responses from
different type of users for RT while they are having access to web browsing sessions. According to
ITU-T recommendation G.1030 [1], it also has been meaningful to understand the user expectation
and the service which user received QoS. Likewise, in G.1010 [3] a relationship between packet loss
and QoE, on user perspective by using MOS has been studied in the context of voice application. The
research is going on the area related to user perceived experience, quality issues and its application.
To the best of our knowledge, there are no study that compares the variations in user experience
between increasing and decreasing RTs with different participants. So, this topic has been the main
motive towards this thesis.
The main objective of our thesis is to evaluate user satisfaction level between increasing and
decreasing RTs of web login page. User perception is judged according to the service utility, the usage
of service by users. This usage might be influenced by network performance. If the users get better
service, it motivates them to use the service in future, if not they might give up service because of bad
network behavior which reduces service utility. Excessive waiting times imply the risk of users
8
leaving service. Hence service utilization and service performance are strongly dependent on each
other in the context of users [11].
In this thesis, our aim is to find the variations in user satisfaction level between increasing and
decreasing RTs of web login page, how it is subjectively ranked by the users.
This thesis presents the variations on the changing user behavior at different RTs and discusses the
correlation of the subjective grading of the login page by the users with different RTs. The hypothesis
that has been used in our research is: “variation of user’s satisfaction level for increasing response time
which can’t be same as variations in decreasing response time”. The scope of the research is limited to
the study of variations in two cases, one for increasing and decreasing RTs. We are supposed to expect
the following results.
1. How does user’s satisfaction level between increasing and decreasing RTs become similar in a
web login?
2. How does users’ satisfaction level become different for increasing and decreasing RTs in a web
login?
The organization of this thesis is as follows: section 1 includes introduction part and section 2 explains
the technical terms that are used during this paper. Likewise, section 3 describes the methodology of
the study which also covers the data collection, section 4 analyses the data (qualitative and
quantitative) obtained from the interview. Section 5 presents the discussion of the data analysis.
Eventually, section 5 shows the conclusion of the thesis and future work.
9
2 Technical Background
2.1 Quality of Experience (QoE) The concept of QoE refers to the totality of end user experience of the delivered service [5]. We
present another definition by the International Telecommunication Union (ITU-T P:10/G.100)
recommendation for QoE: “The overall acceptability of an application or service, as perceived
subjectively by the end-user” [6]. As far as QoE is concerned, Pearson states as the “user satisfaction
is the sum of feeling or affective responses to distinguishable factors of the computer based
information products and service that are provided within the organization” [15].
Several studies have discussed and evaluated user perception of web page and its downloading times
as QoE [11, 25, and 26]. The users of the web login page might think that the page is compromised if
performance is bad and bad performance leads to loss of users [18].
The internet users are increasing in an exponential way [16]. Nevertheless, some studies have shown
that the current service to users is not satisfactory from the user’s perspectives [22, 23] and this
situation is likely to redundant in the near future [24].
Quality is considered as the measurement of user satisfaction, and must be kept in assessing network
efficiency [7]. The current internet users are the number of users which demonstrates the user
perceived QoE is more important than any technical mechanism used inside the network for any
technical purpose [1].
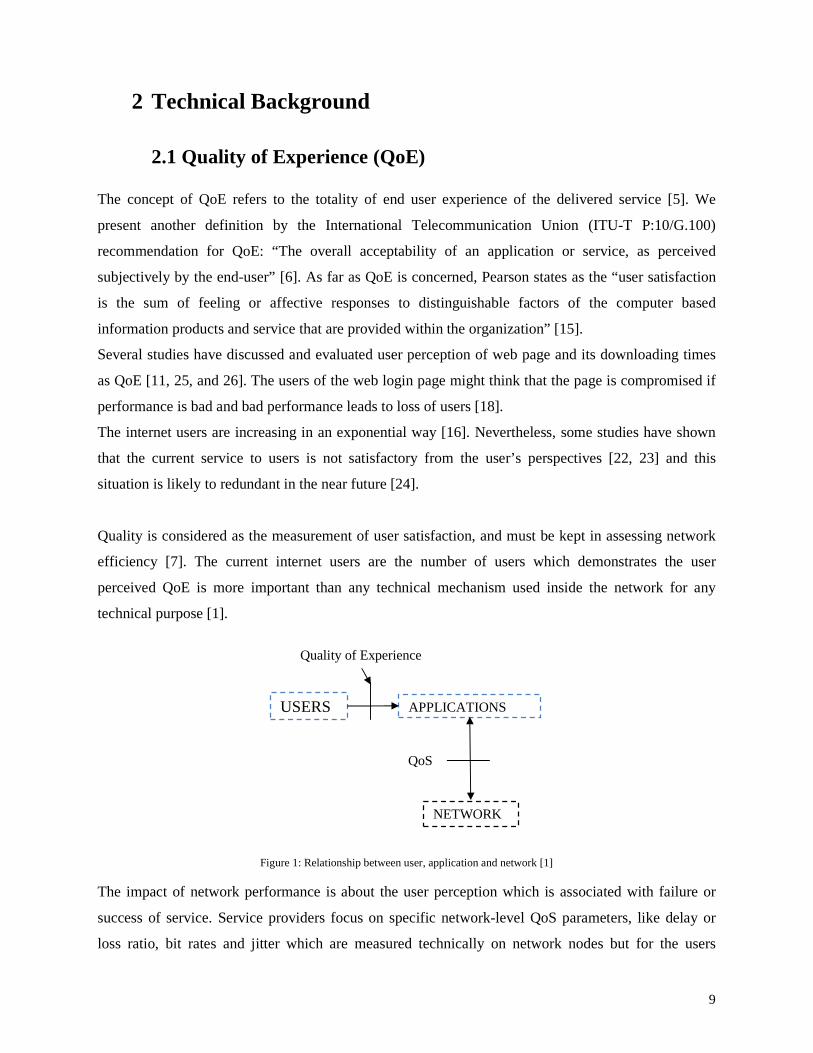
Figure 1: Relationship between user, application and network [1]
The impact of network performance is about the user perception which is associated with failure or
success of service. Service providers focus on specific network-level QoS parameters, like delay or
loss ratio, bit rates and jitter which are measured technically on network nodes but for the users
USERS APPLICATIONS
NETWORK
QoS
Quality of Experience
10
perception, service performance is perceived in more subjective and non-technical terms regardless of
network nodes and devices. The users prefer to acquire service in desired time, more precisely on
reasonable RT. This subjective perception of the users is usually termed as QoE.
In recent years, regardless of the any type of service, QoE is acquiring mindshare. It belongs to the
overall experience users have when accessing and using provided service. Maintaining quality is the
job of any service provider to match the quality level according to their user’s expectation. The
commonly-used metric used to quantify the quality of particular pieces of the multimedia content has
been MOS, as the relative measurement used for the comparative measure of quality [8]. Even though
there are some other methods as well to estimate the QoE, like e-model [12], instrumental metrics
(PESQ) [13] and also neural approach [14] but they all are used to estimate for voice and video.
Subjective assessment is performed to rank the quality of web login with the help of MOS. In general,
subjective measurement belongs to the human perceptual quality.
Studies have shown that users get less interested using service along with the increasing RT. A user
browsing a web page notices a couple of 100 ms delay , get bored after around 4 s and after 10 s the
risk of user leaving service becomes high [27].
2.2 PHP PHP stands for hypertext preprocessor and the main aspect is to construct web page creations. PHP
has established one of the most popular web scripting languages which have been installed on some 2
millions web servers, very short development times, platform independence and multiple data supports
[17]. PHP programming language is used to build web login page.
11
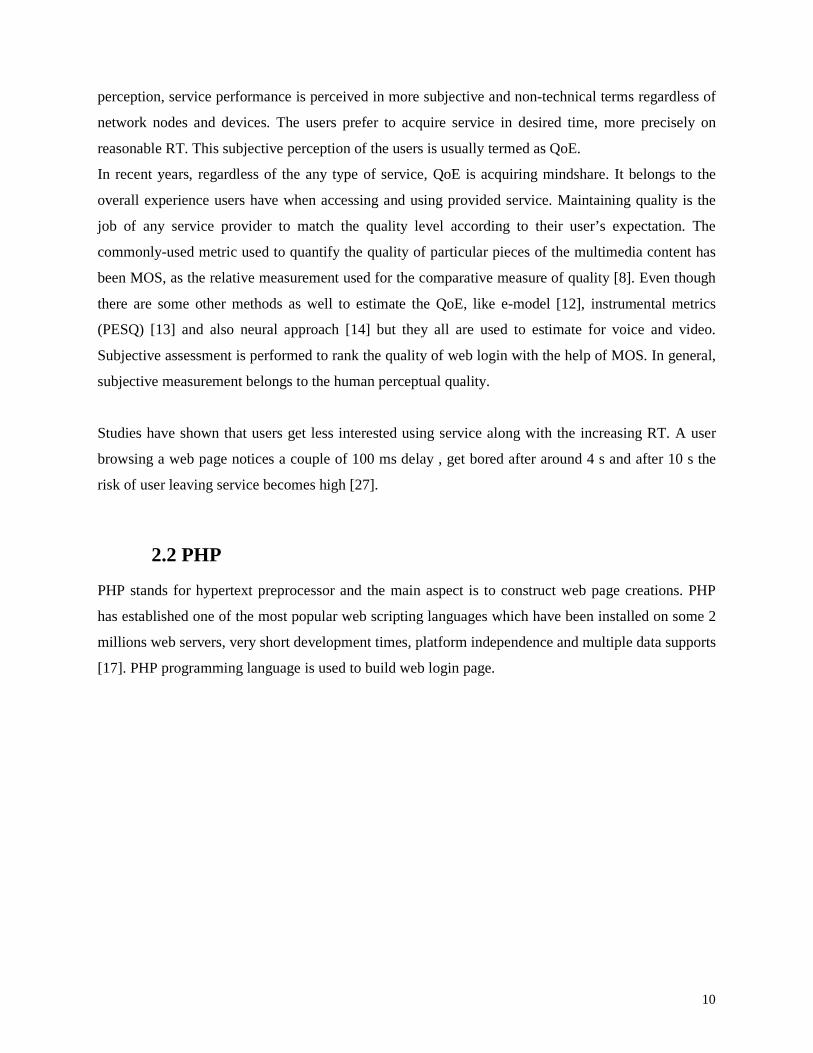
2.3 Web Login Page We created a web login page (constant user name and password) with time delay. The page used for the
experiments is shown below figure A. The delays that were added in the web login page were 0 s, 1 s, 4
s, 7 s, and 10 s.
Firefox was installed on the computer to record all details information of the time delay and web login
page loading. Then firebug gives all the RTs of the web login pages [20].
Figure 2: Web login page.
12
3 Methodology This study used the measurement of RTs and user rankings to evaluate user experience. The
experiments aimed to provide quantitative results on visiting web login page.
A web login page was used to find out the user satisfaction level, the QoE, with regards to the RT.
For a web login page, the QoE is mainly affected by the delay of logged into the page. The MOS, a
numeric value between 1 and 5 were used during interviews.
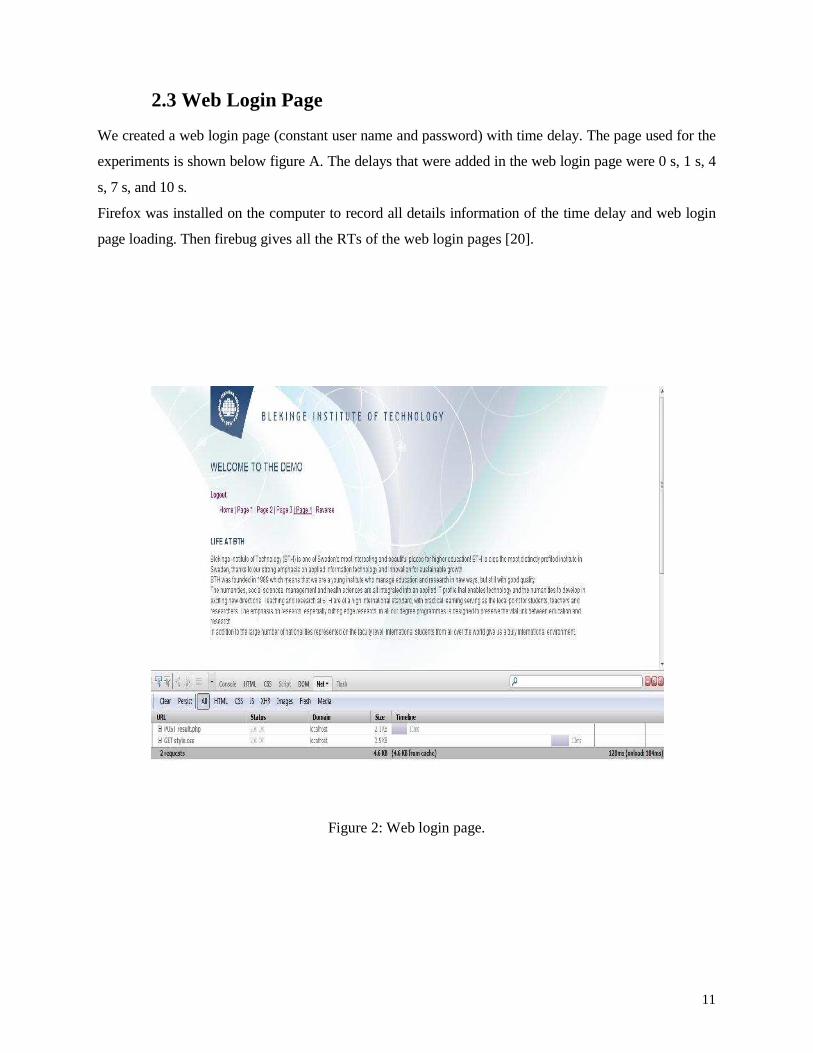
Table1: Interpretation of MOS grades [10].
MOS 1 2 3 4 5
Interpretation Bad Poor Fair Good Excellent
3.1 Quantitative Quantitative research is performed to compare and analyze the results obtained by conducting some
experiments, survey responses and interviews. By the following quantitative approach, it is better to
use quantitative approach rather than qualitative in order to compare variation of user satisfaction level
for increasing and decreasing RTs. By the following quantitative approach, exact numeric output
supports to compare our results in easy and systematic way [4].
For each delay, the time for starting and completing login page was recorded. From these, the total
time for completing page for each delay could be calculated, which is called the RT of the login page.
The RT for each delay is different for different pages. MOS is a mean value of the opinion scores
given by users. It has been applied in several studies before, amongst others to evaluate RT in a map
service [25], and to evaluate RTs of web pages [26]. Delay was generated on the web login page to
evaluate its QoE. The users rank the experience according to the MOS scale given in Table 1.
According to the MOS scale numeric values in between 1 and 5, representing 5 the best quality and 1
with the worst quality. Table1 is presented here recommended by the ITU [9].
13
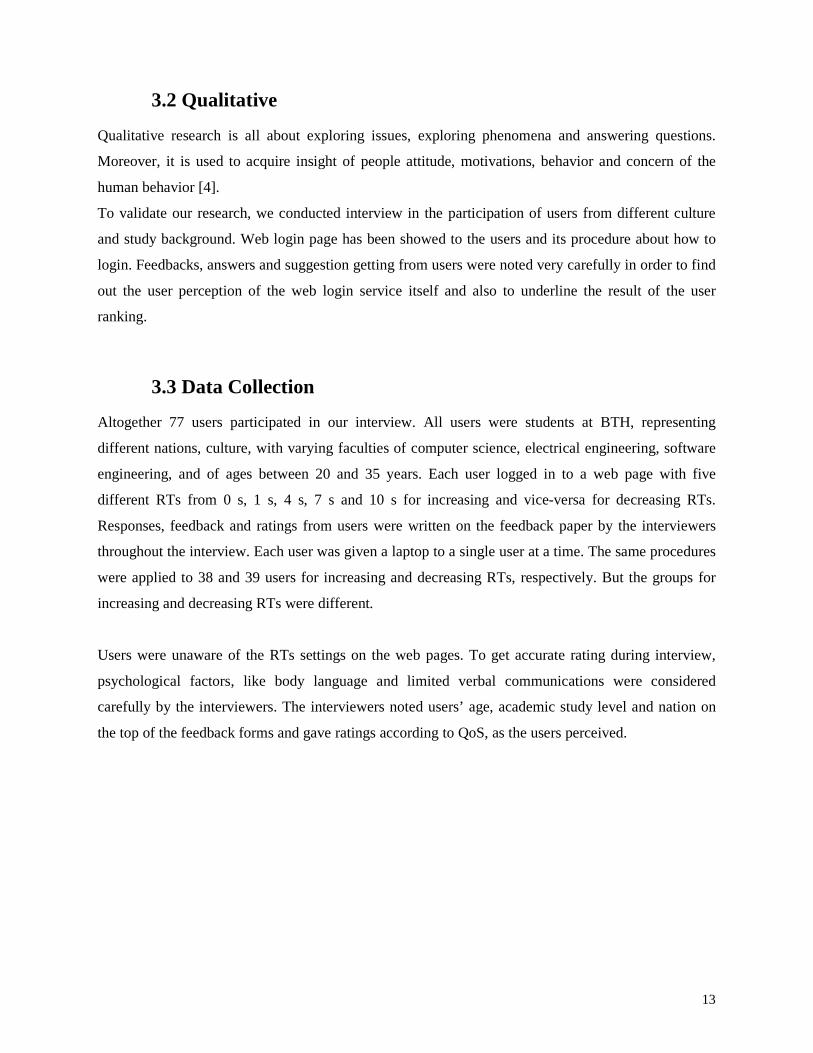
3.2 Qualitative Qualitative research is all about exploring issues, exploring phenomena and answering questions.
Moreover, it is used to acquire insight of people attitude, motivations, behavior and concern of the
human behavior [4].
To validate our research, we conducted interview in the participation of users from different culture
and study background. Web login page has been showed to the users and its procedure about how to
login. Feedbacks, answers and suggestion getting from users were noted very carefully in order to find
out the user perception of the web login service itself and also to underline the result of the user
ranking.
3.3 Data Collection Altogether 77 users participated in our interview. All users were students at BTH, representing
different nations, culture, with varying faculties of computer science, electrical engineering, software
engineering, and of ages between 20 and 35 years. Each user logged in to a web page with five
different RTs from 0 s, 1 s, 4 s, 7 s and 10 s for increasing and vice-versa for decreasing RTs.
Responses, feedback and ratings from users were written on the feedback paper by the interviewers
throughout the interview. Each user was given a laptop to a single user at a time. The same procedures
were applied to 38 and 39 users for increasing and decreasing RTs, respectively. But the groups for
increasing and decreasing RTs were different.
Users were unaware of the RTs settings on the web pages. To get accurate rating during interview,
psychological factors, like body language and limited verbal communications were considered
carefully by the interviewers. The interviewers noted users’ age, academic study level and nation on
the top of the feedback forms and gave ratings according to QoS, as the users perceived.
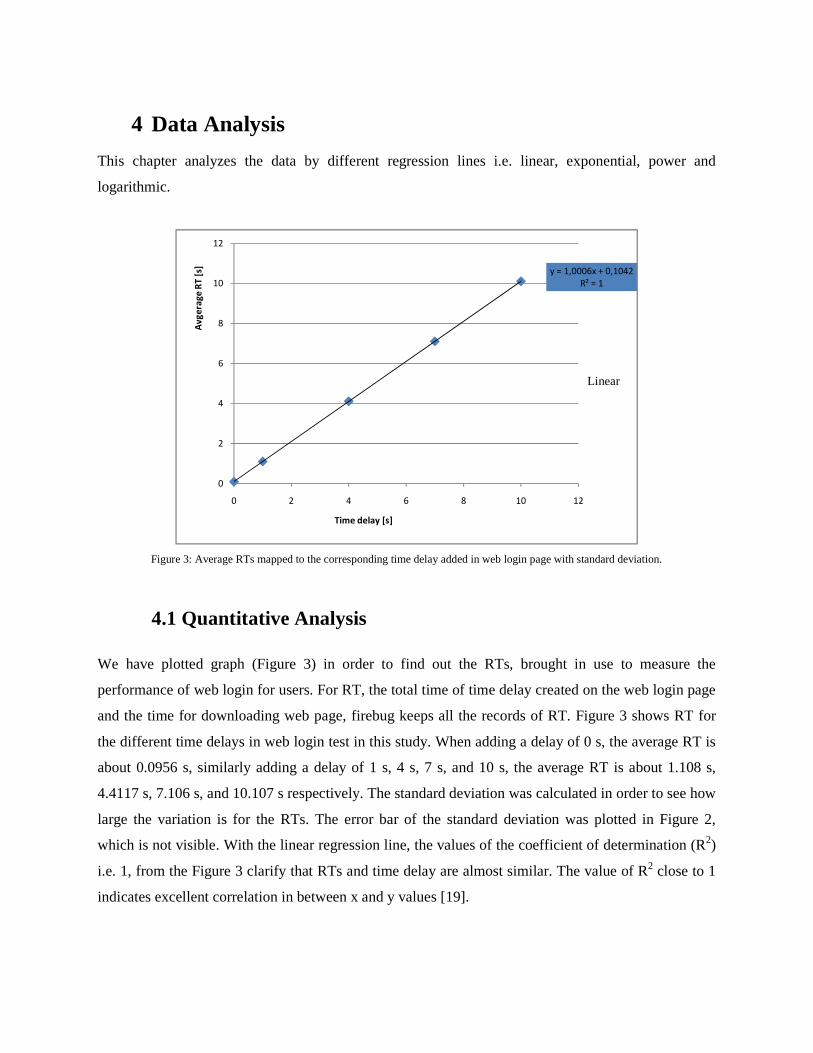
4 Data Analysis
This chapter analyzes the data by different regression lines i.e. linear, exponential, power and
logarithmic.
Figure 3: Average RTs mapped to the corresponding time delay added in web login page with standard deviation.
4.1 Quantitative Analysis
We have plotted graph (Figure 3) in order to find out the RTs, brought in use to measure the
performance of web login for users. For RT, the total time of time delay created on the web login page
and the time for downloading web page, firebug keeps all the records of RT. Figure 3 shows RT for
the different time delays in web login test in this study. When adding a delay of 0 s, the average RT is
about 0.0956 s, similarly adding a delay of 1 s, 4 s, 7 s, and 10 s, the average RT is about 1.108 s,
4.4117 s, 7.106 s, and 10.107 s respectively. The standard deviation was calculated in order to see how
large the variation is for the RTs. The error bar of the standard deviation was plotted in Figure 2,
which is not visible. With the linear regression line, the values of the coefficient of determination (R2)
i.e. 1, from the Figure 3 clarify that RTs and time delay are almost similar. The value of R2 close to 1
indicates excellent correlation in between x and y values [19].
y = 1,0006x + 0,1042
R² = 1
0
2
4
6
8
10
12
0 2 4 6 8 10 12
Av
ge
rag
e R
T [
s]
Time delay [s]
Linear
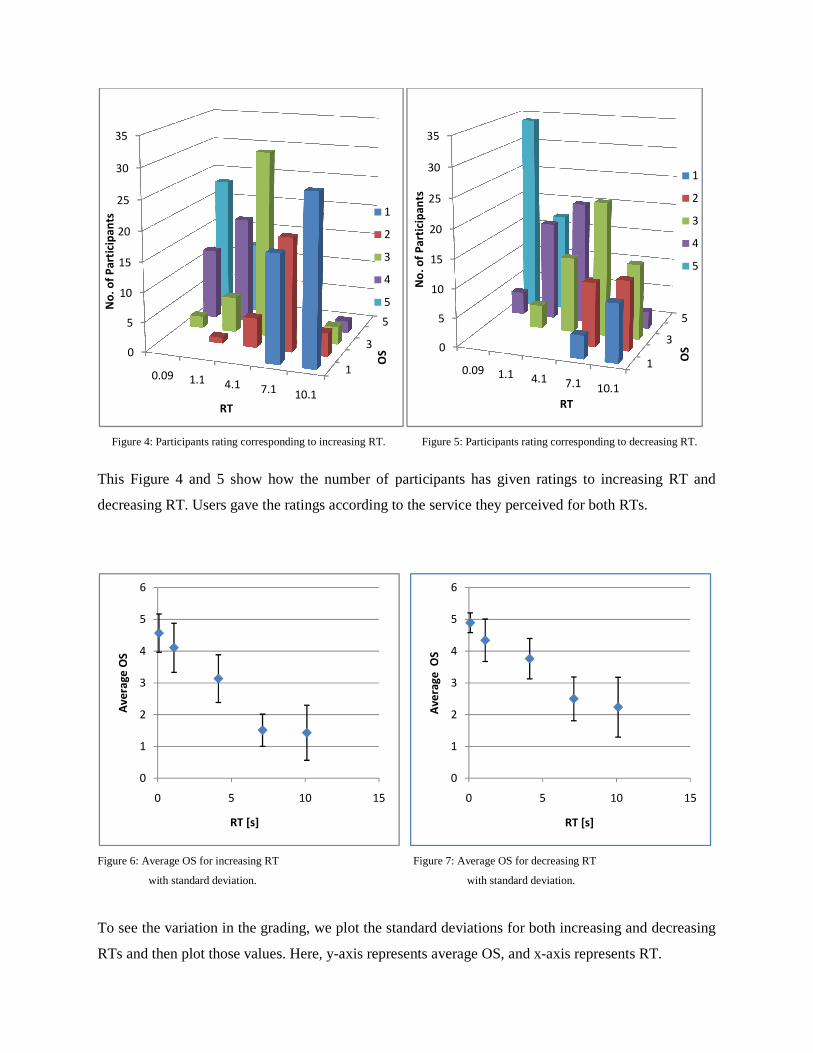
Figure 4: Participants rating corresponding to i
This Figure 4 and 5 show how the number of participants has given ratings to increasing RT and
decreasing RT. Users gave the ratings according to the
Figure 6: Average OS for increasing RT
with standard deviation.
To see the variation in the grading, we plot the standard deviations for both increasing and decreasing
RTs and then plot those values. Here, y
0
5
10
15
20
25
30
35
0.09 1.1 4.1 7.1 10.1
No
. o
f P
art
icip
an
ts
RT
0
1
2
3
4
5
6
0 5 10
Av
era
ge
OS
RT [s]
increasing RT. Figure 5: Participants rating corresponding to
This Figure 4 and 5 show how the number of participants has given ratings to increasing RT and
decreasing RT. Users gave the ratings according to the service they perceived for both RTs.
Figure 7: Average OS for decreasing RT
with standard deviation.
To see the variation in the grading, we plot the standard deviations for both increasing and decreasing
ere, y-axis represents average OS, and x-axis represents RT.
1
3
5
OS
1
2
3
4
5
0
5
10
15
20
25
30
35
0.09 1.1 4.1 7.1 10.1
No
. o
f P
art
icip
an
ts
RT
15
0
1
2
3
4
5
6
0 5
Av
era
ge
O
S
RT [s]
orresponding to decreasing RT.
This Figure 4 and 5 show how the number of participants has given ratings to increasing RT and
service they perceived for both RTs.
To see the variation in the grading, we plot the standard deviations for both increasing and decreasing
axis represents RT.
1
3
5
10.1
OS
1
2
3
4
5
10 15
16
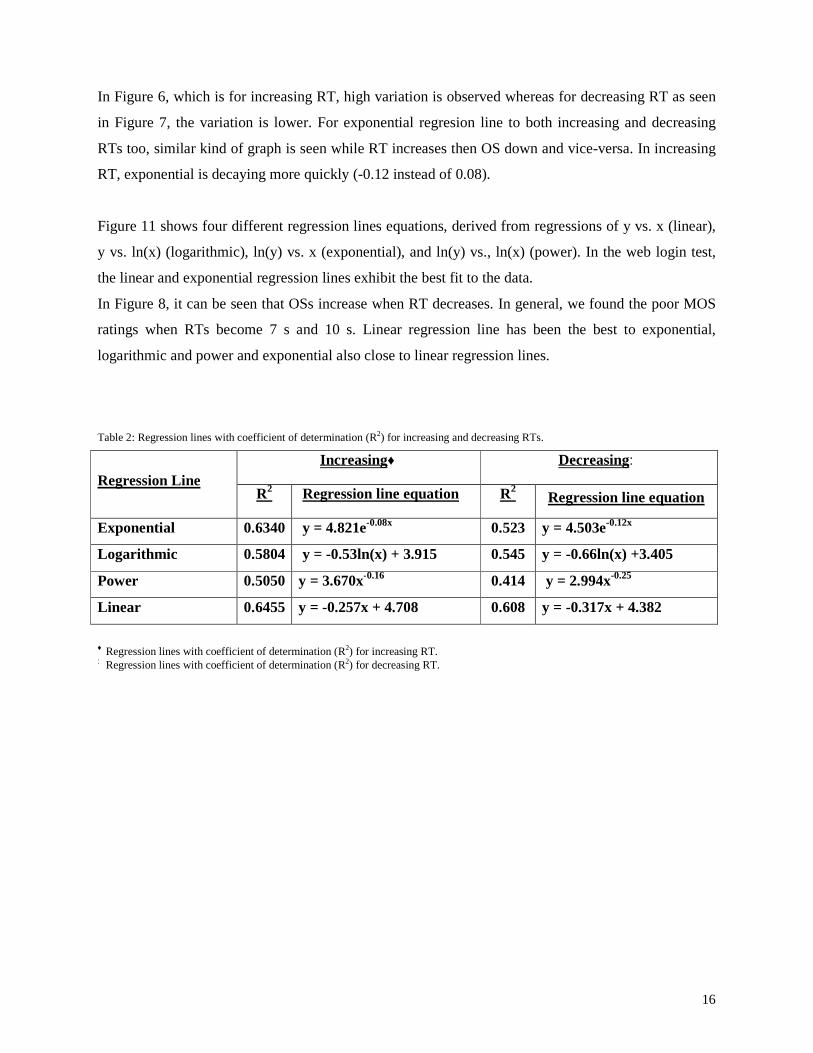
In Figure 6, which is for increasing RT, high variation is observed whereas for decreasing RT as seen
in Figure 7, the variation is lower. For exponential regresion line to both increasing and decreasing
RTs too, similar kind of graph is seen while RT increases then OS down and vice-versa. In increasing
RT, exponential is decaying more quickly (-0.12 instead of 0.08).
Figure 11 shows four different regression lines equations, derived from regressions of y vs. x (linear),
y vs. ln(x) (logarithmic), ln(y) vs. x (exponential), and ln(y) vs., ln(x) (power). In the web login test,
the linear and exponential regression lines exhibit the best fit to the data.
In Figure 8, it can be seen that OSs increase when RT decreases. In general, we found the poor MOS
ratings when RTs become 7 s and 10 s. Linear regression line has been the best to exponential,
logarithmic and power and exponential also close to linear regression lines.
Table 2: Regression lines with coefficient of determination (R2) for increasing and decreasing RTs.
Regression Line Increasing♦ Decreasing♣
R2 Regression line equation R2 Regression line equation
Exponential 0.6340 y = 4.821e-0.08x 0.523 y = 4.503e-0.12x
Logarithmic 0.5804 y = -0.53ln(x) + 3.915 0.545 y = -0.66ln(x) +3.405
Power 0.5050 y = 3.670x-0.16 0.414 y = 2.994x-0.25
Linear 0.6455 y = -0.257x + 4.708 0.608 y = -0.317x + 4.382
♦ Regression lines with coefficient of determination (R2) for increasing RT. ♣ Regression lines with coefficient of determination (R2) for decreasing RT.
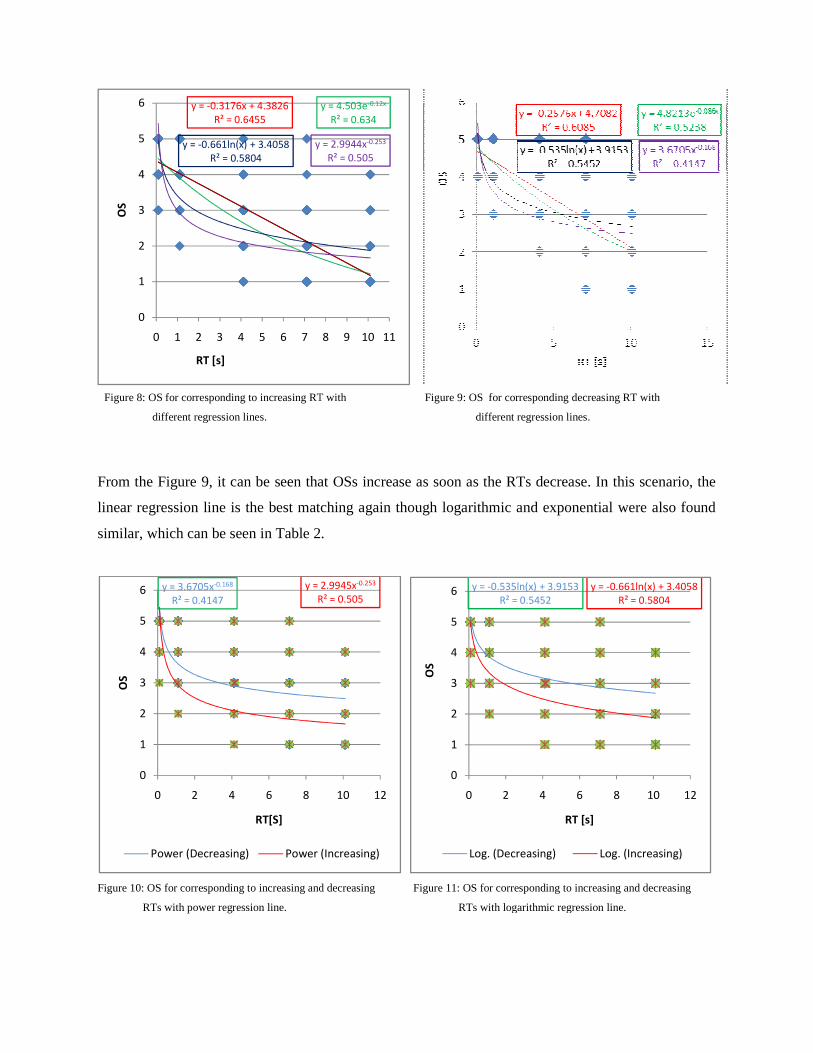
Figure 8: OS for corresponding to increasing RT with
different regression lines.
From the Figure 9, it can be seen that OSs increa
linear regression line is the best matching again though logarithmic and exponential were also found
similar, which can be seen in Table 2
Figure 10: OS for corresponding to increasing and decreasing
RTs with power regression line.
y = 3.6705x-0.168
R² = 0.4147
y = 2.9945x
R² = 0.505
0
1
2
3
4
5
6
0 2 4 6 8
OS
RT[S]
Power (Decreasing) Power (Increasing)
y = -0.3176x + 4.3826
R² = 0.6455
y = -0.661ln(x) + 3.4058
R² = 0.5804
y = 2.9944x
0
1
2
3
4
5
6
0 1 2 3 4 5 6 7
OS
RT [s]
increasing RT with Figure 9: OS for corresponding decreasing RT with
different regression lines.
, it can be seen that OSs increase as soon as the RTs decrease. In this scenario, the
linear regression line is the best matching again though logarithmic and exponential were also found
ar, which can be seen in Table 2.
: OS for corresponding to increasing and decreasing Figure 11: OS for corresponding to increasing and decreasing
RTs with logarithmic regression line.
y = 2.9945x-0.253
R² = 0.505
10 12
Power (Increasing)
y = -0.535ln(x) + 3.9153
R² = 0.5452
y = -
0
1
2
3
4
5
6
0 2 4 6
OS
RT [s]
Log. (Decreasing) Log. (Increasing)
y = 4.503e-0.12x
R² = 0.634
y = 2.9944x-0.253
R² = 0.505
8 9 10 11
corresponding decreasing RT with
In this scenario, the
linear regression line is the best matching again though logarithmic and exponential were also found
ncreasing and decreasing
RTs with logarithmic regression line.
-0.661ln(x) + 3.4058
R² = 0.5804
8 10 12
Log. (Increasing)
18
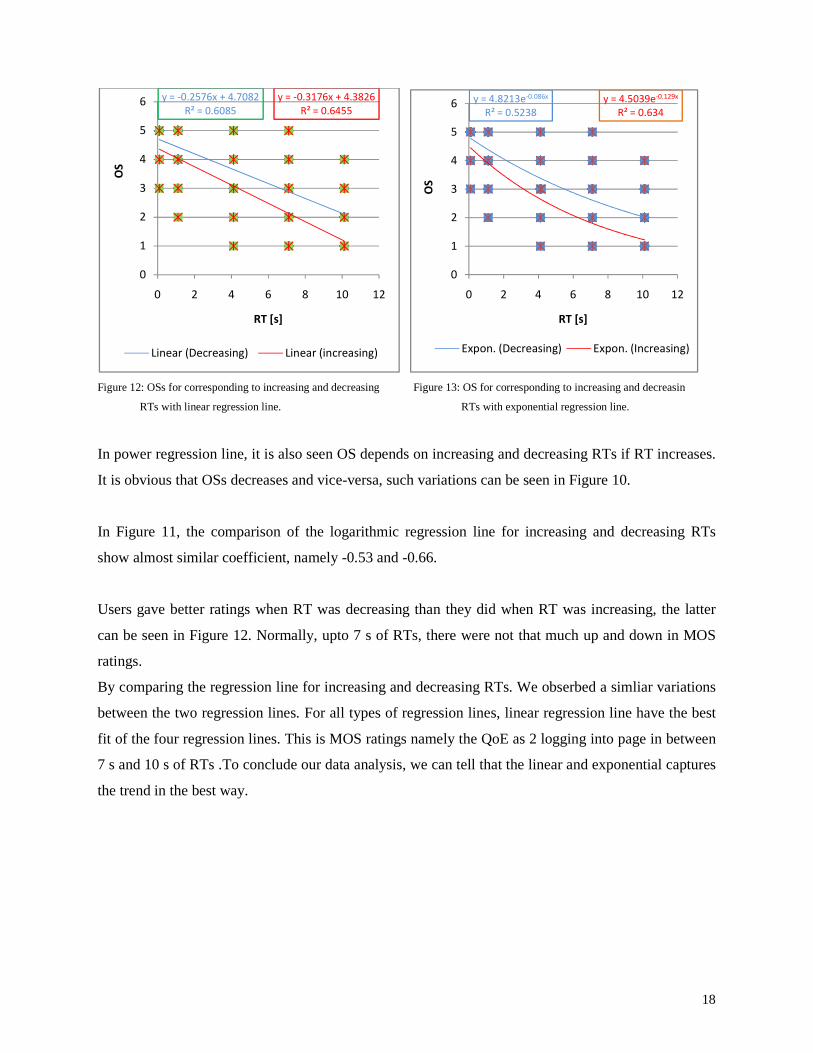
Figure 12: OSs for corresponding to increasing and decreasing
RTs with linear regression line.
Figure 13: OS for corresponding to increasing and decreasin
RTs with exponential regression line.
In power regression line, it is also seen OS depends on increasing and decreasing RTs if RT increases.
It is obvious that OSs decreases and vice-versa, such variations can be seen in Figure 10.
In Figure 11, the comparison of the logarithmic regression line for increasing and decreasing RTs
show almost similar coefficient, namely -0.53 and -0.66.
Users gave better ratings when RT was decreasing than they did when RT was increasing, the latter
can be seen in Figure 12. Normally, upto 7 s of RTs, there were not that much up and down in MOS
ratings.
By comparing the regression line for increasing and decreasing RTs. We obserbed a simliar variations
between the two regression lines. For all types of regression lines, linear regression line have the best
fit of the four regression lines. This is MOS ratings namely the QoE as 2 logging into page in between
7 s and 10 s of RTs .To conclude our data analysis, we can tell that the linear and exponential captures
the trend in the best way.
y = -0.2576x + 4.7082
R² = 0.6085
y = -0.3176x + 4.3826
R² = 0.6455
0
1
2
3
4
5
6
0 2 4 6 8 10 12
OS
RT [s]
Linear (Decreasing) Linear (increasing)
y = 4.8213e-0.086x
R² = 0.5238
y = 4.5039e-0.129x
R² = 0.634
0
1
2
3
4
5
6
0 2 4 6 8 10 12
OS
RT [s]
Expon. (Decreasing) Expon. (Increasing)
19
4.2 Qualitative Analysis
Though our thesis is based on a quantitative research methodology. But the qualitative results during
the interviews are presented here, which play an important role in the results. Surprisingly, many of
the users were united in one point that they were happy user perceived of web login page of low RTs
between 0 s and 4 s, for both increasing and decreasing RTs.
The results were a bit different between the users, like one user said about RT of web login page “I
found all RTs similar, it did not feel me like it is too fast or too slow”. Some users graded 5 even for
RTs of 7 s and 10 s due to their previous experience of slow downloading web pages.
20
5 Discussion
After analyzing all data and visualizing them as regression lines. The linear and exponential function
had the best fit, both with good correlation as seen in the previous chapter. As seen in Figure 11, there
are two different linear regression lines, which are neither overlapped nor intersected at any point. It
clearly indicates that the users’ satisfaction level is not the same for both increasing and decreasing
RTs. The null hypothesis of the thesis suggests that the satisfaction level of users between increasing
and decreasing RTs is same while logging into the webpage. In order for this hypothesis to be valid,
the linear regression lines for increasing and decreasing RTs have been very close to each other which
is not the case in Figure 11. Hence, the first expected outcome is failed.
The Figure 12 shows a linear regression line for decreasing RT is slightly higher than that for
increasing RT. Both lines are regressing from a high grade of OS to a low grade of OS when the RT is
increasing. This verifies that while RT is decreasing, the satisfaction level of users is increasing and
while RT is increasing for web login, the satisfaction level of users decreasing. This fact supports the
second expected outcome and makes it valid.
The result of this study can also be compared to the results of previous studies, such as [18, 20]. This
study indicates a threshold of 10 s was perceived the delay to be unacceptable by the number of
significant number of users. The users lost their attention at 10 s delay.
The results from the user experiment establish a direct relationship between the performance of the
web login page and the corresponding user ranking. This helps to understand the network performance
i.e. expected user ranking of web login page can be directly matched to QoE. However, there are
parameters that should be considered, as for example not only RTs and user satisfaction level but also
parameters which influence the user expectations, like the users different kind of previous background.
By analyzing all data for both experiments, it is found that during the web login, RT that the users
experienced previously influenced the users’ present ratings. When we conducted first experiment
with increasing RT, the ratings for 0 s and 1 s delays were almost similar. It started decreasing a bit
more than expected for 4 s delay and followed tremendously for 7 s and 10 s delay time. We get worst
rating for 10 s delay for increasing RT in web login. But the RT for web login, ratings were slightly
higher as compare to increasing RT. Even for 7 s delay, ratings were 3 which means fair. When user
experienced the better quality for the first time they expect it to be best next time around but even if
quality decreases slightly which are beyond their expectations that ends up with bad experience. When
21
user experienced a bad quality i.e. high RT while logging into the web page, they don’t expect a lot
next time and a bit decreases in RT which makes them more satisfied as compare to first one. This is
how the previously experienced RTs can influence the present result.
During this work, we also have found that could be perhaps interesting, regardless of the type of
device, network access for used, given content, each person has some expectations. The level of
expectation varies among users, depending on the factors such as the money they spent for the service,
type of content being requested for using. If the users pay for the service they get, of course they
possibly expect better performance but if users get service in free then they don’t expect good
performance despite of experiencing higher RT i.e. bad quality [21].
Both graphs (Figure 10 and Figure 11) show the results between QoE (OS) and RTs (increasing and
decreasing). The user grading decreases continuously with increasing RTs on the login page. This tells
that the user experience is correctly predicted by observing approximated RTs ratio on the network.
The average is very good for 0 s and 1 s in both cases, users start ranking the QoE as 5 and 4 in most
cases and approaches poor while the RTs increases above 4 s. There is no variation for 0 s and 1 s of
both RTs showing the consistency in grading. After that, QoE varies randomly for other RTs which
results in increasing the gap between two linear regression lines. The latter implies that the service
provider should be careful when RTs start growing larger than 7 s.
22
6 Conclusion and Future Work This thesis presents the quantitative study of QoE, expressed in OS and QoS, expressed in increasing
and decreasing RTs on web login page. After doing user experiment, we came to the conclusion that
there is difference on users’ perceived quality while logging into the web pages for increasing and
decreasing RTs.
We have proven that the user’s satisfaction level is not the same for increasing and decreasing
RTs while logging into the web page. Our result shows the fact that satisfaction level of user’s
increases while RT decreases and vice-versa. The achieved OS were plotted corresponding to RT.
Exponential, logarithm, power and linear regression lines were plotted to find the best suited
regression to compare the results. We found linear and exponential regressions as best suited for both
increasing and decreasing RTs by comparing coefficient of determination R2 [19].
The main purpose of this thesis was to verify the fact that even after fixing the steady RT for each web
login pages, when different users login to the same page for increasing and decreasing RTs then their
satisfaction level vary each other. The results which we obtained from the interview follows the
previous studies such as [21, 18] and some more similar studies [11], however with different
parameters and time constants. Increasing and decreasing RTs found to be unacceptable of 10 s delay
at which number of significant users lost their patience on web login page. We experienced that the
duration of web login page with users notify that the RT accessibility changes over users expectation,
environment and time. That’s why, we got some variations in the results as well.
In decreasing RTs, user’s satisfaction level went up from lower quality to higher quality
whereas in increasing RTs, user’s satisfaction level went down from higher to lower quality. If the
service provider provides better service in the beginning but later on becoming worse then users get
frustrated and might leave to continue service as well but if the service provider provides the service
from lower to higher quality, users become more happier and continue service longer. RTs influence
the result, in simple words, whether to continue service or not. So, from service provider point of
view, we can tell that it’s better to face decreasing rather than increasing RTs for any users and has to
address the level of quality according to their user’s expectations. By observing our results, service
provider can deliver service according to the user’s perceived QoE value offered in web login page.
Then service provider should continuously monitor to maintain user’s satisfaction level by addressing
network challenge on time. Such type of estimation on QoE helps to rectify the performance problems
and timely work to meet user needs.
There can be further research on the same topic for random time delay. Nowadays, more users
perceived QoE experiments are being carried out over network traffic but further work is needed to
improve to user-level QoS issues for better network performance.
23
7 REFERENCES
[1] Kilkki K., Quality of Experience in Communication Ecosystem, Journal of Universal Computer
Science, Vol. 14, Page 5, 2008.
[2] Simoens P., et al, Towards Automatic Access Networks for Service QoE optimization.
http://biblio.ugent.be/input/download?func=downloadFile&fileOId=576890.
[3] International Telecommunication Union (2001). ITU-T Recommendation G.1010: end-user
multimedia QoS categories.
[4] Creswell J W., Research design: Qualitative, Quantitative and mixed methods approaches, Sage
Publication Inc, 2009.
[5] Reichl P, From “Quality-of-Service” and “Quality-of-Design” to “Quality-of-Experience”: A
Holistic View on Future Interactive Telecommunication Services. In Software
Telecommunications and Computer Networks, 2007.
[6] ITU-T Recommendation P.10/G.100 (2006)/Amendment 2 (07/2008). Vocabulary for
performance and Quality of Service. Amendment 2: New definitions for inclusion in
Recommendation P.10/G.100.
[7] Keller J.J., “Ex-MFs managers plan to build global network based on Internet,” Wall Street
Journal. January 20, 1998.
[8] http://www.dialogic.com/products/docs/whitepapers/11681-qoe-mobile-video-wp.pdf.
[Cited 2011-05-18].
[9] International Telecommunication Union, Subjective video quality assessment methods for
multimedia applications, Rec. ITU-T P.910, Sept, 1999.
[10] ITU-T Recommendation P.910: Subjective Video Quality assessment Methods for multimedia
application, Geneva, Switzerland, 1996.
24
[11] Shaikh J, Fiedler M, and Collange D: Quality of Experience from user and network perspectives.
In Annals of Telecommunications: Quality of Experience -1 Metrics and Performance
Evaluation, Vol 65, issue 1-2, January/February, 2010.
[12] ITU-T Recommendation G.107 (2000): The E-model, a computational model for use in
transmission planning.
[13] ITU-T Recommendation P.862 (2001), Perceptual evaluation of speech quality (PESQ): An
objective method for end- to- end speech quality assessment of narrow-band telephone networks
and speech codes.
[14] Rubino G., Quantifying the Quality of Audio and Video transmission over the internet: the
PSQA approach. In J. Barria (ed), Design and Operations of Communications and Network,
Imperial College Press, 2005.
[15] Bailey J.E., and Pearson S.W., “Measurement of Computer User Satisfaction”, 1977 (Pearson.
S.W, “Measurement of Computer User Satisfaction”, Unpublished PhD dissertation, Arizona
State University, 1977).
[16] Mackie-Mason J. K., and Varian H., “Economic FAQs about the Internet”. In McKnight, L.W.,
and Bailey, J.P. (eds.) Internet Economics, MIT press, 1997.
[17] Atkinson L., Using PHP to build Dynamic Websites, Prentice Hall PTR, August 03, 2000.
[18] Bhatti N., Bouch A., Kuchinsky A., Integrating User-perceived Quality into Web Server Design,
Internet Systems and Applications Laboratory HP Laboratories Palo Alto HPL-2000-3, January,
2000.
[19] Jain R., The Art of the Computer Systems Performance Analysis, John Wiley and Sons, 1991.
[20] Add-ons for Firefox. Firebug Version History (Version 1.2.0b6) by Joe Hewitt, et al:
https://addons.mozilla.org/en-US/firefox/addons/versions/1843#version-1.2.0b6 [online] [Cited
2010-04-02].
25
[21] Lorentzen C., Fiedler M., Johnson H., Shaikh J., and Jørstad I., On User Perception of Web
Login-A Study on QoE in the Context of Security. In Proceedings of Australasian
Telecommunication Networks and Applications Conference, Auckland, New Zealand,
November, 2010.
[22] “Network Reliability Steering Committee”, Annual Report, 1998.
http://www.nric.org.
[23] Cullinane P., “Ready, set, crash.”Telephony 3, (Nov 1998).
[24] Berst J., “Bandwidth progress report”. http://www.zdnet.com/anchordesk/story/story_1384.html.
[25] Eriksen S, Eliasson C, Fiedler M, Chevul S and Ekelin S: Mapping service quality comparing
quality of experience and quality of service for internet-based map services. In proceedings of
the 30th Information Systems Research Seminar in Scandinavia (IRIS), Finland, August, 2007.
[26] Fiedler M, Hoßfeld T, and Tran-Gia P: A generic Quantitative Relationship between Quality of
Experience and Quality of Service. IEEE Network Special Issue on Improving QoE for Network
Service, March, 2010.
[27] Fiedler M., ed. Euro NGI Deliverable D.WP.JRA.6.1.1: State-of-the art with regards to user-
perceived Quality of Service and quality feedback.
May 2004. http://www.eurongi.org [online] [cited 2010-05-31].

![[MS-QoE]: Quality of Experience Monitoring Server ProtocolMS-QoE]-180828.pdf · 1 / 176 [MS-QoE] - v20180828 Quality of Experience Monitoring Server Protocol Copyright © 2018 Microsoft](https://img.pdfslide.net/doc/110x75/5e79f5bbeb0b920b1f313c68/ms-qoe-quality-of-experience-monitoring-server-protocol-ms-qoe-180828pdf.jpg)


![JSTSP SPECIAL ISSUE ON ”MEASURING QOE FOR …and the notion of optimising an overall experience, more recent work has defined QoE in the context of a multisensory experience [3],](https://img.pdfslide.net/doc/110x75/601903fb161574026d453253/jstsp-special-issue-on-ameasuring-qoe-for-and-the-notion-of-optimising-an-overall.jpg)


![[MS-QoE]: Quality of Experience Monitoring Server Protocol · 2016-06-23 · [MS-QoE]: Quality of Experience Monitoring Server Protocol Intellectual Property Rights Notice for Open](https://img.pdfslide.net/doc/110x75/5e79f6d5ec993d79273efe03/ms-qoe-quality-of-experience-monitoring-server-protocol-2016-06-23-ms-qoe.jpg)


![QoE Assessment of Fairness between Players in Networked ... · investigating effects of the senses on Quality of Experience (QoE) [11] by dealing with a variety of multisensory communications](https://img.pdfslide.net/doc/110x75/5ff5e340c0b5715b52771964/qoe-assessment-of-fairness-between-players-in-networked-investigating-effects.jpg)


![[MS-QoE]: Quality of Experience Monitoring Server Protocol](https://img.pdfslide.net/doc/110x75/62004d87bc706c159a58df4a/ms-qoe-quality-of-experience-monitoring-server-protocol.jpg)