Embed Size (px)
Citation preview
A Random Walk Down Wall Street:
The Time-Tested Strategy for Successful Investing by Burton G. Malkiel
Chapter 6: Technical Analysis and the Random-Walk Theory
Ahmet Kadir Tunsay 113613
Abigaelle D. Kenmogne
Technical Analysis and The Random Walk Theory
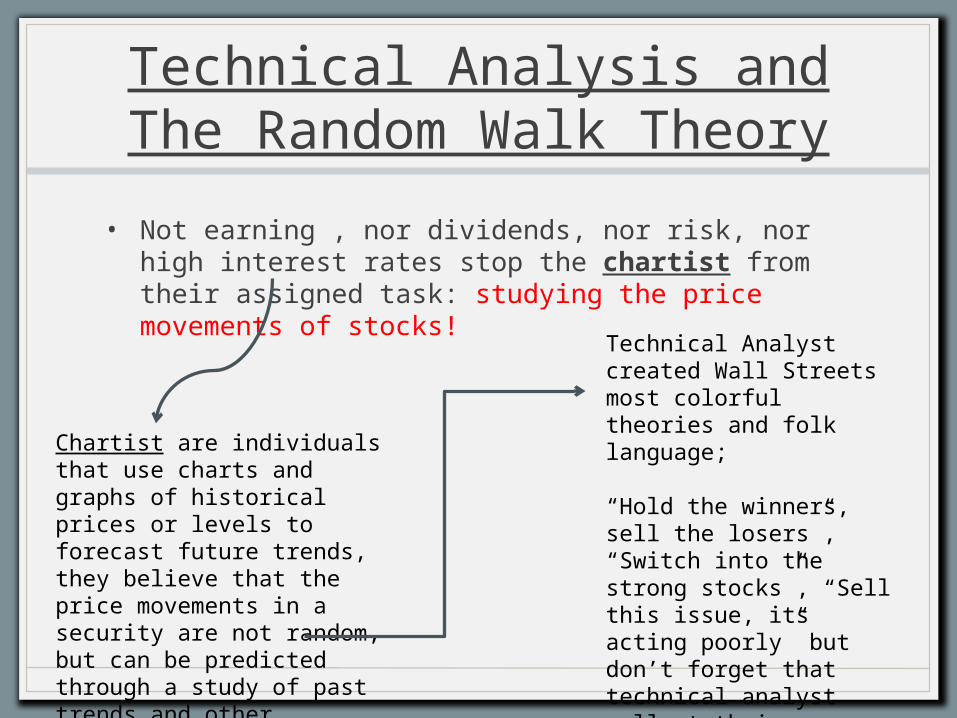
• Not earning , nor dividends, nor risk, nor high interest rates stop the chartist from their assigned task: studying the price movements of stocks!
Chartist are individuals that use charts and graphs of historical prices or levels to forecast future trends, they believe that the price movements in a security are not random, but can be predicted through a study of past trends and other technical analysis.
Technical Analyst created Wall Streets most colorful theories and folk language;
“Hold the winners, sell the losers”, “Switch into the strong stocks”, “Sell this issue, its acting poorly” but don’t forget that technical analyst collect their brokerage fees for churning your account.

Who are the Technical Analysts ?
• Technical Analyst observe patterns of the stock market by using graphs and charts of historical data to make predictions about its future performance.
• They build there strategies upon dreams of castles in the air (extravagant hopes and plans) and expect their tools to tell them which castle is being built and how to get in on the ground floor.
• The question is: Does technical analysis work?
If you’re so smart, why aren't you rich?
• According to Burton G. Malkiel he has never known a successful technician that follows his own technical advice, but seen several unsuccessful ones.
• Broke Technician:
They are never apologetic. You ask them;
Why are you broke?
Answer: I didn’t believe my own chart?!
Technical analysis is strongly disliked by the academic world. Why?
1. After paying transaction costs, the method does not do better than a “buy and hold” strategy for investors.
2. Its easy to pick on!
It is easy to test all technical trading rules on the computer, it has become a favorite pastime for academics to see if they really work.
P.S. We are trying to save your money!

Is there momentum in the stock market?
• In finance, momentum is the empirically observed tendency for rising asset prices to rise further, and falling prices to keep falling.
Chartists (Technicians):
• They believe momentum exists in the market and that there are repeatable patterns in space and time. (Basic premise)
Economist (Mathematicians):
• They believe that stock prices behave very much like random walk.
• Why?
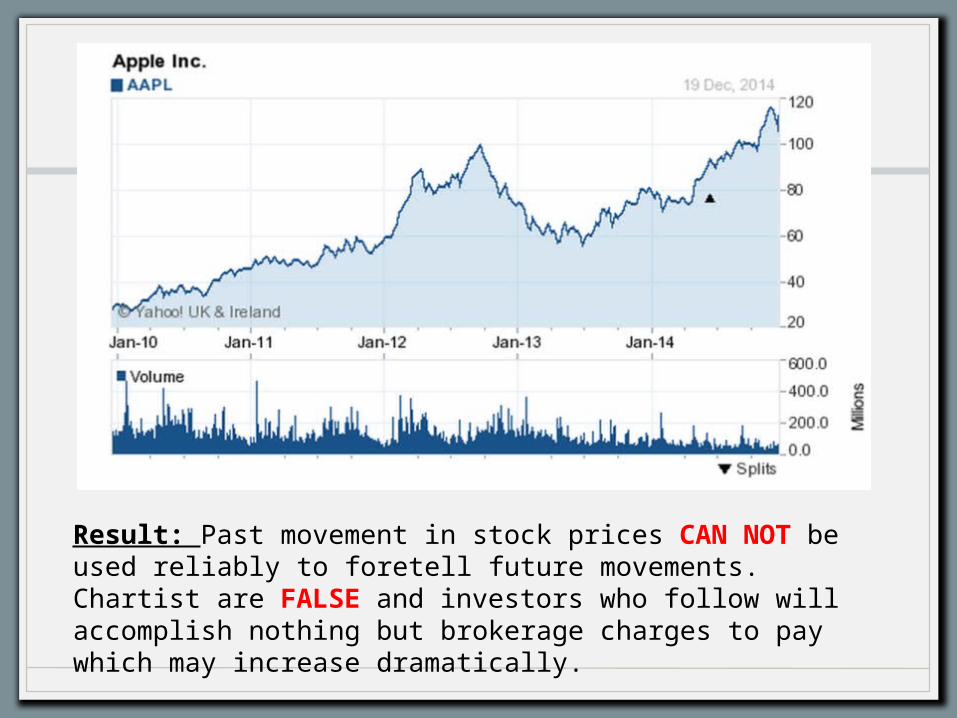
Result: Past movement in stock prices CAN NOT be used reliably to foretell future movements. Chartist are FALSE and investors who follow will accomplish nothing but brokerage charges to pay which may increase dramatically.
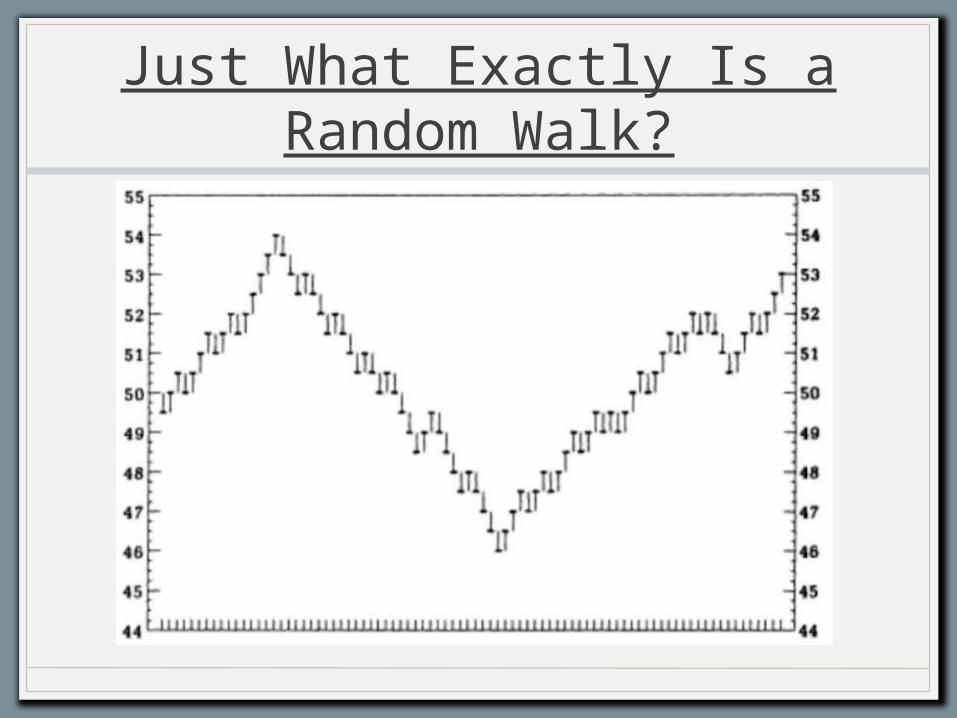
Just What Exactly Is a Random Walk?

Mathematicians:• They call a sequence of numbers produced by a random
process a random walk. The next move on a chart is completely unpredictable on the basis of what has happened before.
• To a mathematician, the sequence of numbers recorded on a stock chart behaves no differently from that in the simulated stock charts with one clear exception. There is a long-run uptrend in most averages of stock prices in line with the long-run growth of earnings and dividends. After adjusting for this trend, there is very little difference. The next move in a series of stock prices is largely unpredictable on the basis of past price behavior. No matter what wiggle or wobble the prices have made in the past, tomorrow starts out roughly fifty-fifty. The next price change is no more predictable than the flip of a coin.

Some More Elaborate Technical Systems
• The Filter System: (Percentage Changes in price)
A stock that has reached a low point and has moved up, say 5% is said to be in an uptrend and a stock at peak and moved down 5% is a downtrend.
Buy a stock when moved up 5% from low point and hold until the price moves down 5% from a subsequent high, and then sell.
Very popular with brokers. Filter method is basically “stop loss” where the client is advised to sell his stock if it falls 5% below the purchase price to “limit his potential losses”.
The Dow Theory:
• A theory which says that the market is in upward trend if one of its averages advances above a previous peak so we should buy, and sell when it sinks through the preceding valley.
• The markets performance after sell signals is no different from its performance after buy signals. This is why there is no significance for predicting future price movements.
• Transaction cost/brokerage cost may be extremely high.
The Relative-Strength System:
• In the relative-strength system an investor buys and holds those stocks that are acting well, that is, outperforming the general market indices ( S&P 500) in the recent past. Conversely, the stocks that are acting poorly relative to the market should be avoided or, perhaps, even sold short.
• Nevertheless, a computer test of relative-strength rules over a twenty-five-year period suggests that such rules do not, after accounting for brokerage charges, outperform the buy-and-hold investment strategy.
Price-Volume Strategy:
• Suggest that when a stock rises on large or increasing volume, there is an unsatisfied excess of buying interest and the stock can be expected to continue its rise.
• When a stock price drops on large volume, selling pressure is indicated and a sell signal is given.
• The buy and sell signals generated by the strategy contain no information useful for predicting future price movements.
• The investor is obliged to do a great deal of in and out trading leading to a lot of transaction cost. A diversified group of stocks would be better.

Reading-Chart Patterns:
Head & Shoulders Pattern
Cup & Handle Pattern

A Gaggle of Other Technical Theories to Help You Lose
Money• Once the academic world polished off most of the
standard technical trading rules, it turned its august attention toward some of the more fanciful schemes.
• The world of financial analysis would be much quieter and duller without the chartists, as the following techniques amply demonstrate.
• The 3 Techniques;
1. The Hemline Indicator
2. The Super bowl Indicator
3. The Odd Lot theory

The Hemline Indicator
• Not content with price movements, some technical analysts have broadened their investigations to include other movements as well.
• One of the most charming of these schemes has been called by Ira Cobleigh the "bull markets and bare knees" theory.
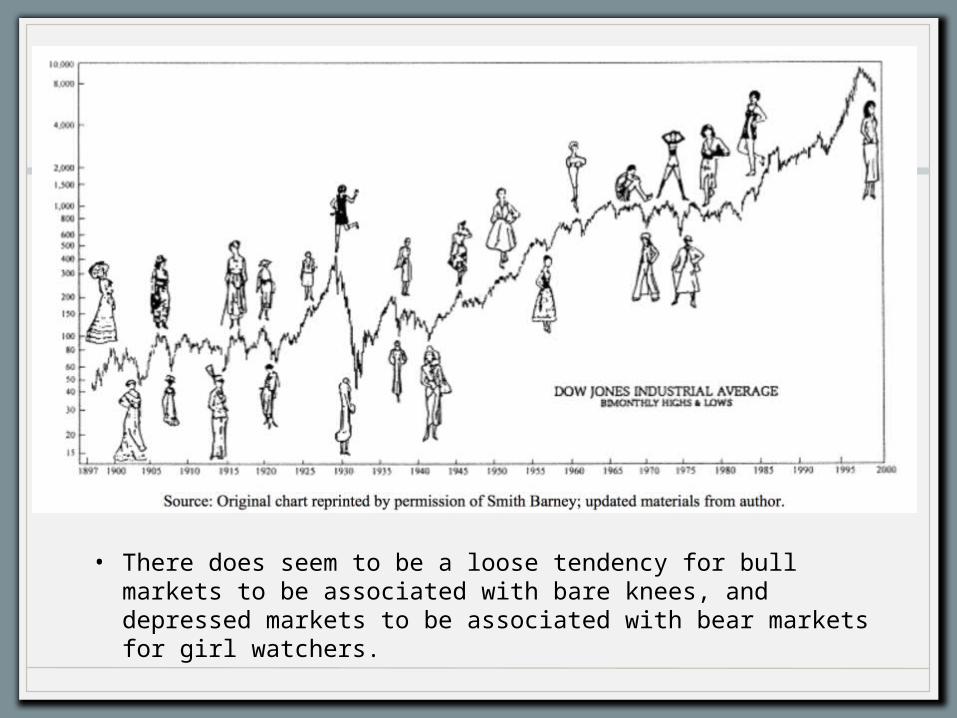
• There does seem to be a loose tendency for bull markets to be associated with bare knees, and depressed markets to be associated with bear markets for girl watchers.
The Super Bowl Indicator
• The Super Bowl indicator forecasts how the stock market will perform based on which team wins the Super Bowl.
• A victory by an NFL team predicts a bull market in stocks, whereas a victory by a former AFL team is bad news for stock-market investors.
• Why did the market go up in 1997?
• Because the Green Bay Packers defeated the New England Patriots in 1997, the auguries for a stock-market rise were good; again, the market responded correctly by rising smartly.

The Odd - Lot Theory
• The odd-lot theory holds that except for the investor who is always right, no person can contribute more to successful investment strategy than an investor who is known to be invariably wrong.
• According to popular superstition, is precisely that kind of person. Thus, success is assured by buying when the odd-lotter sells and selling when the odd-lotter buys.
• Odd-lotters are the people who trade stocks in less than 100-share lots (called round lots).

Technical Market Gurus
• Joseph Granville was one of the most widely followed forecasters of the early 1980s. His record had been good for a time in the late 1970s, and at his heyday he had the power to move markets.
• Robert Prechter became interested in the parallels between social psychology and the stock market while a Yale undergraduate.
• Elaine Garzarelli, an executive vice-president of the investment firm of Lehman Brothers. She uses financial data.
• Mid-1990s were the homespun, grandmotherly (median age 70) Beardstown Ladies. Called by publicists "the greatest investment minds of our generation," these celebrity grannies cooked up profits and hype.
• 1990s, Abby Joseph Cohen of Goldman Sachs.

Moral of The Story:
• With large numbers of technicians predicting the market, there will always be some who have called the last turn or even the last few turns, but none will be consistently accurate.
• "He who looks back at the predictions of market gurus dies of remorse."

Thank You For Listening!

![Abstract arXiv:1704.00383v1 [q-fin.TR] 2 Apr 2017 · information. The random walk theory became well known since the year 1973 when Malkiel (1973) published his book “A Random Walk](https://img.pdfslide.net/doc/110x75/5e7b3eabfae061141b0ca5d8/abstract-arxiv170400383v1-q-fintr-2-apr-2017-information-the-random-walk-theory.jpg)