Embed Size (px)
Citation preview
A rapid review of evidenceThe effects of urban form on health: costs and benefits
EVIDENCEREVIEW
2 RAPID REVIEW
A rapid review of evidenceThe effects of urban form on health: costs and benefits
An Evidence Review commissioned by the NSW Ministry of Health and brokered by the Sax Institute for The Australian Prevention Partnership Centre.
Authors:
Belen Zapata Diomedi, The University of Queensland
Vicki Brown, Deakin University
Lennert Veerman, The University of Queensland
With thanks to the following who provided valuable feedback or information: Professor Billie Giles-Corti, Professor Alan Shiell, Professor Rob Carter, Professor Marj Moodie, Dr Lucy Gunn, Professor Gavin Turrell, Dr Jerome Rachele, Professor Matthew Knuiman, Dr Hayley Christian, Professor Chris Rissel, Dr Andrew Milat, Associate Professor Sonia Wutzke, Ms Emma Slaytor, Dr Rema Hayek and Ms Ana Maria Mantilla Herrera. Any errors are those of the authors.
Editor: Heather Wiseman
September 2015
© The Sax Institute 2015
This work is copyright. It may be reproduced in whole or in part for study or training purposes, subject to the inclusion of an acknowledgement of the source. It may not be reproduced for commercial usage or sale. Reproduction for purposes other than those indicated above requires written permission from the copyright owners.
Enquiries about this report may be directed to:
The Australian Prevention Partnership Centre Email: [email protected] Phone: +61 2 9188 9520
Suggested citation: Diomedi BZ, Brown V, Veerman L. An evidence review and modelling exercise: The effects of urban form on health: costs and benefits. An evidence review commissioned by the Centre for Population Health, NSW Ministry of Health, and brokered by the Sax Institute for The Australian Prevention Partnership Centre; 2015.
Disclaimer: This evidence review is not necessarily a comprehensive review of all literature
relating to the topic area. It was current at the time of production (but not necessarily at the
time of publication) and is based on sources believed to be reliable.
THE EFFECTS OF URBAN FORM ON HEALTH: COSTS AND BENEFITS 3
Executive summary . . . . . . . . . . . . . . . . . . . . . . . . . . . . . . . . . . . . . . . . . . . . . . . . . . . . . . . . . . 5
Key messages . . . . . . . . . . . . . . . . . . . . . . . . . . . . . . . . . . . . . . . . . . . . . . . . . . . . . . . . . . 5
1. Background and introduction . . . . . . . . . . . . . . . . . . . . . . . . . . . . . . . . . . . . . . . . . . . . . . 7
2. Evidence review . . . . . . . . . . . . . . . . . . . . . . . . . . . . . . . . . . . . . . . . . . . . . . . . . . . . . . . . . . . 9
Methods . . . . . . . . . . . . . . . . . . . . . . . . . . . . . . . . . . . . . . . . . . . . . . . . . . . . . . . . . . . . . . 9
Research question 1: What is the evidence regarding the economic benefits/costs to society as a whole arising from the impact of urban form on physical activity? . . . . . . . . . . . . . . . . . . . . . . . . . . . . . . . . . . . . . . . . . . . . . . . . 11
Evidence review: Urban form and economic outcomes . . . . . . . . . . . . . . . . . . . . . . 11
Research question 2: What are the changes in urban form that most benefit physical activity? . . . . . . . . . . . . . . . . . . . . . . . . . . . . . . . . . . . . . . . . . . . . . . . . . . . . . . . 15
Evidence review: urban form and physical activity outcomes . . . . . . . . . . . . . . . . . 15
Summary of findings. . . . . . . . . . . . . . . . . . . . . . . . . . . . . . . . . . . . . . . . . . . . . . . . . . . . 16
3. Modelling exercise . . . . . . . . . . . . . . . . . . . . . . . . . . . . . . . . . . . . . . . . . . . . . . . . . . 22
Research question 3: What is the dollar value of the health externalities associated with changes in urban form? . . . . . . . . . . . . . . . . . . . . . . . . . . . . . . . . . . . 22
Economic model . . . . . . . . . . . . . . . . . . . . . . . . . . . . . . . . . . . . . . . . . . . . . . . . . . . . . . . 23
Economic exercise results . . . . . . . . . . . . . . . . . . . . . . . . . . . . . . . . . . . . . . . . . . . . . . . 24
4. Conclusion and recommendations . . . . . . . . . . . . . . . . . . . . . . . . . . . . . . . . . . . . . 27
5. References . . . . . . . . . . . . . . . . . . . . . . . . . . . . . . . . . . . . . . . . . . . . . . . . . . . . . . . . . 29
6. Appendices . . . . . . . . . . . . . . . . . . . . . . . . . . . . . . . . . . . . . . . . . . . . . . . . . . . . . . . . 32
Contents
4 RAPID REVIEW
List of figures Figure 1 Logic framework for the effect of urban form on benefits and costs . . . . . . . . 8
Figure 2 Summary of search results . . . . . . . . . . . . . . . . . . . . . . . . . . . . . . . . . . . . . . . . . . . . . 10
Figure 3 Economic value per kilometre cycled . . . . . . . . . . . . . . . . . . . . . . . . . . . . . . . . . . . . 14
Figure 4 Economic value per kilometre walked . . . . . . . . . . . . . . . . . . . . . . . . . . . . . . . . . . . 14
Figure 5 Economic value per adult, per year, of changes in destinations within the neighbourhood area . . . . . . . . . . . . . . . . . . . . . . . . . . . . . . . . . . . . . . . . . . . . . . . . . . . . . . . 25
Figure 6 Economic value per adult, per year, of changes in distance to transit within the neighbourhood area . . . . . . . . . . . . . . . . . . . . . . . . . . . . . . . . . . . . . . . . . . . . . . . . . 25
Figure 7 Economic value per adult, per year, of changes in walkability within the neighbourhood area . . . . . . . . . . . . . . . . . . . . . . . . . . . . . . . . . . . . . . . . . . . . . . . . . . . . . . . . . . 26
Figure 8 Economic value per adult, per year, of changes in diversity within the neighbourhood area . . . . . . . . . . . . . . . . . . . . . . . . . . . . . . . . . . . . . . . . . . . . . . . . . . . . . . . . . . 26
List of tablesTable 1 Summary of studies measuring the economic value per kilometre walked or cycled . . . . . . . . . . . . . . . . . . . . . . . . . . . . . . . . . . . . . . . . . . . . . . . . . . . . . . . . . . . . . . 13
Table 2 Categorisation of urban form indicators . . . . . . . . . . . . . . . . . . . . . . . . . . . . . . . . . . 15
Table 3 Summary of associations between urban form and physical activity for adults 18
Table 4 Summary of associations between urban form and physical activity for children (≥12 years) . . . . . . . . . . . . . . . . . . . . . . . . . . . . . . . . . . . . . . . . . . . . . . . . . . . . . . . . . . . 20
Table 5 Ranking of urban form indicators . . . . . . . . . . . . . . . . . . . . . . . . . . . . . . . . . . . . . . . . 21
Table 6 Quality score . . . . . . . . . . . . . . . . . . . . . . . . . . . . . . . . . . . . . . . . . . . . . . . . . . . . . . . . . 23
Table 7 Summary of economic value, per person per year, for selected urban form indicators . . . . . . . . . . . . . . . . . . . . . . . . . . . . . . . . . . . . . . . . . . . . . . . . . . . . . . . . . . . . . . . 24
THE EFFECTS OF URBAN FORM ON HEALTH: COSTS AND BENEFITS 5
Executive summaryCross-sectional evidence suggests that particular attributes of the built environment (urban form), such as the walkability of neighbourhoods and access to green space, are related to health and economic outcomes through their impact on physical activity. This report summarises recent Australian evidence, and uses modelling to estimate the economic value of specific changes in urban form in the Australian context.
Two separate systematic reviews focused on the evidence for the link between:
1. Physical activity to economic outcomes 2. Urban form attributes to physical activity.
After applying the agreed selection criteria, the first review included nine studies. Of these, eight reported monetary values resulting from health gains associated with an increase in walking and cycling. The monetary value of the health-related benefits associated with each additional kilometre walked varied between $1.04 and $2.08. The monetary value of health-related benefits attributable to an additional kilometre cycled ranged from less than $0.02 to $1.12.
After applying the agreed selection criteria, the second review included 30 studies. Sufficient evidence was found to associate urban form with physical activity outcomes among adults. The same conclusions could not be drawn for children given the lack of evidence from the recent Australian literature.
Evidence of a positive association with physical activity was found for: • The number of destinations within walking or cycling distance, such as transport nodes,
shops and recreational facilities
• Greater diversity in land use
• Shorter distance to transit
• Neighbourhood walkability, which typically included measures of density, land use mix and connectivity.
No studies in this review directly linked specific urban form attributes to economic outcomes. Evidence from the second review and economic modelling was therefore used to estimate the economic value of changes in urban form. This was done for 23 different scenarios. Economic outcomes were found to be greatest for increasing destinations within the neighbourhood, which are associated with health-related benefits worth an average of $14.65 per adult annually (range $0.42 to $42.50), while for improvement in neighbourhood walkability, the average economic value was most modest at an estimated $1.62 per adult, per year (range $0.11 to $15.73).
The wide variability of results is due to the different measurements and assumptions in the effect estimates as well as the modelling. More precise measurement of urban form attributes and physical activity, including who benefits most, would enable estimates with greater certainty.
Nevertheless, the combined body of evidence currently available shows that urban form attributes are associated with physical activity patterns and in turn increased physically activity among individuals translates into positive economic outcomes at the population level.
Key messages • Within the Australian context, there is sufficient evidence that increased walking and cycling have
positive monetary health-related benefits.
• Each additional kilometre walked has been estimated to result in health-related benefits that range in value from $1.04 to $2.08. Each additional kilometre cycled results in health-related benefits that range in value from less than $0.02 to $1.12.
• There is compelling Australian evidence linking attributes of the urban form with physical activity among adults. There is insufficient evidence to draw conclusions for children and adolescents.
In this report, ‘health related monetary benefits’ or ‘economic outcomes’ represent the value of improved duration and quality of life, reduced healthcare costs, and increased production associated with an increase in physical activity.
6 RAPID REVIEW
• Attributes of the urban form that increase physical activity among adults are the number of destinations within walking or cycling distance, greater diversity in land use, shorter distance to transit, and neighbourhood walkability. Broadly, the literature suggests that if people are to walk and cycle, they need destinations within walking or cycling distance.
• Economic outcomes were found to be greatest for increasing destinations within the neighbourhood, which are associated with health-related benefits worth an average $14.65 per adult annually (range $0.42 to $42.50), depending on the destination and context. The economic value of increasing neighbourhood walkability was found to be worth an average $1.62 per adult annually (range $0.11 to $15.73).
• The health-related economic benefits of changes in urban form are modest at an individual level, but when multiplied for whole populations, these figures are significant.
THE EFFECTS OF URBAN FORM ON HEALTH: COSTS AND BENEFITS 7
1. Background and introduction The Centre for Population Health of the NSW Ministry of Health commissioned a review to estimate the health-related economic value of changes in urban form that impact on physical activity. This review and modelling exercise will allow the Centre to provide other government departments with the information needed to include these health externalities in the development of cost-benefit analyses for land use planning.
Physical inactivity is associated with a number of health conditions.1,2 It represents a burden for individuals, governments and societies, in terms of adverse health and economic outcomes. A 10% increase in the proportion of physically active people in Australia has been estimated to lead to benefits worth $258 million.3 Of this, 37% is attributable to a reduction in annual healthcare costs and the rest to improvements in production outcomes estimated over the life course (5% economic production, 26% home-based production and 32% in the value of leisure time).
Urban form incorporates the building and transportation design of a city4, including factors such as open green spaces, bikeways and sidewalks, shopping centres, business complexes and residential accommodation. The built environment has a significant impact on physical activity5 and therefore health. However, to date the inclusion of health outcomes related to physical activity in transport and urban planning cost-benefit analysis is uncommon.6
Cost-benefit analysis is the preferred method to evaluate options in land use planning. However, health benefits are not easily included in a cost-benefit analysis. The main reasons are a lack of readily available, evidence-based, context-specific (Australian) estimates of the association of urban form characteristics and physical activity, and an absence of agreed methods for the incorporation of the economic value of changes in specific urban form indicators.
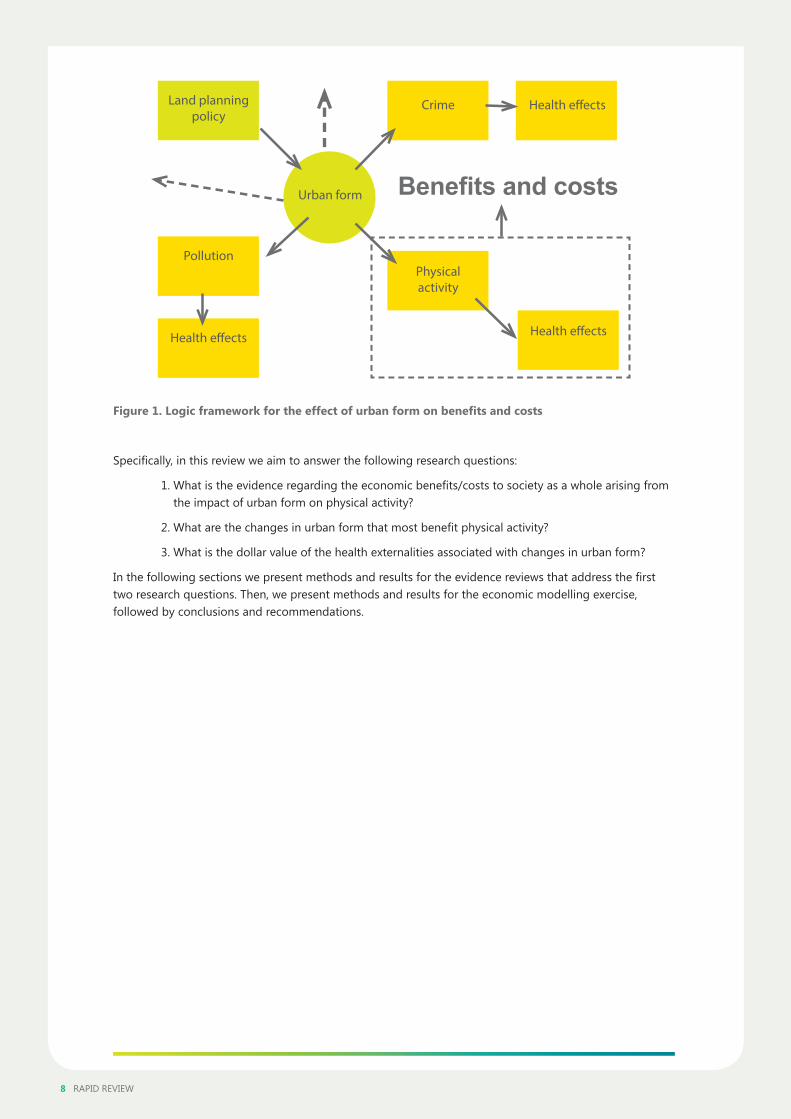
A number of health impacts, or externalities, are associated with urban form, as shown in Figure 1. In economics, an externality is the cost or benefit that affects a party who did not choose to incur that cost or benefit. For the purpose of this review ‘health externalities’ refers to the benefits or costs to society arising from urban form impacts on physical activity. These externalities include healthcare costs, the value of reducing mortality and morbidity, and changes in production that are attributable to changes in physical activity.
This report aims to assign a dollar value to these health externalities. The logic model is as follows:
• Change in urban form indicator affects physical activity indicator
• Change in physical activity indicator affects health indicator
• Change in health indicator causes a change in overall societal economic outcomes (over a specified period).
8 RAPID REVIEW
Urban form
Land planning policy
Pollution
Health effects
Crime
Physical activity
Health effects
Health effects
Benefits and costs
Figure 1. Logic framework for the effect of urban form on benefits and costs
Specifically, in this review we aim to answer the following research questions:
1. What is the evidence regarding the economic benefits/costs to society as a whole arising from the impact of urban form on physical activity?
2. What are the changes in urban form that most benefit physical activity?
3. What is the dollar value of the health externalities associated with changes in urban form?
In the following sections we present methods and results for the evidence reviews that address the first two research questions. Then, we present methods and results for the economic modelling exercise, followed by conclusions and recommendations.
THE EFFECTS OF URBAN FORM ON HEALTH: COSTS AND BENEFITS 9
2. Evidence reviewMethodsSearch strategy and data sources
The literature searches were conducted by one reviewer (BZ) who examined the English language peer-reviewed and grey literature from 2009 to date. The following academic databases were searched: Web of Science, Scopus, EBSCOHost (which includes Business Source Complete, CINAHL, MEDLINE, SportDiscus and Econlit), GeoRef and Leisure Tourism. Google was used to search for government reports and experts in the field were consulted to ensure that all relevant literature was included. All search strategies are given in Appendix A.
Inclusion criteria
1. Published in English from 1 January 2009 to 15 March 2015
2. Study conducted in the Australian context
3. Primary study or review
4. Presented evidence on the direct association of
a. Physical activity with economic outcomes
b. Urban form with physical activity
5. All age groups considered.
Reviews were used to search for additional studies that met the inclusion criteria.
Studies targeting special groups, such as patients with a disability or health condition, were excluded. We further excluded studies comparing physical activity outcomes after relocation without direct association to a particular urban form (e.g. change in walking after relocating to a new neighbourhood that meets land-planning legislation). Studies assessing mediating variables in the association between urban form and physical activity were also excluded, since a direct interpretation of effect is not possible.
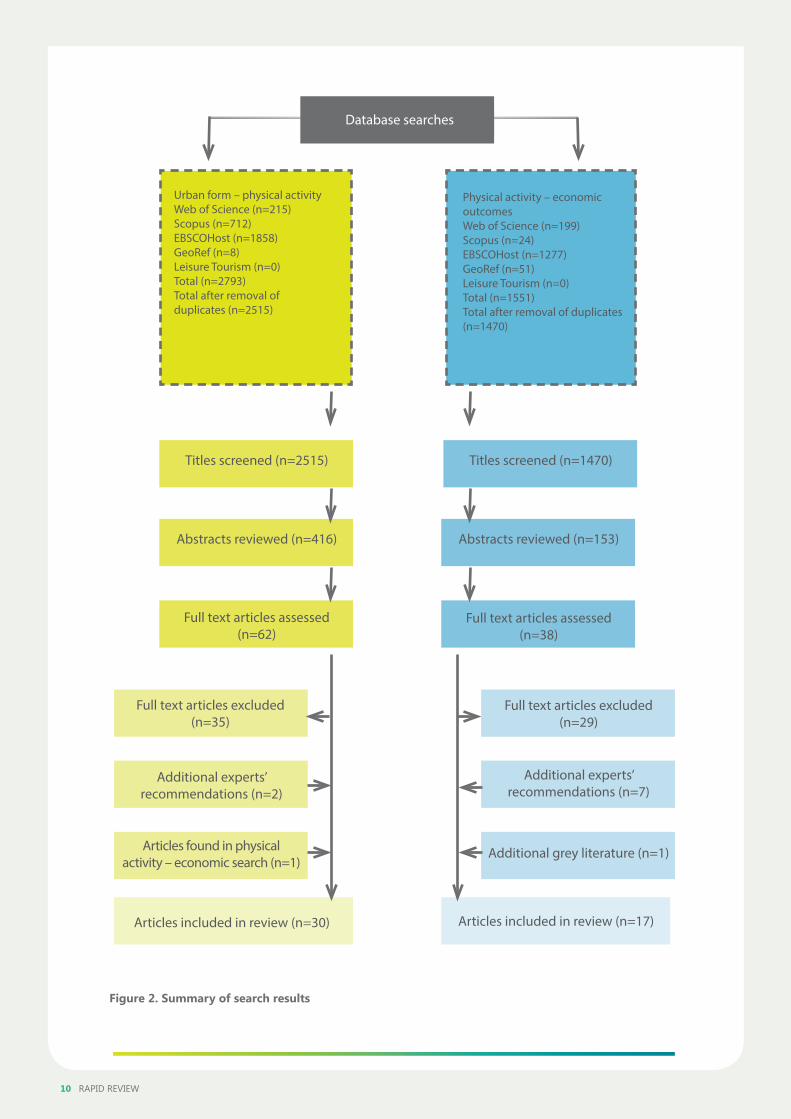
Search results
Figure 2 (next page) shows the search results independently for each literature search. A list of excluded papers and reasons for exclusion is given in Appendix B.
10 RAPID REVIEW
Database searches
Titles screened (n=2515)
Abstracts reviewed (n=416)
Full text articles assessed (n=62)
Articles included in review (n=30)
Full text articles excluded (n=35)
Full text articles excluded (n=29)
Additional experts’ recommendations (n=2)
Additional experts’ recommendations (n=7)
Articles found in physical activity – economic search (n=1)
Additional grey literature (n=1)
Abstracts reviewed (n=153)
Full text articles assessed (n=38)
Articles included in review (n=17)
Titles screened (n=1470)
Physical activity – economic outcomesWeb of Science (n=199)Scopus (n=24)EBSCOHost (n=1277)GeoRef (n=51)Leisure Tourism (n=0)Total (n=1551)Total after removal of duplicates (n=1470)
Urban form – physical activityWeb of Science (n=215)Scopus (n=712) EBSCOHost (n=1858)GeoRef (n=8) Leisure Tourism (n=0)Total (n=2793)Total after removal of duplicates (n=2515)
Figure 2. Summary of search results
THE EFFECTS OF URBAN FORM ON HEALTH: COSTS AND BENEFITS 11
Research question 1: What is the evidence regarding the economic benefits/costs to society as a whole arising from the impact of urban form on physical activity?Evidence review: Urban form and economic outcomesWe found 17 studies, however we only report those that estimated the economic value attributable to built-environment features that facilitate physical activity (n=9). Table C 1 (Appendix C) gives additional information on the studies that estimate the economic value of physical activity (n=8). All research that we included assessed the economic value of additional walking and/or cycling at the population level. All but two studies6,7 were from the grey literature.
Two approaches have been taken in the literature to evaluate the health benefits of walking and cycling due to infrastructure:6,8 monetised values per person taking up physical activity, or per additional kilometre walked or cycled. We only observed the second approach6,8-14 and an alternative to the first7 in the included literature.
Gunn and colleagues expressed outcomes in terms of the average costs of infrastructure per extra person who moves above a walking threshold.7 In this study, it costs $674 in sidewalk investment to move one person above the 60 minutes-per-week threshold and $2330 for the 150 minutes-per-week threshold.
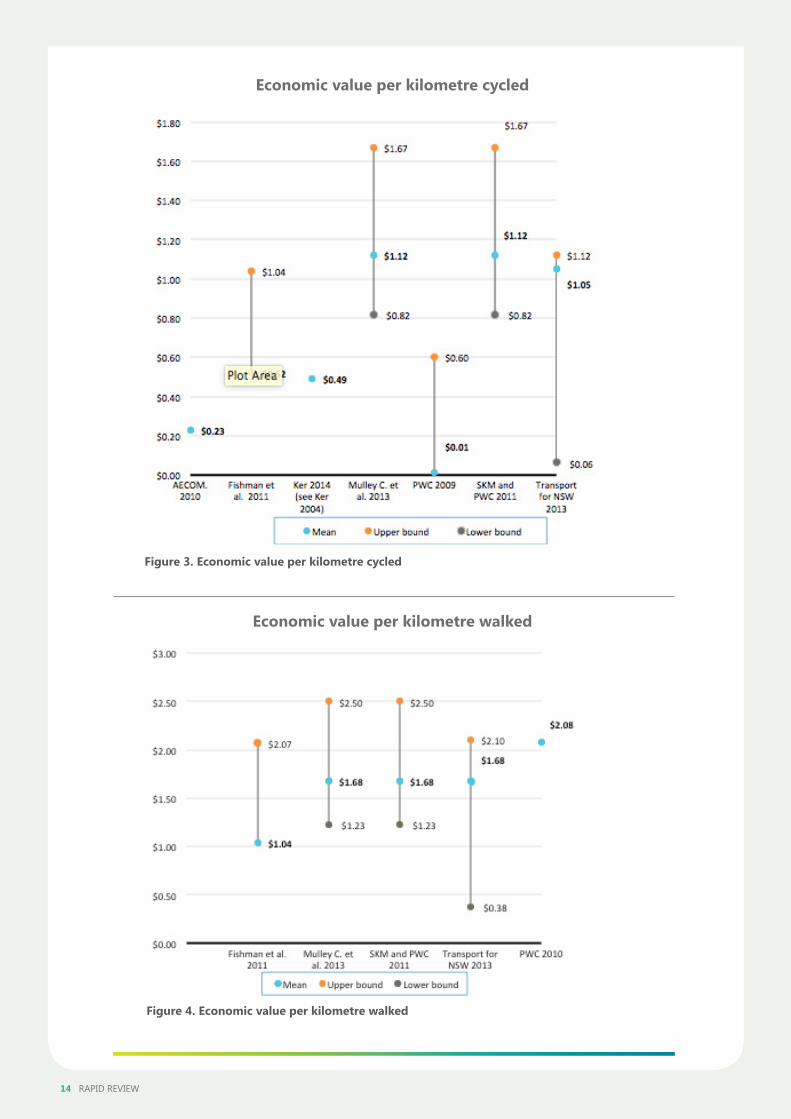
Estimates of the value of health-related benefits per additional kilometre cycled ranged from less than $0.02–$1.12 (Figure 3). For walking, values ranged from $0.52–$2.08 (Figure 4). The wide range of values can be explained by differences in cost categories included (e.g. direct healthcare costs, indirect costs), data sources (e.g. sources of costs), value of statistical life approach (e.g. willingness to pay or human capital) and computational techniques. In Table 1 we present a summary of the included studies. More detailed information can be found in Table C 2 (Appendix C). For instance, the comparatively low estimate of the value of a kilometre cycled of $0.014212 only included premature mortality and heart-attack-related costs for men, whereas both estimates of $1.126,8 used the same method but included direct (healthcare costs) and indirect (disability) costs of physical inactivity. The study by AECOM9 used the value of $0.227, but only included mortality outcomes and a low estimate of production outcomes related to the indirect cost of physical inactivity, based on values from the literature.16 By including only a restricted set of benefits, the lowest two estimates in Figure 3 are almost certainly underestimates. Health benefits were assessed as being the improvement in health from becoming physically active because of the intervention6,8,10,13 and by assessing the marginal improvement in health attributable to more cycling.9,12 In one study methods were not clearly specified11 and in another, values were taken from the literature.14
The per-kilometre approach offers the advantage of being easily included in the economic evaluation of transport infrastructure, as this is commonly performed on per-kilometres basis.6 However, there are a number of challenges. There is a lack of literature indicating who takes up physical activity as a consequence of improved or additional cycling and walking infrastructure, hence, assumptions are required. Past literature has distributed the incremental estimated kilometres walked or cycled as a consequence of the new or improved infrastructure across physical activity categories equally (sedentary, insufficiently active and active). 8, 17 This method is referred to as a “weighted per-kilometre health benefit”.6 The common assumption is that the additional physical activity lifts some sedentary and insufficiently active people to the sufficiently active category.17 As highlighted by Mulley and colleagues6, this method has been adopted in parts of Australia and New Zealand by the Victorian Department of Transport and the New Zealand Transport Agency. Additional physical activity resulting from infrastructure improvements could replace other forms of physical activity, but this is difficult to assess and in general, not considered in the literature.
1 Three alternatives were assessed; here we present results for the minimum investment of building new sidewalks in streets without them. 7
2“The value of statistical life is an estimate of the financial value society places on reducing the average number of deaths by one. A related concept is the value of statistical life year, which estimates the value society places on reducing the risk of premature death, expressed in terms of saving a statistical life year.”15
12 RAPID REVIEW
The value proposed by Sinclair Knight Merz (SKM) and Pricewaterhouse Coopers (PwC)8 of $1.12 per kilometre cycled, also recommended in the study by Mulley et al,6 seems the most plausible value to be applied in economic evaluations of cycling infrastructure. These estimates include mortality and morbidity, and data sources and estimation methods are clearly stated. Likewise, with the value per kilometre walked, the estimate by SKM and PwC is the most plausible at $1.68 per kilometre. Both values are in line with those proposed by the NSW Department of Transport in a previous review of the literature: $1.05 (range $0.06 – $1.12) for cycling and $1.68 (range $0.38 – $2.10) for walking.14
Given that most of these studies are not peer-reviewed, we have limited confidence in the size of benefits attributed to walking and cycling. However, it is well accepted that physical activity is associated with health benefits and thus represents an economic value. This association partly answers research question 1. The next section addresses which attributes of the built environment are most strongly associated with increased physical activity.
13 RAPID REVIEW THE EFFECTS OF URBAN FORM ON HEALTH: COSTS AND BENEFITS 13
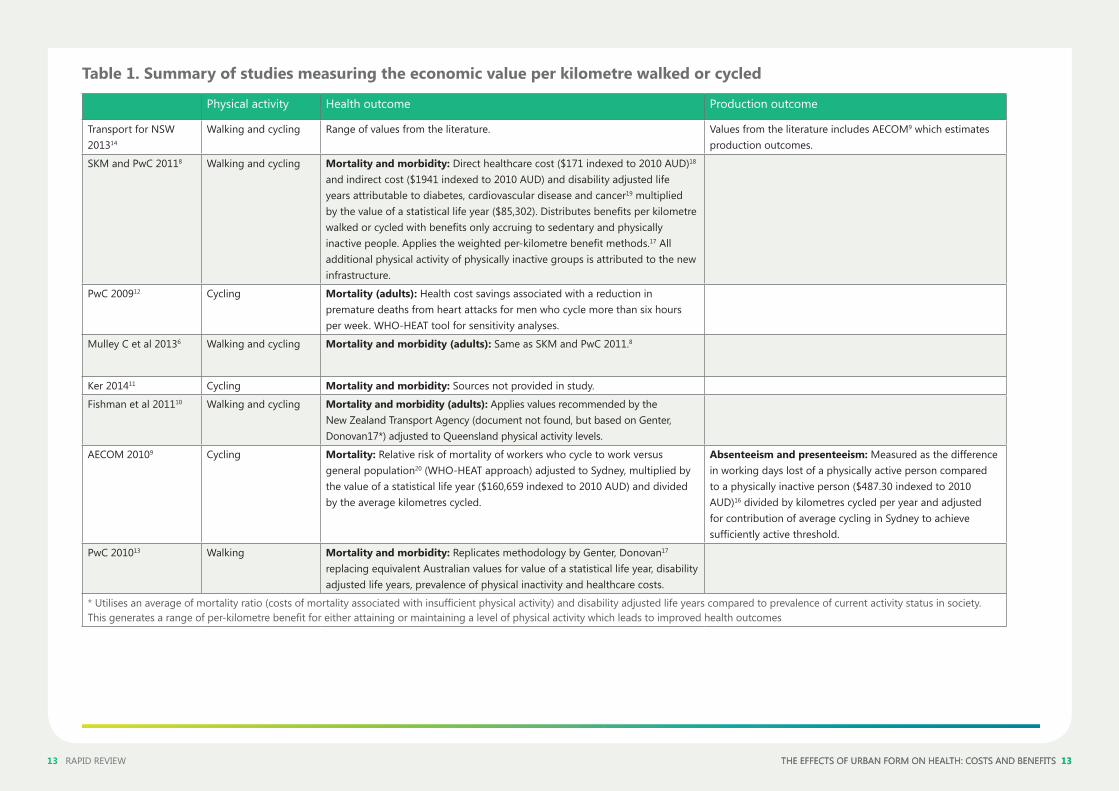
Table 1. Summary of studies measuring the economic value per kilometre walked or cycled
Physical activity Health outcome Production outcome
Transport for NSW 201314
Walking and cycling Range of values from the literature. Values from the literature includes AECOM9 which estimates production outcomes.
SKM and PwC 20118 Walking and cycling Mortality and morbidity: Direct healthcare cost ($171 indexed to 2010 AUD)18 and indirect cost ($1941 indexed to 2010 AUD) and disability adjusted life years attributable to diabetes, cardiovascular disease and cancer19 multiplied by the value of a statistical life year ($85,302). Distributes benefits per kilometre walked or cycled with benefits only accruing to sedentary and physically inactive people. Applies the weighted per-kilometre benefit methods.17 All additional physical activity of physically inactive groups is attributed to the new infrastructure.
PwC 200912 Cycling Mortality (adults): Health cost savings associated with a reduction in premature deaths from heart attacks for men who cycle more than six hours per week. WHO-HEAT tool for sensitivity analyses.
Mulley C et al 20136 Walking and cycling Mortality and morbidity (adults): Same as SKM and PwC 2011.8
Ker 201411 Cycling Mortality and morbidity: Sources not provided in study.
Fishman et al 201110 Walking and cycling Mortality and morbidity (adults): Applies values recommended by the New Zealand Transport Agency (document not found, but based on Genter, Donovan17*) adjusted to Queensland physical activity levels.
AECOM 20109 Cycling Mortality: Relative risk of mortality of workers who cycle to work versus general population20 (WHO-HEAT approach) adjusted to Sydney, multiplied by the value of a statistical life year ($160,659 indexed to 2010 AUD) and divided by the average kilometres cycled.
Absenteeism and presenteeism: Measured as the difference in working days lost of a physically active person compared to a physically inactive person ($487.30 indexed to 2010 AUD)16 divided by kilometres cycled per year and adjusted for contribution of average cycling in Sydney to achieve sufficiently active threshold.
PwC 201013 Walking Mortality and morbidity: Replicates methodology by Genter, Donovan17
replacing equivalent Australian values for value of a statistical life year, disability adjusted life years, prevalence of physical inactivity and healthcare costs.
* Utilises an average of mortality ratio (costs of mortality associated with insufficient physical activity) and disability adjusted life years compared to prevalence of current activity status in society. This generates a range of per-kilometre benefit for either attaining or maintaining a level of physical activity which leads to improved health outcomes
THE EFFECTS OF URBAN FORM ON HEALTH: COSTS AND BENEFITS 13
14 RAPID REVIEW
Economic value per kilometre cycled
Economic value per kilometre walked
Figure 3. Economic value per kilometre cycled
Figure 4. Economic value per kilometre walked
THE EFFECTS OF URBAN FORM ON HEALTH: COSTS AND BENEFITS 15
Research question 2: What are the changes in urban form that most benefit physical activity?Evidence review: urban form and physical activity outcomesMethods
Coding of evidence
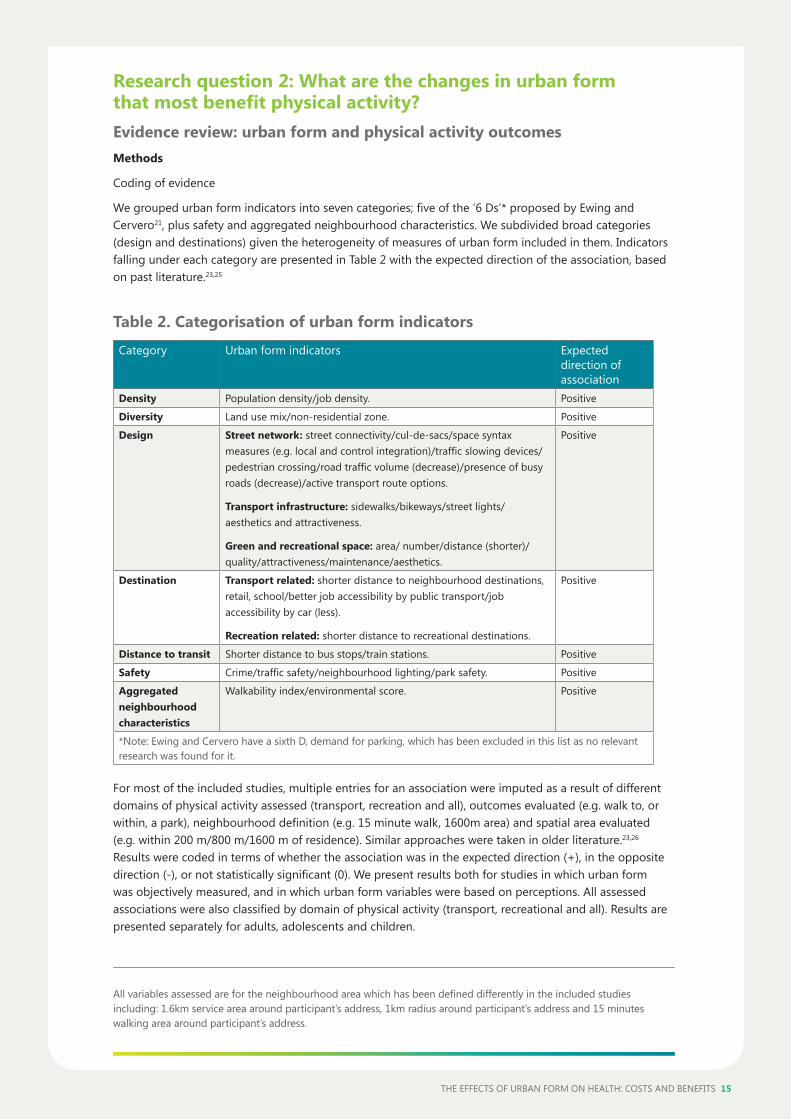
We grouped urban form indicators into seven categories; five of the ‘6 Ds’* proposed by Ewing and Cervero21, plus safety and aggregated neighbourhood characteristics. We subdivided broad categories (design and destinations) given the heterogeneity of measures of urban form included in them. Indicators falling under each category are presented in Table 2 with the expected direction of the association, based on past literature.23,25
Table 2. Categorisation of urban form indicators
Category Urban form indicators Expected direction of association
Density Population density/job density. Positive
Diversity Land use mix/non-residential zone. Positive
Design Street network: street connectivity/cul-de-sacs/space syntax measures (e.g. local and control integration)/traffic slowing devices/pedestrian crossing/road traffic volume (decrease)/presence of busy roads (decrease)/active transport route options.
Transport infrastructure: sidewalks/bikeways/street lights/aesthetics and attractiveness.
Green and recreational space: area/ number/distance (shorter)/quality/attractiveness/maintenance/aesthetics.
Positive
Destination Transport related: shorter distance to neighbourhood destinations, retail, school/better job accessibility by public transport/job accessibility by car (less).
Recreation related: shorter distance to recreational destinations.
Positive
Distance to transit Shorter distance to bus stops/train stations. Positive
Safety Crime/traffic safety/neighbourhood lighting/park safety. Positive
Aggregated neighbourhood characteristics
Walkability index/environmental score. Positive
*Note: Ewing and Cervero have a sixth D, demand for parking, which has been excluded in this list as no relevant research was found for it.
For most of the included studies, multiple entries for an association were imputed as a result of different domains of physical activity assessed (transport, recreation and all), outcomes evaluated (e.g. walk to, or within, a park), neighbourhood definition (e.g. 15 minute walk, 1600m area) and spatial area evaluated (e.g. within 200 m/800 m/1600 m of residence). Similar approaches were taken in older literature.23,26 Results were coded in terms of whether the association was in the expected direction (+), in the opposite direction (-), or not statistically significant (0). We present results both for studies in which urban form was objectively measured, and in which urban form variables were based on perceptions. All assessed associations were also classified by domain of physical activity (transport, recreational and all). Results are presented separately for adults, adolescents and children.
All variables assessed are for the neighbourhood area which has been defined differently in the included studies including: 1.6km service area around participant’s address, 1km radius around participant’s address and 15 minutes walking area around participant’s address.
16 RAPID REVIEW
We calculated the percentage of associations in the expected direction of the total number of relationships for each urban form indicator. We only considered as sufficient evidence urban form attributes that were investigated in at least three independent studies, using three different datasets.27 We interpreted the results following rules used in the past; only those indicators for which 50% of all associations were in the expected direction were classified as convincing evidence of a positive relationship with physical activity outcomes.23, 27
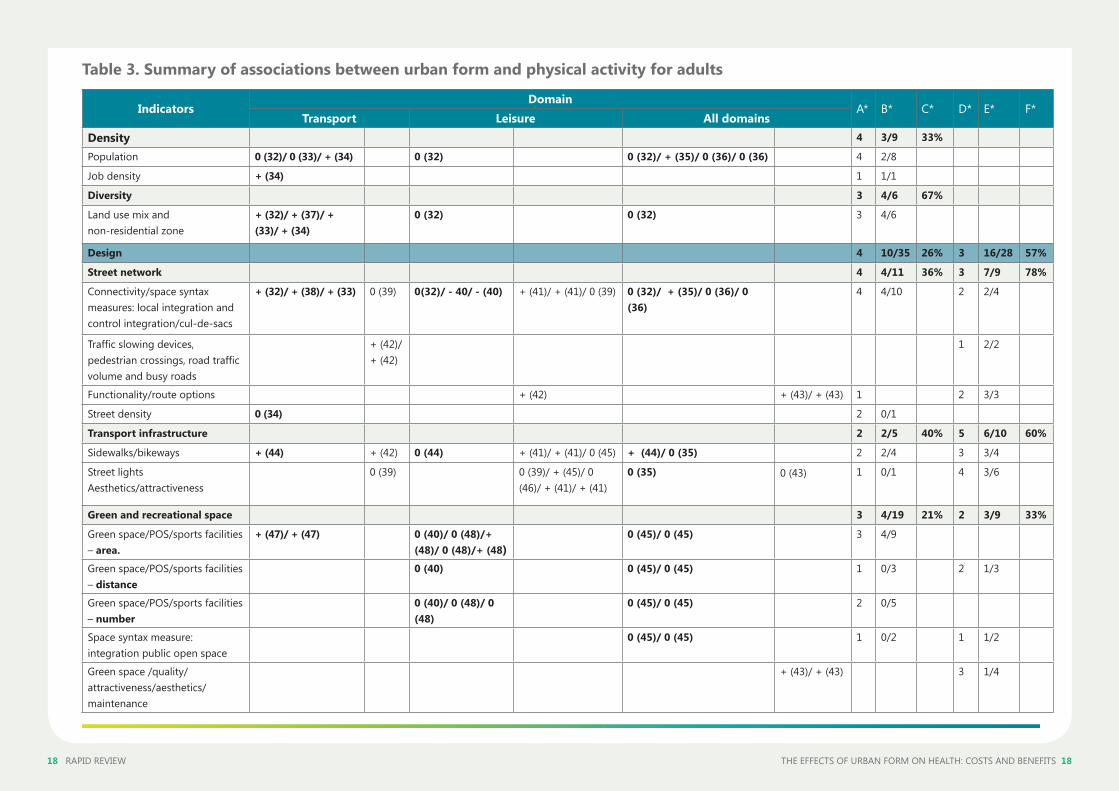
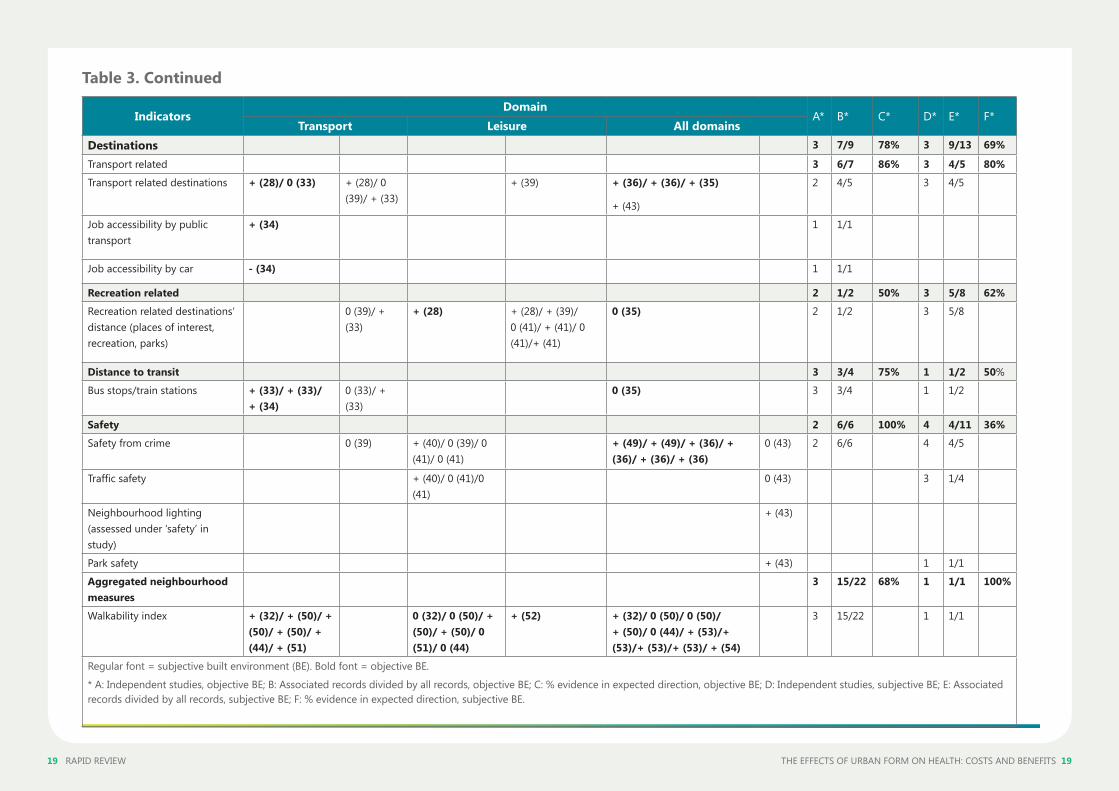
Summary of findings Adults, objective urban formsConvincing evidence of a positive relationship was found for availability of destinations, with seven out of nine cases showing an effect in the expected direction (Table 3). The majority of the evidence covers transport-related destinations (6/7) within the neighbourhood such as retail zones, services, post offices, food stores, transit stops and public open spaces such as parks. Shorter distance to transit also showed convincing evidence, with 75% of the studies in the expected direction. It should be noted that many of the studies included in ‘destinations’ take into account transit as well, however it was not possible to disaggregate what was in the variables. Despite this crossover, the overall evidence suggests that having access to a wide variety of destinations within the neighbourhood has a positive impact on physical activity outcomes.
Convincing evidence was also found for the impact of diversity measures, including land-use-mix indicators and measures of non-residential zones, with four of six studies showing associations in the expected direction (67%). Lastly, aggregated neighbourhood measures such as walkability indices, which typically include measures of density, connectivity and land use mix, provided convincing evidence of having a positive relationship with physical activity outcomes (68%). Australian studies do not provide convincing evidence to indicate that design and density variables are associated with physical activity outcomes. However, density and connectivity (a design measure) are commonly included in aggregated neighbourhood measures which showed convincing evidence of having a positive relationship with physical activity outcomes. Design variables related to public open areas, such as green spaces, are included in measures of transport destinations within the neighbourhood, which also indicated sufficient evidence of association with physical activity in a positive direction.
For measures of safety there was not enough evidence to draw conclusions. It is important to note that we present adjusted associations for other urban forms, which helps to explain the lack of convincing evidence for the case of density. As highlighted in previous literature28,29, density per se is unlikely to be related to physical activity outcomes, but higher density makes mass transit and commercial destinations viable and therefore tends to increase the number of potential destinations within walking or cycling distance. In adjusting for these other variables, which are on the causal pathway from density to physical activity, there is a risk of over adjustment and explaining away real associations.
Adults, subjective urban formsAssociations of physical activity with perceived urban forms were not always in agreement with similar studies that used objective measures of the built environment. For design variables, convincing evidence was found, with 57% of the association in the expected direction. The major contributors to this positive result were measures related to the street network and transport infrastructure. Measures of destination supported objective results with 69% of cases in the expected direction. For cases of distance-to-transit and neighbourhood-aggregated measures, there was not enough evidence to draw conclusions. Contrary to objective measures, safety indicated enough evidence to draw conclusions. However, this evidence did not suggest a positive association (36%).
THE EFFECTS OF URBAN FORM ON HEALTH: COSTS AND BENEFITS 17
Evidence from international systematic reviewsOur findings are restricted to the recent Australian context. However, they are in line with internationally conducted reviews. Recent reviews found that availability of destinations (overlapping with land use mix) and walkability measures are facilitators of physical activity. McCormack and Shiell30 conducted a systematic review of the international literature including only studies that controlled for self-selection. Their findings indicated consistent associations with physical activity outcomes in the expected direction for land use mix, composite walkability indices and neighbourhood type. A study focusing only on European countries found convincing evidence of an association with physical activity outcomes for walkability, access to shops/services/work and environmental quality.27 Grasser and colleagues31 found consistent results for density (population, housing, intersections) and walkability indices.
Tables with characteristics of studies can be found in Table 3 of the appendix and decisions regarding associations included in Table 3 are presented in Table 4 of the appendix.
18 RAPID REVIEW THE EFFECTS OF URBAN FORM ON HEALTH: COSTS AND BENEFITS 18
Table 3. Summary of associations between urban form and physical activity for adults
IndicatorsDomain
A* B* C* D* E* F*Transport Leisure All domains
Density 4 3/9 33%
Population 0 (32)/ 0 (33)/ + (34) 0 (32) 0 (32)/ + (35)/ 0 (36)/ 0 (36) 4 2/8
Job density + (34) 1 1/1
Diversity 3 4/6 67%
Land use mix and non-residential zone
+ (32)/ + (37)/ + (33)/ + (34)
0 (32) 0 (32) 3 4/6
Design 4 10/35 26% 3 16/28 57%
Street network 4 4/11 36% 3 7/9 78%
Connectivity/space syntax measures: local integration and control integration/cul-de-sacs
+ (32)/ + (38)/ + (33) 0 (39) 0(32)/ - 40/ - (40) + (41)/ + (41)/ 0 (39) 0 (32)/ + (35)/ 0 (36)/ 0 (36)
4 4/10 2 2/4
Traffic slowing devices, pedestrian crossings, road traffic volume and busy roads
+ (42)/ + (42)
1 2/2
Functionality/route options + (42) + (43)/ + (43) 1 2 3/3
Street density 0 (34) 2 0/1
Transport infrastructure 2 2/5 40% 5 6/10 60%
Sidewalks/bikeways + (44) + (42) 0 (44) + (41)/ + (41)/ 0 (45) + (44)/ 0 (35) 2 2/4 3 3/4
Street lights Aesthetics/attractiveness
0 (39) 0 (39)/ + (45)/ 0 (46)/ + (41)/ + (41)
0 (35) 0 (43) 1 0/1 4 3/6
Green and recreational space 3 4/19 21% 2 3/9 33%
Green space/POS/sports facilities – area.
+ (47)/ + (47) 0 (40)/ 0 (48)/+ (48)/ 0 (48)/+ (48)
0 (45)/ 0 (45) 3 4/9
Green space/POS/sports facilities – distance
0 (40) 0 (45)/ 0 (45) 1 0/3 2 1/3
Green space/POS/sports facilities – number
0 (40)/ 0 (48)/ 0 (48)
0 (45)/ 0 (45) 2 0/5
Space syntax measure: integration public open space
0 (45)/ 0 (45) 1 0/2 1 1/2
Green space /quality/attractiveness/aesthetics/maintenance
+ (43)/ + (43) 3 1/4
19 RAPID REVIEW THE EFFECTS OF URBAN FORM ON HEALTH: COSTS AND BENEFITS 19
Table 3. Continued
IndicatorsDomain
A* B* C* D* E* F*Transport Leisure All domains
Destinations 3 7/9 78% 3 9/13 69%
Transport related 3 6/7 86% 3 4/5 80%
Transport related destinations + (28)/ 0 (33) + (28)/ 0 (39)/ + (33)
+ (39) + (36)/ + (36)/ + (35)
+ (43)
2 4/5 3 4/5
Job accessibility by public transport
+ (34) 1 1/1
Job accessibility by car - (34) 1 1/1
Recreation related 2 1/2 50% 3 5/8 62%
Recreation related destinations’ distance (places of interest, recreation, parks)
0 (39)/ + (33)
+ (28) + (28)/ + (39)/ 0 (41)/ + (41)/ 0 (41)/+ (41)
0 (35) 2 1/2 3 5/8
Distance to transit 3 3/4 75% 1 1/2 50%
Bus stops/train stations + (33)/ + (33)/ + (34)
0 (33)/ + (33)
0 (35) 3 3/4 1 1/2
Safety 2 6/6 100% 4 4/11 36%
Safety from crime 0 (39) + (40)/ 0 (39)/ 0 (41)/ 0 (41)
+ (49)/ + (49)/ + (36)/ + (36)/ + (36)/ + (36)
0 (43) 2 6/6 4 4/5
Traffic safety + (40)/ 0 (41)/0 (41)
0 (43) 3 1/4
Neighbourhood lighting (assessed under ‘safety’ in study)
+ (43)
Park safety + (43) 1 1/1
Aggregated neighbourhood measures
3 15/22 68% 1 1/1 100%
Walkability index + (32)/ + (50)/ + (50)/ + (50)/ + (44)/ + (51)
0 (32)/ 0 (50)/ + (50)/ + (50)/ 0 (51)/ 0 (44)
+ (52) + (32)/ 0 (50)/ 0 (50)/ + (50)/ 0 (44)/ + (53)/+ (53)/+ (53)/+ (53)/ + (54)
3 15/22 1 1/1
Regular font = subjective built environment (BE). Bold font = objective BE.
* A: Independent studies, objective BE; B: Associated records divided by all records, objective BE; C: % evidence in expected direction, objective BE; D: Independent studies, subjective BE; E: Associated records divided by all records, subjective BE; F: % evidence in expected direction, subjective BE.
20 RAPID REVIEW THE EFFECTS OF URBAN FORM ON HEALTH: COSTS AND BENEFITS 20
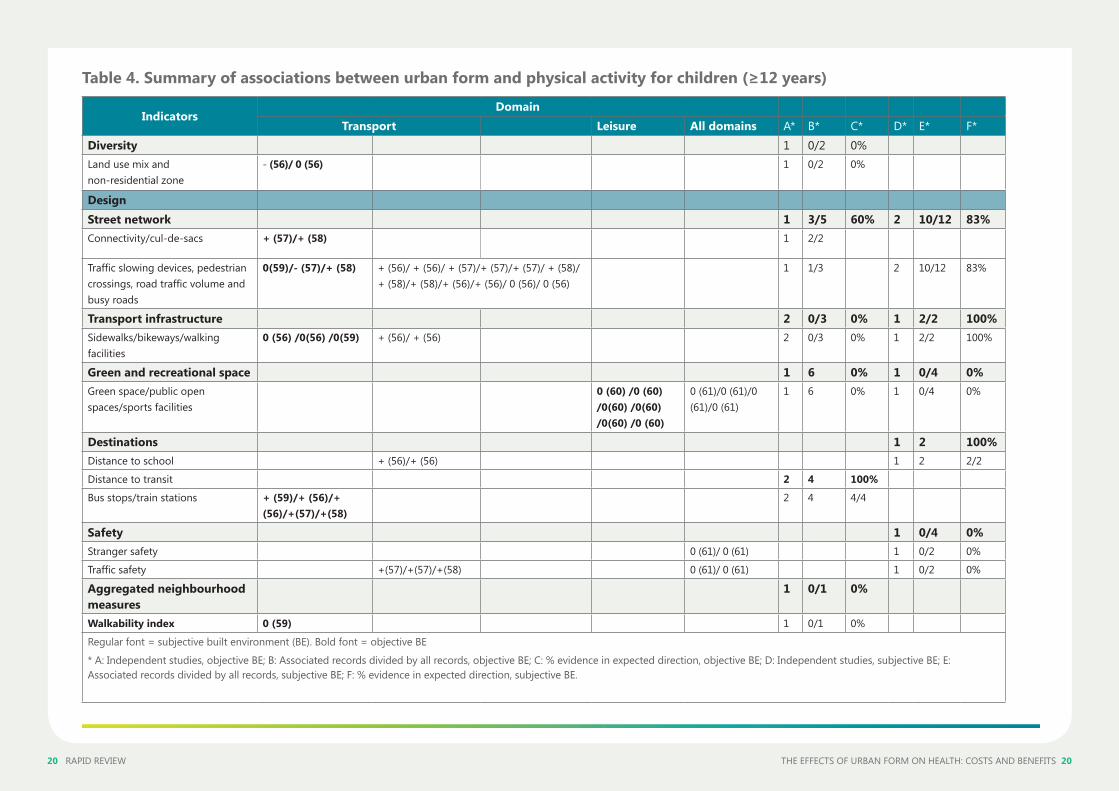
Table 4. Summary of associations between urban form and physical activity for children (≥12 years)
IndicatorsDomain
Transport Leisure All domains A* B* C* D* E* F*Diversity 1 0/2 0%Land use mix and non-residential zone
- (56)/ 0 (56) 1 0/2 0%
DesignStreet network 1 3/5 60% 2 10/12 83%Connectivity/cul-de-sacs + (57)/+ (58) 1 2/2
Traffic slowing devices, pedestrian crossings, road traffic volume and busy roads
0(59)/- (57)/+ (58) + (56)/ + (56)/ + (57)/+ (57)/+ (57)/ + (58)/ + (58)/+ (58)/+ (56)/+ (56)/ 0 (56)/ 0 (56)
1 1/3 2 10/12 83%
Transport infrastructure 2 0/3 0% 1 2/2 100%Sidewalks/bikeways/walking facilities
0 (56) /0(56) /0(59) + (56)/ + (56) 2 0/3 0% 1 2/2 100%
Green and recreational space 1 6 0% 1 0/4 0%Green space/public open spaces/sports facilities
0 (60) /0 (60) /0(60) /0(60) /0(60) /0 (60)
0 (61)/0 (61)/0 (61)/0 (61)
1 6 0% 1 0/4 0%
Destinations 1 2 100%Distance to school + (56)/+ (56) 1 2 2/2
Distance to transit 2 4 100%
Bus stops/train stations + (59)/+ (56)/+ (56)/+(57)/+(58)
2 4 4/4
Safety 1 0/4 0%Stranger safety 0 (61)/ 0 (61) 1 0/2 0%
Traffic safety +(57)/+(57)/+(58) 0 (61)/ 0 (61) 1 0/2 0%
Aggregated neighbourhood measures
1 0/1 0%
Walkability index 0 (59) 1 0/1 0%
Regular font = subjective built environment (BE). Bold font = objective BE
* A: Independent studies, objective BE; B: Associated records divided by all records, objective BE; C: % evidence in expected direction, objective BE; D: Independent studies, subjective BE; E: Associated records divided by all records, subjective BE; F: % evidence in expected direction, subjective BE.
21 RAPID REVIEW
Children and adolescentsA summary of results of studies investigating the association between urban form attributes and physical activity outcomes is presented in Table 4. For children, none of the studied associations had enough evidence to draw conclusions regarding their impact on physical activity, as per the recent Australian literature.
For adolescents, only one study was found, which assessed safety and distance to parks. Again, more evidence is needed before conclusions can be drawn (Table C 5 Appendix C).
Evidence from international systematic reviews
We examined recent international reviews to provide an indication of which urban form factors are more likely to determine physical activity among youth.
Ding and colleagues23 found consistent evidence of a number of factors influencing physical activity outcomes among children, including: recreation facilities (access/density/proximity), land use mix/destinations, residential density, walkability measures, traffic/speed volume, pedestrian safety structures and vegetation. For adolescents, only land use mix/destinations and residential density were consistently associated with physical activity. Pont et al55 found consistent evidence that greater distance to destinations was associated with lower levels of active transport for young people (5 –18 years old). The presence of walking and cycling paths and parks was found to possibly determine active travel behaviours.
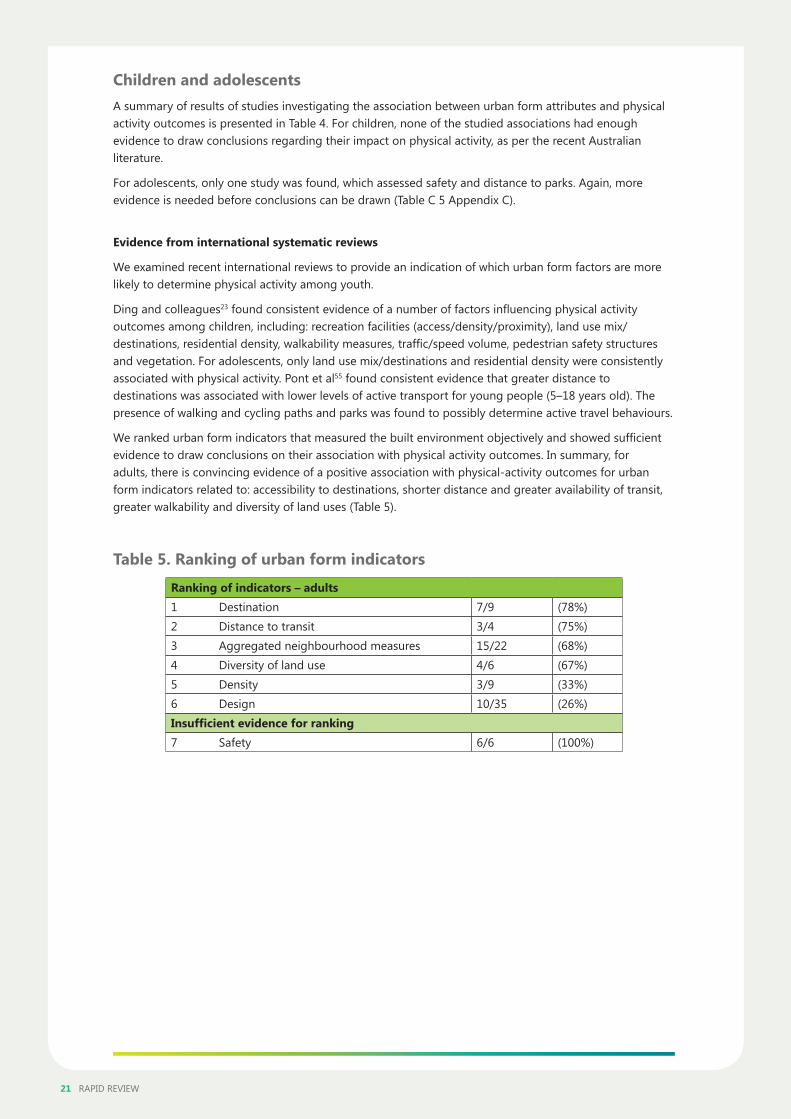
We ranked urban form indicators that measured the built environment objectively and showed sufficient evidence to draw conclusions on their association with physical activity outcomes. In summary, for adults, there is convincing evidence of a positive association with physical-activity outcomes for urban form indicators related to: accessibility to destinations, shorter distance and greater availability of transit, greater walkability and diversity of land uses (Table 5).
Table 5. Ranking of urban form indicators
Ranking of indicators – adults1 Destination 7/9 (78%)2 Distance to transit 3/4 (75%)3 Aggregated neighbourhood measures 15/22 (68%)4 Diversity of land use 4/6 (67%)5 Density 3/9 (33%)6 Design 10/35 (26%)Insufficient evidence for ranking7 Safety 6/6 (100%)
THE EFFECTS OF URBAN FORM ON HEALTH: COSTS AND BENEFITS 22
3. Modelling exerciseResearch Question 3: What is the dollar value of the health externalities associated with changes in urban form? Methods
We estimated the economic outcomes of changes in selected urban form attributes (quality score more than 35%) that indicated convincing evidence of an association in the expected direction (diversity, destinations, distance to transit and aggregated neighbourhood measures). We intended to pool results of effect estimates per urban form indicator by applying a meta-analysis method that accounts for the quality of studies.62 Given the heterogeneity of exposure and outcome measures, this was not possible. Instead, we based the selection of effect estimates to model on studies that met a quality threshold. However, given the wide diversity of economic outcomes per modelled category, we calculated the weighted average by applying the MetaXL quality effects model.62
Quality assessment
We developed and applied a tailored tool that was based on others used in past related reviews.31, 63, 64 We did not apply existing tools, as they were missing important components. For example, we did not find any criteria that assessed for self-selection, which has been widely recognised as inflating the association of physical-activity outcomes with urban form in cross-sectional studies.30 Our quality-criteria tool was discussed with a group of experts in the field for agreement on items and weights.
23 RAPID REVIEW
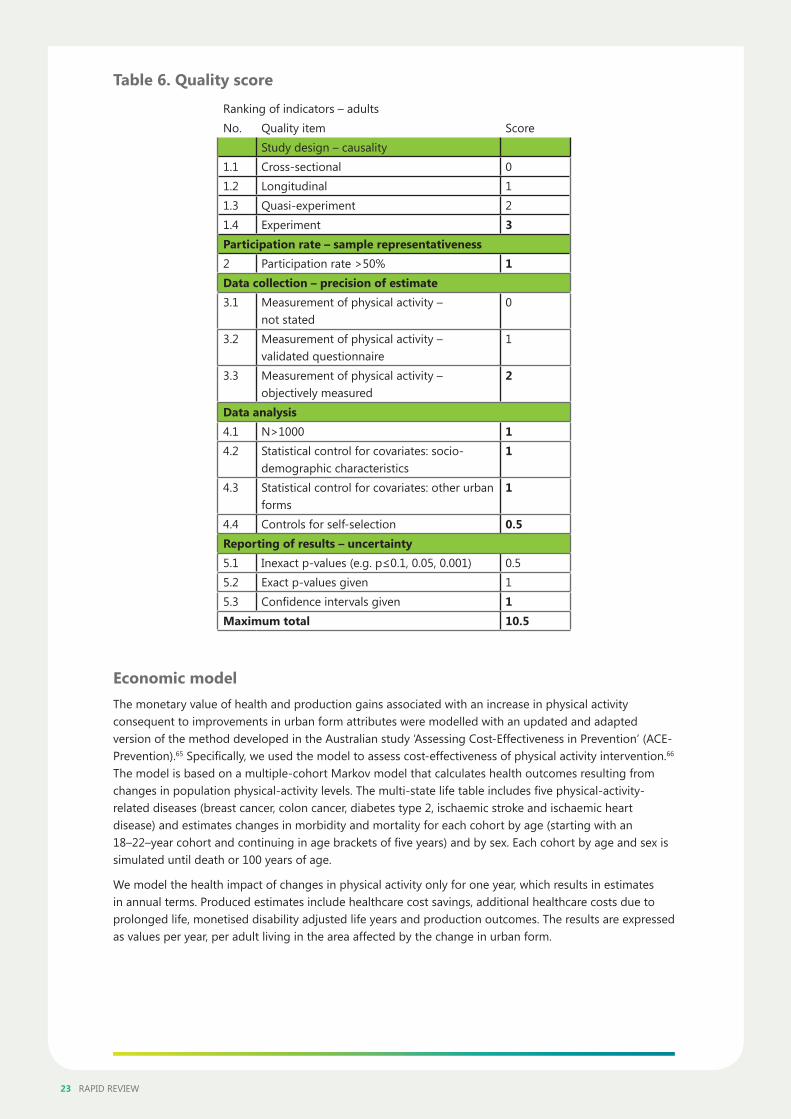
Table 6. Quality score
Ranking of indicators – adultsNo. Quality item Score
Study design – causality 1.1 Cross-sectional 01.2 Longitudinal 11.3 Quasi-experiment 21.4 Experiment 3Participation rate – sample representativeness2 Participation rate >50% 1Data collection – precision of estimate3.1 Measurement of physical activity –
not stated0
3.2 Measurement of physical activity – validated questionnaire
1
3.3 Measurement of physical activity – objectively measured
2
Data analysis4.1 N>1000 14.2 Statistical control for covariates: socio-
demographic characteristics1
4.3 Statistical control for covariates: other urban forms
1
4.4 Controls for self-selection 0.5Reporting of results – uncertainty5.1 Inexact p-values (e.g. p≤0.1, 0.05, 0.001) 0.55.2 Exact p-values given 15.3 Confidence intervals given 1Maximum total 10.5
Economic modelThe monetary value of health and production gains associated with an increase in physical activity consequent to improvements in urban form attributes were modelled with an updated and adapted version of the method developed in the Australian study ‘Assessing Cost-Effectiveness in Prevention’ (ACE-Prevention).65 Specifically, we used the model to assess cost-effectiveness of physical activity intervention.66 The model is based on a multiple-cohort Markov model that calculates health outcomes resulting from changes in population physical-activity levels. The multi-state life table includes five physical-activity-related diseases (breast cancer, colon cancer, diabetes type 2, ischaemic stroke and ischaemic heart disease) and estimates changes in morbidity and mortality for each cohort by age (starting with an 18–22–year cohort and continuing in age brackets of five years) and by sex. Each cohort by age and sex is simulated until death or 100 years of age.
We model the health impact of changes in physical activity only for one year, which results in estimates in annual terms. Produced estimates include healthcare cost savings, additional healthcare costs due to prolonged life, monetised disability adjusted life years and production outcomes. The results are expressed as values per year, per adult living in the area affected by the change in urban form.
THE EFFECTS OF URBAN FORM ON HEALTH: COSTS AND BENEFITS 24
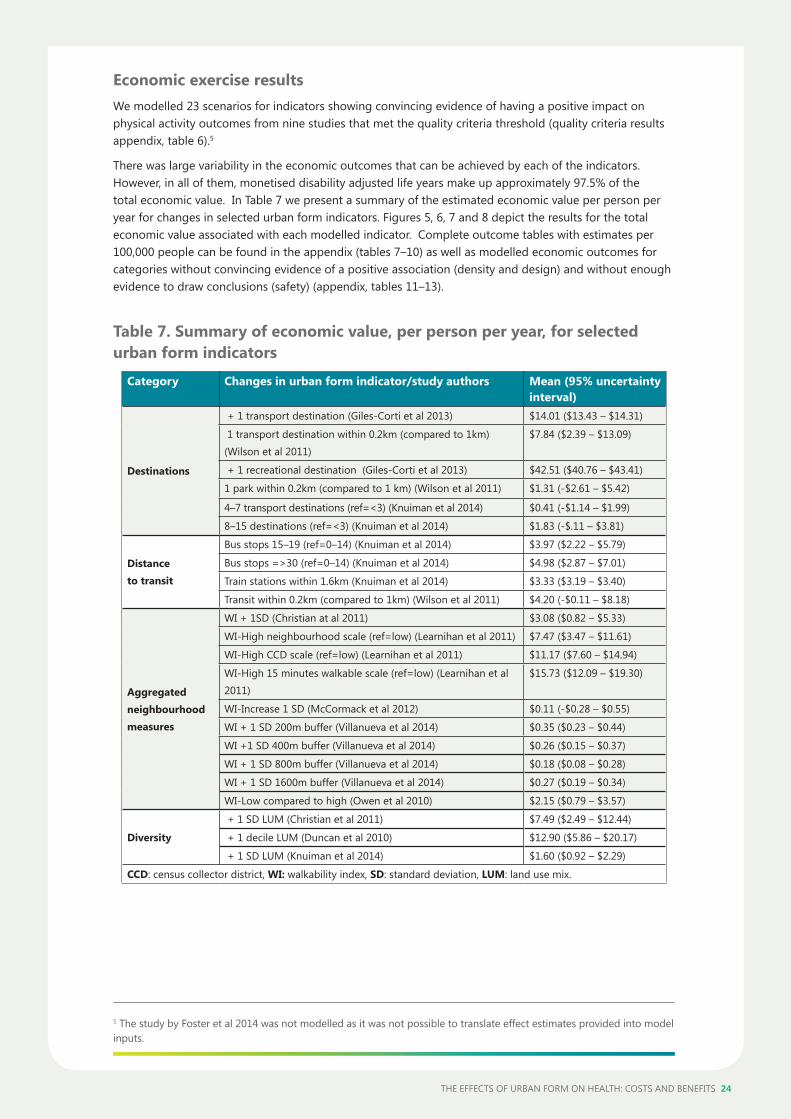
Economic exercise resultsWe modelled 23 scenarios for indicators showing convincing evidence of having a positive impact on physical activity outcomes from nine studies that met the quality criteria threshold (quality criteria results appendix, table 6).5
There was large variability in the economic outcomes that can be achieved by each of the indicators. However, in all of them, monetised disability adjusted life years make up approximately 97.5% of the total economic value. In Table 7 we present a summary of the estimated economic value per person per year for changes in selected urban form indicators. Figures 5, 6, 7 and 8 depict the results for the total economic value associated with each modelled indicator. Complete outcome tables with estimates per 100,000 people can be found in the appendix (tables 7–10) as well as modelled economic outcomes for categories without convincing evidence of a positive association (density and design) and without enough evidence to draw conclusions (safety) (appendix, tables 11–13).
Table 7. Summary of economic value, per person per year, for selected urban form indicators
Category Changes in urban form indicator/study authors Mean (95% uncertainty interval)
Destinations
+ 1 transport destination (Giles-Corti et al 2013) $14.01 ($13.43 – $14.31)
1 transport destination within 0.2km (compared to 1km) (Wilson et al 2011)
$7.84 ($2.39 – $13.09)
+ 1 recreational destination (Giles-Corti et al 2013) $42.51 ($40.76 – $43.41)
1 park within 0.2km (compared to 1 km) (Wilson et al 2011) $1.31 (-$2.61 – $5.42)
4–7 transport destinations (ref=<3) (Knuiman et al 2014) $0.41 (-$1.14 – $1.99)
8–15 destinations (ref=<3) (Knuiman et al 2014) $1.83 (-$.11 – $3.81)
Distance to transit
Bus stops 15–19 (ref=0–14) (Knuiman et al 2014) $3.97 ($2.22 – $5.79)
Bus stops =>30 (ref=0–14) (Knuiman et al 2014) $4.98 ($2.87 – $7.01)
Train stations within 1.6km (Knuiman et al 2014) $3.33 ($3.19 – $3.40)
Transit within 0.2km (compared to 1km) (Wilson et al 2011) $4.20 (-$0.11 – $8.18)
Aggregated neighbourhood measures
WI + 1SD (Christian at al 2011) $3.08 ($0.82 – $5.33)
WI-High neighbourhood scale (ref=low) (Learnihan et al 2011) $7.47 ($3.47 – $11.61)
WI-High CCD scale (ref=low) (Learnihan et al 2011) $11.17 ($7.60 – $14.94)
WI-High 15 minutes walkable scale (ref=low) (Learnihan et al 2011)
$15.73 ($12.09 – $19.30)
WI-Increase 1 SD (McCormack et al 2012) $0.11 (-$0.28 – $0.55)
WI + 1 SD 200m buffer (Villanueva et al 2014) $0.35 ($0.23 – $0.44)
WI +1 SD 400m buffer (Villanueva et al 2014) $0.26 ($0.15 – $0.37)
WI + 1 SD 800m buffer (Villanueva et al 2014) $0.18 ($0.08 – $0.28)
WI + 1 SD 1600m buffer (Villanueva et al 2014) $0.27 ($0.19 – $0.34)
WI-Low compared to high (Owen et al 2010) $2.15 ($0.79 – $3.57)
Diversity
+ 1 SD LUM (Christian et al 2011) $7.49 ($2.49 – $12.44)
+ 1 decile LUM (Duncan et al 2010) $12.90 ($5.86 – $20.17)
+ 1 SD LUM (Knuiman et al 2014) $1.60 ($0.92 – $2.29)
CCD: census collector district, WI: walkability index, SD: standard deviation, LUM: land use mix.
5 The study by Foster et al 2014 was not modelled as it was not possible to translate effect estimates provided into model inputs.
25 RAPID REVIEW
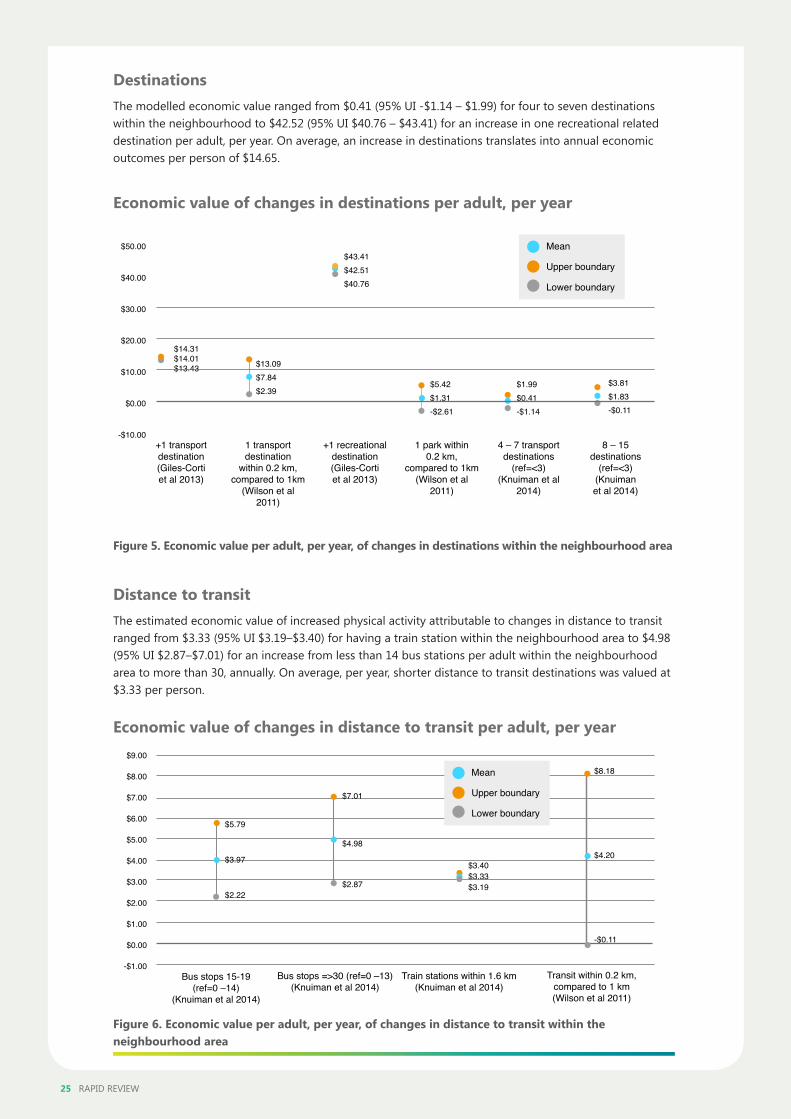
DestinationsThe modelled economic value ranged from $0.41 (95% UI -$1.14 – $1.99) for four to seven destinations within the neighbourhood to $42.52 (95% UI $40.76 – $43.41) for an increase in one recreational related destination per adult, per year. On average, an increase in destinations translates into annual economic outcomes per person of $14.65.
Economic value of changes in destinations per adult, per year
+1 transport destination (Giles-Corti et al 2013)
+1 recreational destination (Giles-Corti et al 2013)
1 transport destination
within 0.2 km, compared to 1km
(Wilson et al 2011)
1 park within 0.2 km,
compared to 1km (Wilson et al
2011)
4 – 7 transport destinations
(ref=<3)(Knuiman et al
2014)
Mean
Upper boundary
Lower boundary
8 – 15 destinations
(ref=<3)(Knuiman et al 2014)
$14.31$14.01$13.43
$50.00
$40.00
$30.00
$20.00
$10.00
$0.00
-$10.00
$5.42$1.31-$2.61
$3.81$1.83-$0.11
$43.41$42.51$40.76
$13.09$7.84$2.39
$1.99$0.41-$1.14
Figure 5. Economic value per adult, per year, of changes in destinations within the neighbourhood area
Distance to transit The estimated economic value of increased physical activity attributable to changes in distance to transit ranged from $3.33 (95% UI $3.19–$3.40) for having a train station within the neighbourhood area to $4.98 (95% UI $2.87–$7.01) for an increase from less than 14 bus stations per adult within the neighbourhood area to more than 30, annually. On average, per year, shorter distance to transit destinations was valued at $3.33 per person.
Economic value of changes in distance to transit per adult, per year
Bus stops 15-19 (ref=0 –14)
(Knuiman et al 2014)
Bus stops =>30 (ref=0 –13) (Knuiman et al 2014)
Train stations within 1.6 km (Knuiman et al 2014)
Transit within 0.2 km, compared to 1 km(Wilson et al 2011)
$9.00
$8.00
$7.00
$6.00
$5.00
$4.00
$3.00
$2.00
$1.00
$0.00
-$1.00
$5.79
$3.97
$2.22
$3.40$3.33$3.19
$7.01
$4.98
$2.87
$8.18
$4.20
-$0.11
Mean
Upper boundary
Lower boundary
Figure 6. Economic value per adult, per year, of changes in distance to transit within the neighbourhood area
THE EFFECTS OF URBAN FORM ON HEALTH: COSTS AND BENEFITS 26
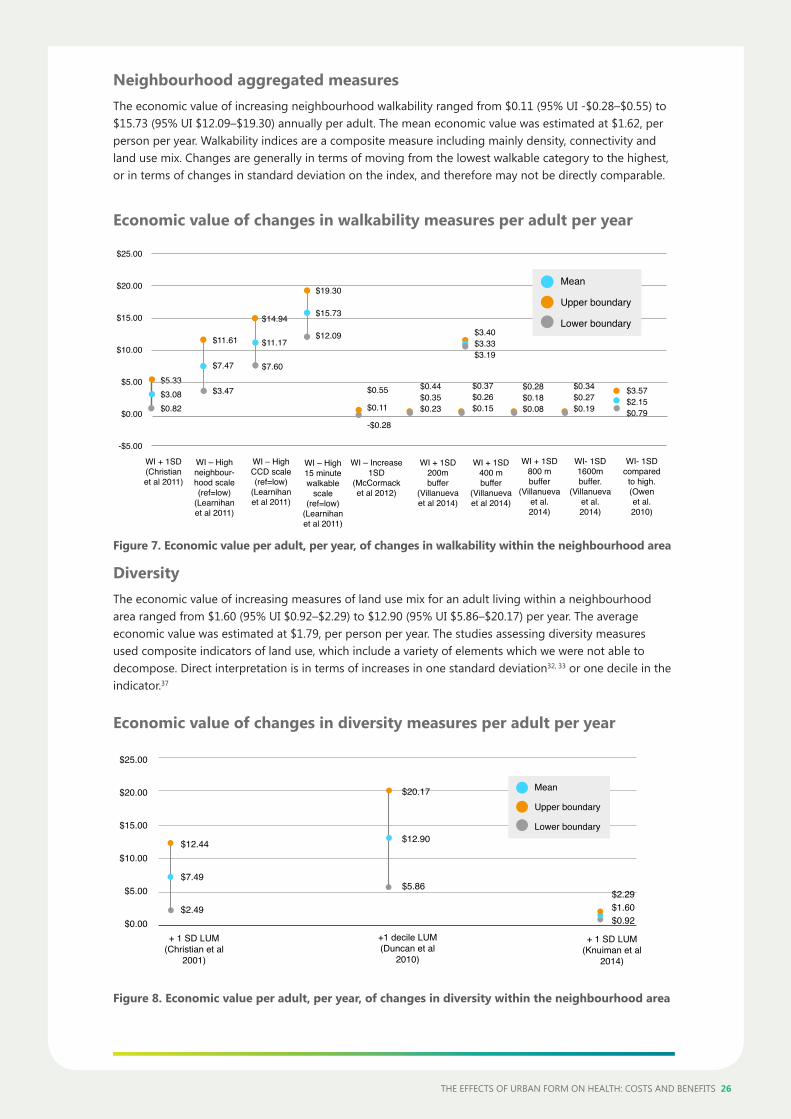
Neighbourhood aggregated measuresThe economic value of increasing neighbourhood walkability ranged from $0.11 (95% UI -$0.28–$0.55) to $15.73 (95% UI $12.09–$19.30) annually per adult. The mean economic value was estimated at $1.62, per person per year. Walkability indices are a composite measure including mainly density, connectivity and land use mix. Changes are generally in terms of moving from the lowest walkable category to the highest, or in terms of changes in standard deviation on the index, and therefore may not be directly comparable.
Economic value of changes in walkability measures per adult per year
WI + 1SD (Christian et al 2011)
WI – High CCD scale (ref=low)
(Learnihan et al 2011)
WI – High neighbour-hood scale (ref=low)
(Learnihan et al 2011)
WI – High 15 minute walkable
scale (ref=low)
(Learnihan et al 2011)
WI – Increase 1SD
(McCormack et al 2012)
WI + 1SD 200m buffer
(Villanueva et al 2014)
WI + 1SD 400 m buffer
(Villanueva et al 2014)
WI + 1SD 800 m buffer
(Villanueva et al.2014)
WI- 1SD1600m buffer.
(Villanueva et al.2014)
WI- 1SDcompared
to high. (Owen et al.2010)
$25.00
$20.00
$15.00
$10.00
$5.00
$0.00
-$5.00
$5.33$3.08$0.82
$11.61
$7.47
$3.47
$14.94
$11.17
$7.60
$3.40$3.33$3.19
$0.37$0.26$0.15
$0.28$0.18$0.08
$0.34$0.27$0.19
$3.57$2.15$0.79
$19.30
$15.73
$12.09
$0.55
$0.11
-$0.28
$0.44$0.35$0.23
Mean
Upper boundary
Lower boundary
Figure 7. Economic value per adult, per year, of changes in walkability within the neighbourhood area
DiversityThe economic value of increasing measures of land use mix for an adult living within a neighbourhood area ranged from $1.60 (95% UI $0.92–$2.29) to $12.90 (95% UI $5.86–$20.17) per year. The average economic value was estimated at $1.79, per person per year. The studies assessing diversity measures used composite indicators of land use, which include a variety of elements which we were not able to decompose. Direct interpretation is in terms of increases in one standard deviation32, 33 or one decile in the indicator.37
Economic value of changes in diversity measures per adult per year
$25.00
$20.00
$15.00
$10.00
$5.00
$0.00+ 1 SD LUM
(Christian et al 2001)
+1 decile LUM (Duncan et al
2010)
+ 1 SD LUM (Knuiman et al
2014)
$12.44
$7.49
$2.49$2.29$1.60$0.92
$20.17
$12.90
$5.86
Mean
Upper boundary
Lower boundary
Figure 8. Economic value per adult, per year, of changes in diversity within the neighbourhood area
27 RAPID REVIEW
4. Conclusion and recommendationsThis evidence review and economic-modelling exercise was conducted to provide information on the association between urban form attributes and physical activity outcomes and the economic value of changes in urban form, via its impact on physical activity in the contemporary Australian context.
As a whole, the body of recent Australian evidence confirms an effect of urban form on physical activity for adults, with a wide range of indicators showing an association with various forms of physical activity. This report ranks broad categories of indicators by the proportion of associations that show a statistically significant relationship with physical activity in the expected direction. Built environment attributes showing convincing evidence of an association with physical activity outcomes include destinations within walking or cycling distance of residence, diversity of land uses, distance to bus stops, train stations, ferry terminals, etc. and measures of walkability. The Australian evidence for children and adolescents was not sufficient to draw conclusions.
The Australian literature provides a range of values to quantify the health benefits per kilometre walked or cycled. However, these are based on reports prepared for government bodies and other grey literature. We only recommend those values for which we could trace data sources and methods and were comprehensive (included mortality and morbidity of a range of physical activity related diseases). SKM and PwC8 estimated $1.12 per kilometre cycled and $1.68 per kilometre walked. These values were also proposed in the study conducted by Mulley et al6 and are in line with recommendations from the NSW Department of Transport. We estimated the potential economic value of changing selected urban form indicators that indicated convincing evidence of having a positive impact on physical activity. We only modelled the best quality studies, since meta-analysing the associations to provide a single effect-estimate was not possible due to heterogeneity in outcomes and exposure measures. Overall impacts of up to $42.51 (95% CI $40.76 – $43.31) were estimated for an increase in one recreational destination within the neighbourhood area.
Strengths of this study include the systematic review of evidence that is recent and directly applicable to the Australian context, the ascertainment of study quality, the use of an established model with results that have been published in high-ranking peer-reviewed journals, and the integration of these various elements to answer questions of direct policy relevance.
In all, this review shows there is Australian and international evidence for an association of urban form characteristics with physical activity behaviours, and of physical activity with health and health-related economic outcomes.
LimitationsThe diverse ways different studies use to report the relationship between urban form and physical activity outcomes hinder comparison and pooling, and in some cases insufficient information is provided to enable meaningful interpretation. More precise measurement of relevant exposures is likely to show stronger effects in future research, and more uniform measurement methods would facilitate pooling of results. Similarly, the limited accuracy with which physical activity is measured in past studies probably results in sizeable underestimation of the impact on disease outcomes in our model (regression dilution bias67).
Moreover, the great majority of research is based on cross-sectional studies, which does not allow for a direct causal interpretation. The association can be due to the built environment influencing physical activity; this is the hypothesis underlying this research. Alternatively, it could be due to physically active people choosing to live in neighbourhoods that facilitate that behaviour.
By adjusting for self-selection, some studies try to avoid this reverse causal interpretation. McCormack and Shiell30 systematically reviewed the international literature and found that adjusting for self-selection tended to diminish the strength of the associations, but only to a small extent.
Finally, the associations could be due to other (observed or unobserved) factors causing both. Most studies use statistical adjustment to minimise the impact of measured factors. It is unclear what unobserved factors could explain the associations. In the model, the proportion of the population that is sufficiently active (~30%) receives no benefit from additional physical activity, which may have led to

28 RAPID REVIEW
underestimation of effects. The modelled economic impacts do not include the production losses that result from absenteeism and presenteeism attributable to physical-activity-related diseases.
5. Recommendations• Physical-activity-related impacts on health and health-related economic outcomes should be included in
cost-benefit analyses in urban planning.
• Joint research involving both health researchers and urban planners is required to select urban form indicators that are most suitable for use in planning and cost-benefit analysis, and to establish guidelines on the calculation of the associated economic values. Initial efforts could usefully focus on indicators for destinations within walking distance of residence, diversity of land use, distance to transit and street connectivity. The current research methods can assist in such research.
THE EFFECTS OF URBAN FORM ON HEALTH: COSTS AND BENEFITS 29
7. References1.Bull FC, Armstrong TP, Dixon T, Ham S, Neiman A, Pratt M. Physical inactivity. Comparative quantification of health risks: global and regional burden of disease due to selected major risk factors. World Health Organization. Volume 1. 2004;729–81. Available from: www.who.int/healthinfo/global_burden_disease/cra/en/
2. Lee IM, Shiroma EJ, Lobelo F, Puska P, Blair SN, Katzmarzyk PT, et al. Effect of physical inactivity on major non-communicable diseases worldwide: an analysis of burden of disease and life expectancy. Lancet. Jul 2012;380(9838):219–29.
3. Cadilhac DA, Cumming TB, Sheppard L, Pearce DC, Carter R, Magnus A. The economic benefits of reducing physical inactivity: an Australian example. Int J Behav Nutr Phys Act. Sep 2011;8:99. doi:10.1186/1479-5868-8-99
4. World Health Organization. Interventions on diet and physical activity: what works: summary report. Geneva, Switzerland. 2009. Available from: www.who.int/dietphysicalactivity/summary-report-09.pdf
5. Sallis JF, Cervero RB, Ascher W, Henderson KA, Kraft MK, Kerr J. An ecological approach to creating active living communities. Annu Rev Public Health. 2006;27:297–22.
6. Mulley C, Tyson R, McCue P, Rissel C, Munro C. Valuing active travel: Including the health benefits of sustainable transport in transportation appraisal frameworks. Research in Transportation Business & Management. 2013;7:27–34.
7. Gunn LD, Lee Y, Geelhoed E, Shiell A, Giles-Corti B. The cost-effectiveness of installing sidewalks to increase levels of transport-walking and health. Prev Med. 2014;67:322–29.
8. Sinclair Knight and PriceWaterhouseCoopers. Benefits of the inclusion of active transport in infrastructure projects. Queensland. Transport and Main Roads, 2011. Available from: www.cbdbug.org.au/wp-content/uploads/north-brisbane-cycleway/135-00825-file8.pdf
9. AECOM. Inner Sydney regional bicycle network – demand assessment and economic appraisal. Sydney. City of Sydney, 2010. Available from: http://cdn.sydneycycleways.net/wp-content/uploads/2014/12/AECOM_ReportApril2010-web.pdf
10. Fishman E, Ker I, Garrard J, Litman T, Rissel C. Cost and health benefit of active transport in Queensland. Prepared by CATALYST for Health Promotion Queensland, 2011.
11. Ker I. Overcoming the inferiority complex: demonstrating the value of active transport. VeloCity Global Conference. May 2014. Adelaide, SA. Available from: www.slideshare.net/Catalystian/140528-ik-paper-v20
12. PricewaterhouseCoopers. Evaluation of the costs and benefits to the community of financial investment in cycling programs and projects in New South Wales: final report. Sydney, NSW. Roads and Traffic Authority of NSW and Department of Environment and Climate Change. Apr 2009. Available from: www.pcal.nsw.gov.au/__data/assets/pdf_file/0008/90899/Evaluation_of_NSW_cycling_study.pdf
13. PricewaterhouseCoopers. Estimating the benefits of walking: a cost benefit methodology. Australia. Nov 2010.
14. Transport for NSW. Principles and guidelines for economic appraisal of transport investment and initiatives. Transport for NSW, Mar 2013. Available from: www.transport.nsw.gov.au/sites/default/files/b2b/publications/tfnsw-principles-and-guidelines-for-economic-appraisal-of-transport-initiatives.pdf
15. Office of Best Practice Regulation. Best practice regulation guidance note: value of statistical life. Department of Prime Minister and Cabinet. Australian Goverment, 2014. Available from: www.dpmc.gov.au/office-best-practice-regulation/publication/best-practice-regulation-guidance-note-value-statistical-life
16. Econtech, for Medibank Private. The cost of physical inactivity. Oct 2008. Available from: www.medibank.com.au/client/documents/pdfs/the_cost_of_physical_inactivity_08.pdf
17. Genter JA, Donovan S, Petrenas B, Badland H. Valuing the health benefits of active transport modes. Dec 2008. Available from: www.nzta.govt.nz/assets/resources/research/reports/359/docs/359.pdf
18. Econtech, for Medibank Private. The cost of physical inactivity; what is the lack of participation in physical activity costing Australia? Aug 2007. Available from: www.medibank.com.au/client/documents/pdfs/pyhsical_inactivity.pdf
19. Jardine A, Endo T, Bright M, Macleod SL, Harper C. Risk factor impact on the burden of disease and injury in Queensland, 2007. Queensland Burden of Disease and Injury. Dec 2010. Available from: www.health.qld.gov.au/publications/research-reports/population-health/c6_series2.pdf
20. Andersen L, Schnohr P, Schroll M, Hein H. All-cause mortality associated with physical activity during leisure time, work, sports, and cycling to work. Arch Intern Med. Jun 2000;160(11):1621–28.
21. Ewing R, Cervero R. Travel and the Built Environment: A Meta-Analysis. J Am Plan Assoc. May 2010;76(3):265–94. doi: 10.1080/01944361003766766
23. Ding D, Sallis JF, Kerr J, Lee S, Rosenberg DE. Neighborhood environment and physical activity among youth: a review. Am J Prev Med. Oct 2011;41(4):442–55. doi: 10.1016/j.amepre.2011.06.036
24. Owen N, Humpel N, Leslie E, Bauman A, Sallis JF. Understanding environmental influences on walking: review and research agenda. Am J Prev Med. Jul 2004;27(1):67–76.
25. Saelens B, Sallis J, Frank L. Environmental correlates of walking and cycling: findings from the transportation, urban design, and planning literatures. Ann Behav Med. 2003;25(2):80–91.
30 RAPID REVIEW
26. Van Cauwenberg J, De Bourdeaudhuij I, De Meester F, Van Dyck D, Salmon J, Clarys P, et al. Relationship between the physical environment and physical activity in older adults: a systematic review. Health Place. Mar 2011;17(2):458–69. doi: 10.1016/j.healthplace.2010.11.010.
27. Van Holle V, Deforche B, Van Cauwenberg J, Goubert L, Maes L, Van de Weghe N, et al. Relationship between the physical environment and different domains of physical activity in European adults: a systematic review. BMC public health. Sep 2012;12(1):807. doi: 10.1186/1471-2458-12-807
28. Giles-Corti B, Bull F, Knuiman M, McCormack G, Van Niel K, Timperio A, et al. The influence of urban design on neighbourhood walking following residential relocation: longitudinal results from the RESIDE study. Soc Sci Med. Jan 2013;77:20–30. doi: 10.1016/j.socscimed.2012.10.016.
29. Giles-Corti B, Foster S, Ryan K. Increasing density in Australia: maximising the health benefits and minimising harm. National Heart Foundation. Mar 2012. Available from: https://heartfoundation.org.au/images/uploads/publications/Increasing-density-in-Australia-Evidence-Review-2012-trevor.pdf
30. McCormack GR, Shiell A. In search of causality: A systematic review of the relationship between the built environment and physical activity among adults. Int J Behav Nutr Phys Act. 2011;8(1):125. doi:10.1186/1479-5868-8-125
31. Grasser G, Van Dyck D, Titze S, Stronegger W. Objectively measured walkability and active transport and weight-related outcomes in adults: a systematic review. Int J Public Health. Aug 2013;58(4):615–25. doi: 10.1007/s00038-012-0435-0
32. Christian HE, Bull FC, Middleton NJ, Knuiman MW, Divitini ML, Hooper P, et al. How important is the land use mix measure in understanding walking behaviour? Results from the RESIDE study. Int J Behav Nutr Phys Act. 2011;8:55. doi: 10.1186/1479-5868-8-55
33. Knuiman MW, Christian HE, Divitini ML, Foster SA, Bull FC, Badland HM, et al. A longitudinal analysis of the influence of the neighborhood built environment on walking for transportation: the RESIDE study. Am J Epidemiol. Sep 2014;180(5):453–61. doi: 10.1093/aje/kwu171
34. McKibbin M. The influence of the built environment on mode choice - evidence from the journey to work in Sydney. Australian Transport Research Forum 2011 Proceedings – 34th Australasian Transport Research Forum. Available from: http://atrf.info/papers/2011/2011_McKibbin.pdf
35. Wilson L-AM, Giles-Corti B, Burton NW, Giskes K, Haynes M, Turrell G. The association between objectively measured neighborhood features and walking in middle-aged adults. Am J Health Promot. Mar-Apr 2011;25(4):e12-e21.
36. Foster S, Knuiman M, Villanueva K, Wood L, Christian H, Giles-Corti B. Does walkable neighbourhood design influence the association between objective crime and walking? Int J Behav Nutr Phys Act. 2014;11(1):100. doi:10.1186/s12966-014-0100-5
37. Duncan MJ, Winkler E, Sugiyama T, Cerin E, duToit L, Leslie E, et al. Relationships of land use mix with walking for transport: do land uses and geographical scale matter? J Urban Health. Sep 2010;87(5):782–95. doi: 10.1007/s11524-010-9488–7
38. Koohsari MJ, Sugiyama T, Lamb KE, Villanueva K, Owen N. Street connectivity and walking for transport: role of neighborhood destinations. Prev Med. Sep 2014;66:118–22. doi: 10.1016/j.ypmed.2014.06.019.
39. Heesch KC, Giles-Corti B, Turrell G. Cycling for transport and recreation: associations with socio-economic position, environmental perceptions, and psychological disposition. Prev Med. 2014;63:29–35. doi: 10.1016/j.ypmed.2014.03.003
40. Koohsari MJ, Karakiewicz JA, Kaczynski AT. Public open space and walking: the role of proximity, perceptual qualities of the surrounding built environment, and street configuration. Environment and Behavior. Aug 2013;45(6):706–36.
41. Sugiyama T, Leslie E, Giles-Corti B, Owen N. Physical activity for recreation or exercise on neighbourhood streets: associations with perceived environmental attributes. Health Place. Dec 2009;15(4):1058–63. doi: 10.1016/j.healthplace.2009.05.001.
42. Titze S, Giles-Corti B, Knuiman MW, Pikora TJ, Timperio A, Bull FC, et al. Associations between intrapersonal and neighborhood environmental characteristics and cycling for transport and recreation in adults: baseline results from the RESIDE study. J Phys Act Health. 2010;7(4):423–31.
43. Leslie E, Cerin E, Kremer P. Perceived neighborhood environment and park use as mediators of the effect of area socio-economic status on walking behaviors. J Phys Act Health. Nov 2010;7(6):802–10.
44. McCormack GR, Shiell A, Giles-Corti B, Begg S, Veerman JL, Geelhoed E, et al. The association between sidewalk length and walking for different purposes in established neighborhoods. Int J Behav Nutr Phys Act. Aug 2012;9:92. doi:10.1186/1479-5868-9-92
45. Koohsari MJ, Kaczynski AT, Giles-Corti B, Karakiewicz JA. Effects of access to public open spaces on walking: Is proximity enough? Landscape and urban planning. Sep 2013;117:92–9. doi:10.1016/j.landurbplan.2013.04.020
46. Sugiyama T, Cerin E, Owen N, Oyeyemi AL, Conway TL, Van Dyck D, et al. Perceived neighbourhood environmental attributes associated with adults[U+05F3] recreational walking: IPEN adult study in 12 countries. Health Place. Jul 2014;28:22–30. doi: 10.1016/j.healthplace.2014.03.003
47. Astell-Burt T, Feng X, Kolt GS. Green space is associated with walking and moderate-to-vigorous physical activity (MVPA) in middle-to-older-aged adults: findings from 203 883 Australians in the 45 and up study. Br J Sports Med. Mar 2014;48(5):404–06. doi: 10.1136/bjsports-2012-092006
THE EFFECTS OF URBAN FORM ON HEALTH: COSTS AND BENEFITS 31
48. Sugiyama T, Giles-Corti B, Summers J, du Toit L, Leslie E, Owen N. Initiating and maintaining recreational walking: a longitudinal study on the influence of neighborhood green space. Prev Med. Sep 2013;57(3):178–82. doi: 10.1016/j.ypmed.2013.05.015
49. Astell-Burt T, Feng X, Kolt GS. Identification of the impact of crime on physical activity depends upon neighbourhood scale: multilevel evidence from 203,883 Australians. Health Place. Jan 2015;31:120–23. doi:10.1016/j.healthplace.2014.11.007
50. Learnihan V, Van Niel KP, Giles-Corti B, Knuiman M. Effect of scale on the links between walking and urban design. Geographical Research. May 2011;49(2):183–91. doi: 10.1111/j.1745-5871.2011.00689.x
51. Shimura H, Sugiyama T, Winkler E, Owen N. High neighborhood walkability mitigates declines in middle-to-older aged adults’ walking for transport. J Phys Act Health. Sep 2012;9(7):1004–08.
52. Cleland VJ, Ball K, Crawford D. Is a perceived supportive physical environment important for self-reported leisure time physical activity among socioeconomically disadvantaged women with poor psychosocial characteristics? An observational study. BMC Public Health. Mar 2013;13:280. doi: 10.1186/1471-2458-13-280
53. Villanueva K, Knuiman M, Nathan A, Giles-Corti B, Christian H, Foster S, et al. The impact of neighborhood walkability on walking: does it differ across adult life stage and does neighborhood buffer size matter? Health Place. Jan 2014;25:43–46. doi: 10.1016/j.healthplace.2013.10.005
54. Owen N, De De Bourdeaudhuij I, Sugiyama T, Leslie E, Cerin E, Van Van Dyck D, et al. Bicycle use for transport in an Australian and a Belgian city: associations with built-environment attributes. J Urban Health. Mar 2010;87(2):189–98. doi: 10.1007/s11524-009-9424-x
55. Pont K, Ziviani J, Wadley D, Bennett S, Abbott R. Environmental correlates of children’s active transportation: a systematic literature review. Health Place. Sep 2009;15(3):849–62. doi: 10.1016/j.healthplace.2009.02.002
56. Pont K, Wadley D, Ziviani J, Khan A. The influence of urban form and family decision making on children’s travel to school. Journal of Urban Design. Aug 2013;18(3):363–82.
57. Trapp GSA, Giles-Corti B, Christian HE, Bulsara M, Timperio AF, McCormack GR, et al. On your bike! A cross-sectional study of the individual, social and environmental correlates of cycling to school. Int J Behav Nutr Phys Act. 2011;8(1):123. doi: 10.1186/1479-5868-8-123
58. Trapp GSA, Giles-Corti B, Christian HE, Bulsara M, Timperio AF, McCormack GR, et al. Increasing children’s physical activity: individual, social, and environmental factors associated with walking to and from school. Health Educ Behav. Apr 2012;39(2):172–82.
59. Giles-Corti B, Wood G, Pikora T, Learnihan V, Bulsara M, Van Niel K, et al. School site and the potential to walk to school: The impact of street connectivity and traffic exposure in school neighborhoods. Health Place. Mar 2011;17(2):545–50. doi: 10.1016/jhealthplace.2010.12.001
60. Prins RRG, Ball K, Timperio A, Salmon J, Oenema A, Brug J, et al. Associations between availability of facilities within three different neighbourhood buffer sizes and objectively assessed physical activity in adolescents. Health Place. Nov 2011;17(6):1228–34. doi:10.1016/j.healthplace.2011.07.012
61. D’Haese S, Timperio A, Veitch J, Cardon G, Van Dyck D, Salmon J. Neighborhood perceptions moderate the association between the family environment and children’s objectively assessed physical activity. Health Place. Nov 2013;24:203–9. doi: 10.1016/j.healthplace.2013.09.012
62. Barendregt JJ. Epigear [cited 2015 July 31]. Available from: www.epigear.com/index_files/metaxl.html
63. McGrath L, Hopkins W, Hinckson E. Associations of objectively measured built-environment attributes with youth moderate-vigorous physical activity: a systematic review and meta-analysis. Sports Med. Jun 2015;45(6):841–65.
64. Singh A, Uijtdewilligen L, Twisk JR, van Mechelen W, Chinapaw MM. Physical activity and performance at school: a systematic review of the literature including a methodological quality assessment. Arch Pediatr Adolesc Med. Jan 2012;166(1):49–55. doi:10.1001/archpediatrics.2011.716.
65. Vos T, Carter R, Barendregt J, C. M, Veerman J, Magnus A, et al. Assessing cost-effectiveness in prevention (ACE-prevention): Final Report. University of Queensland, Brisbane and Deakin University, Melbourne. 2010.
66. Cobiac LJ, Vos T, Barendregt JJ. Cost-effectiveness of interventions to promote physical activity: a modelling study. PLoS Med Jul 2009;6(7) doi:10.137/journal.pmed.1000110
67. Hutcheon JA, Chiolero A, Hanley JA. Random measurement error and regression dilution bias. BMJ [Internet] 2010;340:c2289. doi: 10.1136/bmj.c2289
32 RAPID REVIEW
Appendix
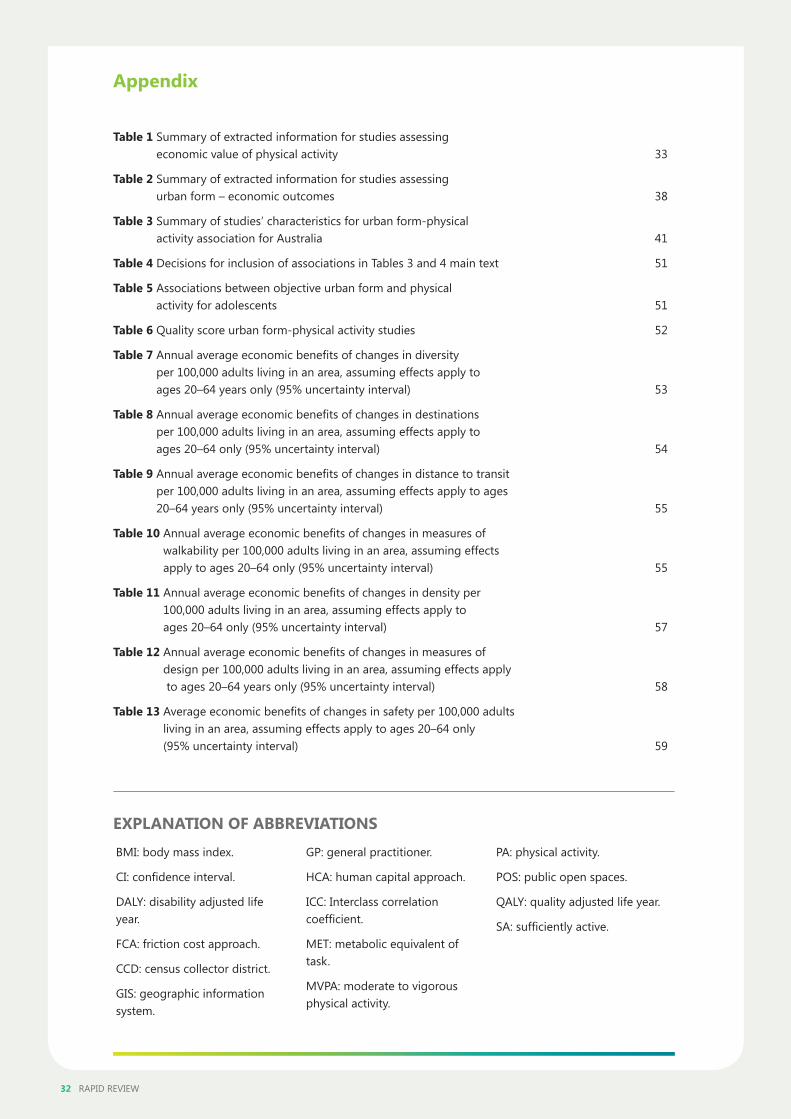
Table 1 Summary of extracted information for studies assessing economic value of physical activity 33
Table 2 Summary of extracted information for studies assessing urban form – economic outcomes 38
Table 3 Summary of studies’ characteristics for urban form-physical activity association for Australia 41
Table 4 Decisions for inclusion of associations in Tables 3 and 4 main text 51
Table 5 Associations between objective urban form and physical activity for adolescents 51
Table 6 Quality score urban form-physical activity studies 52
Table 7 Annual average economic benefits of changes in diversity per 100,000 adults living in an area, assuming effects apply to ages 20–64 years only (95% uncertainty interval) 53
Table 8 Annual average economic benefits of changes in destinations per 100,000 adults living in an area, assuming effects apply to ages 20–64 only (95% uncertainty interval) 54
Table 9 Annual average economic benefits of changes in distance to transit per 100,000 adults living in an area, assuming effects apply to ages 20–64 years only (95% uncertainty interval) 55
Table 10 Annual average economic benefits of changes in measures of walkability per 100,000 adults living in an area, assuming effects apply to ages 20–64 only (95% uncertainty interval) 55
Table 11 Annual average economic benefits of changes in density per 100,000 adults living in an area, assuming effects apply to ages 20–64 only (95% uncertainty interval) 57
Table 12 Annual average economic benefits of changes in measures of design per 100,000 adults living in an area, assuming effects apply to ages 20–64 years only (95% uncertainty interval) 58
Table 13 Average economic benefits of changes in safety per 100,000 adults living in an area, assuming effects apply to ages 20–64 only (95% uncertainty interval) 59
EXPLANATION OF ABBREVIATIONS
BMI: body mass index.
CI: confidence interval.
DALY: disability adjusted life year.
FCA: friction cost approach.
CCD: census collector district.
GIS: geographic information system.
GP: general practitioner.
HCA: human capital approach.
ICC: Interclass correlation coefficient.
MET: metabolic equivalent of task.
MVPA: moderate to vigorous physical activity.
PA: physical activity.
POS: public open spaces.
QALY: quality adjusted life year.
SA: sufficiently active.
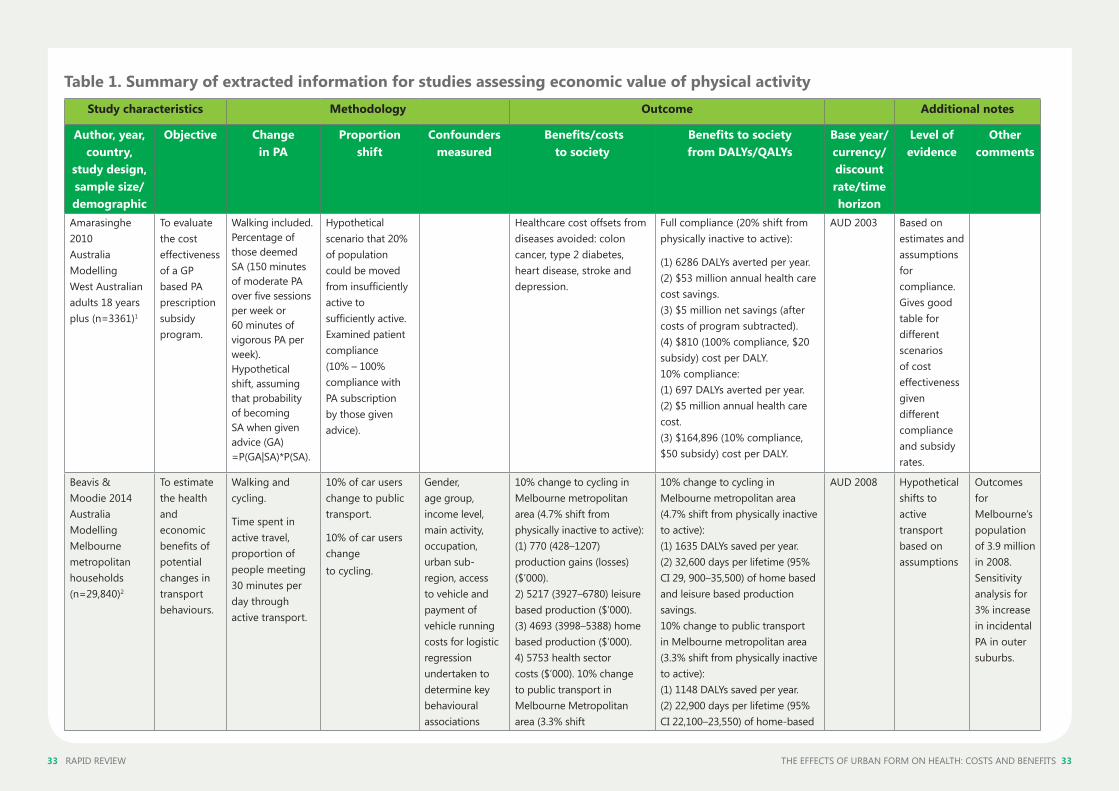
33 RAPID REVIEW THE EFFECTS OF URBAN FORM ON HEALTH: COSTS AND BENEFITS 33
Study characteristics Methodology Outcome Additional notes
Author, year, country,
study design, sample size/demographic
Objective Change in PA
Proportion shift
Confounders measured
Benefits/costs to society
Benefits to society from DALYs/QALYs
Base year/currency/ discount rate/time horizon
Level of evidence
Other comments
Amarasinghe 2010 Australia Modelling West Australian adults 18 years plus (n=3361)1
To evaluate the cost effectiveness of a GP based PA prescription subsidy program.
Walking included. Percentage of those deemed SA (150 minutes of moderate PA over five sessions per week or 60 minutes of vigorous PA per week). Hypothetical shift, assuming that probability of becoming SA when given advice (GA) =P(GA|SA)*P(SA).
Hypothetical scenario that 20% of population could be moved from insufficiently active to sufficiently active. Examined patient compliance (10% – 100% compliance with PA subscription by those given advice).
Healthcare cost offsets from diseases avoided: colon cancer, type 2 diabetes, heart disease, stroke and depression.
Full compliance (20% shift from physically inactive to active):
(1) 6286 DALYs averted per year. (2) $53 million annual health care cost savings. (3) $5 million net savings (after costs of program subtracted). (4) $810 (100% compliance, $20 subsidy) cost per DALY. 10% compliance: (1) 697 DALYs averted per year. (2) $5 million annual health care cost. (3) $164,896 (10% compliance, $50 subsidy) cost per DALY.
AUD 2003 Based on estimates and assumptions for compliance. Gives good table for different scenarios of cost effectiveness given different compliance and subsidy rates.
Beavis & Moodie 2014 Australia Modelling Melbourne metropolitan households (n=29,840)2
To estimate the health and economic benefits of potential changes in transport behaviours.
Walking and cycling.
Time spent in active travel, proportion of people meeting 30 minutes per day through active transport.
10% of car users change to public transport.
10% of car users change to cycling.
Gender, age group, income level, main activity, occupation, urban sub-region, access to vehicle and payment of vehicle running costs for logistic regression undertaken to determine key behavioural associations
10% change to cycling in Melbourne metropolitan area (4.7% shift from physically inactive to active): (1) 770 (428–1207) production gains (losses) ($’000). 2) 5217 (3927–6780) leisure based production ($’000). (3) 4693 (3998–5388) home based production ($’000). 4) 5753 health sector costs ($’000). 10% change to public transport in Melbourne Metropolitan area (3.3% shift
10% change to cycling in Melbourne metropolitan area (4.7% shift from physically inactive to active): (1) 1635 DALYs saved per year. (2) 32,600 days per lifetime (95% CI 29, 900–35,500) of home based and leisure based production savings. 10% change to public transport in Melbourne metropolitan area (3.3% shift from physically inactive to active): (1) 1148 DALYs saved per year. (2) 22,900 days per lifetime (95% CI 22,100–23,550) of home-based
AUD 2008 Hypothetical shifts to active transport based on assumptions
Outcomes for Melbourne’s population of 3.9 million in 2008. Sensitivity analysis for 3% increase in incidental PA in outer suburbs.
Table 1. Summary of extracted information for studies assessing economic value of physical activity
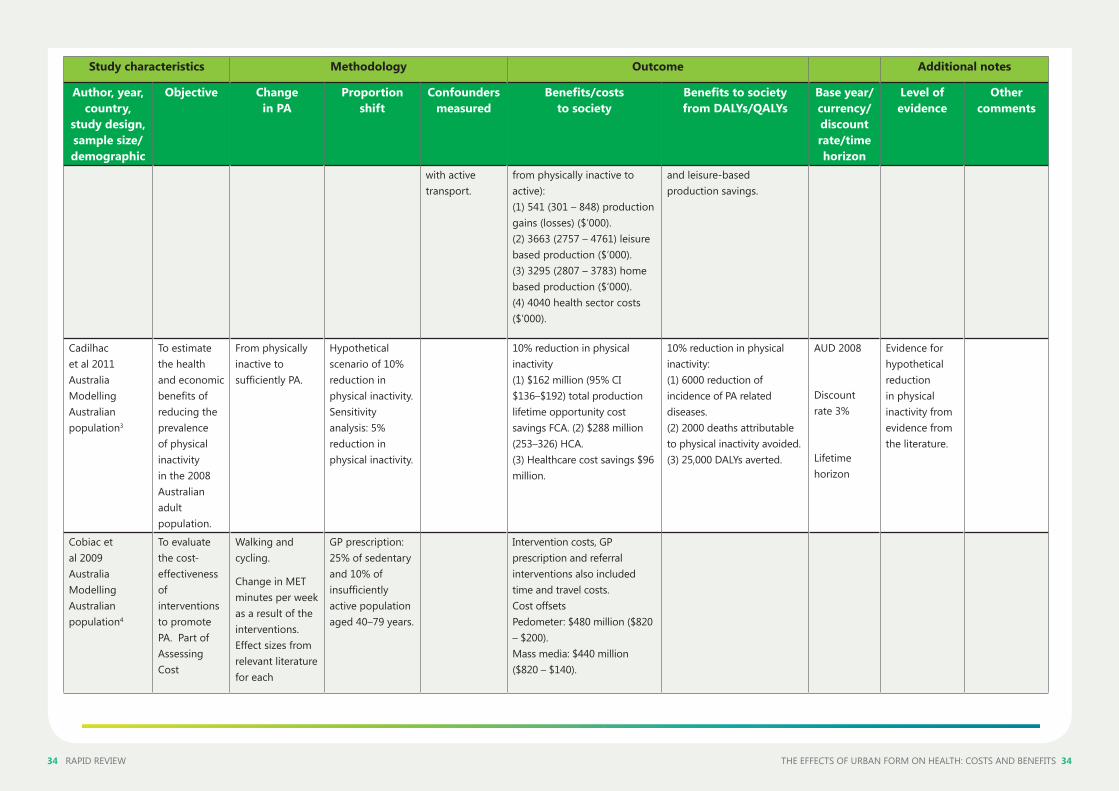
34 RAPID REVIEW THE EFFECTS OF URBAN FORM ON HEALTH: COSTS AND BENEFITS 34
Study characteristics Methodology Outcome Additional notes
Author, year, country,
study design, sample size/demographic
Objective Change in PA
Proportion shift
Confounders measured
Benefits/costs to society
Benefits to society from DALYs/QALYs
Base year/currency/ discount rate/time horizon
Level of evidence
Other comments
with active transport.
from physically inactive to active): (1) 541 (301 – 848) production gains (losses) ($’000). (2) 3663 (2757 – 4761) leisure based production ($’000). (3) 3295 (2807 – 3783) home based production ($‘000). (4) 4040 health sector costs ($’000).
and leisure-based production savings.
Cadilhac et al 2011 Australia Modelling Australian population3
To estimate the health and economic benefits of reducing the prevalence of physical inactivity in the 2008 Australian adult population.
From physically inactive to sufficiently PA.
Hypothetical scenario of 10% reduction in physical inactivity. Sensitivity analysis: 5% reduction in physical inactivity.
10% reduction in physical inactivity (1) $162 million (95% CI $136–$192) total production lifetime opportunity cost savings FCA. (2) $288 million (253–326) HCA. (3) Healthcare cost savings $96 million.
10% reduction in physical inactivity: (1) 6000 reduction of incidence of PA related diseases. (2) 2000 deaths attributable to physical inactivity avoided. (3) 25,000 DALYs averted.
AUD 2008
Discount rate 3%
Lifetime horizon
Evidence for hypothetical reduction in physical inactivity from evidence from the literature.
Cobiac et al 2009 Australia Modelling Australian population4
To evaluate the cost-effectiveness of interventions to promote PA. Part of Assessing Cost
Walking and cycling.
Change in MET minutes per week as a result of the interventions. Effect sizes from relevant literature for each
GP prescription: 25% of sedentary and 10% of insufficiently active population aged 40–79 years.
Intervention costs, GP prescription and referral interventions also included time and travel costs. Cost offsets Pedometer: $480 million ($820 – $200). Mass media: $440 million ($820 – $140).
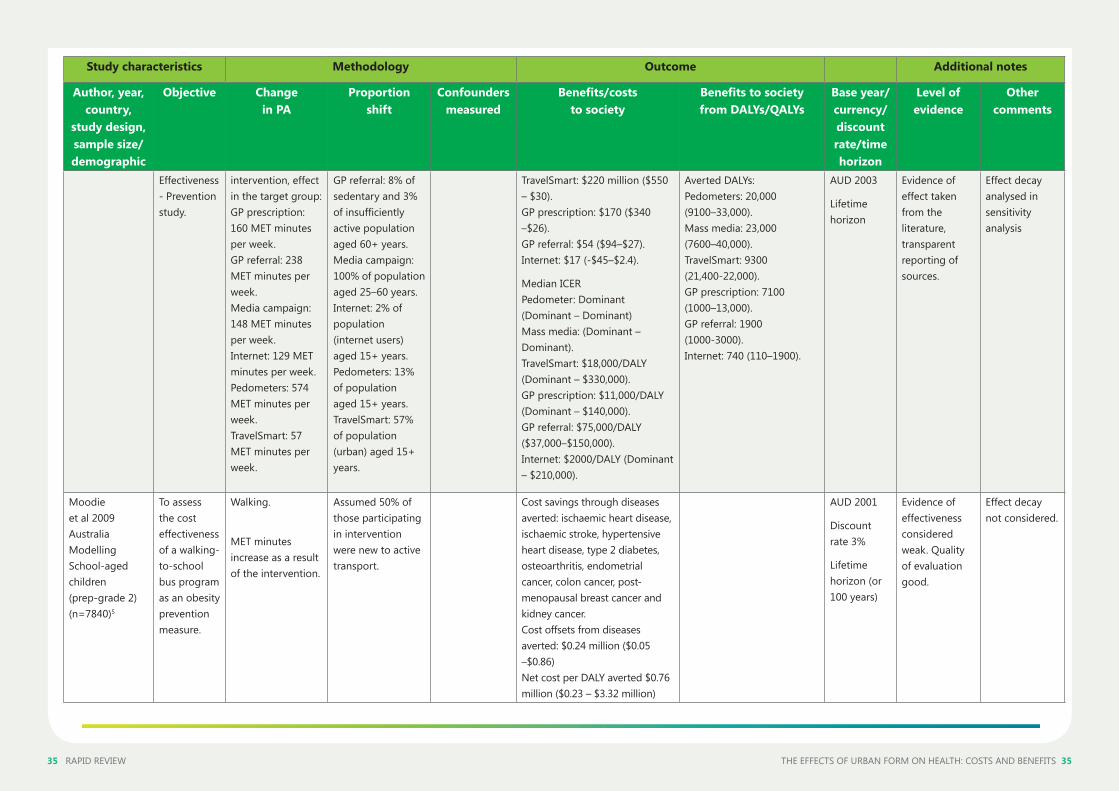
35 RAPID REVIEW THE EFFECTS OF URBAN FORM ON HEALTH: COSTS AND BENEFITS 35
Study characteristics Methodology Outcome Additional notes
Author, year, country,
study design, sample size/demographic
Objective Change in PA
Proportion shift
Confounders measured
Benefits/costs to society
Benefits to society from DALYs/QALYs
Base year/currency/ discount rate/time horizon
Level of evidence
Other comments
Effectiveness - Prevention study.
intervention, effect in the target group: GP prescription: 160 MET minutes per week. GP referral: 238 MET minutes per week. Media campaign: 148 MET minutes per week. Internet: 129 MET minutes per week. Pedometers: 574 MET minutes per week. TravelSmart: 57 MET minutes per week.
GP referral: 8% of sedentary and 3% of insufficiently active population aged 60+ years. Media campaign: 100% of population aged 25–60 years. Internet: 2% of population (internet users) aged 15+ years. Pedometers: 13% of population aged 15+ years. TravelSmart: 57% of population (urban) aged 15+ years.
TravelSmart: $220 million ($550 – $30). GP prescription: $170 ($340 –$26). GP referral: $54 ($94–$27).Internet: $17 (-$45–$2.4).
Median ICER Pedometer: Dominant (Dominant – Dominant) Mass media: (Dominant –Dominant). TravelSmart: $18,000/DALY (Dominant – $330,000). GP prescription: $11,000/DALY (Dominant – $140,000). GP referral: $75,000/DALY ($37,000–$150,000). Internet: $2000/DALY (Dominant – $210,000).
Averted DALYs: Pedometers: 20,000 (9100–33,000). Mass media: 23,000 (7600–40,000). TravelSmart: 9300 (21,400-22,000). GP prescription: 7100 (1000–13,000). GP referral: 1900 (1000-3000). Internet: 740 (110–1900).
AUD 2003
Lifetime horizon
Evidence of effect taken from the literature, transparent reporting of sources.
Effect decay analysed in sensitivity analysis
Moodie et al 2009 Australia Modelling School-aged children (prep-grade 2) (n=7840)5
To assess the cost effectiveness of a walking-to-school bus program as an obesity prevention measure.
Walking.
MET minutes increase as a result of the intervention.
Assumed 50% of those participating in intervention were new to active transport.
Cost savings through diseases averted: ischaemic heart disease, ischaemic stroke, hypertensive heart disease, type 2 diabetes, osteoarthritis, endometrial cancer, colon cancer, post-menopausal breast cancer and kidney cancer. Cost offsets from diseases averted: $0.24 million ($0.05 –$0.86) Net cost per DALY averted $0.76 million ($0.23 – $3.32 million)
AUD 2001
Discount rate 3%
Lifetime horizon (or 100 years)
Evidence of effectiveness considered weak. Quality of evaluation good.
Effect decay not considered.
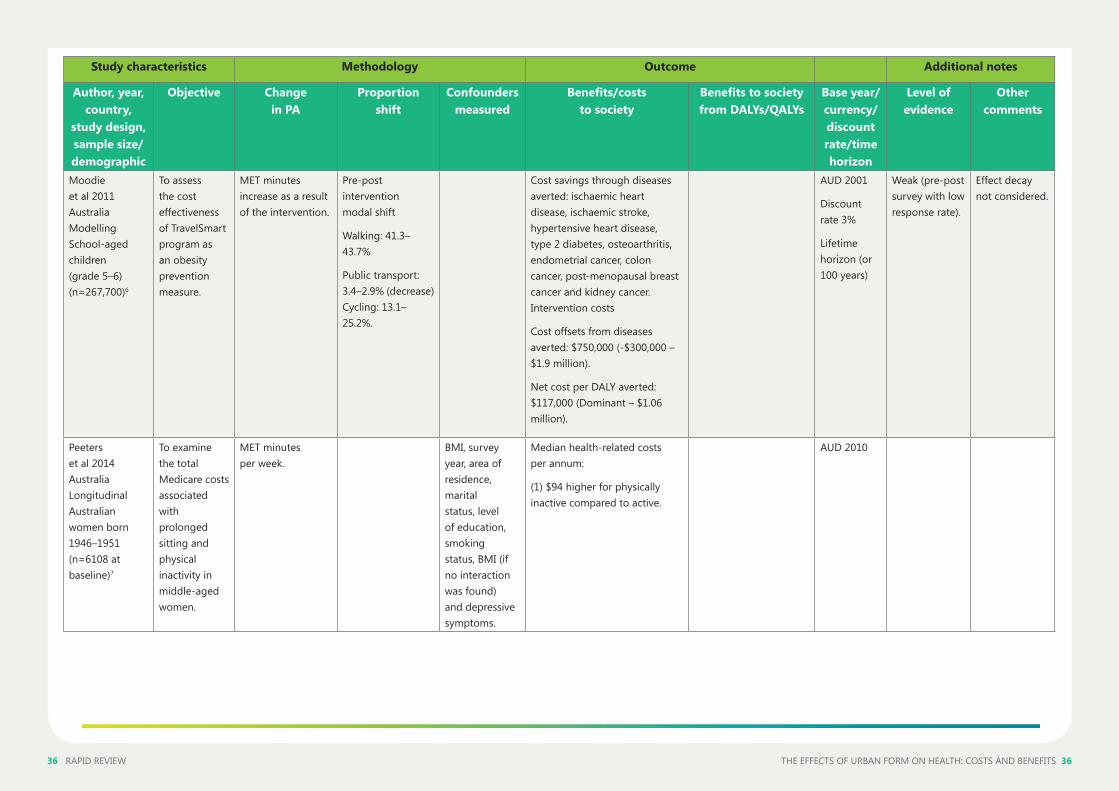
36 RAPID REVIEW THE EFFECTS OF URBAN FORM ON HEALTH: COSTS AND BENEFITS 36
Study characteristics Methodology Outcome Additional notes
Author, year, country,
study design, sample size/demographic
Objective Change in PA
Proportion shift
Confounders measured
Benefits/costs to society
Benefits to society from DALYs/QALYs
Base year/currency/ discount rate/time horizon
Level of evidence
Other comments
Moodie et al 2011 Australia Modelling School-aged children (grade 5–6) (n=267,700)6
To assess the cost effectiveness of TravelSmart program as an obesity prevention measure.
MET minutes increase as a result of the intervention.
Pre-post intervention modal shift
Walking: 41.3–43.7%
Public transport: 3.4–2.9% (decrease) Cycling: 13.1–25.2%.
Cost savings through diseases averted: ischaemic heart disease, ischaemic stroke, hypertensive heart disease, type 2 diabetes, osteoarthritis, endometrial cancer, colon cancer, post-menopausal breast cancer and kidney cancer. Intervention costs
Cost offsets from diseases averted: $750,000 (-$300,000 – $1.9 million).
Net cost per DALY averted: $117,000 (Dominant – $1.06 million).
AUD 2001
Discount rate 3%
Lifetime horizon (or 100 years)
Weak (pre-post survey with low response rate).
Effect decay not considered.
Peeters et al 2014 Australia Longitudinal Australian women born 1946–1951 (n=6108 at baseline)7
To examine the total Medicare costs associated with prolonged sitting and physical inactivity in middle-aged women.
MET minutes per week.
BMI, survey year, area of residence, marital status, level of education, smoking status, BMI (if no interaction was found) and depressive symptoms.
Median health-related costs per annum:
(1) $94 higher for physically inactive compared to active.
AUD 2010
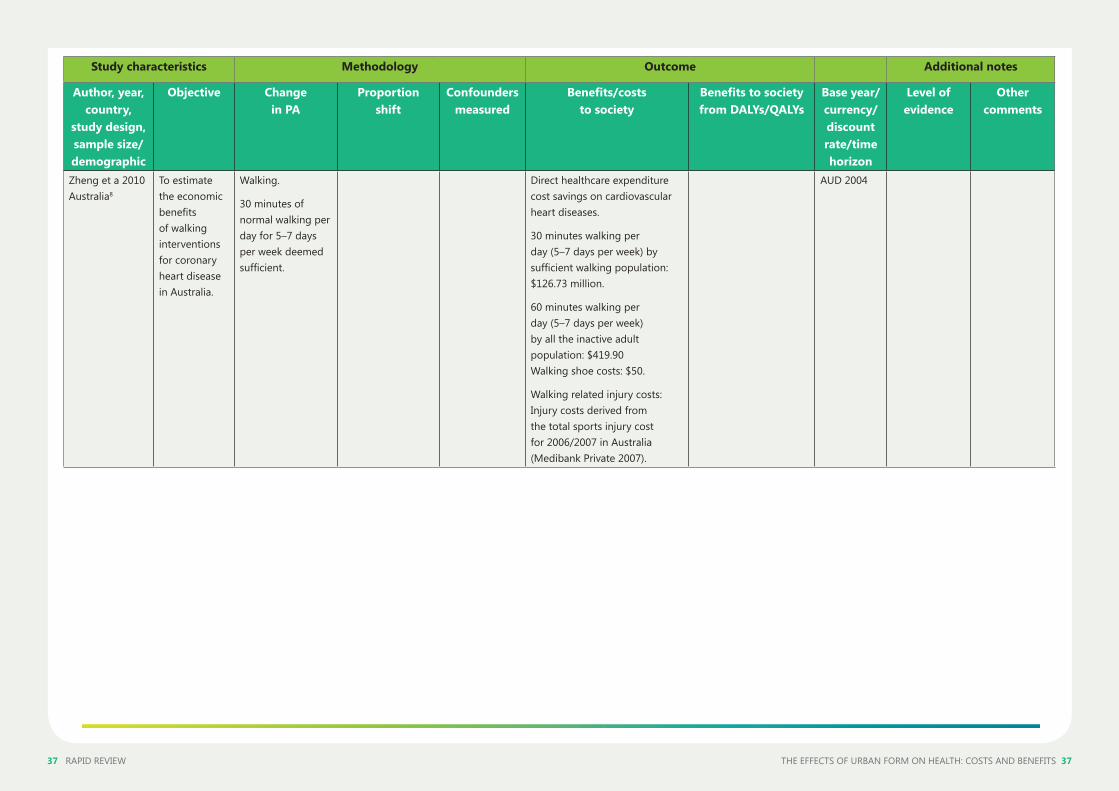
37 RAPID REVIEW THE EFFECTS OF URBAN FORM ON HEALTH: COSTS AND BENEFITS 37
Study characteristics Methodology Outcome Additional notes
Author, year, country,
study design, sample size/demographic
Objective Change in PA
Proportion shift
Confounders measured
Benefits/costs to society
Benefits to society from DALYs/QALYs
Base year/currency/ discount rate/time horizon
Level of evidence
Other comments
Zheng et a 2010 Australia8
To estimate the economic benefits of walking interventions for coronary heart disease in Australia.
Walking.
30 minutes of normal walking per day for 5–7 days per week deemed sufficient.
Direct healthcare expenditure cost savings on cardiovascular heart diseases.
30 minutes walking per day (5–7 days per week) by sufficient walking population: $126.73 million.
60 minutes walking per day (5–7 days per week) by all the inactive adult population: $419.90 Walking shoe costs: $50.
Walking related injury costs: Injury costs derived from the total sports injury cost for 2006/2007 in Australia (Medibank Private 2007).
AUD 2004
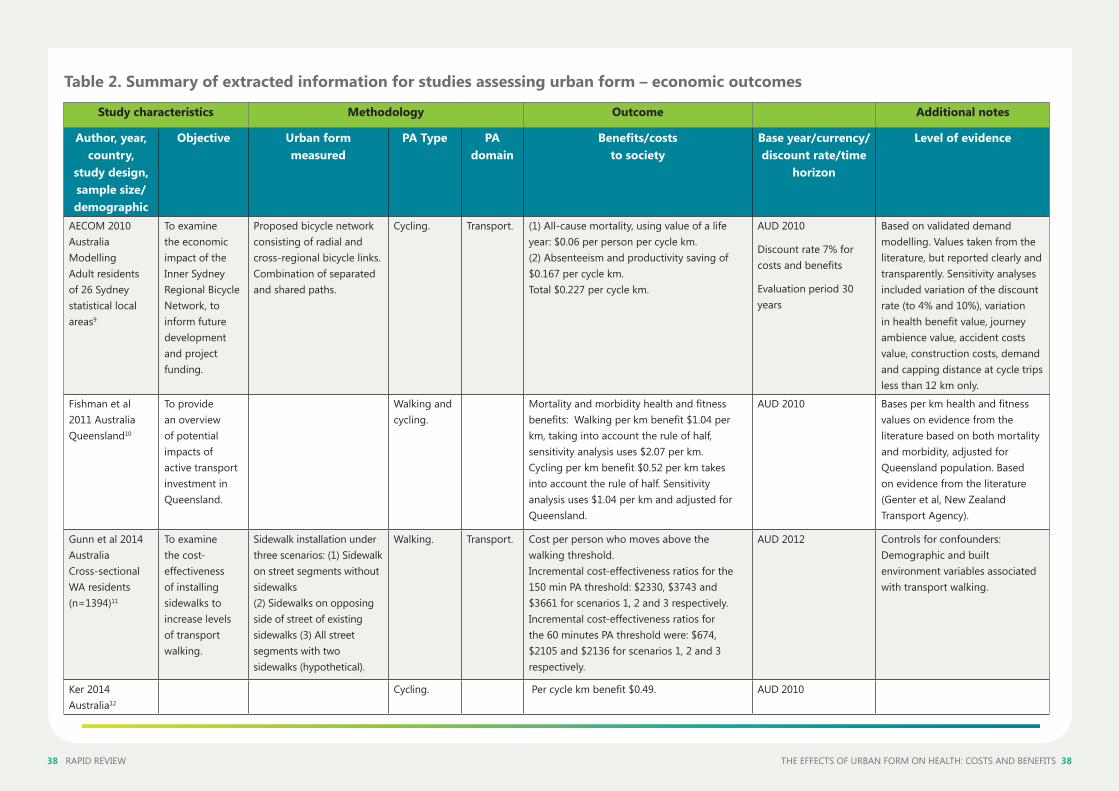
38 RAPID REVIEW THE EFFECTS OF URBAN FORM ON HEALTH: COSTS AND BENEFITS 38
Study characteristics Methodology Outcome Additional notes
Author, year, country,
study design, sample size/demographic
Objective Urban form measured
PA Type PA domain
Benefits/costs to society
Base year/currency/ discount rate/time
horizon
Level of evidence
AECOM 2010 Australia Modelling Adult residents of 26 Sydney statistical local areas9
To examine the economic impact of the Inner Sydney Regional Bicycle Network, to inform future development and project funding.
Proposed bicycle network consisting of radial and cross-regional bicycle links. Combination of separated and shared paths.
Cycling. Transport. (1) All-cause mortality, using value of a life year: $0.06 per person per cycle km. (2) Absenteeism and productivity saving of $0.167 per cycle km. Total $0.227 per cycle km.
AUD 2010
Discount rate 7% for costs and benefits
Evaluation period 30 years
Based on validated demand modelling. Values taken from the literature, but reported clearly and transparently. Sensitivity analyses included variation of the discount rate (to 4% and 10%), variation in health benefit value, journey ambience value, accident costs value, construction costs, demand and capping distance at cycle trips less than 12 km only.
Fishman et al 2011 Australia Queensland10
To provide an overview of potential impacts of active transport investment in Queensland.
Walking and cycling.
Mortality and morbidity health and fitness benefits: Walking per km benefit $1.04 per km, taking into account the rule of half, sensitivity analysis uses $2.07 per km. Cycling per km benefit $0.52 per km takes into account the rule of half. Sensitivity analysis uses $1.04 per km and adjusted for Queensland.
AUD 2010 Bases per km health and fitness values on evidence from the literature based on both mortality and morbidity, adjusted for Queensland population. Based on evidence from the literature (Genter et al, New Zealand Transport Agency).
Gunn et al 2014 Australia Cross-sectional WA residents (n=1394)11
To examine the cost-effectiveness of installing sidewalks to increase levels of transport walking.
Sidewalk installation under three scenarios: (1) Sidewalk on street segments without sidewalks (2) Sidewalks on opposing side of street of existing sidewalks (3) All street segments with two sidewalks (hypothetical).
Walking. Transport. Cost per person who moves above the walking threshold. Incremental cost-effectiveness ratios for the 150 min PA threshold: $2330, $3743 and $3661 for scenarios 1, 2 and 3 respectively. Incremental cost-effectiveness ratios for the 60 minutes PA threshold were: $674, $2105 and $2136 for scenarios 1, 2 and 3 respectively.
AUD 2012 Controls for confounders: Demographic and built environment variables associated with transport walking.
Ker 2014 Australia12
Cycling. Per cycle km benefit $0.49. AUD 2010
Table 2. Summary of extracted information for studies assessing urban form – economic outcomes
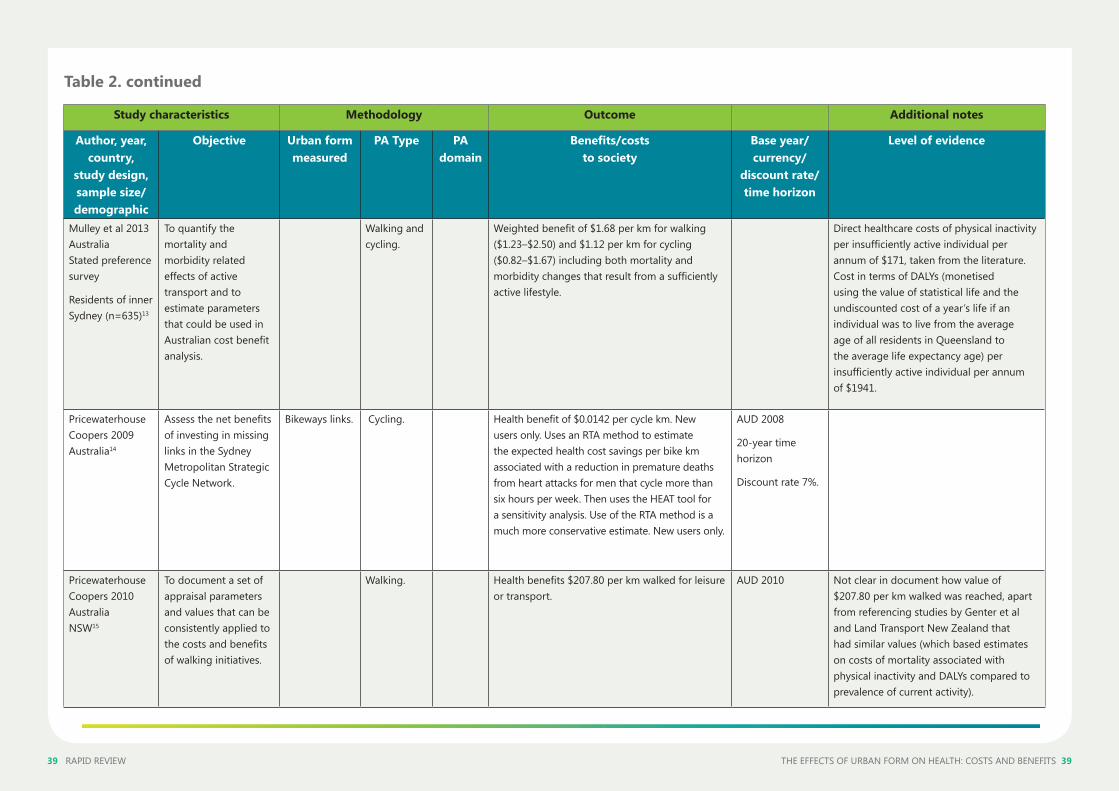
39 RAPID REVIEW THE EFFECTS OF URBAN FORM ON HEALTH: COSTS AND BENEFITS 39
Study characteristics Methodology Outcome Additional notes
Author, year, country,
study design, sample size/demographic
Objective Urban form measured
PA Type PA domain
Benefits/costs to society
Base year/currency/
discount rate/time horizon
Level of evidence
Mulley et al 2013 Australia Stated preference survey
Residents of inner Sydney (n=635)13
To quantify the mortality and morbidity related effects of active transport and to estimate parameters that could be used in Australian cost benefit analysis.
Walking and cycling.
Weighted benefit of $1.68 per km for walking ($1.23–$2.50) and $1.12 per km for cycling ($0.82–$1.67) including both mortality and morbidity changes that result from a sufficiently active lifestyle.
Direct healthcare costs of physical inactivity per insufficiently active individual per annum of $171, taken from the literature. Cost in terms of DALYs (monetised using the value of statistical life and the undiscounted cost of a year’s life if an individual was to live from the average age of all residents in Queensland to the average life expectancy age) per insufficiently active individual per annum of $1941.
Pricewaterhouse Coopers 2009 Australia14
Assess the net benefits of investing in missing links in the Sydney Metropolitan Strategic Cycle Network.
Bikeways links. Cycling. Health benefit of $0.0142 per cycle km. New users only. Uses an RTA method to estimate the expected health cost savings per bike km associated with a reduction in premature deaths from heart attacks for men that cycle more than six hours per week. Then uses the HEAT tool for a sensitivity analysis. Use of the RTA method is a much more conservative estimate. New users only.
AUD 2008
20-year time horizon
Discount rate 7%.
Pricewaterhouse Coopers 2010 Australia NSW15
To document a set of appraisal parameters and values that can be consistently applied to the costs and benefits of walking initiatives.
Walking. Health benefits $207.80 per km walked for leisure or transport.
AUD 2010 Not clear in document how value of $207.80 per km walked was reached, apart from referencing studies by Genter et al and Land Transport New Zealand that had similar values (which based estimates on costs of mortality associated with physical inactivity and DALYs compared to prevalence of current activity).
Table 2. continued
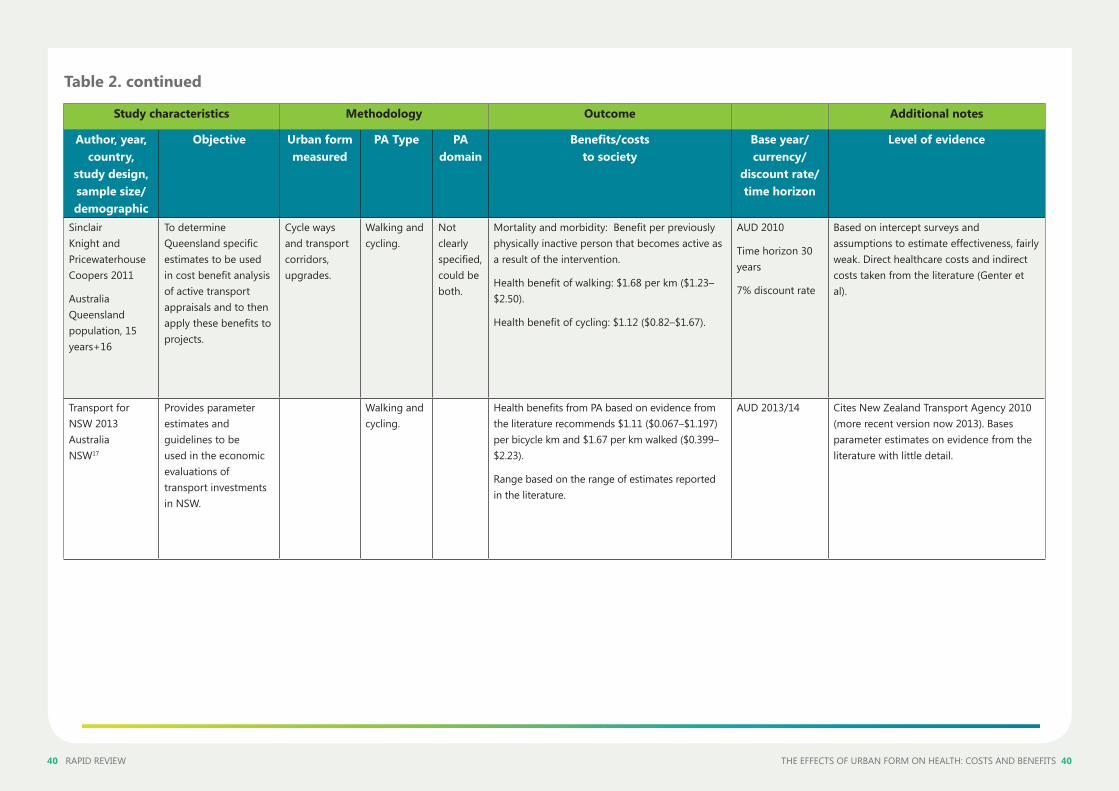
40 RAPID REVIEW THE EFFECTS OF URBAN FORM ON HEALTH: COSTS AND BENEFITS 40
Study characteristics Methodology Outcome Additional notes
Author, year, country,
study design, sample size/demographic
Objective Urban form measured
PA Type PA domain
Benefits/costs to society
Base year/currency/
discount rate/time horizon
Level of evidence
Sinclair Knight and Pricewaterhouse Coopers 2011
Australia Queensland population, 15 years+16
To determine Queensland specific estimates to be used in cost benefit analysis of active transport appraisals and to then apply these benefits to projects.
Cycle ways and transport corridors, upgrades.
Walking and cycling.
Not clearly specified, could be both.
Mortality and morbidity: Benefit per previously physically inactive person that becomes active as a result of the intervention.
Health benefit of walking: $1.68 per km ($1.23–$2.50).
Health benefit of cycling: $1.12 ($0.82–$1.67).
AUD 2010
Time horizon 30 years
7% discount rate
Based on intercept surveys and assumptions to estimate effectiveness, fairly weak. Direct healthcare costs and indirect costs taken from the literature (Genter et al).
Transport for NSW 2013 Australia NSW17
Provides parameter estimates and guidelines to be used in the economic evaluations of transport investments in NSW.
Walking and cycling.
Health benefits from PA based on evidence from the literature recommends $1.11 ($0.067–$1.197) per bicycle km and $1.67 per km walked ($0.399–$2.23).
Range based on the range of estimates reported in the literature.
AUD 2013/14 Cites New Zealand Transport Agency 2010 (more recent version now 2013). Bases parameter estimates on evidence from the literature with little detail.
Table 2. continued
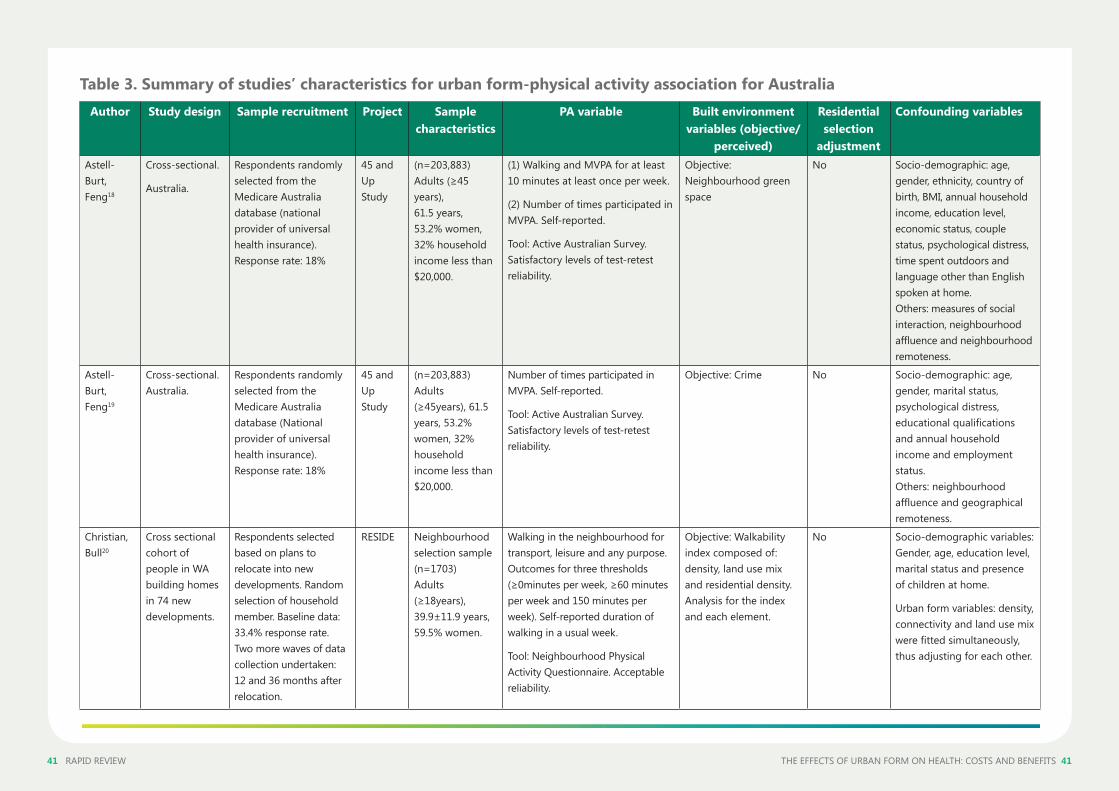
41 RAPID REVIEW THE EFFECTS OF URBAN FORM ON HEALTH: COSTS AND BENEFITS 41
Author Study design Sample recruitment Project Sample characteristics
PA variable Built environment variables (objective/
perceived)
Residential selection
adjustment
Confounding variables
Astell-Burt, Feng18
Cross-sectional.
Australia.
Respondents randomly selected from the Medicare Australia database (national provider of universal health insurance). Response rate: 18%
45 and Up Study
(n=203,883) Adults (≥45 years), 61.5 years, 53.2% women, 32% household income less than $20,000.
(1) Walking and MVPA for at least 10 minutes at least once per week.
(2) Number of times participated in MVPA. Self-reported.
Tool: Active Australian Survey. Satisfactory levels of test-retest reliability.
Objective: Neighbourhood green space
No Socio-demographic: age, gender, ethnicity, country of birth, BMI, annual household income, education level, economic status, couple status, psychological distress, time spent outdoors and language other than English spoken at home. Others: measures of social interaction, neighbourhood affluence and neighbourhood remoteness.
Astell-Burt, Feng19
Cross-sectional. Australia.
Respondents randomly selected from the Medicare Australia database (National provider of universal health insurance). Response rate: 18%
45 and Up Study
(n=203,883)Adults (≥45years), 61.5 years, 53.2% women, 32% household income less than $20,000.
Number of times participated in MVPA. Self-reported.
Tool: Active Australian Survey. Satisfactory levels of test-retest reliability.
Objective: Crime No Socio-demographic: age, gender, marital status, psychological distress, educational qualifications and annual household income and employment status. Others: neighbourhood affluence and geographical remoteness.
Christian, Bull20
Cross sectional cohort of people in WA building homes in 74 new developments.
Respondents selected based on plans to relocate into new developments. Random selection of household member. Baseline data: 33.4% response rate. Two more waves of data collection undertaken: 12 and 36 months after relocation.
RESIDE Neighbourhood selection sample (n=1703) Adults (≥18years), 39.9±11.9 years, 59.5% women.
Walking in the neighbourhood for transport, leisure and any purpose. Outcomes for three thresholds (≥0minutes per week, ≥60 minutes per week and 150 minutes per week). Self-reported duration of walking in a usual week.
Tool: Neighbourhood Physical Activity Questionnaire. Acceptable reliability.
Objective: Walkability index composed of: density, land use mix and residential density. Analysis for the index and each element.
No Socio-demographic variables: Gender, age, education level, marital status and presence of children at home.
Urban form variables: density, connectivity and land use mix were fitted simultaneously, thus adjusting for each other.
Table 3. Summary of studies’ characteristics for urban form-physical activity association for Australia
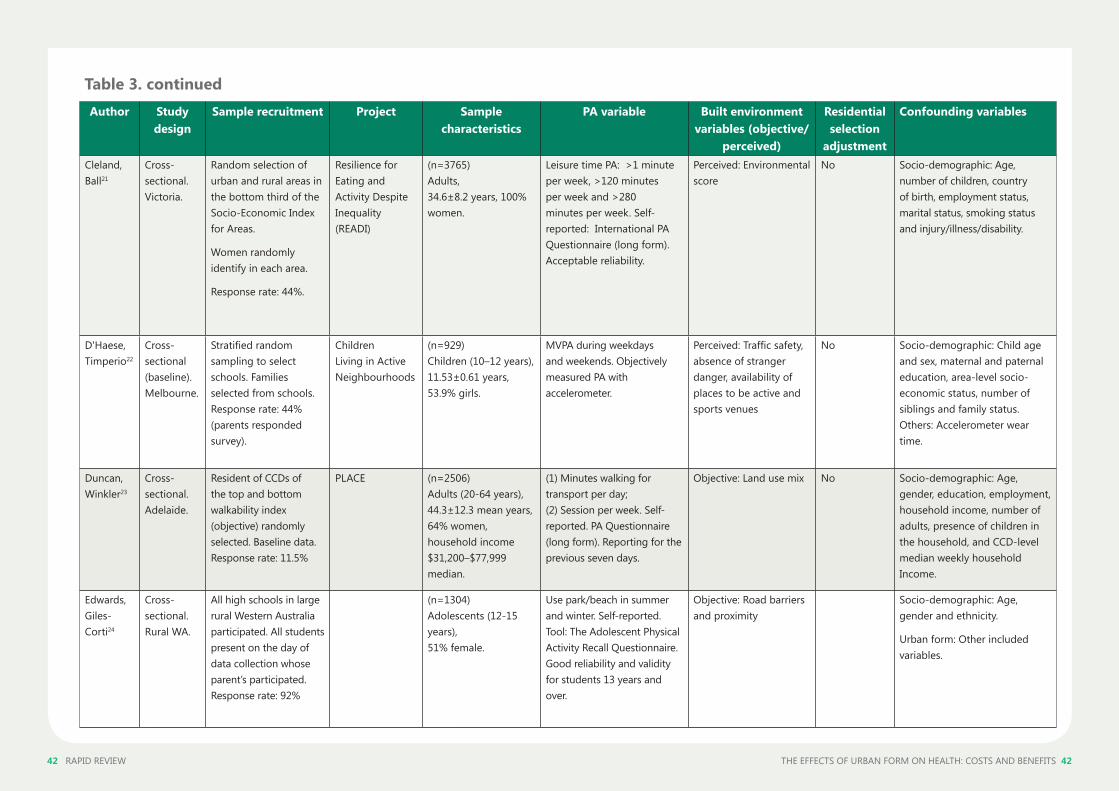
42 RAPID REVIEW THE EFFECTS OF URBAN FORM ON HEALTH: COSTS AND BENEFITS 42
Author Study design
Sample recruitment Project Sample characteristics
PA variable Built environment variables (objective/
perceived)
Residential selection
adjustment
Confounding variables
Cleland, Ball21
Cross-sectional. Victoria.
Random selection of urban and rural areas in the bottom third of the Socio-Economic Index for Areas.
Women randomly identify in each area.
Response rate: 44%.
Resilience for Eating and Activity Despite Inequality (READI)
(n=3765) Adults, 34.6±8.2 years, 100% women.
Leisure time PA: >1 minute per week, >120 minutes per week and >280 minutes per week. Self-reported: International PA Questionnaire (long form). Acceptable reliability.
Perceived: Environmental score
No Socio-demographic: Age, number of children, country of birth, employment status, marital status, smoking status and injury/illness/disability.
D'Haese, Timperio22
Cross-sectional (baseline). Melbourne.
Stratified random sampling to select schools. Families selected from schools. Response rate: 44% (parents responded survey).
Children Living in Active Neighbourhoods
(n=929) Children (10–12 years), 11.53±0.61 years, 53.9% girls.
MVPA during weekdays and weekends. Objectively measured PA with accelerometer.
Perceived: Traffic safety, absence of stranger danger, availability of places to be active and sports venues
No Socio-demographic: Child age and sex, maternal and paternal education, area-level socio-economic status, number of siblings and family status. Others: Accelerometer wear time.
Duncan, Winkler23
Cross-sectional. Adelaide.
Resident of CCDs of the top and bottom walkability index (objective) randomly selected. Baseline data. Response rate: 11.5%
PLACE (n=2506) Adults (20-64 years), 44.3±12.3 mean years, 64% women, household income $31,200–$77,999 median.
(1) Minutes walking for transport per day; (2) Session per week. Self-reported. PA Questionnaire (long form). Reporting for the previous seven days.
Objective: Land use mix No Socio-demographic: Age, gender, education, employment, household income, number of adults, presence of children in the household, and CCD-level median weekly household Income.
Edwards, Giles-Corti24
Cross-sectional. Rural WA.
All high schools in large rural Western Australia participated. All students present on the day of data collection whose parent’s participated. Response rate: 92%
(n=1304) Adolescents (12-15 years), 51% female.
Use park/beach in summer and winter. Self-reported. Tool: The Adolescent Physical Activity Recall Questionnaire. Good reliability and validity for students 13 years and over.
Objective: Road barriers and proximity
Socio-demographic: Age, gender and ethnicity.
Urban form: Other included variables.
Table 3. continued
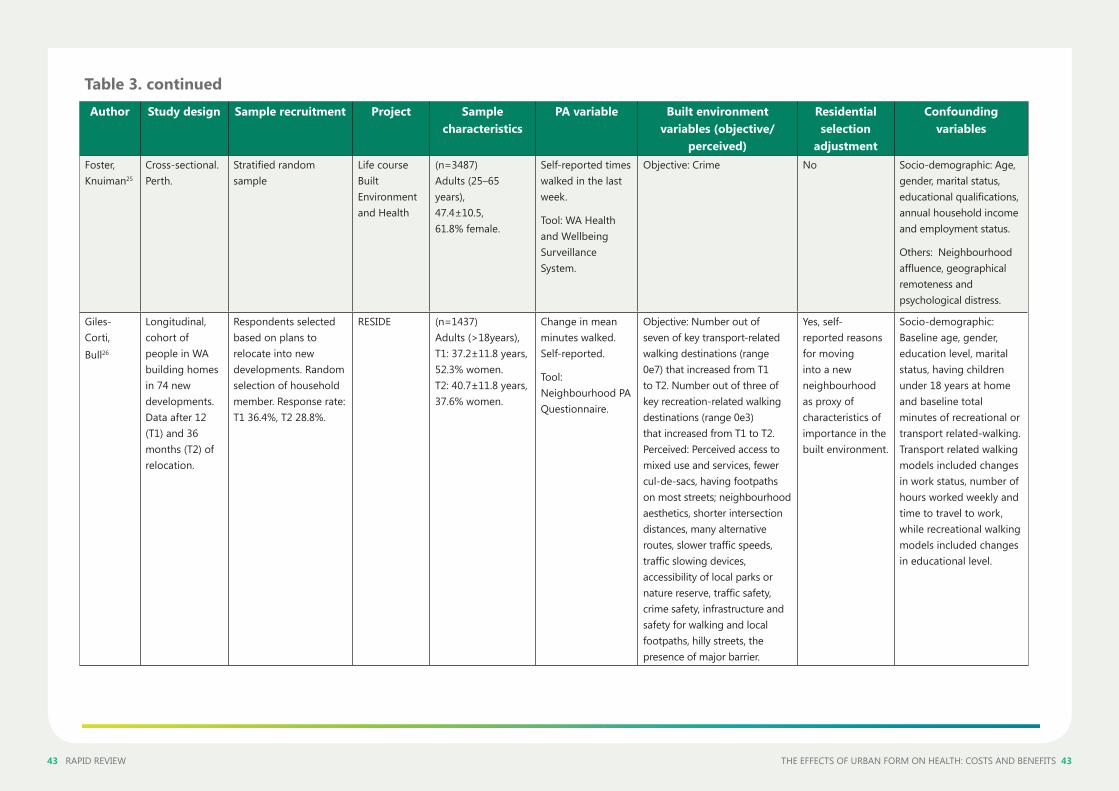
43 RAPID REVIEW THE EFFECTS OF URBAN FORM ON HEALTH: COSTS AND BENEFITS 43
Author Study design Sample recruitment Project Sample characteristics
PA variable Built environment variables (objective/
perceived)
Residential selection
adjustment
Confounding variables
Foster, Knuiman25
Cross-sectional. Perth.
Stratified random sample
Life course Built Environment and Health
(n=3487) Adults (25–65 years), 47.4±10.5, 61.8% female.
Self-reported times walked in the last week.
Tool: WA Health and Wellbeing Surveillance System.
Objective: Crime No Socio-demographic: Age, gender, marital status, educational qualifications, annual household income and employment status.
Others: Neighbourhood affluence, geographical remoteness and psychological distress.
Giles-Corti, Bull26
Longitudinal, cohort of people in WA building homes in 74 new developments. Data after 12 (T1) and 36 months (T2) of relocation.
Respondents selected based on plans to relocate into new developments. Random selection of household member. Response rate: T1 36.4%, T2 28.8%.
RESIDE (n=1437) Adults (>18years), T1: 37.2±11.8 years, 52.3% women. T2: 40.7±11.8 years, 37.6% women.
Change in mean minutes walked. Self-reported.
Tool: Neighbourhood PA Questionnaire.
Objective: Number out of seven of key transport-related walking destinations (range 0e7) that increased from T1 to T2. Number out of three of key recreation-related walking destinations (range 0e3) that increased from T1 to T2. Perceived: Perceived access to mixed use and services, fewer cul-de-sacs, having footpaths on most streets; neighbourhood aesthetics, shorter intersection distances, many alternative routes, slower traffic speeds, traffic slowing devices, accessibility of local parks or nature reserve, traffic safety, crime safety, infrastructure and safety for walking and local footpaths, hilly streets, the presence of major barrier.
Yes, self-reported reasons for moving into a new neighbourhood as proxy of characteristics of importance in the built environment.
Socio-demographic: Baseline age, gender, education level, marital status, having children under 18 years at home and baseline total minutes of recreational or transport related-walking. Transport related walking models included changes in work status, number of hours worked weekly and time to travel to work, while recreational walking models included changes in educational level.
Table 3. continued
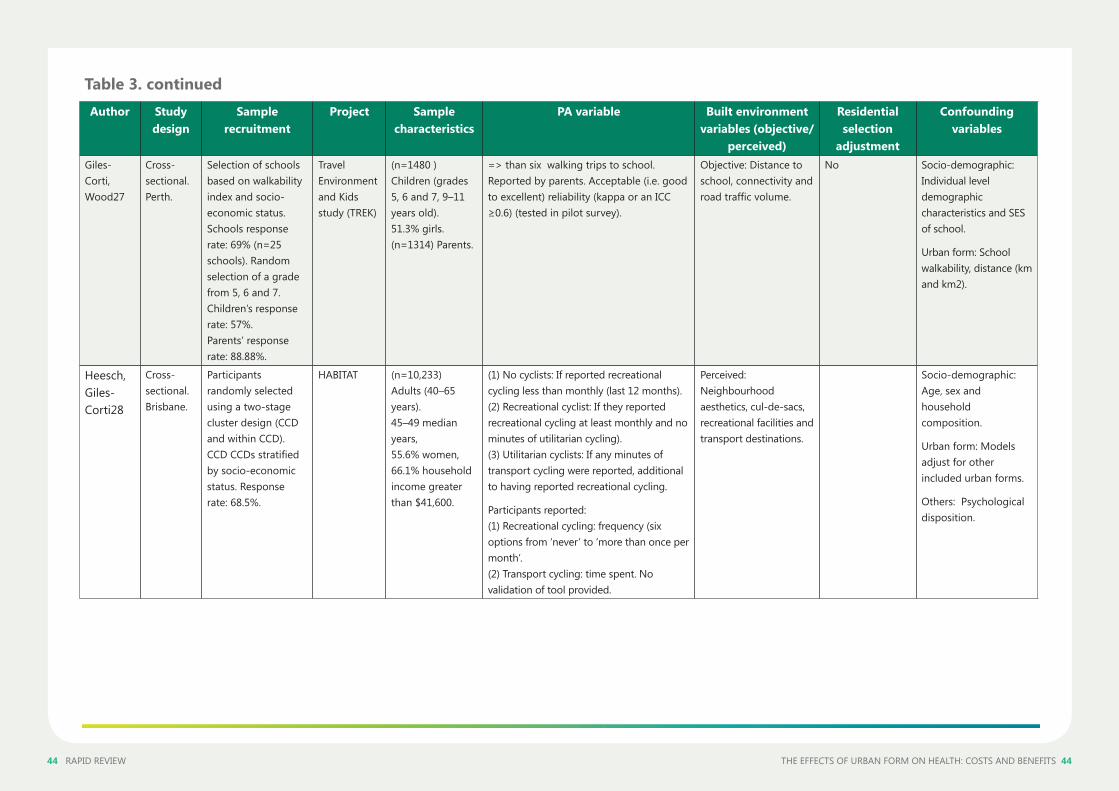
44 RAPID REVIEW THE EFFECTS OF URBAN FORM ON HEALTH: COSTS AND BENEFITS 44
Author Study design
Sample recruitment
Project Sample characteristics
PA variable Built environment variables (objective/
perceived)
Residential selection
adjustment
Confounding variables
Giles-Corti, Wood27
Cross-sectional. Perth.
Selection of schools based on walkability index and socio-economic status. Schools response rate: 69% (n=25 schools). Random selection of a grade from 5, 6 and 7. Children’s response rate: 57%. Parents’ response rate: 88.88%.
Travel Environment and Kids study (TREK)
(n=1480 ) Children (grades 5, 6 and 7, 9–11 years old). 51.3% girls.(n=1314) Parents.
=> than six walking trips to school. Reported by parents. Acceptable (i.e. good to excellent) reliability (kappa or an ICC ≥0.6) (tested in pilot survey).
Objective: Distance to school, connectivity and road traffic volume.
No Socio-demographic: Individual level demographic characteristics and SES of school.
Urban form: School walkability, distance (km and km2).
Heesch, Giles-Corti28
Cross-sectional. Brisbane.
Participants randomly selected using a two-stage cluster design (CCD and within CCD). CCD CCDs stratified by socio-economic status. Response rate: 68.5%.
HABITAT (n=10,233) Adults (40–65 years). 45–49 median years, 55.6% women, 66.1% household income greater than $41,600.
(1) No cyclists: If reported recreational cycling less than monthly (last 12 months). (2) Recreational cyclist: If they reported recreational cycling at least monthly and no minutes of utilitarian cycling). (3) Utilitarian cyclists: If any minutes of transport cycling were reported, additional to having reported recreational cycling.
Participants reported: (1) Recreational cycling: frequency (six options from ‘never’ to ‘more than once per month’. (2) Transport cycling: time spent. No validation of tool provided.
Perceived: Neighbourhood aesthetics, cul-de-sacs, recreational facilities and transport destinations.
Socio-demographic: Age, sex and household composition.
Urban form: Models adjust for other included urban forms.
Others: Psychological disposition.
Table 3. continued
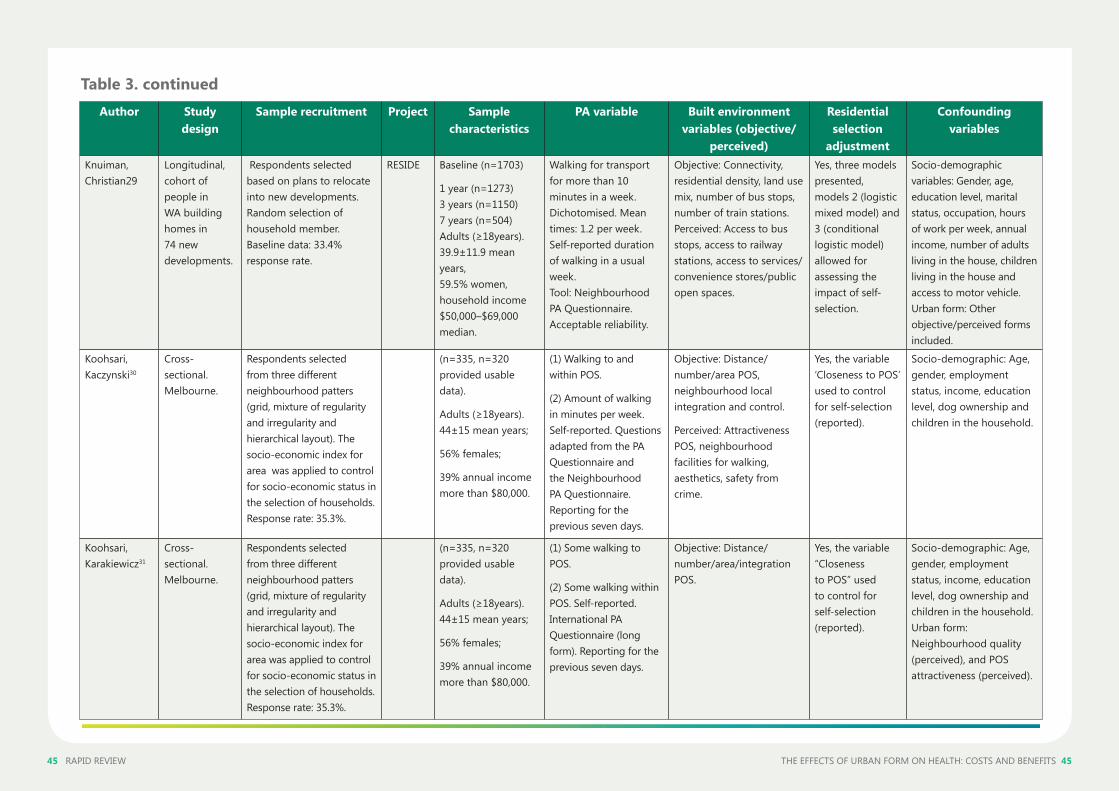
45 RAPID REVIEW THE EFFECTS OF URBAN FORM ON HEALTH: COSTS AND BENEFITS 45
Author Study design
Sample recruitment Project Sample characteristics
PA variable Built environment variables (objective/
perceived)
Residential selection
adjustment
Confounding variables
Knuiman, Christian29
Longitudinal, cohort of people in WA building homes in 74 new developments.
Respondents selected based on plans to relocate into new developments. Random selection of household member. Baseline data: 33.4% response rate.
RESIDE Baseline (n=1703)
1 year (n=1273) 3 years (n=1150) 7 years (n=504) Adults (≥18years). 39.9±11.9 mean years, 59.5% women, household income $50,000–$69,000 median.
Walking for transport for more than 10 minutes in a week. Dichotomised. Mean times: 1.2 per week. Self-reported duration of walking in a usual week. Tool: Neighbourhood PA Questionnaire. Acceptable reliability.
Objective: Connectivity, residential density, land use mix, number of bus stops, number of train stations. Perceived: Access to bus stops, access to railway stations, access to services/convenience stores/public open spaces.
Yes, three models presented, models 2 (logistic mixed model) and 3 (conditional logistic model) allowed for assessing the impact of self-selection.
Socio-demographic variables: Gender, age, education level, marital status, occupation, hours of work per week, annual income, number of adults living in the house, children living in the house and access to motor vehicle. Urban form: Other objective/perceived forms included.
Koohsari, Kaczynski30
Cross-sectional. Melbourne.
Respondents selected from three different neighbourhood patters (grid, mixture of regularity and irregularity and hierarchical layout). The socio-economic index for area was applied to control for socio-economic status in the selection of households. Response rate: 35.3%.
(n=335, n=320 provided usable data).
Adults (≥18years). 44±15 mean years;
56% females;
39% annual income more than $80,000.
(1) Walking to and within POS.
(2) Amount of walking in minutes per week. Self-reported. Questions adapted from the PA Questionnaire and the Neighbourhood PA Questionnaire. Reporting for the previous seven days.
Objective: Distance/number/area POS, neighbourhood local integration and control.
Perceived: Attractiveness POS, neighbourhood facilities for walking, aesthetics, safety from crime.
Yes, the variable ‘Closeness to POS’ used to control for self-selection (reported).
Socio-demographic: Age, gender, employment status, income, education level, dog ownership and children in the household.
Koohsari, Karakiewicz31
Cross-sectional. Melbourne.
Respondents selected from three different neighbourhood patters (grid, mixture of regularity and irregularity and hierarchical layout). The socio-economic index for area was applied to control for socio-economic status in the selection of households. Response rate: 35.3%.
(n=335, n=320 provided usable data).
Adults (≥18years). 44±15 mean years;
56% females;
39% annual income more than $80,000.
(1) Some walking to POS.
(2) Some walking within POS. Self-reported. International PA Questionnaire (long form). Reporting for the previous seven days.
Objective: Distance/number/area/integration POS.
Yes, the variable “Closeness to POS” used to control for self-selection (reported).
Socio-demographic: Age, gender, employment status, income, education level, dog ownership and children in the household. Urban form: Neighbourhood quality (perceived), and POS attractiveness (perceived).
Table 3. continued
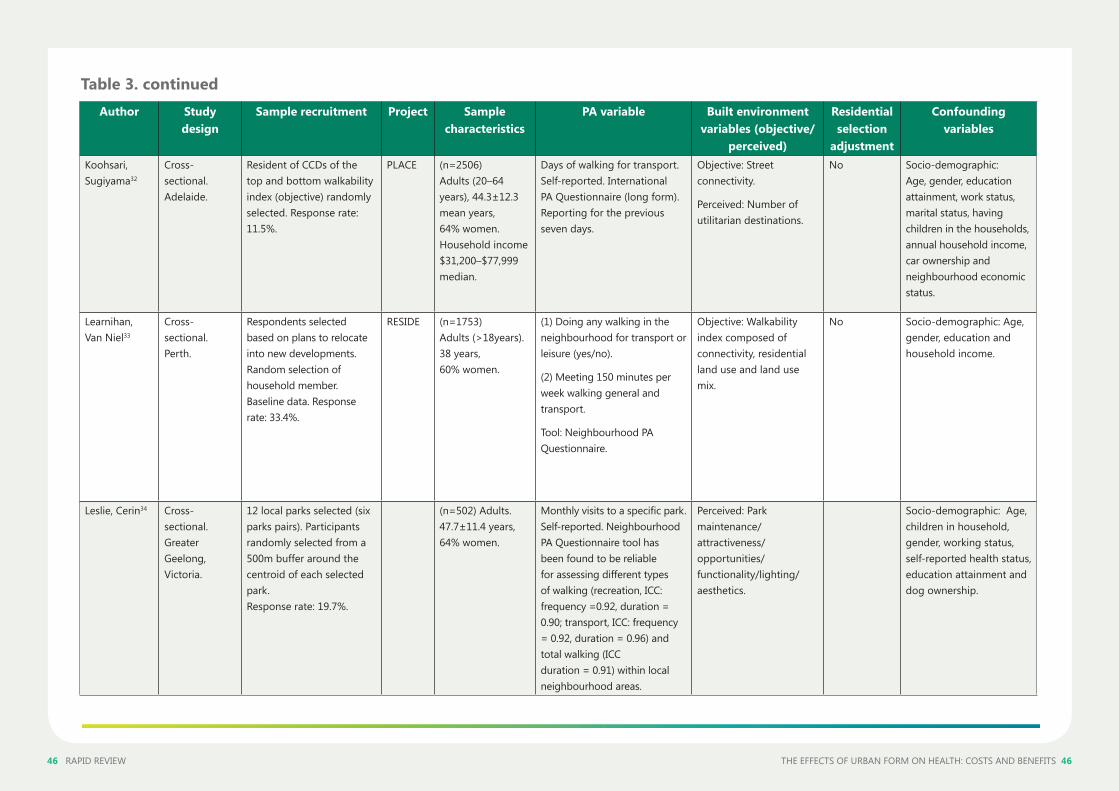
46 RAPID REVIEW THE EFFECTS OF URBAN FORM ON HEALTH: COSTS AND BENEFITS 46
Author Study design
Sample recruitment Project Sample characteristics
PA variable Built environment variables (objective/
perceived)
Residential selection
adjustment
Confounding variables
Koohsari, Sugiyama32
Cross-sectional. Adelaide.
Resident of CCDs of the top and bottom walkability index (objective) randomly selected. Response rate: 11.5%.
PLACE (n=2506) Adults (20–64 years), 44.3±12.3 mean years, 64% women. Household income $31,200–$77,999 median.
Days of walking for transport. Self-reported. International PA Questionnaire (long form). Reporting for the previous seven days.
Objective: Street connectivity.
Perceived: Number of utilitarian destinations.
No Socio-demographic: Age, gender, education attainment, work status, marital status, having children in the households, annual household income, car ownership and neighbourhood economic status.
Learnihan, Van Niel33
Cross-sectional. Perth.
Respondents selected based on plans to relocate into new developments. Random selection of household member. Baseline data. Response rate: 33.4%.
RESIDE (n=1753) Adults (>18years). 38 years, 60% women.
(1) Doing any walking in the neighbourhood for transport or leisure (yes/no).
(2) Meeting 150 minutes per week walking general and transport.
Tool: Neighbourhood PA Questionnaire.
Objective: Walkability index composed of connectivity, residential land use and land use mix.
No Socio-demographic: Age, gender, education and household income.
Leslie, Cerin34 Cross-sectional. Greater Geelong, Victoria.
12 local parks selected (six parks pairs). Participants randomly selected from a 500m buffer around the centroid of each selected park. Response rate: 19.7%.
(n=502) Adults. 47.7±11.4 years, 64% women.
Monthly visits to a specific park. Self-reported. Neighbourhood PA Questionnaire tool has been found to be reliable for assessing different types of walking (recreation, ICC: frequency =0.92, duration = 0.90; transport, ICC: frequency = 0.92, duration = 0.96) and total walking (ICC duration = 0.91) within local neighbourhood areas.
Perceived: Park maintenance/attractiveness/opportunities/functionality/lighting/aesthetics.
Socio-demographic: Age, children in household, gender, working status, self-reported health status, education attainment and dog ownership.
Table 3. continued
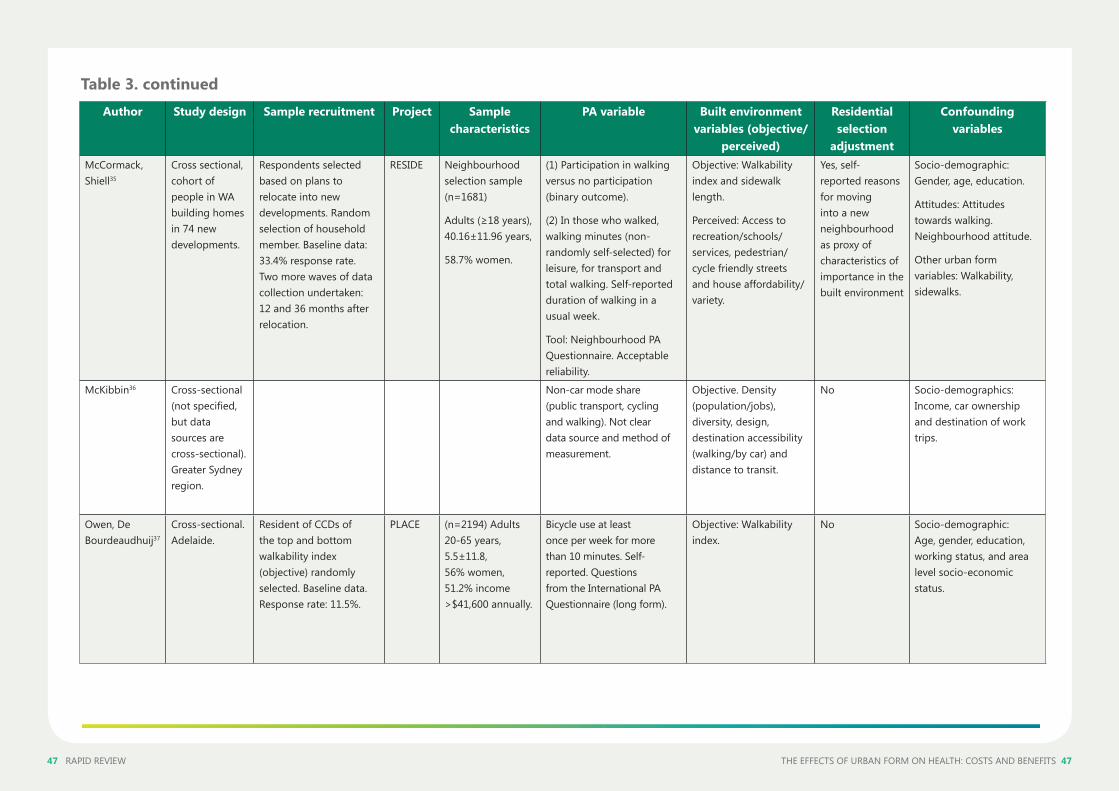
47 RAPID REVIEW THE EFFECTS OF URBAN FORM ON HEALTH: COSTS AND BENEFITS 47
Author Study design Sample recruitment Project Sample characteristics
PA variable Built environment variables (objective/
perceived)
Residential selection
adjustment
Confounding variables
McCormack, Shiell35
Cross sectional, cohort of people in WA building homes in 74 new developments.
Respondents selected based on plans to relocate into new developments. Random selection of household member. Baseline data: 33.4% response rate. Two more waves of data collection undertaken: 12 and 36 months after relocation.
RESIDE Neighbourhood selection sample (n=1681)
Adults (≥18 years), 40.16±11.96 years,
58.7% women.
(1) Participation in walking versus no participation (binary outcome).
(2) In those who walked, walking minutes (non-randomly self-selected) for leisure, for transport and total walking. Self-reported duration of walking in a usual week.
Tool: Neighbourhood PA Questionnaire. Acceptable reliability.
Objective: Walkability index and sidewalk length.
Perceived: Access to recreation/schools/services, pedestrian/cycle friendly streets and house affordability/variety.
Yes, self-reported reasons for moving into a new neighbourhood as proxy of characteristics of importance in the built environment
Socio-demographic: Gender, age, education.
Attitudes: Attitudes towards walking. Neighbourhood attitude.
Other urban form variables: Walkability, sidewalks.
McKibbin36 Cross-sectional (not specified, but data sources are cross-sectional). Greater Sydney region.
Non-car mode share (public transport, cycling and walking). Not clear data source and method of measurement.
Objective. Density (population/jobs), diversity, design, destination accessibility (walking/by car) and distance to transit.
No Socio-demographics: Income, car ownership and destination of work trips.
Owen, De Bourdeaudhuij37
Cross-sectional. Adelaide.
Resident of CCDs of the top and bottom walkability index (objective) randomly selected. Baseline data. Response rate: 11.5%.
PLACE (n=2194) Adults 20-65 years, 5.5±11.8, 56% women, 51.2% income >$41,600 annually.
Bicycle use at least once per week for more than 10 minutes. Self-reported. Questions from the International PA Questionnaire (long form).
Objective: Walkability index.
No Socio-demographic: Age, gender, education, working status, and area level socio-economic status.
Table 3. continued
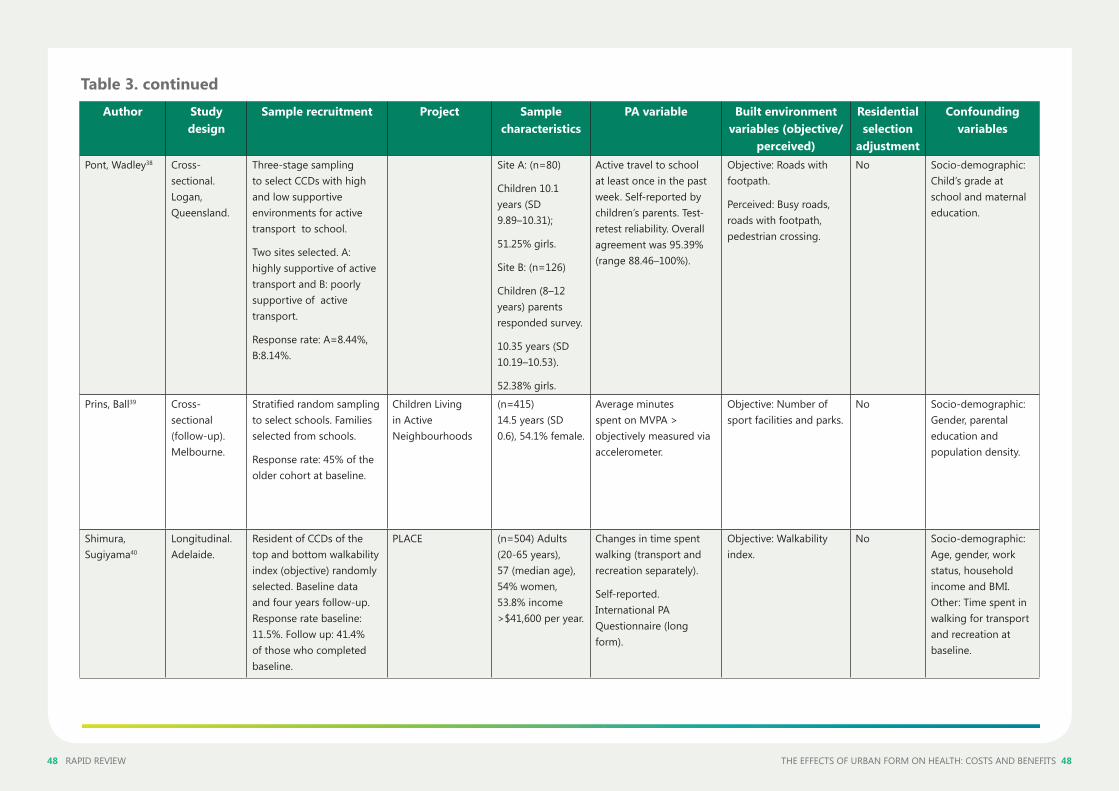
48 RAPID REVIEW THE EFFECTS OF URBAN FORM ON HEALTH: COSTS AND BENEFITS 48
Author Study design
Sample recruitment Project Sample characteristics
PA variable Built environment variables (objective/
perceived)
Residential selection
adjustment
Confounding variables
Pont, Wadley38 Cross-sectional. Logan, Queensland.
Three-stage sampling to select CCDs with high and low supportive environments for active transport to school.
Two sites selected. A: highly supportive of active transport and B: poorly supportive of active transport.
Response rate: A=8.44%, B:8.14%.
Site A: (n=80)
Children 10.1 years (SD 9.89–10.31);
51.25% girls.
Site B: (n=126)
Children (8–12 years) parents responded survey.
10.35 years (SD 10.19–10.53).
52.38% girls.
Active travel to school at least once in the past week. Self-reported by children’s parents. Test-retest reliability. Overall agreement was 95.39% (range 88.46–100%).
Objective: Roads with footpath.
Perceived: Busy roads, roads with footpath, pedestrian crossing.
No Socio-demographic: Child’s grade at school and maternal education.
Prins, Ball39 Cross-sectional (follow-up). Melbourne.
Stratified random sampling to select schools. Families selected from schools.
Response rate: 45% of the older cohort at baseline.
Children Living in Active Neighbourhoods
(n=415) 14.5 years (SD 0.6), 54.1% female.
Average minutes spent on MVPA > objectively measured via accelerometer.
Objective: Number of sport facilities and parks.
No Socio-demographic: Gender, parental education and population density.
Shimura, Sugiyama40
Longitudinal. Adelaide.
Resident of CCDs of the top and bottom walkability index (objective) randomly selected. Baseline data and four years follow-up. Response rate baseline: 11.5%. Follow up: 41.4% of those who completed baseline.
PLACE (n=504) Adults (20-65 years), 57 (median age), 54% women, 53.8% income >$41,600 per year.
Changes in time spent walking (transport and recreation separately).
Self-reported. International PA Questionnaire (long form).
Objective: Walkability index.
No Socio-demographic: Age, gender, work status, household income and BMI. Other: Time spent in walking for transport and recreation at baseline.
Table 3. continued
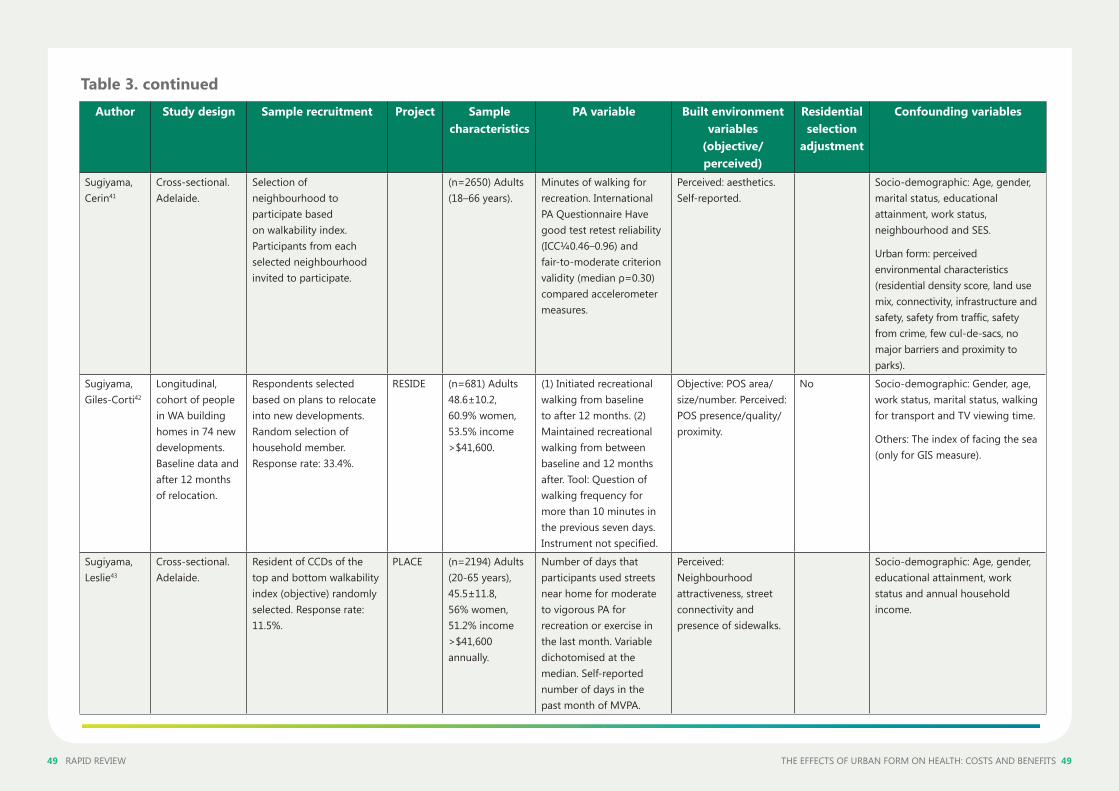
49 RAPID REVIEW THE EFFECTS OF URBAN FORM ON HEALTH: COSTS AND BENEFITS 49
Author Study design Sample recruitment Project Sample characteristics
PA variable Built environment variables
(objective/perceived)
Residential selection
adjustment
Confounding variables
Sugiyama, Cerin41
Cross-sectional. Adelaide.
Selection of neighbourhood to participate based on walkability index. Participants from each selected neighbourhood invited to participate.
(n=2650) Adults (18–66 years).
Minutes of walking for recreation. International PA Questionnaire Have good test retest reliability (ICC¼0.46–0.96) and fair-to-moderate criterion validity (median ρ=0.30) compared accelerometer measures.
Perceived: aesthetics. Self-reported.
Socio-demographic: Age, gender, marital status, educational attainment, work status, neighbourhood and SES.
Urban form: perceived environmental characteristics (residential density score, land use mix, connectivity, infrastructure and safety, safety from traffic, safety from crime, few cul-de-sacs, no major barriers and proximity to parks).
Sugiyama, Giles-Corti42
Longitudinal, cohort of people in WA building homes in 74 new developments. Baseline data and after 12 months of relocation.
Respondents selected based on plans to relocate into new developments. Random selection of household member. Response rate: 33.4%.
RESIDE (n=681) Adults 48.6±10.2, 60.9% women, 53.5% income >$41,600.
(1) Initiated recreational walking from baseline to after 12 months. (2) Maintained recreational walking from between baseline and 12 months after. Tool: Question of walking frequency for more than 10 minutes in the previous seven days. Instrument not specified.
Objective: POS area/size/number. Perceived: POS presence/quality/proximity.
No Socio-demographic: Gender, age, work status, marital status, walking for transport and TV viewing time.
Others: The index of facing the sea (only for GIS measure).
Sugiyama, Leslie43
Cross-sectional. Adelaide.
Resident of CCDs of the top and bottom walkability index (objective) randomly selected. Response rate: 11.5%.
PLACE (n=2194) Adults (20-65 years), 45.5±11.8, 56% women, 51.2% income >$41,600 annually.
Number of days that participants used streets near home for moderate to vigorous PA for recreation or exercise in the last month. Variable dichotomised at the median. Self-reported number of days in the past month of MVPA.
Perceived: Neighbourhood attractiveness, street connectivity and presence of sidewalks.
Socio-demographic: Age, gender, educational attainment, work status and annual household income.
Table 3. continued
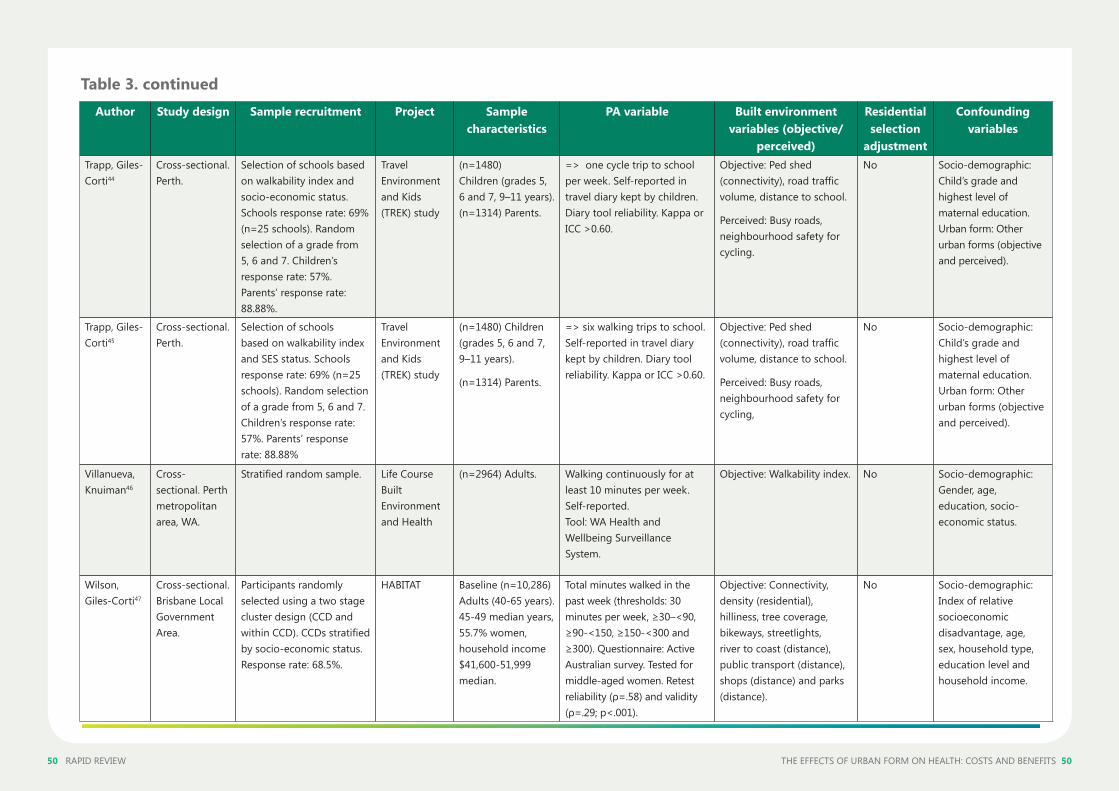
50 RAPID REVIEW THE EFFECTS OF URBAN FORM ON HEALTH: COSTS AND BENEFITS 50
Author Study design Sample recruitment Project Sample characteristics
PA variable Built environment variables (objective/
perceived)
Residential selection
adjustment
Confounding variables
Trapp, Giles-Corti44
Cross-sectional. Perth.
Selection of schools based on walkability index and socio-economic status. Schools response rate: 69% (n=25 schools). Random selection of a grade from 5, 6 and 7. Children’s response rate: 57%. Parents’ response rate: 88.88%.
Travel Environment and Kids (TREK) study
(n=1480) Children (grades 5, 6 and 7, 9–11 years).(n=1314) Parents.
=> one cycle trip to school per week. Self-reported in travel diary kept by children. Diary tool reliability. Kappa or ICC >0.60.
Objective: Ped shed (connectivity), road traffic volume, distance to school.
Perceived: Busy roads, neighbourhood safety for cycling.
No Socio-demographic: Child’s grade and highest level of maternal education. Urban form: Other urban forms (objective and perceived).
Trapp, Giles-Corti45
Cross-sectional. Perth.
Selection of schools based on walkability index and SES status. Schools response rate: 69% (n=25 schools). Random selection of a grade from 5, 6 and 7. Children’s response rate: 57%. Parents’ response rate: 88.88%
Travel Environment and Kids (TREK) study
(n=1480) Children (grades 5, 6 and 7, 9–11 years).
(n=1314) Parents.
=> six walking trips to school. Self-reported in travel diary kept by children. Diary tool reliability. Kappa or ICC >0.60.
Objective: Ped shed (connectivity), road traffic volume, distance to school.
Perceived: Busy roads, neighbourhood safety for cycling,
No Socio-demographic: Child’s grade and highest level of maternal education. Urban form: Other urban forms (objective and perceived).
Villanueva, Knuiman46
Cross-sectional. Perth metropolitan area, WA.
Stratified random sample. Life Course Built Environment and Health
(n=2964) Adults. Walking continuously for at least 10 minutes per week. Self-reported. Tool: WA Health and Wellbeing Surveillance System.
Objective: Walkability index. No Socio-demographic: Gender, age, education, socio-economic status.
Wilson, Giles-Corti47
Cross-sectional. Brisbane Local Government Area.
Participants randomly selected using a two stage cluster design (CCD and within CCD). CCDs stratified by socio-economic status. Response rate: 68.5%.
HABITAT Baseline (n=10,286) Adults (40-65 years). 45-49 median years, 55.7% women, household income $41,600-51,999 median.
Total minutes walked in the past week (thresholds: 30 minutes per week, ≥30–<90, ≥90-<150, ≥150-<300 and ≥300). Questionnaire: Active Australian survey. Tested for middle-aged women. Retest reliability (ρ=.58) and validity (ρ=.29; p<.001).
Objective: Connectivity, density (residential), hilliness, tree coverage, bikeways, streetlights, river to coast (distance), public transport (distance), shops (distance) and parks (distance).
No Socio-demographic: Index of relative socioeconomic disadvantage, age, sex, household type, education level and household income.
Table 3. continued
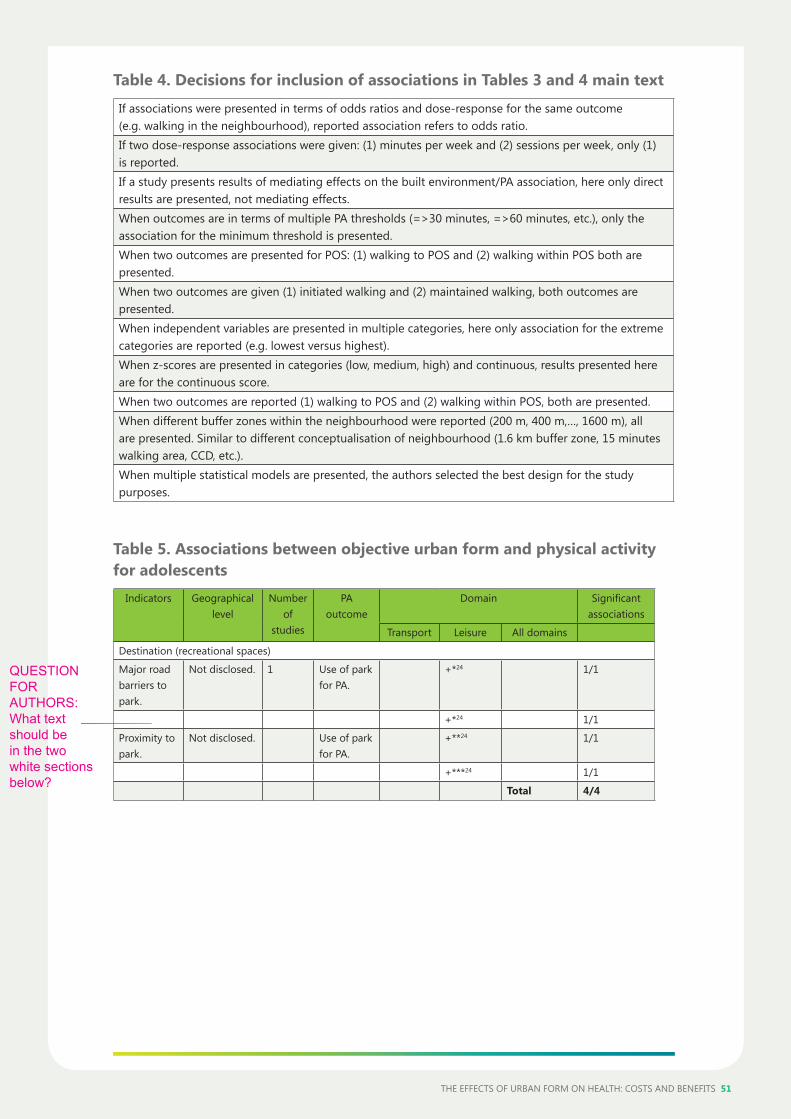
THE EFFECTS OF URBAN FORM ON HEALTH: COSTS AND BENEFITS 51
Table 4. Decisions for inclusion of associations in Tables 3 and 4 main text
If associations were presented in terms of odds ratios and dose-response for the same outcome (e.g. walking in the neighbourhood), reported association refers to odds ratio.If two dose-response associations were given: (1) minutes per week and (2) sessions per week, only (1) is reported.If a study presents results of mediating effects on the built environment/PA association, here only direct results are presented, not mediating effects.When outcomes are in terms of multiple PA thresholds (=>30 minutes, =>60 minutes, etc.), only the association for the minimum threshold is presented.When two outcomes are presented for POS: (1) walking to POS and (2) walking within POS both are presented.When two outcomes are given (1) initiated walking and (2) maintained walking, both outcomes are presented.When independent variables are presented in multiple categories, here only association for the extreme categories are reported (e.g. lowest versus highest).When z-scores are presented in categories (low, medium, high) and continuous, results presented here are for the continuous score.When two outcomes are reported (1) walking to POS and (2) walking within POS, both are presented.When different buffer zones within the neighbourhood were reported (200 m, 400 m,…, 1600 m), all are presented. Similar to different conceptualisation of neighbourhood (1.6 km buffer zone, 15 minutes walking area, CCD, etc.).When multiple statistical models are presented, the authors selected the best design for the study purposes.
Table 5. Associations between objective urban form and physical activity for adolescents
Indicators Geographical level
Number of
studies
PA outcome
Domain Significant associations
Transport Leisure All domains
Destination (recreational spaces)
Major road barriers to park.
Not disclosed. 1 Use of park for PA.
+*24 1/1
+*24 1/1
Proximity to park.
Not disclosed. Use of park for PA.
+**24 1/1
+***24 1/1
Total 4/4
QUESTION FOR AUTHORS: What text should be in the two white sections below?
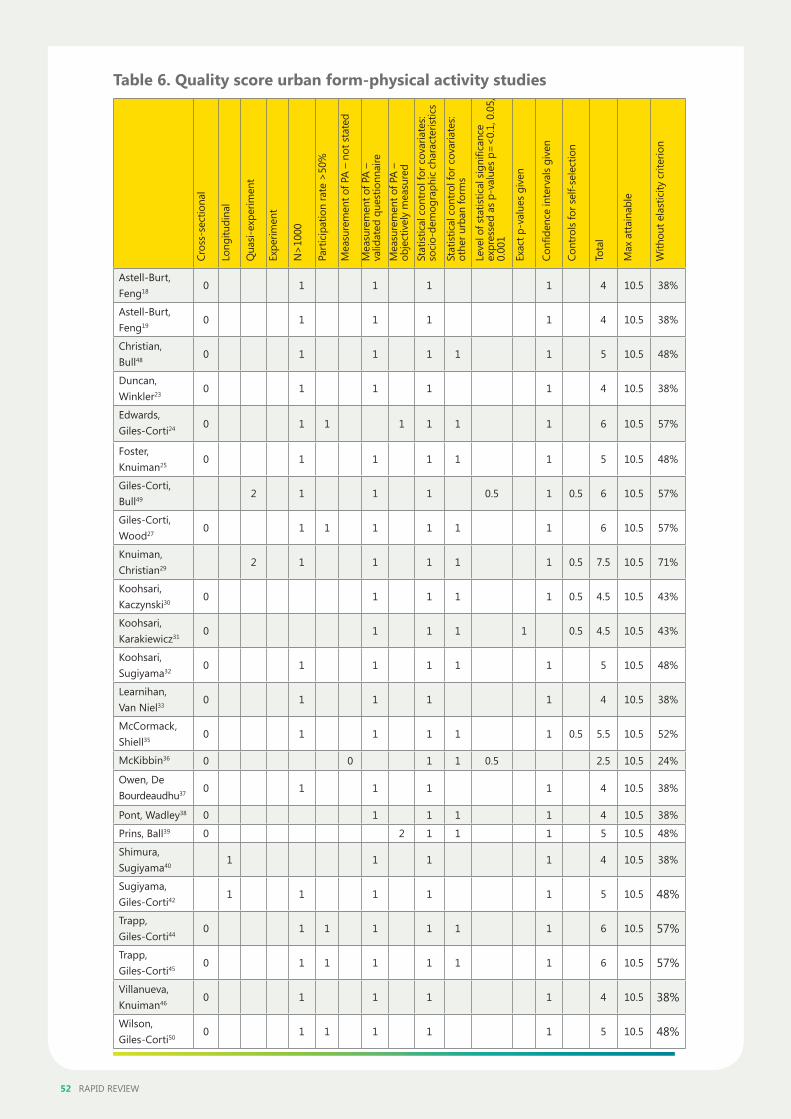
52 RAPID REVIEW
Table 6. Quality score urban form-physical activity studies
Astell-Burt, Feng18
0 1 1 1 1 4 10.5 38%
Astell-Burt, Feng19
0 1 1 1 1 4 10.5 38%
Christian, Bull48
0 1 1 1 1 1 5 10.5 48%
Duncan, Winkler23
0 1 1 1 1 4 10.5 38%
Edwards, Giles-Corti24 0 1 1 1 1 1 1 6 10.5 57%
Foster, Knuiman25
0 1 1 1 1 1 5 10.5 48%
Giles-Corti, Bull49
2 1 1 1 0.5 1 0.5 6 10.5 57%
Giles-Corti, Wood27
0 1 1 1 1 1 1 6 10.5 57%
Knuiman, Christian29
2 1 1 1 1 1 0.5 7.5 10.5 71%
Koohsari, Kaczynski30
0 1 1 1 1 0.5 4.5 10.5 43%
Koohsari, Karakiewicz31
0 1 1 1 1 0.5 4.5 10.5 43%
Koohsari, Sugiyama32
0 1 1 1 1 1 5 10.5 48%
Learnihan, Van Niel33
0 1 1 1 1 4 10.5 38%
McCormack, Shiell35
0 1 1 1 1 1 0.5 5.5 10.5 52%
McKibbin36 0 0 1 1 0.5 2.5 10.5 24%
Owen, De Bourdeaudhu37 0 1 1 1 1 4 10.5 38%
Pont, Wadley38 0 1 1 1 1 4 10.5 38%
Prins, Ball39 0 2 1 1 1 5 10.5 48%
Shimura, Sugiyama40
1 1 1 1 4 10.5 38%
Sugiyama, Giles-Corti42
1 1 1 1 1 5 10.5 48%
Trapp, Giles-Corti44
0 1 1 1 1 1 1 6 10.5 57%
Trapp, Giles-Corti45
0 1 1 1 1 1 1 6 10.5 57%
Villanueva, Knuiman46
0 1 1 1 1 4 10.5 38%
Wilson, Giles-Corti50
0 1 1 1 1 1 5 10.5 48%
Cros
s-se
ctio
nal
Long
itudi
nal
Qua
si-ex
perim
ent
Expe
rimen
t
N>
1000
Part
icip
atio
n ra
te >
50%
Mea
sure
men
t of P
A –
not s
tate
d
Mea
sure
men
t of P
A –
va
lidat
ed q
uest
ionn
aire
Mea
sure
men
t of P
A –
ob
ject
ivel
y m
easu
red
Stat
istic
al c
ontr
ol fo
r cov
aria
tes:
so
cio-
dem
ogra
phic
cha
ract
erist
ics
Stat
istic
al c
ontr
ol fo
r cov
aria
tes:
ot
her u
rban
form
s
Leve
l of s
tatis
tical
sig
nific
ance
ex
pres
sed
as p
-val
ues
p=<
0.1,
0.0
5,
0.00
1
Exac
t p-v
alue
s gi
ven
Confi
denc
e in
terv
als
give
n
Cont
rols
for s
elf-s
elec
tion
Tota
l
Max
att
aina
ble
With
out e
last
icity
crit
erio
n
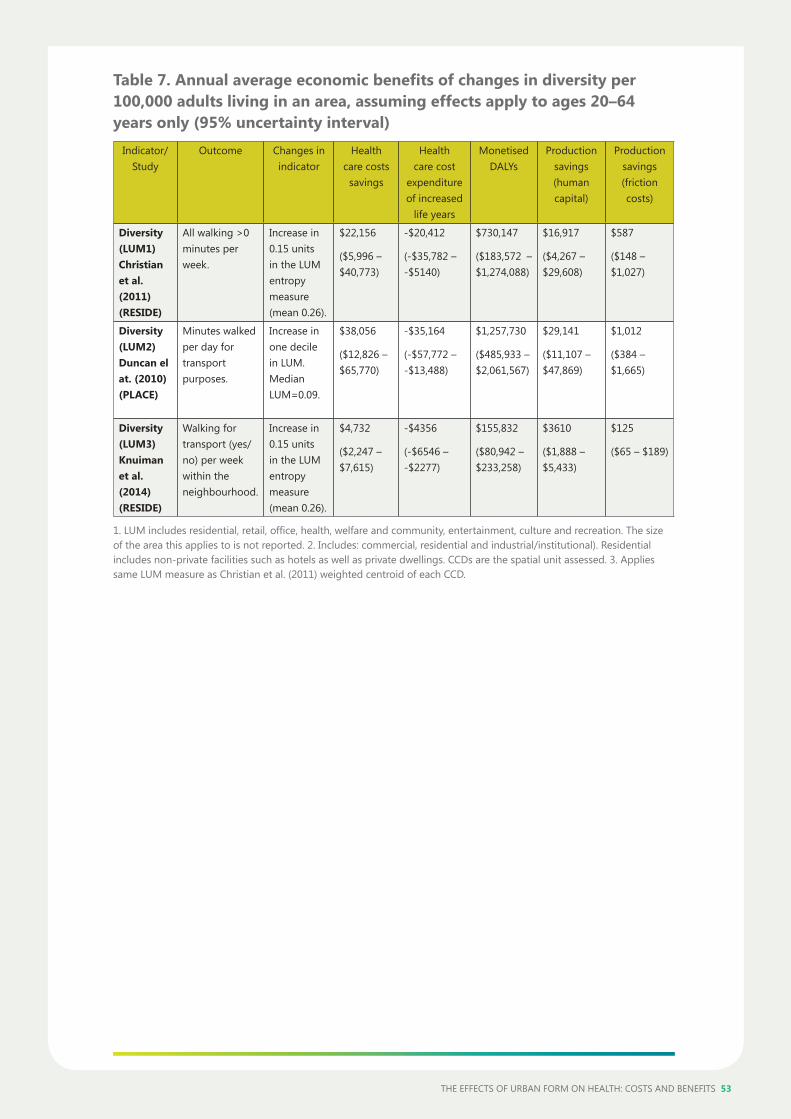
THE EFFECTS OF URBAN FORM ON HEALTH: COSTS AND BENEFITS 53
Table 7. Annual average economic benefits of changes in diversity per 100,000 adults living in an area, assuming effects apply to ages 20–64 years only (95% uncertainty interval)
Indicator/Study
Outcome Changes in indicator
Health care costs
savings
Health care cost
expenditure of increased
life years
Monetised DALYs
Production savings (human capital)
Production savings (friction costs)
Diversity (LUM1) Christian et al. (2011) (RESIDE)
All walking >0 minutes per week.
Increase in 0.15 units in the LUM entropy measure (mean 0.26).
$22,156
($5,996 – $40,773)
-$20,412
(-$35,782 – -$5140)
$730,147
($183,572 – $1,274,088)
$16,917
($4,267 – $29,608)
$587
($148 – $1,027)
Diversity (LUM2)Duncan el at. (2010) (PLACE)
Minutes walked per day for transport purposes.
Increase in one decile in LUM. Median LUM=0.09.
$38,056
($12,826 – $65,770)
-$35,164
(-$57,772 – -$13,488)
$1,257,730
($485,933 – $2,061,567)
$29,141
($11,107 – $47,869)
$1,012
($384 – $1,665)
Diversity (LUM3)Knuiman et al. (2014) (RESIDE)
Walking for transport (yes/no) per week within the neighbourhood.
Increase in 0.15 units in the LUM entropy measure (mean 0.26).
$4,732
($2,247 – $7,615)
-$4356
(-$6546 – -$2277)
$155,832
($80,942 – $233,258)
$3610
($1,888 – $5,433)
$125
($65 – $189)
1. LUM includes residential, retail, office, health, welfare and community, entertainment, culture and recreation. The size of the area this applies to is not reported. 2. Includes: commercial, residential and industrial/institutional). Residential includes non-private facilities such as hotels as well as private dwellings. CCDs are the spatial unit assessed. 3. Applies same LUM measure as Christian et al. (2011) weighted centroid of each CCD.
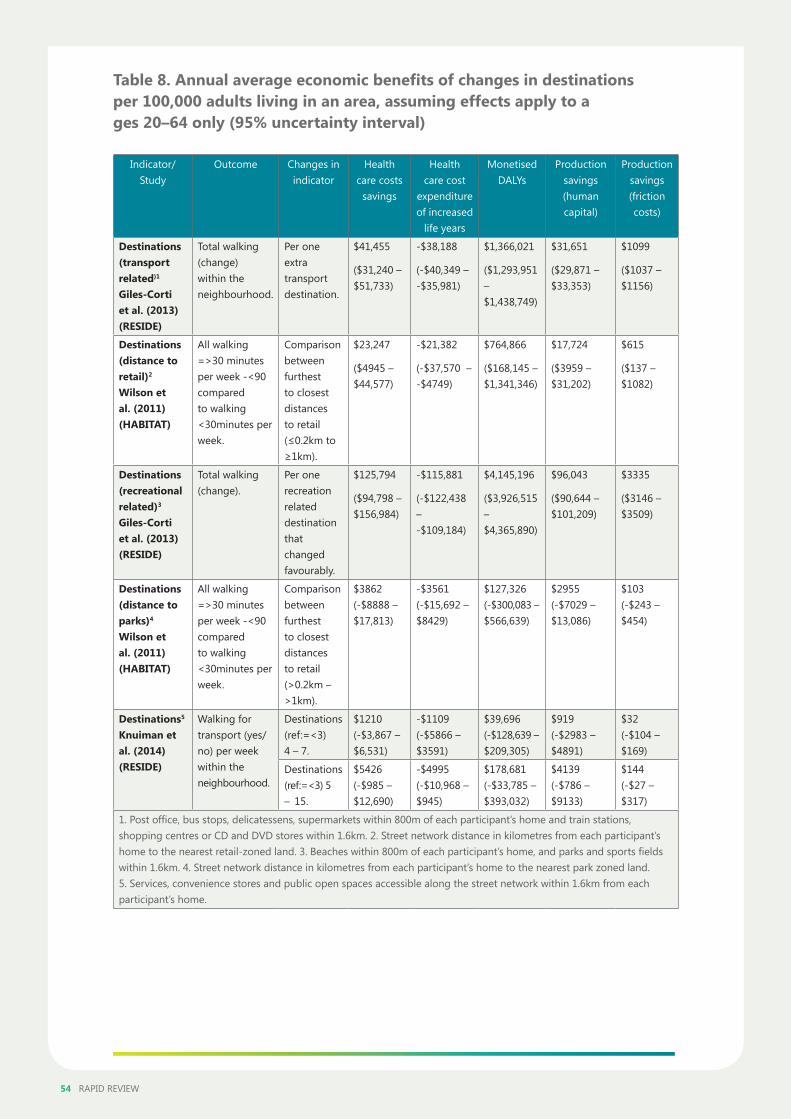
54 RAPID REVIEW
Table 8. Annual average economic benefits of changes in destinations per 100,000 adults living in an area, assuming effects apply to a ges 20–64 only (95% uncertainty interval)
Indicator/Study
Outcome Changes in indicator
Health care costs
savings
Health care cost
expenditure of increased
life years
Monetised DALYs
Production savings (human capital)
Production savings (friction costs)
Destinations (transport related)1 Giles-Corti et al. (2013) (RESIDE)
Total walking (change) within the neighbourhood.
Per one extra transport destination.
$41,455
($31,240 – $51,733)
-$38,188
(-$40,349 – -$35,981)
$1,366,021
($1,293,951 – $1,438,749)
$31,651
($29,871 – $33,353)
$1099
($1037 – $1156)
Destinations (distance to retail)2 Wilson et al. (2011) (HABITAT)
All walking =>30 minutes per week -<90 compared to walking <30minutes per week.
Comparison between furthest to closest distances to retail (≤0.2km to ≥1km).
$23,247
($4945 – $44,577)
-$21,382
(-$37,570 – -$4749)
$764,866
($168,145 – $1,341,346)
$17,724
($3959 – $31,202)
$615
($137 – $1082)
Destinations (recreational related)3 Giles-Corti et al. (2013) (RESIDE)
Total walking (change).
Per one recreation related destination that changed favourably.
$125,794
($94,798 – $156,984)
-$115,881
(-$122,438 – -$109,184)
$4,145,196
($3,926,515 – $4,365,890)
$96,043
($90,644 – $101,209)
$3335
($3146 – $3509)
Destinations (distance to parks)4 Wilson et al. (2011) (HABITAT)
All walking =>30 minutes per week -<90 compared to walking <30minutes per week.
Comparison between furthest to closest distances to retail (>0.2km – >1km).
$3862 (-$8888 – $17,813)
-$3561 (-$15,692 – $8429)
$127,326 (-$300,083 – $566,639)
$2955 (-$7029 – $13,086)
$103 (-$243 – $454)
Destinations5 Knuiman et al. (2014) (RESIDE)
Walking for transport (yes/no) per week within the neighbourhood.
Destinations (ref:=<3) 4 – 7.
$1210 (-$3,867 – $6,531)
-$1109 (-$5866 – $3591)
$39,696 (-$128,639 – $209,305)
$919 (-$2983 – $4891)
$32 (-$104 – $169)
Destinations (ref:=<3) 5 – 15.
$5426 (-$985 – $12,690)
-$4995 (-$10,968 – $945)
$178,681 (-$33,785 – $393,032)
$4139 (-$786 – $9133)
$144 (-$27 – $317)
1. Post office, bus stops, delicatessens, supermarkets within 800m of each participant’s home and train stations, shopping centres or CD and DVD stores within 1.6km. 2. Street network distance in kilometres from each participant’s home to the nearest retail-zoned land. 3. Beaches within 800m of each participant’s home, and parks and sports fields within 1.6km. 4. Street network distance in kilometres from each participant’s home to the nearest park zoned land. 5. Services, convenience stores and public open spaces accessible along the street network within 1.6km from each participant’s home.
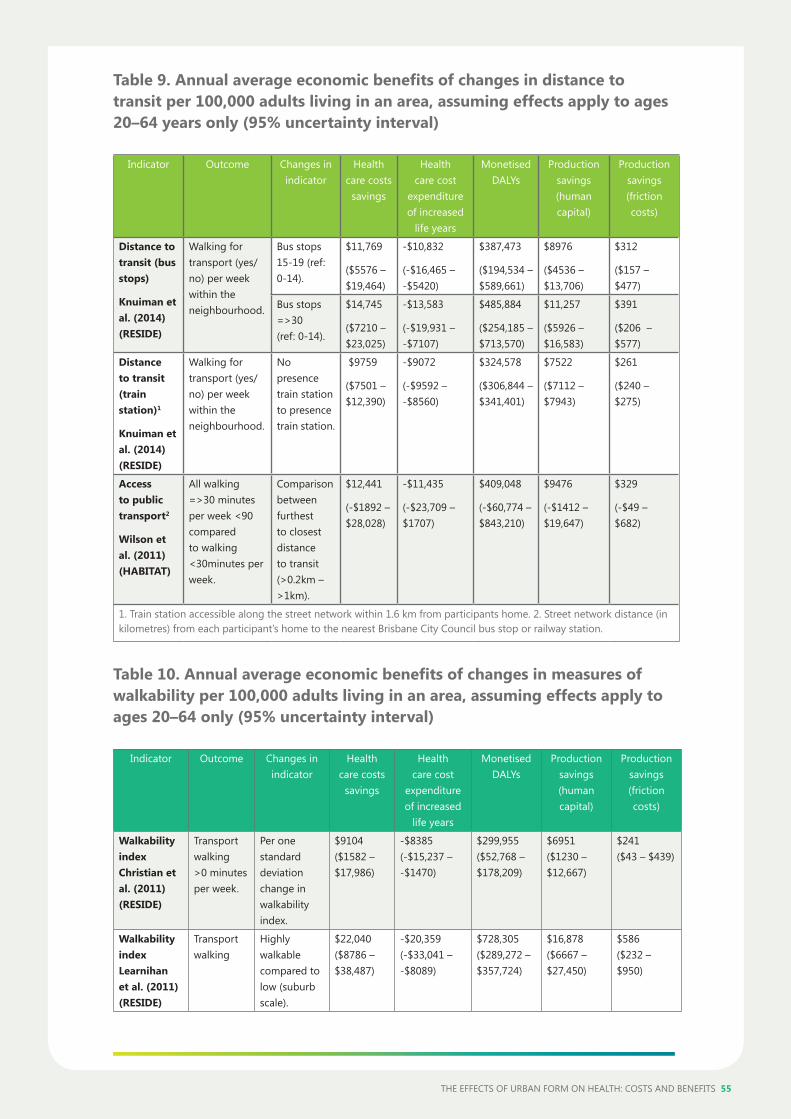
THE EFFECTS OF URBAN FORM ON HEALTH: COSTS AND BENEFITS 55
Table 9. Annual average economic benefits of changes in distance to transit per 100,000 adults living in an area, assuming effects apply to ages 20–64 years only (95% uncertainty interval)
Indicator Outcome Changes in indicator
Health care costs
savings
Health care cost
expenditure of increased
life years
Monetised DALYs
Production savings (human capital)
Production savings (friction costs)
Distance to transit (bus stops)
Knuiman et al. (2014) (RESIDE)
Walking for transport (yes/no) per week within the neighbourhood.
Bus stops 15-19 (ref: 0-14).
$11,769
($5576 – $19,464)
-$10,832
(-$16,465 – -$5420)
$387,473
($194,534 – $589,661)
$8976
($4536 – $13,706)
$312
($157 – $477)
Bus stops =>30 (ref: 0-14).
$14,745
($7210 – $23,025)
-$13,583
(-$19,931 – -$7107)
$485,884
($254,185 – $713,570)
$11,257
($5926 – $16,583)
$391
($206 – $577)
Distance to transit (train station)1
Knuiman et al. (2014) (RESIDE)
Walking for transport (yes/no) per week within the neighbourhood.
No presence train station to presence train station.
$9759
($7501 – $12,390)
-$9072
(-$9592 – -$8560)
$324,578
($306,844 – $341,401)
$7522
($7112 – $7943)
$261
($240 – $275)
Access to public transport2
Wilson et al. (2011) (HABITAT)
All walking =>30 minutes per week <90 compared to walking <30minutes per week.
Comparison between furthest to closest distance to transit (>0.2km – >1km).
$12,441
(-$1892 – $28,028)
-$11,435
(-$23,709 – $1707)
$409,048
(-$60,774 – $843,210)
$9476
(-$1412 – $19,647)
$329
(-$49 – $682)
1. Train station accessible along the street network within 1.6 km from participants home. 2. Street network distance (in kilometres) from each participant’s home to the nearest Brisbane City Council bus stop or railway station.
Table 10. Annual average economic benefits of changes in measures of walkability per 100,000 adults living in an area, assuming effects apply to ages 20–64 only (95% uncertainty interval)
Indicator Outcome Changes in indicator
Health care costs
savings
Health care cost
expenditure of increased
life years
Monetised DALYs
Production savings (human capital)
Production savings (friction costs)
Walkability index Christian et al. (2011) (RESIDE)
Transport walking >0 minutes per week.
Per one standard deviation change in walkability index.
$9104 ($1582 – $17,986)
-$8385 (-$15,237 – -$1470)
$299,955 ($52,768 – $178,209)
$6951 ($1230 – $12,667)
$241 ($43 – $439)
Walkability index Learnihan et al. (2011) (RESIDE)
Transport walking
Highly walkable compared to low (suburb scale).
$22,040 ($8786 – $38,487)
-$20,359 (-$33,041 – -$8089)
$728,305 ($289,272 – $357,724)
$16,878 ($6667 – $27,450)
$586 ($232 – $950)
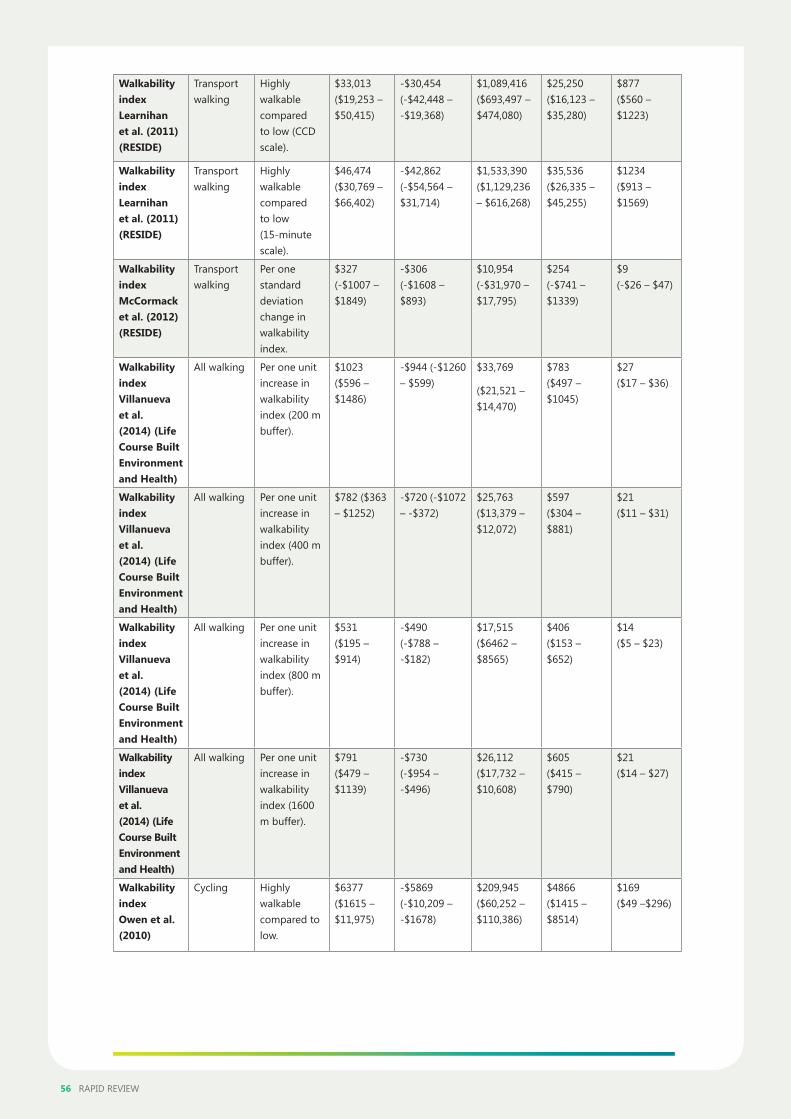
56 RAPID REVIEW
Walkability index Learnihan et al. (2011) (RESIDE)
Transport walking
Highly walkable compared to low (CCD scale).
$33,013 ($19,253 – $50,415)
-$30,454 (-$42,448 – -$19,368)
$1,089,416 ($693,497 – $474,080)
$25,250 ($16,123 – $35,280)
$877 ($560 – $1223)
Walkability index Learnihan et al. (2011) (RESIDE)
Transport walking
Highly walkable compared to low (15-minute scale).
$46,474 ($30,769 – $66,402)
-$42,862 (-$54,564 – $31,714)
$1,533,390 ($1,129,236 – $616,268)
$35,536 ($26,335 – $45,255)
$1234 ($913 – $1569)
Walkability index McCormack et al. (2012) (RESIDE)
Transport walking
Per one standard deviation change in walkability index.
$327 (-$1007 – $1849)
-$306 (-$1608 – $893)
$10,954 (-$31,970 – $17,795)
$254 (-$741 – $1339)
$9 (-$26 – $47)
Walkability index Villanueva et al. (2014) (Life Course Built Environment and Health)
All walking Per one unit increase in walkability index (200 m buffer).
$1023 ($596 – $1486)
-$944 (-$1260 – $599)
$33,769
($21,521 – $14,470)
$783 ($497 – $1045)
$27 ($17 – $36)
Walkability index Villanueva et al. (2014) (Life Course Built Environment and Health)
All walking
Per one unit increase in walkability index (400 m buffer).
$782 ($363 – $1252)
-$720 (-$1072 – -$372)
$25,763 ($13,379 – $12,072)
$597 ($304 – $881)
$21 ($11 – $31)
Walkability index Villanueva et al. (2014) (Life Course Built Environment and Health)
All walking Per one unit increase in walkability index (800 m buffer).
$531 ($195 – $914)
-$490 (-$788 – -$182)
$17,515 ($6462 – $8565)
$406 ($153 – $652)
$14 ($5 – $23)
Walkability index Villanueva et al. (2014) (Life Course Built Environment and Health)
All walking Per one unit increase in walkability index (1600 m buffer).
$791 ($479 – $1139)
-$730 (-$954 – -$496)
$26,112 ($17,732 – $10,608)
$605 ($415 – $790)
$21 ($14 – $27)
Walkability index Owen et al. (2010)
Cycling Highly walkable compared to low.
$6377 ($1615 – $11,975)
-$5869 (-$10,209 – -$1678)
$209,945 ($60,252 – $110,386)
$4866 ($1415 – $8514)
$169 ($49 –$296)
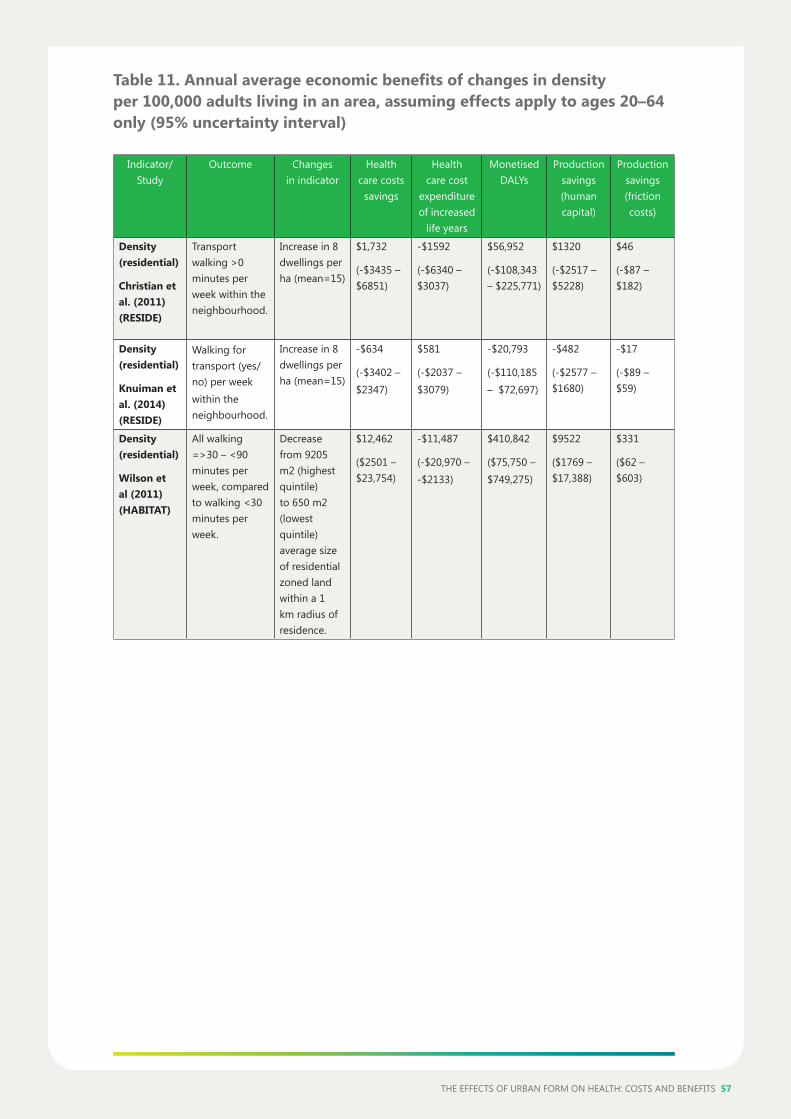
THE EFFECTS OF URBAN FORM ON HEALTH: COSTS AND BENEFITS 57
Table 11. Annual average economic benefits of changes in density per 100,000 adults living in an area, assuming effects apply to ages 20–64 only (95% uncertainty interval)
Indicator/Study
Outcome Changes in indicator
Health care costs
savings
Health care cost
expenditure of increased
life years
Monetised DALYs
Production savings (human capital)
Production savings (friction costs)
Density (residential)
Christian et al. (2011) (RESIDE)
Transport walking >0 minutes per week within the neighbourhood.
Increase in 8 dwellings per ha (mean=15)
$1,732
(-$3435 – $6851)
-$1592
(-$6340 – $3037)
$56,952
(-$108,343 – $225,771)
$1320
(-$2517 – $5228)
$46
(-$87 – $182)
Density (residential)
Knuiman et al. (2014) (RESIDE)
Walking for transport (yes/no) per week within the neighbourhood.
Increase in 8 dwellings per ha (mean=15)
-$634
(-$3402 – $2347)
$581
(-$2037 – $3079)
-$20,793
(-$110,185 – $72,697)
-$482
(-$2577 – $1680)
-$17
(-$89 – $59)
Density (residential)
Wilson et al (2011) (HABITAT)
All walking =>30 – <90 minutes per week, compared to walking <30 minutes per week.
Decrease from 9205 m2 (highest quintile) to 650 m2 (lowest quintile) average size of residential zoned land within a 1 km radius of residence.
$12,462
($2501 – $23,754)
-$11,487
(-$20,970 – -$2133)
$410,842
($75,750 – $749,275)
$9522
($1769 – $17,388)
$331
($62 – $603)
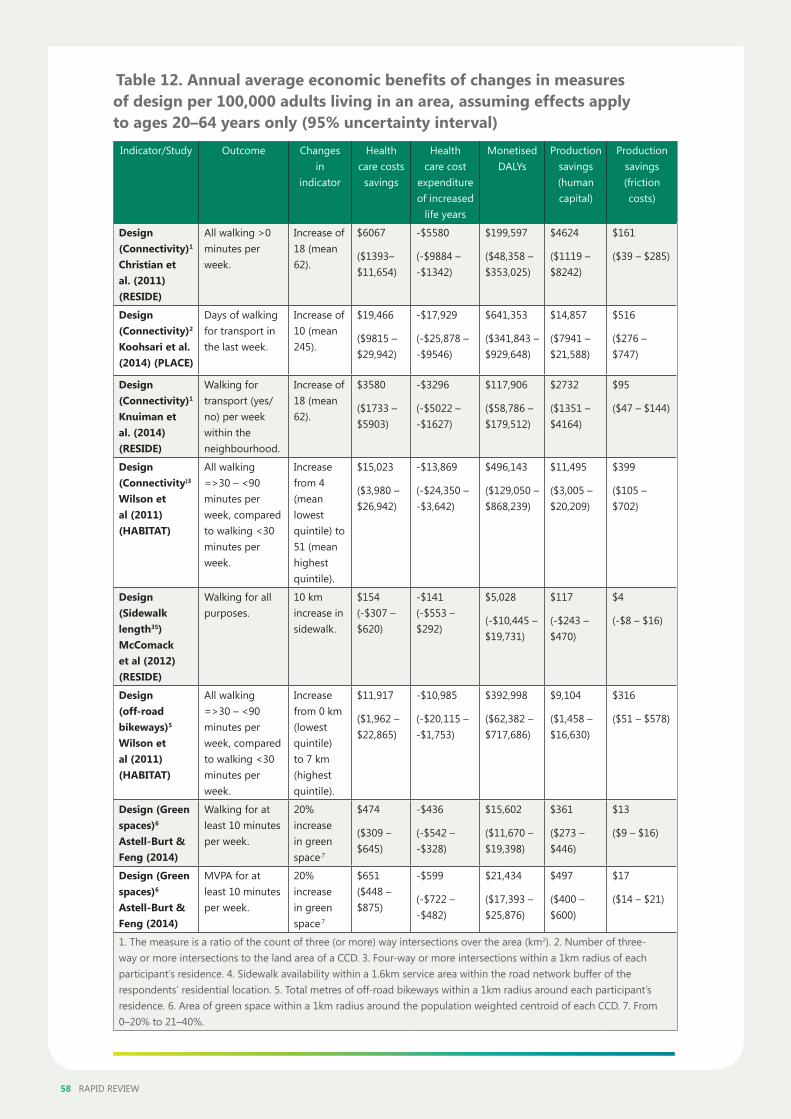
58 RAPID REVIEW
Table 12. Annual average economic benefits of changes in measures of design per 100,000 adults living in an area, assuming effects apply to ages 20–64 years only (95% uncertainty interval)
Indicator/Study Outcome Changes in
indicator
Health care costs
savings
Health care cost
expenditure of increased
life years
Monetised DALYs
Production savings (human capital)
Production savings (friction costs)
Design (Connectivity)1 Christian et al. (2011) (RESIDE)
All walking >0 minutes per week.
Increase of 18 (mean 62).
$6067
($1393– $11,654)
-$5580
(-$9884 – -$1342)
$199,597
($48,358 – $353,025)
$4624
($1119 – $8242)
$161
($39 – $285)
Design (Connectivity)2 Koohsari et al. (2014) (PLACE)
Days of walking for transport in the last week.
Increase of 10 (mean 245).
$19,466
($9815 – $29,942)
-$17,929
(-$25,878 – -$9546)
$641,353
($341,843 – $929,648)
$14,857
($7941 – $21,588)
$516
($276 – $747)
Design (Connectivity)1 Knuiman et al. (2014) (RESIDE)
Walking for transport (yes/no) per week within the neighbourhood.
Increase of 18 (mean 62).
$3580
($1733 – $5903)
-$3296
(-$5022 – -$1627)
$117,906
($58,786 – $179,512)
$2732
($1351 – $4164)
$95
($47 – $144)
Design (Connectivity)3
Wilson et al (2011) (HABITAT)
All walking =>30 – <90 minutes per week, compared to walking <30 minutes per week.
Increase from 4 (mean lowest quintile) to 51 (mean highest quintile).
$15,023
($3,980 – $26,942)
-$13,869
(-$24,350 – -$3,642)
$496,143
($129,050 – $868,239)
$11,495
($3,005 – $20,209)
$399
($105 – $702)
Design (Sidewalk length35) McComack et al (2012) (RESIDE)
Walking for all purposes.
10 km increase in sidewalk.
$154 (-$307 – $620)
-$141 (-$553 – $292)
$5,028
(-$10,445 – $19,731)
$117
(-$243 – $470)
$4
(-$8 – $16)
Design (off-road bikeways)5 Wilson et al (2011) (HABITAT)
All walking =>30 – <90 minutes per week, compared to walking <30 minutes per week.
Increase from 0 km (lowest quintile) to 7 km (highest quintile).
$11,917
($1,962 – $22,865)
-$10,985
(-$20,115 – -$1,753)
$392,998
($62,382 – $717,686)
$9,104
($1,458 – $16,630)
$316
($51 – $578)
Design (Green spaces)6 Astell-Burt & Feng (2014)
Walking for at least 10 minutes per week.
20% increase in green space.7
$474
($309 – $645)
-$436
(-$542 – -$328)
$15,602
($11,670 – $19,398)
$361
($273 – $446)
$13
($9 – $16)
Design (Green spaces)6 Astell-Burt & Feng (2014)
MVPA for at least 10 minutes per week.
20% increase in green space.7
$651 ($448 – $875)
-$599
(-$722 – -$482)
$21,434
($17,393 – $25,876)
$497
($400 – $600)
$17
($14 – $21)
1. The measure is a ratio of the count of three (or more) way intersections over the area (km2). 2. Number of three-way or more intersections to the land area of a CCD. 3. Four-way or more intersections within a 1km radius of each participant’s residence. 4. Sidewalk availability within a 1.6km service area within the road network buffer of the respondents’ residential location. 5. Total metres of off-road bikeways within a 1km radius around each participant’s residence. 6. Area of green space within a 1km radius around the population weighted centroid of each CCD. 7. From 0–20% to 21–40%.
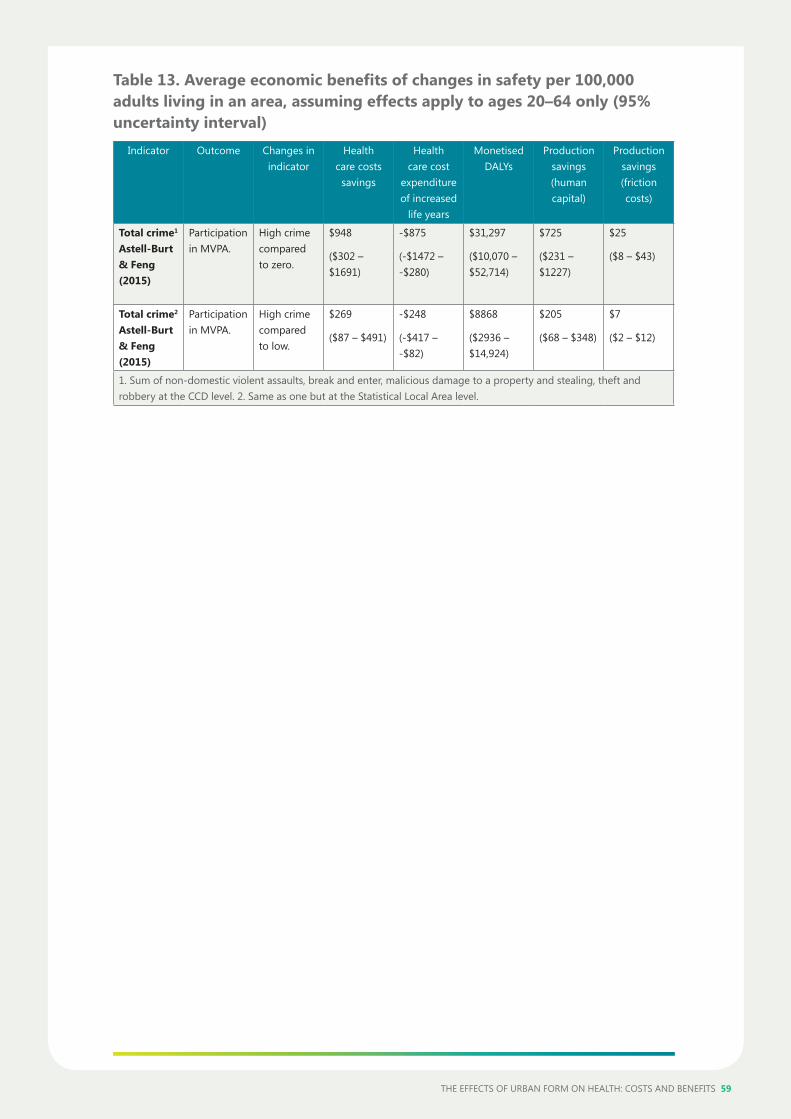
THE EFFECTS OF URBAN FORM ON HEALTH: COSTS AND BENEFITS 59
Table 13. Average economic benefits of changes in safety per 100,000 adults living in an area, assuming effects apply to ages 20–64 only (95% uncertainty interval)
Indicator Outcome Changes in indicator
Health care costs
savings
Health care cost
expenditure of increased
life years
Monetised DALYs
Production savings (human capital)
Production savings (friction costs)
Total crime1 Astell-Burt & Feng (2015)
Participation in MVPA.
High crime compared to zero.
$948
($302 – $1691)
-$875
(-$1472 – -$280)
$31,297
($10,070 – $52,714)
$725
($231 – $1227)
$25
($8 – $43)
Total crime2 Astell-Burt & Feng (2015)
Participation in MVPA.
High crime compared to low.
$269
($87 – $491)
-$248
(-$417 – -$82)
$8868
($2936 – $14,924)
$205
($68 – $348)
$7
($2 – $12)
1. Sum of non-domestic violent assaults, break and enter, malicious damage to a property and stealing, theft and robbery at the CCD level. 2. Same as one but at the Statistical Local Area level.
60 RAPID REVIEW
References
1. Amarasinghe AK. Cost-effectiveness implications of GP intervention to promote physical activity: evidence from Perth, Australia. Cost Eff Resour Alloc. May 2010;8:10. doi: 10.1186/1478–7547-8–10.
2. Beavis MJ, Moodie M. Incidental physical activity in Melbourne, Australia: health and economic impacts of mode of transport and suburban location. Health Promot Austr. 2014;25(3):174–81. doi: 10.1071/HE14057.
3. Cadilhac DA, Cumming TB, Sheppard L, Pearce DC, Carter R, Magnus A. The economic benefits of reducing physical inactivity: an Australian example. Int J Behav Nutr Phys Act. 2011;8:99. doi: 10.1186/1479–5868–8–99.
4. Cobiac LJ, Vos T, Barendregt JJ. Cost-effectiveness of interventions to promote physical activity: a modelling study. Plos Med. 2009;6(7):e1000110-e. doi: 10.1371/journal.pmed.1000110.
5. Moodie M, Haby M, Galvin L, Swinburn B, Carter R. Cost-effectiveness of active transport for primary school children – walking school bus program. Int J Behav Nutr Phys Act. 2009;6:63. doi: 10.1186/1479–5868–6–63.
6. Moodie M, Haby MM, Swinburn B, Carter R. Assessing cost-effectiveness in obesity: active transport program for primary school children – travelSMART schools curriculum program. J Phys Act Health. 2011;8(4):503–15.
7. Peeters G, Mishra GD, Dobson AJ, Brown WJ. Health care costs associated with prolonged sitting and inactivity. Am J Prev Med. 2014;46(3):265–72. doi: 10.1016/j.amepre.2013.11.014.
8. Zheng H, Ehrlich F, Amin J. Economic evaluation of the direct healthcare cost savings resulting from the use of walking interventions to prevent coronary heart disease in Australia. Int JOf Health Care Finance And Econ. 2010;10(2):187–201. doi: 10.1007/s10754-009-9074-2.
9. AECOM. Inner Sydney regional bicycle network – demand assessment and economic appraisal. Sydney: City of Sydney, 2010.
10. Fishman E, Ker I, Garrard J, Litman T, Rissel C. Cost and Health Benefit of Active Transport in Queensland Stage 2 Report. Prepared by CATALYST for Health Promotion Queensland; 2011. Available from: www.sensibletransport.org.au/sites/sensibletransport.org.au/files/QLD%20Health%20Stage%202-%20HR_V4.pdf.
11. Gunn LD, Lee Y, Geelhoed E, Shiell A, Giles-Corti B. The cost-effectiveness of installing sidewalks to increase levels of transport-walking and health. Prev Med. 2014;67:322–9. doi: 10.1016/j.ypmed.2014.07.041.
12. Ker I. Overcoming the inferiority complex: demonstrating the value of active transport. VeloCity Global Conference; 27-30 May 2014; Adelaide, South Australia.
13. Mulley C, Tyson R, McCue P, Rissel C, Munro C. Valuing active travel: Including the health benefits of sustainable transport in transportation appraisal frameworks. Research in Transportation Business & Management. 2013;7:27–34. doi: 10.1016/j.rtbm.2013.01.001.
14. PricewaterhouseCoopers. Evaluation of the costs and benefits to the community of financial investment in cycling programs and projects in New South Wales – Final Report. Roads and Traffic Authority of NSW and the Department of Environment and Climate Change, 2009.
15. PricewaterhouseCoopers. Estimating the benefits of walking, a cost benefit methodology. Australia. Pricewaterhouse Coopers, 2010.
16. Sinclair Knight and PricewaterhouseCoopers. Benefits of the inclusion of active transport in infrastructure projects. Queensland, Australia: Transport and Main Roads, 2011.
17. Transport for NSW. Principles and Guidelines for Economic Appraisal of Transport Investment and Initiatives Sydney: Transport for NSW; 2013 [3 March 2015]. Available from: www.transport.nsw.gov.au/sites/default/files/b2b/publications/tfnsw-principles-and-guidelines-for-economic-appraisal-of-transport-initiatives.pdf.
18. Astell-Burt T, Feng X, Kolt GS. Green space is associated with walking and moderate-to-vigorous physical activity (MVPA) in middle-to-older-aged adults: findings from 203,883 Australians in the 45 and up study. Br J Sports Med. Mar 2014;48(5):404–6. doi: 10.1136/bjsports-2012–092006.
19. Astell-Burt T, Feng X, Kolt GS. Identification of the impact of crime on physical activity depends upon neighbourhood scale: multilevel evidence from 203,883 Australians. Health Place. Jan 2015;31:120–3. doi: 10.1016/j.healthplace.2014.11.007.
20. Christian HE, Bull FC, Middleton NJ, Knuiman MW, Divitini ML, Hooper P, et al. How important is the land use mix measure in understanding walking behaviour? Results from the RESIDE study. Int J Behav Nutr Phys Act. 2011;8:55. doi: 10.1186/1479-5868–8–55.
21. Cleland VJ, Ball K, Crawford D. Is a perceived supportive physical environment important for self-reported leisure time physical activity among socioeconomically disadvantaged women with poor psychosocial characteristics? An observational study. BMC Public Health. Mar 2013;13:280. doi: 10.1186/1471–2458–13–280.
22. D’Haese S, Timperio A, Veitch J, Cardon G, Van Dyck D, Salmon J. Neighborhood perceptions moderate the association between the family environment and children’s objectively assessed physical activity. Health Place. 2013;24:203–9. doi: 10.1016/j.healthplace.2013.09.012.
23. Duncan MJ, Winkler E, Sugiyama T, Cerin E, duToit L, Leslie E, et al. Relationships of land use mix with walking for transport: do land uses and geographical scale matter? J Urban Health. Sep 2010;87(5):782–95. doi: 10.1007/s11524–010–9488–7.
THE EFFECTS OF URBAN FORM ON HEALTH: COSTS AND BENEFITS 61
24. Edwards NJ, Giles-Corti B, Larson A, Beesley B. The effect of proximity on park and beach use and physical activity among rural adolescents. J Phys Act Health. 2014;11(5):977–84. doi: 10.1123/jpah.2011–0332.
25. Foster S, Knuiman M, Villanueva K, Wood L, Christian H, Giles-Corti B. Does walkable neighbourhood design influence the association between objective crime and walking? Int J Behav Nutr Phys Act. 2014;11(1):100.
26. Giles-Corti B, Bull F, Knuiman M, McCormack G, Van Niel K, Timperio A, et al. The influence of urban design on neighbourhood walking following residential relocation: longitudinal results from the RESIDE study. Soc Sci Med. 2013;77:20–30. doi: 10.1016/j.socscimed.2012.10.016.
27.Giles-Corti B, Wood G, Pikora T, Learnihan V, Bulsara M, Van Niel K, et al. School site and the potential to walk to school: the impact of street connectivity and traffic exposure in school neighborhoods. Health Place. 2011;17(2):545–50. doi: 10.1016/j.healthplace.2010.12.011.
28. Heesch KC, Giles-Corti B, Turrell G. Cycling for transport and recreation: associations with socio-economic position, environmental perceptions, and psychological disposition. Prev Med. 2014;63:29–35. doi: 10.1016/j.ypmed.2014.03.003.
29. Knuiman MW, Christian HE, Divitini ML, Foster SA, Bull FC, Badland HM, et al. A longitudinal analysis of the influence of the neighborhood built environment on walking for transportation: the RESIDE study. Am J Epidemiol. 2014;180(5):453–61. doi: 10.1093/aje/kwu171.
30. Koohsari MJ, Kaczynski AT, Giles-Corti B, Karakiewicz JA. Effects of access to public open spaces on walking: Is proximity enough? Landscape Urban Plan. 2013;117:92–9. doi: 10.1016/j.landurbplan.2013.04.020.
31. Koohsari MJ, Karakiewicz JA, Kaczynski AT. Public open space and walking: the role of proximity, perceptual qualities of the surrounding built environment, and street configuration. Environ Behav. 2013;45(6):706–36. doi: 10.1177/0013916512440876.
32. Koohsari MJ, Sugiyama T, Lamb KE, Villanueva K, Owen N. Street connectivity and walking for transport: role of neighborhood destinations. Prev Med. 2014;66:118–22. doi: 10.1016/j.ypmed.2014.06.019.
33. Learnihan V, Van Niel KP, Giles-Corti B, Knuiman M. Effect of scale on the links between walking and urban design. Geographical Research. 2011;49(2):183–91. doi: 10.1111/j.1745-5871.2011.00689.x.
34. Leslie E, Cerin E, Kremer P. Perceived neighborhood environment and park use as mediators of the effect of area socio-economic status on walking behaviors. J Phys Act Health. 2010;7(6):802–10.
35. McCormack GR, Shiell A, Giles-Corti B, Begg S, Veerman JL, Geelhoed E, et al. The association between sidewalk length and walking for different purposes in established neighborhoods. Int J Behav Nutr Phys Act. 2012;9. doi: 10.1186/1479-5868-9-92.
36. McKibbin M. The influence of the built environment on mode choice: Evidence from the journey to work in Sydney. Australasian Transport Research Forum 2011. 34th Australasian Transport Research Forum; 2014.
37. Owen N, De Bourdeaudhuij I, Sugiyama T, Leslie E, Cerin E, Van Van Dyck D, et al. Bicycle use for transport in an Australian and a Belgian city: associations with built-environment attributes. J Urban Health. Mar 2010;87(2):189–98. doi: 10.1007/s11524-009-9424-x.
38. Pont K, Wadley D, Ziviani J, Khan A. The Influence of Urban Form and Family Decision Making on Children’s Travel to School. Journal of Urban Design. 2013;18(3):363–82. doi: 10.1080/13574809.2013.800452.
39. Prins RRG, Ball K, Timperio A, Salmon J, Oenema A, Brug J, et al. Associations between availability of facilities within three different neighbourhood buffer sizes and objectively assessed physical activity in adolescents. Health Place. 2011;17(6):1228–34. doi: 10.1016/j.healthplace.2011.07.012.
40. Shimura H, Sugiyama T, Winkler E, Owen N. High neighborhood walkability mitigates declines in middle-to-older aged adults’ walking for transport. J Phys Act Health. Sep 2012;9(7):1004–08.
41. Sugiyama T, Cerin E, Owen N, Oyeyemi AL, Conway TL, Van Dyck D, et al. Perceived neighbourhood environmental attributes associated with adults[U+05F3] recreational walking: IPEN Adult study in 12 countries. Health Place. 2014;28:22–30. doi: 10.1016/j.healthplace.2014.03.003.
42. Sugiyama T, Giles-Corti B, Summers J, du Toit L, Leslie E, Owen N. Initiating and maintaining recreational walking: a longitudinal study on the influence of neighborhood green space. Prev Med. 2013;57(3):178–82. doi: 10.1016/j.ypmed.2013.05.015.
43. Sugiyama T, Leslie E, Giles-Corti B, Owen N. Physical activity for recreation or exercise on neighbourhood streets: associations with perceived environmental attributes. Health Place. 2009;15(4):1058–63. doi: 10.1016/j.healthplace.2009.05.001.
44. Trapp GSA, Giles-Corti B, Christian HE, Bulsara M, Timperio AF, McCormack GR, et al. On your bike! a cross-sectional study of the individual, social and environmental correlates of cycling to school. Int J Behav Nutr Phy Act. 2011;8(1):123. doi: 10.1186/1479-5868-8-123.
45. Trapp GSA, Giles-Corti B, Christian HE, Bulsara M, Timperio AF, McCormack GR, et al. Increasing Children’s Physical Activity: Individual, Social, and Environmental Factors Associated With Walking to and From School. Health Educ Behav. Apr 2012;39(2):172–82. doi: 10.1177/1090198111423272.
46. Villanueva K, Knuiman M, Nathan A, Giles-Corti B, Christian H, Foster S, et al. The impact of neighborhood walkability on walking: does it differ across adult life stage and does neighborhood buffer size matter? Health Place. 2014;25:43–6. doi: 10.1016/j.healthplace.2013.10.005.
62 RAPID REVIEW
47. Wilson L-AM, Giles-Corti B, Burton NW, Giskes K, Haynes M, Turrell G. The association between objectively measured neighborhood features and walking in middle-aged adults. Am J Health Promot. 2011;25(4):e12-e21.
48. Christian H, Bull F, Middleton NJ, Knuiman MW, Divitini ML, Hooper P, et al. How important is the land use mix measure in understanding walking behaviour? Results from the RESIDE study. Int J Behav Nutr Phys Act. 2011;8:55. doi: 10.1186/1479-5868-8-55.
49. Giles-Corti B, Bull F, Knuiman MW, McCormack GR, Van Niel K, Timperio A, et al. The influence of urban design on neighbourhood walking following residential relocation: longitudinal results from the RESIDE study. Soc Sci Med. Jan 2013;77:20–30. doi: 10.1016/j.socscimed.2012.10.016.
50. Wilson LAM, Giles-Corti B, Burton NW, Giskes K, Haynes M, Turrell G. The association between objectively measured neighborhood features and walking in middle-aged adults. Am J Health Promot. Mar-Apr 2011;25(4):e12-e21.

www.preventioncentre.org.au