Embed Size (px)
Citation preview
DIPLOMARBEIT
Titel der Diplomarbeit
„A Rasch Analysis of the AID English for a European
Population“
Verfasst von
Caren Wiedekind
angestrebter akademischer Grad
Magistra der Naturwissenschaften (Mag. rer. nat.)
Wien, 2015
Studienkennzahl lt. Studienblatt: A 298
Studienrichtung lt. Studienblatt: Psychologie
Betreuerin / Betreuer: Univ.-Prof. i. R. Mag. Dr. Klaus Kubinger


1
Acknowledgements
First and foremost, I would like to thank my supervisor, Univ. Prof. Dr.
Mag. Klaus D. Kubinger, who suggested the topic for this thesis and allowed me
to be a part of this scientific project.
I would also like to thank my excellent test administers, Katarina Virtue, Miriam
Matysik, Melanie Eichorn and all the others for their help and support
throughout the testing and data input process.
Thank you to Ann-Kathrin Schock for supplying me with all the materials and to
Larissa Bartok for her patience and constant support in the Rasch model
analysis.
Thank you also to the Schools, who so kindly let me test their students and
organized everything so well. Here, a special thank you to Mary Hightower, from
Vienna International School, who provided the majority of participants for this
study, for her interest and positive attitude.
Of course, a big thank you goes to all the children, who so enthusiastically took
part in the testing, and their parents, who with their consent made this study
possible.
Another thank you goes to Katarina Virtue again; Jan-Phillip Schulz and Kristin
Mednick for investing their time proof reading this thesis.
Finally I would like to thank my parents for their emotional and financial support
throughout my studies. Also I would like to thank my siblings, the rest of my
family, my friends and especially my boyfriend, who all provided me with advice
and positive energy and who have been such a great support to me during the
past 5 years. I could not have done it without you!

2
3
Abstract
Today’s increasingly international society has created a growing need for
psychological assessment techniques that take the cultural aspect into
consideration. The intelligence test battery AID 3 ("Adaptive Intelligence
Diagnosticum", Version 3, Kubinger & Holocher-Ertl, 2014) has been translated
and adopted from the German into an English version (AID English) and this
study examines whether the AID English is suitable to asses cognitive abilities
of English educated children between six and fifteen years old living in a
European context outside of Great-Britain. 202 not necessarily English native
speaking children (111 girls and 91 boys), aged between 6 and 16, were tested
individually in Austria and Germany. A Rasch model analysis, using the
Andersen's likelihood ratio test and graphical model check with the three
partition criteria score (low vs. high score), sex (male vs. female) and language
(English native vs. non-English native) was carried out to establish whether the
items of the AID English guarantee fair scoring between these subgroups. One
of the subtests had to be analyzed with a partial credit model due to its
polytomous response model. As a result of the small sample size, a number of
ill-conditioned items had to be unconsidered and in two of the seventeen
subtests some non Rasch model conform items had to be deleted in order to
achieve model conformity. Excluded and deleted items were qualitatively
investigated and should be revised for future prospects. This psychometric
analysis of the AID English for an English educated European population
showed promising results in regard to the future use of this valuable instrument.
4
Contents
Acknowledgements ..........................................................................................1
Abstract .............................................................................................................3
Contents ............................................................................................................4
Tables .................................................................................................................6
Figures ...............................................................................................................7
Formula ............................................................................................................10
I. Introduction ..................................................................................................11
II. Theoretical Section .....................................................................................13
1. Intelligence Theories and Intelligence Testing ..............................13
2. Intelligence and Culture - Cross-cultural Assessment .................15
3. Item-Response-Theory and the Rasch model ...............................18
4. AID - Adaptive Intelligence Diagnosticum .....................................21
4.1 AID 3 / AID English subtests ..................................................23
4.2 Quality Criteria .......................................................................31
III. Empirical Section .......................................................................................33
5. Purpose of the Study .......................................................................33
6. Method ...............................................................................................33
6.1 Design of the Study ...............................................................33
6.2 Instruments ............................................................................35
6.3 Procedure ..............................................................................35
6.4 Participants ............................................................................35
7. Results ..............................................................................................38
7.1 Subtest 1: Everyday Knowledge ............................................40
7.2 Subtest 2: Competence in Realism .......................................43
5
7.3 Subtest 3: Applied Computing ...............................................46
7.4 Subtest 4: Social and Material Sequencing ...........................48
7.5 Subtest 5: Immediately Reproducing numerical ....................51
7.6 Subtest 6: Producing Synonyms ............................................52
7.7 Subtest 7: Coding and Associating ........................................55
7.8 Subtest 8: Anticipating and Combining - figural .....................56
7.9 Subtest 9: Verbal Abstraction ................................................59
7.10 Subtest 10: Analyzing and Synthesizing - abstract ..............62
7.11 Subtest 11: Social Understanding and Material Reflection...64
7.12 Subtest 12: Formal Sequencing ..........................................68
7.13 Subtest 5a: Immediately Reproducing - figural/abstract ......71
7.14 Subtest 5b: Memorizing by Repetition - lexical ....................73
7.15 Subtest 5c: Learning and Long-term Memory - figural/
spatial ..........................................................................................75
7.16 Subtest 6a: Antonyms ..........................................................78
7.17 Subtest 10a: Recognition of figural Structures ....................81
8. Interpretation ....................................................................................85
9. Discussion ........................................................................................93
10. Summary .........................................................................................94
11. Bibliography ...................................................................................96
12. Appendix .......................................................................................101
A. Abstract German ...................................................................101
B. School and Parent Information letters ...................................103
C. Beta parameter / Item Easiness Parameters ........................106
CV ...................................................................................................................119
6
Tables
Table 1: Test administrators .............................................................................34
Table 2: Distribution of participants with regard to Age and Sex ......................36
Table 3: Distribution of participants with regard to Mother tongue ...................38
Table 4: Results of LRT for subtest 1 Everyday Knowledge ............................41
Table 5: Results of LRT for subtest 2 Competence in Realism.........................43
Table 6: Results of LRT for subtest 3 Applied Computing ...............................46
Table 7: Results of LRT for subtest 4 Social and Material Sequencing ...........49
Table 8: Results subtest 5 score frequencies ..................................................51
Table 9: Results subtest 5 Mean, Standard Deviation, Minimum, Maximum, N .......................................................................................................................52
Table 10: Results of LRT for subtest 6 Producing Synonyms ..........................53
Table 11: Results subtest 7 Mean, Standard Deviation, Minimum, Maximum,
N .......................................................................................................................56
Table 12: Results of LRT for subtest 8 Anticipating and Combining - figural ...57
Table 13: Results of LRT for subtest 9 Verbal Abstraction ..............................59
Table 14: Results of LRT for subtest 10 Analyzing and Synthesizing -
abstract .............................................................................................................62
Table 15: Results of LRT for subtest 11 Social Understanding and Material
Reflection ..........................................................................................................64
Table 16: Results 2 of LRT for subtest 11 Social Understanding and Material
Reflection without excluded items i13 and i26 ..................................................66
Table 17: Results of LRT for subtest 12 Formal Sequencing ...........................68
Table 18: Results of LRT for additional subtest 5a Immediately reproducing - figural/abstract ..................................................................................................71
Table 19: Results of LRT for additional subtest 6a Antonyms ..........................73
Table 20: Results of Subtest 5c, panel 1, Mean, Standard Deviation, Minimum,
Maximum, N ......................................................................................................76
Table 21: Results of Subtest 5c, panel 2, Mean, Standard Deviation, Minimum,
Maximum, N ......................................................................................................77
Table 22: Results of Subtest 5c, panel 3, Mean, Standard Deviation, Minimum,
Maximum, N ......................................................................................................78
Table 23: Results of LRT for additional subtest 6a Antonyms ..........................79
Table 24: Results 1 of LRT for subtest 10a Recognition of figural Structures ..81
Table 25: Results 2 of LRT for subtest 10a Recognition of figural Structures
without excluded item i1 ....................................................................................83
7
Figures
Figure 1: Distribution of participants with regard to Age and Sex ....................36
Figure 2: Participating Schools ........................................................................37
Figure 3: Graphical model check for subtest 1 with partition criterion
"score"................................................................................................................42
Figure 4: Graphical model check for subtest 1, item i71Z with partition criterion
"score" and confidence ellipse ..........................................................................42
Figure 5: Graphical model check for subtest 1 with partition criterion "sex" ....42
Figure 6: Graphical model check for subtest 1, item i18 with partition criterion
"sex" and confidence ellipse .............................................................................42
Figure 7: Graphical model check for subtest 1 with partition criterion
"language"..........................................................................................................43
Figure 8: Graphical model check for subtest 1, item i65 with partition criterion
"language" and confidence ellipse ....................................................................43
Figure 9: Graphical model check for subtest 2 with partition criterion
"score"................................................................................................................44
Figure 10: Graphical model check for subtest 2, item i16 with partition criterion
"score" and confidence ellipse ..........................................................................44
Figure 11: Graphical model check for subtest 2 with partition criterion
"sex" ..................................................................................................................45
Figure 12: Graphical model check for subtest 2, items i4, i16, i17 and i18 with
partition criterion "sex" and confidence ellipses ................................................45
Figure 13: Graphical model check for subtest 2 with partition criterion
"language"..........................................................................................................45
Figure 14: Graphical model check for subtest 2, items i15 and i18 with partition
criterion "language" and confidence ellipses ....................................................45
Figure 15: Graphical model check for subtest 3 with partition criterion
"score"................................................................................................................47
Figure 16: Graphical model check for subtest 3, item i68z with partition criterion
"score" and confidence ellipse ..........................................................................47
Figure 17: Graphical model check for subtest 3 with partition criterion
"sex" ..................................................................................................................47
Figure 18: Graphical model check for subtest 3, item i54 with partition criterion
"sex" and confidence ellipses ...........................................................................47
Figure 19: Graphical model check for subtest 3 with partition criterion
"language"..........................................................................................................48
Figure 20: Graphical model check for subtest 3, item i36 with partition criterion
"language" and confidence ellipses ..................................................................48
8
Figure 21: Graphical model check for subtest 4 with partition criterion "score of
subtest 2" ..........................................................................................................49
Figure 22: Graphical model check for subtest 4 with partition criterion
"sex"...................................................................................................................50
Figure 23: Graphical model check for subtest 4, items i12 and i16 with partition
criterion "sex" and confidence ellipses ..............................................................50
Figure 24: Graphical model check for subtest 4 with partition criterion
"language"..........................................................................................................50
Figure 25: Graphical model check for subtest 6 with partition criterion
"score" ...............................................................................................................54
Figure 26: Graphical model check for subtest 6 with partition criterion
"sex" ..................................................................................................................54
Figure 27: Graphical model check for subtest 6 with partition criterion
"language"..........................................................................................................55
Figure 28: Graphical model check for subtest 6, items i27 and i67z with
partition criterion "language" and confidence ellipses .......................................55
Figure 29: Graphical model check for subtest 8 with partition criterion
"score" ...............................................................................................................57
Figure 30: Graphical model check for subtest 8, items i6c1 and i9c1 with
partition criterion "score" and confidence ellipse ..............................................57
Figure 31: Graphical model check for subtest 8 with partition criterion
"sex" ..................................................................................................................58
Figure 32: Graphical model check for subtest 8, item i10c1 with partition
criterion "sex" and confidence ellipse ...............................................................58
Figure 33: Graphical model check for subtest 8 with partition criterion
"language"..........................................................................................................58
Figure 34: Graphical model check for subtest 9 with partition criterion
"score"................................................................................................................60
Figure 35: Graphical model check for subtest 9, item i16 with partition criterion
"score" and confidence ellipse ..........................................................................60
Figure 36: Graphical model check for subtest 9 with partition criterion
"sex" ..................................................................................................................61
Figure 37: Graphical model check for subtest 9, items i41 and i62 with partition
criterion "sex" and confidence ellipses ..............................................................61
Figure 38: Graphical model check for subtest 9 with partition criterion
"language"..........................................................................................................61
Figure 39: Graphical model check for subtest 9, items i23, i34, i67z and i68z
with partition criterion "language" and confidence ellipses ...............................61
Figure 40: Graphical model check for subtest 10 with partition criterion "score
of subtest 2" ......................................................................................................63
9
Figure 41: Graphical model check for subtest 10 with partition criterion
"sex"...................................................................................................................63
Figure 42: Graphical model check for subtest 10, item i10 with partition criterion
"sex" and confidence ellipses ...........................................................................63
Figure 43: Graphical model check for subtest 10 with partition criterion
"language"..........................................................................................................64
Figure 44: Graphical model check for subtest 11 with partition criterion
"score"................................................................................................................65
Figure 45: Graphical model check for subtest 11, deviant items i13, i26, i34,
i59, i65z, i67z and i69z with partition criterion "score" and confidence ellipses...............................................................................................................65
Figure 46: Graphical model check for subtest 11 without item i26 with partition criterion "score" .................................................................................................67
Figure 47: Graphical model check for subtest 11 without item i26, items i67z and i69z with partition criterion "score" and confidence ellipse ........................67
Figure 48: Graphical model check for subtest 11 without item i26 with partition criterion "sex" ....................................................................................................67
Figure 49: Graphical model check for subtest 11 without item i26, item i72z with partition criterion "sex" and confidence ellipses ................................................67
Figure 50: Graphical model check for subtest 11 without item i26 with partition criterion "language" ...........................................................................................68
Figure 51: Graphical model check for subtest 11 without item i26, items i15, i50 and i73 with partition criterion "language" and confidence ellipses ..................68
Figure 52: Graphical model check for subtest 12 with partition criterion "score"................................................................................................................69
Figure 53: Graphical model check for subtest 12, items i18, i19, i23, i51, i64 with partition criterion "score" and confidence ellipses .....................................69
Figure 54: Graphical model check for subtest 12 with partition criterion "sex"...................................................................................................................70
Figure 55: Graphical model check for subtest 12, item i23 with partition criterion "sex" and confidence ellipses ...........................................................................70
Figure 56: Graphical model check for subtest 12 with partition criterion "language"..........................................................................................................70
Figure 57: Graphical model check for subtest 5a with partition criterion "score"................................................................................................................72
Figure 58: Graphical model check for subtest 5a, item i4 with partition criterion "score" and confidence ellipses ........................................................................72
Figure 59: Graphical model check for subtest 5a with partition criterion "sex"...................................................................................................................72
Figure 60: Graphical model check for subtest 5a with partition criterion "language"..........................................................................................................73
10
Figure 61: Graphical model check for subtest 5b with partition criterion
"score"................................................................................................................74
Figure 62: Graphical model check for subtest 5b with partition criterion
"sex"...................................................................................................................74
Figure 63: Graphical model check for subtest 5b with partition criterion
"language"..........................................................................................................75
Figure 64: Graphical model check for subtest 6a with partition criterion
"score"................................................................................................................80
Figure 65: Graphical model check for subtest 6a, items i27, i55, i59 and i79
with partition criterion "score" and confidence ellipses .....................................80
Figure 66: Graphical model check for subtest 6a with partition criterion
"sex"...................................................................................................................80
Figure 67: Graphical model check for subtest 6a, item i47 with partition criterion
"sex" and confidence ellipse .............................................................................80
Figure 68: Graphical model check for subtest 6a with partition criterion
"language"..........................................................................................................81
Figure 69: Graphical model check for subtest 6a, item i14 with partition criterion
"language" and confidence ellipse ....................................................................81
Figure 70: Graphical model check for subtest 10a with partition criterion
"score"................................................................................................................82
Figure 71: Graphical model check for subtest 10a, deviant items i1, i3 and i9
with partition criterion "score" and confidence ellipses .....................................82
Figure 72: Graphical model check for subtest 10a without item i1 with partition
criterion "score" .................................................................................................84
Figure 73: Graphical model check for subtest 10a without item i1 with partition
criterion "sex" ....................................................................................................84
Figure 74: Graphical model check for subtest 10a without item i1 with partition
criterion "language" ...........................................................................................85
Formula
Formula 1: dichotomous logistical test model or Rasch model (from Kubinger,
2005) .................................................................................................................20

11
I. Introduction
Due to increasing globalization, our society is internationally connected in
many different areas and different ways. Especially European countries
promote these transboundary relations through school exchange programs,
university exchange programs such as Erasmus and an open labor market, in
order to simplify migration not just within Europe, but worldwide. This leads to a
culturally and linguistically diverse population and thus to a growing interest in
cross-cultural assessment.
PISA (Program for International Student Assessment) is a large-scale cross-
national study that "assesses the extent to which 15-year-old students have
acquired key knowledge and skills that are essential for full participation in
modern societies." (OECD, 2014, p.3). In the year of 2012, 65 nations
participated. As the OECD mentions, PISA results can be used by policy
makers to improve their own education system by learning from practices in
other countries. In order to be able to compare PISA results from different
countries, one has to make sure that the tests measure the same competencies
in all cultures (Kankaraš & Moors, 2014). Cultural fairness is one of the many
challenges that arise when transferring a psychological instrument from one
country to another. An intelligence test cannot simply be translated, but must be
adapted to the cultural surroundings it is going to be used in.
However, it is not just the interest of the psychological community in cross-
national assessment that leads to more research in this field, but the need for
psychometric assessment methods that meet the requirements of an
international society. Many of the world's developed countries have become
diverse and multiethnic societies for safety, labor related, financial and many
other reasons (Massey et al., 1993, Stalker 2000). This blend of immigrated and
native inhabitants brings new challenges to many areas of everyday life. On
account of the fact that culture and intelligence are imminently connected
(Sternberg, 2004), this multicultural and multilingual society seeks new
psychological assessments that take the cultural bias into consideration: "Tests
must be modified if they are to measure the same basic processes as they
apply from one culture to another."
12
Many students undergo psychological assessments and especially intelligence
testing during their schooling for a variety of reasons. Teachers may suspect
learning difficulties or parents might not be sure about their child's future
educational route. Depending on the results of such intelligence tests, life
changing decisions are made. Especially children with a migratory background
might be disadvantaged due to their minor knowledge of the instrument's
language or due to their lack of knowledge about specific "culturally loaded"
aspects of the items. Therefore their results may not adequately represent their
actual performance. Yet it is very likely that the future educational surroundings
of this child are culturally and linguistically loaded as well; simply leaving out
these items won't help to solve the problem (Te Nijenhuis & van der Flier,
2003).
Since most of the intelligence tests for children nowadays are developed in the
United States, an instrument that addresses multicultural children regarding
their European cultural environment there should be constructed.
This thesis aims to examine whether the english adaption of the AID 3
("Adaptive Intelligence Diagnosticum", Version 3, Kubinger & Holocher-Ertl,
2014) can serve as such a European English language intelligence test battery
for children and adolescents. Following the study of Lampe (2008), a culturally
diverse group of both native and non-native English speaking children living in a
European context and attending international schools in Austria and Germany
were assessed in order to find out if the AID English guarantees fair scoring and
is unbiased towards non-native speakers.
The theoretical part of this thesis will deal with intelligence theories, intelligence
testing in general and cultural aspects of such psychological assessment. As
mentioned previously, culture plays an important role when it comes to
intelligence, therefore cross-cultural assessment will be addressed as well.
Since the Rasch model was applied in the empirical analysis of the collected
data, there will be a brief overview of the main aspects of the Items-Response-
Theory. Finally, the AID English as well as its subtests will be described and
discussed.
13
In the empirical part of this thesis, the conducting of the study will be explained,
addressing participants, materials and procedures, followed by the description
and discussion of results and the data analysis. In conclusion, the initial
objective of the study will be reviewed, taking future prospects into
consideration.
II Theoretical Section
1. Intelligence Theories and Intelligence Testing
What is intelligence and how can we measure it? The term intelligence
has been used by many different scientists, philosophers and psychologists in
many different ways (Sternberg, 1982, p.3), which demonstrates the complexity
of this concept.
More than 100 years ago, Francis Galton was one of the first scientists to
introduce the term psychological assessment by measuring a broad range of
psychophysical skills like weight discrimination and sensitivities (Sternberg,
2009, p.532). Several years later, at the beginning of the 19th century, Alfred
Binet and Theodore Simon gave first impulses towards psychological
assessment of intelligence how we know it today as they were asked to develop
"a procedure for distinguishing normal learners from learners who are mentally
retarded" (as cited in Sternberg, 2009, p.532). For this reason, they developed
one of the first intelligence tests in Europe and introduced the term mental age -
"the average level of intelligence for a person of a given age" (Sternberg, 2009,
p.532). Thus they set out to measure intelligence as the ability to learn within an
academic setting, using different school related tasks as items for each age
group. With regard to this, in 1912 William Stern suggested to use the ratio of
mental age divided by chronological age in order to be able to compare the
relative intelligence in children (as cited in Sternberg, 2009, p.532). Based on
their intelligence test, Lewis Terman, from Stanford University constructed the
earliest version of the Stanford-Binet Intelligence Scale, which was in turn the
foundation of one of the most used intelligence scales nowadays: the Wechsler
14
intelligence scale by David Wechsler. In 1939 he published his first intelligence
test with 11 subtests, called Wechsler/Bellevue Intelligence Scale (see
Saklofske, Weiss, Beal, & Coalson, 2003). All Wechsler tests like the Wechsler
Adult Intelligence Scale (WAIS-IV) or the Wechsler Intelligence Scale for
Children (WISC-IV) yield three scores: a verbal score, a performance score and
an overall score (Sternberg, 2009). These test-batteries have been translated
into many languages and used in many research studies.
On account of the early development of intelligence tests, a more operational
definition of intelligence became established: Intelligence is what intelligence
tests measure (Boring, 1923). Obviously this is a tautology rather than a
scientifically sufficient definition and Wechsler stated, "What intelligence tests
measure, what we hope they measure, is something much more important: the
capacity of an individual to understand the world about him and his
resourcefulness to cope with its challenges." (Wechsler, 1975). He defined
intelligence as a global intellectual capacity and specific abilities, and that "...
intelligence is not the mere sum of these abilities" (as cited in Georgas, 2003).
Over the past 100 years, there have been a variety of definitions and models for
the concept of intelligence. A short description of some of the most important
theories will be given.
Charles Spearman is credited with inventing factor analysis (as cited in
Sternberg, 2009, p.532). Based on his studies (1904), he concluded that
intelligence can be understood in terms of two kinds of factors: a single general
factor and a set of specific factors, which is involved in performance on only a
single type of mental-ability test, such as arithmetic computation for example
(Sternberg, 2009). Using factor analysis as well, Louis Thurstone (1938) came
to the conclusion that intelligence resides not in one single factor, but seven
such factors: so called primary mental abilities (e.g., verbal comprehension,
verbal fluency etc.). Raymond B. Cattell and John L. Horn on the other hand
proposed that general intelligence comprises two major subfactors: fluid ability
and crystallized ability. Fluid intelligence "is an expression of the level of
complexity of relationships which an individual can perceive an act upon when
he does not have recourse to answers to such complex issues already stored in
15
memory" (Cattell, 1987). Crystallized ability is accumulated knowledge and
vocabulary.
According to Sternberg (2009) and his triarchic theory of human intelligence,
intelligence comprises three aspects, dealing with the relation of intelligence (1)
to the internal world of the person, (2) to experience and (3) to the external
world. The internal part of the theory emphasizes the processing of information,
which consists of different components: metacomponents, performance
components and knowledge-acquisition components. According to the theory,
our experience interacts with all three kinds of information-processing. The
various components of intelligence are therefore applied to experience to serve
three functions in real world contexts: firstly, adapting ourselves to our existing
environment, secondly shaping our existing environment to create new
environments and thirdly selecting new environments. Thus our environment
plays a huge part in when, where and how cognitive processes are used.
2. Intelligence and Culture - Cross-Cultural Assessment
There have been many definitions of culture. Barnouw (as cited in
Sternberg, 2009) defines culture as "the set of attitudes, values, beliefs and
behaviors shared by a group of people, communicated from one generation to
the next via language or some other means of communication.".
According to Greenfeld (1997), the term culture implies sharing or agreement,
that is, social convention. In symbolic culture, what is shared are values,
knowledge and communication.
Georgas (2003) defines cross-cultural psychology as the study of the
relationship between culture and psychological variables, focusing on two
aspects: the degree to which there is communality of psychological processes
across cultures and the degree to which there are variations in psychological
processes due to specific cultural influences
Contextualists consider intelligence to be inextricably linked to culture
(Sternberg, 2009). Greenfield (1997) states that the cultural context in which
learning and thinking happens is very unique to every culture. Cognitive
16
performance is tied to specific features of the cultural context and to the
symbols and meanings of it. Yet according to Sternberg (2004), some things
like mental representations and processes are constant across cultures,
whereas others, like the content to which they are applied to, are not. In other
words a certain universality of aptitudes that are not shaped by culture can be
assumed, the manifestation of these aptitudes is influenced by the cultural
context (Georgas, 2003). Helms-Lorenz et al. (2003) have argued in their study
that measured differences in intellectual performance may result from
differences in cultural complexity of the instrument, also called cultural load.
According to Van de Vijver and Poortinga (as cited in Helms-Lorenz, Van de
Vijver and Poortinga, 2003), cultural load are the "implicit or explicit references
of the instrument or the test target to a specific cultural context, mostly the
culture of the test author". Cultural and linguistic influences should always be
taken into account when interpreting results. Van de Vijver and Poortinga (as
cited in Helms-Lorenz, Van de Vijver and Poortinga, 2003) differentiate between
5 potential sources for cultural loading of a test instrument:
a) the tester
b) the testees
c) the tester-testee interaction
d) the response procedure
e) the cultural loadings of the stimuli
In order to compare people across national or cultural borders in terms of cross-
cultural research, so called culture free or fair instruments are required.
In her studies, Rovainen (2010, 2013) investigated cross-national differences in
performance subtest scores and compared Finnish WAIS norms with norms of
the USA from different years to find out if cross-national differences in IQ
profiles are stable. She stated that the comparison of linguistic abilities of two
different nations is to be regarded very critically. In some cases, differences in
the verbal performance could simply be attributed to the linguistic differences of
the test language, like the length of the words for numbers for example. The
assessment of linguistic abilities of people, whose mother tongue is not the
17
language of the test, leads to great difficulties as well. A clear statement about
whether the performance in the test can be attributed to the abilities of the
person or simply to his or her fluency in the test language cannot be made.
Another challenge cross-cultural psychology faces, is the question of what is
considered as intelligent in different cultural contexts. People from different
cultures may have quite different ideas of what it means to be smart (Sternberg,
2009). A majority of western intelligence tests follow Wechsler's lead and focus
on cognitive performance like reasoning, acquired knowledge and memory.
However, empirical evidence indicated repeatedly that non-Western societies
have a slightly different concept of intelligence, which is broader, includes social
aspects of intelligence and doesn't primarily focus on school-related domains
like western intelligence tests often do (Van de Vijver & Hambleton, 1996). As a
result, construct bias can occur. Rovainen (2013) suggested that differences in
test-taking attitudes may have affected the differences in speeded tests
because US Americans may focus on fast performance whereas Europeans
concentrate on avoiding mistakes.
The Spearman hypothesis suggests that the performance differences in
intelligence tests between African Americans and Caucasian Americans depend
on how high the test's loading on the g-factor is. G factor stands for the English
term general factor of intelligence (Sternberg 2009, p. 536), which was
characterized by Charles Spearman. The g-load of a test is represented mostly
by the charge on the first factor of the inter-test correlation matrix (Jensen cited
Helms-Lorenz et al. 2003). In general, the positive correlation between the g-
load of a test and a variable X is called Jensen effect (Rushton 1998).
For that matter, whenever a child or an adult is assessed with an intelligence
test, his or her cultural background should be taken into consideration,
especially when comparing individuals with different backgrounds.
18
3. Item-Response-Theory and the Rasch model
Psychological instruments try to measure the extent to which a person
possesses a certain property such as intelligence. There are certain observable
human behaviors indicating that a person has more or less of such a property,
but no specific manifest behavior fully covers it. This is why such general
properties are called latent traits (Fischer & Molenaar, 1995).
At the heart of the Classical Test Theory (CCT) is the assertion that an
observed score is determined by the actual state of the unobservable variable
of interest or the so called true score and the error contributed by all other
influences to the observable variable (Gulliksen, 2013; DeVellis, 2006). The
three biggest disadvantages of CCT are the fact that parameter estimates
depend on the sample of individuals studied, the theoretical foundation if the
measurement is missing and providing proof for one-dimensionality is not
possible (see e.g. Moosbrugger & Hartig, 2003). These disadvantages and the
idea that every manifest and observable reaction to an item underlies a not
observable or latent trait led to the development of the Item-Response-Theory
(IRT).
In the IRT or probabilistic test theory one distinguishes between the dimension
of the latent trait, which is to be measured and the observable variables, the
items. All unidimensional IRT models share the assumption that a single
underlying latent construct or trait is the primary causal determinant of the
observed responses to each of the test's items, which means the latent trait can
be estimated through the observable variables (Fischer, 1974; Harvey &
Hammer, 1999). The central idea is that the estimation or probability of a
person's answer to an item can ideally be described as a function of the
person's position on the latent trait plus one or more parameters characterizing
the particular item. "For each item, the probability of a certain answer as a
function of the latent trait value, is called the item characteristic curve (ICC) or
item response function (IRF)" (Fischer & Molenaar, 1995). The probability of a
correct response to an item increases, as the level of the trait increases. In
other words, a specific trait doesn't inevitably lead to a correct or incorrect
answer in a deterministic manner, but rather in a probabilistic manner because
19
a person with a higher value of a trait will have a higher probability of answering
an item correctly, compared to a person with a lower value of a trait (see
Hambleton et al., 1991; Kubinger, 2003). These person and item parameters
can be estimated and the assumptions underlying the IRT model can be tested,
which serves the accountability of the quality of the test as a measurement
instrument and its performance in future applications (Fischer & Molenaar,
1995). IRT can also be used to improve the quality of a test by indicating which
items are inappropriate and should be changed, deleted or replaced (see
Fischer & Molenaar, 1995; Kubinger 2005).
IRT models have been developed to deal with responses to items that are
scored in an either dichotomous (i.e. only two possible scored responses exist
such as true-false, correct-incorrect) or polytomous (i.e. more than two scored
values are possible, such as rating scales) fashion and are built on the following
fundamental assumptions (see Harvey & Hammer, 1999; Hambleton et al.,
1991):
1. Unidimensionality: the item pool of a test being analyzed is effectively
unidimensional, which means the items measure only one specific
construct
2. Local independence: the testees' responses to different items are
statistically independent, which means no other factors influence the
testees' responses than their ability and the matter of chance (e.g.
learning effects)
The "dichotomous logistical test model", "One-Parameter Logistic model" (1-PL)
or simply Rasch model (RM), developed in the 1960s by the Danish
mathematician Georg Rasch, is one of the simplest IRT models and implies that
only a single item parameter is required to represent the item response process
(see Kubinger 2003; Harvey & Hammer, 1999). It describes the probability (P),
that person v with an ability parameter ξv solves ("+") item i with a difficulty
parameter σi.
20
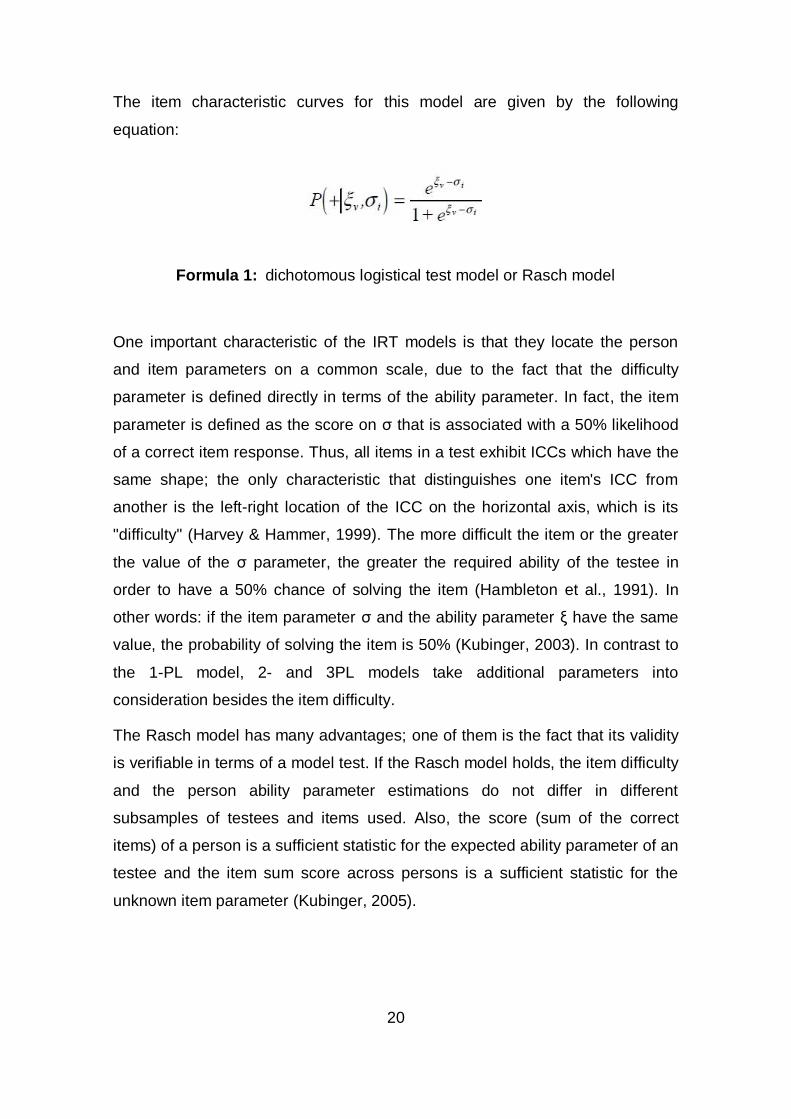
The item characteristic curves for this model are given by the following
equation:
Formula 1: dichotomous logistical test model or Rasch model
One important characteristic of the IRT models is that they locate the person
and item parameters on a common scale, due to the fact that the difficulty
parameter is defined directly in terms of the ability parameter. In fact, the item
parameter is defined as the score on σ that is associated with a 50% likelihood
of a correct item response. Thus, all items in a test exhibit ICCs which have the
same shape; the only characteristic that distinguishes one item's ICC from
another is the left-right location of the ICC on the horizontal axis, which is its
"difficulty" (Harvey & Hammer, 1999). The more difficult the item or the greater
the value of the σ parameter, the greater the required ability of the testee in
order to have a 50% chance of solving the item (Hambleton et al., 1991). In
other words: if the item parameter σ and the ability parameter ξ have the same
value, the probability of solving the item is 50% (Kubinger, 2003). In contrast to
the 1-PL model, 2- and 3PL models take additional parameters into
consideration besides the item difficulty.
The Rasch model has many advantages; one of them is the fact that its validity
is verifiable in terms of a model test. If the Rasch model holds, the item difficulty
and the person ability parameter estimations do not differ in different
subsamples of testees and items used. Also, the score (sum of the correct
items) of a person is a sufficient statistic for the expected ability parameter of an
testee and the item sum score across persons is a sufficient statistic for the
unknown item parameter (Kubinger, 2005).
21
4. AID - Adaptive Intelligence Diagnosticum
The Adaptive Intelligence Diagnosticum is an intelligence test battery
constructed for the assessment of the intellectual abilities of children and
adolescents aged between 6;00 and 15;11 years, and was first developed in
1985 in the German language. The revised version AID 2 was released in 2000
and its version 2.2 was published in 2009. All revisions brought a new
calibration, content modification and further improvements, which provided a
higher quality of these test batteries. The most recent version is the AID 3,
published in 2014 (Kubinger & Holocher-Ertl, 2014). The starting point of this
"3rd generation" of the AID was not only the commitment to a new calibration
according to DIN 33430 (DIN, 2002), but also the adjustment of a variety of
items to the latest social changes (Kubinger & Holocher-Ertl, 2014). In addition,
the test battery should be extended with new subtest to better suit the demands
of practice. The result is a test battery with a modernized and more economical
concept of the measurement of cognitive abilities. The AID is well established in
Austria and Germany, and several translations of the test battery are available:
Turkish, English, Italian, Hungarian, Serbian and Japanese (Krković, 2012). The
following description of the AID 3 and its subtests can be applied to the AID
English.
From the beginning, the AID 3 was intended to be used as a differential
diagnostic instrument, which allows promotion oriented assessment of children's
complex and basal cognitive abilities (Kubinger & Holocher-Ertl, 2014). The
skills measured with the AID 3 result in a dimensionality and factor structure
(explorative factor analysis results in 4 factors) that is not consistent with any
relevant intelligence theory. The determination of a conventional "IQ"
(intelligence), defined as the average of all tested abilities, is therefore
unjustifiable from a scientific point of view. Instead, the so called Intelligence
quantity (the lowest subtest score) was defined as the global measure of the
testees cognitive abilities. This (lower limit of) intelligence quantity is to be
interpreted as the minimum of a person's cognitive ability. If the lowest subtest
score can most likely be attributed to situational, energetic or motivational
conditions, rather the second lowest subtest score should be used for
22
interpretation. The third index "range" of intelligence represents the difference
between the lowest and highest subtest score and indicates how homogeneous
or differentiated the ability spectrum of a particular person is. All these indices
are seen in regard to the reference population. However, the authors
recommend interpreting the entire result profile regarding each individual
subtest score and therefore the child's strengths and weaknesses. In the course
of this, the AID 3 aims to be used as a screening method for determining
learning difficulties or partially impaired capacities (Kubinger & Holocher-Ertl,
2014).
However, three indices are calculated to gain an overview of the examinee's
performance: the "intelligence quantity" (the lowest subtest score), the "range"
(the variance between the lowest and the highest subtest score) and the second
lowest subtest score.
Vaguely in line with Cattell and his theory of investment ("knowledge is invested
intelligence"), the authors of the AID 3 define "intelligence" as follows:
intelligence is the totality of all cognitive requirements that are necessary in
order to acquire knowledge and skills – the term "cognition" in this case refers
to "any process, through which a human acquires knowledge about an object or
becomes aware of his environment...: perception, recognition, imagine,
judgments, memory, learning, thinking,... Language" (Kubinger & Holocher-Ertl,
2014).
In regard to content, the intelligence test battery AID is partly oriented towards
the world's widely used test concept by David Wechsler, although even the
related subtest displays conceptual modifications (Kubinger & Holocher-Ertl,
2014). Apart from "verbal-acoustic" tasks, which refer to acoustic detection and
verbalized action, also "manual-visual" tasks, that require visual detection and
manual action, are included in the AID 3.
Methodically the AID enables adaptive testing which is embedded in the IRT: by
presenting each test person only those tasks which correspond to his or her
level of performance, good measurement accuracy will be achieved. Such an
approach does not only allow very economic testing, because the test person is
not presented with an unnecessarily large pool of items, but also simplifies the
23
calculation of the score because neither categorical answers nor speed-points
are involved. This measurement accuracy is especially important and useful for
differentiating between children within the high ability range, which is why the
AID is even suitable for the assessment of cognitive giftedness (Holocher-Ertl,
Kubinger & Hohensinn, 2008). Additionally, this adaptive approach reduces
frustration and motivational problems on the part of the testee, due to either
persistent failure or lack of challenge. All items of the AID 3 are calibrated
according to the rules and definitions of the Rasch model which consequently
guarantees unidimensionality and fair scoring (Kubinger, 2004).
In order to meet the requirements of adaptive testing on one hand and to allow
an efficient approach to intelligence testing on the other hand, the AID 3 is
administered in an individual one-on-one setting with a branched testing design.
For most of the subtests the procedure is as follows: each testee is presented
with an age-conform block of items and then continues with a second or third
item block depending on his or her preceding achievements (score).
4.1 AID 3 / AID English subtests
The following detailed description of the AID 3 and it's subtests is based
on the test description found in the AID 3 test manual (Kubinger & Holocher-
Ertl, 2014) and can be applied to the AID English as mentioned earlier.
The AID 3 consists of 12 standard subtest, as well as 5 additional subtests. The
majority of the subtests (1, 2, 3, 4, 6, 8, 9, 10, 11, 12, 6a) are administered
adaptively. Subtests 5, 7, 5a and 10a are applied conventionally and every
testee is presented with the same items until either the indicated time has run
out or a specific number of unsolved items is reached.
1.) Subtest 1: Everyday Knowledge
The subtest "Everyday knowledge" assesses the ability to acquire knowledge
about topics that are common in today's society. Questions are provided
verbally by the test administrator and the testee must answer them verbally.
24
Only those items which were evaluated as representative and relevant based
on important topics of everyday life like history, media and sports, were
incorporated. The subtest with its total amount of 60 items evidently measures
one-dimensional. By default, only 15 of the 60 items are administered per testee
(3 blocks with 5 items each), with the selection largely depending on his or her
performance. Answers are scored dichotomously ("correct" or "incorrect") and
the number of solved items is added together.
2.) Subtest 2: Competence in Realism
The subtest "Competence in Realism" intends to examine the comprehension
and control of the reality of everyday life objects. The testee is presented with
images of objects with a missing detail and is asked to point to or tell the
examiner what is missing. The items were designed in a way that a functionally
essential, but missing part of a whole has to be detected. The subtest with its
total amount of 20 items plus a warming-up item, which is presented at the
beginning, evidently measures one-dimensional. By default, only 10 or 15 of the
20 items are administered per testee, with the selection largely depending on
his or her performance. Answers are scored dichotomously ("correct" or
"incorrect").
3.) Subtest 3: Applied Computing
The subtest "Applied Computing" assesses the ability to solve numerical
problems that are common in everyday life by reasoning and using the
appropriate arithmetic operation, independently of the school level of
mathematical skills. The math problems are presented verbally and from a
certain difficulty level on, the testee is additionally given the possibility to read
the text in a text book. Younger children are additionally presented with a
graphic representation of the task in order for them to be able to solve the
problem independently of their memory capacity. The subtest with its total
amount of 60 items evidently measures one-dimensional. By default, only 15 of
the 60 items are administered per testee (3 blocks with 5 items each), with the
25
selection largely depending on his or her performance. Answers are scored
dichotomously ("correct" or "incorrect") and the number of solved items is added
together.
4.) Subtest 4: Social and Material Sequencing
The subtest "Social and material sequencing" intends to cover the ability, to
understand and control the sequence of social events and the conditions of
everyday life objects. The testee receives pictures of different stories in a
random order and is asked to logically arrange the pictures into the correct
sequence. The subtest with its total amount of 30 items evidently measures
one-dimensional. By default, only 6 of the 30 items are administered per testee
(3 blocks with 5 items each), with the selection largely depending on his or her
performance. Answers are scored dichotomously ("correct" or "incorrect").
5.) Subtest 5: Immediately Reproducing numerical
The subtest "Immediately reproducing numerical" measures the capacity of
serial information processing (verbal acoustic). A sequence of numbers is read
out loud to the testee and he or she has to correctly reproduce these numbers
in the predetermined order. The test consists of the item sets "forward" and
"backward", which both consist of number series of different lengths, beginning
with two numbers per series and progressing to nine numbers per series. Every
length has three number series which are read to the testee depending on the
number of attempts required. The testing is discontinued if the child fails to
reproduce all three number series of the same length. Scoring is carried out
separately for each item set: the length of the longest correctly reproduced
number series and the corresponding number of attempts is recorded (the latter
is only relevant within those test performances with the same longest length of
correctly reproduced numbers).
26
6.) Subtest 6: Producing Synonyms
The subtest "Producing synonyms" examines elementary language
comprehension regarding to what extent the testee captures the meaning of
terms and to what extent an alternative vocabulary of words exists. The subtest
with its total amount of 60 items evidently measures one-dimensional. By
default, only 15 of the 60 items are administered per testee (3 blocks with 5
items each), with the selection largely depending on his or her performance.
Answers are scored dichotomously ("correct" or "incorrect") and the number of
solved items is added together.
7.) Subtest 7: Coding and Associating
With the subtest "Coding and Associating" two partially independent skills are
being captured: the speed of information processing and the incidental learning
ability. The testee must code simple objects into symbols, according to a pattern
sheet and later has to encode the same objects from memory without the
pattern sheet. The test consists of a repertoire of twelve graphical objects,
which are presented in a two-page worksheet in an unsystematic order and the
testee has two minutes to draw these simple geometric symbols below the
object according to the template as quickly as possible. After the two minutes
the pattern sheet is removed and the testee is asked to code the twelve objects
from memory without the template. The number of correctly coded objects after
two minutes, as well as the number of correctly coded objects by
memory/associations, is scored.
8.) Subtest 8: Anticipating and Combining - figural
The subtest "Anticipating and Combining - figural" assesses reasoning as the
ability to identify parts of a whole and to arrange these parts. The testee is
presented with pieces of a figure which he or she must correctly put together.
Each item contains an "anchor"-part, which all other parts have to be aligned
around. The testee is neither informed about what the figure is, nor is he or she
given a template of the figure, which usually represent of the child's everyday
27
life. The subtest with its total number of 12 items evidently measures one-
dimensional. Results of all items except for two are scored in three categories,
distinguishing between fast solution, slow solution and no solution. This manner
of scoring is empirically well founded. By default, only 6 of the 12 items are
administered per testee, with the selection largely depending on his or her
performance.
9.) Subtest 9: Verbal Abstraction
The subtest "Verbal Abstraction" assesses the ability to form a concept of terms
through abstraction. Two objects are named and the testee must recognize and
describe their essential common function. The authors tried to ensure that
solving an item puts low demands on the vocabulary of the test person. The
subtest with its total number of 60 items evidently measures one-dimensional.
By default, only 15 of the 60 items are administered per testee (3 blocks with 5
items each), with the selection largely depending on his or her performance.
Answers are scored dichotomously ("correct" or "incorrect") and the number of
solved items is added together.
10.) Subtest 10: Analyzing and Synthesizing - abstract
The subtest "Analyzing and Synthesizing - abstract" examines the ability to
reproduce a complex (abstract) figure by using a suitable structure. Geometric
patterns are presented and the testee must form the patterns using a number of
cubes. The cubes have a plain white, a plain red and a plain blue side (which is
irrelevant for the solution), as well as sides that are half red (one with a
horizontal and one with a diagonal line) and a quarter red, with the rest of the
side being white. The subtest with its total amount of 30 items evidently
measures one-dimensional. By default only 6 of the 30 items plus two warming-
up items at the beginning are administered per testee (3 blocks with 5 items
each), with the selection largely depending on his or her performance. Answers
are scored dichotomously ("correct" or "incorrect").
28
11.) Subtest 11: Social Understanding and Material Reflection
The subtest "Social Understanding and Material Reflection" assesses whether
the testee understands connections of our "social" environment and to what
extent he or she is able to socialize in terms of knowing socially appropriate
behaviors and conditions in our society. The subtest with its total amount of 60
items evidently measures one-dimensional. By default, only 15 of the 60 items
are administered per testee (3 blocks with 5 items each), with the selection
largely depending on his or her performance. Answers are scored
dichotomously ("correct" or "incorrect") and the number of solved items is added
together.
12.) Subtest 12: Formal Sequencing
The subtest "Formal Sequencing" captures the ability to identify and suitably
exploit regularities or logical connections. Pads of different color, shape and
size are provided for the testee with which he or she must complement a
sequence of corresponding elements on slides, following specific rules. The
pads are yellow or green, large or small and in the shape of a square, rectangle,
circle or triangle. The sequences vary in length from three to eleven. The
subtest with its total amount of 30 items evidently measures one-dimensional.
By default, only 9 of the 30 items plus one warming-up item are administered
per testee (3 blocks with 5 items each), with the selection largely depending on
his or her performance. Answers are scored dichotomously ("correct" or
"incorrect").
13.) Subtest 5a: Immediately Reproducing - figural/abstract
The additional subtest "Immediately Reproducing - figural/abstract" measures
the capacity of serial information processing of visual stimuli. The testee is
presented with a picture board of 49 colorful, partly abstract and partly graphic
pictures that are arranged in a 7 x 7 position in a square. The test administrator
points to certain pictures in a certain order and the child must remember the
sequence and point to the same pictures in the same order as demonstrated
29
before. The subtest with its total amount of 14 items evidently measures one-
dimensional. The items have an ascending number of pictures from three to
nine and each item consists of two sequences: one with only abstract and one
with only graphic figures. Answers are scored dichotomously ("correct" or
"incorrect") and the testing is discontinued when the child fails to reproduce
both sequences of the same length and both of the following sequences.
14.) Subtest 5b: Memorizing by Repetition - lexical
The additional subtest "Memorizing by Repetition - lexical" examines the
memory capacity of verbal stimuli that is presented once and then repeated
once more. Two sequences of nine meaningless syllables are read aloud to the
testee who must reproduce them. The syllables are the same in both word lists,
but arranged differently. Only the second word list is scored and is done so
dichotomously. The subtest evidently measures one-dimensional among age
groups.
15.) Subtest 5c: Learning and Long-term Memory - figural/spatial
With the additional subtest "Learning and Long-term Memory - figural/spatial",
the learning efficiency and the capacity of the long-term memory of spatial
stimuli are being measured. The testee is presented with a picture board of
mostly graphic objects and asked to memorize their arrangement. The test
consists of three such panels with 3 × 3, 3 x 4 and 4 × 4 images, however only
one is presented to each subject, depending on age. The testee himself
determines how long he or she needs in order to memorize the arrangement of
the images on the picture board. A maximum of four testing phases are
undertaken, where the testee must correctly arrange the pictures from his or her
memory on a blank panel using picture plates. Depending on his or her
success, the testee has to undergo a learning phase again before trying to
correctly arrange the pictures. About 20 minutes after the preliminary
completion of this additional subtest, the final testing phase is conducted. As a
first test score the administrator records how many trials the child needed to
30
correctly arrange the pictures (one, two, three or four trials, or none). Secondly,
the difference of the number of errors between the final test phase and the
preceding test phase is scored.
16.) Subtest 6a: Antonyms
The additional subtest "Antonyms" examines basic understanding of language,
in terms of to what extent the testee captures the meaning of terms by coming
up with the opposite concept and describing it. The subtest with its total amount
of 60 items evidently measures one-dimensional. By default, only 15 of the 60
items are administered per testee (3 blocks with 5 items each), with the
selection largely depending on his or her performance. Answers are scored
dichotomously ("correct" or "incorrect") and the number of solved items is added
together.
17.) Subtest 10a: Recognition of figural Structures
The additional subtest "Recognition of figural Structures" tries to capture the
ability to decompose complex (abstract) figures in their basic components. Each
testee is provided with a geometric pattern, which has to be divided into its
components according to the different sides of a cube by drawing lines between
these components. The cube sides are the same as in subtest 10 "Analyzing
and Synthesizing - abstract", the patterns however, are fundamentally different.
The subtest with its total amount of 11 items evidently measures one-
dimensional. In addition, one example item is given. The testing is discontinued
as soon as the time limit of two minutes is over. The testee can chose in which
order he or she would like to handle the items. Answers are scored
dichotomously ("correct" or "incorrect") and the number of solved items is added
together, whereby it must be taken into consideration which items the testee
worked on. This subtest is only suitable for children of a minimum age of eight
years.
31
4.2 Quality Criteria
Scoring: The allocation of test performance to test scores is evidently "fair"
according to the Rasch model and its generalization (this applies to ten subtests
and four additional subtests; the two remaining subtests, as well as the other
additional subtest measure "fair" by definition).
Objectivity: Test administrator effects could be verified in two subtests
(deviations of 4 T values)
Reliability: Internal consistency can be assumed due to the validity of the Rasch
model (or a generalization of it) for ten subtest and four additional subtests
given away. Split-half reliability for nine under testing (original AID) was mostly
between 0.91 and 0.95. Stability after four weeks, or at least a year mostly
between 0.83 and 0.95, respectively between 0.60 and 0.80
Validation: Content-related validity is given based on expert ratings. Construct
validity in regard to a hierarchical model of specific learning disorders with
(domain) factors of perception, memory and processing/use is given.
Discriminating construct validity according to performance tests and several
personality questionnaires is given.
Standardization: Norm tables are valid.
Economy: As a result of Adaptive Testing ten subtests assess reliably, despite
shorter test length. The scoring effort with the specially distributed evaluation
program AID_3_Score is minimal. Test administration time for one on one
assessment is common.
Utility: Regarding promotion oriented assessment, especially for the screening
of learning difficulties or partially impaired capacities, the AID is very useful.
Reasonableness: The energetic motivational stress is relatively low.
Non-Fakeability: For common items it is unlikely that a test subject performs
deliberately and purposefully badly.
Fairness: Fairness is given due to sex-specific norm tables. Instruction in
different languages is possible.
32
In conclusion, the AID offers several advantages over traditional intelligence
tests (Kubinger, 2009):
- Economic testing due to shorter test duration (item selection is adapted
to the testee's ability and uninformative items are not administered)
- Informative testing (item selection is adapted to the testee's ability
and uninformative items are not administered)
- Assessment in extreme ability ranges (item selection is adapted to the
testee's ability)
- Precise differentiation between testees (item selection is adapted to the
testee's ability)
- Achievement motivation at a constant high level (item selection is
adapted to the testee's ability)
- Validity of the Rasch model is verifiable (fairness of the items can be
verified)
33
III. Empirical Section
5. Purpose of the Study
The purpose of this empirical study is to psychometrically validate the
adapted English version of the AID 3 (Kubinger & Holocher-Ertl, 2014),
according to the Item Response Theory and in particular the Rasch model.
The central question is, whether the items of the AID English are Rasch model
conform and therefore can be used to assess the cognitive abilities of English
educated children, who live in a European cultural context. Presently, English
language tests predominately originate in the USA and do not generalize well
into a European cultural context, and may be biased towards non-native
speakers.
6. Method
6.1 Design of the Study
Since the intended population of this study was English educated
children living in the European region, the very first step was to find appropriate
schools to participate in this research project in order to reach as many students
between the age of 6 and 15 as possible. Over 50 International schools in
Germany, Austria and Slovakia were contacted via email between October and
December 2013, with a letter describing the purpose of the study and some
features of the AID English. After several months of reaching out to schools, the
following five schools agreed to participate:
- Vienna International School (VIS), Vienna, Austria
- Amadeus International School (AIS), Vienna, Austria
- European School of Karlsruhe (ES), Karlsruhe, Germany
- Heidelberg International School (HIS), Heidelberg, Germany
- Berlin International School (BIS), Berlin, Germany
34
After finalizing details about the implementation of the study with the
participating schools, parents were contacted via email. They received a letter,
which included information about the study and requested the consent for their
children to participate in this research project. The children and adolescents
who had, with their parents consent, agreed to take part in the study were
tested individually at their respective school during school hours.
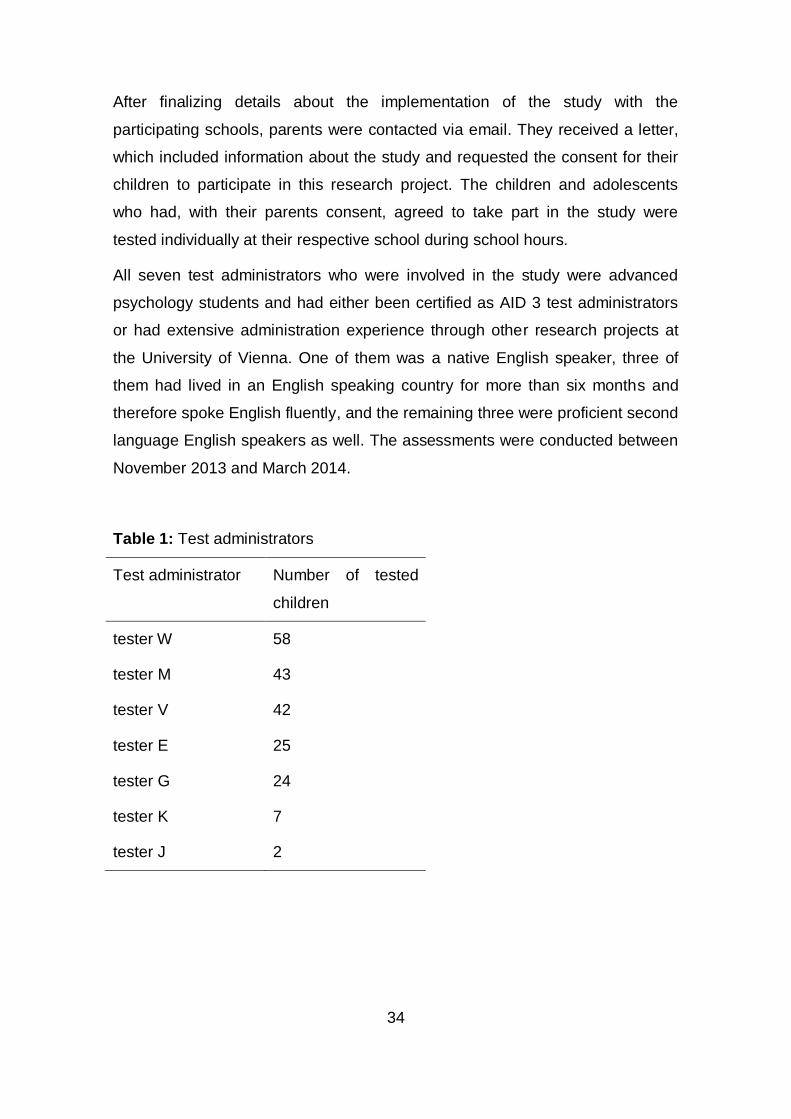
All seven test administrators who were involved in the study were advanced
psychology students and had either been certified as AID 3 test administrators
or had extensive administration experience through other research projects at
the University of Vienna. One of them was a native English speaker, three of
them had lived in an English speaking country for more than six months and
therefore spoke English fluently, and the remaining three were proficient second
language English speakers as well. The assessments were conducted between
November 2013 and March 2014.
Table 1: Test administrators
Test administrator Number of tested
children
tester W 58
tester M 43
tester V 42
tester E 25
tester G 24
tester K 7
tester J 2
35
6.2 Instruments
The twelve subtests and all five additional subtests of the AID English,
which were described in chapter 4, were administered to the participants of the
study.
6.3 Procedure
All the assessments took place at the respective schools, which meant,
in some cases, that the test administrators had to travel to Germany to conduct
the testing. The schools made several rooms available, where the assessments
could take place in an undisturbed manner. This was very important since each
testing was conducted individually, as prescribed in the test manual. Depending
on the school, assessments took place between 8:30 am and 3:30 pm. The
younger participants were usually fetched from their classrooms by the test
administrator and taken to the allocated room. The older students were sent to
the respective rooms by their classmates or teachers. Before starting the
assessment, some demographic information of the children, such as their age
and the language they speak at home, was recorded. Giving the instruction as
mentioned in the test manual, the administrators tried to make the child feel at
ease and comfortable enough to ask questions if necessary. The AID English
was administered in a branched testing design, which means the questions and
items were adapted to the child's knowledge and abilities. Due to the fact that
each participant was tested with all seventeen subtests, the test duration was
comparably long, ranging from 90 to 110 minutes. The answers of each
participant were scored on an individual profile sheet.
6.4 Participants
Altogether 202 children between the age 6 and 16 (M(age)=10.954
years, S=2.6769 years) participated in the study; 111 of them were female and
91 male (see Table 2 and Figure 1). The sex of the participating children was
somewhat balanced within the age groups (see Figure 1).
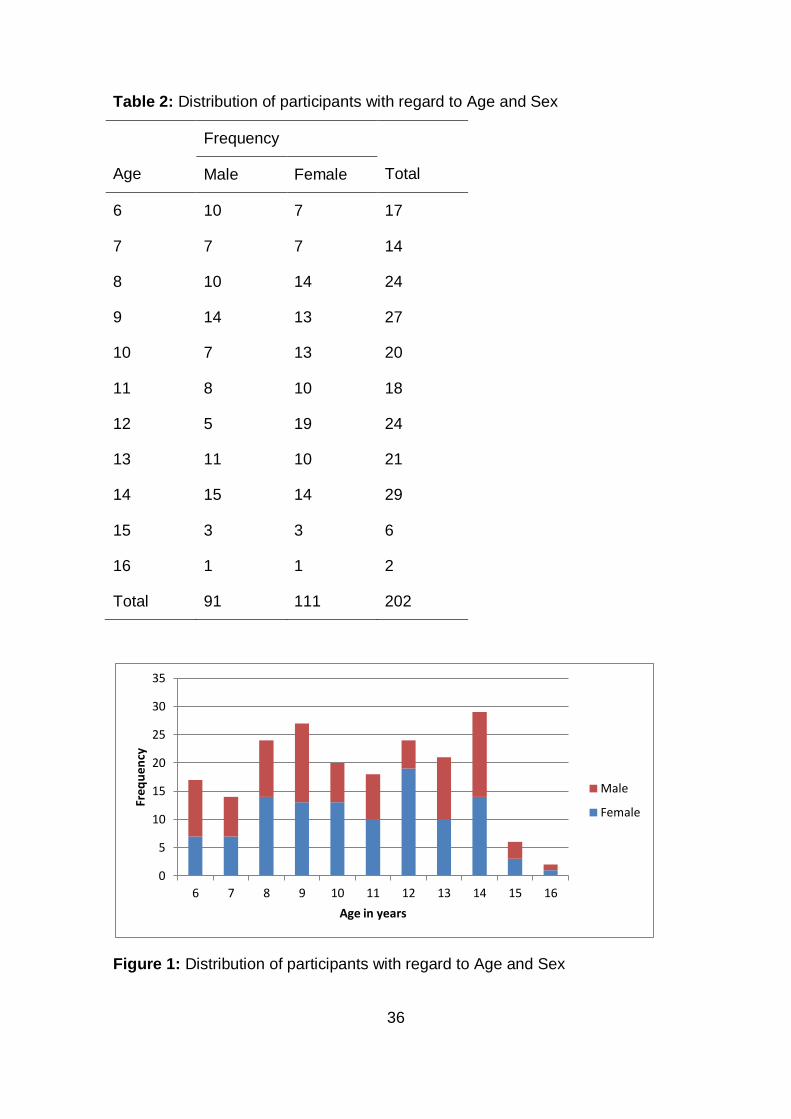
36
Table 2: Distribution of participants with regard to Age and Sex
Age
Frequency
Total Male Female
6 10 7 17
7 7 7 14
8 10 14 24
9 14 13 27
10 7 13 20
11 8 10 18
12 5 19 24
13 11 10 21
14 15 14 29
15 3 3 6
16 1 1 2
Total 91 111 202
Figure 1: Distribution of participants with regard to Age and Sex
0
5
10
15
20
25
30
35
6 7 8 9 10 11 12 13 14 15 16
Fre
qu
ency
Age in years
Male
Female
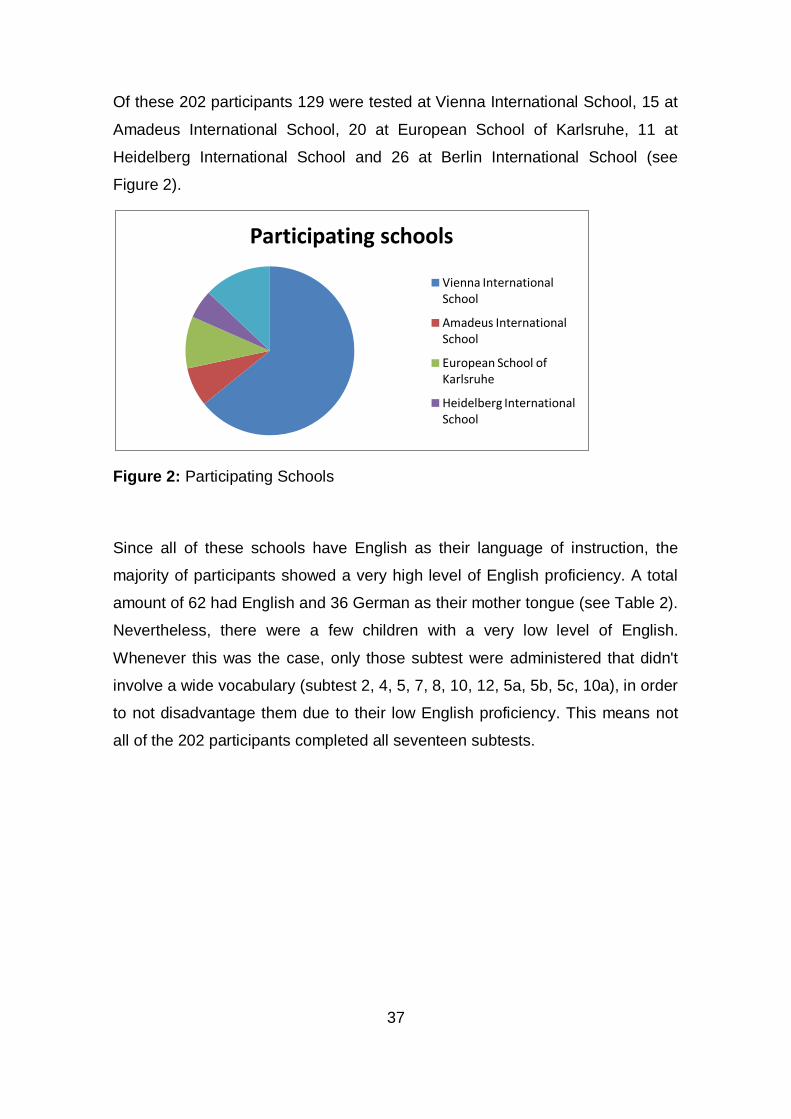
37
Of these 202 participants 129 were tested at Vienna International School, 15 at
Amadeus International School, 20 at European School of Karlsruhe, 11 at
Heidelberg International School and 26 at Berlin International School (see
Figure 2).
Figure 2: Participating Schools
Since all of these schools have English as their language of instruction, the
majority of participants showed a very high level of English proficiency. A total
amount of 62 had English and 36 German as their mother tongue (see Table 2).
Nevertheless, there were a few children with a very low level of English.
Whenever this was the case, only those subtest were administered that didn't
involve a wide vocabulary (subtest 2, 4, 5, 7, 8, 10, 12, 5a, 5b, 5c, 10a), in order
to not disadvantage them due to their low English proficiency. This means not
all of the 202 participants completed all seventeen subtests.
Participating schools
Vienna International School
Amadeus International School
European School of Karlsruhe
Heidelberg International School
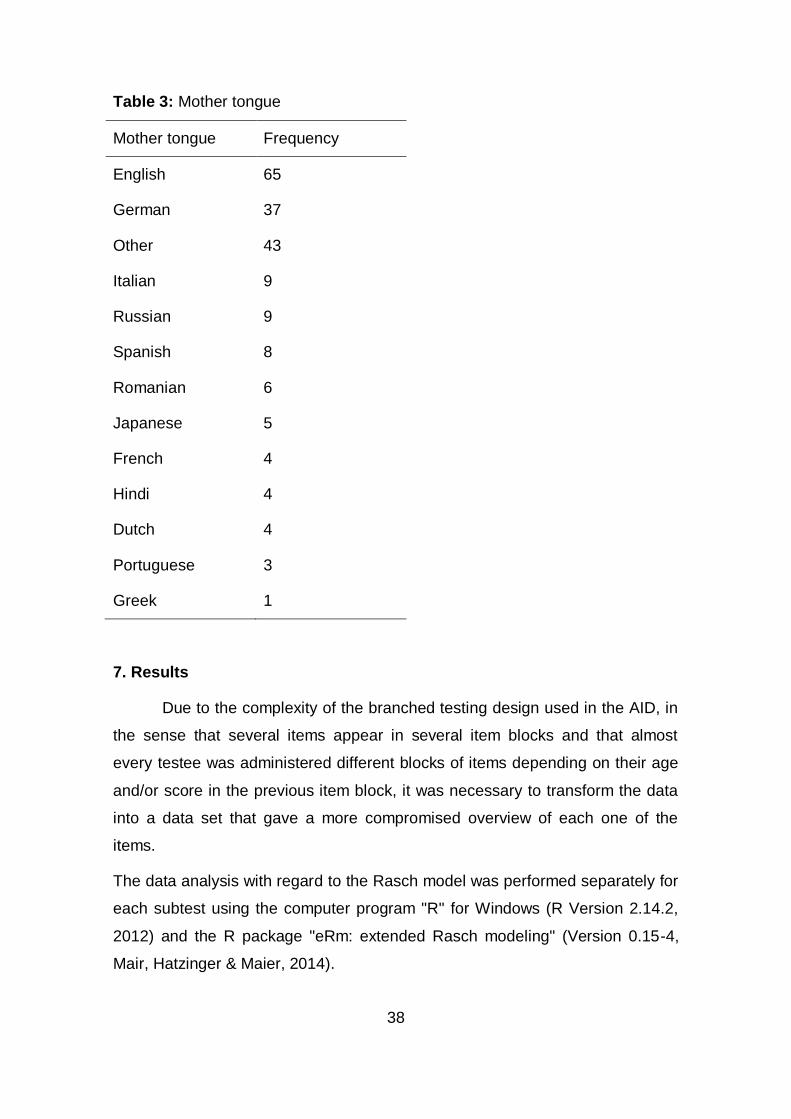
38
Table 3: Mother tongue
Mother tongue Frequency
English 65
German 37
Other 43
Italian 9
Russian 9
Spanish 8
Romanian 6
Japanese 5
French 4
Hindi 4
Dutch 4
Portuguese 3
Greek 1
7. Results
Due to the complexity of the branched testing design used in the AID, in
the sense that several items appear in several item blocks and that almost
every testee was administered different blocks of items depending on their age
and/or score in the previous item block, it was necessary to transform the data
into a data set that gave a more compromised overview of each one of the
items.
The data analysis with regard to the Rasch model was performed separately for
each subtest using the computer program "R" for Windows (R Version 2.14.2,
2012) and the R package "eRm: extended Rasch modeling" (Version 0.15-4,
Mair, Hatzinger & Maier, 2014).
39
The data was analyzed according to three partition criteria:
- "score": testees with a score > median versus testees with a score ≤
median
- "sex": male versus female testees
- "language": English natives versus non-English natives
The partition criterion "age", which is commonly used for Rasch model analysis,
couldn't be used in this case due to the small sample size and the fact that the
younger children were generally administered different items than the older
children.
The validity of the Rasch model for the item samples of thirteen of the
seventeen subtests were analyzed, using the Andersen's likelihood ratio test
(LRT) (1973) and graphical model check. Subtest 8 was analyzed with Master's
"Partial-Credit-Model" due to its three-categorical response pattern. According
to Kubinger and Holocher-Ertl (2014), subtests 5, 5c and 7 are in no need of a
Rasch model analysis because the scores can be considered as fair without
any further checking.
In consequence of the Rasch model analysis, non-conform items were identified
using the graphical model check and excluded, until no significant deviation
from the model (α=.05) occurred. A deviation is practically relevant if it is bigger
than 1/10 of the span of the difficulty parameter in the affected item pool
(Kubinger 2005). In this paper, an item is considered deviant if its confidence
ellipse with α 0.05 does not touch or cross the regression line. A significance
level of α=.05 was used, but based on Kubinger (2005) it was adjusted to α=.01
in order to counteract the accumulation of overall Type I risk, which occurred
due to the application of the three LRT for the three partition criteria. As a result,
the accumulated Type I risk of three model checks yields an α of .029. Kubinger
(2005) states that if indeed some items have to be deleted in order to produce
at least an a posteriori model fit for the given data, a type of cross-validation
must be applied. However, this was not part of this study, but should be
followed up on by future research.
40
For the analysis of subtests 4 and 10, the partition criterion "score" was
replaced by the criterion "score of subtest 2", following the approach of
Kubinger and Holocher-Ertl (2014). The median of subtest 2 is used as a
partition criterion because of methodical artifacts that occur in these two
subtests due to the branched testing system. Using the program SPSS (Version
20.0), accumulated frequencies were calculated.
Some items could not be analyzed by means of the dichotomous logistical test
model due to "inappropriate response patterns" or "ill-conditioning". These items
had either been solved by the majority or all participants or had never been
solved by anyone or by only very few testees (in the entire sample or in the
subgroups caused by the partition criteria), or they had never been
administered due to the partition and therefore full NA responses in one of the
subgroups. "Ill-conditioned" items prevented the likelihood ratio test from being
calculated. As a consequence, these items had to be excluded and no
statement can be made about them.
Since the English version of the AID 3 has not been published yet, no further
information about the content of specific items can be given in this paper for
confidentiality reasons. However, item parameters are listed in the appendix.
7.1 Subtest 1: Everyday Knowledge
201 testees were administered with the first subtest "Everyday
Knowledge". Item i61 had to be excluded because it was solved every time it
was administered (no 0-responses).
The following table shows the results of the Anderson's likelihood ratio test for
subtest 1.
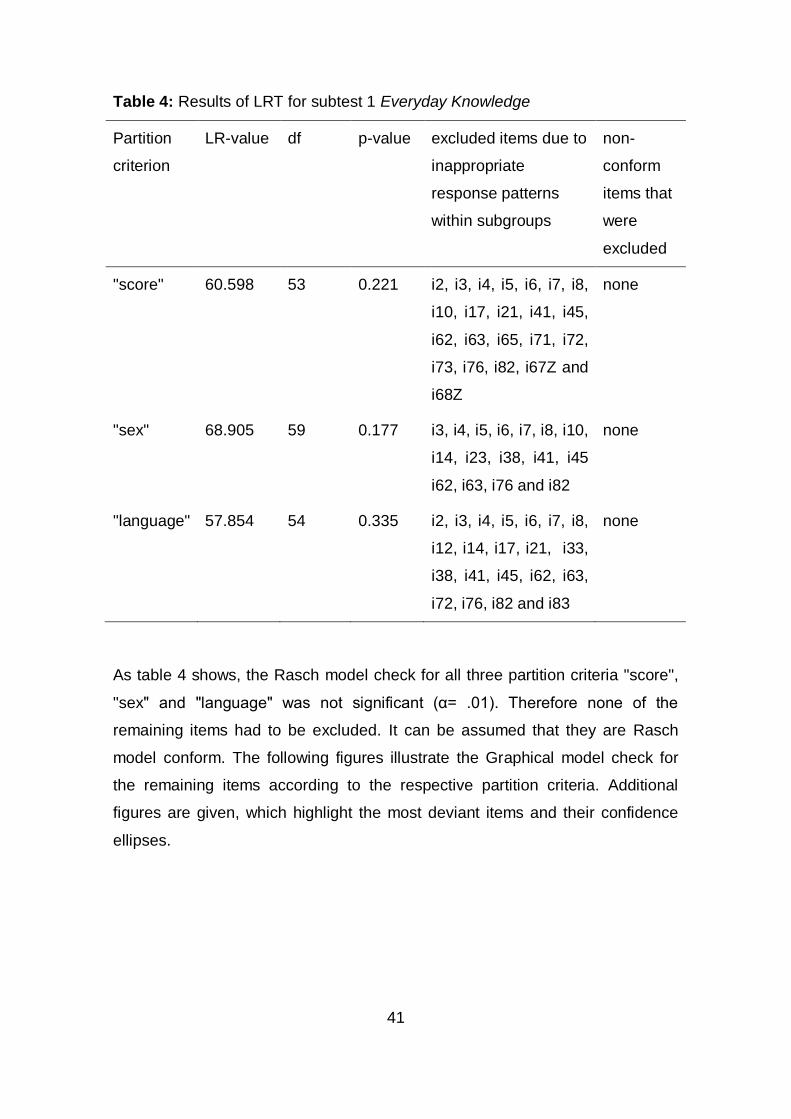
41
Table 4: Results of LRT for subtest 1 Everyday Knowledge
Partition
criterion
LR-value df p-value excluded items due to
inappropriate
response patterns
within subgroups
non-
conform
items that
were
excluded
"score" 60.598 53 0.221 i2, i3, i4, i5, i6, i7, i8,
i10, i17, i21, i41, i45,
i62, i63, i65, i71, i72,
i73, i76, i82, i67Z and
i68Z
none
"sex" 68.905 59 0.177 i3, i4, i5, i6, i7, i8, i10,
i14, i23, i38, i41, i45
i62, i63, i76 and i82
none
"language" 57.854 54 0.335 i2, i3, i4, i5, i6, i7, i8,
i12, i14, i17, i21, i33,
i38, i41, i45, i62, i63,
i72, i76, i82 and i83
none
As table 4 shows, the Rasch model check for all three partition criteria "score",
"sex" and "language" was not significant (α= .01). Therefore none of the
remaining items had to be excluded. It can be assumed that they are Rasch
model conform. The following figures illustrate the Graphical model check for
the remaining items according to the respective partition criteria. Additional
figures are given, which highlight the most deviant items and their confidence
ellipses.
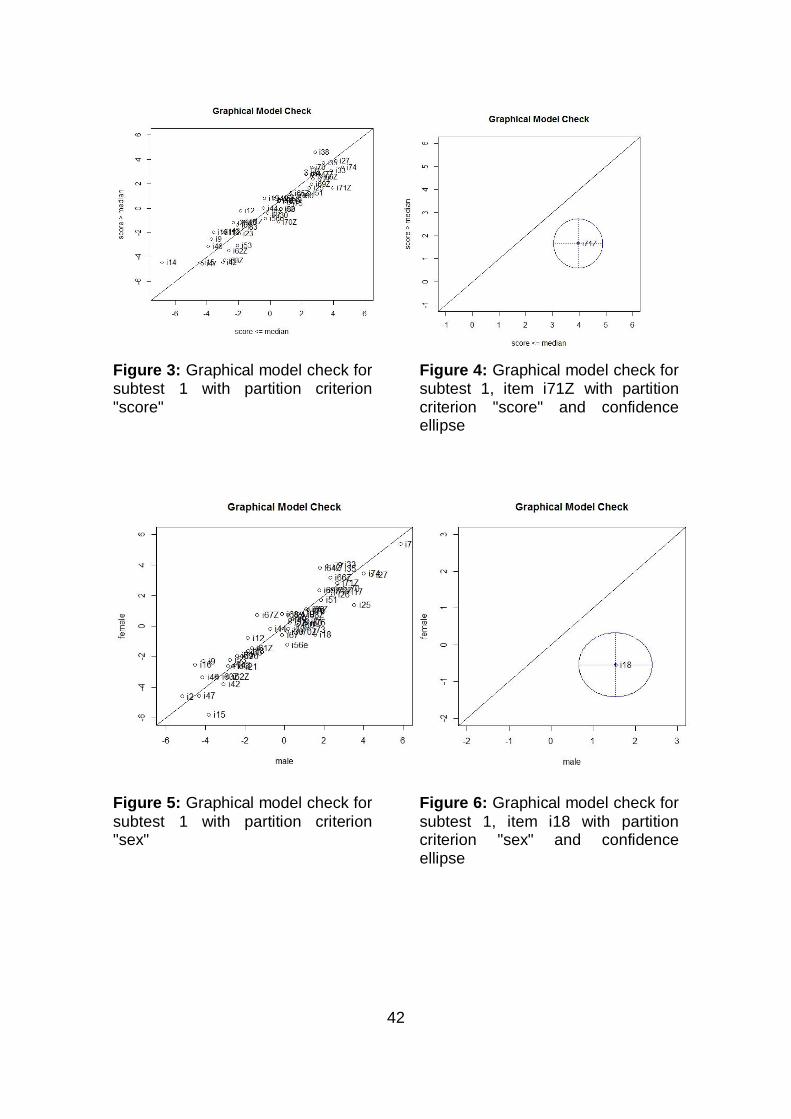
42
Figure 3: Graphical model check for subtest 1 with partition criterion "score"
Figure 4: Graphical model check for subtest 1, item i71Z with partition criterion "score" and confidence ellipse
Figure 5: Graphical model check for
subtest 1 with partition criterion "sex"
Figure 6: Graphical model check for
subtest 1, item i18 with partition criterion "sex" and confidence ellipse
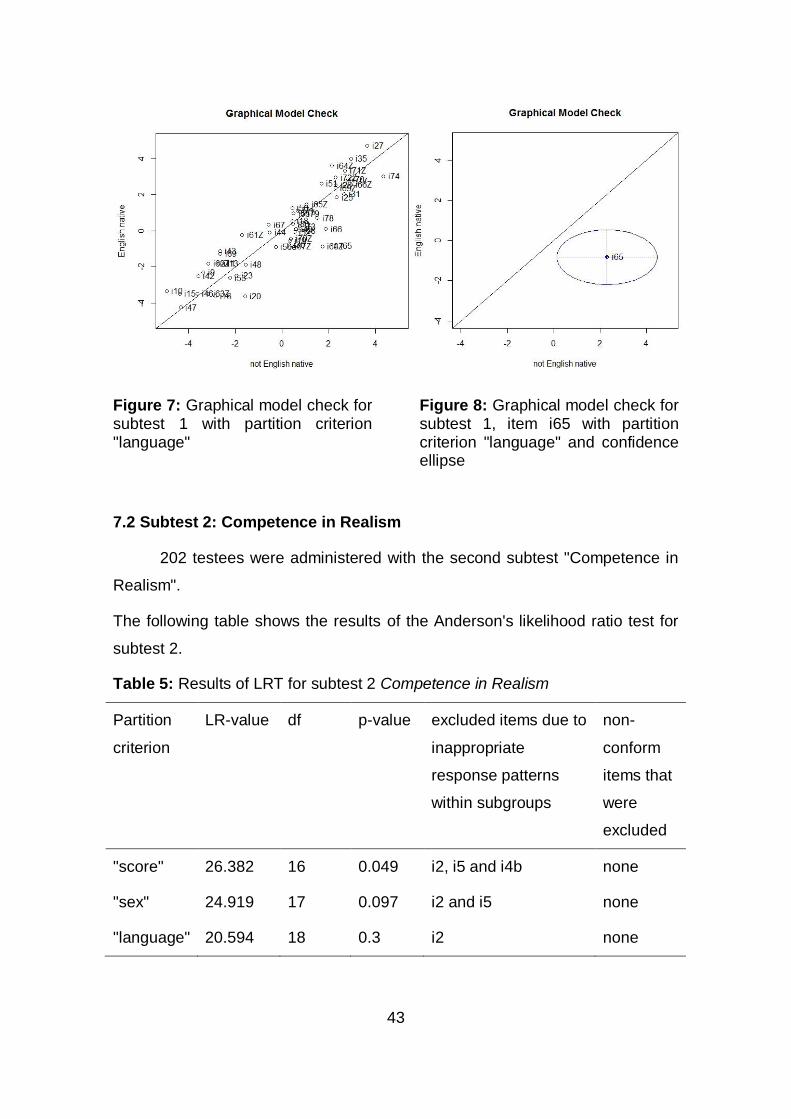
43
Figure 7: Graphical model check for subtest 1 with partition criterion "language"
Figure 8: Graphical model check for subtest 1, item i65 with partition criterion "language" and confidence ellipse
7.2 Subtest 2: Competence in Realism
202 testees were administered with the second subtest "Competence in
Realism".
The following table shows the results of the Anderson's likelihood ratio test for
subtest 2.
Table 5: Results of LRT for subtest 2 Competence in Realism
Partition
criterion
LR-value df p-value excluded items due to
inappropriate
response patterns
within subgroups
non-
conform
items that
were
excluded
"score" 26.382 16 0.049 i2, i5 and i4b none
"sex" 24.919 17 0.097 i2 and i5 none
"language" 20.594 18 0.3 i2 none
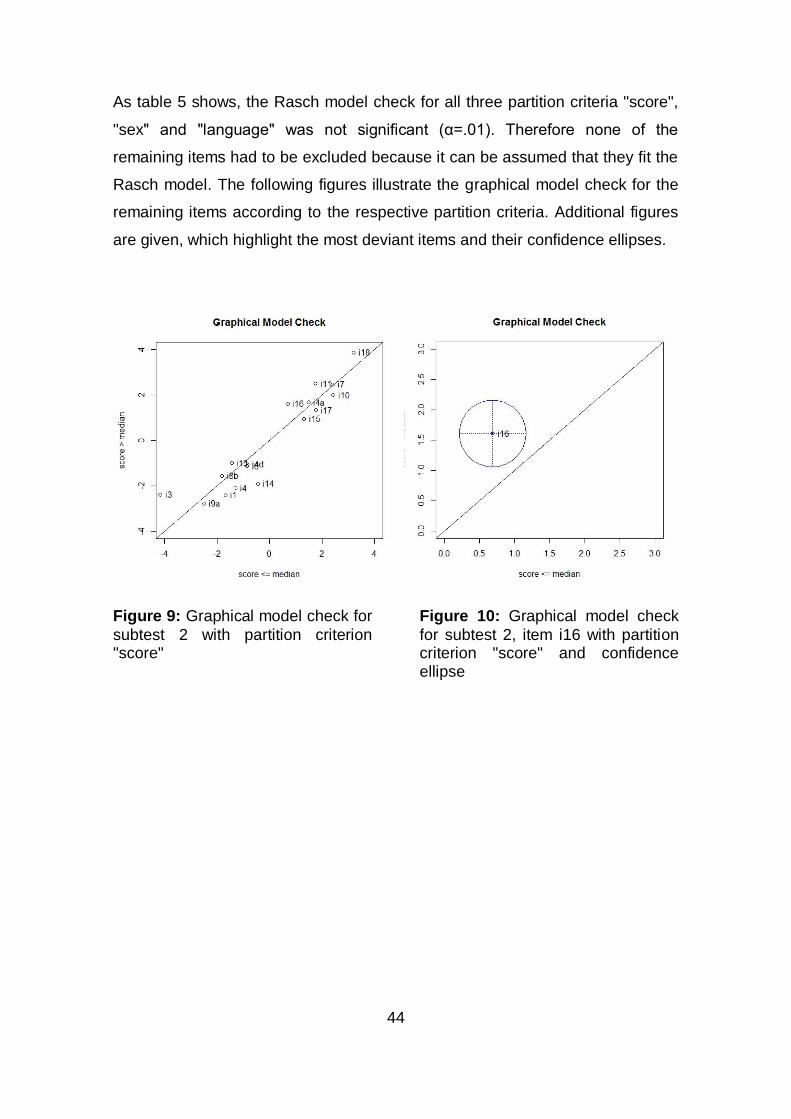
44
As table 5 shows, the Rasch model check for all three partition criteria "score",
"sex" and "language" was not significant (α=.01). Therefore none of the
remaining items had to be excluded because it can be assumed that they fit the
Rasch model. The following figures illustrate the graphical model check for the
remaining items according to the respective partition criteria. Additional figures
are given, which highlight the most deviant items and their confidence ellipses.
Figure 9: Graphical model check for
subtest 2 with partition criterion "score"
Figure 10: Graphical model check
for subtest 2, item i16 with partition criterion "score" and confidence ellipse
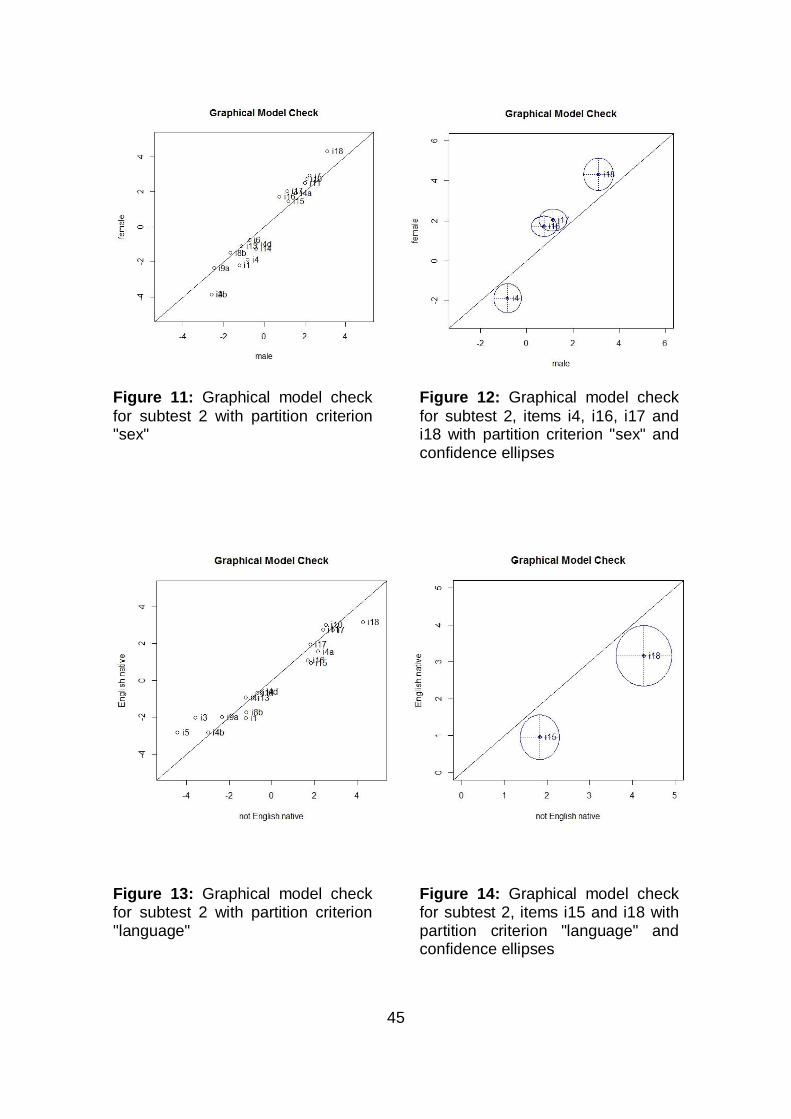
45
Figure 11: Graphical model check
for subtest 2 with partition criterion "sex"
Figure 12: Graphical model check
for subtest 2, items i4, i16, i17 and i18 with partition criterion "sex" and confidence ellipses
Figure 13: Graphical model check for subtest 2 with partition criterion "language"
Figure 14: Graphical model check for subtest 2, items i15 and i18 with partition criterion "language" and confidence ellipses
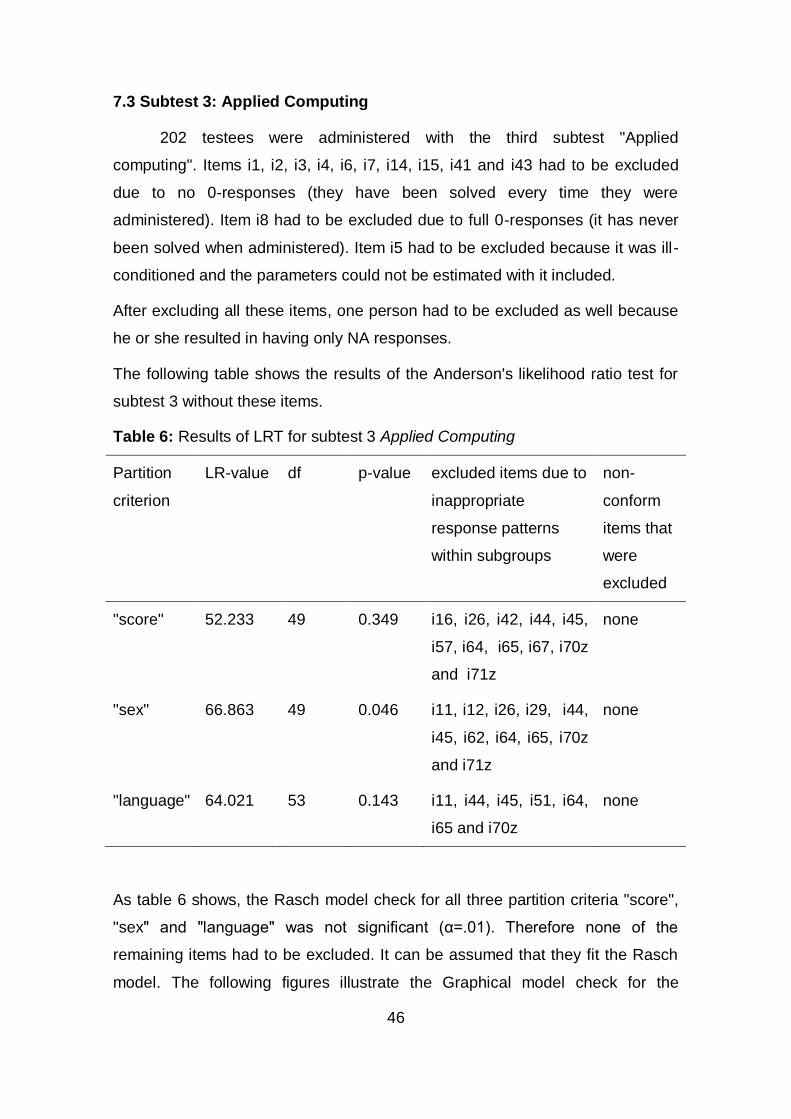
46
7.3 Subtest 3: Applied Computing
202 testees were administered with the third subtest "Applied
computing". Items i1, i2, i3, i4, i6, i7, i14, i15, i41 and i43 had to be excluded
due to no 0-responses (they have been solved every time they were
administered). Item i8 had to be excluded due to full 0-responses (it has never
been solved when administered). Item i5 had to be excluded because it was ill-
conditioned and the parameters could not be estimated with it included.
After excluding all these items, one person had to be excluded as well because
he or she resulted in having only NA responses.
The following table shows the results of the Anderson's likelihood ratio test for
subtest 3 without these items.
Table 6: Results of LRT for subtest 3 Applied Computing
Partition
criterion
LR-value df p-value excluded items due to
inappropriate
response patterns
within subgroups
non-
conform
items that
were
excluded
"score" 52.233 49 0.349 i16, i26, i42, i44, i45,
i57, i64, i65, i67, i70z
and i71z
none
"sex" 66.863 49 0.046 i11, i12, i26, i29, i44,
i45, i62, i64, i65, i70z
and i71z
none
"language" 64.021 53 0.143 i11, i44, i45, i51, i64,
i65 and i70z
none
As table 6 shows, the Rasch model check for all three partition criteria "score",
"sex" and "language" was not significant (α=.01). Therefore none of the
remaining items had to be excluded. It can be assumed that they fit the Rasch
model. The following figures illustrate the Graphical model check for the
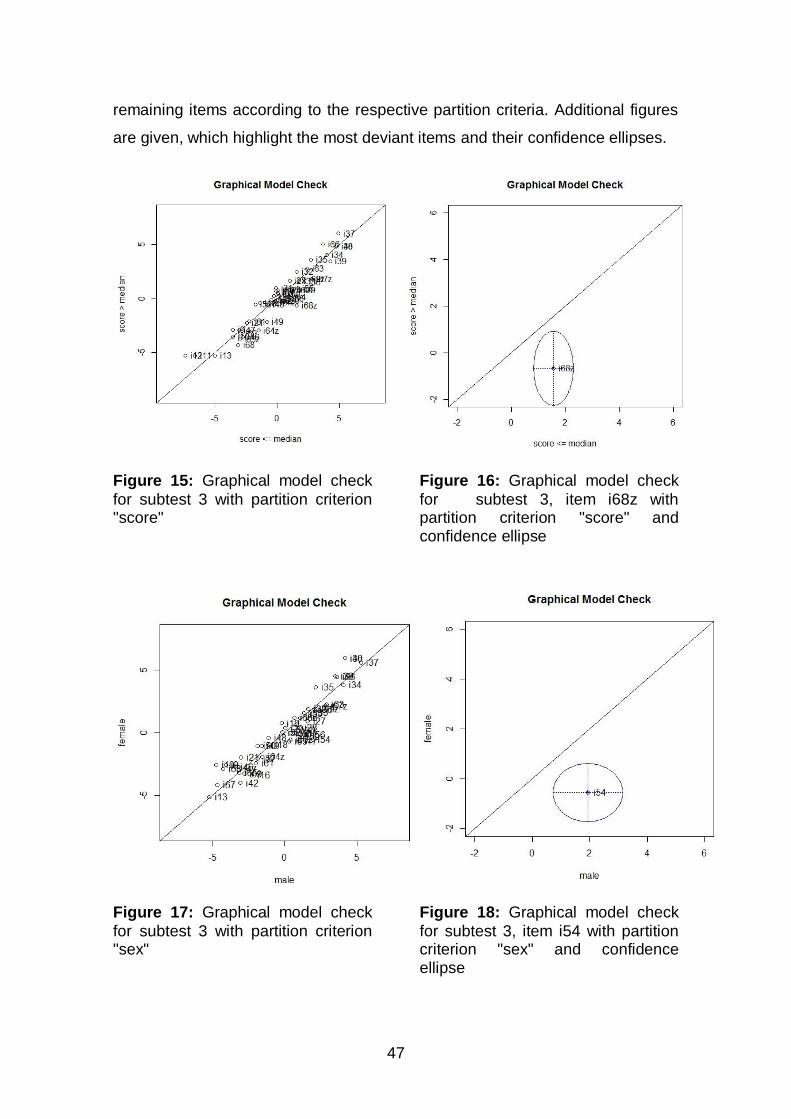
47
remaining items according to the respective partition criteria. Additional figures
are given, which highlight the most deviant items and their confidence ellipses.
Figure 15: Graphical model check
for subtest 3 with partition criterion "score"
Figure 16: Graphical model check
for subtest 3, item i68z with partition criterion "score" and confidence ellipse
Figure 17: Graphical model check
for subtest 3 with partition criterion "sex"
Figure 18: Graphical model check
for subtest 3, item i54 with partition criterion "sex" and confidence ellipse
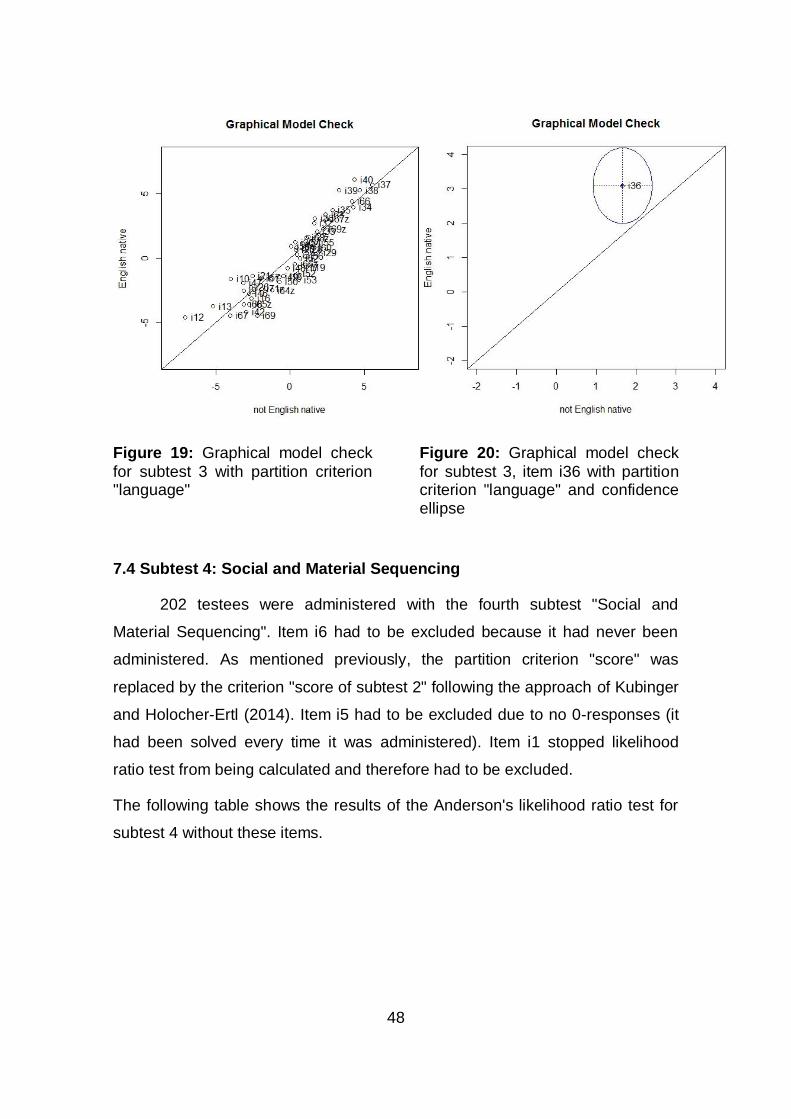
48
Figure 19: Graphical model check
for subtest 3 with partition criterion "language"
Figure 20: Graphical model check
for subtest 3, item i36 with partition criterion "language" and confidence ellipse
7.4 Subtest 4: Social and Material Sequencing
202 testees were administered with the fourth subtest "Social and
Material Sequencing". Item i6 had to be excluded because it had never been
administered. As mentioned previously, the partition criterion "score" was
replaced by the criterion "score of subtest 2" following the approach of Kubinger
and Holocher-Ertl (2014). Item i5 had to be excluded due to no 0-responses (it
had been solved every time it was administered). Item i1 stopped likelihood
ratio test from being calculated and therefore had to be excluded.
The following table shows the results of the Anderson's likelihood ratio test for
subtest 4 without these items.
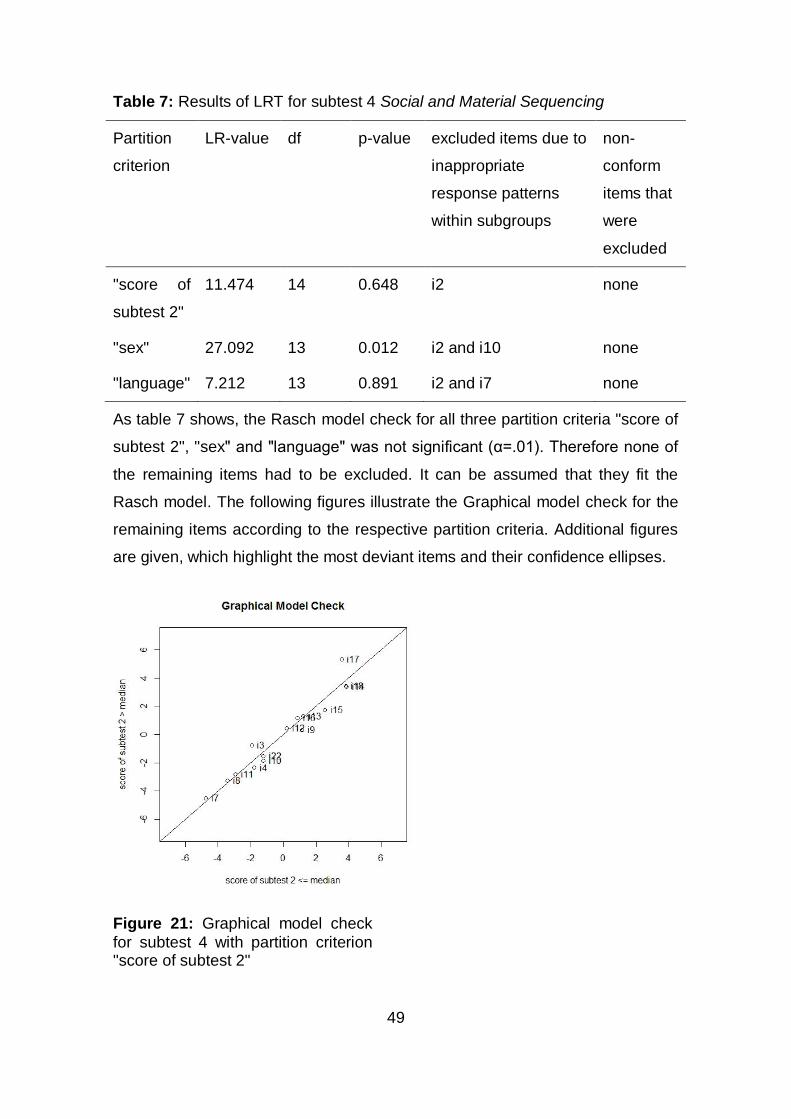
49
Table 7: Results of LRT for subtest 4 Social and Material Sequencing
Partition
criterion
LR-value df p-value excluded items due to
inappropriate
response patterns
within subgroups
non-
conform
items that
were
excluded
"score of
subtest 2"
11.474 14 0.648 i2 none
"sex" 27.092 13 0.012 i2 and i10 none
"language" 7.212 13 0.891 i2 and i7 none
As table 7 shows, the Rasch model check for all three partition criteria "score of
subtest 2", "sex" and "language" was not significant (α=.01). Therefore none of
the remaining items had to be excluded. It can be assumed that they fit the
Rasch model. The following figures illustrate the Graphical model check for the
remaining items according to the respective partition criteria. Additional figures
are given, which highlight the most deviant items and their confidence ellipses.
Figure 21: Graphical model check
for subtest 4 with partition criterion "score of subtest 2"
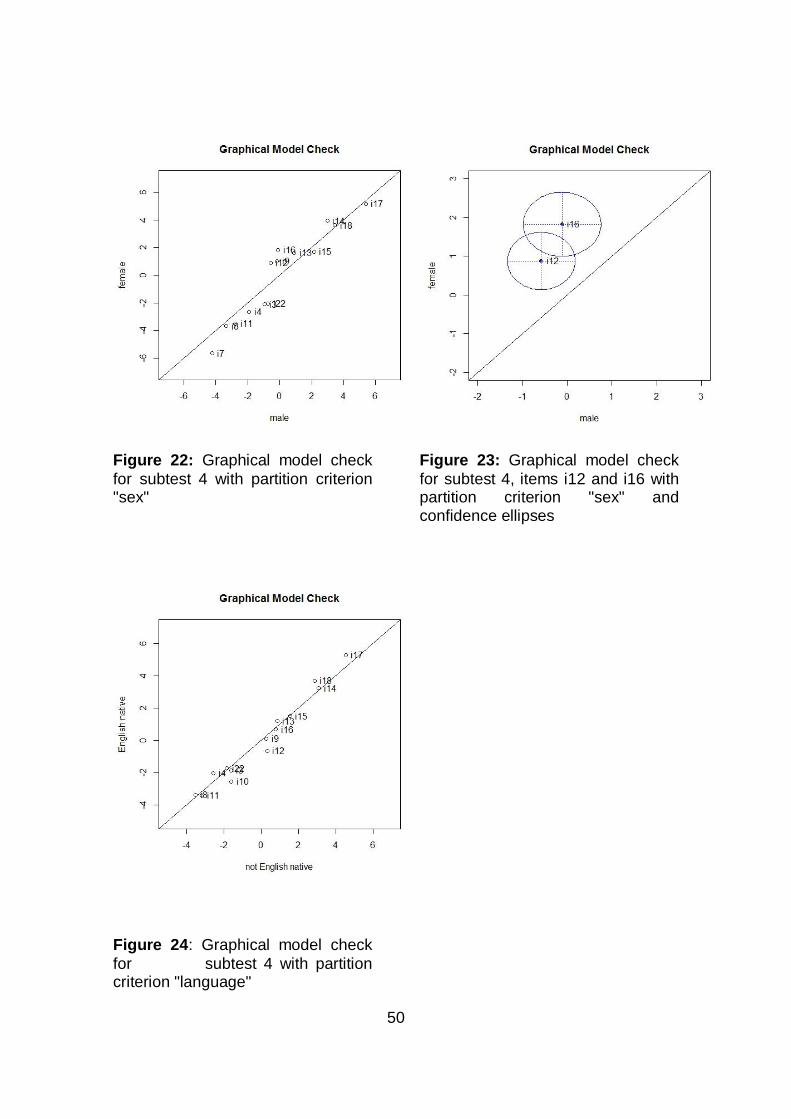
50
Figure 22: Graphical model check
for subtest 4 with partition criterion "sex"
Figure 23: Graphical model check
for subtest 4, items i12 and i16 with partition criterion "sex" and confidence ellipses
Figure 24: Graphical model check
for subtest 4 with partition criterion "language"
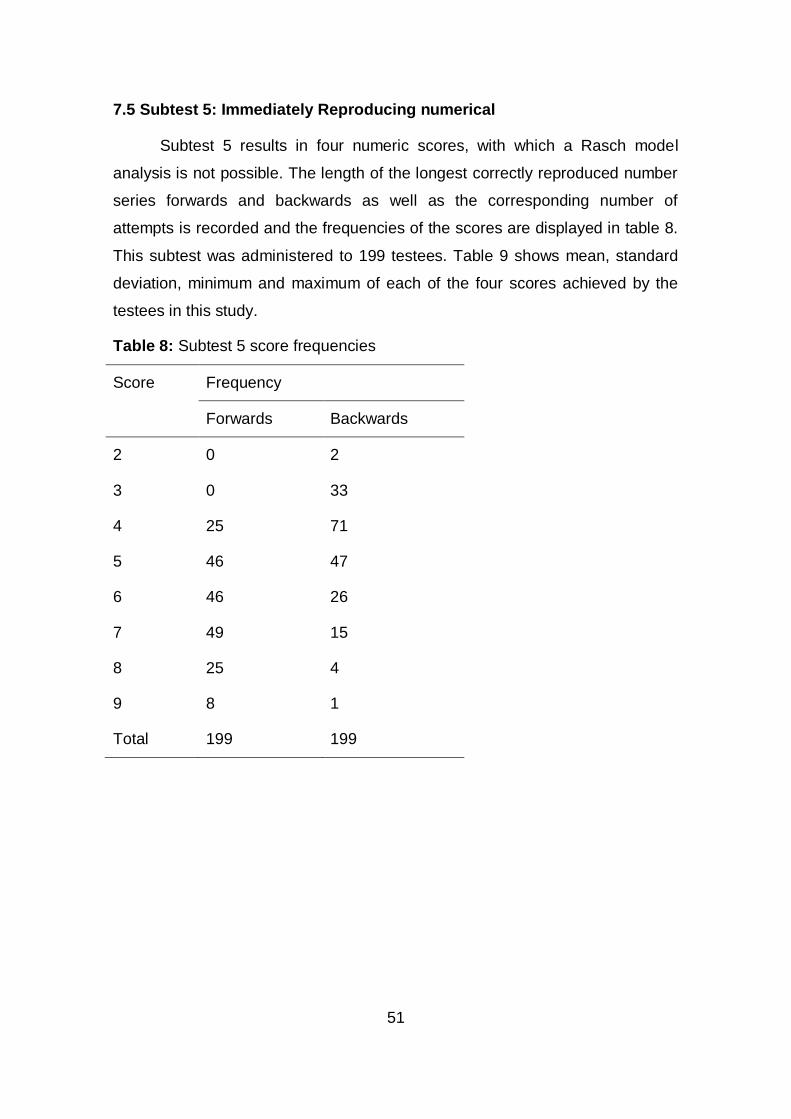
51
7.5 Subtest 5: Immediately Reproducing numerical
Subtest 5 results in four numeric scores, with which a Rasch model
analysis is not possible. The length of the longest correctly reproduced number
series forwards and backwards as well as the corresponding number of
attempts is recorded and the frequencies of the scores are displayed in table 8.
This subtest was administered to 199 testees. Table 9 shows mean, standard
deviation, minimum and maximum of each of the four scores achieved by the
testees in this study.
Table 8: Subtest 5 score frequencies
Score Frequency
Forwards Backwards
2 0 2
3 0 33
4 25 71
5 46 47
6 46 26
7 49 15
8 25 4
9 8 1
Total 199 199
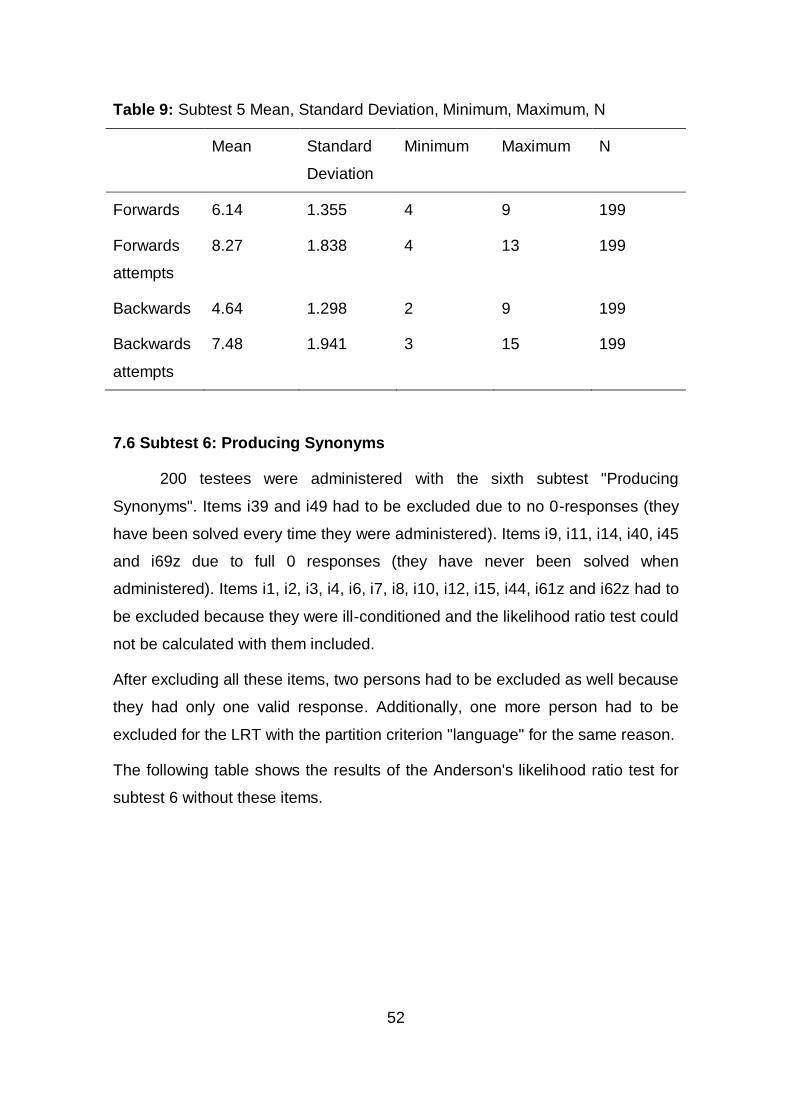
52
Table 9: Subtest 5 Mean, Standard Deviation, Minimum, Maximum, N
Mean Standard
Deviation
Minimum Maximum N
Forwards 6.14 1.355 4 9 199
Forwards
attempts
8.27 1.838 4 13 199
Backwards 4.64 1.298 2 9 199
Backwards
attempts
7.48 1.941 3 15 199
7.6 Subtest 6: Producing Synonyms
200 testees were administered with the sixth subtest "Producing
Synonyms". Items i39 and i49 had to be excluded due to no 0-responses (they
have been solved every time they were administered). Items i9, i11, i14, i40, i45
and i69z due to full 0 responses (they have never been solved when
administered). Items i1, i2, i3, i4, i6, i7, i8, i10, i12, i15, i44, i61z and i62z had to
be excluded because they were ill-conditioned and the likelihood ratio test could
not be calculated with them included.
After excluding all these items, two persons had to be excluded as well because
they had only one valid response. Additionally, one more person had to be
excluded for the LRT with the partition criterion "language" for the same reason.
The following table shows the results of the Anderson's likelihood ratio test for
subtest 6 without these items.
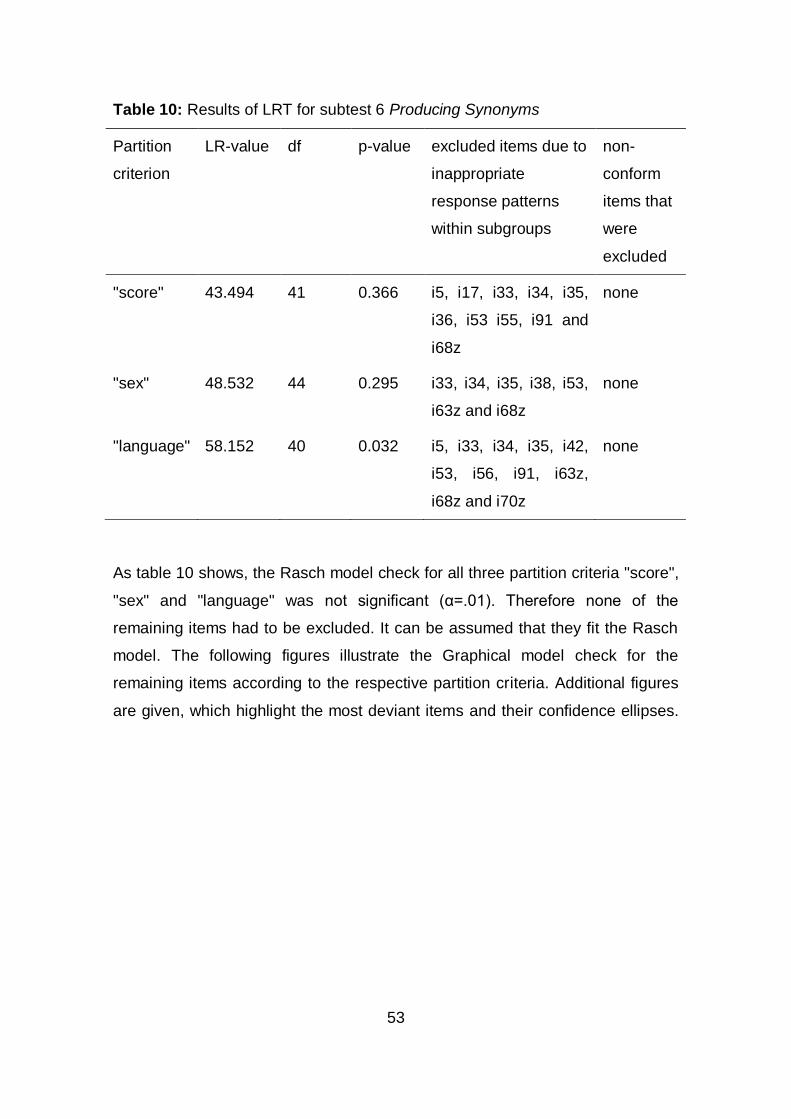
53
Table 10: Results of LRT for subtest 6 Producing Synonyms
Partition
criterion
LR-value df p-value excluded items due to
inappropriate
response patterns
within subgroups
non-
conform
items that
were
excluded
"score" 43.494 41 0.366 i5, i17, i33, i34, i35,
i36, i53 i55, i91 and
i68z
none
"sex" 48.532 44 0.295 i33, i34, i35, i38, i53,
i63z and i68z
none
"language" 58.152 40 0.032 i5, i33, i34, i35, i42,
i53, i56, i91, i63z,
i68z and i70z
none
As table 10 shows, the Rasch model check for all three partition criteria "score",
"sex" and "language" was not significant (α=.01). Therefore none of the
remaining items had to be excluded. It can be assumed that they fit the Rasch
model. The following figures illustrate the Graphical model check for the
remaining items according to the respective partition criteria. Additional figures
are given, which highlight the most deviant items and their confidence ellipses.
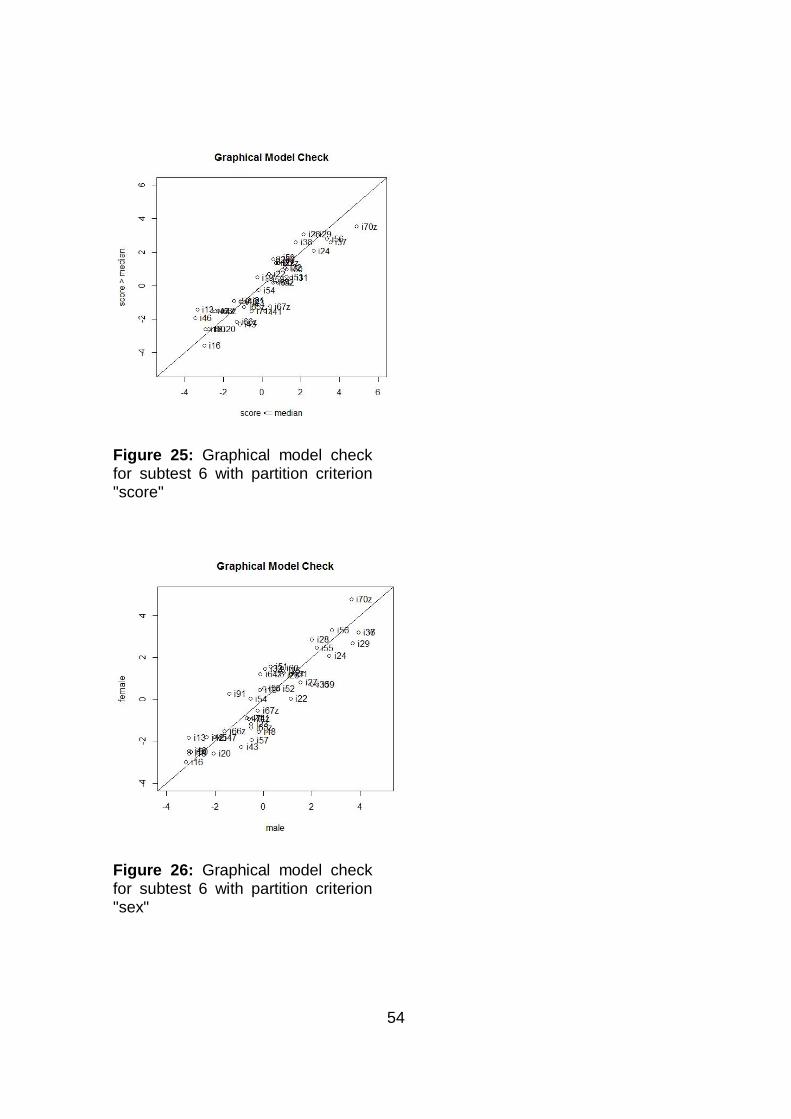
54
Figure 25: Graphical model check for subtest 6 with partition criterion "score"
Figure 26: Graphical model check for subtest 6 with partition criterion "sex"
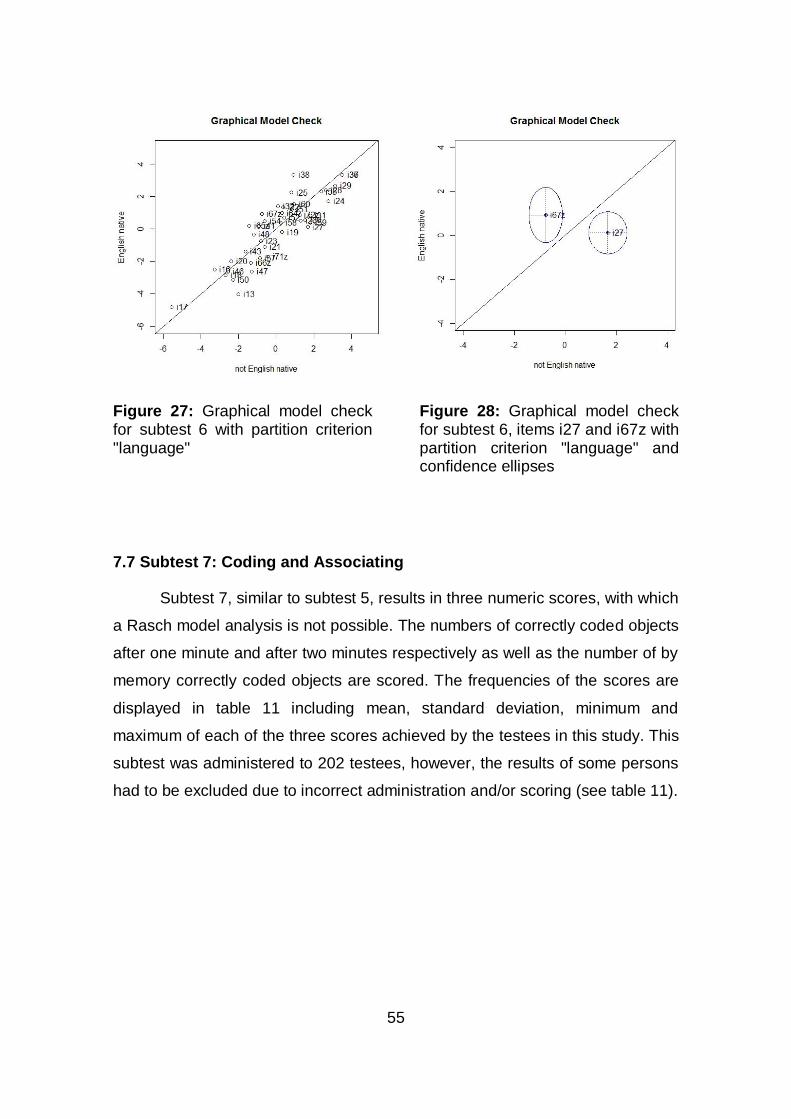
55
Figure 27: Graphical model check for subtest 6 with partition criterion "language"
Figure 28: Graphical model check for subtest 6, items i27 and i67z with partition criterion "language" and confidence ellipses
7.7 Subtest 7: Coding and Associating
Subtest 7, similar to subtest 5, results in three numeric scores, with which
a Rasch model analysis is not possible. The numbers of correctly coded objects
after one minute and after two minutes respectively as well as the number of by
memory correctly coded objects are scored. The frequencies of the scores are
displayed in table 11 including mean, standard deviation, minimum and
maximum of each of the three scores achieved by the testees in this study. This
subtest was administered to 202 testees, however, the results of some persons
had to be excluded due to incorrect administration and/or scoring (see table 11).
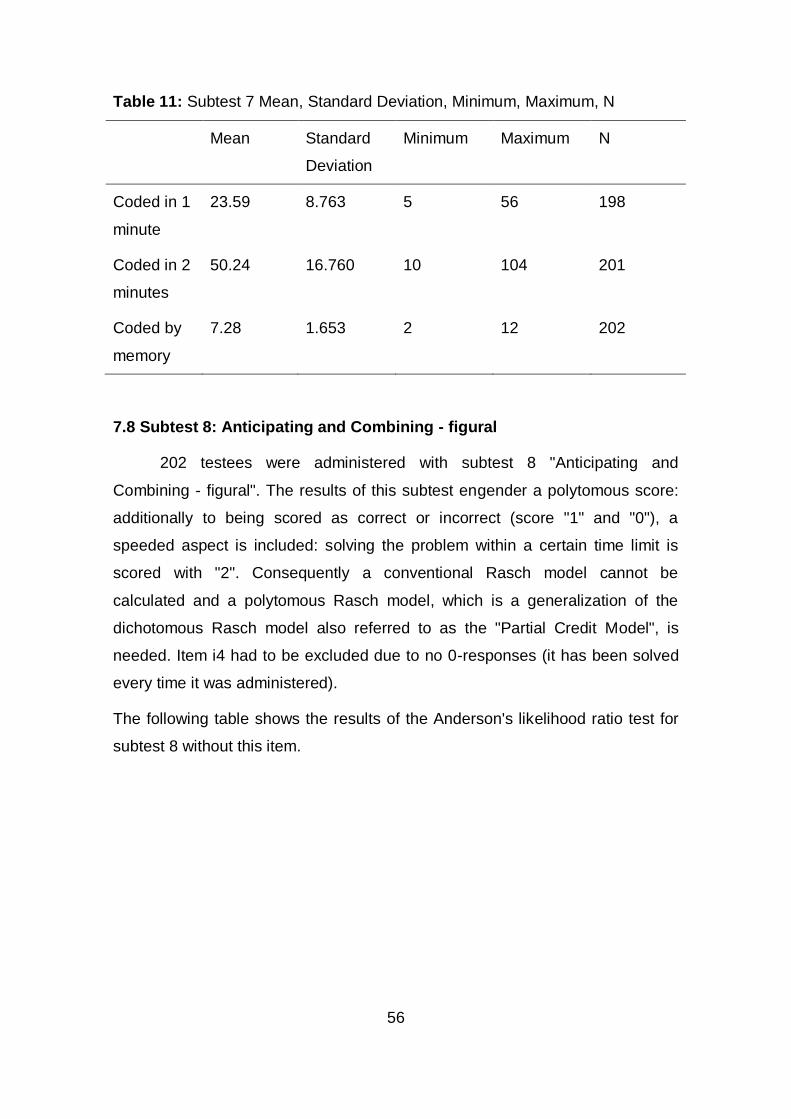
56
Table 11: Subtest 7 Mean, Standard Deviation, Minimum, Maximum, N
Mean Standard
Deviation
Minimum Maximum N
Coded in 1
minute
23.59 8.763 5 56 198
Coded in 2
minutes
50.24 16.760 10 104 201
Coded by
memory
7.28 1.653 2 12 202
7.8 Subtest 8: Anticipating and Combining - figural
202 testees were administered with subtest 8 "Anticipating and
Combining - figural". The results of this subtest engender a polytomous score:
additionally to being scored as correct or incorrect (score "1" and "0"), a
speeded aspect is included: solving the problem within a certain time limit is
scored with "2". Consequently a conventional Rasch model cannot be
calculated and a polytomous Rasch model, which is a generalization of the
dichotomous Rasch model also referred to as the "Partial Credit Model", is
needed. Item i4 had to be excluded due to no 0-responses (it has been solved
every time it was administered).
The following table shows the results of the Anderson's likelihood ratio test for
subtest 8 without this item.
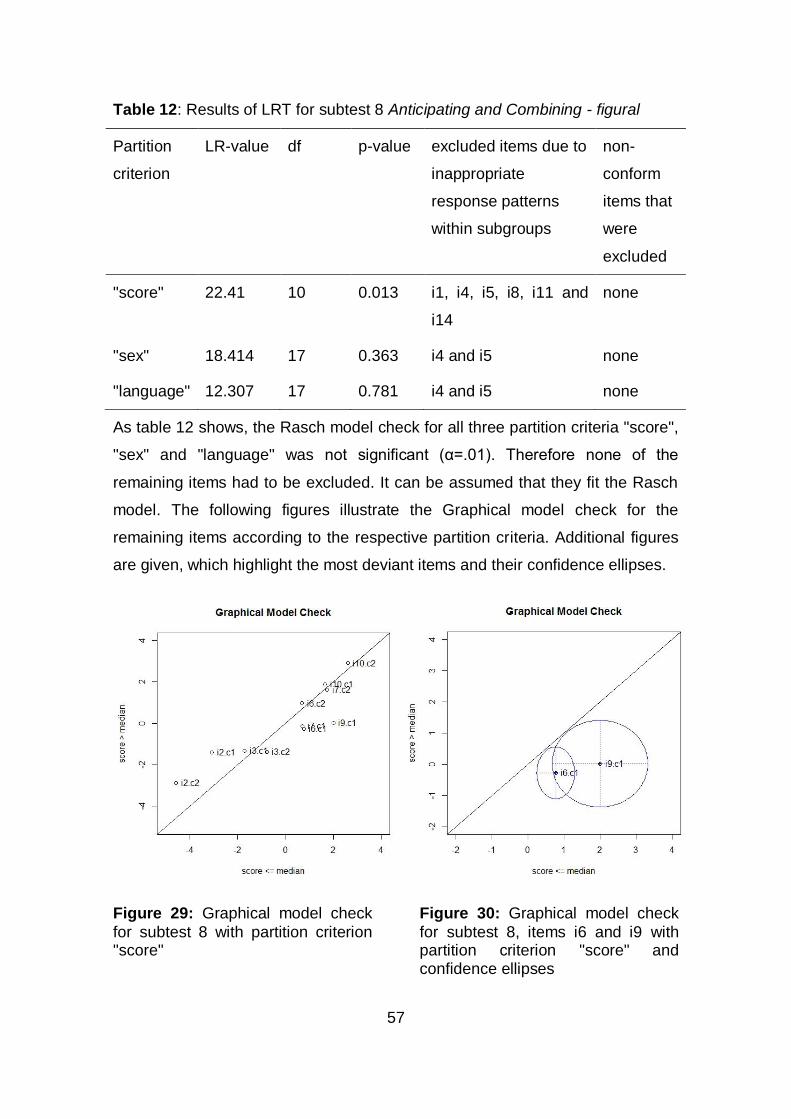
57
Table 12: Results of LRT for subtest 8 Anticipating and Combining - figural
Partition
criterion
LR-value df p-value excluded items due to
inappropriate
response patterns
within subgroups
non-
conform
items that
were
excluded
"score" 22.41 10 0.013 i1, i4, i5, i8, i11 and
i14
none
"sex" 18.414 17 0.363 i4 and i5 none
"language" 12.307 17 0.781 i4 and i5 none
As table 12 shows, the Rasch model check for all three partition criteria "score",
"sex" and "language" was not significant (α=.01). Therefore none of the
remaining items had to be excluded. It can be assumed that they fit the Rasch
model. The following figures illustrate the Graphical model check for the
remaining items according to the respective partition criteria. Additional figures
are given, which highlight the most deviant items and their confidence ellipses.
Figure 29: Graphical model check
for subtest 8 with partition criterion "score"
Figure 30: Graphical model check
for subtest 8, items i6 and i9 with partition criterion "score" and confidence ellipses
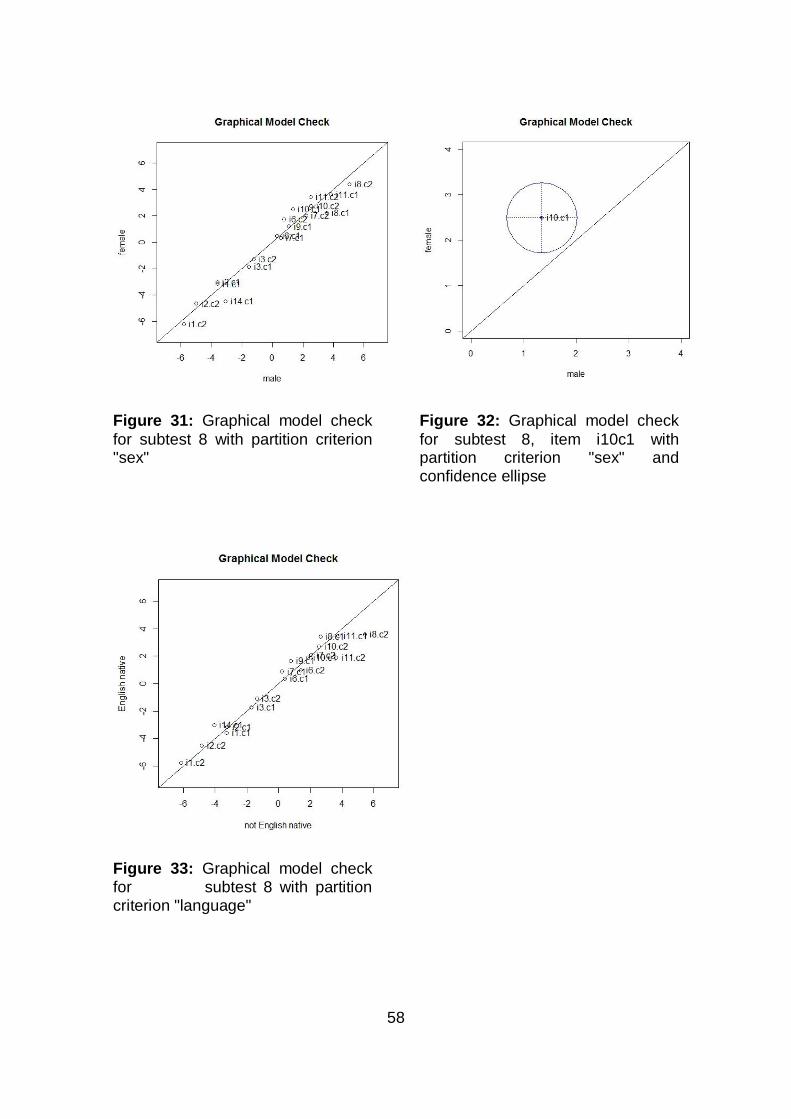
58
Figure 31: Graphical model check
for subtest 8 with partition criterion "sex"
Figure 32: Graphical model check
for subtest 8, item i10c1 with partition criterion "sex" and confidence ellipse
Figure 33: Graphical model check for subtest 8 with partition criterion "language"
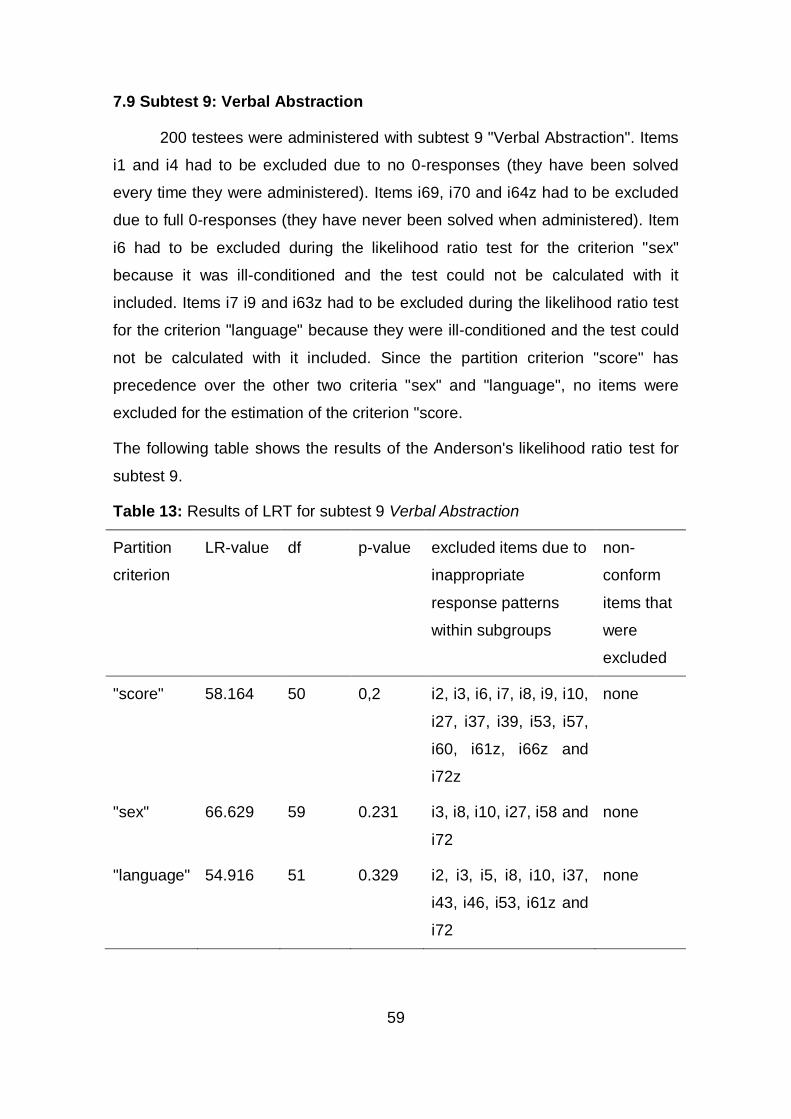
59
7.9 Subtest 9: Verbal Abstraction
200 testees were administered with subtest 9 "Verbal Abstraction". Items
i1 and i4 had to be excluded due to no 0-responses (they have been solved
every time they were administered). Items i69, i70 and i64z had to be excluded
due to full 0-responses (they have never been solved when administered). Item
i6 had to be excluded during the likelihood ratio test for the criterion "sex"
because it was ill-conditioned and the test could not be calculated with it
included. Items i7 i9 and i63z had to be excluded during the likelihood ratio test
for the criterion "language" because they were ill-conditioned and the test could
not be calculated with it included. Since the partition criterion "score" has
precedence over the other two criteria "sex" and "language", no items were
excluded for the estimation of the criterion "score.
The following table shows the results of the Anderson's likelihood ratio test for
subtest 9.
Table 13: Results of LRT for subtest 9 Verbal Abstraction
Partition
criterion
LR-value df p-value excluded items due to
inappropriate
response patterns
within subgroups
non-
conform
items that
were
excluded
"score" 58.164 50 0,2 i2, i3, i6, i7, i8, i9, i10,
i27, i37, i39, i53, i57,
i60, i61z, i66z and
i72z
none
"sex" 66.629 59 0.231 i3, i8, i10, i27, i58 and
i72
none
"language" 54.916 51 0.329 i2, i3, i5, i8, i10, i37,
i43, i46, i53, i61z and
i72
none
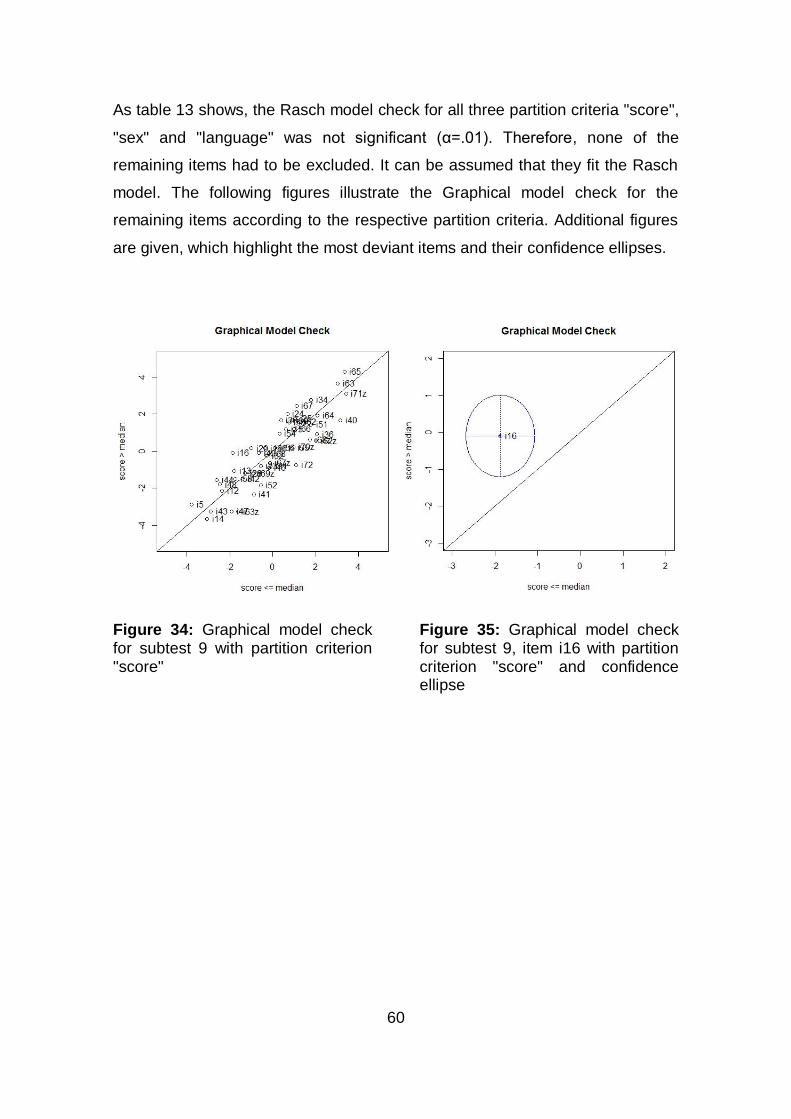
60
As table 13 shows, the Rasch model check for all three partition criteria "score",
"sex" and "language" was not significant (α=.01). Therefore, none of the
remaining items had to be excluded. It can be assumed that they fit the Rasch
model. The following figures illustrate the Graphical model check for the
remaining items according to the respective partition criteria. Additional figures
are given, which highlight the most deviant items and their confidence ellipses.
Figure 34: Graphical model check for subtest 9 with partition criterion "score"
Figure 35: Graphical model check for subtest 9, item i16 with partition criterion "score" and confidence ellipse
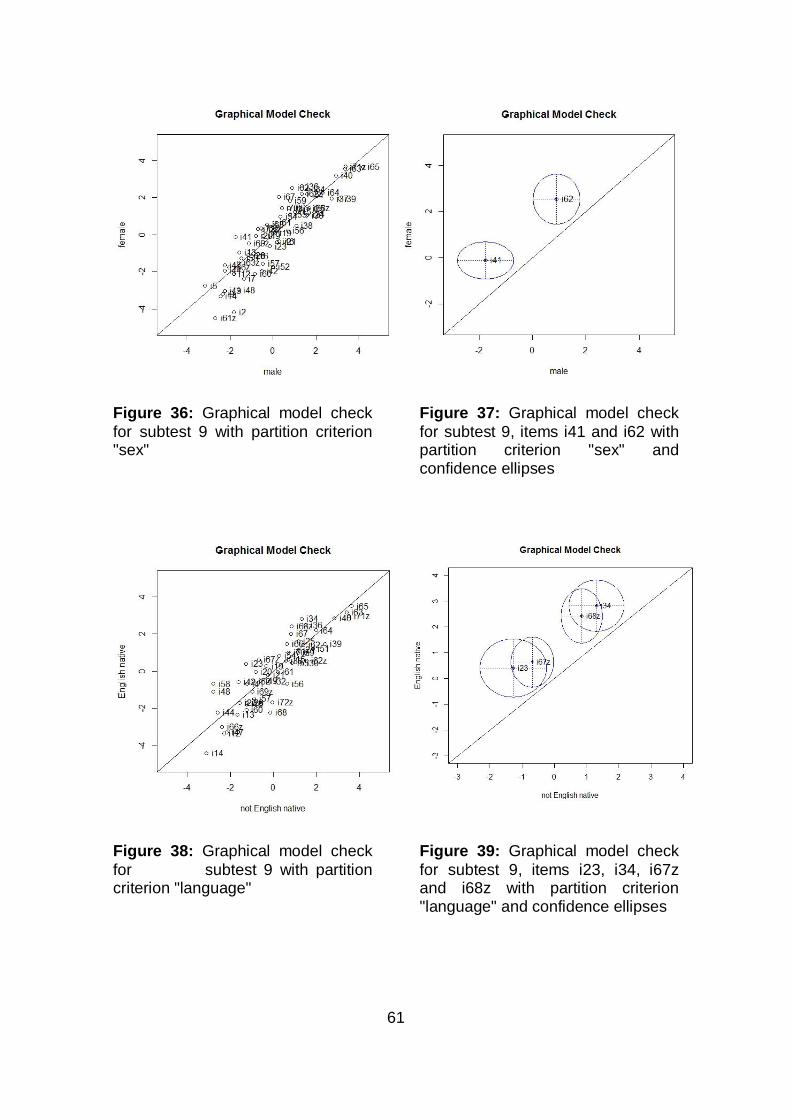
61
Figure 36: Graphical model check
for subtest 9 with partition criterion "sex"
Figure 37: Graphical model check
for subtest 9, items i41 and i62 with partition criterion "sex" and confidence ellipses
Figure 38: Graphical model check
for subtest 9 with partition criterion "language"
Figure 39: Graphical model check
for subtest 9, items i23, i34, i67z and i68z with partition criterion "language" and confidence ellipses
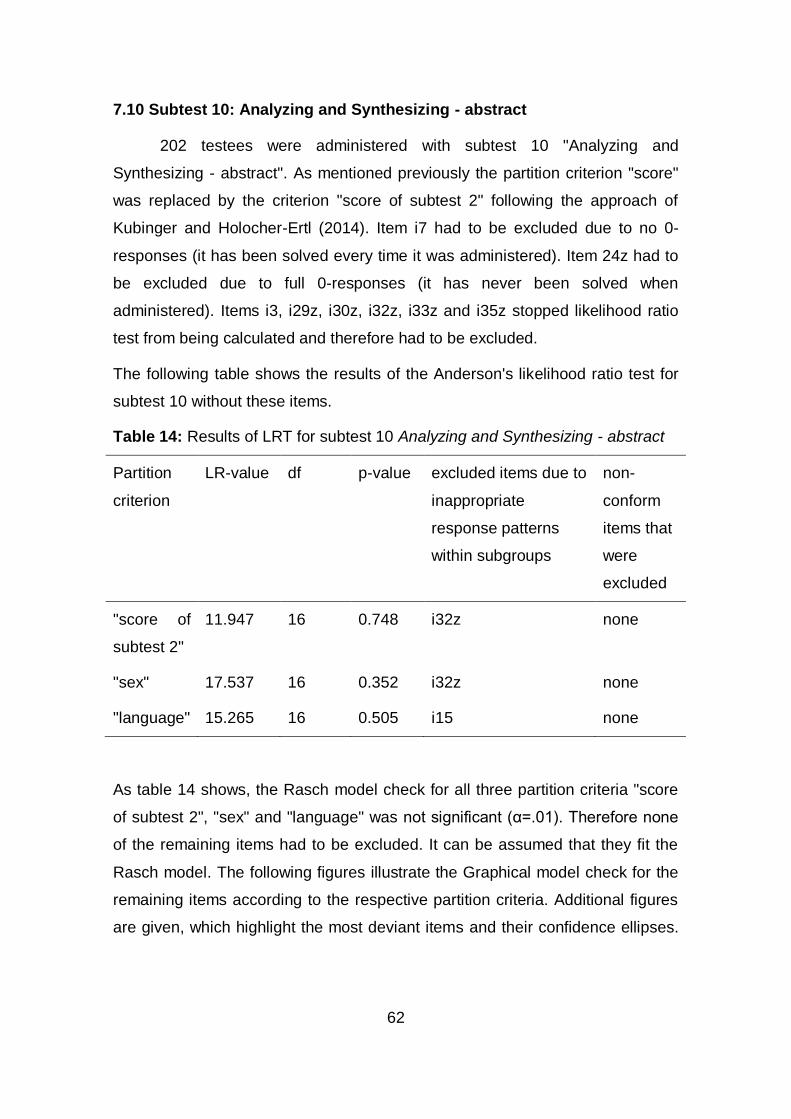
62
7.10 Subtest 10: Analyzing and Synthesizing - abstract
202 testees were administered with subtest 10 "Analyzing and
Synthesizing - abstract". As mentioned previously the partition criterion "score"
was replaced by the criterion "score of subtest 2" following the approach of
Kubinger and Holocher-Ertl (2014). Item i7 had to be excluded due to no 0-
responses (it has been solved every time it was administered). Item 24z had to
be excluded due to full 0-responses (it has never been solved when
administered). Items i3, i29z, i30z, i32z, i33z and i35z stopped likelihood ratio
test from being calculated and therefore had to be excluded.
The following table shows the results of the Anderson's likelihood ratio test for
subtest 10 without these items.
Table 14: Results of LRT for subtest 10 Analyzing and Synthesizing - abstract
Partition
criterion
LR-value df p-value excluded items due to
inappropriate
response patterns
within subgroups
non-
conform
items that
were
excluded
"score of
subtest 2"
11.947 16 0.748 i32z none
"sex" 17.537 16 0.352 i32z none
"language" 15.265 16 0.505 i15 none
As table 14 shows, the Rasch model check for all three partition criteria "score
of subtest 2", "sex" and "language" was not significant (α=.01). Therefore none
of the remaining items had to be excluded. It can be assumed that they fit the
Rasch model. The following figures illustrate the Graphical model check for the
remaining items according to the respective partition criteria. Additional figures
are given, which highlight the most deviant items and their confidence ellipses.
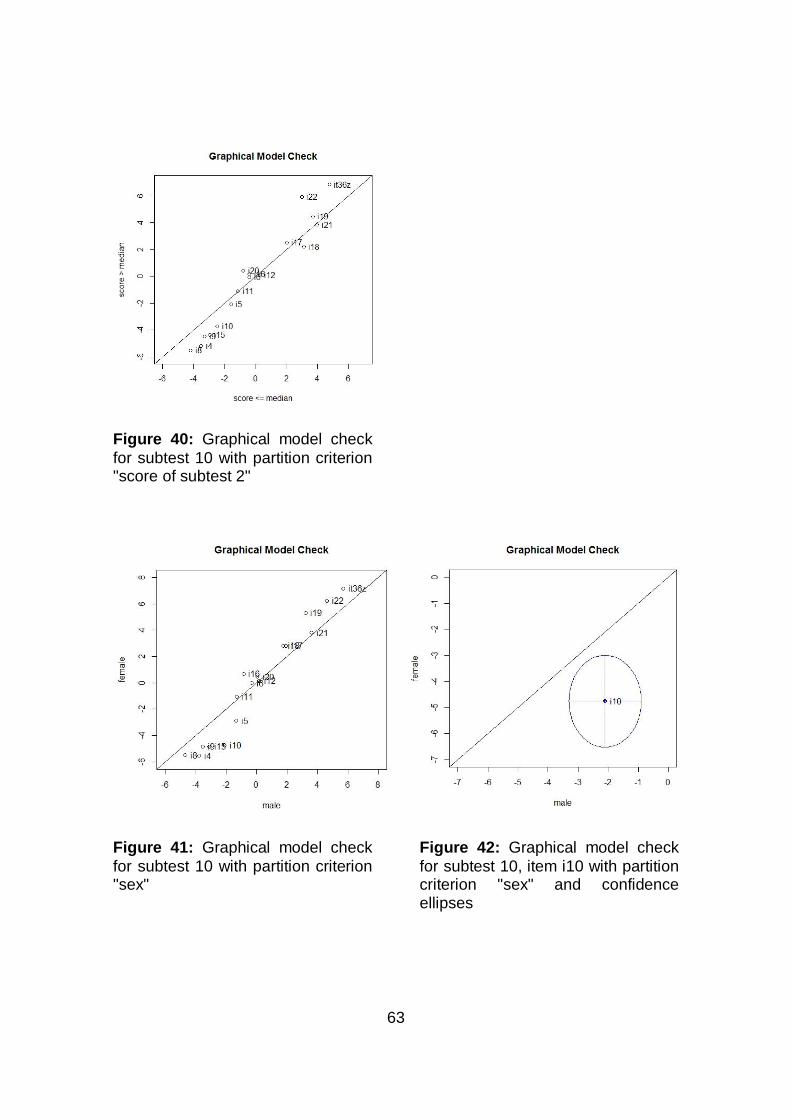
63
Figure 40: Graphical model check
for subtest 10 with partition criterion "score of subtest 2"
Figure 41: Graphical model check
for subtest 10 with partition criterion "sex"
Figure 42: Graphical model check
for subtest 10, item i10 with partition criterion "sex" and confidence ellipses
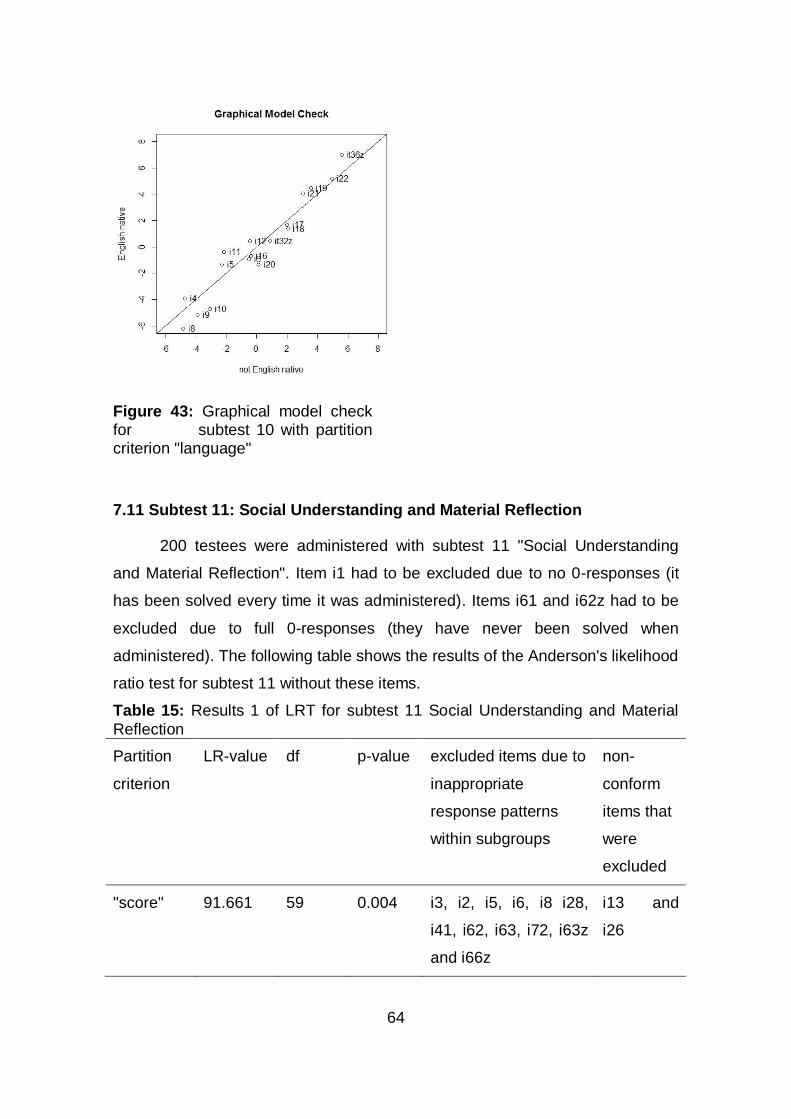
64
Figure 43: Graphical model check for subtest 10 with partition criterion "language"
7.11 Subtest 11: Social Understanding and Material Reflection
200 testees were administered with subtest 11 "Social Understanding
and Material Reflection". Item i1 had to be excluded due to no 0-responses (it
has been solved every time it was administered). Items i61 and i62z had to be
excluded due to full 0-responses (they have never been solved when
administered). The following table shows the results of the Anderson's likelihood
ratio test for subtest 11 without these items.
Table 15: Results 1 of LRT for subtest 11 Social Understanding and Material
Reflection
Partition
criterion
LR-value df p-value excluded items due to
inappropriate
response patterns
within subgroups
non-
conform
items that
were
excluded
"score" 91.661 59 0.004 i3, i2, i5, i6, i8 i28,
i41, i62, i63, i72, i63z
and i66z
i13 and
i26
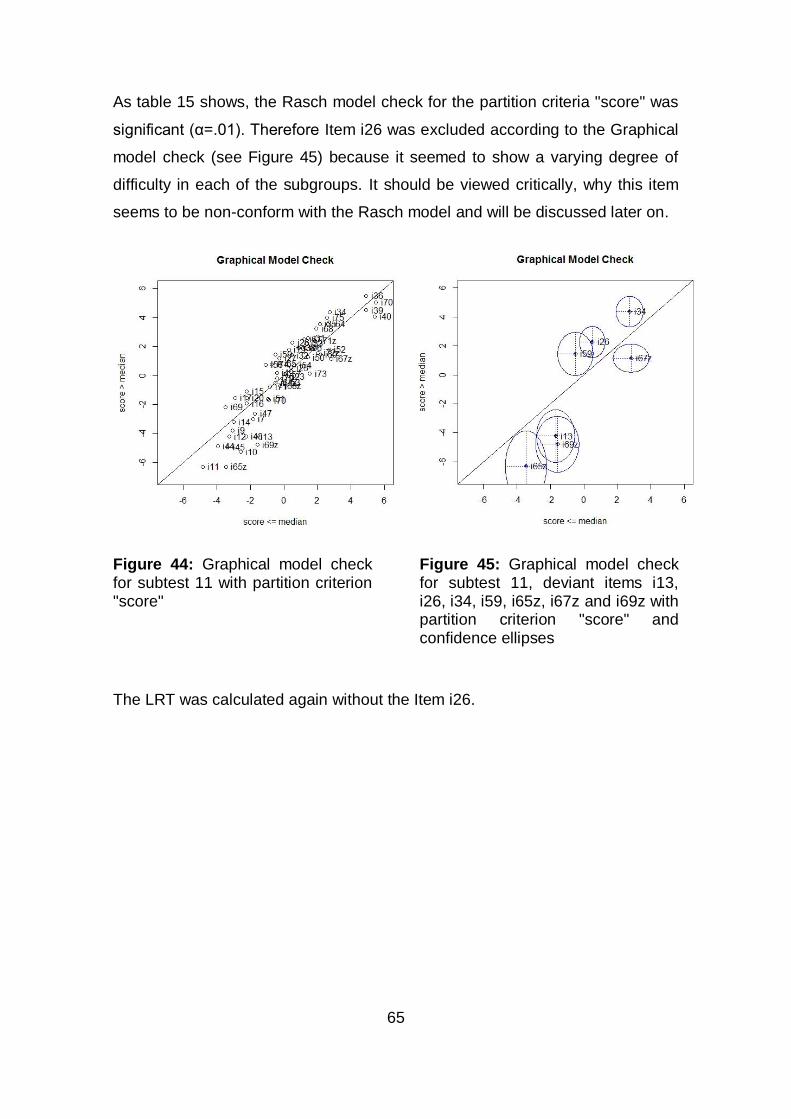
65
As table 15 shows, the Rasch model check for the partition criteria "score" was
significant (α=.01). Therefore Item i26 was excluded according to the Graphical
model check (see Figure 45) because it seemed to show a varying degree of
difficulty in each of the subgroups. It should be viewed critically, why this item
seems to be non-conform with the Rasch model and will be discussed later on.
Figure 44: Graphical model check for subtest 11 with partition criterion "score"
Figure 45: Graphical model check for subtest 11, deviant items i13, i26, i34, i59, i65z, i67z and i69z with partition criterion "score" and confidence ellipses
The LRT was calculated again without the Item i26.
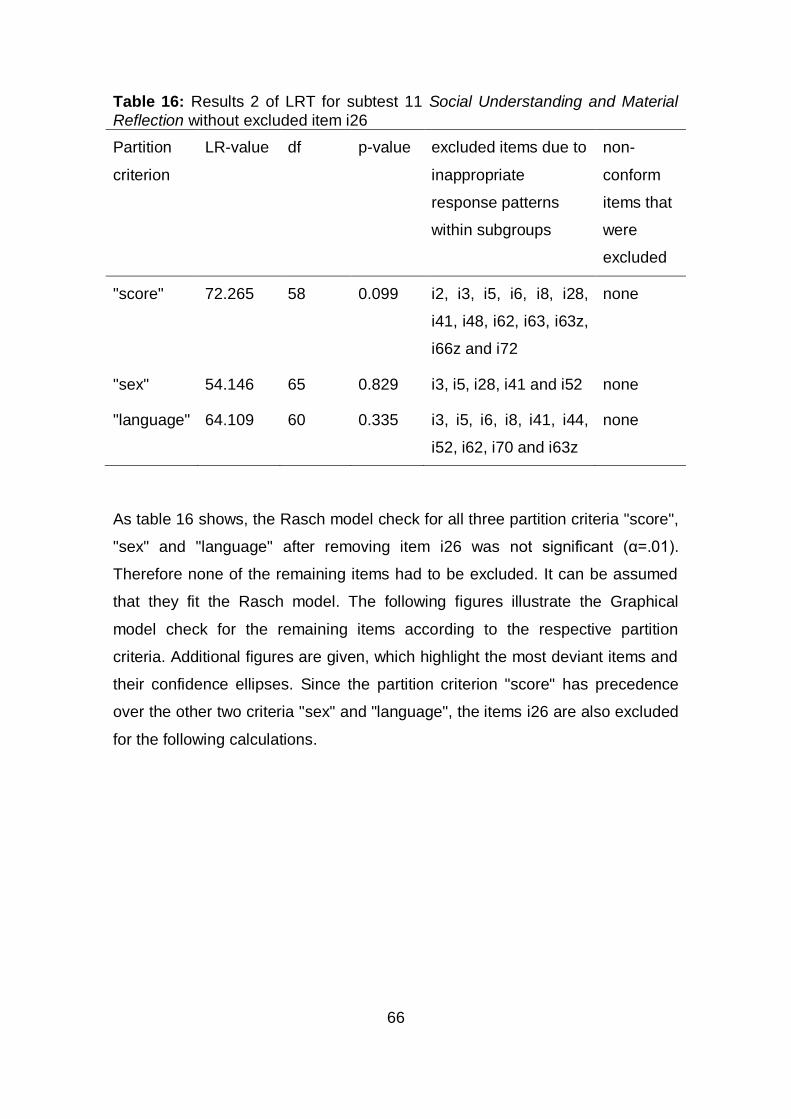
66
Table 16: Results 2 of LRT for subtest 11 Social Understanding and Material
Reflection without excluded item i26
Partition
criterion
LR-value df p-value excluded items due to
inappropriate
response patterns
within subgroups
non-
conform
items that
were
excluded
"score" 72.265 58 0.099 i2, i3, i5, i6, i8, i28,
i41, i48, i62, i63, i63z,
i66z and i72
none
"sex" 54.146 65 0.829 i3, i5, i28, i41 and i52 none
"language" 64.109 60 0.335 i3, i5, i6, i8, i41, i44,
i52, i62, i70 and i63z
none
As table 16 shows, the Rasch model check for all three partition criteria "score",
"sex" and "language" after removing item i26 was not significant (α=.01).
Therefore none of the remaining items had to be excluded. It can be assumed
that they fit the Rasch model. The following figures illustrate the Graphical
model check for the remaining items according to the respective partition
criteria. Additional figures are given, which highlight the most deviant items and
their confidence ellipses. Since the partition criterion "score" has precedence
over the other two criteria "sex" and "language", the items i26 are also excluded
for the following calculations.
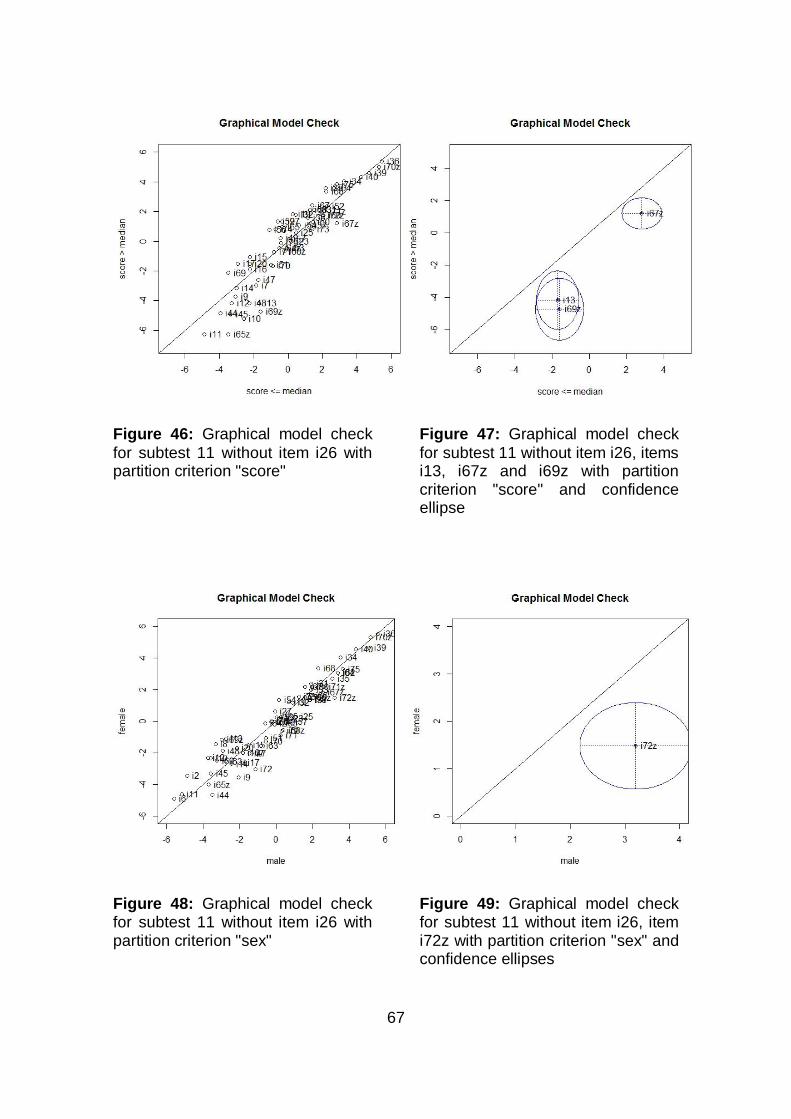
67
Figure 46: Graphical model check
for subtest 11 without item i26 with partition criterion "score"
Figure 47: Graphical model check
for subtest 11 without item i26, items i13, i67z and i69z with partition criterion "score" and confidence ellipse
Figure 48: Graphical model check for subtest 11 without item i26 with partition criterion "sex"
Figure 49: Graphical model check for subtest 11 without item i26, item i72z with partition criterion "sex" and confidence ellipses
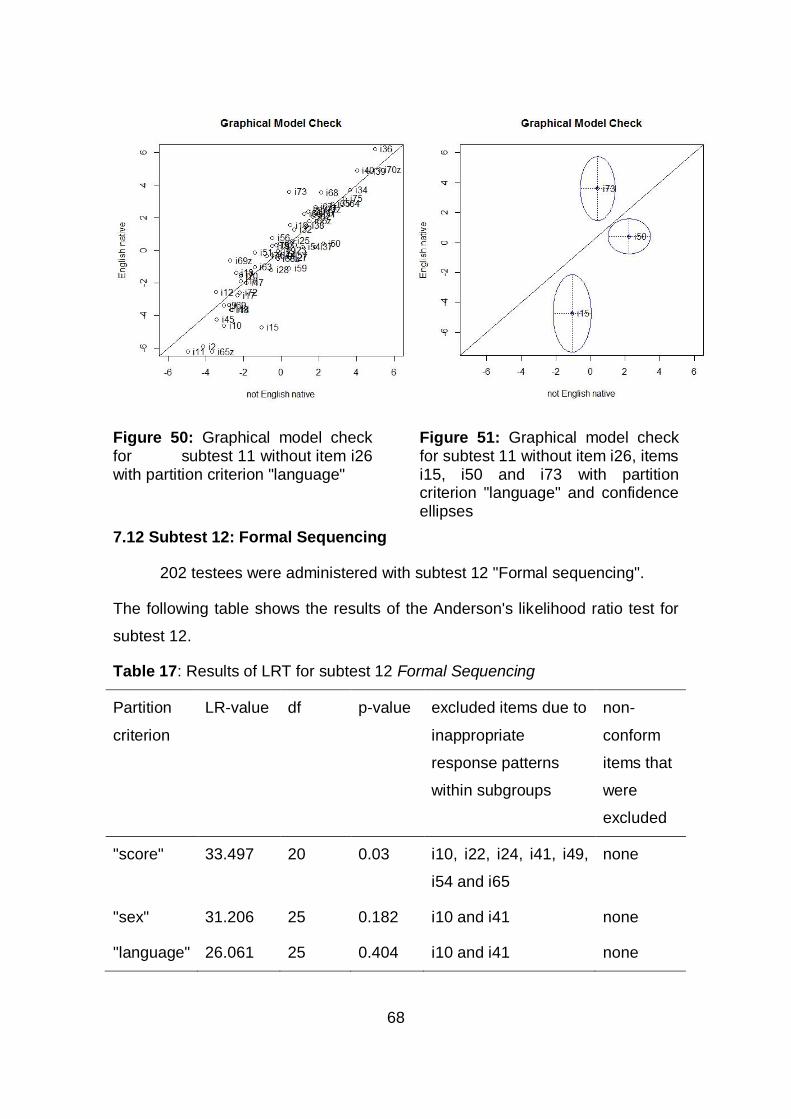
68
Figure 50: Graphical model check for subtest 11 without item i26 with partition criterion "language"
Figure 51: Graphical model check for subtest 11 without item i26, items i15, i50 and i73 with partition criterion "language" and confidence ellipses
7.12 Subtest 12: Formal Sequencing
202 testees were administered with subtest 12 "Formal sequencing".
The following table shows the results of the Anderson's likelihood ratio test for
subtest 12.
Table 17: Results of LRT for subtest 12 Formal Sequencing
Partition
criterion
LR-value df p-value excluded items due to
inappropriate
response patterns
within subgroups
non-
conform
items that
were
excluded
"score" 33.497 20 0.03 i10, i22, i24, i41, i49,
i54 and i65
none
"sex" 31.206 25 0.182 i10 and i41 none
"language" 26.061 25 0.404 i10 and i41 none
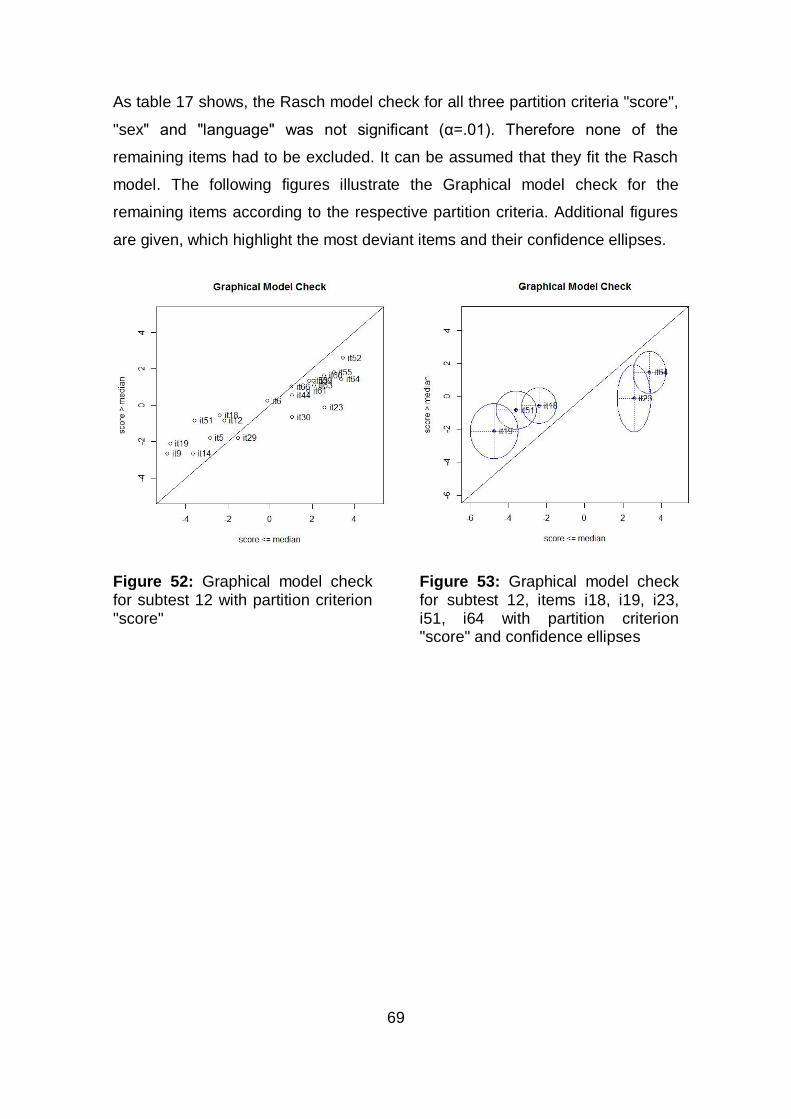
69
As table 17 shows, the Rasch model check for all three partition criteria "score",
"sex" and "language" was not significant (α=.01). Therefore none of the
remaining items had to be excluded. It can be assumed that they fit the Rasch
model. The following figures illustrate the Graphical model check for the
remaining items according to the respective partition criteria. Additional figures
are given, which highlight the most deviant items and their confidence ellipses.
Figure 52: Graphical model check for subtest 12 with partition criterion "score"
Figure 53: Graphical model check for subtest 12, items i18, i19, i23, i51, i64 with partition criterion "score" and confidence ellipses
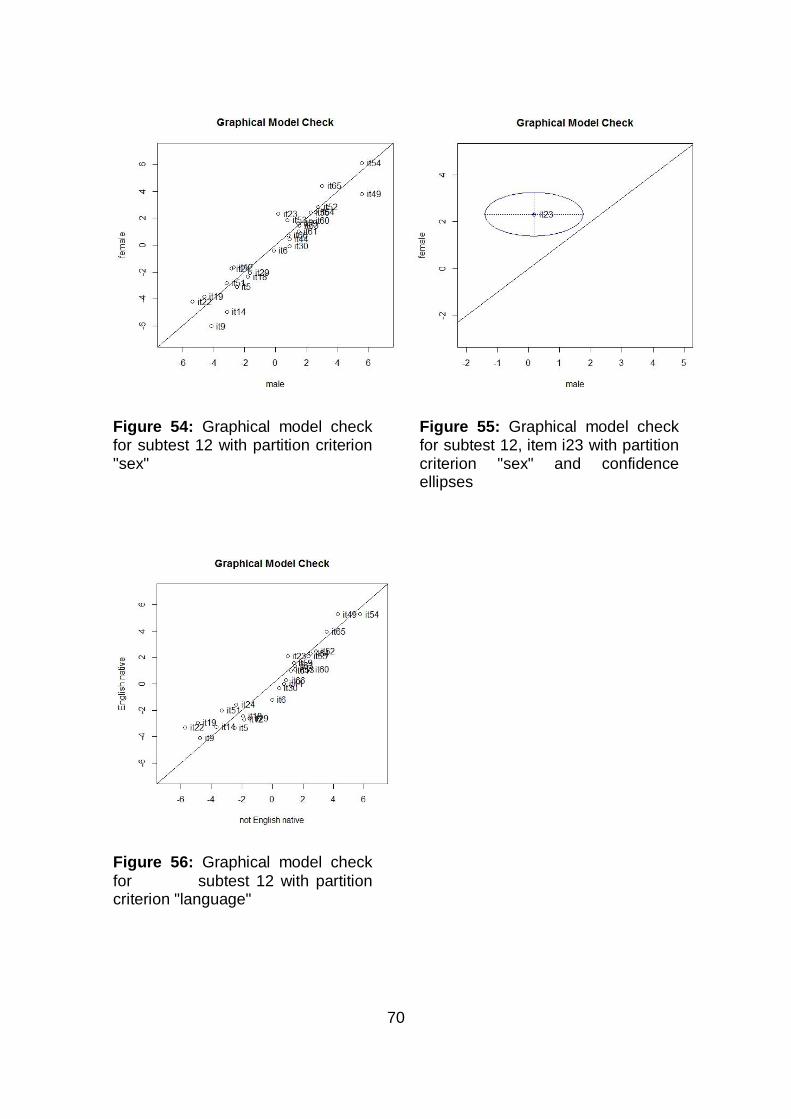
70
Figure 54: Graphical model check for subtest 12 with partition criterion "sex"
Figure 55: Graphical model check for subtest 12, item i23 with partition criterion "sex" and confidence ellipses
Figure 56: Graphical model check
for subtest 12 with partition criterion "language"
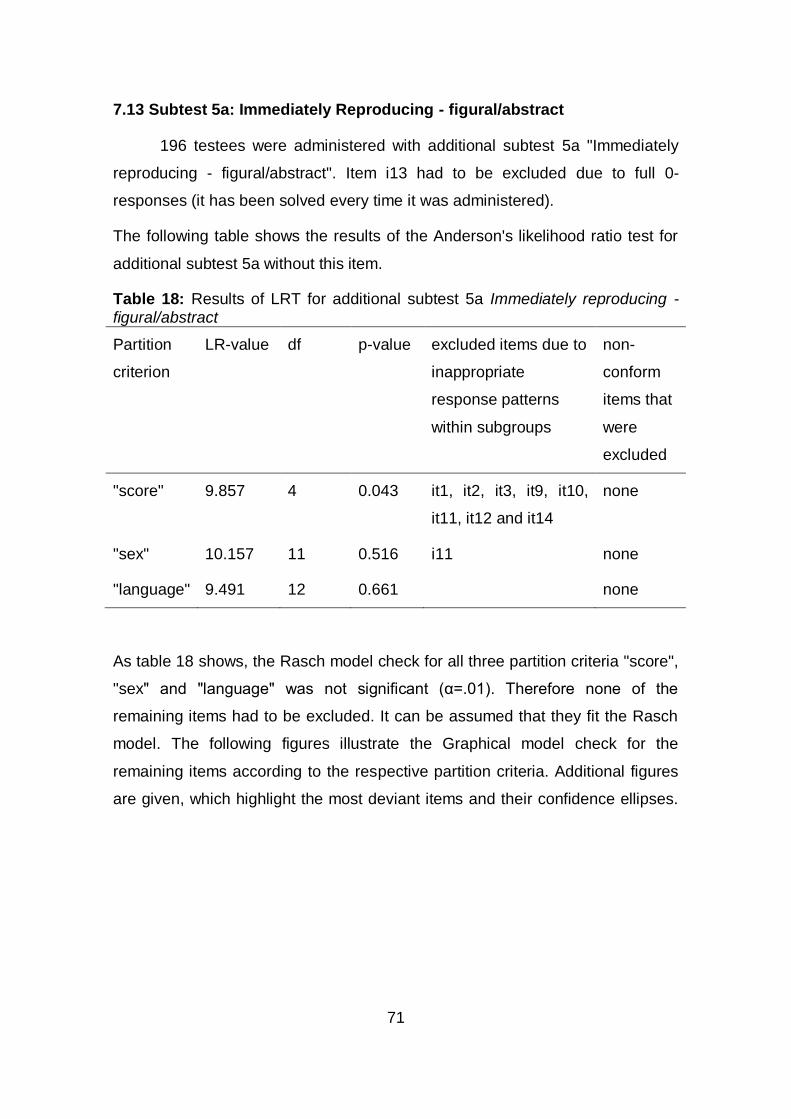
71
7.13 Subtest 5a: Immediately Reproducing - figural/abstract
196 testees were administered with additional subtest 5a "Immediately
reproducing - figural/abstract". Item i13 had to be excluded due to full 0-
responses (it has been solved every time it was administered).
The following table shows the results of the Anderson's likelihood ratio test for
additional subtest 5a without this item.
Table 18: Results of LRT for additional subtest 5a Immediately reproducing - figural/abstract
Partition
criterion
LR-value df p-value excluded items due to
inappropriate
response patterns
within subgroups
non-
conform
items that
were
excluded
"score" 9.857 4 0.043 it1, it2, it3, it9, it10,
it11, it12 and it14
none
"sex" 10.157 11 0.516 i11 none
"language" 9.491 12 0.661 none
As table 18 shows, the Rasch model check for all three partition criteria "score",
"sex" and "language" was not significant (α=.01). Therefore none of the
remaining items had to be excluded. It can be assumed that they fit the Rasch
model. The following figures illustrate the Graphical model check for the
remaining items according to the respective partition criteria. Additional figures
are given, which highlight the most deviant items and their confidence ellipses.
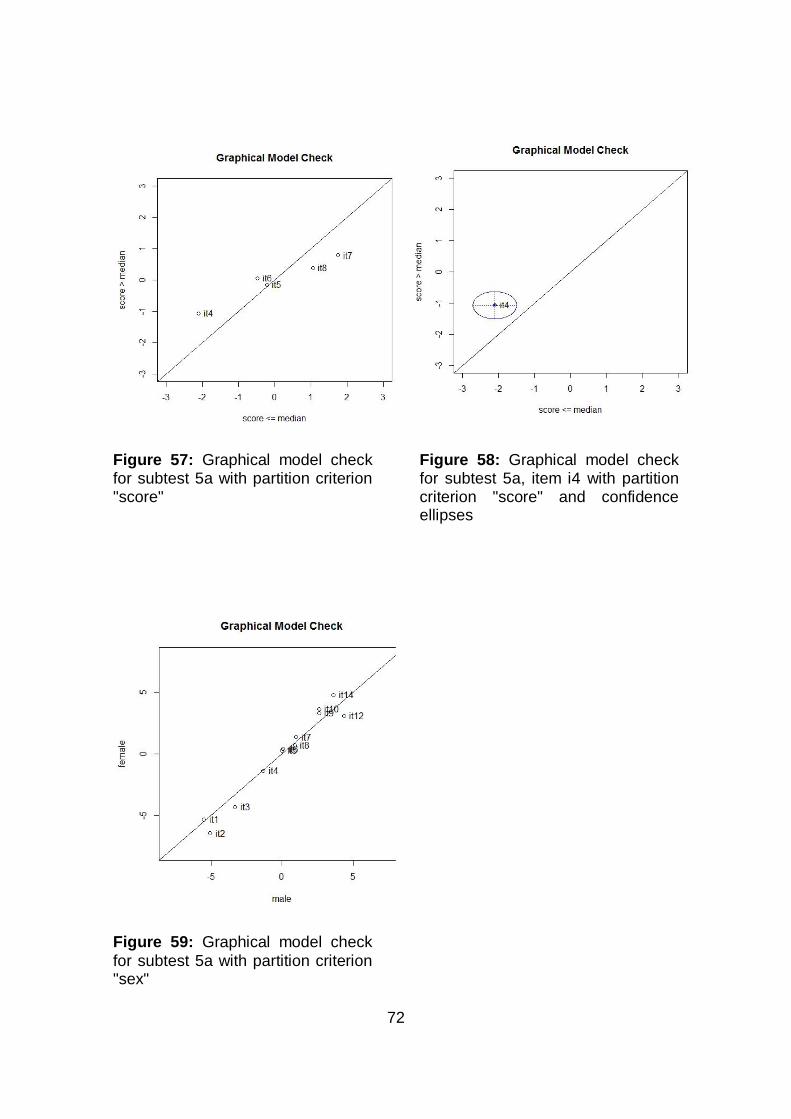
72
Figure 57: Graphical model check for subtest 5a with partition criterion "score"
Figure 58: Graphical model check for subtest 5a, item i4 with partition criterion "score" and confidence ellipses
Figure 59: Graphical model check
for subtest 5a with partition criterion "sex"
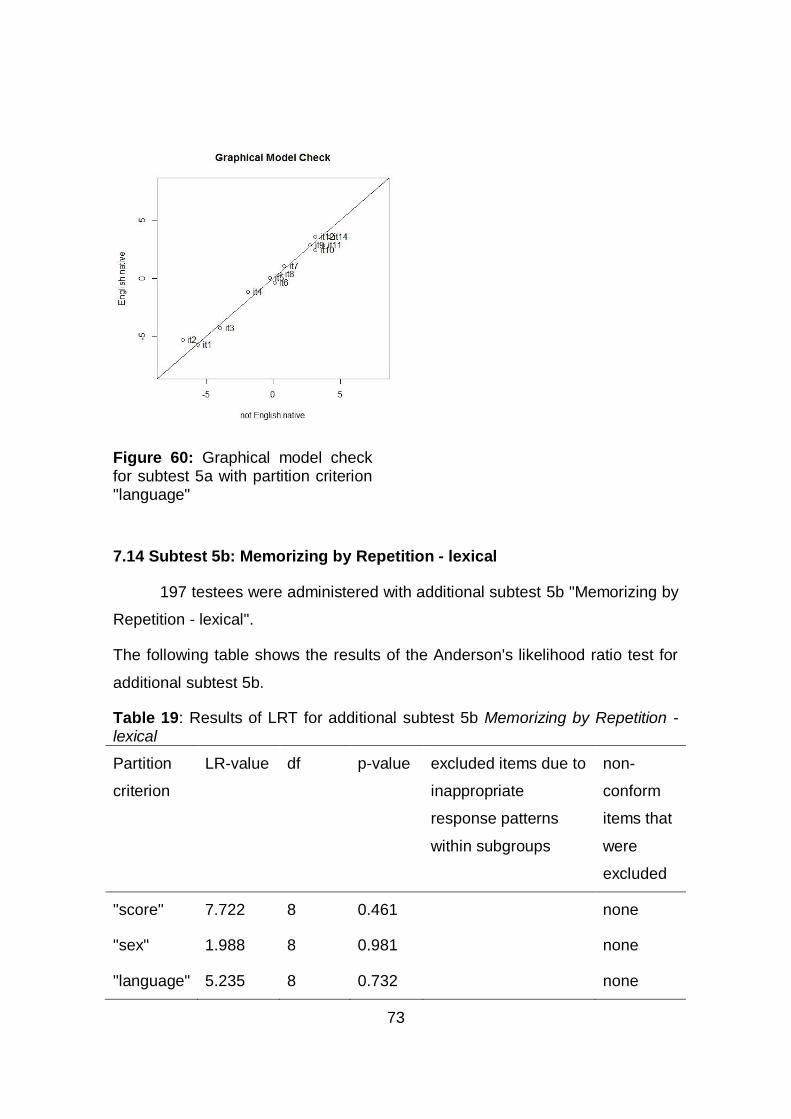
73
Figure 60: Graphical model check for subtest 5a with partition criterion "language"
7.14 Subtest 5b: Memorizing by Repetition - lexical
197 testees were administered with additional subtest 5b "Memorizing by
Repetition - lexical".
The following table shows the results of the Anderson's likelihood ratio test for
additional subtest 5b.
Table 19: Results of LRT for additional subtest 5b Memorizing by Repetition - lexical
Partition
criterion
LR-value df p-value excluded items due to
inappropriate
response patterns
within subgroups
non-
conform
items that
were
excluded
"score" 7.722 8 0.461 none
"sex" 1.988 8 0.981 none
"language" 5.235 8 0.732 none
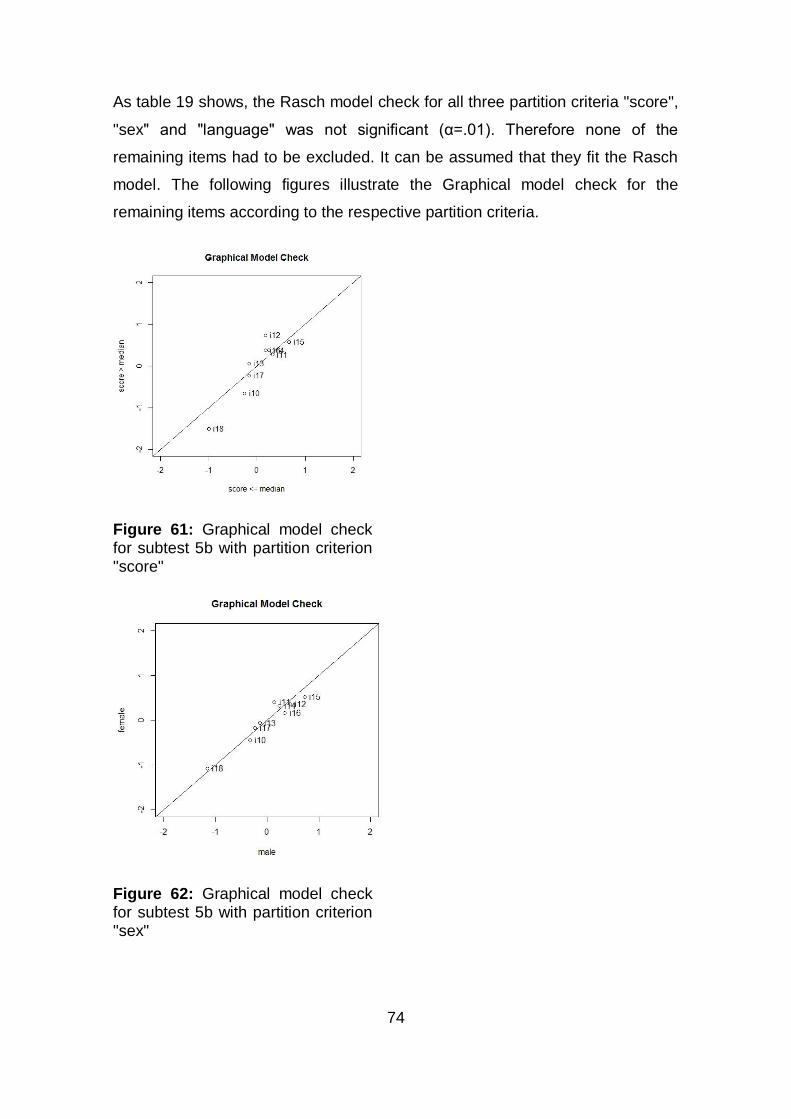
74
As table 19 shows, the Rasch model check for all three partition criteria "score",
"sex" and "language" was not significant (α=.01). Therefore none of the
remaining items had to be excluded. It can be assumed that they fit the Rasch
model. The following figures illustrate the Graphical model check for the
remaining items according to the respective partition criteria.
Figure 61: Graphical model check for subtest 5b with partition criterion "score"
Figure 62: Graphical model check for subtest 5b with partition criterion "sex"
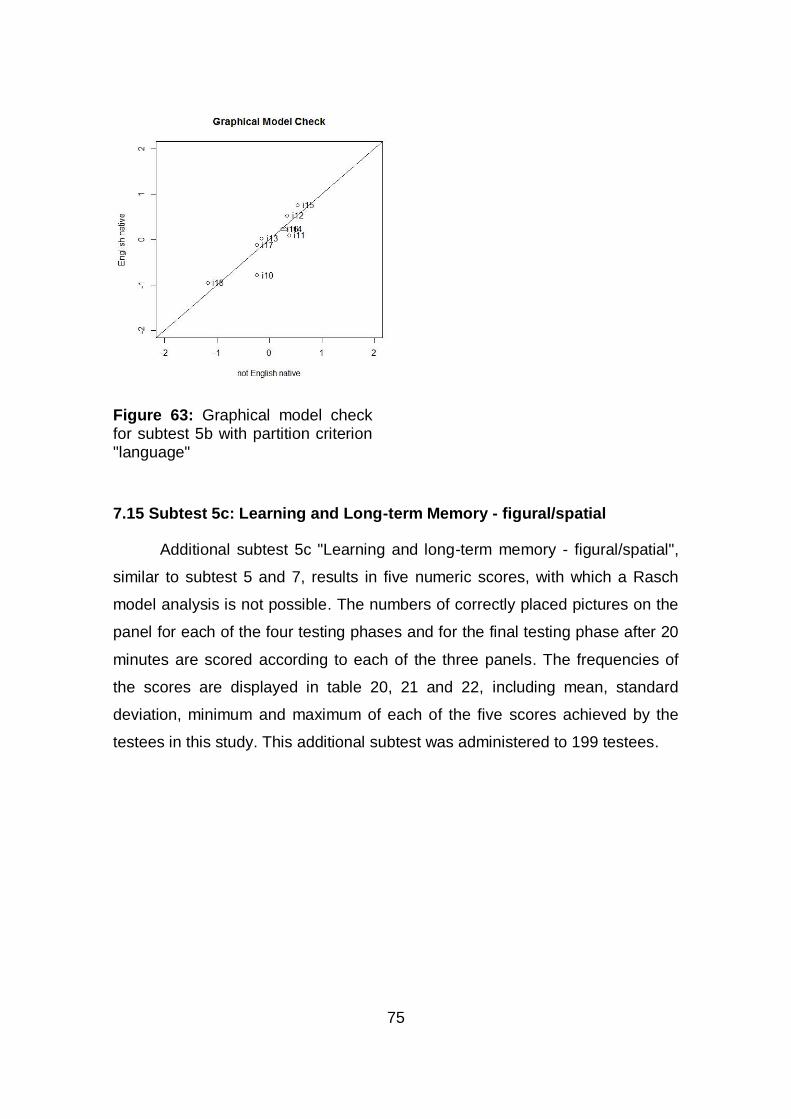
75
Figure 63: Graphical model check for subtest 5b with partition criterion "language"
7.15 Subtest 5c: Learning and Long-term Memory - figural/spatial
Additional subtest 5c "Learning and long-term memory - figural/spatial",
similar to subtest 5 and 7, results in five numeric scores, with which a Rasch
model analysis is not possible. The numbers of correctly placed pictures on the
panel for each of the four testing phases and for the final testing phase after 20
minutes are scored according to each of the three panels. The frequencies of
the scores are displayed in table 20, 21 and 22, including mean, standard
deviation, minimum and maximum of each of the five scores achieved by the
testees in this study. This additional subtest was administered to 199 testees.
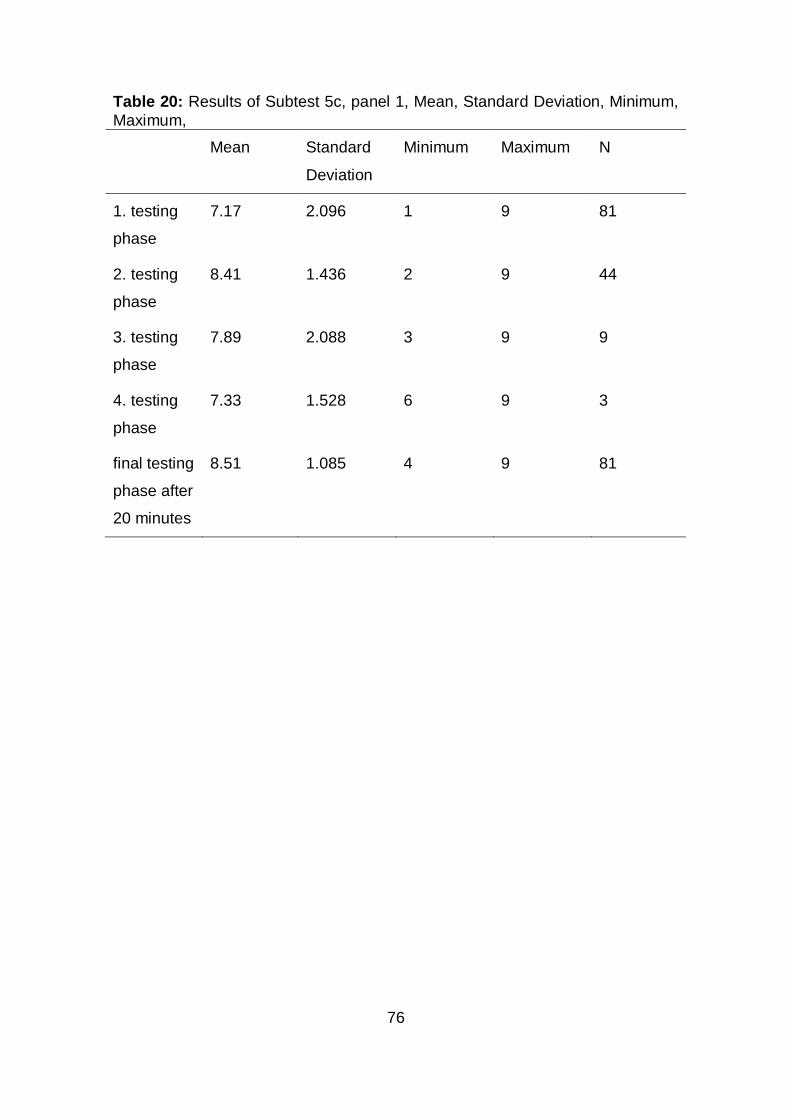
76
Table 20: Results of Subtest 5c, panel 1, Mean, Standard Deviation, Minimum,
Maximum,
Mean Standard
Deviation
Minimum Maximum N
1. testing
phase
7.17 2.096 1 9 81
2. testing
phase
8.41 1.436 2 9 44
3. testing
phase
7.89 2.088 3 9 9
4. testing
phase
7.33 1.528 6 9 3
final testing
phase after
20 minutes
8.51 1.085 4 9 81
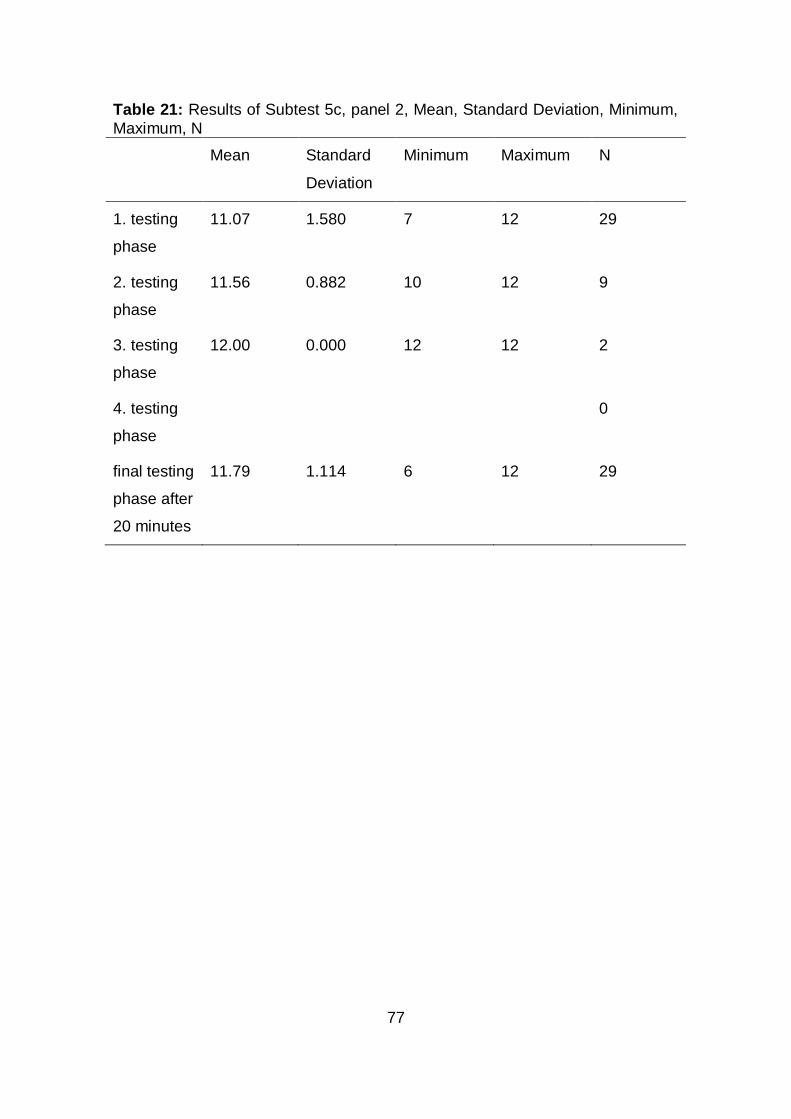
77
Table 21: Results of Subtest 5c, panel 2, Mean, Standard Deviation, Minimum,
Maximum, N
Mean Standard
Deviation
Minimum Maximum N
1. testing
phase
11.07 1.580 7 12 29
2. testing
phase
11.56 0.882 10 12 9
3. testing
phase
12.00 0.000 12 12 2
4. testing
phase
0
final testing
phase after
20 minutes
11.79 1.114 6 12 29
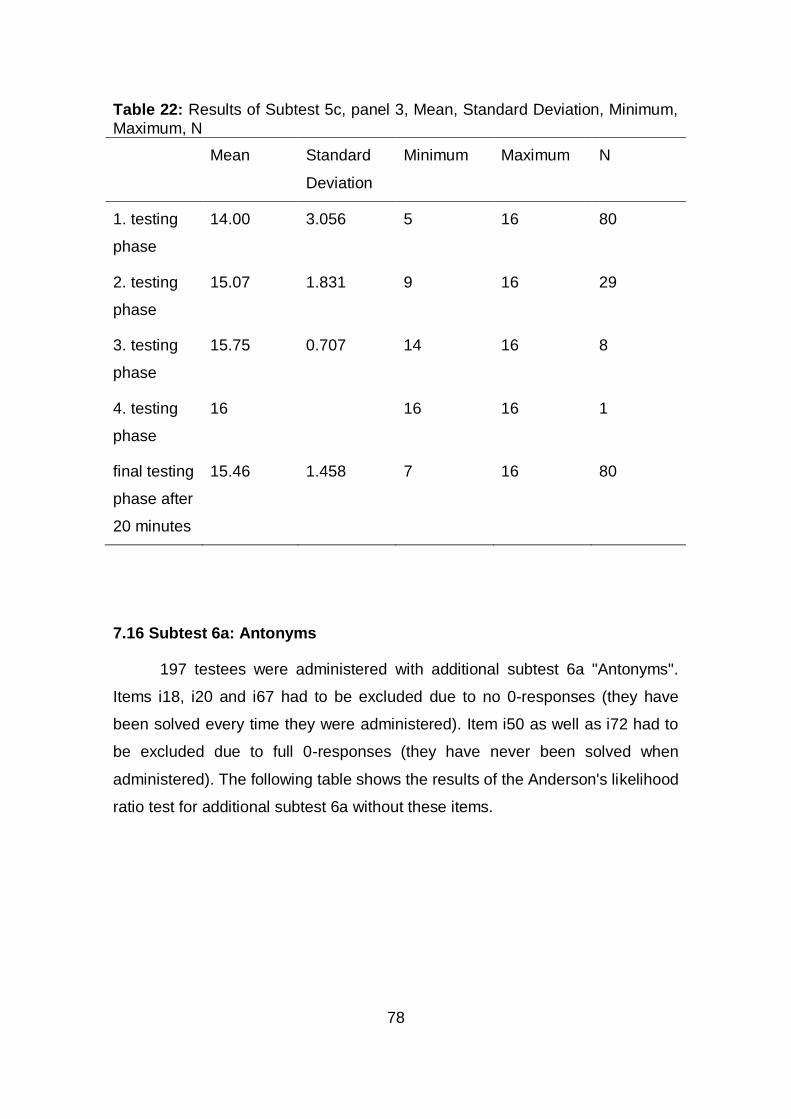
78
Table 22: Results of Subtest 5c, panel 3, Mean, Standard Deviation, Minimum,
Maximum, N
Mean Standard
Deviation
Minimum Maximum N
1. testing
phase
14.00 3.056 5 16 80
2. testing
phase
15.07 1.831 9 16 29
3. testing
phase
15.75 0.707 14 16 8
4. testing
phase
16 16 16 1
final testing
phase after
20 minutes
15.46 1.458 7 16 80
7.16 Subtest 6a: Antonyms
197 testees were administered with additional subtest 6a "Antonyms".
Items i18, i20 and i67 had to be excluded due to no 0-responses (they have
been solved every time they were administered). Item i50 as well as i72 had to
be excluded due to full 0-responses (they have never been solved when
administered). The following table shows the results of the Anderson's likelihood
ratio test for additional subtest 6a without these items.
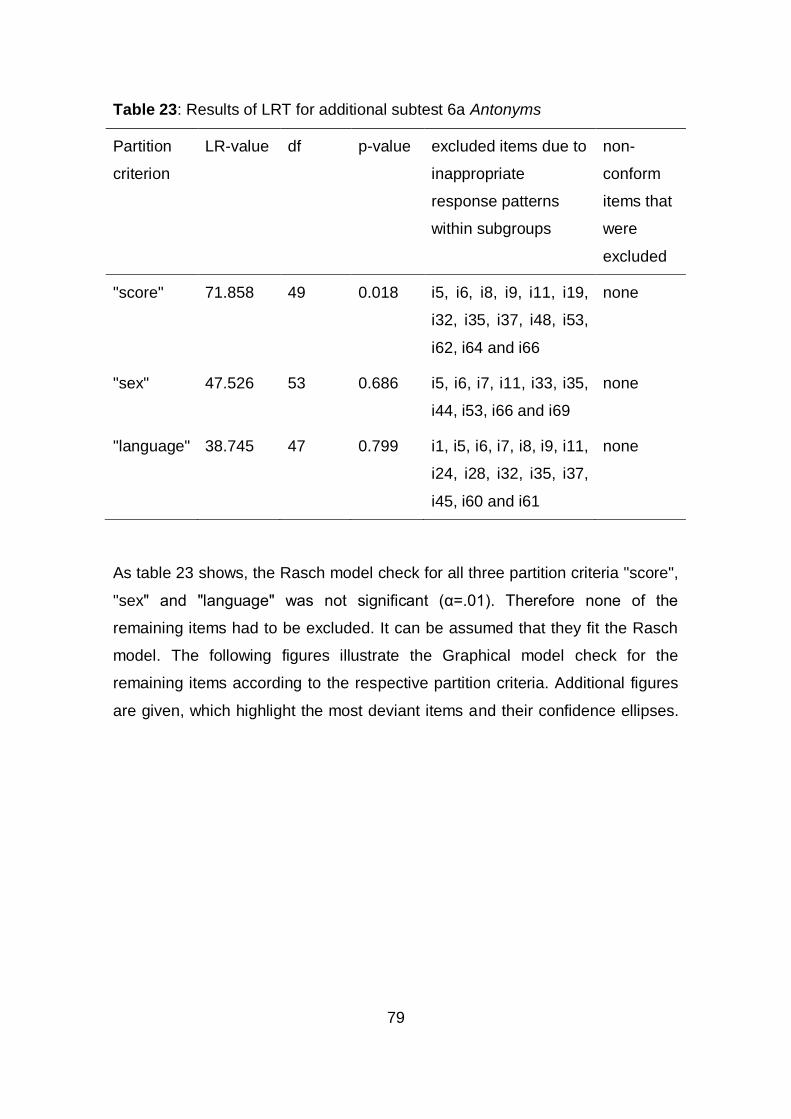
79
Table 23: Results of LRT for additional subtest 6a Antonyms
Partition
criterion
LR-value df p-value excluded items due to
inappropriate
response patterns
within subgroups
non-
conform
items that
were
excluded
"score" 71.858 49 0.018 i5, i6, i8, i9, i11, i19,
i32, i35, i37, i48, i53,
i62, i64 and i66
none
"sex" 47.526 53 0.686 i5, i6, i7, i11, i33, i35,
i44, i53, i66 and i69
none
"language" 38.745 47 0.799 i1, i5, i6, i7, i8, i9, i11,
i24, i28, i32, i35, i37,
i45, i60 and i61
none
As table 23 shows, the Rasch model check for all three partition criteria "score",
"sex" and "language" was not significant (α=.01). Therefore none of the
remaining items had to be excluded. It can be assumed that they fit the Rasch
model. The following figures illustrate the Graphical model check for the
remaining items according to the respective partition criteria. Additional figures
are given, which highlight the most deviant items and their confidence ellipses.
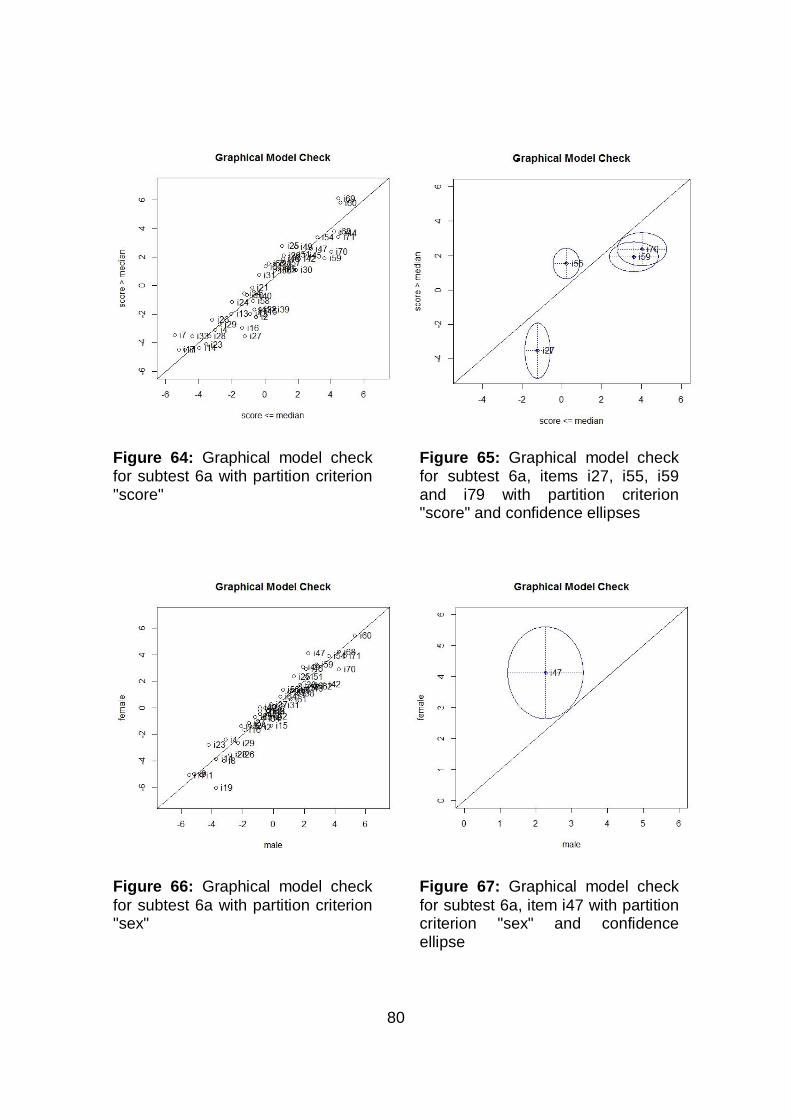
80
Figure 64: Graphical model check for subtest 6a with partition criterion "score"
Figure 65: Graphical model check for subtest 6a, items i27, i55, i59 and i79 with partition criterion "score" and confidence ellipses
Figure 66: Graphical model check
for subtest 6a with partition criterion "sex"
Figure 67: Graphical model check
for subtest 6a, item i47 with partition criterion "sex" and confidence ellipse
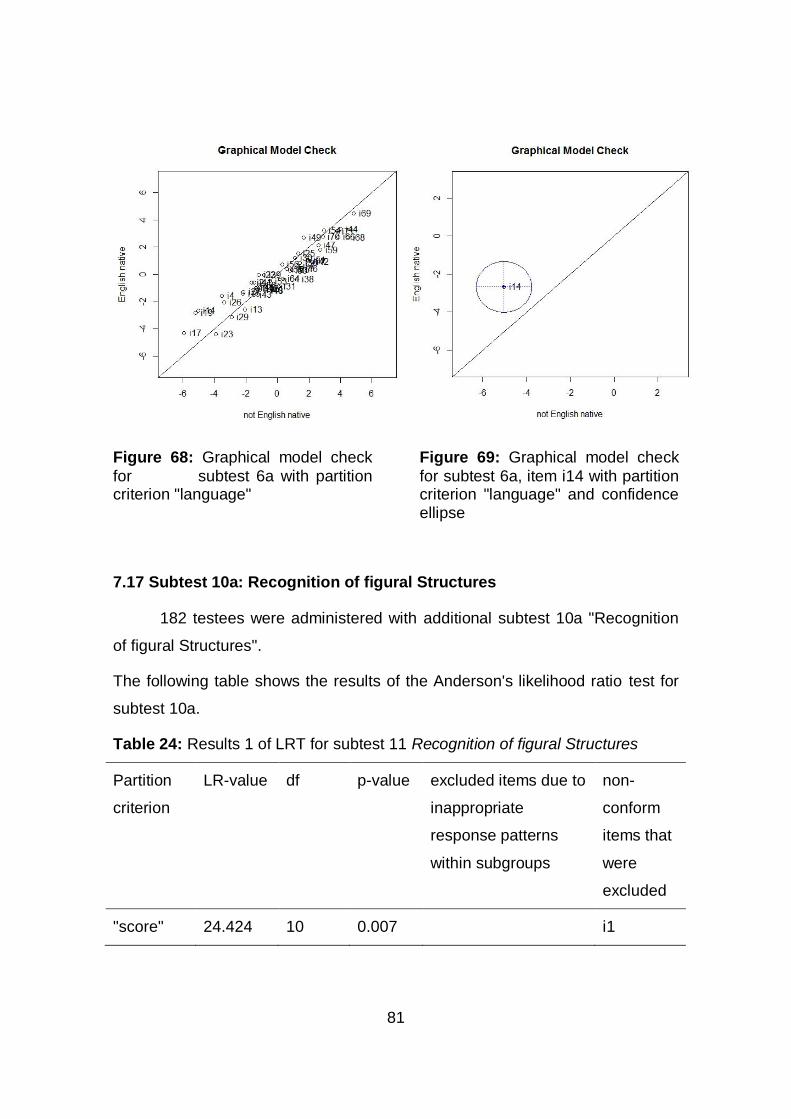
81
Figure 68: Graphical model check
for subtest 6a with partition criterion "language"
Figure 69: Graphical model check
for subtest 6a, item i14 with partition criterion "language" and confidence ellipse
7.17 Subtest 10a: Recognition of figural Structures
182 testees were administered with additional subtest 10a "Recognition
of figural Structures".
The following table shows the results of the Anderson's likelihood ratio test for
subtest 10a.
Table 24: Results 1 of LRT for subtest 11 Recognition of figural Structures
Partition
criterion
LR-value df p-value excluded items due to
inappropriate
response patterns
within subgroups
non-
conform
items that
were
excluded
"score" 24.424 10 0.007 i1
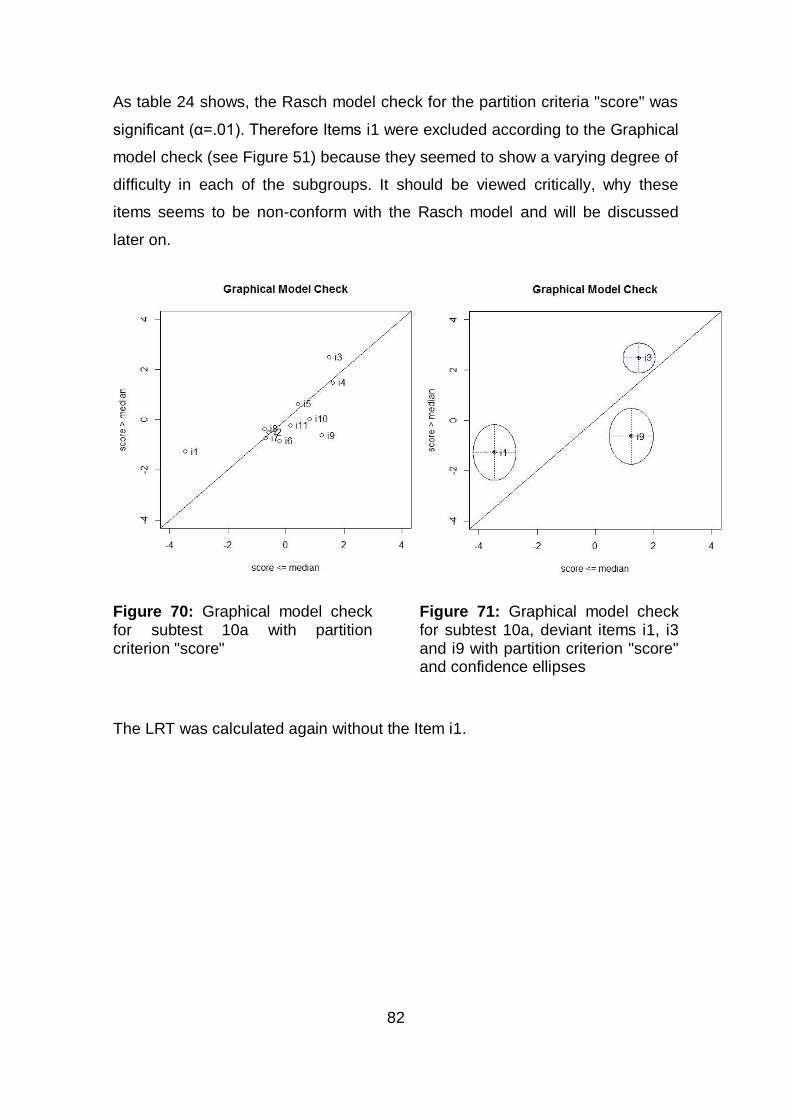
82
As table 24 shows, the Rasch model check for the partition criteria "score" was
significant (α=.01). Therefore Items i1 were excluded according to the Graphical
model check (see Figure 51) because they seemed to show a varying degree of
difficulty in each of the subgroups. It should be viewed critically, why these
items seems to be non-conform with the Rasch model and will be discussed
later on.
Figure 70: Graphical model check for subtest 10a with partition criterion "score"
Figure 71: Graphical model check for subtest 10a, deviant items i1, i3 and i9 with partition criterion "score" and confidence ellipses
The LRT was calculated again without the Item i1.
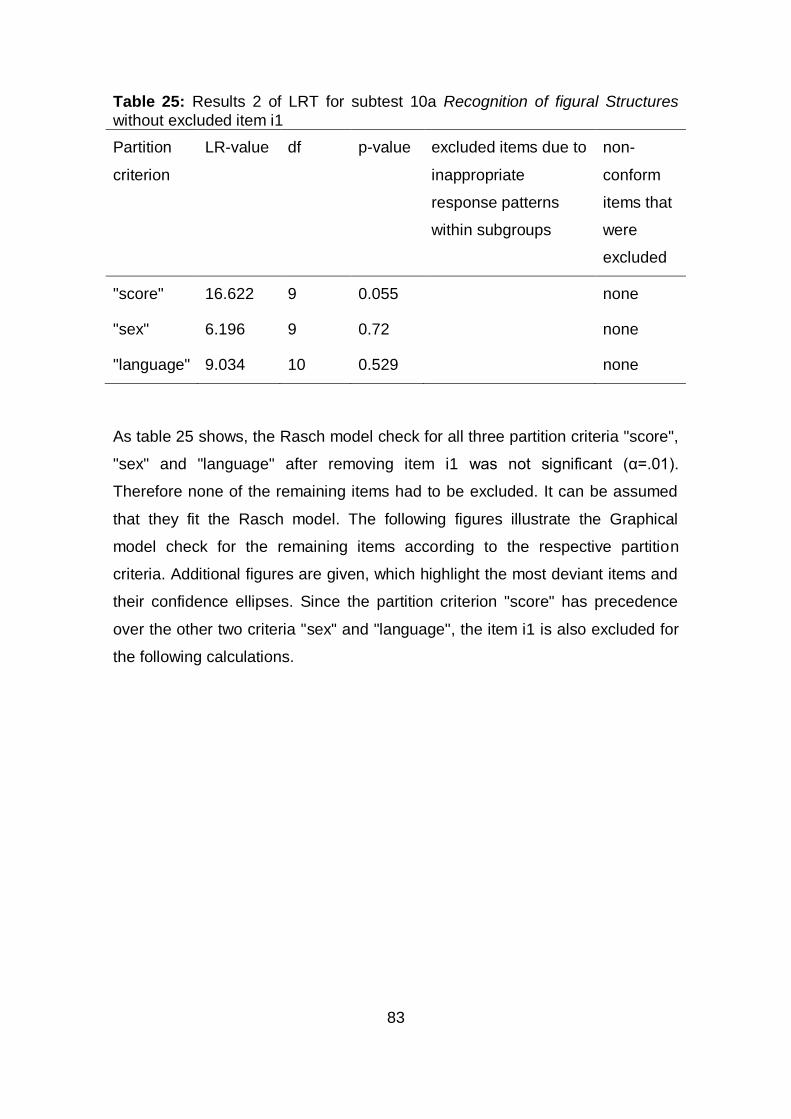
83
Table 25: Results 2 of LRT for subtest 10a Recognition of figural Structures
without excluded item i1
Partition
criterion
LR-value df p-value excluded items due to
inappropriate
response patterns
within subgroups
non-
conform
items that
were
excluded
"score" 16.622 9 0.055 none
"sex" 6.196 9 0.72 none
"language" 9.034 10 0.529 none
As table 25 shows, the Rasch model check for all three partition criteria "score",
"sex" and "language" after removing item i1 was not significant (α=.01).
Therefore none of the remaining items had to be excluded. It can be assumed
that they fit the Rasch model. The following figures illustrate the Graphical
model check for the remaining items according to the respective partition
criteria. Additional figures are given, which highlight the most deviant items and
their confidence ellipses. Since the partition criterion "score" has precedence
over the other two criteria "sex" and "language", the item i1 is also excluded for
the following calculations.
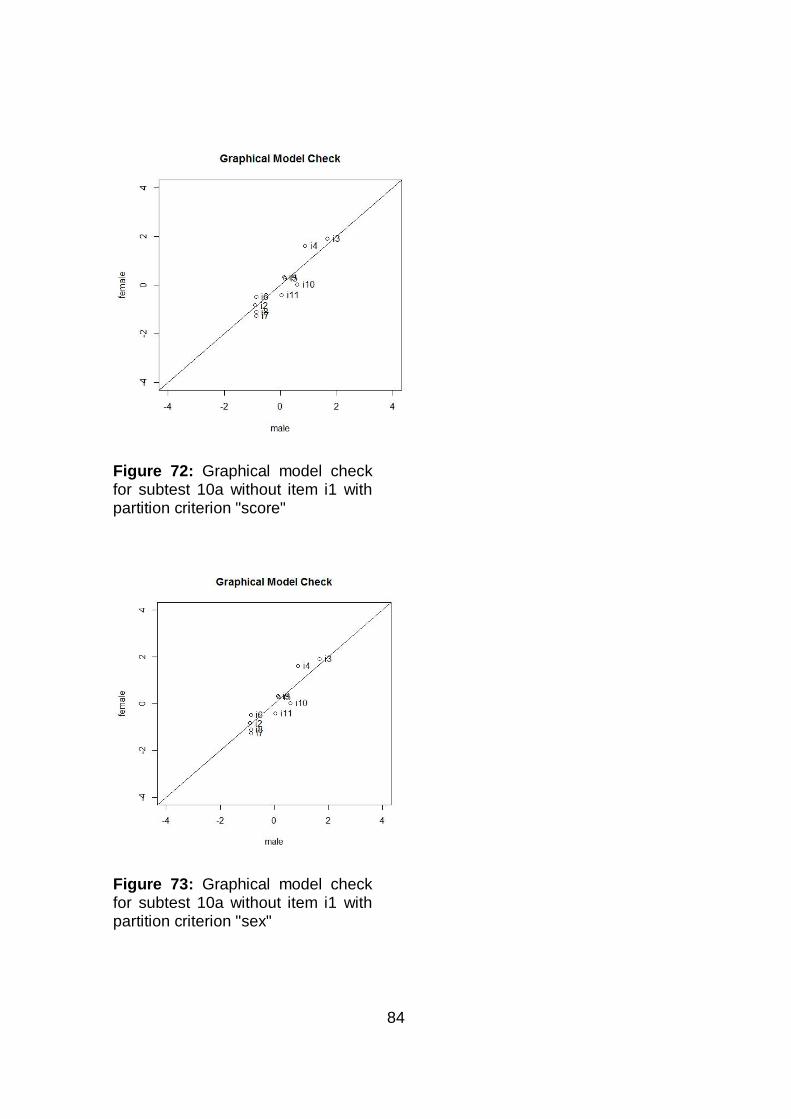
84
Figure 72: Graphical model check for subtest 10a without item i1 with partition criterion "score"
Figure 73: Graphical model check for subtest 10a without item i1 with partition criterion "sex"
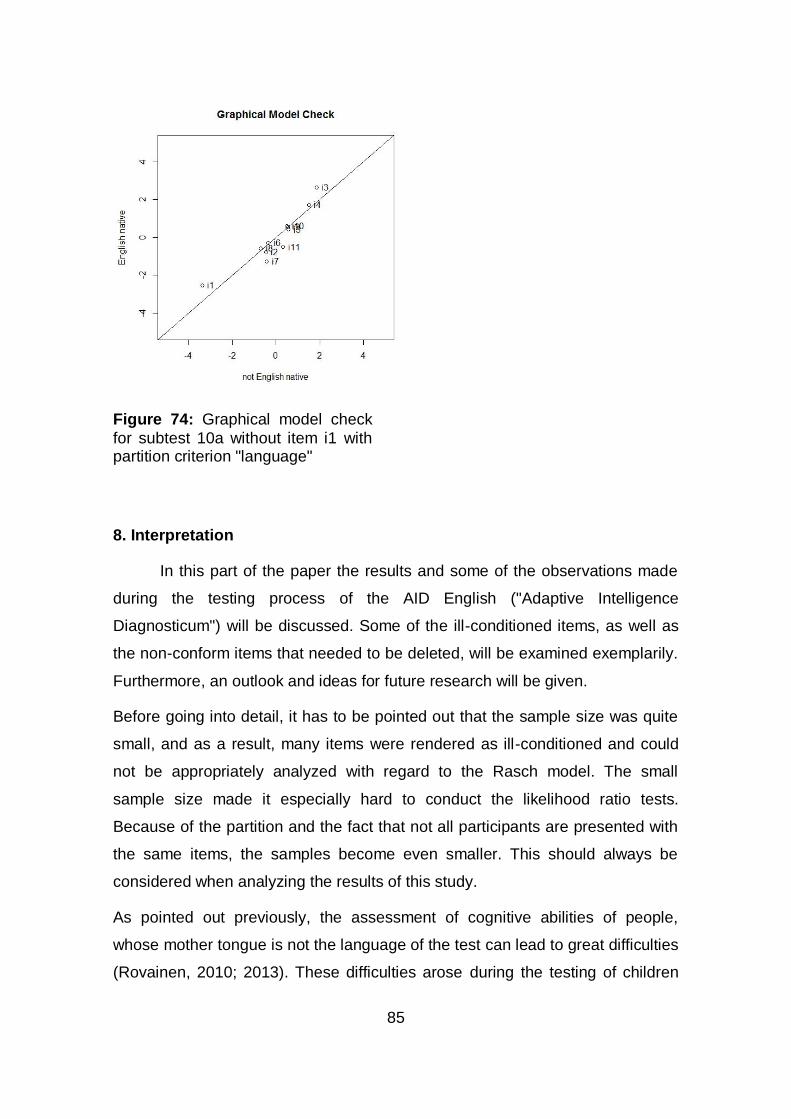
85
Figure 74: Graphical model check
for subtest 10a without item i1 with partition criterion "language"
8. Interpretation
In this part of the paper the results and some of the observations made
during the testing process of the AID English ("Adaptive Intelligence
Diagnosticum") will be discussed. Some of the ill-conditioned items, as well as
the non-conform items that needed to be deleted, will be examined exemplarily.
Furthermore, an outlook and ideas for future research will be given.
Before going into detail, it has to be pointed out that the sample size was quite
small, and as a result, many items were rendered as ill-conditioned and could
not be appropriately analyzed with regard to the Rasch model. The small
sample size made it especially hard to conduct the likelihood ratio tests.
Because of the partition and the fact that not all participants are presented with
the same items, the samples become even smaller. This should always be
considered when analyzing the results of this study.
As pointed out previously, the assessment of cognitive abilities of people,
whose mother tongue is not the language of the test can lead to great difficulties
(Rovainen, 2010; 2013). These difficulties arose during the testing of children
86
whose English proficiency was somewhat weak. Whenever these children did
not understand the instruction, question or word, they failed to correctly solve
the item. However, a clear statement about whether their performance can be
attributed to their abilities or simply to their weak English proficiency cannot be
made. For this reason, whenever one of the test administrators came to the
conclusion that the testees English proficiency was not good enough, subtests
that have a very strong language component, such as subtests 6; 9 and 6a,
were not administered.
In subtest 1 "Everyday Knowledge" the item i61 "You have two hands. One of
them is the right one, the other one is the …" had to be excluded from the
analysis because all 5 children that were administered this item were able to
solve it. It can be assumed that even for 6-7 year olds this item is too easy,
possibly due to the fact that children in European countries learn to differentiate
between left and right at a very early age (during Kindergarten). Even though no
item had to be excluded for the analysis, the graphical model check showed
one deviant item for each partition criterion. The item i18 "The violin and the
contrabass are two instruments that are played with a bow. Name another
one..?" appeared to be less Rasch model conform during the analysis with the
criterion "sex", with 44 out of 52 female testees and 17 out of 32 male testees
being able to answer this question correctly. It can be concluded that this item
seems to be slightly easier for girls than for boys. A reason for this might be that
playing a musical instrument is more common for girls than for boys and
therefore girls have more knowledge about musical instruments in general.
However, whether or not the testees actively played an instrument was not
assessed in this study, so no final conclusion can be drawn from this. Item i17
"Name a conifer." was conspicuous during administration because only two out
of 58 children who were administered this item knew the word "conifer". The
word "conifer" does not seem to be used very frequently in the English
language. It had to be excluded from the analysis of the partition criteria "score"
and "language" because it was ill-conditioned. This is in accordance with
previous results (Lampe, 2008). As a conclusion, this item should likely be
adapted for future administration.
87
In subtest 2 "Competence in Realism" item i2, the picture of the slide had to be
excluded from the analysis due to inappropriate response patterns within
subgroups. Only one out of 31 students who were administered this item was
not able to solve it. It can be assumed that children are or have been confronted
with slides very frequently in their daily lives and therefore are very familiar with
this object. Therefore, it might be very easy for the respondents to detect a
missing piece in a picture of a slide, which makes this item too easy and thus
little informative. Additionally, unexpected gender differences arose. Items i16
(scuba diver), i17 (bicycle) and i18 (beach) seemed to be slightly easier for boys
than for girls and turned out to deviate from the Rasch model, but did not
deviate enough to be excluded from the analysis.
Subtest 3 "Applied Computing" assesses the ability to solve everyday numerical
problems; however, the items consist of math text problems that are presented
to the testee orally and visually. Therefore, language proficiency plays a key
role because being the ability to understand the problem is the basis for being
able to solve it. Interestingly i36 ("Two runners A and B are running along a 1
km track. In the first half, B is 3 seconds behind A for every 100 meters. In the
second half, B catches up by a third. How many seconds is B behind when he
reaches the finish line?") seemed to be slightly easier for non-native English
speakers than for English natives. For a math problem like this, it would be very
common in the English language to use the term "person A" and "person B"
instead of just "A" and "B", which might have been the reason for the English
native speakers of this sample to be confused about this sentence. This item
should possibly be rephrased for future use. Items i1, i2, i3, i4, i6, i7, i14, i15,
i41 and i43 had to be excluded from the analysis because they have been
solved correctly every time they were administered. No statement can be made
about these items, however, it can be assumed that they are too easy and
therefore little informative. Item i8 had to be excluded because it has been
solved incorrectly every time it was administered. No statement can be made
about this item either, however, it can be assumed that it is too difficult and
therefore little informative.
88
Item i1 (blocks) of subtest 4 "Social and Material Sequencing" was solved by 18
out of 22 testees and i2 (painter) by 28 out of 29. Both items had to be excluded
from the analysis and can be assumed to be too easy and therefore very little
informative. Item i5 had to be excluded from the analysis as well because it had
been solved correctly every time it was administered and therefore no
statement can be made about this item. However, it can be assumed that it is
too easy and consequently little informative. Gender differences arose for i12
(inattentive pupil) and i16 (sling), although none of these items had to be
excluded from the analysis. Item i16 in particular was solved more often by boys
(44 out of 53) than by girls (47 out of 72). Playing with a sling, as it is displayed
in i16, might be more common for boys than for girls and therefore girls might
be slightly less familiar with a sling and its use, which could be a reason for girls
being less able to arrange the parts of the story correctly.
As Steindl (2005) and Lampe (2008) argue, no cultural differences are to be
expected for visually-manual skills, covered by subtest 5 "Immediate
Reproducing numerical" and subtest 7 "Coding and Associating" which is why
these subtests are not discussed any further in this paper (see Lampe, 2008;
Steindl, 2005). The same assumption was made about subtest 5c "Learning
and long-term memory - figural/spatial".
Subtest 6 "Finding Synonyms" showed to be much more Rasch model conform
than expected, considering its strong language component. However, numerous
items had to be excluded from the analysis, which should be considered when
analyzing the results of the likelihood ratio tests. Items i39 and i49 had to be
excluded because they have been solved correctly every time they were
administered. No statement can be made about these items, however, it can be
assumed that they are too easy and therefore little informative. Items i9, i11,
i14, i40, i45 and i69z had to be excluded from the analysis due to the fact that
they have been solved incorrectly every time they were administered. No
statement can be made about these items either, however, it can be assumed
that they are too difficult and therefore little informative. Items i1, i2, i3, i4, i6, i7,
i8, i10, i12, i15, i44, i61z and i62z had to be excluded because they were ill-
conditioned and the likelihood ratio test could not be calculated with them
89
included. The LRT for the partition criterion "language" revealed that item i27
("shy") was slightly easier for the English native speakers, as 17 out of 29
testees were able to find a correct synonym, whereas only 12 out of 53 non-
English natives were able to suitable synonym. The word "shy" seems to be a
very commonly used word amongst native and non-native speakers of English,
as, when asked, all the children knew what the word "shy" meant. However,
apparently it requires a solid vocabulary of the English language in order to find
a suitable synonym for this word. On the contrary, the likewise deviant item i67z
("excellence") seemed to be easier for testees whos mother tongue was not
English. According to the test administrator's experience, many students tried to
find a synonym for the adjective "excellent" but not the noun "excellence". A
reason for this might be that in the English language the adjective is more
frequently used than the noun. As mentioned by Lampe (2008) and Steindl
(2005), the translated items very often are not of the same level of difficulty as
the original German language items, partly because they are less frequently
used in the English language. This opinion was supported by the test
administrators' experience in this study. German words like "Ross" (i9) and
"verschwenden/vergeuden" (i14) might be very commonly used in the German
language but the English translations "steed" and "squander" are not
exceedingly prevalent. The word "to eavesdrop" (i44) for example, was only
solved correctly by 2 out of 30 testees, which displays the same problem. An
assembly of a completely new pool of items, rather than the simple translation
of items from the German to the English language, would probably be more
suitable here.
In subtest 8 "Anticipating and Combining - figural", Item i4 ("pear") had to be
excluded due to the fact that all testees that were administered with this item
were able to solve it. No statement can be made about this item, however, it
can be assumed that it is too easy and therefore little informative. As expected,
no differences between English natives and non-English natives were found.
The item i10 ("locomotive") however, showed gender differences and seemed
to be slightly easier for boys than for girls. 21 out of 75 male testees were able
to correctly put the pieces of the train together within the regular time limit, but
90
only 14 out of 97 female testees were able. However, 6 male and 8 female
testees were able to solve this item within the shorter time limit. It can be
hypothesized that this can be attributed to boys playing with trains more
frequently and therefore being more familiar with a train's shape. A more neutral
object might be a more suitable item in order to avoid gender effects.
In subtest 9 "Verbal Abstraction", several items had to be excluded from the
analysis. Items i1 and i4 had to be excluded because they have been solved
every time they were administered. No statement can be made about these
items, however, it can be assumed that they are too easy and therefore little
informative. Items i69, i70 and i64z had to be excluded, since they have never
been solved when administered. Item i69 ("internet - bush drum") for example,
was administered 61 times, but not solved once. No statement can be made
about these items, though it can be assumed, that they are too difficult and
therefore little informative. The item i16 ("Zoo - Prison") showed to be one of the
least Rasch model conform items for the partition criteria "score", as it seemed
to be slightly easier for high-performance testees. It seems to be harder than
expected to understand the concept that in both cases living things are kept
locked up. Therefore this item maybe should only be administered to older
children. Interestingly, items i23, i34, i67z and i68z seemed to be easier to non-
English natives.
A one of the subtests which measure´s "manual-visual" abilities, it is not
surprising that the analyzed items of subtest 10 "Analyzing and Synthesizing -
abstract" fit the Rasch model rather well. Only one of the patterns (i10) showed
gender differences. It has to be pointed out that the partition criterion "score"
was replaced by the criterion "score of subtest 2", as mentioned previously.
Item i7 had to be excluded from the analysis due to the fact that it had been
solved every time it was administered. No statement can be made about this
item, however, it can be assumed that it is too easy and therefore little
informative. No statement can be made about item i24z either because it had to
be excluded as well, due to the fact that it had not been solved once. However,
it can be assumed that it is too difficult and therefore little informative. As
91
previously stated by Lampe (2008), abilities assessed in this subtest are
assumed less likely to differ across different linguistic populations.
Subtest 11 "Social Understanding and Material Reflection" was one of two
subtests in which items had to be excluded in order to reach a Rasch model
conform item sample. Item i1 had to be excluded from the analysis because it
had been solved every time it was administered. No statement can be made
about this item, however, it can be assumed that it is too easy and therefore
little informative. Items i61 and i62z had never been solved when administered
and therefore had to be excluded as well. No statement can be made about
these items either, however, it can be assumed that they are too difficult and
therefore little informative. Items i13, i26, i34, i59, i65z, i67z and i69z all
appeared to be critical regarding the Rasch model conformity during the
analysis with the partition criterion "score". Item i26 ("Why does every country
make an effort to support tourism?") was one of the least conform items and
therefore was excluded. This leads to the conclusion that item i26 is an
unsuitable ability indicator, since its difficulty varies among high-performing
children and low-performing children. The possible correct answers to this item
are very specific and the topics of traveling and the advantages of any country's
national tourism are not very child-friendly subjects. Children might travel,
however, they might not think about what kinds of consequences tourism has
for a country. However, the small sample size and its possible influences on the
results should be noted. As expected, item i72z ("Why is a caesarean section
sometimes performed during childbirth?") seemed slightly easier for girls than
for boys, as 34 out of 47 female testees but only 14 out of 34 male testees were
able to correctly answer this question. This could be attributed to the fact that
childbirth is a rather female subject which, in general, girls are more familiar
with. Items i15 ("Why do hiking shoes have a tough sole?") and i50 ("What is an
insurance company for?") appeared to be slightly easier for testees whos
mother tongue is English. This can be attributed to the vocabulary used in these
items: the words "sole" and "insurance company" might be words that are not
frequently used in an academic context, so children who speak English at home
92
may be exposed to them more often. If a child does not fully understand the
question, as a result it negatively affects the ability to correctly answer it.
Although subtest 12 "Formal sequencing" was one of the newly developed and
added subtests, its items turned out to fit the Rasch model rather well. Only very
few items had to be excluded from the analysis due to being ill-conditioned,
which can also be attributed to the fact that this subtest assesses "manual-
visual" abilities. In the graphical model check items i18, i19, i23, i51 and i64 all
appeared to poorly fit the Rasch model. It can be hypothesized, always keeping
the small sample size in mind, that they are unsuitable ability indicators, since
their difficulty varies among high-performing children and low-performing
children. Surprisingly, gender differences were found for item i23.
Additional subtest 5a "Immediately Reproducing" is again a subtest assessing
"manual-visual" abilities and it is thus not surprising that the majority of the
analyzed items are well fitting. Item i13 had to be excluded because it had been
solved every time it was administered. No statement can be made about this
item, however, it can be assumed that it was too easy and therefore little
informative. For unapparent reasons item i4 appeared to poorly fit the Rasch
model for the criterion "score". The small sample size might be the cause.
The items in the additional subtest 5b "Memorizing by Repetition - lexical" all
showed to be Rasch model conform, as expected.
Several items in the additional subtest 6a "Antonyms" had to be excluded from
the analysis. Items i18, i20 and i67 had to be excluded because they have been
solved every time they were administered. No statement can be made about
these items, however, it can be assumed that they are too easy and therefore
little informative. Item i50 ("revenues") as well as i72 had to be excluded due to
the fact that they have never been solved when administered. No statement can
be made about these items either, however, it can be assumed that they are too
difficult and therefore little informative. Numerous other items had to be
excluded due to inappropriate response patterns within subgroups. For
unapparent reasons partition criterion "language" revealed that i14 ("fall
asleep") was slightly easier for testees whose mother tongue was not English.
93
Again, the small sample size might be the reason for this. During the analysis
with the partition criterion "score" the items i27, i55, i59 and i79 appeared to be
least Rasch model conform. Keeping the small sample size in mind, it can be
hypothesized that they are unsuitable ability indicators, since their difficulty
varies among high-performing children and low-performing children. Following
Krkovic (2012) it should be considered that the subtests "Synonyms" and
"Antonyms" might capture two different abilities, which can be attributed to the
measurement of vocabulary size. In the subtest "Synonyms", testees are asked
to find alternative expressions for a given word, which presupposes the
availability of multiple expressions for one concept within their vocabulary. In
the subtest "Antonyms" on the other hand, testees are requested to find the
contrary of a specific word. Accordingly, the meaning of the specific word or
term must be understood, thus this subtest might capture the language
comprehension. See Krkovic (2012) for further discussion on this topic.
Additional subtest 10a "Recognition of figural Structures" is one of the subtests
that were newly developed and added to the AID 3. Therefore it is not surprising
that some items seemed to not fit the Rasch model very well. As a result, item
i1 had to be excluded from the analysis, since it was the least conform one.
After excluding item i1, the remaining items showed to be Rasch model
conform, as expected, since this subtest assesses "manual-visual" abilities.
Item i1 is very similar to the practice item, which might make it easier and
therefore less conform.
9. Discussion
Before applying the AID English under real conditions, a cross-validation
(Kubinger, 2005) and renormalization is needed, as the small sample size
prevented the evaluation of a number of items in different subtests; hence no
reliable statement about their Rasch model conformity can be made. Individual
testing with the AID English requires a great amount of time and effort,
considering that one testing takes between 90 and 110 minutes. However, the
item response approach requires a large number of testees in order to be able
94
to make statements about every single item. Although this is a requirement that
is very difficult to realize, a large sample size should be given for future
research about the items of the AID English. For further details on sample size
for Rasch model tests, see Draxler (2010).
In line with the results of Lampe (2008), the results of the Rasch model analysis
conducted in this study seem very promising and although a number of items
should be reviewed, the items of the AID English seem to fairly assess the
abilities of English educated children living in Europe.
10. Summary
Due to increasing globalization and societal intermingling of people with
different cultural backgrounds, the need develop fair assessment instruments
that meet the requirements of an international society is more persistent than
ever. Researchers throughout the world are devoted to the translation and
adaptation of psychological tests in order to be able to implement them in
diverse linguistic and cultural populations.
In line with the extensive research in the area of cross-cultural psychology, this
study aimed to evaluate whether or not the AID English is suitable to assess the
cognitive abilities English-educated but not necessarily native English-speaking
children living within a European context.
The AID ("Adaptive Intelligence Diagnosticum") is an originally German
language adaptive intelligence test that is well-established in German speaking
countries and has been adapted and empirically tested in other languages.
Several validation studies about the English version of the AID 2 have been
conducted (Lampe, 2008; Steindl, 2005). For the recently published and newest
version, AID 3 (Kubinger and Holocher-Ertl, 2014), several subtests were
updated and revised and additional subtests were added. Therefore the
adapted English version of the German AID 3 had to be validated in reference
to the Item Response Theory. Accordingly, the aim of this study was to
establish whether the items of the AID English guarantee fair scoring in a
95
linguistically and culturally diverse European population, regarding the Rasch
model.
In total, 202 children who are not necessarily native speakers of English were
tested. There were 111 females and 91 males tested, all of whom were
between the ages of six and fifteen. Students were tested individually at various
international schools in Austria and Germany, and all test administrators were
proficiently skilled in English. The main language of instruction of all schools
was English.
A Rasch model analysis, using the Andersen's likelihood ratio test and graphical
model check with the three partition criteria score (low vs. high score), sex
(male vs. female) and language (English native vs. non-English native) was
carried out to establish whether the items of the AID English guarantee fair
scoring between these subgroups. One of the subtests had to be analyzed with
a partial credit model due to its polytomous response model.
A number of ill-conditioned items had to be excluded from the analysis because
they prevented the Likelihood Ratio Test from being conducted. In two of the
seventeen subtests, non-conform items were selected in a stepwise manner
and had to be excluded in order to reach a non-significant Likelihood Ratio Test
value. After excluding these two items in these two subtests, overall non-
significant and therefore Rasch model conform results were achieved for all of
the 17 subtests. Excluded items were qualitatively analyzed in this study and
should be revised, and, if necessary, modified for future research. Feedback
letters for parents, regarding their children's performances, are in process.
This psychometric analysis of the AID English for an English educated
European population showed promising results in regard to the future use of
this valuable instrument.
96
11. Bibliography
Andersen, E. B. (1973). A Goodness of fit test for the Rasch Model.
Psychometrika, 38(1), 123-140.
Bond, T.G. & Fox, C. M. (2012) Applying The Rasch Model - Fundamental
Measruement in the Human Sciences [DX Reader Version]. Retrieved
from
http://books.google.de/books?hl=de&lr=&id=MRr_AQAAQBAJ&oi=fnd&p
g=PP1&ots=L21C2qOfT4&sig=EeNd-
GzUO1mJ4BaKGg14Jxkr6cY#v=onepage&q&f=false
Boring, E. G. (1923). Intelligence as the Tests Test It. New Rebublic, 36, 35-37
Cattell, R. B. (1987). Intelligence: Its Structure, Growth and Action. [DX Reader
version] Retrieved from
http://books.google.de/books?hl=de&lr=&id=flX770mG2HcC&oi=fnd&pg=
PP2&dq=cattell+intelligence&ots=8VaUkuQztI&sig=Q6_rRxY9Ta9611s
LmIozoTWwgE#v=onepage&q=cattell%20intelligence&f=false
DeVellis, R. F., (2006). Classical Test Theory. Medical Care 44(11), 50-59
DIN Deutsches Institut für Normung e. V. (2002). Anforderungen an Verfahren
und deren Einsatz bei berufsbezogenen Eignungsbeurteilungen. DIN
33430. Berlin: Beuth.
Draxler, C. (2010) Sample Size Determination for Rasch Motel Tests.
Pychometrika, 75(4), 708-724
Fischer, G. H. & Molenaar, I. W. (1995). Rasch Models: Foundations, Recent
Developments, and Applications. New York: Springer.
Fischer, G. H. (1974). Einführung in die Theorie psychologischer Tests. Bern:
Huber.
Flynn, J. R. (2009). The WAIS III and WAIS IV: Daubert motions favor the
certainly false over the approximately true. Applied
Neuropsychology, 16(2), 98-104).
97
Georgas, J. (2003). Cross-cultural psychology, intelligence, and cognitive
processes. In J. Georgas, L. G. Weiss, F. Van de Vijver & D. H.
Saklofske, (Eds.). Culture and Children`s Intelligence: Cross-
Cultural Analysis of the WISC-III (p.23-37). California: Academic
Press.
Georgas, J., Weiss, L. G., Can de Vijver, F. & Saklofske, D. H. (Eds.). (2003)
Culture and Children`s Intelligence: Cross-Cultural Analysis of the WISC-
III. California: Academic Press.
Greenfeld, P., M. (1997). You Can't Take It With You: Why Ability Assessments
Don't Cross Cultures. American Psychologist, 52(10), 1115-1124.
Gulliksen, H. (2013). Theory of mental tests. New York: Routledge.
Hambleton, R., K., Swaminathan, H. & Rogers, H. J. (1991). Fundamentals of
Item Response Theory (Vol. 2). California: Sage
Harvey, R. J. & Hammer, A. L. (1999) Item Response Theory. The Counseling
Psychologist, 27(3), 353-383
Helms-Lorenz, M., Van de Vijver, F. J. R. & Poortinga, Y. H. (2003). Cross-
cultural differences in cognitive performance and Spearman's hypothesis:
g or c? Intelligence, 31, 9-29.
Holocher-Ertl, S., Kubinger, K. D. & Hohensinn, C. (2008). Identifying children
who may be cognitively gifted: the gap between practical demands and
scientific supply. Psychology Science Quarterly, 50(2), 97-111
Kankaraš, M. & Moors, G. (2014). Analysis of Cross-Cultural Comparability of
PISA 2009 Scores. Journal of Cross-Cultural Psychology, 45(3), 381-
399. doi: 10.1177/0022022113511297.
Krković, K. (2012). Machbarkeitsstudie - AID Serbisch (AID srpski)
(Unpublished thesis). University of Vienna, Vienna
Kubinger, K. D. & Holocher-Ertl, S. (2014) Adaptives Intelligenz Diagnostikum 3.
- Manual : AID3. Göttingen: Hogrefe
98
Kubinger, K. D. (2003) Probabilistische Testtheorie. In K. D. Kubinger, & R.
S. Jäger (Eds.), Schlüsselbegriffe der Psychologischen Diagnostik (415-
423). Berlin:Beltz
Kubinger, K. D. (2004). On a Practitioner's Need of Further Development of
Wechsler Scales. Adaptive Intelligence Diagnosticum (AID 2). The
Spanish Journal of Psychology, 7(2), 101-111
Kubinger, K. D. (2005). Psychological Test Calibration Using the Rasch Model -
Some Critical Suggestions on Traditional Approaches. International
Journal of Testing, 5(4), 377-394
Kubinger, K. D., Draxler, C. (2007). Probleme bei der Testkonstruktion nach
dem Rasch-Modell. Diagnostica, 53(3), 131-143
Kubinger, K. D., Rasch, D. & Yanagida, T. (2011). Statistik in der Psychologie.
Göttingen: Hogrefe
Kubinger, K., D. (2009). Psychologische Diagnostik. Theorie und Praxis
psychologischen Diagnostizierens (2. überarbeitete Auflage). Göttingen:
Hogrefe
Lampe S. (2008). A Rasch Analysis of the AID 2-English for a European
Population (Unpublished thesis). University of Vienna, Vienna
Mair, P., Hatzinger, R. & Maier, M. J. (2012). eRm: Extended Rasch Modeling.
R package version 0.15-1. Retrieved from: http://CRAN.R-
project.org/package=eRm
Massey, D., S., Arango, J., Hugo, G., Kouaouci, A., Pellegrino, A. & Taylor, J.
E. (1993). Theories of International Migration: A Review and Appraisal.
Population and Development Review, 19(3), 431-466.
Moosbrugger, H. & Hartig, J. (2003) Klassische Testtheorie. In K. D. Kubinger,
& R. S. Jäger (Eds.), Schlüsselbegriffe der Psychologischen Diagnostik
(408-415). Berlin:Beltz
OECD (2014) PISA 2012 Results in Focus - What 15-year-olds know and what
they can do with what they know. Retrieved from
http://www.oecd.org/pisa/keyfindings/pisa-2012-results-overview.pdf
99
Roivainen, E. (2010) European and American WAIS III norms: Cross-national
differences in performance subtest scores. Intelligence 38, 187-192
Roivainen, E. (2013), Are Cross-National Differences in IQ Profiles Stable? A
Comparison of Finnish and U.S. WAIS Norms. International Journal of
Testing, 13, 140-151
Rushton, J. P. (1998) The "Jensen Effect" and the "Spearman-Jensen
Hypothesis of Black-White IQ Differences. Intelligence, 26(3), 217-225.
Saklofske, D. H., Weiss, L. G., Beal, A. L. & Coalson, D. (2003). The Wechsler
Scale for assessing children's intelligence: past to present. In J. Georgas,
L. G. Weiss, F. Van de Vijver & D. H. Saklofske, (Eds.). Culture and
Children`s Intelligence: Cross-Cultural Analysis of the WISC-III
(3-21). California: Academic Press.
Stalker, P. (2000). Workers without frontiers - The Impact of Globalization on
international Migration [DX Reader version]. Retrieved from
http://books.google.de/books?hl=de&lr=&id=Hn13UQ6qCGEC&oi=fnd&p
g=PR9&dq=reasons+for+international+migration+&ots=KAQ23eVqMX&s
ig=cvju8zUaUxS1KZniwocF4CvYQe4#v=onepage&q=reasons%20for%2
0international%20migration&f=false
Steindl, R. (2005). The Psychometric Properties of the AID 2 - Adapted English
Sternber, R.J. (2009). Cognitive Psychology (5th edition). Wadsworth: Cengage
Learning
Sternberg, R.J. (1982). Handbook of Human Intelligence [DX Reader Version].
Retrieved from
http://books.google.de/books?hl=de&lr=&id=VG85AAAAIAAJ&oi=fnd&pg
=PR8&dq=sternberg+handbook+of+human+intelligence&ots=J2k_mFv5
Zl&sig =YlQGNOrDC12-
ImVvf1vJOsdOrc#v=onepage&q=sternberg%20handbook%20of%20hum
an%20intelligence&f=false
Sternberg, R.J. (2004). Culture and Intelligence. American Psychologist, 59(5),
325/338 doi: 10.1037/0003-066X.59.5.325.
100
te Nijenhuis, J. & van der Flier, H. (2003). Immigrant-majority group differences
in cognitive performance: Jensen effect, cultural effects, or both?
Intelligence, 31, 443-459.
Van de Vijver, F. & Hambleton, R. K. (1996). Translating Tests: Some Practical
Guidlines. European Psychologist, 1(2), 89-99
Version. Unveröffentlichte Diplomarbeit, Universität Wien.
Wechsler, D. (1975). Intelligence Defined and Undefined - A Relativistic
Appraisal. American Psychologist, 30(2), 135-139
Zimbardo, P. G. & Gerrig, R. J. (1999). Psychologie (7. Auflage). Heidelberg:
Springer Verlag.
R (Version 2.14.2). (2012) [Software]. The R Foundation for Statistical
Computing
SPSS (Version 20). (2012) [Software].
101
12. Appendix
A. Abstract German
Unsere zunehmend internationaler werdende Gesellschaft schafft einen
wachsenden Bedarf an psychologischen Testverfahren, die den kulturellen
Kontext berücksichtigen. Die Intelligenztestbatterie AID 3 ("Adaptives Intelligenz
Diagnostikum", Version 3, Kubinger & Holocher-Ertl, 2014) wurde aus dem
Deutschen ins Englische übersetzt und adaptiert. Diese Studie untersucht,
inwiefern die englische Version (AID English) dazu geeignet ist, die kognitiven
Fähigkeiten von Kindern im Alter zwischen sechs und fünfzehn Jahren zu
messen, welche in einer europäischen Umgebung außerhalb Großbritanniens
leben und auf Englisch unterrichtet werden. 202 Kinder (111 Mädchen und 91
Jungen) zwischen 6 und 16 Jahren, deren Muttersprache nicht
notwendigerweise Englisch ist, wurden in Österreich und Deutschland
individuell getestet. Es wurde eine Rasch Modell Analyse mit Hilfe des
Andersen's Likelihood-Ratio-Tests und eine grafische Modellkontrolle mit den
drei Teilungskriterien Score (niedriger vs. hoher Score), Geschlecht (männlich
vs. weiblich) und Sprache (Englisch als Muttersprache vs. Englisch nicht als
Muttersprache) durchgeführt, um festzustellen, ob die Items des AID English
eine faire Skalierung gewährleisten. Einer der Untertests musste mit dem
Partial Credit Modell analysiert werden, da dieser ein polytomes Antwortformat
aufweist. Aufgrund des geringen Stichprobenumfangs konnten einige ill-
conditioned Items nicht in der Analyse berücksichtig werden und bei der
Überpfügung von zwei der siebzehn Untertests mussten einige Items
ausgeschlossen werden, um Rasch Modell Koformität zu erreichen. Die
ausgeschlossenen Items wurden qualitativ untersucht und sollten
gegebenenfalls für zukünftige Untersuchungen bearbeitet werden. Diese
psychometrische Analyse des AID English für eine europäischen Stichprobe
von Kindern und Jugendlichen, welche auf Englisch unterrichtet werden, zeigte
vielversprechende Ergebnisse im Hinblick auf die zukünftige Nutzung dieses
wertvollen Instruments.

102
B. School and Parent Information letters

103
Dear Ladies and Gentlemen, 2014
The University of Vienna is currently running a trial of a cognitive abilities test (Adaptive Intelligence Assessment, AID) in schools all over the UK and at International Schools in Austria, Germany and Slovakia. We are investigating the test’s viability and suitability for students between 6 and 16 years old who don't live in an English-speaking country but are taught in English.
The trial has already been completed successfully in several schools in the UK and we are strongly searching for more schools willing to participate.
The project has received ethical approval from the School of Education Ethics Committee at Durham University. Only small effort would be required from your part like handing out the informed consent forms to the parents and provide a room for the testing. From my own experience in England and from feedback we received from the teachers in the UK schools I can tell that most children really enjoy the challenge.
A quick overview on the general procedure:
One or two test instructors (member of our team) would conduct the testing at your school within more or less one week, depending on the number of students who are participating.
We are very flexible regarding the date and time of the testing although as you know children tend to be more motivated and focused in the morning. The duration of one assessment is approximately 90 minutes and a quiet room would be required.
All children who wish to participate and whose parents agree will be tested individually using all kinds of different materials like cubes, illustrations and cards with pictures.
Once the project is completed children and their parents can receive complimentary feedback on individual children’s performances while schools can receive aggregated data based on all their pupils that took the test.
Please let me know if you are interested in participating in the project. Not only would you contribute greatly to our scientific work at the Faculty of Psychology at the University of Vienna but also support the psychological provision for English speaking children in not English-speaking European countries.
I am looking forward to hear from you and to provide you with more information!
Kindest regards,
Caren Wiedekind University of Vienna
Faculty of Psychology Department of Psychological Assessment and Applied Psychometrics
Caren Wiedekind Project Assistant
Email: [email protected]
104
University of Vienna 2014 Faculty of Psychology AID Project (Department of Psychological Assessment and Applied Psychometrics) Liebiggasse 5 A-1010 Vienna Caren Wiedekind (Project Assistant) Email: [email protected]
Consent for your child to participate in the AID project, University of Vienna
Dear Parents,
Many children are assessed with psychological tests, during their schooling, for a variety of reasons.
Dependant on the results of such intelligence tests, often grave decisions are made, for example decisions
on which future educational route a child should take or the detection of learning difficulties and
impairments.
Today’s increasingly international society has created a growing need for psychological assessment
techniques that are free from cultural bias.
Presently, English language tests predominately originate in the USA and do not generalize well into a
European cultural context. We at the Department of Psychological Assessment, at the Faculty of
Psychology of the University of Vienna, are seeking to develop an unbiased European English language
intelligence test (AID). The “Adaptive Intelligence Assessment” (AID, Kubinger & Wurst, 1985, 1988,
1991, 2000; and Kubinger, 2009) is an intelligence test-battery for the assessment of a wide variety of
cognitive abilities of children and adolescents aged between 6 and 15 years. The aim of our research
project is to investigate the test’s viability and suitability for students who don't live in an English-speaking
country but are taught in English and to establish whether the adapted english test version is free from
cultural bias.
Our calibration project has been completed successfully in several schools in the UK and it has received
ethical approval from the School of Education Ethics Committee at Durham University.
School XY kindly agreed to participate in this scientific project of the University of Vienna.
Therefore we kindly ask you to allow your child to take part in this study, provided of course your child
would like to. The evaluation will last approximately 90 minutes. Every student will be tested individually
and the assessment will be performed by specially trained test-administrators. So far, children had fun
working on the test items. During the assessment, the students are free to take breaks as needed. If they
do not feel comfortable during the test situation, they may stop immediately without any explanation.
The evaluation will be completely anonymous to ensure the strict protection of privacy. No feedback on
individual pupils will be given or information conveyed to the school. The data will be treated with utmost
confidentiality and used solely for research purposes. However, if you or your child wishes, we would be
willing to give feedback with regard to the individual intelligence profile, focusing on strengths and
weaknesses in various aspects of intelligence, once the project is completed. Your participation in the AID
calibration-project is an important contribution to the improvement of psychological assessment and
counselling for children and adolescents. We kindly ask you to sign the form below and give your consent
to the participation of your child in the calibration-project described above – or definitely refuse any
participation.
For any questions, please feel free to contact us.
Best regards and thank you very much for your cooperation in advance!
Caren Wiedekind
105
I give my consent / I refuse (please delete appropriately) for my daughter / my son
_____________________________, born _________________________________________,
Name of child Date of birth
to take part in the AID research project, organised by the Faculty of Psychology of the
University of Vienna.
___________________ ____________________________
Date Signature of parent/Guardian
I would like to receive feedback regarding my child’s individual intelligence profile.
My Email address is __________________________________________________________
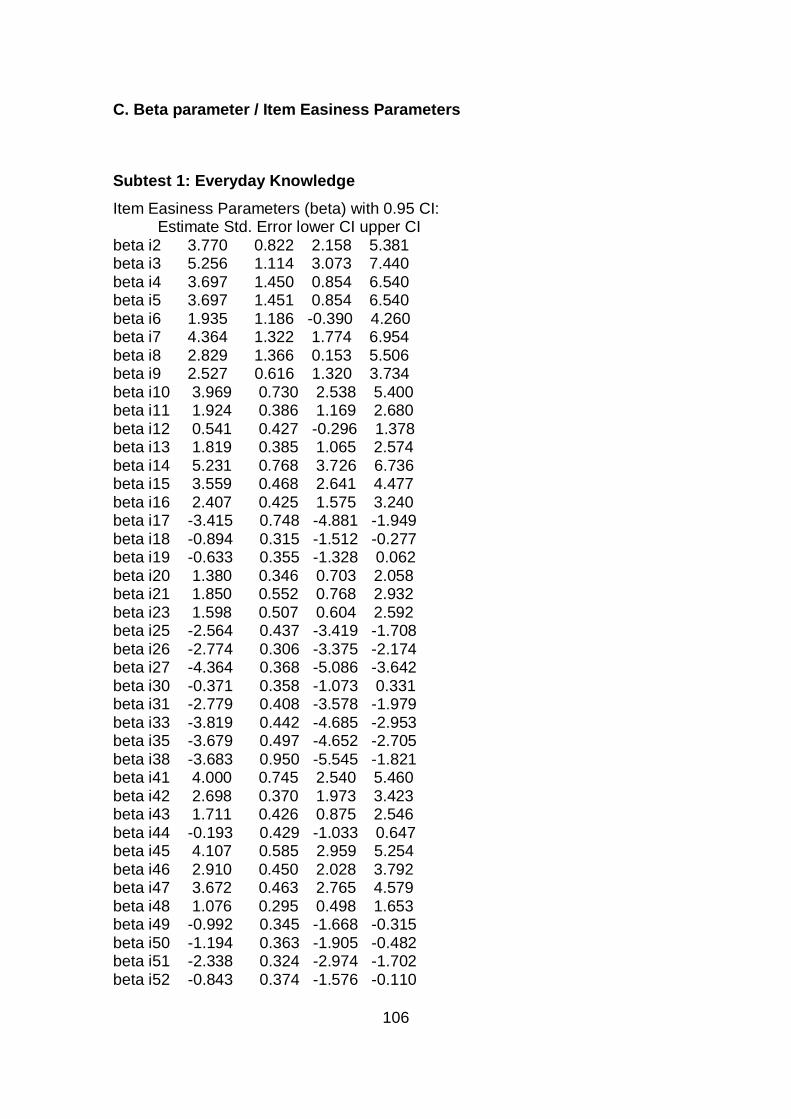
106
C. Beta parameter / Item Easiness Parameters
Subtest 1: Everyday Knowledge
Item Easiness Parameters (beta) with 0.95 CI: Estimate Std. Error lower CI upper CI beta i2 3.770 0.822 2.158 5.381 beta i3 5.256 1.114 3.073 7.440 beta i4 3.697 1.450 0.854 6.540 beta i5 3.697 1.451 0.854 6.540 beta i6 1.935 1.186 -0.390 4.260 beta i7 4.364 1.322 1.774 6.954 beta i8 2.829 1.366 0.153 5.506 beta i9 2.527 0.616 1.320 3.734 beta i10 3.969 0.730 2.538 5.400 beta i11 1.924 0.386 1.169 2.680 beta i12 0.541 0.427 -0.296 1.378 beta i13 1.819 0.385 1.065 2.574 beta i14 5.231 0.768 3.726 6.736 beta i15 3.559 0.468 2.641 4.477 beta i16 2.407 0.425 1.575 3.240 beta i17 -3.415 0.748 -4.881 -1.949 beta i18 -0.894 0.315 -1.512 -0.277 beta i19 -0.633 0.355 -1.328 0.062 beta i20 1.380 0.346 0.703 2.058 beta i21 1.850 0.552 0.768 2.932 beta i23 1.598 0.507 0.604 2.592 beta i25 -2.564 0.437 -3.419 -1.708 beta i26 -2.774 0.306 -3.375 -2.174 beta i27 -4.364 0.368 -5.086 -3.642 beta i30 -0.371 0.358 -1.073 0.331 beta i31 -2.779 0.408 -3.578 -1.979 beta i33 -3.819 0.442 -4.685 -2.953 beta i35 -3.679 0.497 -4.652 -2.705 beta i38 -3.683 0.950 -5.545 -1.821 beta i41 4.000 0.745 2.540 5.460 beta i42 2.698 0.370 1.973 3.423 beta i43 1.711 0.426 0.875 2.546 beta i44 -0.193 0.429 -1.033 0.647 beta i45 4.107 0.585 2.959 5.254 beta i46 2.910 0.450 2.028 3.792 beta i47 3.672 0.463 2.765 4.579 beta i48 1.076 0.295 0.498 1.653 beta i49 -0.992 0.345 -1.668 -0.315 beta i50 -1.194 0.363 -1.905 -0.482 beta i51 -2.338 0.324 -2.974 -1.702 beta i52 -0.843 0.374 -1.576 -0.110
107
beta i53 1.872 0.394 1.099 2.644 beta i55 -1.086 0.317 -1.708 -0.464 beta i56e 0.097 0.446 -0.778 0.972 beta i62 3.697 1.451 0.854 6.540 beta i63 2.829 1.366 0.153 5.506 beta i65 -1.045 0.505 -2.036 -0.055 beta i66 -1.773 0.441 -2.637 -0.910 beta i67 -0.163 0.362 -0.872 0.546 beta i68 -0.948 0.357 -1.647 -0.249 beta i69 1.561 0.626 0.335 2.787 beta i70 -3.227 0.316 -3.846 -2.608 beta i71 -1.167 0.775 -2.685 0.351 beta i72 -6.115 0.798 -7.679 -4.551 beta i73 -1.010 0.526 -2.041 0.022 beta i74 -4.264 0.410 -5.067 -3.461 beta i75 -1.223 0.495 -2.194 -0.252 beta i76 -6.117 1.167 -8.404 -3.829 beta i77 -3.353 0.451 -4.237 -2.468 beta i78 -1.613 0.300 -2.200 -1.026 beta i79 -1.313 0.333 -1.966 -0.661 beta i80 -0.834 0.356 -1.533 -0.136 beta i82 -0.032 1.073 -2.135 2.072 beta i83 0.993 0.465 0.083 1.904 beta i61Z 0.719 0.502 -0.264 1.701 beta i62Z 2.184 0.447 1.307 3.061 beta i63Z 2.486 0.453 1.599 3.374 beta i64Z -2.950 0.408 -3.749 -2.151 beta i65Z -1.674 0.304 -2.270 -1.077 beta i66Z -3.246 0.384 -3.999 -2.493 beta i67Z -0.514 0.583 -1.656 0.629 beta i68Z -1.392 0.599 -2.566 -0.218 beta i69Z -2.660 0.400 -3.444 -1.876 beta i70Z -0.532 0.379 -1.274 0.211 beta i71Z -3.288 0.334 -3.942 -2.633 beta i72Z -2.894 0.327 -3.536 -2.252
Subtest 2: Competence in Realism
Item Easiness Parameters (beta) with 0.95 CI: Estimate Std. Error lower CI upper CI beta i1 1.226 0.265 0.706 1.746 beta i2 4.541 1.088 2.409 6.673 beta i3 2.709 0.577 1.578 3.841 beta i4 0.867 0.243 0.390 1.344 beta i5 3.691 0.825 2.074 5.308 beta i6 0.305 0.219 -0.124 0.734 beta i7 -3.045 0.265 -3.564 -2.526 beta i10 -2.858 0.216 -3.281 -2.435
108
beta i11 -2.702 0.213 -3.119 -2.285 beta i13 0.662 0.233 0.205 1.119 beta i14 0.418 0.378 -0.324 1.160 beta i15 -1.769 0.197 -2.155 -1.384 beta i16 -1.723 0.205 -2.124 -1.321 beta i17 -2.079 0.220 -2.509 -1.649 beta i18 -4.111 0.266 -4.633 -3.589 beta i4a -2.192 0.207 -2.597 -1.788 beta i4b 2.709 0.577 1.578 3.841 beta i4d 0.281 0.224 -0.158 0.719 beta i8b 1.114 0.264 0.597 1.631 beta i9a 1.956 0.338 1.293 2.619
Subtest 3: Applied Computing
Item Easiness Parameters (beta) with 0.95 CI: Estimate Std. Error lower CI upper CI beta i9 2.658 0.617 1.449 3.867 beta i10 2.947 0.600 1.772 4.123 beta i11 5.688 0.691 4.333 7.043 beta i12 6.161 0.806 4.581 7.742 beta i13 4.563 0.501 3.581 5.544 beta i16 2.425 0.408 1.625 3.225 beta i17 -0.508 0.337 -1.168 0.152 beta i18 0.456 0.337 -0.205 1.116 beta i19 -0.804 0.342 -1.474 -0.135 beta i20 -0.705 0.340 -1.371 -0.039 beta i21 1.863 0.319 1.238 2.488 beta i26 2.093 0.729 0.665 3.521 beta i27 -1.694 0.273 -2.230 -1.158 beta i28 -1.162 0.284 -1.717 -0.606 beta i29 -1.877 0.584 -3.022 -0.732 beta i30 -0.985 0.289 -1.552 -0.419 beta i31 -0.717 0.396 -1.493 0.059 beta i32 -2.261 0.376 -2.997 -1.524 beta i33 -2.164 0.337 -2.825 -1.503 beta i34 -4.378 0.387 -5.137 -3.619 beta i35 -3.410 0.361 -4.117 -2.702 beta i36 -2.422 0.317 -3.042 -1.801 beta i37 -5.867 0.525 -6.897 -4.838 beta i38 -5.166 0.551 -6.245 -4.087 beta i39 -4.314 0.507 -5.308 -3.320 beta i40 -5.166 0.551 -6.245 -4.087 beta i42 2.971 0.530 1.933 4.009 beta i44 6.561 1.033 4.537 8.585 beta i45 5.832 0.763 4.336 7.328
109
beta i46 2.509 0.399 1.728 3.290 beta i47 2.521 0.375 1.786 3.256 beta i48 0.110 0.399 -0.672 0.891 beta i49 0.680 0.361 -0.027 1.387 beta i50 0.762 0.389 -0.001 1.525 beta i51 -0.849 0.445 -1.722 0.024 beta i52 -0.337 0.402 -1.124 0.451 beta i53 -0.220 0.351 -0.909 0.468 beta i54 -1.125 0.392 -1.893 -0.357 beta i55 -1.822 0.424 -2.652 -0.991 beta i56 -1.077 0.281 -1.628 -0.525 beta i57 1.483 0.607 0.294 2.673 beta i58 -0.644 0.364 -1.357 0.068 beta i59 -0.819 0.317 -1.441 -0.198 beta i60 -1.638 0.307 -2.239 -1.037 beta i61 1.675 0.383 0.925 2.425 beta i62 -0.747 0.633 -1.988 0.494 beta i63 -3.015 0.280 -3.564 -2.467 beta i64 -6.284 1.022 -8.288 -4.280 beta i70z -0.418 0.638 -1.668 0.832 beta i65 5.276 0.813 3.683 6.870 beta i66 -4.538 0.526 -5.568 -3.507 beta i67 3.863 0.499 2.886 4.841 beta i68 3.012 0.464 2.102 3.922 beta i69 2.563 0.467 1.648 3.478 beta i64z 1.292 0.334 0.639 1.946 beta i65z 2.649 0.436 1.795 3.502 beta i66z -0.342 0.279 -0.889 0.206 beta i67z -2.910 0.314 -3.526 -2.295 beta i68z -1.542 0.319 -2.167 -0.916 beta i69z -2.507 0.310 -3.116 -1.899 beta i71z 1.821 0.807 0.239 3.403
Subtest 4: Social and Material Sequencing
Item Easiness Parameters (beta) with 0.95 CI: Estimate Std. Error lower CI upper CI beta i2 5.726 1.004 3.757 7.694 beta i3 0.929 0.339 0.264 1.593 beta i4 1.652 0.335 0.996 2.308 beta i7 4.137 0.579 3.002 5.272 beta i8 2.909 0.436 2.054 3.763 beta i9 -0.920 0.295 -1.499 -0.342 beta i10 1.196 0.434 0.344 2.047 beta i11 2.490 0.409 1.689 3.290 beta i12 -0.710 0.253 -1.207 -0.214 beta i13 -1.657 0.360 -2.362 -0.952 beta i14 -3.811 0.357 -4.511 -3.111
110
beta i15 -2.225 0.338 -2.887 -1.564 beta i16 -1.449 0.294 -2.024 -0.873 beta i17 -5.470 0.594 -6.634 -4.306 beta i18 -3.842 0.373 -4.572 -3.111 beta i22 1.047 0.420 0.223 1.871
Subtest 6: Producing Synonyms after excluding items
Item Easiness Parameters (beta) with 0.95 CI: Estimate Std. Error lower CI upper CI beta i5 2.221 0.925 0.407 4.034 beta i13 2.896 0.616 1.689 4.103 beta i16 3.332 0.285 2.774 3.890 beta i17 5.612 0.492 4.647 6.577 beta i18 3.053 0.276 2.512 3.593 beta i19 0.185 0.322 -0.446 0.816 beta i20 2.584 0.265 2.065 3.103 beta i21 1.074 0.247 0.591 1.558 beta i22 -0.248 0.279 -0.795 0.300 beta i23 1.120 0.246 0.637 1.603 beta i24 -2.055 0.447 -2.931 -1.178 beta i25 -0.757 0.308 -1.360 -0.153 beta i26 -0.695 0.290 -1.263 -0.126 beta i27 -0.766 0.291 -1.336 -0.195 beta i28 -2.226 0.362 -2.936 -1.516 beta i29 -2.621 0.403 -3.410 -1.831 beta i30 -0.857 0.295 -1.435 -0.279 beta i31 -0.885 0.475 -1.816 0.047 beta i32 -0.885 0.475 -1.816 0.047 beta i33 -4.313 1.545 -7.341 -1.285 beta i34 -1.297 1.241 -3.729 1.136 beta i35 -4.313 1.545 -7.341 -1.285 beta i36 -3.093 0.782 -4.627 -1.560 beta i37 -3.093 0.782 -4.627 -1.560 beta i38 -1.731 0.684 -3.072 -0.390 beta i41 0.958 0.379 0.216 1.700 beta i42 2.419 0.837 0.780 4.059 beta i43 1.892 0.590 0.736 3.049 beta i46 2.938 0.424 2.108 3.769 beta i47 1.991 0.486 1.038 2.943 beta i48 1.269 0.347 0.588 1.949 beta i50 2.892 0.353 2.201 3.584 beta i51 -0.597 0.333 -1.249 0.056 beta i52 -0.245 0.278 -0.791 0.300 beta i53 -1.293 0.722 -2.708 0.122 beta i54 0.490 0.271 -0.042 1.021 beta i55 -2.061 0.396 -2.836 -1.286
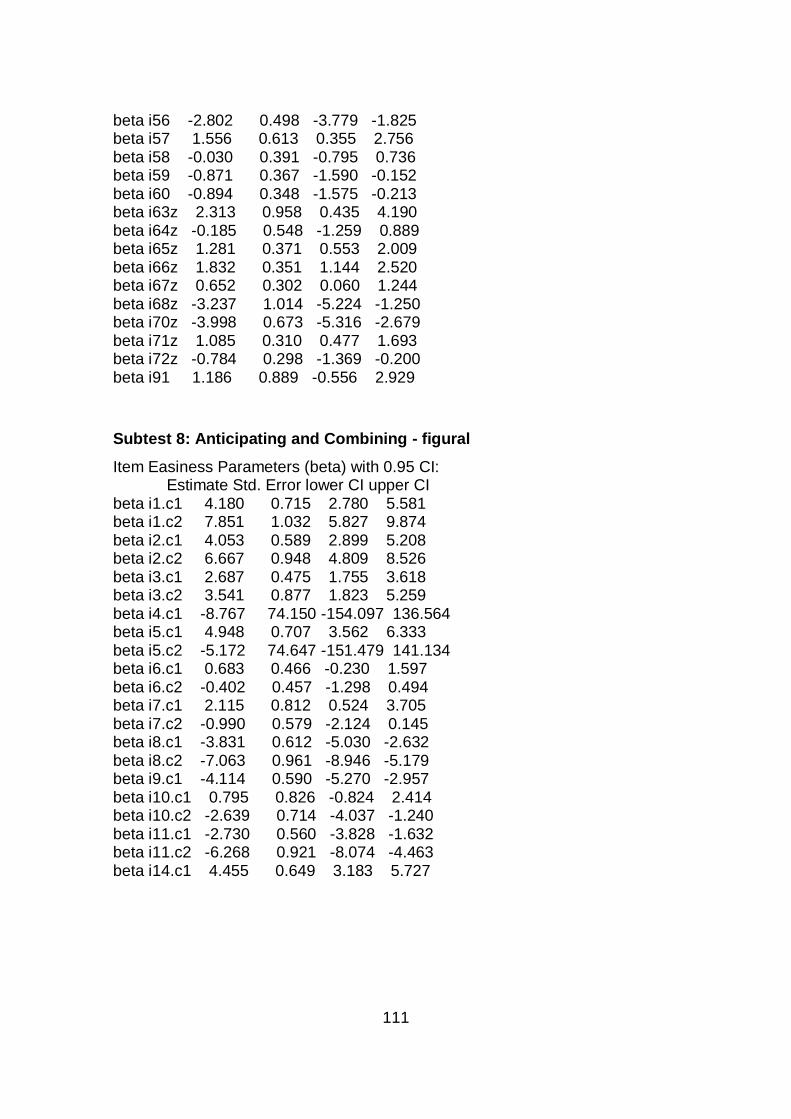
111
beta i56 -2.802 0.498 -3.779 -1.825 beta i57 1.556 0.613 0.355 2.756 beta i58 -0.030 0.391 -0.795 0.736 beta i59 -0.871 0.367 -1.590 -0.152 beta i60 -0.894 0.348 -1.575 -0.213 beta i63z 2.313 0.958 0.435 4.190 beta i64z -0.185 0.548 -1.259 0.889 beta i65z 1.281 0.371 0.553 2.009 beta i66z 1.832 0.351 1.144 2.520 beta i67z 0.652 0.302 0.060 1.244 beta i68z -3.237 1.014 -5.224 -1.250 beta i70z -3.998 0.673 -5.316 -2.679 beta i71z 1.085 0.310 0.477 1.693 beta i72z -0.784 0.298 -1.369 -0.200 beta i91 1.186 0.889 -0.556 2.929
Subtest 8: Anticipating and Combining - figural
Item Easiness Parameters (beta) with 0.95 CI: Estimate Std. Error lower CI upper CI beta i1.c1 4.180 0.715 2.780 5.581 beta i1.c2 7.851 1.032 5.827 9.874 beta i2.c1 4.053 0.589 2.899 5.208 beta i2.c2 6.667 0.948 4.809 8.526 beta i3.c1 2.687 0.475 1.755 3.618 beta i3.c2 3.541 0.877 1.823 5.259 beta i4.c1 -8.767 74.150 -154.097 136.564 beta i5.c1 4.948 0.707 3.562 6.333 beta i5.c2 -5.172 74.647 -151.479 141.134 beta i6.c1 0.683 0.466 -0.230 1.597 beta i6.c2 -0.402 0.457 -1.298 0.494 beta i7.c1 2.115 0.812 0.524 3.705 beta i7.c2 -0.990 0.579 -2.124 0.145 beta i8.c1 -3.831 0.612 -5.030 -2.632 beta i8.c2 -7.063 0.961 -8.946 -5.179 beta i9.c1 -4.114 0.590 -5.270 -2.957 beta i10.c1 0.795 0.826 -0.824 2.414 beta i10.c2 -2.639 0.714 -4.037 -1.240 beta i11.c1 -2.730 0.560 -3.828 -1.632 beta i11.c2 -6.268 0.921 -8.074 -4.463 beta i14.c1 4.455 0.649 3.183 5.727
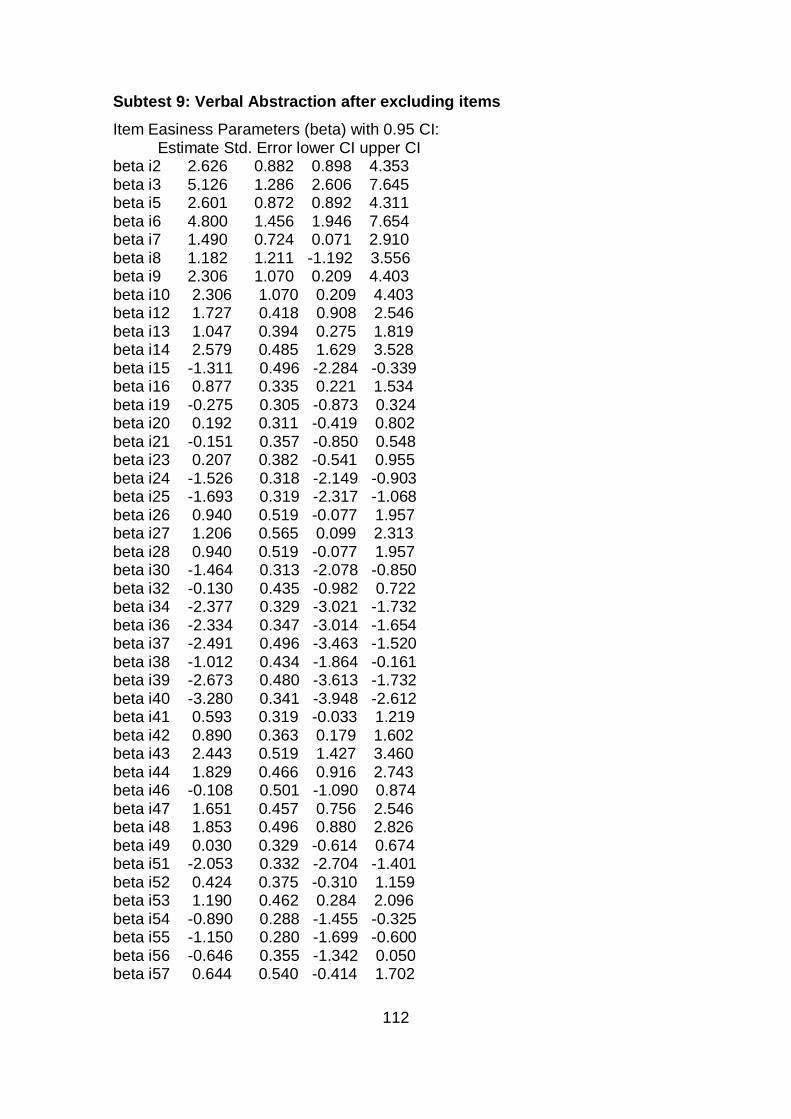
112
Subtest 9: Verbal Abstraction after excluding items
Item Easiness Parameters (beta) with 0.95 CI: Estimate Std. Error lower CI upper CI beta i2 2.626 0.882 0.898 4.353 beta i3 5.126 1.286 2.606 7.645 beta i5 2.601 0.872 0.892 4.311 beta i6 4.800 1.456 1.946 7.654 beta i7 1.490 0.724 0.071 2.910 beta i8 1.182 1.211 -1.192 3.556 beta i9 2.306 1.070 0.209 4.403 beta i10 2.306 1.070 0.209 4.403 beta i12 1.727 0.418 0.908 2.546 beta i13 1.047 0.394 0.275 1.819 beta i14 2.579 0.485 1.629 3.528 beta i15 -1.311 0.496 -2.284 -0.339 beta i16 0.877 0.335 0.221 1.534 beta i19 -0.275 0.305 -0.873 0.324 beta i20 0.192 0.311 -0.419 0.802 beta i21 -0.151 0.357 -0.850 0.548 beta i23 0.207 0.382 -0.541 0.955 beta i24 -1.526 0.318 -2.149 -0.903 beta i25 -1.693 0.319 -2.317 -1.068 beta i26 0.940 0.519 -0.077 1.957 beta i27 1.206 0.565 0.099 2.313 beta i28 0.940 0.519 -0.077 1.957 beta i30 -1.464 0.313 -2.078 -0.850 beta i32 -0.130 0.435 -0.982 0.722 beta i34 -2.377 0.329 -3.021 -1.732 beta i36 -2.334 0.347 -3.014 -1.654 beta i37 -2.491 0.496 -3.463 -1.520 beta i38 -1.012 0.434 -1.864 -0.161 beta i39 -2.673 0.480 -3.613 -1.732 beta i40 -3.280 0.341 -3.948 -2.612 beta i41 0.593 0.319 -0.033 1.219 beta i42 0.890 0.363 0.179 1.602 beta i43 2.443 0.519 1.427 3.460 beta i44 1.829 0.466 0.916 2.743 beta i46 -0.108 0.501 -1.090 0.874 beta i47 1.651 0.457 0.756 2.546 beta i48 1.853 0.496 0.880 2.826 beta i49 0.030 0.329 -0.614 0.674 beta i51 -2.053 0.332 -2.704 -1.401 beta i52 0.424 0.375 -0.310 1.159 beta i53 1.190 0.462 0.284 2.096 beta i54 -0.890 0.288 -1.455 -0.325 beta i55 -1.150 0.280 -1.699 -0.600 beta i56 -0.646 0.355 -1.342 0.050 beta i57 0.644 0.540 -0.414 1.702
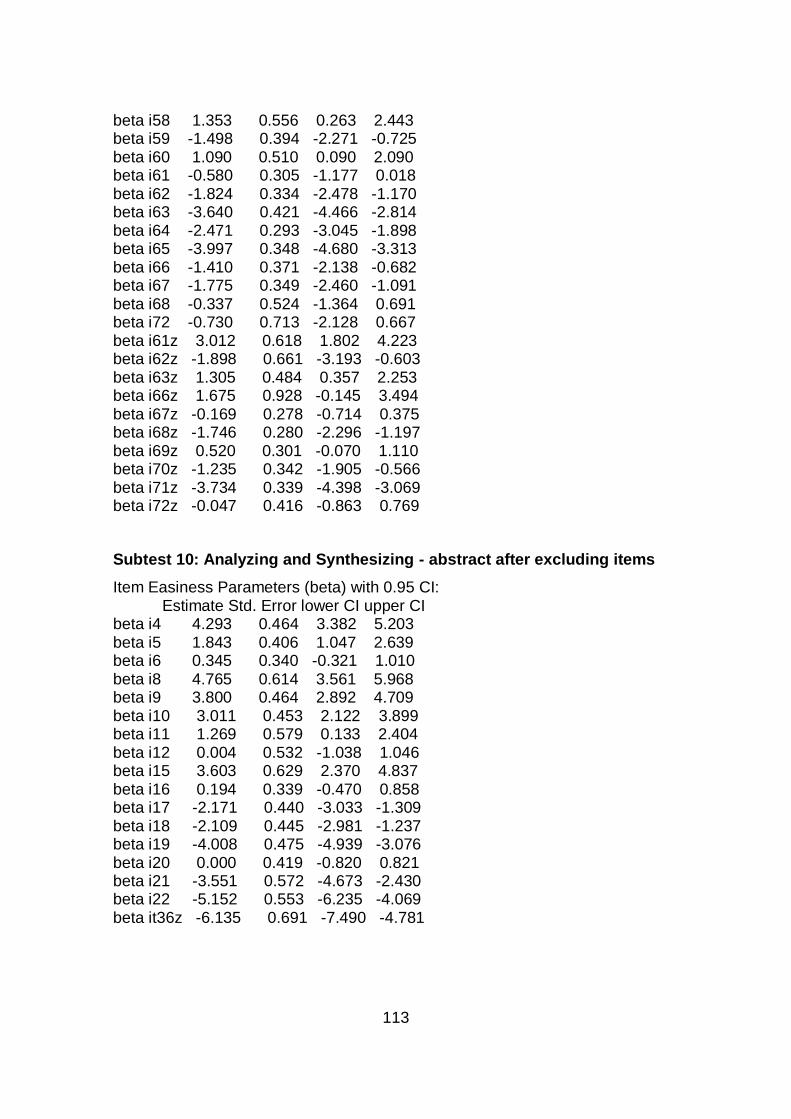
113
beta i58 1.353 0.556 0.263 2.443 beta i59 -1.498 0.394 -2.271 -0.725 beta i60 1.090 0.510 0.090 2.090 beta i61 -0.580 0.305 -1.177 0.018 beta i62 -1.824 0.334 -2.478 -1.170 beta i63 -3.640 0.421 -4.466 -2.814 beta i64 -2.471 0.293 -3.045 -1.898 beta i65 -3.997 0.348 -4.680 -3.313 beta i66 -1.410 0.371 -2.138 -0.682 beta i67 -1.775 0.349 -2.460 -1.091 beta i68 -0.337 0.524 -1.364 0.691 beta i72 -0.730 0.713 -2.128 0.667 beta i61z 3.012 0.618 1.802 4.223 beta i62z -1.898 0.661 -3.193 -0.603 beta i63z 1.305 0.484 0.357 2.253 beta i66z 1.675 0.928 -0.145 3.494 beta i67z -0.169 0.278 -0.714 0.375 beta i68z -1.746 0.280 -2.296 -1.197 beta i69z 0.520 0.301 -0.070 1.110 beta i70z -1.235 0.342 -1.905 -0.566 beta i71z -3.734 0.339 -4.398 -3.069 beta i72z -0.047 0.416 -0.863 0.769
Subtest 10: Analyzing and Synthesizing - abstract after excluding items
Item Easiness Parameters (beta) with 0.95 CI: Estimate Std. Error lower CI upper CI beta i4 4.293 0.464 3.382 5.203 beta i5 1.843 0.406 1.047 2.639 beta i6 0.345 0.340 -0.321 1.010 beta i8 4.765 0.614 3.561 5.968 beta i9 3.800 0.464 2.892 4.709 beta i10 3.011 0.453 2.122 3.899 beta i11 1.269 0.579 0.133 2.404 beta i12 0.004 0.532 -1.038 1.046 beta i15 3.603 0.629 2.370 4.837 beta i16 0.194 0.339 -0.470 0.858 beta i17 -2.171 0.440 -3.033 -1.309 beta i18 -2.109 0.445 -2.981 -1.237 beta i19 -4.008 0.475 -4.939 -3.076 beta i20 0.000 0.419 -0.820 0.821 beta i21 -3.551 0.572 -4.673 -2.430 beta i22 -5.152 0.553 -6.235 -4.069 beta it36z -6.135 0.691 -7.490 -4.781
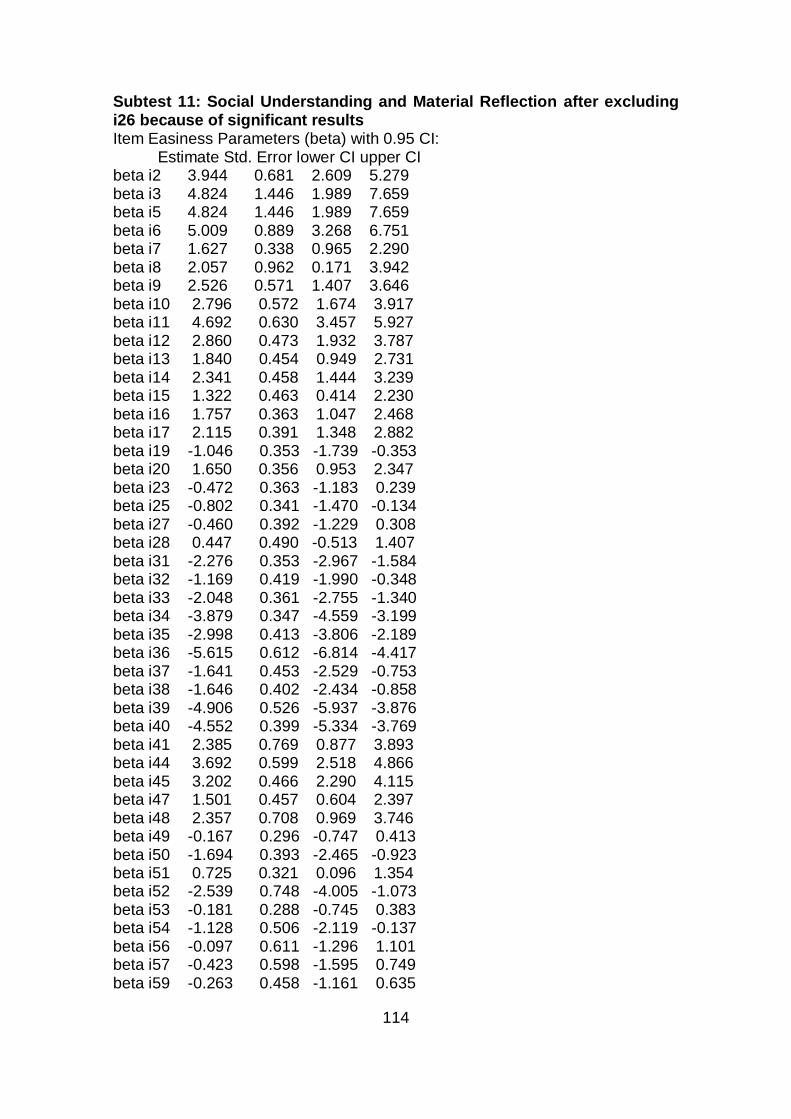
114
Subtest 11: Social Understanding and Material Reflection after excluding i26 because of significant results Item Easiness Parameters (beta) with 0.95 CI: Estimate Std. Error lower CI upper CI beta i2 3.944 0.681 2.609 5.279 beta i3 4.824 1.446 1.989 7.659 beta i5 4.824 1.446 1.989 7.659 beta i6 5.009 0.889 3.268 6.751 beta i7 1.627 0.338 0.965 2.290 beta i8 2.057 0.962 0.171 3.942 beta i9 2.526 0.571 1.407 3.646 beta i10 2.796 0.572 1.674 3.917 beta i11 4.692 0.630 3.457 5.927 beta i12 2.860 0.473 1.932 3.787 beta i13 1.840 0.454 0.949 2.731 beta i14 2.341 0.458 1.444 3.239 beta i15 1.322 0.463 0.414 2.230 beta i16 1.757 0.363 1.047 2.468 beta i17 2.115 0.391 1.348 2.882 beta i19 -1.046 0.353 -1.739 -0.353 beta i20 1.650 0.356 0.953 2.347 beta i23 -0.472 0.363 -1.183 0.239 beta i25 -0.802 0.341 -1.470 -0.134 beta i27 -0.460 0.392 -1.229 0.308 beta i28 0.447 0.490 -0.513 1.407 beta i31 -2.276 0.353 -2.967 -1.584 beta i32 -1.169 0.419 -1.990 -0.348 beta i33 -2.048 0.361 -2.755 -1.340 beta i34 -3.879 0.347 -4.559 -3.199 beta i35 -2.998 0.413 -3.806 -2.189 beta i36 -5.615 0.612 -6.814 -4.417 beta i37 -1.641 0.453 -2.529 -0.753 beta i38 -1.646 0.402 -2.434 -0.858 beta i39 -4.906 0.526 -5.937 -3.876 beta i40 -4.552 0.399 -5.334 -3.769 beta i41 2.385 0.769 0.877 3.893 beta i44 3.692 0.599 2.518 4.866 beta i45 3.202 0.466 2.290 4.115 beta i47 1.501 0.457 0.604 2.397 beta i48 2.357 0.708 0.969 3.746 beta i49 -0.167 0.296 -0.747 0.413 beta i50 -1.694 0.393 -2.465 -0.923 beta i51 0.725 0.321 0.096 1.354 beta i52 -2.539 0.748 -4.005 -1.073 beta i53 -0.181 0.288 -0.745 0.383 beta i54 -1.128 0.506 -2.119 -0.137 beta i56 -0.097 0.611 -1.296 1.101 beta i57 -0.423 0.598 -1.595 0.749 beta i59 -0.263 0.458 -1.161 0.635
115
beta i60 -2.218 0.417 -3.035 -1.402 beta i62 -3.319 0.635 -4.563 -2.075 beta i63 1.088 0.473 0.162 2.014 beta i64 -3.321 0.448 -4.199 -2.442 beta i65 -0.340 0.402 -1.128 0.449 beta i66 -1.847 0.322 -2.479 -1.216 beta i67 -2.053 0.337 -2.714 -1.392 beta i68 -2.897 0.506 -3.889 -1.905 beta i69 2.545 0.380 1.800 3.291 beta i70 0.722 0.512 -0.281 1.725 beta i71 0.335 0.376 -0.402 1.072 beta i72 1.984 0.462 1.080 2.889 beta i73 -1.554 0.401 -2.340 -0.768 beta i63z 2.385 0.769 0.877 3.893 beta i64z 0.142 0.281 -0.409 0.693 beta i65z 3.599 0.527 2.565 4.633 beta i66z -1.805 0.688 -3.155 -0.456 beta i67z -2.296 0.325 -2.933 -1.659 beta i68z 0.017 0.280 -0.532 0.565 beta i69z 2.031 0.485 1.081 2.981 beta i70z -5.315 0.455 -6.207 -4.423 beta i71z -2.441 0.335 -3.097 -1.784 beta i72z -2.314 0.336 -2.973 -1.655 beta i74 -0.116 0.340 -0.782 0.550 beta i75 -3.542 0.349 -4.226 -2.858 beta i79 0.038 0.373 -0.693 0.769
Subtest 12: Formal Sequencing
Item Easiness Parameters (beta) with 0.95 CI: Estimate Std. Error lower CI upper CI beta it5 2.259 0.471 1.337 3.182 beta it6 -0.088 0.308 -0.692 0.517 beta it9 4.045 0.605 2.859 5.232 beta it10 5.856 1.418 3.077 8.635 beta it12 1.648 0.351 0.960 2.336 beta it14 3.052 0.554 1.966 4.137 beta it18 1.641 0.368 0.919 2.362 beta it19 3.793 0.516 2.782 4.805 beta it22 4.457 0.842 2.806 6.107 beta it23 -1.997 0.391 -2.764 -1.231 beta it24 1.608 0.519 0.591 2.626 beta it29 1.352 0.481 0.410 2.294 beta it30 -0.637 0.356 -1.335 0.061 beta it41 5.856 1.418 3.077 8.635 beta it44 -0.960 0.357 -1.661 -0.260 beta it49 -4.949 0.740 -6.399 -3.499
116
beta it51 2.524 0.415 1.711 3.337 beta it52 -3.101 0.429 -3.941 -2.261 beta it53 -1.775 0.320 -2.402 -1.148 beta it54 -6.111 0.723 -7.529 -4.693 beta it55 -2.701 0.350 -3.386 -2.016 beta it59 -1.911 0.318 -2.534 -1.287 beta it60 -2.357 0.351 -3.045 -1.669 beta it61 -1.587 0.388 -2.347 -0.826 beta it63 -1.849 0.308 -2.453 -1.246 beta it64 -2.838 0.364 -3.551 -2.124 beta it65 -4.104 0.478 -5.041 -3.166 beta it66 -1.127 0.272 -1.660 -0.594 Subtest 5a: Immediately Reproducing - figural/abstract
Item Easiness Parameters (beta) with 0.95 CI: Estimate Std. Error lower CI upper CI beta it1 5.636 0.487 4.683 6.590 beta it2 5.872 0.529 4.835 6.910 beta it3 4.061 0.304 3.465 4.657 beta it4 1.672 0.208 1.265 2.078 beta it5 0.179 0.207 -0.226 0.584 beta it6 0.081 0.208 -0.327 0.489 beta it7 -0.878 0.232 -1.333 -0.423 beta it8 -0.454 0.219 -0.883 -0.025 beta it9 -2.739 0.360 -3.444 -2.034 beta it10 -2.876 0.376 -3.613 -2.139 beta it11 -3.403 0.454 -4.292 -2.514 beta it12 -3.202 0.421 -4.027 -2.377 beta it14 -3.949 0.565 -5.057 -2.842 Subtest 5b: Memorizing by Repetition - lexical Item Easiness Parameters (beta) with 0.95 CI: Estimate Std. Error lower CI upper CI beta i10 0.392 0.137 0.123 0.661 beta i11 -0.284 0.140 -0.559 -0.010 beta i12 -0.396 0.142 -0.674 -0.118 beta i13 0.099 0.137 -0.169 0.368 beta i14 -0.284 0.140 -0.559 -0.010 beta i15 -0.606 0.146 -0.893 -0.320 beta i16 -0.240 0.139 -0.514 0.033 beta i17 0.204 0.137 -0.064 0.472 beta i18 1.116 0.150 0.822 1.409 Subtest 6a: Antonyms Item Easiness Parameters (beta) with 0.95 CI: Estimate Std. Error lower CI upper CI beta i1 4.413 0.594 3.248 5.577 beta i2 0.857 0.577 -0.273 1.987
117
beta i4 2.522 0.423 1.692 3.351 beta i5 5.383 1.193 3.044 7.722 beta i6 2.003 1.146 -0.244 4.250 beta i7 4.393 0.983 2.466 6.319 beta i8 3.160 0.655 1.876 4.443 beta i9 4.693 0.750 3.222 6.164 beta i10 0.536 0.264 0.019 1.053 beta i11 5.640 1.128 3.430 7.850 beta i13 1.561 0.283 1.006 2.115 beta i14 3.611 0.464 2.702 4.520 beta i15 0.583 0.609 -0.611 1.777 beta i16 1.500 0.773 -0.014 3.014 beta i17 4.723 0.636 3.477 5.969 beta i19 4.253 0.697 2.887 5.618 beta i21 0.133 0.260 -0.376 0.642 beta i22 0.373 0.515 -0.636 1.382 beta i23 3.209 0.424 2.378 4.040 beta i24 1.198 0.548 0.123 2.272 beta i25 -2.007 0.490 -2.967 -1.047 beta i26 2.480 0.493 1.515 3.446 beta i27 1.223 0.284 0.667 1.779 beta i28 2.979 0.386 2.222 3.736 beta i29 2.297 0.321 1.668 2.926 beta i30 -1.807 0.315 -2.424 -1.189 beta i31 -0.345 0.390 -1.109 0.419 beta i32 0.247 0.676 -1.077 1.571 beta i33 3.703 0.496 2.732 4.675 beta i34 0.593 0.284 0.036 1.151 beta i35 -0.266 0.782 -1.798 1.267 beta i36 -1.847 0.350 -2.532 -1.161 beta i37 -0.266 0.782 -1.798 1.267 beta i38 -1.282 0.289 -1.848 -0.716 beta i39 0.108 0.559 -0.986 1.203 beta i40 0.233 0.266 -0.288 0.755 beta i41 0.534 0.274 -0.003 1.070 beta i42 -2.335 0.298 -2.919 -1.751 beta i43 0.778 0.284 0.221 1.334 beta i44 -4.365 0.647 -5.633 -3.096 beta i45 -2.710 0.736 -4.152 -1.267 beta i46 -1.728 0.290 -2.297 -1.159 beta i47 -3.038 0.395 -3.811 -2.264 beta i48 0.259 0.558 -0.834 1.353 beta i49 -2.630 0.392 -3.397 -1.862 beta i51 -2.254 0.300 -2.842 -1.666 beta i53 -0.152 0.759 -1.640 1.335 beta i54 -3.606 0.494 -4.574 -2.638 beta i55 -1.180 0.281 -1.731 -0.629 beta i56 -1.113 0.290 -1.681 -0.544
118
beta i57 -1.671 0.347 -2.351 -0.990 beta i58 0.405 0.312 -0.206 1.016 beta i59 -2.995 0.347 -3.675 -2.316 beta i60 -5.284 0.821 -6.893 -3.675 beta i61 -0.773 0.782 -2.305 0.759 beta i62 -2.216 0.460 -3.117 -1.314 beta i63 -1.258 0.333 -1.910 -0.606 beta i64 -0.720 0.427 -1.557 0.117 beta i65 -1.352 0.249 -1.841 -0.863 beta i66 -4.150 1.109 -6.323 -1.977 beta i68 -4.270 0.601 -5.448 -3.092 beta i69 -5.358 0.641 -6.615 -4.102 beta i70 -3.425 0.362 -4.135 -2.715 beta i71 -4.180 0.437 -5.038 -3.323
Subtest 10a: Recognition of figural Structures after excluding i1 because of significant results Item Easiness Parameters (beta) with 0.95 CI: Estimate Std. Error lower CI upper CI beta i2 0.862 0.199 0.471 1.252 beta i3 -1.797 0.210 -2.208 -1.386 beta i4 -1.265 0.195 -1.647 -0.883 beta i5 -0.223 0.202 -0.619 0.174 beta i6 0.639 0.214 0.220 1.058 beta i7 1.069 0.235 0.608 1.530 beta i8 0.990 0.242 0.515 1.465 beta i9 -0.254 0.257 -0.756 0.249 beta i10 -0.265 0.268 -0.790 0.260 beta i11 0.243 0.334 -0.412 0.899
119
Caren Wiedekind
Date of birth
Nationality Email
23.12.1988 German [email protected]
Education
04/2010 - 11/2015 Universität Wien (Vienna, Austria)
Diploma (graduate degree): Psychology Thesis: A Rasch Analysis of the AID English for a European Population
03/2015 - 08/2015 Universidad de Chile (semester abroad) (Santiago, Chile) field of study: International Business
09/2014 - 02/2015 Universidad Autónoma de Barcelona (semester abroad)
(Barcelona, Spain)
field of study: Psychology
01/2009 - 06/2009 Valencia Community College (part of Au Pair program) (Orlando, FL, USA)
field of study: English as a foreign language, Psychology
07/1999 - 06/2008 Justus-Liebig-Schule (Darmstadt, Germany)
High School Diploma (bilingual: German/French)
Professional Experience
06/2014 - present Recruiter EU (working student), Applause GmbH (Berlin, Germany)
Managing job vacancies (writing job descriptions, posting job ads on specific job boards)
Screening applications Approaching suitable candidates proactively through
executive search (LinkedIn, Xing) Developing new recruitment strategies Preparing and conducting interviews in English and German Developing and implementing Employer Branding strategies Conducting employee satisfaction surveys Planning team events Administrative tasks
120
10/2009 - 02/2010 Management Assistant in Retail Business, Belmodi GmbH
(Gross-Zimmern, Germany) Managing client orders, alterations, reservations, inventory
and deliveries Being responsible for the cash desk and customer care Working in different departments as Sales Executive
09/2008 - 10/2009 Au Pair (Orlando, FL, USA) Taking care of 3 children between the ages of 3 and 9
Other Experiences
03/2015 - 06/2015 Human Resources Consultancy Project at Faculty of Economics and Business, Universidad de Chile (Santiago, Chile)
10/2013 AID Gruppe Research Project (validation of a group intelligence test for children) (Salzburg, Austria)
06/2013 AID English Research Project (validation of an intelligence test for children) (Swindon, England)
04/2013 - 06/2013 Internship at Children's Psychiatry Department, AKH Vienna (Vienna, Austria) Taking care of ambulant patients Conducting intelligence test, neuropsychological assessment,
personality tests and projective tests Conducting structured clinical interviews with patients and/or
their family members
Additional Skills
Languages German: native speaker English: fluent (C2) Spanish: very good (B2-C1) French: good (B1)
Technological skills
Social/Personal
skills
Microsoft Office (Word, Excel, PowerPoint), Google drive, SPSS Statistics, jobvite, trello, R intercultural competence, communicational skills, team spirit, reliability, accountability, analytical skills

121


![2014/15 doors 2014/15 Highlights of Architecture€¦ · 4 I 5 3rd GENERATION f.l.t.r.: Mag. Christian Klinger, Mag. Anette Klinger, DI (FH) Stephan Kubinger, MBA [1st] WINDOW 20](https://img.pdfslide.net/doc/110x75/6002e94225154739971025b8/201415-doors-201415-highlights-of-architecture-4-i-5-3rd-generation-fltr.jpg)