Embed Size (px)
Citation preview

A Reaction-Diffusion Model of Cholinergic Retinal WavesBenjamin Lansdell1*, Kevin Ford2, J. Nathan Kutz1
1 Department of Applied Mathematics, University of Washington, Seattle, Washington, United States of America, 2 Department of Biochemistry and Biophysics, University
of California San Francisco, San Francisco, California, United States of America
Abstract
Prior to receiving visual stimuli, spontaneous, correlated activity in the retina, called retinal waves, drives activity-dependentdevelopmental programs. Early-stage waves mediated by acetylcholine (ACh) manifest as slow, spreading bursts of actionpotentials. They are believed to be initiated by the spontaneous firing of Starburst Amacrine Cells (SACs), whose dense,recurrent connectivity then propagates this activity laterally. Their inter-wave interval and shifting wave boundaries are theresult of the slow after-hyperpolarization of the SACs creating an evolving mosaic of recruitable and refractory cells, whichcan and cannot participate in waves, respectively. Recent evidence suggests that cholinergic waves may be modulated bythe extracellular concentration of ACh. Here, we construct a simplified, biophysically consistent, reaction-diffusion model ofcholinergic retinal waves capable of recapitulating wave dynamics observed in mice retina recordings. The dense, recurrentconnectivity of SACs is modeled through local, excitatory coupling occurring via the volume release and diffusion of ACh. Inaddition to simulation, we are thus able to use non-linear wave theory to connect wave features to underlying physiologicalparameters, making the model useful in determining appropriate pharmacological manipulations to experimentallyproduce waves of a prescribed spatiotemporal character. The model is used to determine how ACh mediated connectivitymay modulate wave activity, and how parameters such as the spontaneous activation rate and sAHP refractory periodcontribute to critical wave size variability.
Citation: Lansdell B, Ford K, Kutz JN (2014) A Reaction-Diffusion Model of Cholinergic Retinal Waves. PLoS Comput Biol 10(12): e1003953. doi:10.1371/journal.pcbi.1003953
Editor: Olaf Sporns, Indiana University, United States of America
Received April 29, 2014; Accepted October 1, 2014; Published December 4, 2014
Copyright: � 2014 Lansdell et al. This is an open-access article distributed under the terms of the Creative Commons Attribution License, which permitsunrestricted use, distribution, and reproduction in any medium, provided the original author and source are credited.
Data Availability: The authors confirm that all data underlying the findings are fully available without restriction. All relevant data are within the paper, itsSupporting Information files, and the following repository hosted at https://github.com/benlansdell/retinalwaves (DOI: 10.5281/zenodo.12248).
Funding: The authors received no specific funding for this work.
Competing Interests: The authors have declared that no competing interests exist.
* Email: [email protected]
Introduction
Throughout the nervous system, correlated spontaneous activity
drives developmental programs [1,2]. Within the retina, these
events manifest as slow, spreading waves of depolarizations and
are thus termed retinal waves. Waves are observed in a variety of
species and progress through three stages of development [3,4].
They have been implicated in numerous developmental processes,
including retinotopic map refinement [5] and the eye-specific
segregation of retinal projections into layers of the thalamus [6]. In
mammals, waves mediated by acetylcholine (cholinergic waves, or
stage II waves) are the best characterized. They exhibit a slow
wavefront velocity, random initiation site and direction of
propagation, an interwave interval (IWI) which lasts tens of
seconds, and constantly shifting wave boundaries. Precisely
determining their role in development requires a controlled
manipulation of these properties, which in turn requires a sound
theoretical understanding of the mechanisms responsible for their
generation. However, the complexity of their dynamics means that
determining the connection between the generation and resulting
spatiotemporal patterns of wave activity and underlying physiol-
ogy is by no means intuitive and is reliant on computational
modeling. This paper develops a biophysically consistent, yet
simplified, conductance based model of the developing retina that
is able to produce physiological waves, in order to elucidate this
connection.
Retinal waves are believed to be initiated by spontaneous
depolarizations of Starburst amacrine cells (SACs) whose processes
reside in the inner plexiform layer (IPL) of the retina. In mice these
spontaneous depolarizations are sparse: they occur roughly once
every 15 minutes per SAC [7], where as in rabbit the rate is closer
to once every 30 seconds. Following initiation, the dense, recurrent
connectivity of the SAC network laterally propagates activity
through cholinergic synapses [8]. After depolarizing, SACs exhibit
a slow after-hyperpolarization current due to a cyclic-AMP
sensitive, calcium-activated potassium channel [7,9], which
persists for tens of seconds. Consequently, waves propagate over
only a finite domain of the retina, with their boundaries
determined by regions still refractory from previous wave activity.
A number of computational studies have tested this wave
generation hypothesis, notably the models by Godfrey et al.2007 [10], Hennig et al. 2009 [11] and subsequent study by Ford
et al. 2012 [7] (refer to the reviews Gjorgjieva and Eglen 2011 [12]
and Godfrey and Eglen 2009 [13] for more information on
previous computational studies).
A striking feature of retinal waves is their variety of sizes, speeds
and shapes, which differs from the more stereotyped behavior of
spontaneous activity in other developing brain regions, for
example in neocortex [14,15]. Despite numerous theoretical
studies, it is not clear what properties of the recurrent developing
SAC network most contribute to these spatiotemporal patterns.
Indeed, retinal waves sizes appear to be distributed according to a
PLOS Computational Biology | www.ploscompbiol.org 1 December 2014 | Volume 10 | Issue 12 | e1003953
power-law [11], analogous to other examples of spontaneous
activity in the nervous system. In cortex, such activity has been
extensively studied as an example of a critical state phase-
transition [16]. Additionally, diffuse release of ACh has been
detected at the inner limiting membrane coincident with wave
activity [7], suggesting that, like later stage waves mediated by
glutamate [17], extra-synaptic diffusion may play a role in
cholinergic wave propagation, though this has not been tested
theoretically or experimentally.
In this work, we develop a theoretical, reaction-diffusion
framework that integrates the key biophysical processes, includ-
ing increased excitation due to acetylcholine diffusion and the
slow after hyper-polarization of the SACs, to characterize
spontaneous wave dynamics in the developing retina. This
provides a framework to address the above questions of critical
dynamics and mechanisms of wave generation and lateral
propagation. The model is consistent with the above described
mechanisms, but its purpose is to be as simple as possible while
still being able to capture the defining spatiotemporal properties
of retinal waves. We demonstrate the model is capable of
producing physiological waves, as observed in mice [7], after
which we address two questions. First, what are the conditions
for spontaneous activity in the amacrine cell layer to propagate
laterally as waves? We derive necessary conditions for propa-
gating activity using techniques from non-linear dynamics that
are made available through the use of a reaction-diffusion model.
These conditions are shown to be consistent with known
pharmacological and genetic manipulations. Second, once
conditions for propagation are met, what are the conditions
required for the spatiotemporal patterns of retinal wave activity
to take the form of avalanches, as observed in multielectrode
array recordings of stage II waves in a variety of species [11]?
This is answered by appeal to a model of critical behaviour in a
canonical model of forest fires.
Results
A physiological reaction-diffusion model of cholinergicretinal waves
As in previous models [7,11], individual SACs are modeled
according to Morris-Lecar dynamics [18], with an additional
sAHP current activated by depolarization and subsequent calcium
influx. The sAHP current generates recovery times on the order of
a minute. Each cell is assigned the same recovery time scale, and
the dynamics are such that recovery is minimally activity-
dependent (Fig. 1A). Previous theoretical models [10,11] and
experimental observations [9] show that larger depolarizations
increase sAHP duration. The lack of a strongly activity-dependent
refractory period in our model does not affect the its ability to
generate physiological waves. A noisy, excitatory current induces
spontaneous depolarizations (Fig. 1B) at an average rate of once
every 15 minutes per isolated cell, consistent with recordings in
mice (Fig. 1C).
The dense synaptic connectivity of the SAC network and the
potential role for extra-synaptic transmission suggests that a
model based on local coupling between cells is appropriate. As
such, coupling between amacrine cells is modeled via the
volume release and diffusion of acetylcholine (ACh), and an
excitatory post-synaptic current dependent on the local
concentration of ACh. By taking a continuum limit of this
amacrine cell network, a reaction-diffusion model is thus
described (Methods). By modelling lateral excitation as a
diffusion process the model is mathematically tractable. It
should be emphasized that the diffusion of ACh is best thought
of as an effective diffusion process, representing the combination
of synaptic and extra-synaptic excitation through acetylcholine.
Below we will demonstrate the inclusion of long-range connec-
tions, in addition to local, ‘diffusive’, ones has minimal impact in
simulations.
The model is described in more detail in the Methods, but its
notation is established here. For a SAC located at x, its membrane
potential at time t is described by V (x,t). Three dynamic variables
regulate the membrane potential: A(x,t), the extra-cellular ACh
concentration which provides an excitatory current to the SAC;
S(x,t), a calcium-dependent potassium channel which provides an
inhibitory, slow after hyperpolarization (sAHP) current; and
R(x,t), an inhibitory potassium channel modeled as in the original
Morris-Lecar model. The vector
v~(V ,A,R,S) ð1Þ
then specifies the state of the system and obeys the following
dynamics
vt~f(v)zD+2v:
The matrix D is a diagonal matrix whose specified entries
indicate the diffusion coefficient of each dynamic variable
D~
0
D
0
0
0BBB@
1CCCA,
and whose blank entries represent zeros. The function f(v)specifies the cell-intrinsic dynamics.
Author Summary
Both within the visual system and more generally, twogeneral processes describe nervous system development:first, genetically determined cues provide a coarse layoutof cells and connections and second, neuronal activityremoves unwanted cells and refines connections. Thisactivity occurs not just through external stimulation, butalso through correlated, spontaneously generated burstsof action potentials occurring in hyper-excitable regions ofthe developing nervous system prior to external stimula-tion. Spontaneous activity has been implicated in thematuration of many neural circuits, however exactly whichfeatures are important for this purpose is largely unknown.In order to help address this question we construct amathematical model to understand the spatiotemporalpatterns of spontaneously driven activity in the developingretina. This activity is known as retinal waves. We describea simplified, biophysically consistent, reaction-diffusionmodel of cholinergic retinal waves capable of recapitulat-ing wave dynamics observed in mice retina recordings.This novel reaction-diffusion formulation allows us toconnect wave features to underlying physiological param-eters. In particular this approach is used to determinewhich features of the system are responsible for wavepropagation and for the spatiotemporal patterns ofpropagating waves observed in both mice and otherspecies.
A Reaction-Diffusion Model of Cholinergic Retinal Waves
PLOS Computational Biology | www.ploscompbiol.org 2 December 2014 | Volume 10 | Issue 12 | e1003953

Simulations show qualitatively that the model produces realistic
waves (Fig. 2A; Movie S1). Waves propagate without bias in their
initiation region or direction (due to the translational and
rotational symmetry of the equations), occur on average once
every 60 s, propagate at an average speed of 150 mm per second,
and exhibit a broad distribution of wave sizes, all of which are
consistent with in vitro recordings of mice retinal waves [7]
(Fig. 2B). The uniform distribution of initiation points is expected
given the homogeneity of the connectivities (diffusion coefficient)
of the model. Some studies show that both in vivo and in vitrorecordings contain a directional bias in propagation [19,20], which
could be modelled with a drift-diffusion model. However, since
there is presently no physiological model for how this directionality
occurs, we do not attempt to address these issues here.
The spontaneous firing of each cell is modeled as a Poisson process,
which makes it simple to fix the per-cell spontaneous activation rate to
be consistent with the recordings of Ford et al. 2012 [7]. The mean
firing rate is set to be low, such that adjacent spontaneous activations
are exceedingly rare, and hence waves are the result of a single SAC
depolarization. However, the mean rate is sufficiently high to
desynchronize the network, such that the correlation of activity of
neighboring SACs quickly decays as a function of distance (Fig. 2C).
Indeed, the correlation of both refractory variables (S and R) decays
faster than either the voltage or acetylcholine variables, indicating
neighboring SACs can exist in different refractory states and thus
exhibit variable participation in waves [7,11]. These features are
consistent with physiological waves observed in mice. Further, by
assuming a continuum model, the dimensionality of the dynamics can
be drastically reduced, when compared with a network model. This
feature is exploited in the following section.
Necessary conditions for wave propagationHaving established the model produces realistic waves, in this
section we determine under what conditions propagating activity
exists. For this note that previous studies predict that the evolving
mosaic of retinal wave activity is a result of the refractory period of
SACs, which delineates shifting boundaries of future wave activity
[7]. If previous wave activity is indeed responsible for the finite
spatial extent of retinal waves then, were the amacrine cell
network in a homogeneously recovered state, activity would spread
across the entire retina without dissipation. Under this hypothesis,
a prerequisite for the amacrine cell network supporting propagat-
ing retinal wave activity is thus that it should support traveling
wave solutions were it provided an infinite spatial domain at rest –
or that it should be an excitable medium.
To investigate parameters in which our retinal waves model is
excitable is this sense, the amacrine cell network is studied as a
non-linear reaction-diffusion system, in which we seek parameters
under which traveling wave solutions can be constructed. The
method is outlined briefly here, and described in further detail in
Methods. We take advantage of the fact that the voltage and
acetylcholine variables change on a faster timescale than either
refractory variables. Following a singular-perturbation analysis
outlined by Keener and Sneyd, 2001 [21], (treated in a number of
other texts also, e.g. Ermentrout and Terman 2010 [22]), the
dynamics can thus be broken into a fast and slow system:
vt~f (v,r,a),
rt~Eh(v,r,s),
st~Ehk(s,v),
at~+2azk(a,v)
~ttACh
, ð2Þ
Figure 1. Isolated SAC dynamics. Starburst amacrine cells obey Morris-Lecar dynamics with voltage term V , refractory variable R, sAHP variable Sand acetylcholine concentration A. A. Time course of individual SAC dynamics following current injections of indicated size, injected at t~1s for1.5 s (shown in grey). Model SACs’ refractory period shows dependence on amount of current injected. B. Single cell dynamics showing sparsespontaneous depolarizations. Different colors represent different SACs. C. Distribution of inter-event intervals in stochastic simulation of isolated SAC.A threshold of 250 mV was employed. Bar plot shows mean and standard deviation.doi:10.1371/journal.pcbi.1003953.g001
A Reaction-Diffusion Model of Cholinergic Retinal Waves
PLOS Computational Biology | www.ploscompbiol.org 3 December 2014 | Volume 10 | Issue 12 | e1003953

where the lower-case variables denote dimensionless quantities
corresponding to their upper-case equivalents of Equation 1.
Singular perturbation analysis is used to study systems for which
dynamics on more than one timescale need to be considered. For
such systems, attempting to find approximate solutions by
neglecting very fast or very slow components would result in an
incorrect description of the dynamics. Here, the parameter Erepresents the ratio of the fast and slow timescales and is to be
considered small (for the default parameters used in simulations
E&0:001). The model requires singular perturbation techniques
because the small parameter affects the leading order derivative
terms. The fast-system models the dynamics during the jump from
the rest state to the excited (depolarized) state, or from the excited
state to the refractory state. In one spatial dimension +2~Lxx, and
the zeroth-order (E?0) dynamics are therefore
vt~f (v,r,a),
at~axxzk(a,v)
~ttACh
:
In a moving frame with speed c(r), stationary solutions which
connect the rest and excited fixed points are heteroclinic orbits
which represent traveling front solutions. The basic idea of the
wave front construction is outlined in Fig. 3.
Parameters for which a heteroclinic orbit exists for a positive
speed c are parameters which support propagating activity.
Parameters at the transition between a propagating, positive
speed, traveling front and a receding, negative speed, traveling
front (that is, when c~0) represent an excitability threshold. Fig. 4
demonstrates this excitability threshold over a two dimensional
parameter space, computed using the above framework and, for
comparison, computed using numerical simulations of the model
Figure 2. Model produces realistic cholinergic waves. A. Network dynamics showing spatiotemporal patterns of retinal waves B. Distributionof wave sizes, speeds, durations and inter-wave intervals from 2500 s of simulation. Mean wave size is 0.017 mm2(+0.059 mm2), mean wave speed is0.11 mm/s (+0.022 mm/s), mean wave duration is 0.63 s (+0.90 s), and mean inter-wave interval is 49 s (+25 s). C. SACs exhibit variableparticipation in waves. Pearson correlation coefficient between a cell in the center of the domain and all other cells. The correlation coefficient foreach variable is plotted as a function of euclidean distance between cells. Computed using one 2500 s simulation, with activity recorded every 0.1 s.Solid curve represents a loess moving average estimate of mean correlation as a function of distance. Shaded region highlights all points within onestandard deviation of this mean curve.doi:10.1371/journal.pcbi.1003953.g002
A Reaction-Diffusion Model of Cholinergic Retinal Waves
PLOS Computational Biology | www.ploscompbiol.org 4 December 2014 | Volume 10 | Issue 12 | e1003953

for different values of E (the separation of fast and slow time scales).
The analysis and simulations exhibit the same general behavior.
The analysis method presented here is a more direct method for
determining wave propagation because it is not necessary to set up
and solve numerically a solution for each point in parameter space
to be queried. Refer to Methods for more detail on the numerical
simulations.
Both analysis and simulation demonstrate that excitability is
sensitive to the value of both maximal conductances gMACh and gM
Ca.
Further, excitability is independent of all aspects of the model not
involved in the fast dynamics. This means that neither the
spontaneous activation rate nor the duration of either refractory
variable have an effect on wave propagation. Indeed, this is
consistent with data presented in Ford et al. 2012 [7], which shows
manipulations affecting the strength of the sAHP current have
minimal effect on measured wave speed. In the sense defined here,
excitability is also independent of the diffusion coefficient D, as it is
scaled out of the dimensionless equations used to compute the
excitability thresholds. Thus, beyond assuming a non-zero
coefficient, the diffusion rate merely determines the speed at
which waves propagate. The existence of spontaneous, propagat-
ing activity in the developing retina is thus determined by factors
regulating individual SACs excitability and their synaptic strength.
It is important to understand that this analysis is only for the
case of a domain uniformly at rest. Of course, we would like to
consider the existence of waves within a medium that is not
uniformly recovered but for which some of the domain may be
refractory from previous activity. Our analysis provides a
necessary condition for the existence of propagating activity in
this more general case: a network incapable of supporting wave
propagation at rest is a network incapable of supporting wave
activity when some of its cells are refractory. In this more general
case, waves propagate not only if SACs are sufficiently excitable,
but also if neighboring SACs are sufficiently recovered from prior
depolarizations. The wave speed is then modulated by the
refractory state as well (e.g. Fig. 5).
Waves under physiological manipulationsThe pharmacological or genetic manipulation of retinal waves
forms a major component of their experimental study. In this
section we show how two such common manipulations are
recapitulated by our model and use the above analysis to interpret
the effects of these manipulations. Using a biophysically inspired
model is beneficial since model parameters have clear, experi-
mentally determinable values.
Synaptic connection strength. We first investigate the effect
of nicotinic acetylcholine receptor (nAChR) agonists/antagonists
by varying the maximal synaptic conductance gMACh (see Methods
for definition). Our analysis shows both the wave speed at rest and
the wave speed as a function of refractory state R are highly
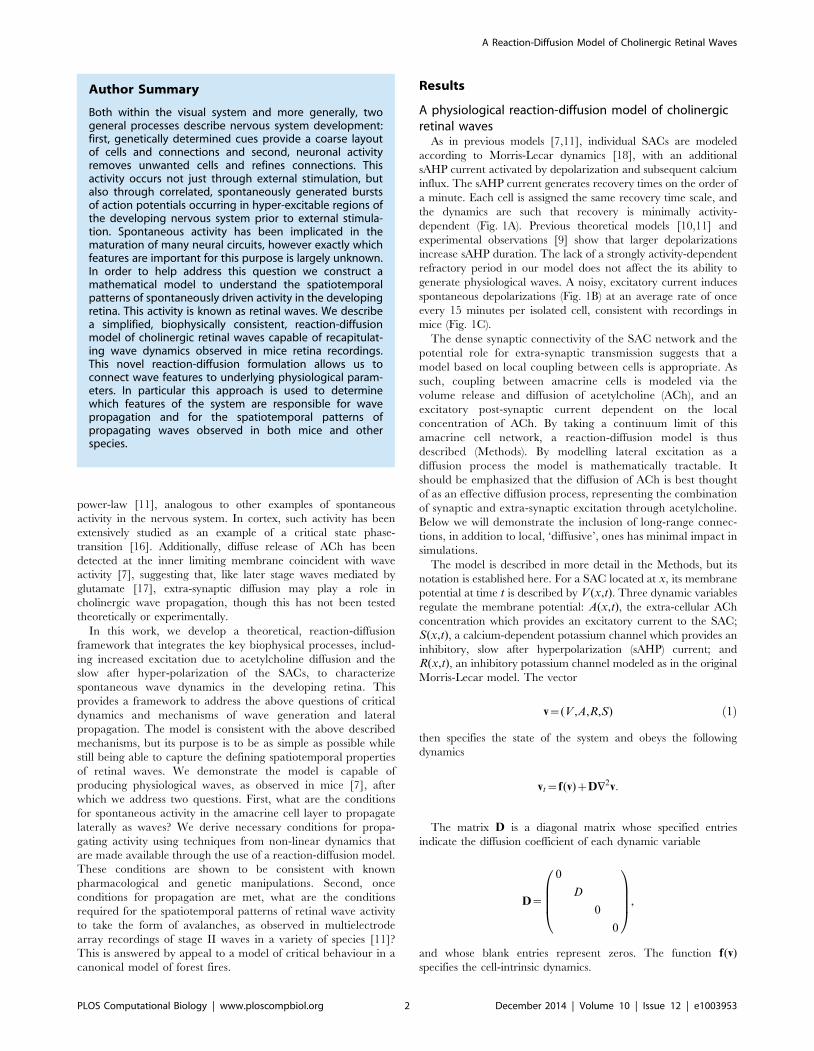
sensitive to changes in gMACh (Fig. 5A). A 25% reduction in gM
ACh
lowers the C(R) curve significantly, making the medium less
excitable and waves more easily blocked by encounters with
refractory cells. This manifests in simulations as a reduction in
wave size, and a change in the inter-wave interval: from sharply
peaked at a mean of approximately 50 s to a monotonically
Figure 3. Construction of traveling wave-front. A. Fast-slow dynamics in the canonical Fitzhugh-Nagumo model of action potential generation.Black curve represents a trajectory of an action potential through phase space, in which a fast transition occurs between the rest (blue dot) andexcited state (green dot), followed by slow excited dynamics (green to purple dot), another fast transition between the excited and refractory state(purple to yellow), and slow dynamics while refractory (yellow to black). Red arrows represent flow lines, and the blue curve is the V~0 nullclinewhich defines the slow manifold (R~0 nullcline not drawn for clarity). B. The fast system here is described by three dynamical variables (v, a, andb:a’). Shown here is the trajectory connecting the rest (blue) and excited (green) fixed points, defining the wavefront. C. Temporal voltage dynamicsof the wave front.doi:10.1371/journal.pcbi.1003953.g003
Figure 4. Parameter regimes which produce propagatingactivity. Numerical determination of retinal wave excitability thresholdfor different timescales E and excitability threshold determined throughsingular perturbation analysis, both as functions of gACh, gCa. Each pointon each curve indicates a point in parameter space in which thewavefront transitions from propagating to receding. Points inparameter space below each curve are therefore not excitable, whilethose above are excitable.doi:10.1371/journal.pcbi.1003953.g004
A Reaction-Diffusion Model of Cholinergic Retinal Waves
PLOS Computational Biology | www.ploscompbiol.org 5 December 2014 | Volume 10 | Issue 12 | e1003953
decaying function similar to the individual SAC spontaneous firing
rate (Fig. 1), indicating that wave activity is localized and
activations are primarily caused by spontaneous activity, not wave
activity. This is indeed observed in pharmacological studies of
mice, chick and turtle retina [23–25], which produce both a
decrease in wave frequency and a decrease in wave size following
treatment with nAChR antagonists.
Additionally, a study by Xu et al. 2011 [6] used transgenic mice
in which only about half of SACs express functional nicotinic
acetylcholine receptors, which reduces the effective coupling of the
network. In these mice, wave frequency and speed were
unchanged, whereas wave size was significantly reduced, as the
analysis of our model predicts.
Conversely, a 25% increase in gMAChresults in an increase in
wave speed both from rest and as a function of refractory state,
indicating that wave activity is more robust and less likely to be
blocked by encounters with refractory cells. Indeed, in simulations
this results in an increase in wave size and a more frequent and
sharply peaked inter-wave interval distribution.Modulation of sAHP current. We also investigate the effect
on waves from varying the sAHP current. Experimentally, this is
achieved through stimulating the cAMP second-messenger path-
way via forskolin. We study this effect by varying the sAHP
timescale tS . Since tS does not effect the fast time scale dynamics,
our singular perturbation analysis does not provide insight into
how tS effects wave speed or propagation. However, using the
model’s excitability criteria does allow us to compute the duration
of an absolute refractory period, which is the length of the period
in which activation, either spontaneous or through incident wave
activity, results in subsequent a refractory state that does not
support a propagating wave. This period is shown to be on the
order of 30 seconds, in accordance with experimental findings
[25]. (Fig. 5B)
Retinal wave simulation does show how tS affects wave
properties. An increase (respectively decrease) in tS results in an
increase (respectively decrease) in the interwave interval and a
minimal change in wave size and wave speed (Fig. 5B). The
reduction in IWI is expected given the decrease in absolute
refractory period. The minimal change in wavespeed is also
expected. Further, the moderate changes in tS presented here
should not affect significantly the wave size (larger changes in tS
through which different wave behavior regimes are explored are
investigated below). These results agree with the study of Ford etal. 2012 [7], which found that treatment with 1 mM of forskolin
resulted in roughly a 50% reduction in IWI, and only a moderate
reduction in wave speed. The same increase in wave frequency
and decrease in underlying sAHP current are also observed in
ferrets and rabbit [9,26].
Recently, Ford et al. 2013 [27] proposed that the sAHP current
is established by the two-pore potassium channel TREK1. In this
study TREK1 knockout mice are shown to exhibit retinal waves
with a significantly reduced (approximately halved) interwave
intervals. The present model, in which wave frequency is shown to
be increased by a reduction of the timescale of sAHP recovery, is
consistent with these findings.
It is possible the effect of forskolin is on the strength of the sAHP
current, not on its decay rate, thus we also investigated the effect of
changing the strength parameter a, which determines how
sensitive each SAC is to the slow refractory state S. The effect
was comparable to varying tS – a decrease in wave frequency and
slight change in wave speed and size following an increase in a(Figure S3).
In summary, the preceding sections have demonstrated that our
model produces physiological retinal waves, and that the existence
of propagating activity can be understood by studying the model
as an excitable medium. This allows for the effect of common
genetic and pharmacological manipulations to be predicted.
Spatio-temporal patterns of propagating activityWe now turn our attention to a second question: given
parameters in which propagating activity exists, what model
Figure 5. Modeling biophysical manipulations. A. Synaptic connection strength gMACh is varied. Sub plots from left to right: speed of wave front
c(R0) at rest (when R~R0) as a function of conductance gMACh, velocity indicates maximum wave-front speed since R§R0 and C(R) is monotonically
decreasing, point at which c becomes zero represents excitability threshold; wave-front speed as function of refractory variable R for three differentvalues of gM
ACh; from 5000 s of simulation of model with indicated values of gMACh interwave-inteval; wave speed distribution; and mean wave size. B.
Sub plots from left to right: dynamics of refractory variable R of individual SAC following depolarization with different sAHP timescales tS , black lineindicates refractory value above which C(R)ƒ0 and thus represents an absolute refractory time period in which SAC is not sufficiently excitable toparticipate in future wave activity; from 5000 s of simulation of model with indicated values of tS inter-wave interval; wave speed distribution; andmean wave size.doi:10.1371/journal.pcbi.1003953.g005
A Reaction-Diffusion Model of Cholinergic Retinal Waves
PLOS Computational Biology | www.ploscompbiol.org 6 December 2014 | Volume 10 | Issue 12 | e1003953

parameters determine their form? Indeed, the spatiotemporal
patterns of cholinergic retinal waves are often similar, despite
differences in a range of physiological parameters, in a range of
species. How is this similarity of form maintained given variations
in physiology? Given parameters in which propagating activity
exists, this section addresses the nature of the resulting spatiotem-
poral patterns. Hennig et al. 2009 [11] notes that, both in MEA
recordings and computer simulation, physiological waves take the
form of avalanches, or power-law sized events. Thus it has been
proposed that the developing amacrine cell network is in a
critically configured state – a transition between a locally and
globally connected network. Such neuronal avalanches have been
observed and extensively studied in the both in vitro [28] and invivo [16] cortex.
Here, we make an analogy between retinal waves and a model
of self-organized criticality (SOC) [29], allowing us to determine
for which parameters avalanches may be observed. A well-studied
example of a complex system potentially demonstrating self-
organized criticality is the Drossl-Schwabl forest fire model (DS-
FFM) [30,31], imagined as a grid in which each unit is either
occupied (by a tree), ignited (burning tree), or empty (ash, burnt
tree). At each discrete time step: 1) an occupied grid point
spontaneously ignites with probability f , 2) burning trees ignite
their occupied neighbors, 3) burning trees become empty and 4)
empty sites regrow a tree with probability p: The analogy between
the forest and the retina is clear: amacrine cells spontaneously fire
at some rate and excite their nearest recruitable neighbors to also
fire, after which these cells experience a slow recovery time, which
proceeds at some average rate.
For a simulated lattice of n2 cells, representing L2mm2 of retina
(in our simulations n~64 and L~2mm), a simple heuristic
derivation shows a relationship between f and p of the DS-FFM
and the retinal wave model parameters:
f ~pn2c2t2 ff
L2, p~
t
r,
for wave speed c, a per cell spontaneous firing rate ff , burst
duration t, an effective refractory period r, and length of domain
L. These values are determined either directly from model
parameters (ff , L, n), from the model analysis (c and r), or from
simulation (t).
The heuristic derivation is as follows: to estimate f and p from
retinal wave simulations, and relate it to the DS-FFM, we rescale
time and space so that one time unit is the duration of a burst during
wave activity (t); in this way after one time unit every active grid
point is now refractory. And rescale space such that the area of one
‘lattice point’ is the area covered by all grid points excited as a result
of one point spontaneously firing (initiating a wave) (pc2t2); in this
way, during one time unit, an active lattice point induces the nearest
(and only the nearest) excitable lattice points to become active.
When scaled in this way, the dynamics of our retinal wave
simulations approximate the dynamics described by the rules of the
DS-FFM. The probability of ‘regrowth’ (recovery) is p~t=r, and
the probability of a lattice point spontaneously firing is assumed to
be the probability of a single simulated cell firing, multiplied by the
number of cells that are included in that lattice point (pc2t2n2=L2).
In the DS-FFM, SOC is expected when [30]
(f =p){1=2%p{1%f {1,
or, for the present model, when
pn2c2tff r
L2
" #{1=2
%r
t%
L2
pn2c2t2 ff: ð3Þ
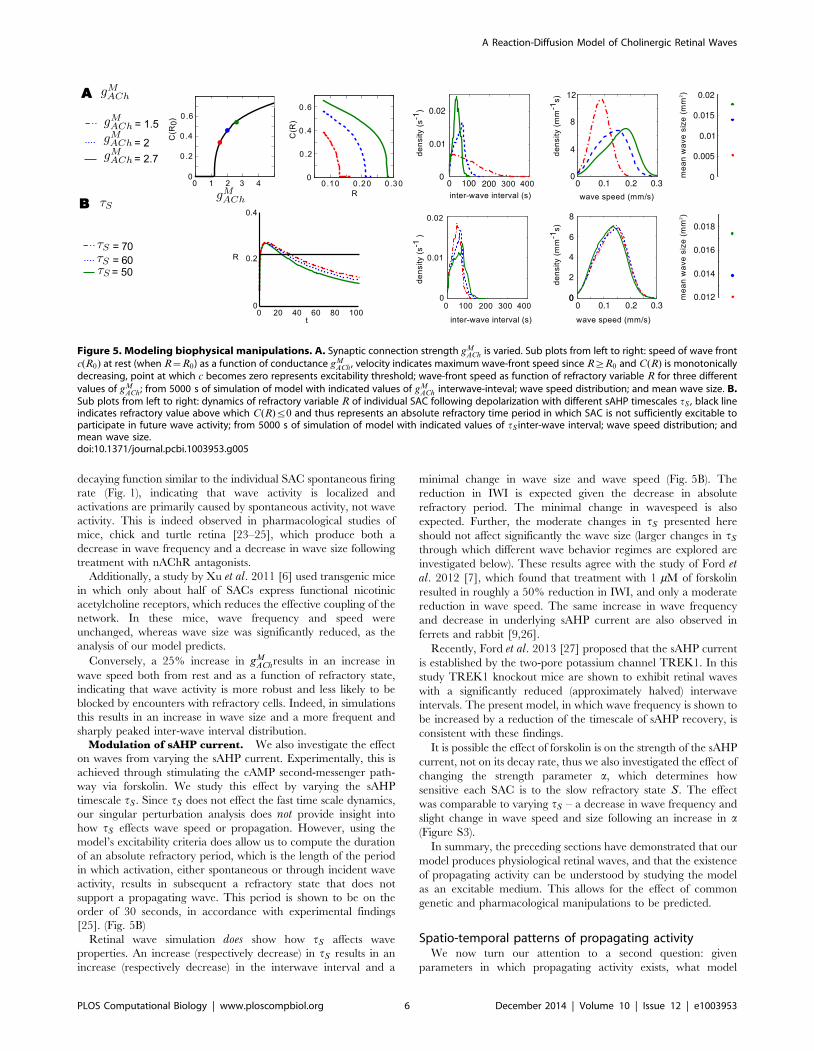
In this regime, retinal wave, or forest fire, sizes are characterized
by a power-law distribution with scaling exponent of approx-
imately h~{1:15 (simulation based [32], theoretical based
[33,34]). Parameters which have the largest and most direct
impact on f and p are the per cell spontaneous firing rate ff , and
the slow refractory variable tS (refer to Fig. 5): these are the
parameters which best determine when criticality may be
observed. Fig. 6 demonstrates that, within the region described
by Equation (3), wave sizes distributions approximately follow a
power law with an estimated exponent close to the expected
h~{1:15. Conversely, simulations performed outside this
parameter region are sub-critical and do not follow an approx-
imate power-law. The same behaviour is observed when the
distribution of wave duration (or lifetimes) are considered (Figure
S4). This is further made clear by looking at the correlation in
voltage activity between cells of a given distance from one another
(Fig. 6C). Parameters for which power-laws are observed produce
an initially high, but sharply decaying correlation function, while
the sub-critical parameter set produces significantly less correlated
activity. This is indicative of the smaller, more localized wave
activity expected in a sub-critical system.
The relationship between the rate of spontaneous firing ff , and
the slow refractory variable tS , dictates whether the network exists
in a critical state. This simple inverse relationship (Fig. 6) can
explain how robust waves with similar spatiotemporal character-
istics exist in very different parameter regimes. Experiments in
mice indicate that SACs depolarize infrequently but exhibit sAHPs
lasting as long as two minutes [7], whereas experiments in rabbit
[9] show a spontaneous depolarization rate an order of mangitude
higher and sAHPs that are substantially shorter. While these two
systems have cellular parameters that differ on an order of
magnitude, their collective network activity is very similar. This
can be explained by the fact that the ratio of ff to tS is conserved
across species.
This analysis can thus be used to predict, given particular
parameters for a particular species, whether or not the wave-size
distribution will be critical or sub-critical. Further, since both
parameters varied here, ff and tS , have no bearing on the
excitability of the medium, the analysis of the spatio-temporal
patterns of the amacrine cell network separates neatly into two
stages. Firstly, if the medium is not excitable then only small,
localized activity is expected. If the medium is excitable then,
secondly, the spatio-temporal patterns expected will depend on the
value of both ff and tS , as discussed here.
Discussion
Comparison to previous studiesClose collaboration with experimentalists means computational
modeling of retinal waves has been notably successful (refer to the
reviews Gjorgjieva and Eglen 2011 [12] and Godfrey and Elgen
2009 [13]). Models have helped identify SACs as the cell layer
which both initiates and laterally propagates waves [35], and have
highlighted the importance of an activity-dependent refractory
period to the generation of physiological waves [10]. Most
recently, the models of Hennig et al. 2009 [11] and Ford et al.2012 [7] (henceforth referred to by their first authors) have
A Reaction-Diffusion Model of Cholinergic Retinal Waves
PLOS Computational Biology | www.ploscompbiol.org 7 December 2014 | Volume 10 | Issue 12 | e1003953
investigated how the cell-intrinsic spontaneous firing rate and the
duration of each cell’s refractory period contributes to physiolog-
ical waves.
Godfrey and Hennig both propose the importance of a
refractory period that scales with the degree of excitation. The
Godfrey model was deterministic, and thus was reliant on the
activity dependent refractory periods to make the dynamics
chaotic and therefore consistent with observed waves – variable in
size, and with shifting wave boundaries.
In the Hennig model, the competition between the synchroniz-
ing force of waves and the desynchronizing force of spontaneous
activity is balanced at physiological wave parameters. This was
adjusted in the Ford model to match the observed low
spontaneous activation rate observed in mice SACs. Physiological
waves were then only observed when each cell’s refractory time
scale was allowed to vary randomly (a hypothesis also pursued in
Feller et al. 1997). Ford hypothesizes that this cell to cell variability
is thus a necessary component of the developing amacrine cell
network.
We find that neither hypothesis is necessary in producing
realistic waves – our model does not contain an activity-dependent
refractory variable or cell to cell variability in parameters. Our
model is stochastic, consisting of sparse spontaneous depolariza-
tions with enough strength to initiate a wave by themselves. These
strong, sparse depolarizations are sufficient to induce variability in
refractory periods. It remains to be shown how this might change
in other species whose spontaneous depolarization rate is much
higher, and in which cell-cell variability or activity-dependent
refractory periods may play a more important role.
Experimental validation of the modelThe model makes several predictions. Firstly, it provides a way
to systematically investigate the effect of different parameters on
both wave propagation and spatiotemporal patterns. One way to
confirm the model experimentally would then be to match (more
closely than was able to be performed in the present study) the
parameters of the model to observed wave statistics such that in a
quantitative fashion the effect of particular pharmacological
manipulations (e.g. nAChR antagonists) could be reliably repro-
duced. The test would then be to predict the outcome of a different
pharmacological manipulation (e.g. cholinesterase inhibition) that
the model was not calibrated against.
A simpler validation would be the following: a prediction the
model makes is that certain parameters affect only the existence of
propagating activity, while certain parameters affect only the form
of that propagating activity (power-law distributed or otherwise).
Thus manipulations that affect only parameters within one of these
classes should have no effect on behaviours determined by
parameters in the other class. For instance, the only effect changes
to parameters of the sAHP current, according to our analysis, is on
the form of the activity – spiral waves, large domain-covering
waves, etc – not on their existence.
Finally, the model predicts the existence of power-law
distributed activity within a particular parameter range based on
an analogy to a forest fire model. There are many different models
of self-organized critical systems which have slightly different rules
and slightly different statistics, and it is not clear that the forest fire
model indeed is the best analog. These different models exhibit
different sub-sampling artifacts, when only a subset of cells are
observed, and these effects thus provide a way of teasing apart
different SOC candidates [36]. Examining sub-sampling effects in
our model’s simulations, and in high-density recordings of in-vivoor in-vitro retinal waves, would provide a way of determining
which model exhibiting criticality is most appropriate.
On the extra-synaptic diffusion of AChPrevious retinal wave studies have hypothesized an extra-
synaptic agent as responsible for wave propagation: Burgi et al.1994 [37], for instance, noted that the relatively slow wave speed is
consistent more with an extra-synaptic agent than either gap
junction or direct synaptic stimulation, and proposed extracellular
potassium as a source of lateral excitation. This particular
hypothesis was later discredited. However diffuse action of ACh
within the IPL has been observed coincident with wave activity,
suggesting that the volume transmission of acetylcholine may
instead play a role [7,38]. Thus, although direct recurrent synaptic
connections between SACs both in mice and in rabbit have been
observed [7,8], there is evidence that the diffuse release of ACh is
responsible for wave propagation: synaptic currents recorded
during waves last several seconds beyond depolarization, suggest-
ing excitation via an extra-synaptic agent; and retinal waves drive
ON and OFF RGCs [39] and cells in the inner nuclear layer [40],
despite the restricted stratification of SAC processes within the IPL
that do not form direct contacts with all cells, again suggesting
propagation via volume transmission.
It is worth pointing out that extra-synaptic neurotransmission is
observed throughout the developing nervous system to produce
correlated spontaneous activity, and thus may be a general
phenomenon regulating a diverse range of developmental
programs. This may happen when the development of neuro-
transmitter release through synaptic vesicle fusion precedes the
expression of the uptake transporters and breakdown enzymes
Figure 6. Power-law distributed wave-size retinal waves. A. Parameter space in which avalanches are expected (gray, Equation 3) and threesample points B. Wave size distributions (points) following 5000 s of simulation on a 128|128 domain for specified values of tS and f {1. Solid linesrepresent log-linear least-squares lines of best fit, having slopes: h~{1:45 (R2~0:95, green), h~{1:01 (R2~0:95, red) and h~{1:14 (R2~0:95,blue) C. Correlation in membrane potential between cells of a given distance apart.doi:10.1371/journal.pcbi.1003953.g006
A Reaction-Diffusion Model of Cholinergic Retinal Waves
PLOS Computational Biology | www.ploscompbiol.org 8 December 2014 | Volume 10 | Issue 12 | e1003953
required to prevent spillover into the extra-cellular space. For a the
review of the role of extra-synaptic stimulation in generating
spontaneous activity refer to Kerschensteiner 2013 [41].
The role of volume transmission has been explored in cortex
[42], hippocampus [43], as well as extensively in stage III
(glutamatergic) retinal waves [17,44,45]. In stage III waves
extra-synaptic glutamate mediates lateral connections between
bipolar cells.
The model presented here represents a theoretical validation
that volume release of ACh is able to mediate stage II retinal
waves. However, further experimental validation is needed beyond
the above observations and this model. It should therefore be
emphasized that the motivation of writing a model based on
diffusion of acetylcholine is not to test the role of volume
transmission. The dense lateral connectivity observed between
SACs (synaptic or otherwise) means that lateral excitation is well
approximated by a diffusion process – the model’s diffusion of
acetylcholine should be interpreted as a phenomenological, or
effective, diffusion, not as a literal diffusion process based on the
net Brownian motion of molecules which allows for singular-
perturbation analysis to be performed.
Indeed, the extent of a SAC’s arborization is only approxi-
mately 100 microns, so that even if synaptic terms were explicitly
included their connectivity would be well-modelled by a short-
range Gaussian weight function similar to the Gaussian kernel that
results from modelling interactions as occurring through a
diffusion process [46]. The only cells in the retina with long range
connections are other types of GABAergic amacrine cells, which
do not alter waves since GABA antagonists play a minor role in
shaping the spatiotemporal features of waves. For these reasons
models with long-range connectivity were not pursued in this
study.
Stage II retinal waves and developmentRetinal waves are one example of spontaneous activity in the
nervous system instructing developmental processes. A number of
processes appear to rely on the activity generated by retinal waves.
Indeed, they have been shown to coordinate activity throughout
the visual system [19]. In animals in which waves are blocked, the
formation of the retinotopic map [47], the separation of
retinogeniculate projections into eye-specific layers of the LGN
[6], and the formation of ocular dominance and orientation
selectivity [5] (and references therein) are all adversely effected.
Retinal waves are thus believed to provide a naturalistic
stimulus from which downstream connections can be refined
and stablized. However, it remains unclear how important the
spatiotemporal patterns of the activity are, or whether any activity,
regardless of its properties (size, speed, typical shape), would suffice
to provide input for correct development to occur. Hennig et al.2009 [11], for instance, suggests that the critical form of the retinal
waves are a useful feature, because, by definition, critical-state
activity consists of events possessing no intrinsic length scale, they
thereby provide an input without bias to any particular feature
length. Godfrey et al. 2009 [48], on the other hand, investigates
this question explicitly in a model of retinotopic map refinement
and finds that the only feature which affects the degree of
refinement is the spatial correlation activity function – the size,
speed and frequency of the waves otherwise had no effect.
If correlation structure of retinal activity is the main factor
regulating downstream developmental processes, then how is this
structure dependent on the spatiotemporal properties of retinal
waves? Are scale-free, critical ‘avalanches’ the only form of activity
that provide the necessary correlation structure? In other areas (i.e.cortex), a network operating at a critical state can be shown to be
optimal for information processing, and for maintaining a high
dynamic range [49,50]: there is some functional role for criticality
(as discussed in Shew and Plenz 2013 [51]), but its significance
remains controversial [52]. Retinal waves provide a useful study
into the functional role of criticality, as they occur within well
defined and understood circuitry where the above questions can be
asked and thus critical activity can (potentially) be assigned a
specific developmental role.
Self-organized criticalityOur study focused in particular on a forest fire model
extensively studied in the context of complex systems and critical
phenomena for its potential demonstration of self-organized
criticality (SOC). This connection between correlated activity
within the central nervous system and the DS-FFM has been noted
before (e.g. Buice and Cowan 2009 [53]). The DS-FFM model is
not without its issues: while initial theoretical results [30,33]
provided justification for numerically observed scaling behavior,
subsequent, more extensive, numerical analysis [32] demonstrate
the power-law scaling behavior to be transient and not reflective of
the ‘true’ asymptotic behavior. Indeed, a variety of scaling
parameter (t) estimates have been observed for different parameter
values and lattice sizes (refer to the summary presented in
Pruessner 2012 [54]).
In theory, critical behavior is expected as the ratio h~f =p tends
to infinity. However, this limit corresponds to lightning strikes
becoming increasingly rare, such that in simulations, for
sufficiently large h, strikes are rare enough that the entire domain
recovers by the time the next strike hits, and the resulting
dynamics are simply that the fire spreads across the entire domain.
Thus, in practice, critical behavior is to be expected when h is
large, yet the characteristic length scale remains small compared to
the lattice size. In addition to this behavior, for sufficiently large p
values spiral wave fronts are observed [55]. These behaviours –
propagating ‘critical’, stationary rotating spirals and radially
symmetric domain-covering waves are the three regimes of
spatially extending activity observed in simulation of the present
model, and as classified in previous models [56]. The latter two
behaviours are likely to occur in parameter regimes where the
spontaneous activation rate is sparse, thus creating large scale
structures, and where, relative to the wave-front speed, the rate of
recovery is either too fast (spiral waves) or too slow (domain-
covering radial waves). Though more systematic study is needed in
these cases, we argue the principle value of the analogy to the DS-
FFM is not evidence of critical behavior in the developing retina
(as it is not clear the DS-FFM is critical in a strict sense), but is the
insight it provides into when and how these different regimes will
be observed.
Wider contextThis work shows that a model based on lateral excitation
through the diffusion of ACh can account for physiological retinal
waves, and can predict how wave dynamics consequently depend
on biophysical parameters. Specifically, by determining when the
retinal network is excitable and through analogy to a canonical
forest-fire model, the spatiotemporal patterns observed in different
parameter regimes can be understood. This framework is shown to
be consistent with previous experimental studies.
We note that the nature of this analysis is novel: the singular
perturbation and traveling front construction analysis presented
here has not been extended before, from the well studied and more
stereotyped waves studied in cortex, to the considerably more
complicated wave behavior observed in the developing retina.
A Reaction-Diffusion Model of Cholinergic Retinal Waves
PLOS Computational Biology | www.ploscompbiol.org 9 December 2014 | Volume 10 | Issue 12 | e1003953

A number of avenues for future work present themselves. First,
the reaction-diffusion component of the model can be naturally
applied to glutamatergic waves, for which there is more significant
evidence that diffusion is indeed a key excitatory process.
Mechanistic models of stage III waves have recently been
developed [44,45], and would benefit from computational
modeling to establish their validity. It is proposed in stage III
waves that lateral excitation occurs via the diffusion of extra-
synaptic glutamate released by bipolar cells in the ganglion cell
layer, and that GABAergic connections from amacrine cells to
bipolar and ganglion cells provides a source of inhibition that is
absent during stage II waves. Changes to the present model to a
model of stage III waves would therefore be significant, however
the framework to both analyze and simulate the resulting model
would remain the same.
Second, the connection between between criticality and
development can also be explored in much more depth than
was performed in this study.
We believe the approaches developed here may also be applied
to other forms of spontaneous and correlated activity in the
nervous system.
Models
The modelSACs are assumed to obey dynamics based on a Morris-Lecar
[11] model, which includes a quasi-stationary voltage dependent
calcium conductance. The voltage dynamics are described by
CmVt~{gCa(V{VCa){gK (V{VK ){gML (V{VL)
{gACh(V{Vsyn){gMn N(V{VCa),
where
gCa(V )~1
2gM
Ca 1z tanhV{V1
V2
� �� �,
gK (R)~gMK R,
L(V )~ coshV{V3
2V4
� �,
R?(V )~1
21z tanh
V{V3
V4
� �� �,
are the standard Morris-Lecar auxiliary functions. The model also
includes an ACh conductance (gACh(A)) which depends on the
local concentration of acetylcholine (A):
gACh(A)~gMACh
dA2
1zdA2:
Additionally, a slow AHP variable (S) is activated according to a
voltage-dependent function G(V ) with time scale tACh:
St~cG(V ){S
tS
G(V )~1
1z exp ½{k(V{V0)� :
The sAHP variable enters the dynamics through its effect on
refractory variable R as follows
tRRt~L(V )(R?{R)zaS(1{R),
where L(V ) is defined above as part of the Morris-Lecar
equations.
Cells are indexed by a continuous spatial parameter xsuch that the state space is described by the tuple
(V (x,t),R(x,t),S(x,t),A(x,t)), where V (x,t) is the membrane
potential. On spiking, cells release ACh at a voltage dependent
rate bG(V ) which diffuses with coefficient D:
At~D+2AzbG(V){A
tACh
G(V )~1
1z exp ½{k(V{V0)� :
Coupling between SACs occurs only through the diffusion of
ACh.
To induce spontaneous depolarizations, a noisy, excitatory
current is included in simulations:
gMn N(V{VCa),
where at each time-step N is a Bernoulli random variable
(N*B(1,p)). Refer to Table 1 for the parameter values used. The
value of p is chosen such that the mean waiting time between
sponataneous noisy channel openings matches approximately the
rate of intrinsic spontaneous bursts observed in mouse retina
recordings [7].
Computational methodsNumerical integration was performed using a time-splitting
method, in which the diffusion term was computed using a locally
one dimensional Crank-Nicolson method and the reaction term
was computed using a two-stage Runge-Kutta method. Simula-
tions were computed in MATLAB (version 7.14.0; R2012a.
Natick, Massachusetts: The Mathworks, Inc., 2012) using a 64664
grid with a fixed step size of 1 ms. The stochastic conductance
variable was updated every 10 ms. Simulation data used in
statistical analysis was from 2500 s of simulation on a 4 mm2
domain (L~2mm), following a 500 s warm-up period. The
dimensions chosen mean that one grid point has a length of
approximately 30 mm – roughly the density of SACs in the inner
plexiform layer [56]. Simulations were performed on a dual 6-core
Intel Xeon 3.07 Ghz machine with 24 GB RAM, running Ubuntu
12.04. MATLAB code to run simulations is available for download
at: https://github.com/benlansdell/retinalwaves.
Simulation statisticsStatistical analysis is performed as follows: snapshots of the
simulation are taken every 10 time steps (10 ms). To remove
boundary effects, grid points 5 units or less from the boundary are
A Reaction-Diffusion Model of Cholinergic Retinal Waves
PLOS Computational Biology | www.ploscompbiol.org 10 December 2014 | Volume 10 | Issue 12 | e1003953

not considered for analysis. All grid points whose potential is above a
threshold of 260 mV are labeled as active. All active points
adjacent to one another are assigned a common wave number. For
each set of cells assigned that number: the time from the first active
cell to the last active cell is its wave duration, and the total number of
cells is its size. The wave speed is calculated as in Blankenship et al.2009 [17]: the wave initiation and termination points are identified
and the path the wave front travels between these two points is
computed. This allows the maximum wave front speed for that
wave to be computed, and the distance this wave front travels
divided by the wave duration gives an average wave speed. To give
better estimates of the wave front speed, waves which involve the
activation of fewer than 50 cells or whose duration is less than 1 s
are ignored, and waves which do not have a distinct initiation point
and are therefore the result of two waves colliding are also omitted
(Figure S1). The interwave-intervals are computed by considering
all above threshold wave activity, collisions or otherwise, and, for
each grid point, measuring the time between successive threshold
crossings. A minimum IWI of 2 s was imposed.
A note on thresholds and smoothing voltagesPrevious models of retinal waves consisted of two layers: an
amacrine cell layer, which initiated and laterally propagated
activity, and a ganglion cell layer, which acted as a smoothed ‘read
out’ layer [35]. Subsequent models did away with the ganglion cell
layer, and modeled only SACs [10,11]. However, without this
read-out later, wave analysis based directly on thresholding SAC
potentials is noisy, making wave front tracking more difficult and
wave ‘collisions’ more common. In order to compare simulated
waves to recorded waves, Godfrey et al. 2007 [10] thus compute a
calcium response variable, in which wave fronts are smoothed.
Our simulations (Fig. 2A), and experiments [7] show highly
variable participation in wave activity on a cell-cell basis. Thus to
compare our simulations to calcium imaging data, which is based on
filtered RGC activity, we lower the threshold for which a cell is
counted as participating in a wave to the ACh release threshold (near
255 mV), instead of its spiking threshold. This thus reflects the
‘general excitation’ of the region, not individual SAC activity, which
makes it better suited for comparison with calcium imaging data.
With this threshold, smoothing our data did not have a significant
effect on wave labeling, so was not implemented (Figure S2).
BifurcationsAUTO [57] was used for the numerical continuation of
traveling fronts and bifurcation analysis.
Mathematical analysisIn order to analyze the model we first perform non-
dimensionalisation, the parameters and scalings are outlined in
Table 2. Non-dimensional dynamic variables are named in lower-
case. To non-dimensionalise we make the following change of
variables:
V~VCav, R~r, A~tAChba, S~tScs
and scale time (dimensioned quantity here denoted by a capital T )
and space (capital X ) such that
T~Cm
gMK
t, X~
ffiffiffiffiffiffiffiffiffiffiffiDCm
gMK
sx:
Then:
vt~{~ggCa(v)(v{1){r(v{vK ){~ggML (v{vL){~ggACh(a)(v{vACh),
rt~1
~ttR
½l(v)(r?(v){r)z~aas(1{r)�,
st~1
~ttS
(g(v){s),
Table 1. Parameters for retinal waves model.
Parameter Value Parameter Value
Cm 0.160 nF V2 20 mV
VCa 50 mV V3 225 mV
VK 290 mV V4 40 mV
Vsyn 50 mV k 2
VN 50 mV k 0.2 mV{1
VL 270 mV V0 240 mV
gMACh
2 nS D 0.01 mm2s{1
gMCa
10 nS b 5 nM:s{1
gMK
30 nS d 800 nM{2
gML
3 nS tR 5 s
V1 220 mV tACh 0.2 s
Vn 50mV tS 60 s
a 2 m 5
L 2 mm c 0.3 s{1
Dimensioned parameters used in numerical simulations unless otherwise specified in text. The chosen length of domain (2 mm) and a simulation of a 64|64 squarelattice corresponds to approximation one SAC per grid point assuming an average distance between SACs of approximately 30 microns.doi:10.1371/journal.pcbi.1003953.t001
A Reaction-Diffusion Model of Cholinergic Retinal Waves
PLOS Computational Biology | www.ploscompbiol.org 11 December 2014 | Volume 10 | Issue 12 | e1003953

at~+2az1
~ttACh
(g(v){a),
with
g(v)~1
1z exp ½{~kk(v{v0)�
~ggCa(v)~1
2~ggM
Ca 1z tanhv{v1
v2
� �� �
~ggACh(a)~~ggMACh
~dda2
1z~dda2
l(v)~ coshv{v3
2v4
� �
r?(v)~1
21z tanh
v{v3
v4
� �� �:
To proceed, let E~1=~ttR, Eh~1=~ttS and a~p
f (v,r,a)~{~ggCa(v)(v{1){r(v{vK ){~ggML (v{vL){~ggACh(a)(v{vACh),
h(v,r,s)~1
~ttR
½l(v)(r?(v){r)z~aas(1{r)�,
k(x,v)~{xzg(v),
to give:
vt~f (v,r,a),
rt~Eh(v,r,s),
st~Ehk(s,v),
at~+2azk(a,v)
~ttACh
, ð4Þ
which we analyze as a fast-slow system as is standard (refer to
Ermentrout and Terman 2010 [22], or Keener and Sneyd 2001
[21]). The methods described below make no attempt to rigorously
establish the existence of traveling fronts or waves.
Wave frontsThis scaling of space and time is appropriate in regions where
the diffusion term is relevant, thus the system obtained by letting
E?0
vt~f (v,a; r),
at~+2azk(a,v)
~ttACh
, ð5Þ
provides an approximate description of the wave fronts and backs.
The variable r is here considered a parameter. To construct wave
front solutions in one spatial dimension, change coordinates to a
frame moving with speed c:
x’~x{ct, t’~t
so that
vt’{cvx’~f (v,a; r),
at’{cax’~+2azk(a,v)
~ttACh
:
Table 2. Dimensionless parameters for retinal waves model.
Parameter Relation Value Parameter Relation Value
vK VK=VCa 21.8 v0 V0=VCa 20.8
vACh VACh=VCa 1 v1 V1=VCa 20.4
vL VL=VCa 21.4 v2 V2=VCa 0.4
�ggCa gMCa=gM
K1/3 v3 V3=VCa 20.5
�ggACh gMACh=gM
K1/15 v4 V4=VCa 0.8
�ggL gML =gM
K1/10 ~kk kVCa 10
1~ttR
Cm=(tRgMK ) 0.001067 ~DD (CmD)=(gM
K L2) 1.333|10{5
1~ttACh
Cm=(tAChgMK ) 0.02667 ~dd dt2
AChb2 800
1~ttS
Cm=(tSgMK ) 8.88|10{5 ~aa atSc 36
Dimensionless parameters used in analysis of model and their values.doi:10.1371/journal.pcbi.1003953.t002
A Reaction-Diffusion Model of Cholinergic Retinal Waves
PLOS Computational Biology | www.ploscompbiol.org 12 December 2014 | Volume 10 | Issue 12 | e1003953
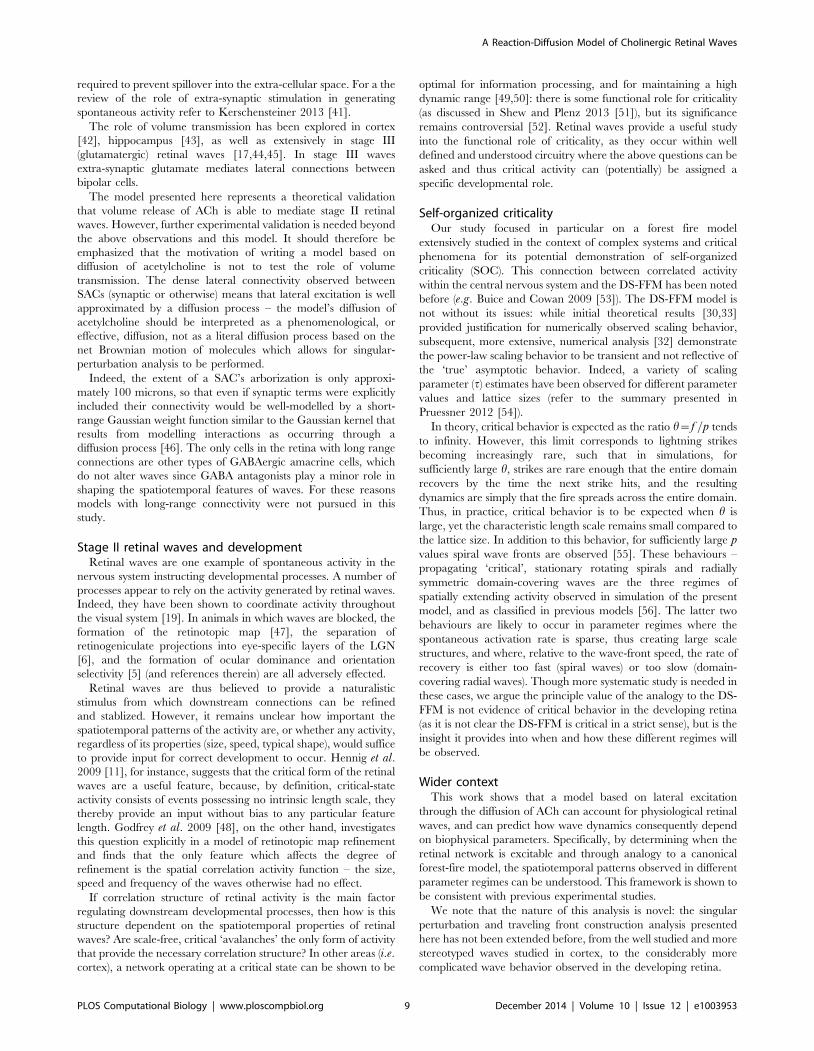
A traveling front corresponds to the stationary solutions:
0~f (v,a; r)zcv’zEv’’,
0~ca’za’’zk(a,v)
~ttACh
: ð6Þ
where 0~d
dx’. A bounded wave front solution, if it exists,
corresponds to a heteroclinic orbit connecting the rest fixed point
to the excited fixed point of Equation 6. In order to obtain this
heteroclinic orbit, Equation 5 was simulated in MATLAB with a
sigmoid function connecting the rest and excited fixed points for
initial data. Once the solution had sufficient time to converge to
the traveling front solution, its profile was saved, its wave speed
calculated, and these two pieces of data put into the AUTO
subpackage homcont to perform continuation on the system
described in Equation 6. This allows for the computation of c(r) –
the wave speed as a function of refractory state.
Excitability thresholdsWe seek to determine when the medium is sufficiently
excitable to support a traveling front solution. In two variable
neuronal systems such as Fitzhugh-Nagumo or Morris-Lecar, in
which case the fast dynamics are one dimensional, an energy
argument can provide conditions under which the medium is
excitable (e.g. Ermentrout and Terman 2010 [22]). This is not
possible since the fast dynamics are here two dimensional. So, let
r0 be the unique fixed point of Equation 4. We aim to find
parameters for which c(r0)w0, which, assuming the front we are
studying is excited to the left and at rest to the right, will
correspond to a propagating front. Parameters for which c(r0)v0will generate a receding front, and thus parameters for which
c(r0)~0 corresponds to the transition between excitable and not.
This is found using AUTO.
These results are compared to model simulations without the
noise channel. The simulations are performed for different
parameters for a simulated time of 10 s, with an initial condition
in which the domain is at rest besides a small cluster of grid points
on one side of the domain. Excitability is determined by measuring
if activity above an ‘excited’ threshold is observed on the other side
of the domain – from which we infer that a wave must have
traversed the simulated retina.
Relation between one dimensional analysis and twodimensional simulations
Our analysis is performed in one spatial dimension only.
Moving to two dimensions has the following effect: the Laplacian
in radially symmetric polar coordinates is
+2~L2f
Lr2z
1
r
Lf
Lr,
which, for large r, approximates the one dimensional Laplacian
operator. Thus we expect, for waves of large radius, the results we
find for one spatial dimension will apply. Indeed, performing the
above simulations to determine excitability threshold with either a
small cluster of initially excited cells (thus simulating a 2D, but
radially symmetric solution) or with an entire strip of initially
excited cells (thus simulating essentially the 1D dynamics) showed
negligible difference (S5 Figure).
Supporting Information
Figure S1 Determining speed of wave front for twoexample waves. Black corresponds to earlier times, and orange to
later. At the latest time the wave is active, the wave front which
connects the most distal point from the initiation point is tracked.
Starting at this final point and moving backward in units of 0.5 s, the
next closest active point to the current one draws the wave front
trajectory in reverse, as demonstrated in A. This process does not
make sense if a wave is the result of a collision, as shown in B. Waves
that are involved in a collision have more than one start point
(additional start point shown as single green circle), meaning there is
ambiguity in how to apply the wave speed algorithm. The wave speeds
for these waves (shown in right subplot) are not counted in our analysis.
(EPS)
Figure S2 Effect of thresholds and smoothing on wavelabeling. Snapshot of a thresholded and subsequently labeled
wave from voltage data A. without B. and with C. smoothing.
Threshold was set to 260 mV to produce wave forms which, by
eye, match waves shown in voltage data.
(EPS)
Figure S3 Effect of varying sAHP sensitivity parametera. Statistics following 5000 s of simulation of model with indicated
values of a – interwave interval; wave speed distribution; and
mean wave size. Comparison to Fig. 5 shows varying a has a
similar effect to varying the timescale tS . Note that varying the
sAHP sensitivity parameter a or varying the rate of activation
parameter c have identical impact on the model – as can be seen
from the dimensional analysis summaryized in Table 2.
(EPS)
Figure S4 Distributions of wave duration (lifetime).Distribution of wave duration on logarithmic scale following
5000 s simulation on a 1286128 grid point domain for specified
values of tS and f {1. For reference, the dotted black curve shows
a theoretical distribution of the form p(s)*s{a for a~{1:2 as
observed in large-scale simulations of the DS-FFM model [54].
Comparison to Fig. 6 shows that SOC is not predicted for the
parameters drawn in green, which indeed is clearly sub-critical.
(EPS)
Figure S5 Determination of excitability thresholdsthrough numerical simulation, comparison between 1Dand 2D simulations. Curves show parameter values for which
medium is excitable, estimated through numerical simulation of the
model as described in ‘Models: Excitability thresholds’. Computa-
tions are performed with an initial condition of either an excited
strip of SACs A., or an excited point of SACs B., thus simulating the
1D and 2D radially symmetric systems, respectively. Computed for
three different values of time-scale parameter E. The figures are
identical, indicating that the excitability thresholds obtained from
analysis of the 1D system can also apply to a 2D domain.
(EPS)
Movie S1 500 s of simulation of retinal waves model.Simulation of 42 mm of retina played at 106 speed. Left panel to
right panel: voltage potential (V ), sAHP variable (S), and
acetylcholine variable (A). A higher resolution version can be
found at https://github.com/benlansdell/retinalwaves.
(MP4)
Acknowledgments
The authors would like to thank Pedro Maia, Eli Shlizerman and Julijana
Gjorgjieva for discussion and feedback on this work.
A Reaction-Diffusion Model of Cholinergic Retinal Waves
PLOS Computational Biology | www.ploscompbiol.org 13 December 2014 | Volume 10 | Issue 12 | e1003953

Author Contributions
Conceived and designed the experiments: BL KF JNK. Analyzed the data:
BL JNK. Contributed reagents/materials/analysis tools: BL JNK. Wrote
the paper: BL KF JNK.
References
1. Moody W, Bosma M (2005) Ion channel development, spontaneous activity, andactivity-dependent development in nerve and muscle cells. Physiol Rev 85: 883–
941.2. Blankenship A, Feller M (2010) Mechanisms underlying spontaneous patterned
activity in developing neural circuits. Nat Rev Neurosci 11: 18–29.
3. Wong R (1999) Retinal Waves and Visual System Development. Annu RevNeurosci 22: 29–47.
4. Ford K, Feller M (2012) Webvision: Formation of Early Retinal Circuits in theInner Plexiform Layer. http://webvision.med.utah.edu/. Accessed 21 Septem-
ber 2014.
5. Huberman AD, Feller M, Chapman B (2008) Mechanisms underlyingdevelopment of visual maps and receptive fields. Annu Rev Neurosci 31: 479–
509.6. Xu H, Furman M, Mineur YS, Chen H (2011) An instructive role for patterned
spontaneous retinal activity in mouse visual map development. Neuron 70:1115–1127.
7. Ford KJ, Felix AL, Feller MB (2012) Cellular mechanisms underlying
spatiotemporal features of cholinergic retinal waves. J Neurosci 32: 850–63.8. Zheng J, Lee S, Zhou ZJ, Rock L (2004) A developmental switch in the
excitability and function of the starburst network in the mammalian retina.Neuron 44: 851–864.
9. Zheng J, Lee S, Zhou ZJ (2006) A transient network of intrinsically bursting
starburst cells underlies the generation of retinal waves. Nat Neurosci 9: 363–371.
10. Godfrey KB, Swindale NV (2007) Retinal wave behavior through activity-dependent refractory periods. PLoS Comput Biol 3: e245.
11. Hennig MH, Adams C, Willshaw D, Sernagor E (2009) Early-stage waves in theretinal network emerge close to a critical state transition between local and
global functional connectivity. J Neurosci 29: 1077–86.
12. Gjorgjieva J, Eglen S (2011) Modeling developmental patterns of spontaneousactivity. Curr Opin Neurobiol 21: 679–84.
13. Godfrey KB, Eglen SJ (2009) Theoretical models of spontaneous activitygeneration and propagation in the developing retina. Mol Biosyst 5: 1527–1535.
14. Adelsberger H, Garaschuk O, Konnerth A (2005) Cortical calcium waves in
resting newborn mice. Nat Neurosci 8: 988–90.15. Allene C, Cossart R (2010) Early NMDA receptor-driven waves of activity in the
developing neocortex: physiological or pathological network oscillations?J Physiol 588: 83–91.
16. Beggs JM, Plenz D (2003) Neuronal avalanches in neocortical circuits.J Neurosci 23: 11167–11177.
17. Blankenship AG, Ford KJ, Johnson J, Seal RP, Edwards RH, et al. (2009)
Synaptic and extrasynaptic factors governing glutamatergic retinal waves.Neuron 62: 230–41.
18. Morris C, Lecar H (1981) Voltage oscillations in the barnacle giant muscle fiber.Biophys J 35: 193–213.
19. Ackman JB, Burbridge TJ, Crair MC (2012) Retinal waves coordinate patterned
activity throughout the developing visual system. Nature 490: 219–225.20. Stafford B, Sher A, Litke AM, Feldheim DA (2009) Spatial-Temporal Patterns of
Retinal Waves Underlying Activity- Dependent Refinement of RetinofugalProjections. Neuron 64: 200–212.
21. Keener J, Sneyd J (2001) Mathematical Physiology. New York: Springer.
22. Ermentrout G, Terman D (2010) Mathematical foundations of neuroscience.New York: Springer.
23. Sernagor E, Eglen SJ, O9Donovan MJ (2000) Differential effects of acetylcholineand glutamate blockade on the spatiotemporal dynamics of retinal waves.
J Neurosci 20: RC56.24. Sernagor E, Young C, Eglen SJ (2003) Developmental modulation of retinal
wave dynamics: shedding light on the GABA saga. J Neurosci 23: 7621–9.
25. Bansal A, Singer JH, Hwang BJ, Xu W, Beaudet A, et al. (2000) Mice lackingspecific nicotinic acetylcholine receptor subunits exhibit dramatically altered
spontaneous activity patterns and reveal a limited role for retinal waves informing ON and OFF circuits in the inner retina. J Neurosci 20: 7672–7681.
26. Stellwagen D, Shatz CJ, Feller MB (1999) Dynamics of retinal waves are
controlled by cyclic AMP. Neuron 24: 673–685.27. Ford K, Arroyo D, Kay J, Lloyd EE, Bryan RM, et al. (2013) A role for TREK1
in generating the slow afterhyperpolarization in developing starburst amacrinecells. J Neurophysiol 109: 2250–2259.
28. Petermann T, Thiagarajan TC, Lebedev Ma, Nicolelis MaL, Chialvo DR, et al.(2009) Spontaneous cortical activity in awake monkeys composed of neuronal
avalanches. Proc Natl Acad Sci U S A 106: 15921–6.
29. Bak P, Tang C, Wiesenfeld K (1988) Self-organized criticality. Phys Rev A AtMol Opt Phys 38: 364–374.
30. Drossel B, Schwabl F (1992) Self-organized critical forest fire model. Phys RevLett 69: 1629–1632.
31. Bak P, Chen K, Tang C (1990) A forest-fire model and some thoughts on
turbulence. Phys Lett A 147: 297–300.32. Grassberger P (2002) Critical behaviour of the Drossel-Schwabl forest fire
model. New J Phys 4: 1–8.33. Loreto V, Pietronero L, Vespignani a, Zapperi S (1995) Renormalization group
approach to the critical behavior of the forest-fire model. Phys Rev Lett 75: 465–
468.34. Hergarten S, Krenn R (2011) A semi-phenomenological approach to explain the
event-size distribution of the Drossel-Schwabl forest-fire model. Nonlin ProcessesGeophys 18: 381–388.
35. Feller MB, Butts Da, Aaron HL, Rokhsar DS, Shatz CJ (1997) Dynamicprocesses shape spatiotemporal properties of retinal waves. Neuron 19: 293–306.
36. Priesemann V, Munk MHJ, Wibral M (2009) Subsampling effects in neuronal
avalanche distributions recorded in vivo. BMC Neurosci 10: 40.37. Burgi P, Grzywacz NM (1994) Model based on extracellular potassium for
spontaneous synchronous activity in developing retinas. Neural Comput 6: 983–1004.
38. Syed MM, Lee S, Zheng J, Zhou ZJ (2004) Stage-dependent dynamics and
modulation of spontaneous waves in the developing rabbit retina. J Physiol 560:533–49.
39. Wong RO, Oakley DM (1996) Changing patterns of spontaneous burstingactivity of on and off retinal ganglion cells during development. Neuron 16:
1087–95.40. Wong R, Chernjavsky A, Smith S, Shatz C (1995) Early functional neural
networks in the developing retina. Nature 374: 716–718.
41. Kerschensteiner D (2013) Spontaneous Network Activity and SynapticDevelopment. Neuroscientist 20: 1–19.
42. Allene C, Cattani A, Ackman JB, Bonifazi P, Aniksztejn L, et al. (2008)Sequential generation of two distinct synapse-driven network patterns in
developing neocortex. J Neurosci 28: 12851–63.
43. Cattani AA, Bonfardin VD, Represa A, Ben-Ari Y, Aniksztejn L (2007)Generation of slow network oscillations in the developing rat hippocampus after
blockade of glutamate uptake. J Neurophysiol 98: 2324–36.44. Akrouh A, Kerschensteiner D (2013) Intersecting circuits generate precisely
patterned retinal waves. Neuron 79: 322–34.45. Firl A, Sack GS, Newman ZL, Tani H, Feller MB (2013) Extrasynaptic
glutamate and inhibitory neurotransmission modulate ganglion cell participation
during glutamatergic retinal waves. J Neurophysiol 109: 1969–78.46. Whitney IE, Keeley PW, Raven Ma, Reese BE (2008) Spatial patterning of
cholinergic amacrine cells in the mouse retina. J Comp Neurol 508: 1–12.47. Chandrasekaran AR, Shah RD, Crair MC (2007) Developmental homeostasis of
mouse retinocollicular synapses. J Neurosci 27: 1746–55.
48. Godfrey KB, Eglen SJ, Swindale NV (2009) A multi-component model of thedeveloping retinocollicular pathway incorporating axonal and synaptic growth.
PLoS Comput Biol 5: e1000600.49. Beggs JM (2008) The criticality hypothesis: how local cortical networks might
optimize information processing. Philos Trans A Math Phys Eng Sci 366: 329–
43.50. Shew WL, Yang H, Petermann T, Roy R, Plenz D (2009) Neuronal avalanches
imply maximum dynamic range in cortical networks at criticality. J Neurosci 29:15595–600.
51. Shew WL, Plenz D (2013) The functional benefits of criticality in the cortex.Neuroscientist 19: 88–100.
52. Beggs JM, Timme N (2012) Being critical of criticality in the brain. Front Physiol
3: 1–14.53. Buice MA, Cowan JD (2009) Statistical mechanics of the neocortex. Prog
Biophys Mol Biol 99: 53–86.54. Pruessner G (2012) Self-organised criticality: theory, models and characterisa-
tion. Cambridge: Cambridge University Press.
55. Clar S, Drossel B, Schwabl F (1996) Forest fires and other examples of self-organized criticality. J Phys: Cond Mat 8: 1–37.
56. Butts DA, Feller MB, Shatz CJ, Rokhsar DS (1999) Retinal waves are governedby collective network properties. J Neurosci 19: 3580–93.
57. Doedel EJ (2007) Auto 2007p: Continuation and bifurcation software forordinary differential equations (with homcont). http://cmvl.cs.concordia.ca/
auto. Accessed 21 September 2014.
A Reaction-Diffusion Model of Cholinergic Retinal Waves
PLOS Computational Biology | www.ploscompbiol.org 14 December 2014 | Volume 10 | Issue 12 | e1003953