Embed Size (px)
Citation preview
A REBALANCING CHINA AND RESURGING INDIA
Pub
lic D
iscl
osur
e A
utho
rized
Pub
lic D
iscl
osur
e A
utho
rized
Pub
lic D
iscl
osur
e A
utho
rized
Pub
lic D
iscl
osur
e A
utho
rized

A Rebalancing China and Resurging India: How will the pendulum swing for Russia?
This report is written by staff and consultants of the World Bank. The findings, interpretations and conclu-sions expressed herein are those of the authors and should not be attributed in any manner to the Board of Executive Directors the World Bank or the governments they represent, the Government of the Russian Federation, or any of the reviewers. Any mistakes found in the report are the sole responsibility of the authors and the World Bank does not guarantee the accuracy of the data included in this work.
ISBN 978-5-9618-0085-2
© The World Bank, The World Bank Group, 2017.www.worldbank.org
Printed in RussiaAlex Publishersalexpublishers.ru

A Reader’s Guide
This report assesses the future impact of two dynamically transforming economies – China and India – on Russia’s economy. China is rebalancing its economy whereas India is rapidly expanding. What does this hold for Russia? The report begins with a snapshot of fi ndings, followed by eight chapters. Chapter 1 motivates the topic and identifi es analytical and empirical gaps that this report fi lls. Chapter 2 examines the current pattern of trade between Russia and the two countries, and it discusses how important – or not – China and India’s economies are for Russia. Chapter 3 follows by summarizing the results of three complementary approaches for measuring Russia’s trade potential with China and India (and also the rest of the world). Chapter 4 intuitively describes the customized methodology developed for this report; its major caveats and assumptions, and its possible extensions (technical details, for those interested, are in the annexes). Chapter 5 outlines four plausible scenarios of the potential impact on Russia of changes in China and India, and chapter 6 presents the results. Chapter 7 explores the sensitivity of results to changes key in assumptions. Finally, chapter 8 concludes with emerging policy implications for Russia.
Contents
A Snapshot of Findings ...................................................................................................................................................................... 11
1. Exploring the Trinity of China, India, and Russia: Why it Matters? .................................................................................. 21
2. Russia’s Pivot East? Exploring Current Trade Patterns ......................................................................................................... 25
3. From Under-trading to Over-trading: Boosting Russian Exports to China and India.............................................. 33
Measuring Russia’s trade openness ........................................................................................................................................ 33
(i) The gravity model of trade: Russia under-trades with many countries ................................................................ 34
(ii) Russia’s revealed comparative advantage: Beyond primary products, construction and transport
services stand out .................................................................................................................................................................... 37
(iii) Examining Russia’s trade complementarity index: There is greater complementarity with India
than with China ....................................................................................................................................................................... 39
4. Methodology, Caveats, and Extensions ................................................................................................................................... 41
5. Simulating the Future: Presenting Four Key Scenarios ...................................................................................................... 45
6. Simulating the Future: Presenting the Results ...................................................................................................................... 47
6.1. Scenario 1 – China’s Slowdown: This would have little impact on Russian growth but a more
substantial impact on welfare .......................................................................................................................................... 47
6.2. Scenario 2—China’s Rebalancing: This would have small, positive eff ects on growth and welfare
in Russia .................................................................................................................................................................................... 52
6.3. Scenario 3—India’s Expansion: This would signifi cantly boost Russian exports but have little
impact on growth or welfare ............................................................................................................................................ 57
6.4. Scenario 4—India’s expansion, China’s slowdown and its rebalancing: This combination would
have little net impact on Russia ....................................................................................................................................... 61
7. Simulating the Future: A Discussion on Sensitivity ............................................................................................................. 63
8. The Swinging Pendulum: Policy Implications for Russia ................................................................................................... 71
Bibliography ........................................................................................................................................................................................... 73
Annex 1: Mapping Between the ENVISAGE Model and GTAP Database .......................................................................... 77
Annex 2: Literature Review- Impact of Transformations in China....................................................................................... 83
Annex 3: Foreign Direct Investment in Russia ........................................................................................................................... 87
Annex 4: Supplementary Tables and Figures Related to the Simulation Scenarios ..................................................... 91
Annex 5: Russia’s Current Trade Patterns ..................................................................................................................................... 93
Russia, China, and India’s Trade and FDI Flows ...................................................................................................................... 93
Composition and direction of Russia’s merchandise and services trade ..................................................................... 93
Sectors contributing to Russia’s export growth .................................................................................................................... 98
Annex 6: Presentation of the CGE model ..................................................................................................................................... 99
5Contents
Figures
Figure 1: Growth in China has consistently exceeded the global growth rate .............................................................. 21
Figure 2: Data on consumption and investment reveal little rebalancing in China ..................................................... 23
Figure 3: China’s share of services in GDP is rising ................................................................................................................... 23
Figure 4: Growth in India is highly cyclical, but it is trending upwards ............................................................................ 24
Figure 5: China is an important trading partner for advanced economies and EMDEs (2015) ................................ 25
Figure 6: Russia’s trade with China has expanded sharply (USD, billions) ....................................................................... 26
Figure 7: Russian exports to China consist mostly of fuels, 2015 ........................................................................................ 26
Figure 8: Russian imports from China are mostly manufactures, 2015 ............................................................................ 26
Figure 9: Russian exports to India are increasing but remain small (USD, billions) ...................................................... 27
Figure 10: Russian exports to India are not dominated by fuels, 2015 ............................................................................. 28
Figure 11: Russian imports from India are diverse, 2015 ....................................................................................................... 28
Figure 12: Russia’s GVC participation as a buyer and seller, 2011 ....................................................................................... 28
Figure 13: Russia’s GVC participation as a seller across manufacturing sectors, 2011 ................................................ 29
Figure 14: Russia’s value added in China and India’s exports (as a share of total foreign value added) ............... 30
Figure 15: China and India’s value added in Russia’s exports (as a share of total foreign value added) ............... 30
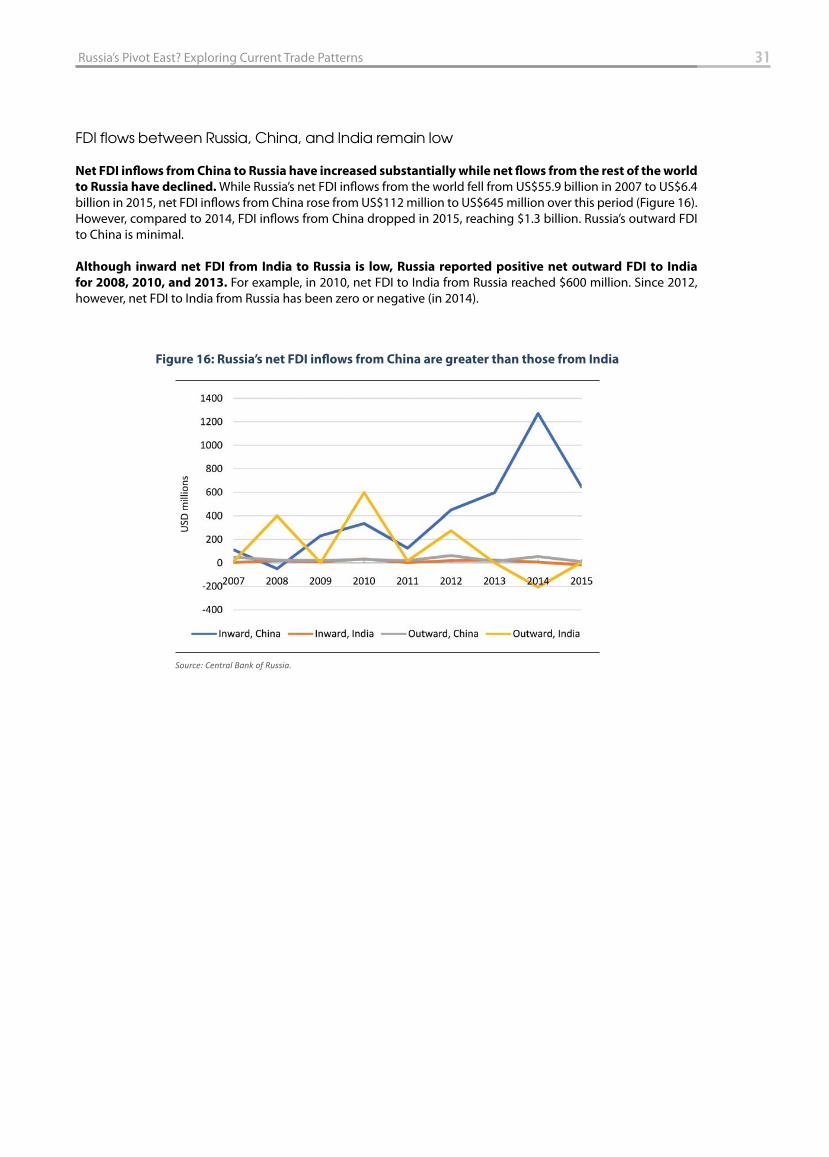
Figure 16: Russia’s net FDI infl ows from China are greater than those from India ........................................................ 31
Figure 17: Russia’s trade openness is below that of countries with a similar level of development, 2015 .......... 33
Figure 18: Commercial services trade is related to per capita income, 2015 .................................................................. 34
Figure 19: Russia’s export potential in 2015................................................................................................................................ 35
Figure 20: Russia’s export potential in 2015, non-oil and gas exports .............................................................................. 36
Figure 21: Russia has been gaining market share in exports of transport services ...................................................... 38
Figure 22: Russia’s trade complementarity index (goods and services) with India is greater than
that with China ................................................................................................................................................................. 39
Figure 23: Russia’s services trade complementarity with China and India has fallen .................................................. 40
Figure 24: Russia’s services export growth has been less than China’s import growth (top) but has
exceeded India’s import growth (bottom) in most services sectors ............................................................. 40
Figure 25: Russia’s share of world trade remains constant under the reference scenario ......................................... 46
Figure 26: China’s share of Russian exports rises and Europe’s share falls under the reference scenario ............ 46
Figure 27: China’s growth falls signifi cantly in the slowdown scenario ............................................................................ 47
Figure 28: Exports to China from all regions decline in the slowdown scenario........................................................... 48
Figure 29: The drop in China’s imports is larger in primary products than in manufactures .................................... 48
Figure 30: Global market dependence on China diff ers greatly by region ..................................................................... 49
Figure 31: Russian exports to non-Chinese markets are higher than in the reference scenario due to
lower prices ........................................................................................................................................................................ 49
6 A Rebalancing China and Resurging India: How will the pendulum swing for Russia?
Figure 32: Russia’s exchange rate depreciates as a result of the China slowdown ....................................................... 50
Figure 33: Russian exports of primary products are sharply lower in the China slowdown scenario ................... 50
Figure 34: The China slowdown would boost non-oil tradable sectors ........................................................................... 51
Figure 35: The China slowdown has little impact on Russian growth ............................................................................... 52
Figure 36: The China slowdown has a substantial impact on household welfare in Russia ...................................... 52
Figure 37: China’s rebalancing involves a shift from investment to private consumption ........................................ 53
Figure 38: Rebalancing signifi cantly changes the composition of China’s import demand ..................................... 54
Figure 39: Rebalancing has positive impacts on regions exporting agriculture and high-skilled services ......... 54
Figure 40: China’s rebalancing signifi cantly aff ects the composition of Russian exports .......................................... 55
Figure 41: China’s rebalancing results in an appreciation of Russia’s real exchange rate .......................................... 55
Figure 42: China’s rebalancing has a small positive impact on Russian growth ............................................................ 56
Figure 43: China’s rebalancing would slightly improve household welfare in Russia ................................................. 56
Figure 44: Higher growth in India would signifi cantly increase exports to India as well as global exports ........ 57
Figure 45: The impact of expansion on India’s imports diff ers by product ..................................................................... 58
Figure 46: After OPEC, China has the largest share of exports to India ............................................................................ 58
Figure 47: India’s expansion has the largest impact on exports of Russian primary products ................................ 59
Figure 48: The impact of India’s expansion on Russian GDP growth is small ................................................................. 60
Figure 49: The impact of India’s expansion on household welfare in Russia is also small ......................................... 60
Figure 50: Most regions’ exports to China are lower in the combined scenario............................................................ 61
Figure 51: The impact of the combined scenario on Russian growth and welfare is small ....................................... 61
Figure 52: The China slowdown scenario – Growth and household welfare are higher with a fi scal
defi cit fi nanced through current expenditures adjustment ............................................................................ 64
Figure 53: The India expansion scenario – GDP and household welfare are lower if the exogenous
fi scal balance is fi nanced through increased current expenditures.............................................................. 65
Figure 54: China’s slowdown – a larger oil price decline results in lower GDP and welfare in Russia .................... 66
Figure 55: India’s expansion – A greater oil price response would boost GDP and welfare in Russia ................... 67
Figure 56: China’s slowdown – GDP is lower with Impediments to labor mobility ...................................................... 68
Figure 57: India’s expansion – the rise in GDP is smaller with impediments to labor mobility ................................ 69
Figure 58: China’s rebalancing – Russia’s growth is higher but exports are lower with higher FDI
infl ows from China .......................................................................................................................................................... 70
Figure A3. 1: FDI infl ows into Russia (USD, millions ................................................................................................................. 87
Figure A4. 1: The impact of the combined scenario (scenario 4) on Russia’s exports diff ers by sector ................. 90
Figure A5. 1: Russia’s declining export performance ............................................................................................................... 94
Figure A5. 2: Russia’s market share in the goods trade ........................................................................................................... 95
Figure A5. 3: Composition of Russia’s trade in services, 2015............................................................................................... 95
Figure A5. 4: Evolution of Russia’s sectoral services exports ................................................................................................. 96
Figure A5. 5: Trends in Russia’s trade in commercial services ............................................................................................... 97
Figure A6. 1: Nested structure of production ............................................................................................................................. 100
Figure A6. 2: How import decisions are made ........................................................................................................................... 101
Figure A6. 3: How export decisions are made ............................................................................................................................ 101
7Contents
Tables
Table 1: Russia’s export potential: Trade with China and India, 2015 ................................................................................ 36
Table 2: Russia’s export potential: Non-oil and gas trade with China and India, 2015 ................................................ 36
Table 3: Russia’s revealed comparative advantage in selected merchandise sectors ................................................. 37
Table 4: Russia’s revealed comparative advantage index for services sectors, 2015 ................................................... 38
Table A1. 1: Mapping between model and GTAP factors of production .......................................................................... 76
Table A1. 2: Mapping between model and GTAP sectors ...................................................................................................... 76
Table A1. 3: Mapping between model and GTAP regions ..................................................................................................... 79
Table A3. 1: Russia’s net FDI infl ows by sector, 2015 ................................................................................................................ 88
Table A3. 2: Russia’s net FDI infl ows and outfl ows by country, 2015 ................................................................................. 89
Table A5. 1: Export Performance of the world’s 10 largest economies ............................................................................. 93
Table A5. 2: Russia’s main service trading partners – 2015.................................................................................................... 96
Table A5. 3: Sectoral contribution to Russia’s export growth, 2005-2007 to 2013-2015 ............................................ 98
Boxes
Box 1: Benchmarking Russian bilateral export relationships using a gravity model of trade .................................. 35
Box 2: Trade diversifi cation and productivity: Literature review ......................................................................................... 43
Acknowledgments
This report was prepared by a World Bank team led by Apurva Sanghi (Lead Economist for the Russian Federation and co-TTL) and Andrew Burns (Lead Economist, co-TTL). Calvin Djiofack (Senior Economist) and Dinar Prihardini (Economist) were the lead modelers, ably assisted by Eleanor Dalgleish (Consultant), Jagath Dissanayake (Consultant), Olga Emelyanova (Research Analyst), Claire Honore Hollweg (Economist), Irina Rostovtseva (Research Analyst), and William Shaw (Consultant). Farah Manji (Consultant) provided editorial assistance, and Marina Koroleva (Program Assistant) provided logistical support. Andras Horvai (Country Director for the Russian Federation), Maria De los Angeles Cuqui Gonzalez Miranda (Practice Manager, Macroeconomics and Fiscal Management Global Practice for Europe and Central Asia), and Dorota Nowak (Country Program Coordinator) provided overall guidance.
We are especially grateful to the following peer reviewers for their careful and thoughtful comments: Alexander Morozov (Director, Department for Research and Forecasting, Central Bank of Russia), Vladimir Kolchyev (Deputy Minister of Finance, Russian Federation), Vladimir Tsibanov (Director, Budget Policies and Strategic Planning Department, Ministry of Finance, Russian Federation), Gabriel Di Bella (Resident Representative for Russia, IMF), Junaid Kamal Ahmad (Country Director for India, World Bank), Bert Hoff man (World Bank Country Director, China), and Hans Timmer (Chief Economist, Europe and Central Asia, World Bank).
In addition, the team has benefi tted greatly from conversations and discussions with World Bank colleagues, notably Cecilia Heuser, Aaditya Mattoo, Sebastian Saez, Frederico Gil Sander, and H.E. Pankaj Saran, Indian Ambassador to Russia.
For queries, please contact the corresponding author, Apurva Sanghi, at “[email protected]”.
Abbreviations
ASEAN-5
BOP
BRI
BRICS
CES
CET
CGE
CIS
FDI
ECA
EFTA
EMDEs
EU
FSGM
GDP
GTAP
GVC
IAMC
IMF
LES
LPI
MFMOD
OECD
OPEC
RCA
ROW
SSP
TCI
VAR
Indonesia, Malaysia, the Philippines, Singapore, and Thailand
Balance of Payments
Belt and Road Ini a ve
Brazil, Russia, India, China, and South Africa (emerging economies)
Constant elas city of subs tu on
Constant elas city of transforma on
Computable general equilibrium
Commonwealth of Independent States
Foreign direct investment
Europe and Central Asia
European Free Trade Associa on
Emerging and developing economies
European Union
Flexible System of Global Models
Gross domes c product
Global Trade Analysis Project
Global value chains
Integrated Assessment Modeling Consor um
Interna onal Monetary Fund
Linear expenditure system
Logis cs Performance Index, World Bank
Macro-Fiscal model
Organiza on for Economic Coopera on and Development
Organiza on of the Petroleum Expor ng Countries
Revealed compara ve advantage
Rest of the World
Shared Socioeconomic Pathways
Trade complementary index
Value at Risk

A Snapshot of Findings
A. RUSSIA PIVOTS TOWARDS CHINA AND INDIA
1. Like most nations, Russia’s economic prospects are closely linked to its ability to export and penetrate
new dynamic markets. However, Russia’s trade performance has been rather modest in the last decade, with the country under-trading compared to countries at a similar level of economic development. Russia’s export to GDP ratio declined from 33 percent during 2005-2007 to about 28 percent in 2013-2015. Although traditional trade partners in Europe, the Organization for Economic Cooperation and Development (OECD), and the Commonwealth of Independent States (CIS) remain the top destinations for Russian exports, under the rubric of initiatives such as BRICS, Russia is beginning to deepen its economic relationships with new dynamic markets such as China and India. In the global market, China is now the world’s second largest importer after the United States, and in many metal markets, it represents more than half of global demand. Russia’s trade with China has increased substantially in recent decades: Merchandise trade between the two countries almost tripled over the past ten years. In addition, Russia’s trade with India has increased more than 15 percent in the last fi ve years.
2. Recent developments also attest to the strengthening of Russia’s trade relationships with both China
and India. Russia has publicly voiced its support for China’s One-Belt-One-Road initiative. And the recently concluded St. Petersburg International Economic Forum saw a revival of bilateral trade measures between Russia and India, which go beyond defense and into areas of pharmaceuticals, agriculture, automobile components, and mining and metallurgy.
3. Net FDI infl ows from China to Russia have also increased substantially as net infl ows from the rest of
the world declined. Although net FDI from India to Russia is low, Russia reported positive net outward FDI to India for 2008, 2010, and 2013. Overall, Russia’s FDI fl ows are diversifi ed across countries.
4. However, the current level of Russian exports to both China and India are below their natural potential.
A gravity model analysis suggests that Russia has an untapped potential to increase merchandise exports to China by around 24 percent of its actual exports in 2015, and by nearly 17 percent to India1. The potential gap between Russia and China is bigger than that with India, indicating a higher prospect to increase Russian merchandise exports. This fi nding refl ects the bigger size of the Chinese economy (compared to India), as well as the geographical proximity between Russia and China as captured in the gravity model. For example, China is able to benefi t from Russia’s commodity exports but for reasons of geography and logistics, India is not. Nonetheless, the current pattern of below-potential trade also indicates untapped opportunities for Russia to grow its total exports.
5. Russia’s integration in the global value chains of China and India is also limited. A global value chain index (GVC), which measures Russia’s value added embodied in exports of China and India as a share of total foreign value added embodied in these exports, is low. In total, Russia has less than a 3 percent market share in China and less than a 2 percent market share in India (measured on a value-added basis).
6. Russia has a revealed comparative advantage (RCA) in several merchandise industries and also in some
services sectors. Unsurprisingly perhaps, Russia has a revealed comparative advantage in merchandise sectors, predominantly natural resource-based industries. Surprisingly perhaps, Russia also has a revealed comparative advantage in key services sectors, including construction (due to nuclear plants – an area where India can continue to benefi t) and transport services. As discussed in the report, Russia’s share of global transport services exports has increased in recent years, and exports of small services sectors, including communications and intellectual property, have also grown faster than the world import growth of these services.
1 A gravity model analysis predicts the level of exports between two economies based on size, income level, distance, as well as whether countries share a common border, whether they share a common language, and whether one was a colony of the other or whether they were colonies of the same country.
12 A Rebalancing China and Resurging India: How will the pendulum swing for Russia?
7. These developments are occurring in the context of signifi cant changes in Russia’s economy. Russia’s economy has been coping with the twin shocks of low oil prices and economic sanctions since mid-2014. It entered a recession period that saw GDP contracting by 2.8 percent in 2015 and 0.2 percent in 2016. However, over the last two years, the government’s policy response package of a fl exible exchange rate policy, expenditure cuts in real terms, and emergency bank recapitalization has helped Russia’s economy stabilize. Supported by fi rming commodity prices, the economy is moving from recession to recovery, with projected growth to be between 1.3 and 1.4 percent between 2017 – 2019 (World Bank estimates).
8. Several sectors are benefi ting from the sharp ruble depreciation of 2014-2015, setting in motion a
process of diversifi cation, which has been slow. In 2016, the following non-oil sectors recorded export growth: food products, chemicals and rubber, wood and pulp, textiles, metals and metal goods, machines and equipment, transport vehicles. As expected, the relative price adjustment also facilitated the import substitution process, supporting production in several tradable sectors. However, this adjustment is slow due to relatively low levels of spare capacity (the capacity utilization level remained at historically high levels in most tradable sectors), limited availability of labor, and medium-term factors that adversely aff ect labor productivity.
9. Dynamic changes in China and India’s economies therefore present Russia with both opportunities
and challenges. Opportunities come primarily from China’s rebalancing of its demand, which increases the importance of consumption compared to investment, and India’s emergence as one of the fastest growing large economies in the world. Challenges stem mainly from China’s slowdown (which reduces demand for Russia’s commodity exports), low levels of trade fl ows between Russia and India (compared to Russia and China), and as outlined above, the current sub-optimal Russia-China and Russia-India bilateral trade patterns. The ongoing diversifi cation process is an opportunity as it can position Russia to take advantage of changes in China and India’s economies, but its slow pace – and other structural issues – remain a constraint.
B. ASSESSING IMPACT IS A TRICKY AFFAIR
10. The impact of changes in China and India on Russia’s economy is subtle. Beyond fi rst-order, direct eff ects on bilateral trade, changes in China and India’s economies aff ect Russia’s economy in subtle and indirect ways. This can happen, for example, because of third-country eff ects (how changes in China and India aff ect Russia’s trading partners, that then aff ect Russia), and through changes in the global price of oil. Another indirect and elusive channel of impact is how a slowdown in China’s economy could have a positive eff ect on Russia. This is because lower Russian commodity exports to China would lead to a more depreciated ruble, thereby increasing demand for Russian goods from other parts of the world. Another aspect is assessing the impact of changes in China only (holding changes in India constant), and vice-versa, as well as changes in both China and India simultaneously. And yet another subtlety is isolating the impact on Russia stemming from just the China slowdown vs. China rebalancing (and both). Isolating such impacts is necessary not only to get a better understanding of underlying dynamics but also for evaluating appropriate policy levers.
11. This report develops a customized methodology that can capture these subtleties. The analysis develops a computable general equilibrium (CGE) model, customized to address the above-mentioned nuances and subtleties, and through carefully constructed future scenarios, it can assess and quantify such impacts. No methodology is perfect, however, and Chapter 7 notes the caveats and limitations as well as eff orts made to overcome at least some of these limitations2.
2 While non-economists like to criticize economists for their models, economists are even more critical. In his 2015 book “Economic Rules”, Dani Rodrik notes that the economist Kenneth Boulding supposedly remarked, “Mathematics brought rigor to economics; unfortunately, it also brought mortis”. In our modeling work, we clearly do not attempt to capture every single aspect of reality; only the most relevant ones.
13A Snapshot of Findings
C. UNFOLDING THE FUTURE: WHAT THE ANALYSIS REVEALS
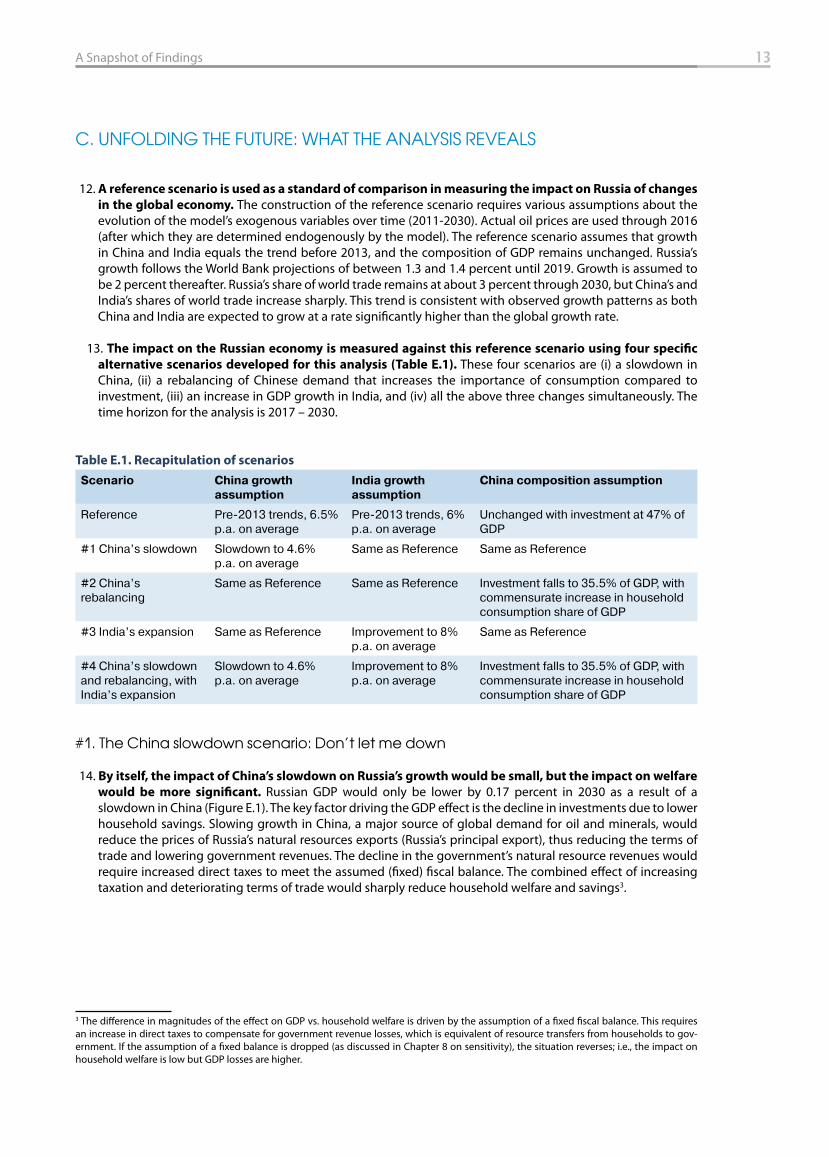
12. A reference scenario is used as a standard of comparison in measuring the impact on Russia of changes
in the global economy. The construction of the reference scenario requires various assumptions about the evolution of the model’s exogenous variables over time (2011-2030). Actual oil prices are used through 2016 (after which they are determined endogenously by the model). The reference scenario assumes that growth in China and India equals the trend before 2013, and the composition of GDP remains unchanged. Russia’s growth follows the World Bank projections of between 1.3 and 1.4 percent until 2019. Growth is assumed to be 2 percent thereafter. Russia’s share of world trade remains at about 3 percent through 2030, but China’s and India’s shares of world trade increase sharply. This trend is consistent with observed growth patterns as both China and India are expected to grow at a rate signifi cantly higher than the global growth rate.
13. The impact on the Russian economy is measured against this reference scenario using four specifi c
alternative scenarios developed for this analysis (Table E.1). These four scenarios are (i) a slowdown in China, (ii) a rebalancing of Chinese demand that increases the importance of consumption compared to investment, (iii) an increase in GDP growth in India, and (iv) all the above three changes simultaneously. The time horizon for the analysis is 2017 – 2030.
Table E.1. Recapitulation of scenarios
Scenario China growth
assumption
India growth
assumption
China composition assumption
Reference Pre-2013 trends, 6.5% p.a. on average
Pre-2013 trends, 6% p.a. on average
Unchanged with investment at 47% of GDP
#1 China’s slowdown Slowdown to 4.6% p.a. on average
Same as Reference Same as Reference
#2 China’s rebalancing
Same as Reference Same as Reference Investment falls to 35.5% of GDP, with commensurate increase in household consumption share of GDP
#3 India’s expansion Same as Reference Improvement to 8% p.a. on average
Same as Reference
#4 China’s slowdown and rebalancing, with India’s expansion
Slowdown to 4.6% p.a. on average
Improvement to 8% p.a. on average
Investment falls to 35.5% of GDP, with commensurate increase in household consumption share of GDP
#1. The China slowdown scenario: Don’t let me down
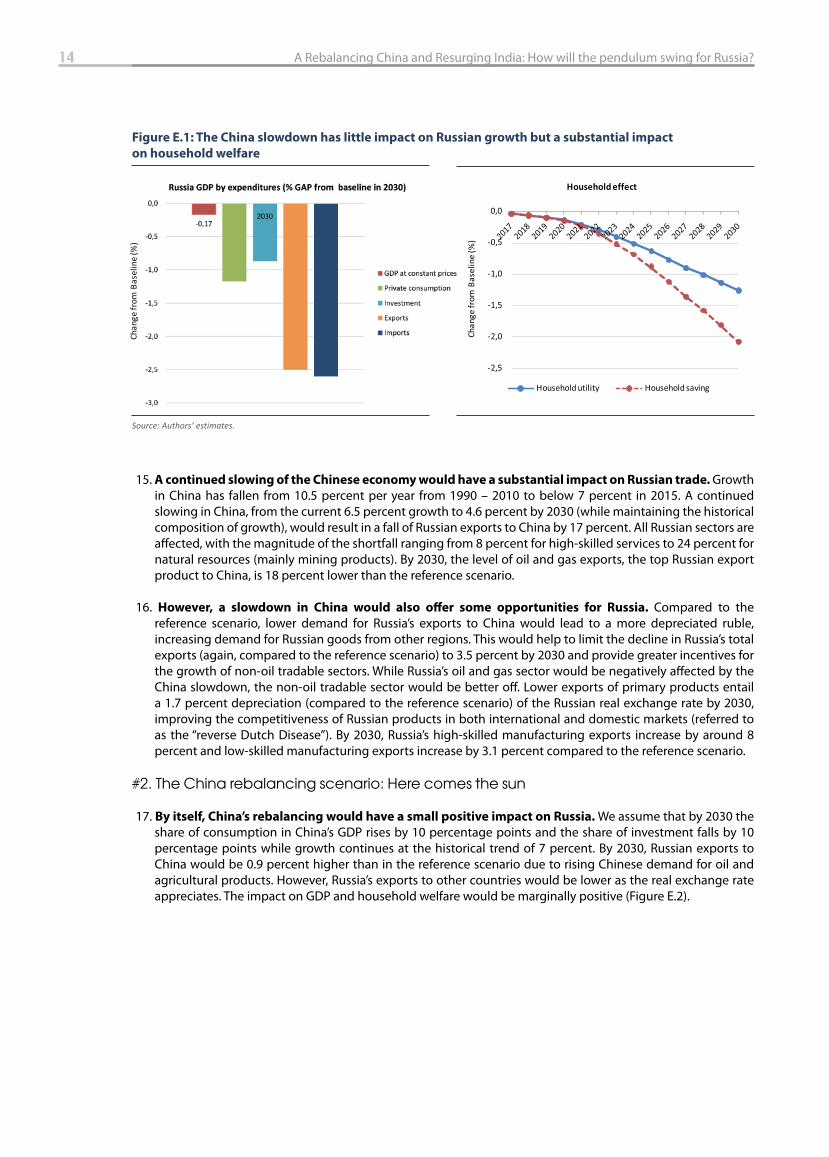
14. By itself, the impact of China’s slowdown on Russia’s growth would be small, but the impact on welfare
would be more signifi cant. Russian GDP would only be lower by 0.17 percent in 2030 as a result of a slowdown in China (Figure E.1). The key factor driving the GDP eff ect is the decline in investments due to lower household savings. Slowing growth in China, a major source of global demand for oil and minerals, would reduce the prices of Russia’s natural resources exports (Russia’s principal export), thus reducing the terms of trade and lowering government revenues. The decline in the government’s natural resource revenues would require increased direct taxes to meet the assumed (fi xed) fi scal balance. The combined eff ect of increasing taxation and deteriorating terms of trade would sharply reduce household welfare and savings3.
3 The diff erence in magnitudes of the eff ect on GDP vs. household welfare is driven by the assumption of a fi xed fi scal balance. This requires an increase in direct taxes to compensate for government revenue losses, which is equivalent of resource transfers from households to gov-ernment. If the assumption of a fi xed balance is dropped (as discussed in Chapter 8 on sensitivity), the situation reverses; i.e., the impact on household welfare is low but GDP losses are higher.
14 A Rebalancing China and Resurging India: How will the pendulum swing for Russia?
15. A continued slowing of the Chinese economy would have a substantial impact on Russian trade. Growth in China has fallen from 10.5 percent per year from 1990 – 2010 to below 7 percent in 2015. A continued slowing in China, from the current 6.5 percent growth to 4.6 percent by 2030 (while maintaining the historical composition of growth), would result in a fall of Russian exports to China by 17 percent. All Russian sectors are aff ected, with the magnitude of the shortfall ranging from 8 percent for high-skilled services to 24 percent for natural resources (mainly mining products). By 2030, the level of oil and gas exports, the top Russian export product to China, is 18 percent lower than the reference scenario.
16. However, a slowdown in China would also off er some opportunities for Russia. Compared to the reference scenario, lower demand for Russia’s exports to China would lead to a more depreciated ruble, increasing demand for Russian goods from other regions. This would help to limit the decline in Russia’s total exports (again, compared to the reference scenario) to 3.5 percent by 2030 and provide greater incentives for the growth of non-oil tradable sectors. While Russia’s oil and gas sector would be negatively aff ected by the China slowdown, the non-oil tradable sector would be better off . Lower exports of primary products entail a 1.7 percent depreciation (compared to the reference scenario) of the Russian real exchange rate by 2030, improving the competitiveness of Russian products in both international and domestic markets (referred to as the “reverse Dutch Disease”). By 2030, Russia’s high-skilled manufacturing exports increase by around 8 percent and low-skilled manufacturing exports increase by 3.1 percent compared to the reference scenario.
#2. The China rebalancing scenario: Here comes the sun
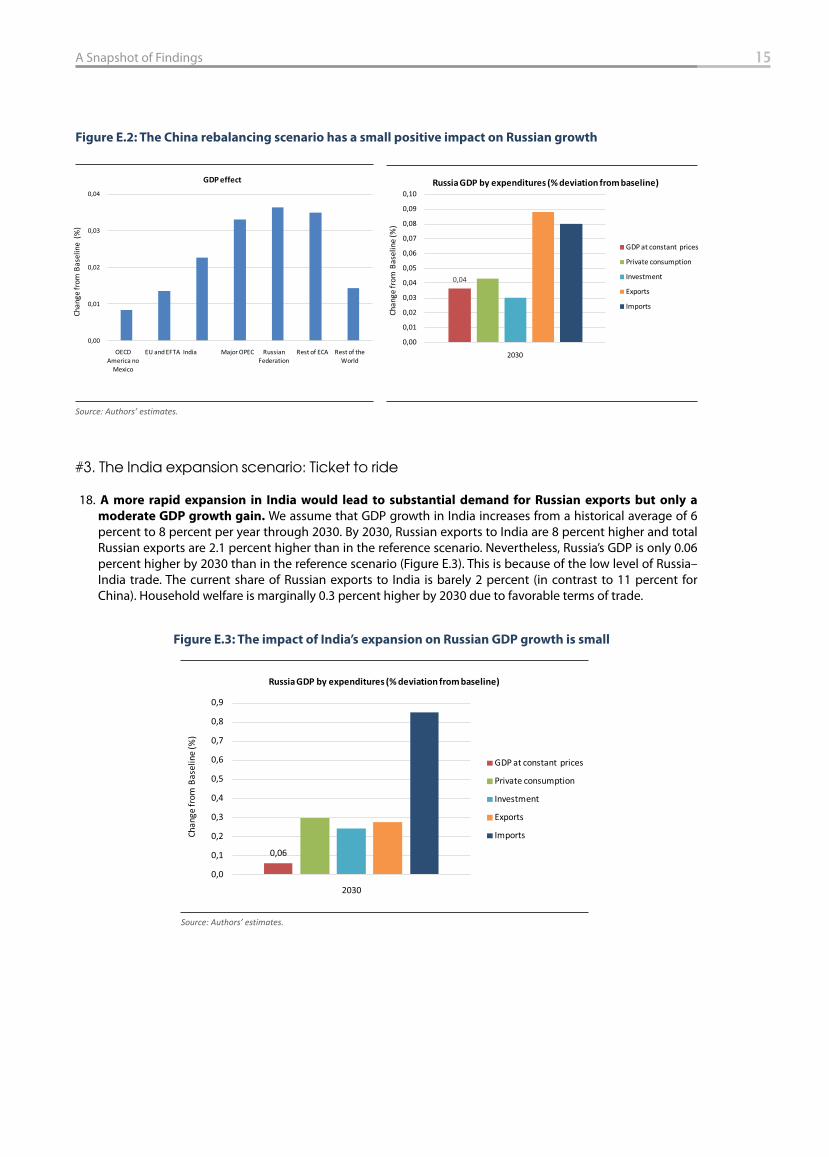
17. By itself, China’s rebalancing would have a small positive impact on Russia. We assume that by 2030 the share of consumption in China’s GDP rises by 10 percentage points and the share of investment falls by 10 percentage points while growth continues at the historical trend of 7 percent. By 2030, Russian exports to China would be 0.9 percent higher than in the reference scenario due to rising Chinese demand for oil and agricultural products. However, Russia’s exports to other countries would be lower as the real exchange rate appreciates. The impact on GDP and household welfare would be marginally positive (Figure E.2).
Figure E.1: The China slowdown has little impact on Russian growth but a substantial impact
on household welfare
Source: Authors’ estimates.
Chan
ge fr
om B
asel
ine
(%)
-2,5
-2,0
-1,5
-1,0
-0,5
0,0
Chan
ge fr
om B
asel
ine
(%)
Household effect
Household utility Household saving
Household effect
15A Snapshot of Findings
#3. The India expansion scenario: Ticket to ride
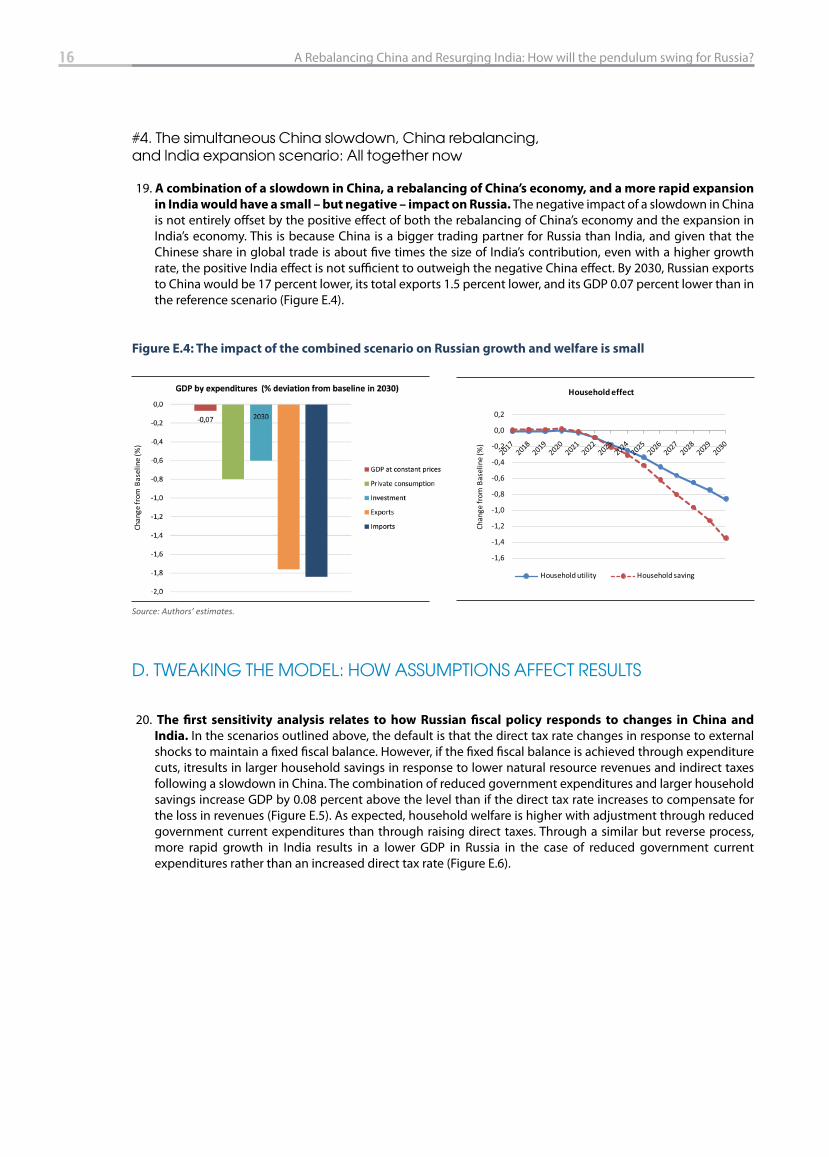
18. A more rapid expansion in India would lead to substantial demand for Russian exports but only a
moderate GDP growth gain. We assume that GDP growth in India increases from a historical average of 6 percent to 8 percent per year through 2030. By 2030, Russian exports to India are 8 percent higher and total Russian exports are 2.1 percent higher than in the reference scenario. Nevertheless, Russia’s GDP is only 0.06 percent higher by 2030 than in the reference scenario (Figure E.3). This is because of the low level of Russia–India trade. The current share of Russian exports to India is barely 2 percent (in contrast to 11 percent for China). Household welfare is marginally 0.3 percent higher by 2030 due to favorable terms of trade.
Figure E.2: The China rebalancing scenario has a small positive impact on Russian growth
Source: Authors’ estimates.
0,00
0,01
0,02
0,03
0,04
OECD America no
Mexico
EU and EFTA India Major OPEC Russian Federation
Rest of ECA Rest of the World
Chan
ge fr
om B
asel
ine
(%)
GDP effect
0,04
0,00
0,01
0,02
0,03
0,04
0,05
0,06
0,07
0,08
0,09
0,10
2030
Сhan
ge fr
om B
asel
ine
(%)
Russia GDP by expenditures (% deviation from baseline)
GDP at constant prices
Private consumption
Investment
Exports
Imports
Figure E.3: The impact of India’s expansion on Russian GDP growth is small
Source: Authors’ estimates.
0,06
0,0
0,1
0,2
0,3
0,4
0,5
0,6
0,7
0,8
0,9
2030
Chan
ge fr
om B
asel
ine
(%)
Russia GDP by expenditures (% deviation from baseline)
GDP at constant prices
Private consumption
Investment
Exports
Imports
Russia GDP by expenditures (% deviation from baseline)
Chan
ge fr
om B
asel
ine
(%)
16 A Rebalancing China and Resurging India: How will the pendulum swing for Russia?
#4. The simultaneous China slowdown, China rebalancing, and India expansion scenario: All together now
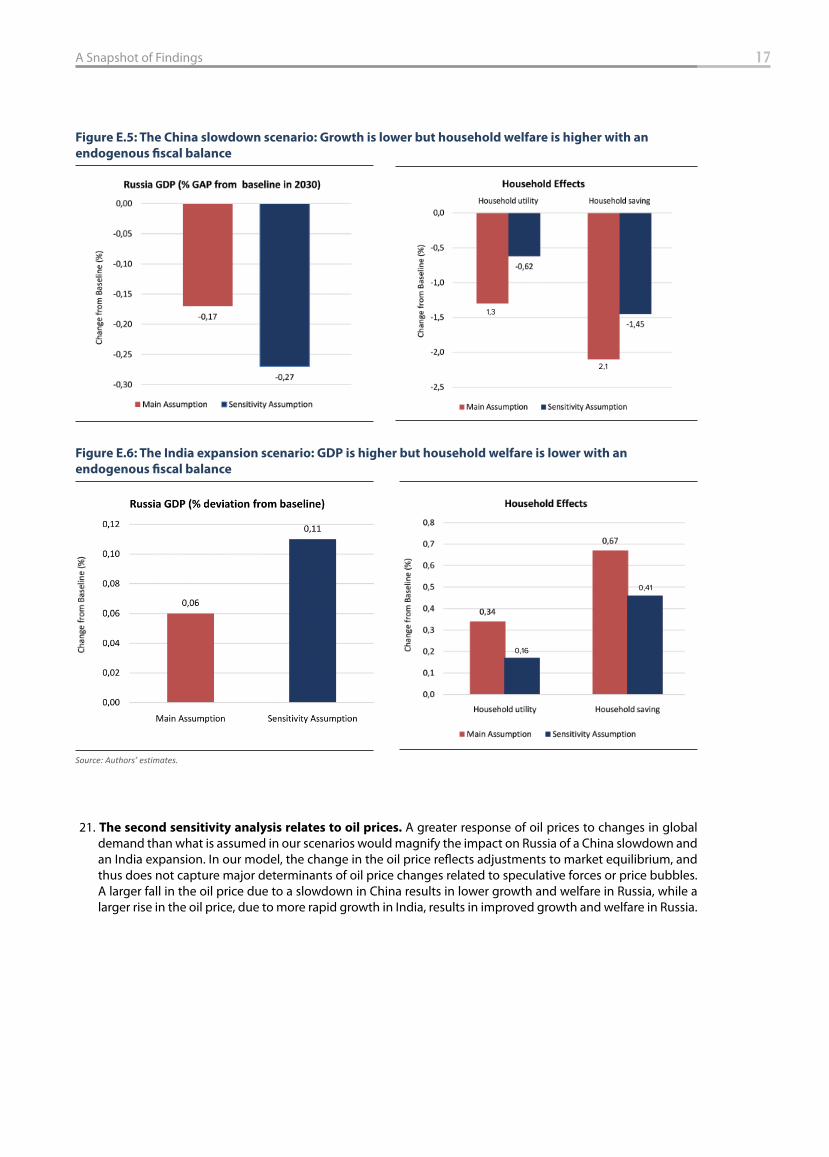
19. A combination of a slowdown in China, a rebalancing of China’s economy, and a more rapid expansion
in India would have a small – but negative – impact on Russia. The negative impact of a slowdown in China is not entirely off set by the positive eff ect of both the rebalancing of China’s economy and the expansion in India’s economy. This is because China is a bigger trading partner for Russia than India, and given that the Chinese share in global trade is about fi ve times the size of India’s contribution, even with a higher growth rate, the positive India eff ect is not suffi cient to outweigh the negative China eff ect. By 2030, Russian exports to China would be 17 percent lower, its total exports 1.5 percent lower, and its GDP 0.07 percent lower than in the reference scenario (Figure E.4).
D. TWEAKING THE MODEL: HOW ASSUMPTIONS AFFECT RESULTS
20. The fi rst sensitivity analysis relates to how Russian fi scal policy responds to changes in China and
India. In the scenarios outlined above, the default is that the direct tax rate changes in response to external shocks to maintain a fi xed fi scal balance. However, if the fi xed fi scal balance is achieved through expenditure cuts, itresults in larger household savings in response to lower natural resource revenues and indirect taxes following a slowdown in China. The combination of reduced government expenditures and larger household savings increase GDP by 0.08 percent above the level than if the direct tax rate increases to compensate for the loss in revenues (Figure E.5). As expected, household welfare is higher with adjustment through reduced government current expenditures than through raising direct taxes. Through a similar but reverse process, more rapid growth in India results in a lower GDP in Russia in the case of reduced government current expenditures rather than an increased direct tax rate (Figure E.6).
Figure E.4: The impact of the combined scenario on Russian growth and welfare is small
Source: Authors’ estimates.
Chan
ge fr
om B
asel
ine
(%)
-1,6
-1,4
-1,2
-1,0
-0,8
-0,6
-0,4
-0,2
0,0
0,2
Chan
ge fr
om B
asel
ine
(%)
Household effect
Household utility Household saving
Household effect
17A Snapshot of Findings
21. The second sensitivity analysis relates to oil prices. A greater response of oil prices to changes in global demand than what is assumed in our scenarios would magnify the impact on Russia of a China slowdown and an India expansion. In our model, the change in the oil price refl ects adjustments to market equilibrium, and thus does not capture major determinants of oil price changes related to speculative forces or price bubbles. A larger fall in the oil price due to a slowdown in China results in lower growth and welfare in Russia, while a larger rise in the oil price, due to more rapid growth in India, results in improved growth and welfare in Russia.
Figure E.5: The China slowdown scenario: Growth is lower but household welfare is higher with an
endogenous fi scal balance
Figure E.6: The India expansion scenario: GDP is higher but household welfare is lower with an
endogenous fi scal balance
Source: Authors’ estimates.
1,3
2,1
0,16
0,41
18 A Rebalancing China and Resurging India: How will the pendulum swing for Russia?
22. A third sensitivity analysis relaxes the assumption that labor is perfectly mobile across diff erent sectors
of production. Existence of labor market frictions, such as limited access to information, limited mobility, or regulatory restrictions, may impede the movement of labor between sectors. If we assume slower adjustment in labor markets (by lowering labor substitution elasticities), negative external shocks result in a greater reduction in Russia’s GDP and welfare, and positive external shocks lead to a smaller increase in GDP and welfare than with more rapid adjustment. Thus, with slower adjustment in labor markets, by 2030, Russia’s GDP is 0.05 percent lower in response to a slowdown in China compared to more rapid labor market adjustment. Conversely, in response to more rapid growth in India, assuming that labor market rigidities slow adjustment, GDP rises by slightly less4.
E. BEYOND THE MODEL: THE SURPRISING ROLE OF FDI
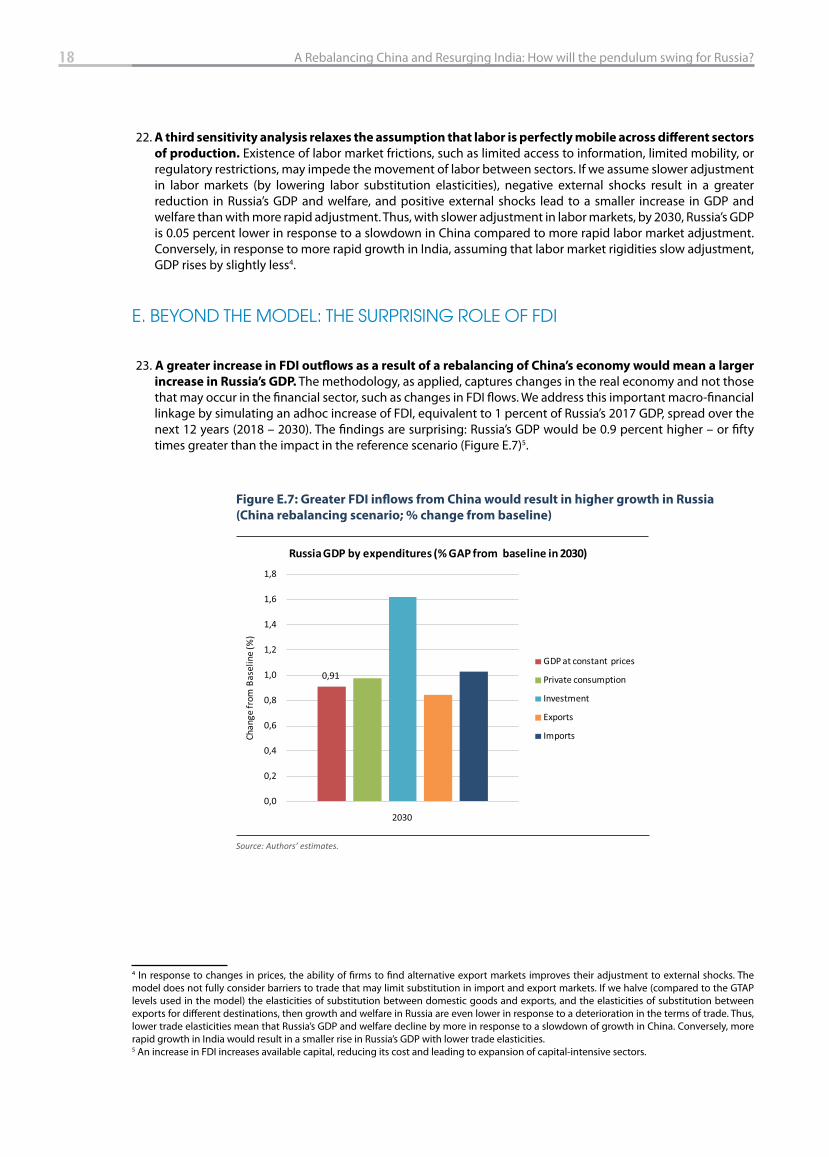
23. A greater increase in FDI outfl ows as a result of a rebalancing of China’s economy would mean a larger
increase in Russia’s GDP. The methodology, as applied, captures changes in the real economy and not those that may occur in the fi nancial sector, such as changes in FDI fl ows. We address this important macro-fi nancial linkage by simulating an adhoc increase of FDI, equivalent to 1 percent of Russia’s 2017 GDP, spread over the next 12 years (2018 – 2030). The fi ndings are surprising: Russia’s GDP would be 0.9 percent higher – or fi fty times greater than the impact in the reference scenario (Figure E.7)5.
4 In response to changes in prices, the ability of fi rms to fi nd alternative export markets improves their adjustment to external shocks. The model does not fully consider barriers to trade that may limit substitution in import and export markets. If we halve (compared to the GTAP levels used in the model) the elasticities of substitution between domestic goods and exports, and the elasticities of substitution between exports for diff erent destinations, then growth and welfare in Russia are even lower in response to a deterioration in the terms of trade. Thus, lower trade elasticities mean that Russia’s GDP and welfare decline by more in response to a slowdown of growth in China. Conversely, more rapid growth in India would result in a smaller rise in Russia’s GDP with lower trade elasticities.5 An increase in FDI increases available capital, reducing its cost and leading to expansion of capital-intensive sectors.
Figure E.7: Greater FDI infl ows from China would result in higher growth in Russia
(China rebalancing scenario; % change from baseline)
Source: Authors’ estimates.
0,91
0,0
0,2
0,4
0,6
0,8
1,0
1,2
1,4
1,6
1,8
2030
Chan
ge fr
om B
asel
ine
(%)
Russia GDP by expenditures (% GAP from baseline in 2030)
GDP at constant prices
Private consumption
Investment
Exports
Imports
19A Snapshot of Findings
F. POLICY IMPLICATIONS: REAPING REWARDS, LIMITING LIABILITIES
24. Perhaps the most important policy implication for Russia is the urgency to speed up domestic structural
reforms. The four scenarios summarized above assumed rapid adjustment in labor and goods markets. Introducing labor market rigidities and impediments to adjustments in goods markets increases the impact of negative external shocks (e.g., a slowdown in China) and reduces the benefi ts from positive ones (e.g., a rebalancing in China and more rapid expansion in India). These results highlight the potentially high costs to Russia of low labor productivity, immobility, and rising informality (which impede labor market adjustment), and of poor connectivity (which impedes adjustment in goods markets: out of 160 countries, Russia ranks a low 99 in the World Bank’s 2016 Logistics Performance Index (LPI), well below neighboring Kazakhstan and all other BRICS). Another impediment is the existence of non-tariff barriers in countries that trade with Russia, which may limit Russia’s (and other countries’) ability to adjust smoothly to changes in the international economic environment. This therefore underlines the importance of negotiations to reduce non-tariff barriers.
25. The fi ndings also suggest specifi c areas that merit increased policy attention:
a. The fi nding that Russian exports to both China and India are below their natural potential further underscores the importance of export diversifi cation, particularly reducing dependence on natural resources. In addition, the high level of complementarity between Russian exports and Chinese/Indian imports points to potential positive eff ects of trade agreements.
b. The fi ndings regarding Russia’s revealed comparative advantage point towards deepening eff orts to promote diversifi cation into non-oil traded goods (manufacturing) and supporting trade in services, particularly in high-skilled services (e.g., communication, fi nancial insurance, business services, tourism, defense, education, and health services).
c. The fi ndings emphasize the importance of policy measures that increase mutually benefi cial trade between China, India, and Russia, and by extension, those that increase strategic partnerships between large emerging economies. For example, from being a consumer/importer of Russia’s nuclear machinery, equipment, and technology, India is now positioning itself as a low-cost supplier/exporter of such machinery, equipment, and technologies to Russia, thereby increasing Russia’s global competitiveness in this area. There may well be implications for China’s Belt and Road Initiative (BRI), and eff orts to deepen the already thriving cross-border trade along the Russia–China border could yield even more dividends.
26. Finally, FDI emerges as an important contender. FDI is a potentially important channel through which Russia may gain from China, which is increasingly looking for investment opportunities abroad because of its changing economic structure. Given their geographical proximity and shared borders, Russia is in a good position to capture outward fl owing Chinese FDI, particularly in its Far East region. Beyond energy, where Indian fi rms have been acquiring stakes in Russian oil fi elds for example, there may also be important opportunities for increasing FDI between Russia and India. Potential sectors where Russia can benefi t further from incoming Indian FDI include pharmaceuticals, attracting Indian IT fi rms to invest in Russian techno parks (which would support Russia’s digital economy initiative), and mining and metallurgy in the Arctic. Policy changes that improve the attractiveness of the Russian economy to FDI could therefore have a signifi cant impact on growth.
G. CAN THE PENDULUM BE SWUNG?

20 A Rebalancing China and Resurging India: How will the pendulum swing for Russia?
Overall, the impact of these four scenarios on Russia’s GDP would be small. The seemingly anti-climactic fi nding may suggest that changes in the Chinese and Indian economies are not of great concern to Russia. Alternatively, these small changes could indicate limits on Russia’s ability to benefi t from the opportunities off ered by a rebalancing in China and more rapid growth in India. Moreover, the implications of these scenarios for household welfare in Russia are more signifi cant, largely driven by changes in the terms of trade. In general, it appears that likely changes in economic developments in China and India present more of a challenge than an opportunity for Russia, largely due to Russia’s limited non-oil trade with both countries. But if well prepared, changing economic fortunes in China and India may well swing the pendulum in Russia’s favor.
1. Exploring the Trinity of China, India, and Russia: Why it Matters?
China’s economy is slowing and there is mixed evidence of a rebalancing of demand from high levels of investment to consumption. At the same time, growth in India is trending upwards. The net impact on Russia of these ongoing changes in China is unclear, and while rising growth in India is intuitively good for Russia and the world as a whole, the size of these eff ects is unknown. To the best of our knowledge, there is no study that looks specifi cally at the eff ects of China and India on Russia. There is also a dearth of quantitative analysis focusing on the eff ects of a booming India on the global economy. This study therefore fi lls these gaps.
The rapidly changing global environment, and a redefi nition of Russia’s relations with its main trading
partners, off ers Russia both opportunities and challenges. The changes include: (i) the slowdown of China since the fi nancial crisis; (ii) the rebalancing of China’s economy marked by a reduction of investment in favor of consumption; and (iii) the rise of India as one of the largest growing global economies with historical relationships with Russia. These changes are likely to sharply alter the composition of Russia’s trade and have important implications for welfare. Understanding the implications of these changes is critical to designing appropriate domestic policy responses and to eventually leading to a re-shaping of trade agreements and policies.
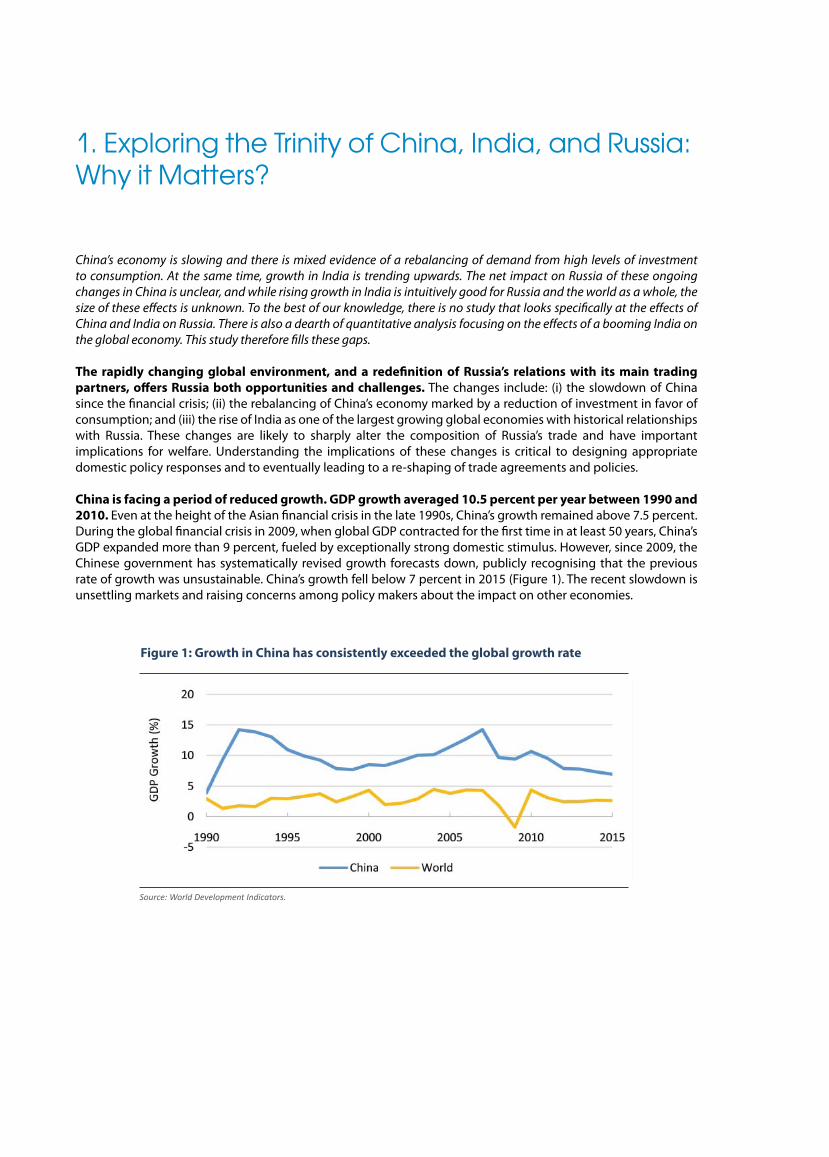
China is facing a period of reduced growth. GDP growth averaged 10.5 percent per year between 1990 and
2010. Even at the height of the Asian fi nancial crisis in the late 1990s, China’s growth remained above 7.5 percent. During the global fi nancial crisis in 2009, when global GDP contracted for the fi rst time in at least 50 years, China’s GDP expanded more than 9 percent, fueled by exceptionally strong domestic stimulus. However, since 2009, the Chinese government has systematically revised growth forecasts down, publicly recognising that the previous rate of growth was unsustainable. China’s growth fell below 7 percent in 2015 (Figure 1). The recent slowdown is unsettling markets and raising concerns among policy makers about the impact on other economies.
Figure 1: Growth in China has consistently exceeded the global growth rate
Source: World Development Indicators.
22 A Rebalancing China and Resurging India: How will the pendulum swing for Russia?
However, analysts disagree on the drivers of the growth slowdown, and thus the implications for China’s
prospects. Several papers such as Albert et al. (2015), Pettis (2013), Nabar and N’Diaye (2013), and the World Bank Group (2016) claim that slower growth is a structural trend, driven by slower productivity growth. Anderson et al. (2015) consider it too early to determine whether the slowdown refl ects structural or cyclical changes and thus account for both scenarios in their modelling. Dorrucci et al. (2013) argue that the fundamental drivers of rapid growth remain, including rising inward FDI to support investment, coupled with an increasingly sophisticated export basket to boost penetration of new markets. However, the authors warn that continued rapid growth in the near future could have negative implications over the long term by providing policy makers with excuses to postpone needed reforms. Conversely, Albert et al. (2015) argue that the structural slowdown will provide the right economic climate to facilitate rebalancing. Their study highlights similarities between China’s slowdown and the Japanese experience during the 1970s and 1980s, when a sharp deceleration in investment and a gradual consumption slowdown led to a long period of slow growth.
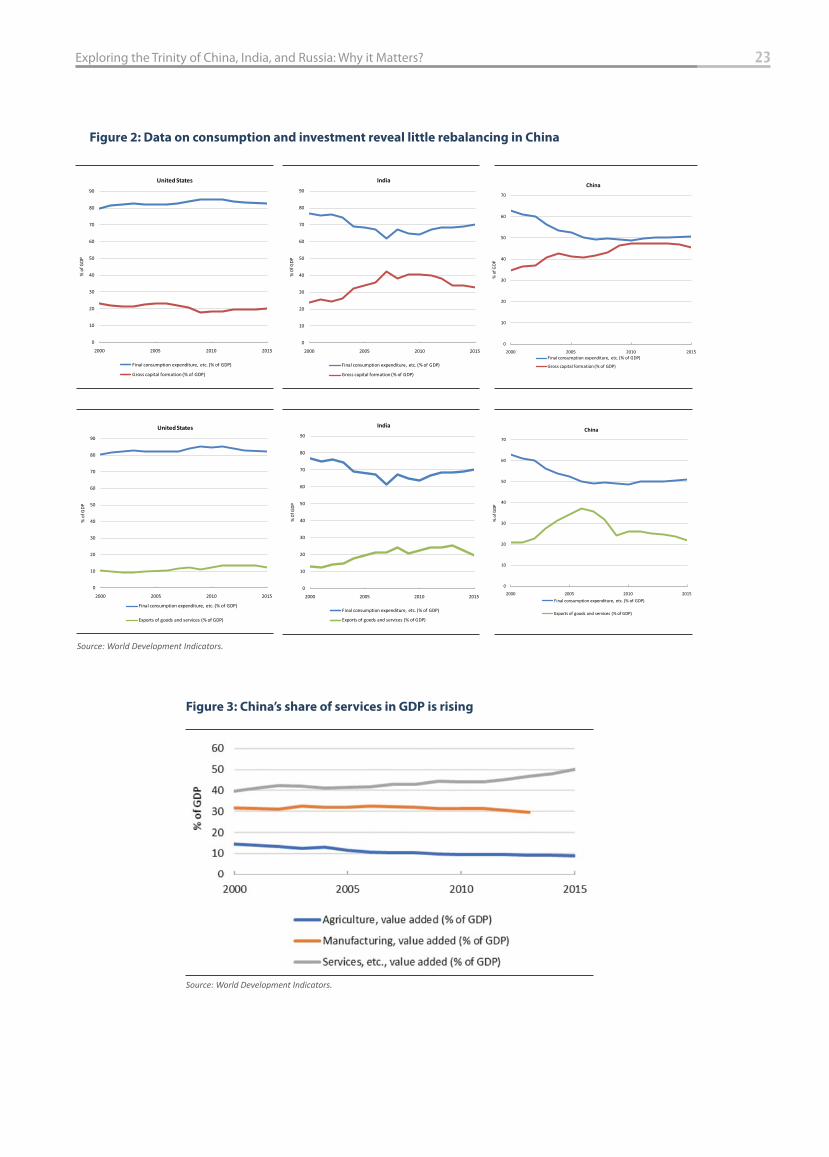
The evidence of a rebalancing of China’s economy is mixed. Since 2009, the high investment rate in China has been associated with falling returns to capital and rising non-performing loans, which will test the solidity of the banking sector and could expose vulnerabilities associated with the shadow-banking sector. A rebalancing of China’s economy, marked by a reduction of investment in favor of consumption, is essential to achieve the sustainable growth required for the country to become a high-income economy. Other important elements of this rebalancing could include a shift from manufacturing to services, from inward FDI to outward FDI, and from low-skilled intensive production to high-skilled intensive production. However, investment in China remains high and fi nal consumption has increased very little as a share of GDP, equaling about half of GDP in 2015 (Figure 2). By contrast, the share of fi nal consumption in GDP is 70 percent in India and more than 80 percent in the United States. On the supply side, the share of China’s services sector in GDP has risen from around 40 percent of GDP in 2000 to more than half, while the shares of manufacturing and agriculture have fallen (Figure 3).
All of these changes could have far-reaching consequences for China’s economy and the rest of the world.
Anderson et al. (2015) argue that rebalancing would soften the negative eff ects of the economic slowdown and boost the level of output over the long run. Gauvin et al. (2015) elaborate that an ambitious program of economic reforms is essential to prevent sluggish output growth, corporate defaults, and considerable stress on the banking sector, which could lead to a rise in economic insecurity and possibly social unrest.
23Exploring the Trinity of China, India, and Russia: Why it Matters?
Figure 2: Data on consumption and investment reveal little rebalancing in China
0
10
20
30
40
50
60
70
2000 2005 2010 2015
% o
f GDP
China
Final consumption expenditure, etc. (% of GDP)
Gross capital formation (% of GDP)
Source: World Development Indicators.
Figure 3: China’s share of services in GDP is rising
Source: World Development Indicators.
0
10
20
30
40
50
60
70
80
90
2000 2005 2010 2015
% o
f GDP
United States
Final consumption expenditure, etc. (% of GDP)
Gross capital formation (% of GDP)
0
10
20
30
40
50
60
70
80
90
2000 2005 2010 2015
% 0
f GDP
India
Final consumption expenditure, etc. (% of GDP)
Exports of goods and services (% of GDP)
0
10
20
30
40
50
60
70
80
90
2000 2005 2010 2015
% o
f GDP
United States
Final consumption expenditure, etc. (% of GDP)
Exports of goods and services (% of GDP)
0
10
20
30
40
50
60
70
80
90
2000 2005 2010 2015
% 0
f GDP
India
Final consumption expenditure, etc. (% of GDP)
Gross capital formation (% of GDP)
0
10
20
30
40
50
60
70
2000 2005 2010 2015
% o
f GDP
China
Final consumption expenditure, etc. (% of GDP)
Exports of goods and services (% of GDP)
24 A Rebalancing China and Resurging India: How will the pendulum swing for Russia?
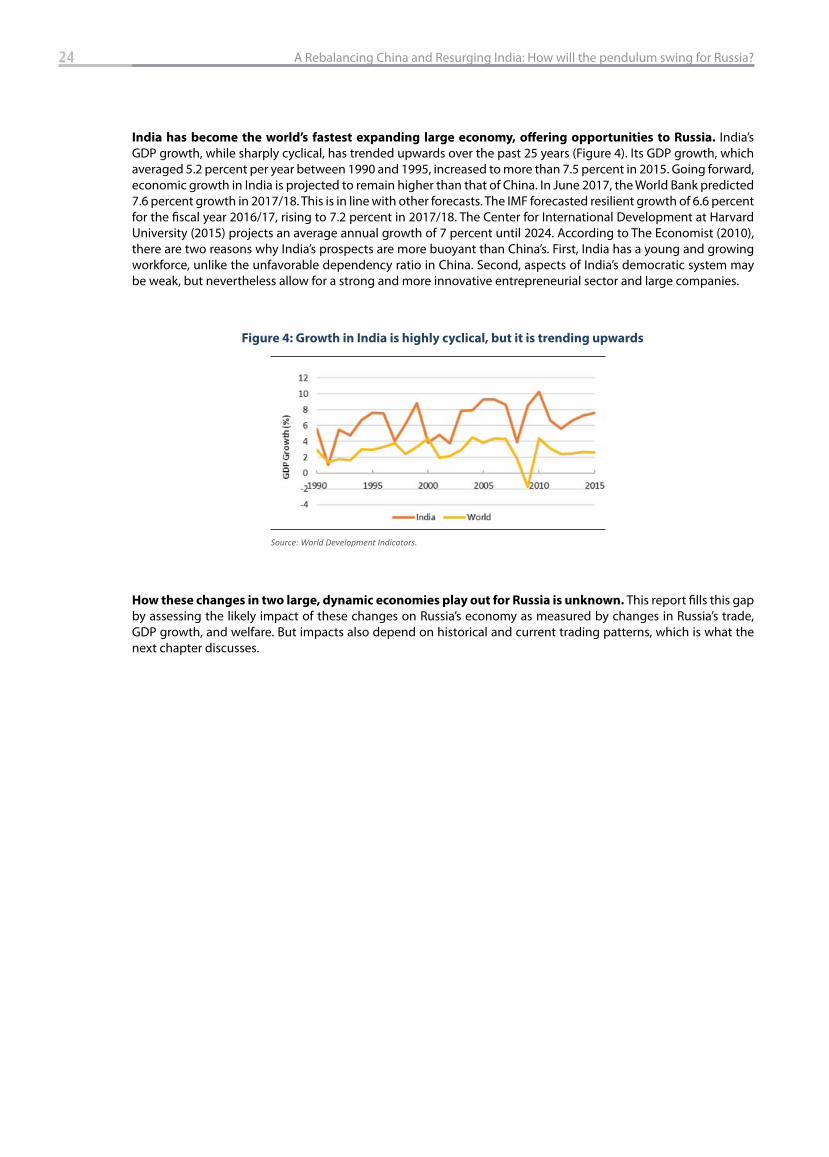
India has become the world’s fastest expanding large economy, off ering opportunities to Russia. India’s GDP growth, while sharply cyclical, has trended upwards over the past 25 years (Figure 4). Its GDP growth, which averaged 5.2 percent per year between 1990 and 1995, increased to more than 7.5 percent in 2015. Going forward, economic growth in India is projected to remain higher than that of China. In June 2017, the World Bank predicted 7.6 percent growth in 2017/18. This is in line with other forecasts. The IMF forecasted resilient growth of 6.6 percent for the fi scal year 2016/17, rising to 7.2 percent in 2017/18. The Center for International Development at Harvard University (2015) projects an average annual growth of 7 percent until 2024. According to The Economist (2010), there are two reasons why India’s prospects are more buoyant than China’s. First, India has a young and growing workforce, unlike the unfavorable dependency ratio in China. Second, aspects of India’s democratic system may be weak, but nevertheless allow for a strong and more innovative entrepreneurial sector and large companies.
How these changes in two large, dynamic economies play out for Russia is unknown. This report fi lls this gap by assessing the likely impact of these changes on Russia’s economy as measured by changes in Russia’s trade, GDP growth, and welfare. But impacts also depend on historical and current trading patterns, which is what the next chapter discusses.
Figure 4: Growth in India is highly cyclical, but it is trending upwards
Source: World Development Indicators.
2. Russia’s Pivot East? Exploring Current Trade Patterns
Russia’s exports to China are substantial but dominated by primary products. In contrast, Russia’s exports to India are more diversifi ed but quite small, largely because of geographical and technical limitations on India’s access to Russia’s main exports of oil and gas. This is also true when looking at bilateral FDI fl ows as well as trade that takes place in global value chains.
China has become increasingly important to the global economy and to Russia
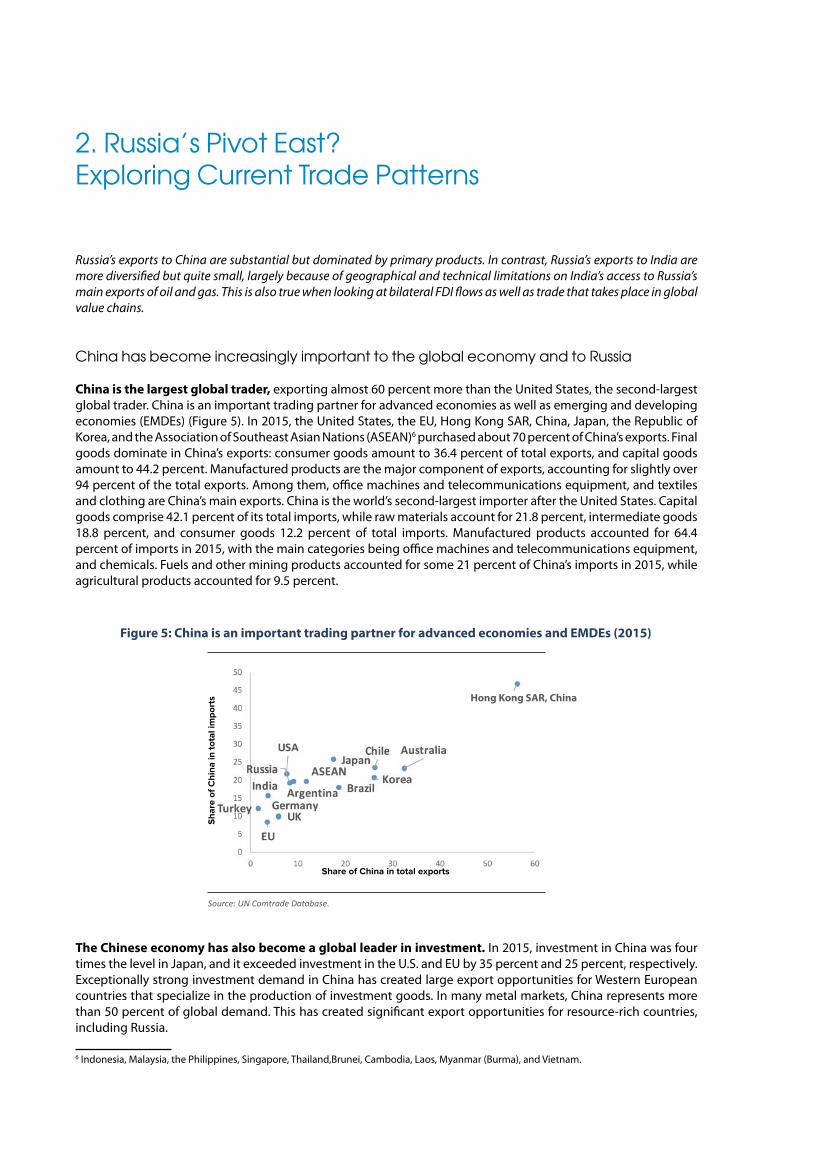
China is the largest global trader, exporting almost 60 percent more than the United States, the second-largest global trader. China is an important trading partner for advanced economies as well as emerging and developing economies (EMDEs) (Figure 5). In 2015, the United States, the EU, Hong Kong SAR, China, Japan, the Republic of Korea, and the Association of Southeast Asian Nations (ASEAN)6 purchased about 70 percent of China’s exports. Final goods dominate in China’s exports: consumer goods amount to 36.4 percent of total exports, and capital goods amount to 44.2 percent. Manufactured products are the major component of exports, accounting for slightly over 94 percent of the total exports. Among them, offi ce machines and telecommunications equipment, and textiles and clothing are China’s main exports. China is the world’s second-largest importer after the United States. Capital goods comprise 42.1 percent of its total imports, while raw materials account for 21.8 percent, intermediate goods 18.8 percent, and consumer goods 12.2 percent of total imports. Manufactured products accounted for 64.4 percent of imports in 2015, with the main categories being offi ce machines and telecommunications equipment, and chemicals. Fuels and other mining products accounted for some 21 percent of China’s imports in 2015, while agricultural products accounted for 9.5 percent.
The Chinese economy has also become a global leader in investment. In 2015, investment in China was four times the level in Japan, and it exceeded investment in the U.S. and EU by 35 percent and 25 percent, respectively. Exceptionally strong investment demand in China has created large export opportunities for Western European countries that specialize in the production of investment goods. In many metal markets, China represents more than 50 percent of global demand. This has created signifi cant export opportunities for resource-rich countries, including Russia.
6 Indonesia, Malaysia, the Philippines, Singapore, Thailand,Brunei, Cambodia, Laos, Myanmar (Burma), and Vietnam.
Figure 5: China is an important trading partner for advanced economies and EMDEs (2015)
Source: UN Comtrade Database.
Share of China in total exports
Sha
re o
f Chi
na in
tota
l im
port
s Hong Kong SAR, China
26 A Rebalancing China and Resurging India: How will the pendulum swing for Russia?
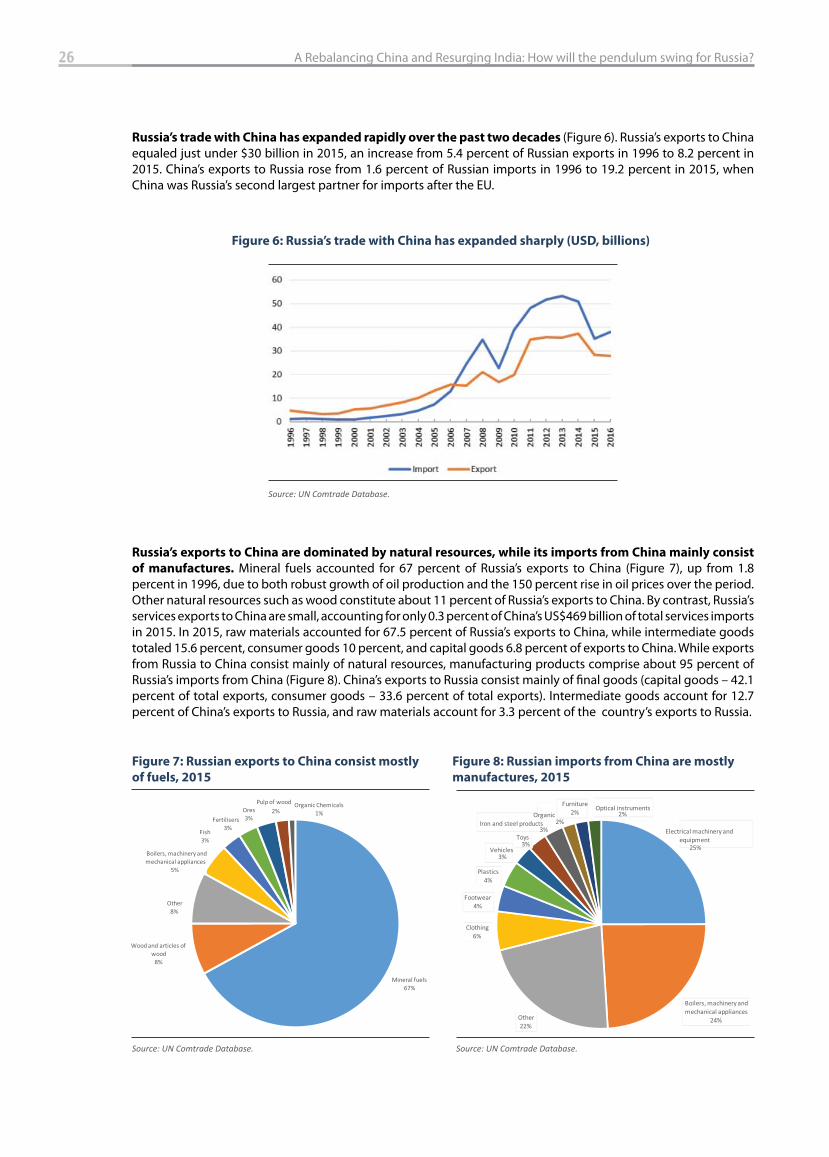
Russia’s trade with China has expanded rapidly over the past two decades (Figure 6). Russia’s exports to China equaled just under $30 billion in 2015, an increase from 5.4 percent of Russian exports in 1996 to 8.2 percent in 2015. China’s exports to Russia rose from 1.6 percent of Russian imports in 1996 to 19.2 percent in 2015, when China was Russia’s second largest partner for imports after the EU.
Russia’s exports to China are dominated by natural resources, while its imports from China mainly consist
of manufactures. Mineral fuels accounted for 67 percent of Russia’s exports to China (Figure 7), up from 1.8 percent in 1996, due to both robust growth of oil production and the 150 percent rise in oil prices over the period. Other natural resources such as wood constitute about 11 percent of Russia’s exports to China. By contrast, Russia’s services exports to China are small, accounting for only 0.3 percent of China’s US$469 billion of total services imports in 2015. In 2015, raw materials accounted for 67.5 percent of Russia’s exports to China, while intermediate goods totaled 15.6 percent, consumer goods 10 percent, and capital goods 6.8 percent of exports to China. While exports from Russia to China consist mainly of natural resources, manufacturing products comprise about 95 percent of Russia’s imports from China (Figure 8). China’s exports to Russia consist mainly of fi nal goods (capital goods – 42.1 percent of total exports, consumer goods – 33.6 percent of total exports). Intermediate goods account for 12.7 percent of China’s exports to Russia, and raw materials account for 3.3 percent of the country’s exports to Russia.
Figure 6: Russia’s trade with China has expanded sharply (USD, billions)
Source: UN Comtrade Database.
Figure 7: Russian exports to China consist mostly
of fuels, 2015
Source: UN Comtrade Database.
Figure 8: Russian imports from China are mostly
manufactures, 2015
Source: UN Comtrade Database.
27 Russia’s Pivot East? Exploring Current Trade Patterns
China’s net FDI to Russia is modest. Only a few years ago, outward FDI from China was negligible, but by 2015, outward FDI amounted to US$167 billion, roughly 70 percent of inward FDI. China’s share of Russia’s net FDI infl ows rose from 0.2 percent in 2007 to 10 percent in 2015, largely refl ecting declines in FDI from other sources in 2014-15 due to low oil prices and economic sanctions. The expected rise in outward FDI in China, owing to structural changes in the economy, is likely to present an important opportunity for Russia to capture a larger part of the higher end of the value chain.
India is less important as a trading partner to Russia
India has also become an important participant in global trade. Its exports of goods and services totaled US$418 billion in 2015, or 1.7 percent of the world’s exports. India’s top merchandise exports during 2013-2015 were petroleum and coke, chemical rubber products, other manufacturing products, textiles, and other machinery and equipment. India has a larger share of services (37 percent) in its export basket than Russia, China, and many other large economies. The telecommunications, computer, and information services sector was the top Indian services export during 2013-2015, followed by other business services, and travel. In 2015, India’s total imports amounted to US$471 billion. Its top merchandise imports during 2013-2015 were oil, petroleum and coke, non-ferrous metals, other machinery and equipment, and electronic equipment. India’s top services imports during the same period were transport, other business services, and travel.
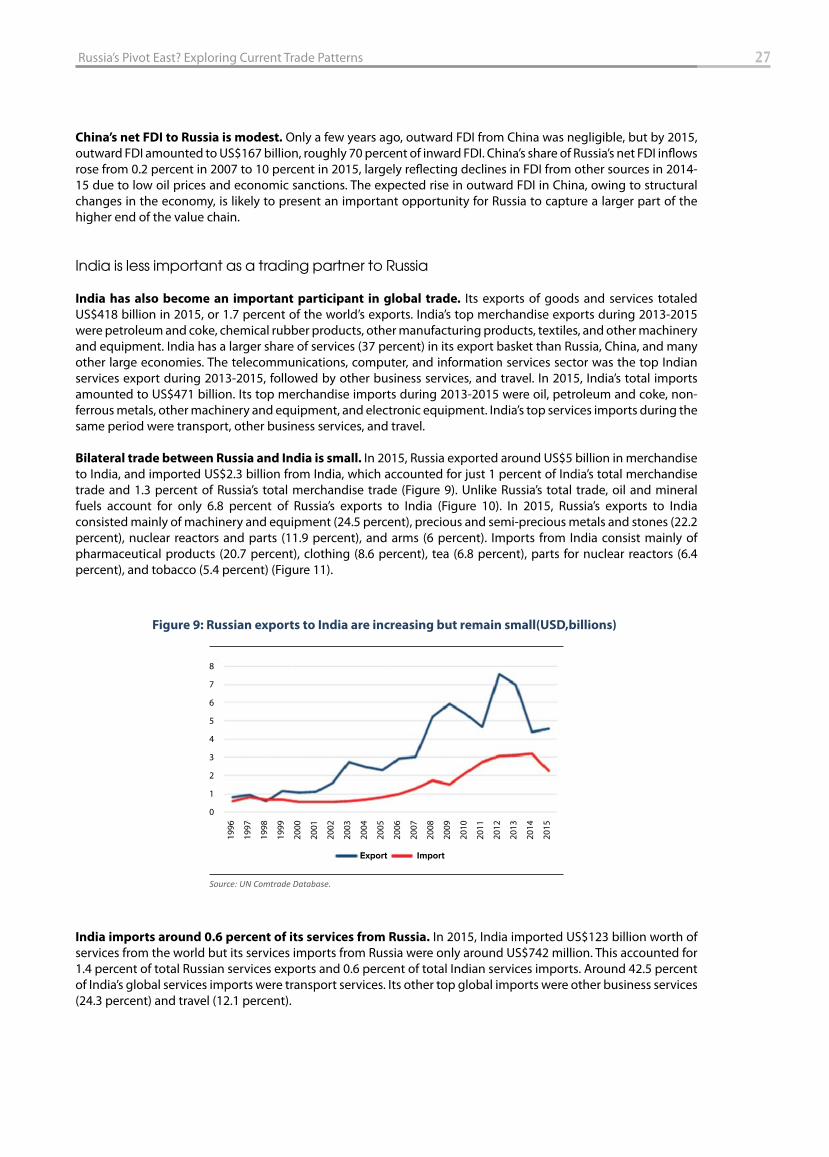
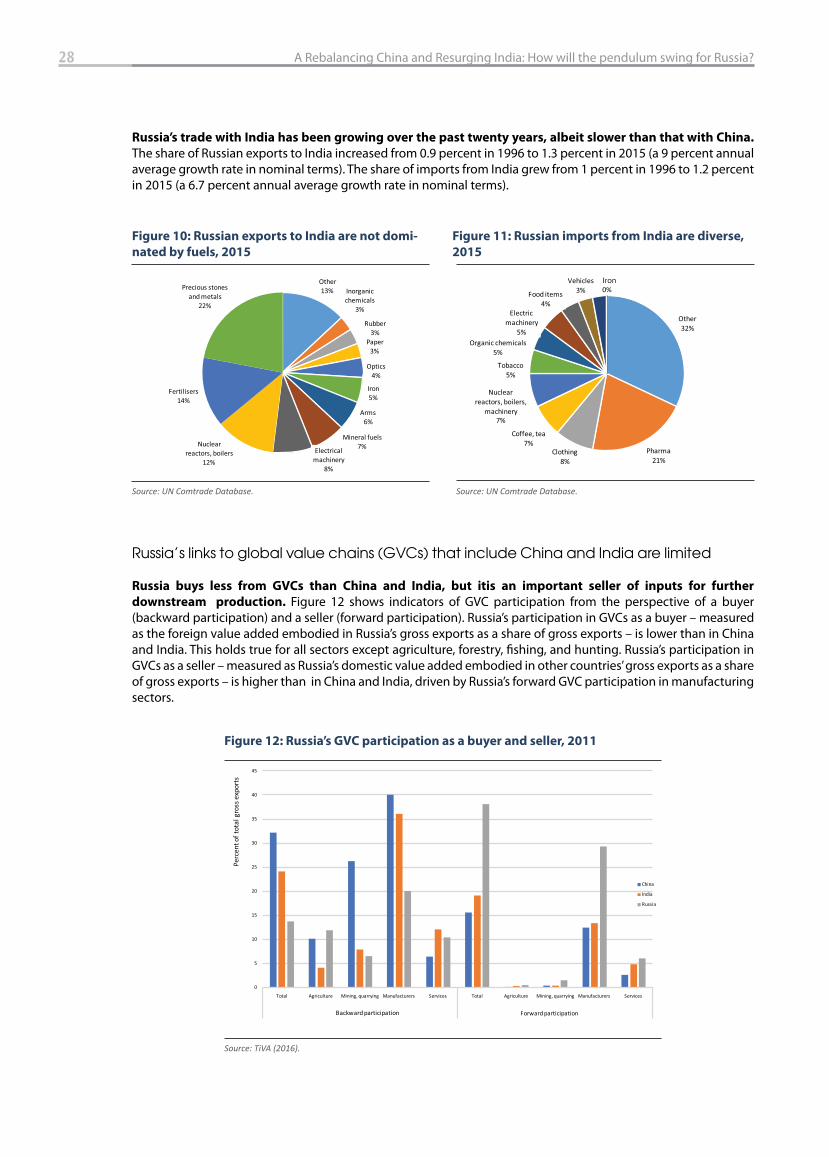
Bilateral trade between Russia and India is small. In 2015, Russia exported around US$5 billion in merchandise to India, and imported US$2.3 billion from India, which accounted for just 1 percent of India’s total merchandise trade and 1.3 percent of Russia’s total merchandise trade (Figure 9). Unlike Russia’s total trade, oil and mineral fuels account for only 6.8 percent of Russia’s exports to India (Figure 10). In 2015, Russia’s exports to India consisted mainly of machinery and equipment (24.5 percent), precious and semi-precious metals and stones (22.2 percent), nuclear reactors and parts (11.9 percent), and arms (6 percent). Imports from India consist mainly of pharmaceutical products (20.7 percent), clothing (8.6 percent), tea (6.8 percent), parts for nuclear reactors (6.4 percent), and tobacco (5.4 percent) (Figure 11).
India imports around 0.6 percent of its services from Russia. In 2015, India imported US$123 billion worth of services from the world but its services imports from Russia were only around US$742 million. This accounted for 1.4 percent of total Russian services exports and 0.6 percent of total Indian services imports. Around 42.5 percent of India’s global services imports were transport services. Its other top global imports were other business services (24.3 percent) and travel (12.1 percent).
Figure 9: Russian exports to India are increasing but remain small(USD,billions)
Source: UN Comtrade Database.
Export Import
1996
1997
1998
1999
2000
2001
2002
2003
2004
2005
2006
2007
2008
2009
2010
2011
2012
2013
2014
2015
8
7
6
5
4
3
2
1
0
28 A Rebalancing China and Resurging India: How will the pendulum swing for Russia?
Russia’s trade with India has been growing over the past twenty years, albeit slower than that with China.
The share of Russian exports to India increased from 0.9 percent in 1996 to 1.3 percent in 2015 (a 9 percent annual average growth rate in nominal terms). The share of imports from India grew from 1 percent in 1996 to 1.2 percent in 2015 (a 6.7 percent annual average growth rate in nominal terms).
Russia’s links to global value chains (GVCs) that include China and India are limited
Russia buys less from GVCs than China and India, but itis an important seller of inputs for further
downstream production. Figure 12 shows indicators of GVC participation from the perspective of a buyer (backward participation) and a seller (forward participation). Russia’s participation in GVCs as a buyer – measured as the foreign value added embodied in Russia’s gross exports as a share of gross exports – is lower than in China and India. This holds true for all sectors except agriculture, forestry, fi shing, and hunting. Russia’s participation in GVCs as a seller – measured as Russia’s domestic value added embodied in other countries’ gross exports as a share of gross exports – is higher than in China and India, driven by Russia’s forward GVC participation in manufacturing sectors.
Figure 12: Russia’s GVC participation as a buyer and seller, 2011
Source: TiVA (2016).
0
5
10
15
20
25
30
35
40
45
Total Agriculture Mining, quarrying Manufacturers Services Total Agriculture Mining, quarrying Manufacturers Services
Backward participation Forward participation
Perc
ent o
f tot
al g
ross
exp
orts
China
India
Russia
Figure 10: Russian exports to India are not domi-
nated by fuels, 2015
Source: UN Comtrade Database.
Other 13% Inorganic
chemicals3%
Rubber3%
Paper3%
Optics4%
Iron 5%
Arms 6%
Mineral fuels7%Electrical
machinery8%
Nuclear reactors, boilers
12%
Fertilisers14%
Precious stones and metals
22%
Figure 11: Russian imports from India are diverse,
2015
Source: UN Comtrade Database.
Other 32%
Pharma21%
Clothing8%
Coffee, tea 7%
Nuclear reactors, boilers,
machinery7%
Tobacco5%
Organic chemicals5%
Electric machinery
5%
Food items4%
Vehicles3%
Iron3%0%Iron
29 Russia’s Pivot East? Exploring Current Trade Patterns
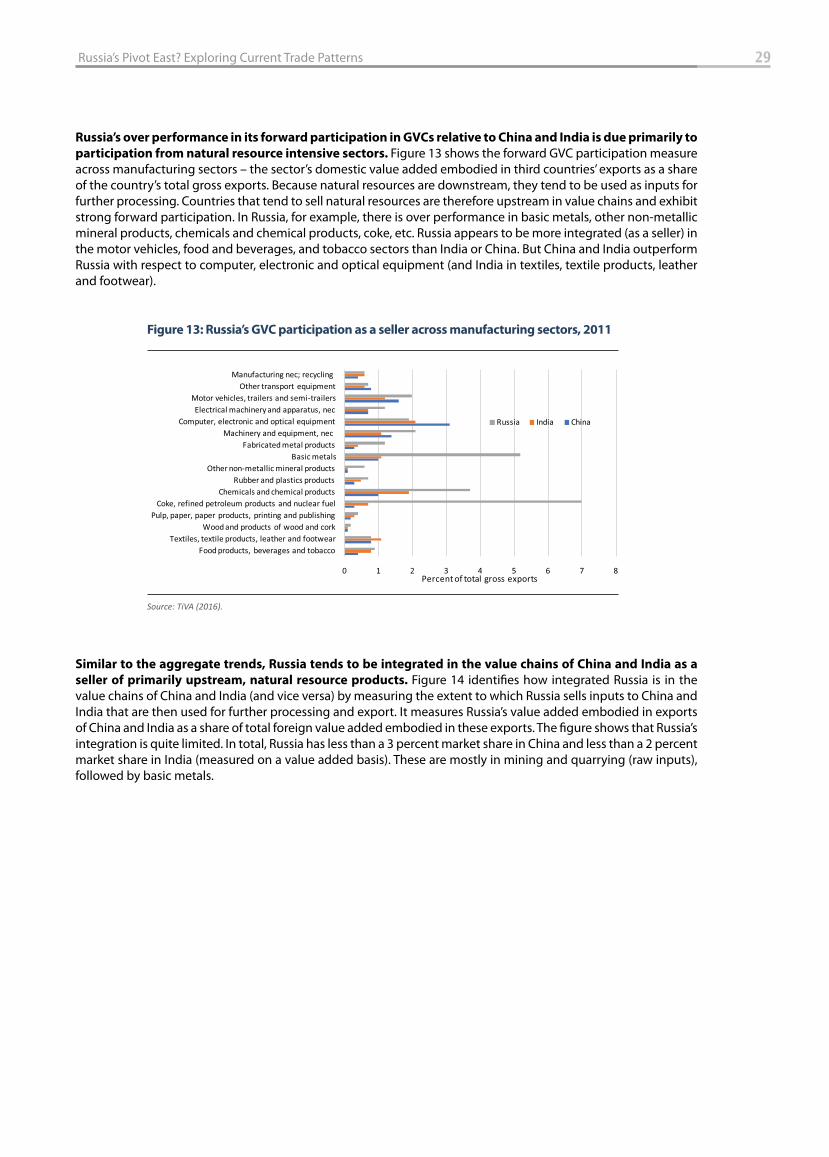
Russia’s over performance in its forward participation in GVCs relative to China and India is due primarily to
participation from natural resource intensive sectors. Figure 13 shows the forward GVC participation measure across manufacturing sectors – the sector’s domestic value added embodied in third countries’ exports as a share of the country’s total gross exports. Because natural resources are downstream, they tend to be used as inputs for further processing. Countries that tend to sell natural resources are therefore upstream in value chains and exhibit strong forward participation. In Russia, for example, there is over performance in basic metals, other non-metallic mineral products, chemicals and chemical products, coke, etc. Russia appears to be more integrated (as a seller) in the motor vehicles, food and beverages, and tobacco sectors than India or China. But China and India outperform Russia with respect to computer, electronic and optical equipment (and India in textiles, textile products, leather and footwear).
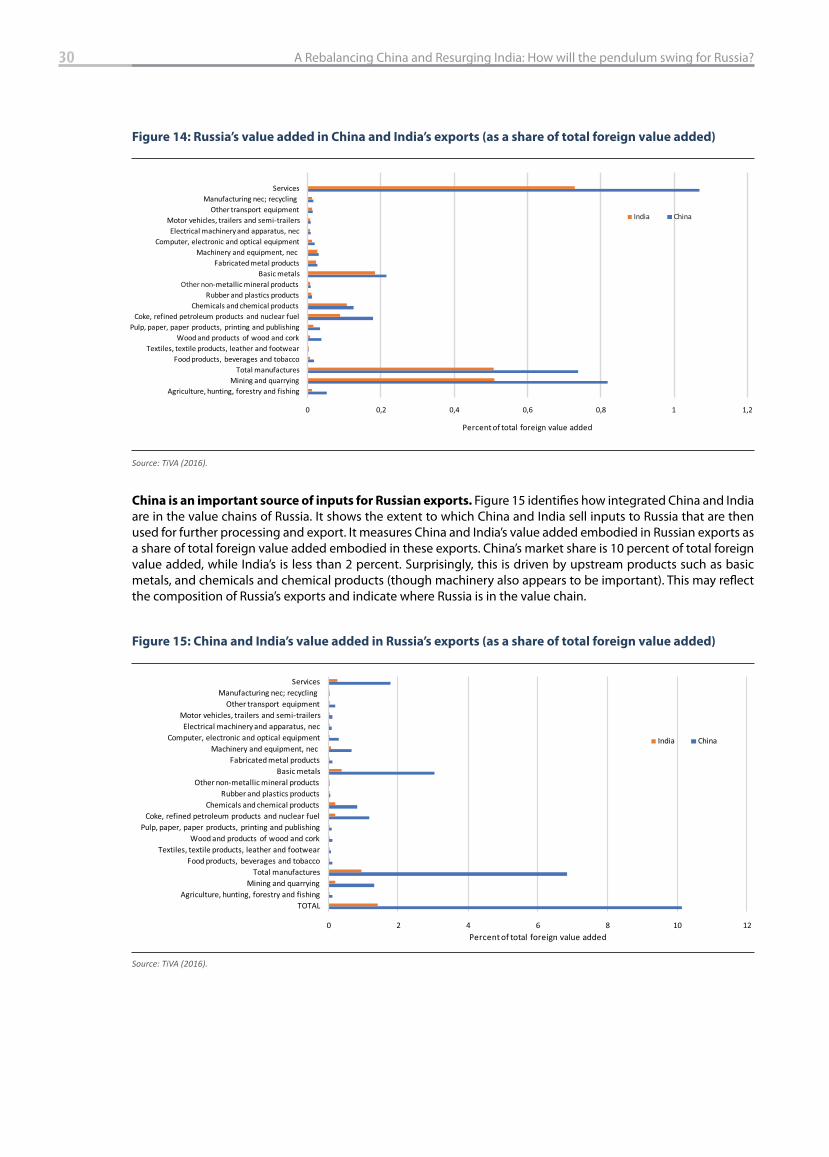
Similar to the aggregate trends, Russia tends to be integrated in the value chains of China and India as a
seller of primarily upstream, natural resource products. Figure 14 identifi es how integrated Russia is in the value chains of China and India (and vice versa) by measuring the extent to which Russia sells inputs to China and India that are then used for further processing and export. It measures Russia’s value added embodied in exports of China and India as a share of total foreign value added embodied in these exports. The fi gure shows that Russia’s integration is quite limited. In total, Russia has less than a 3 percent market share in China and less than a 2 percent market share in India (measured on a value added basis). These are mostly in mining and quarrying (raw inputs), followed by basic metals.
Figure 13: Russia’s GVC participation as a seller across manufacturing sectors, 2011
Source: TiVA (2016).
0 1 2 3 4 5 6 7 8
Food products, beverages and tobaccoTextiles, textile products, leather and footwear
Wood and products of wood and corkPulp, paper, paper products, printing and publishing
Coke, refined petroleum products and nuclear fuelChemicals and chemical products
Rubber and plastics productsOther non-metallic mineral products
Basic metalsFabricated metal products
Machinery and equipment, nec Computer, electronic and optical equipment
Electrical machinery and apparatus, necMotor vehicles, trailers and semi-trailers
Other transport equipmentManufacturing nec; recycling
Percent of total gross exports
Russia India China
30 A Rebalancing China and Resurging India: How will the pendulum swing for Russia?
China is an important source of inputs for Russian exports. Figure 15 identifi es how integrated China and India are in the value chains of Russia. It shows the extent to which China and India sell inputs to Russia that are then used for further processing and export. It measures China and India’s value added embodied in Russian exports as a share of total foreign value added embodied in these exports. China’s market share is 10 percent of total foreign value added, while India’s is less than 2 percent. Surprisingly, this is driven by upstream products such as basic metals, and chemicals and chemical products (though machinery also appears to be important). This may refl ect the composition of Russia’s exports and indicate where Russia is in the value chain.
Figure 14: Russia’s value added in China and India’s exports (as a share of total foreign value added)
Source: TiVA (2016).
0 0,2 0,4 0,6 0,8 1 1,2
Agriculture, hunting, forestry and fishingMining and quarrying
Total manufacturesFood products, beverages and tobacco
Textiles, textile products, leather and footwearWood and products of wood and cork
Pulp, paper, paper products, printing and publishingCoke, refined petroleum products and nuclear fuel
Chemicals and chemical productsRubber and plastics products
Other non-metallic mineral productsBasic metals
Fabricated metal productsMachinery and equipment, nec
Computer, electronic and optical equipmentElectrical machinery and apparatus, nec
Motor vehicles, trailers and semi-trailersOther transport equipment
Manufacturing nec; recycling Services
Percent of total foreign value added
India China
Figure 15: China and India’s value added in Russia’s exports (as a share of total foreign value added)
Source: TiVA (2016).
0 2 4 6 8 10 12
TOTALAgriculture, hunting, forestry and fishing
Mining and quarryingTotal manufactures
Food products, beverages and tobaccoTextiles, textile products, leather and footwear
Wood and products of wood and corkPulp, paper, paper products, printing and publishing
Coke, refined petroleum products and nuclear fuelChemicals and chemical products
Rubber and plastics productsOther non-metallic mineral products
Basic metalsFabricated metal products
Machinery and equipment, nec Computer, electronic and optical equipment
Electrical machinery and apparatus, necMotor vehicles, trailers and semi-trailers
Other transport equipmentManufacturing nec; recycling
Services
Percent of total foreign value added
India China
31 Russia’s Pivot East? Exploring Current Trade Patterns
FDI flows between Russia, China, and India remain low
Net FDI infl ows from China to Russia have increased substantially while net fl ows from the rest of the world
to Russia have declined. While Russia’s net FDI infl ows from the world fell from US$55.9 billion in 2007 to US$6.4 billion in 2015, net FDI infl ows from China rose from US$112 million to US$645 million over this period (Figure 16). However, compared to 2014, FDI infl ows from China dropped in 2015, reaching $1.3 billion. Russia’s outward FDI to China is minimal.
Although inward net FDI from India to Russia is low, Russia reported positive net outward FDI to India
for 2008, 2010, and 2013. For example, in 2010, net FDI to India from Russia reached $600 million. Since 2012, however, net FDI to India from Russia has been zero or negative (in 2014).
Figure 16: Russia’s net FDI infl ows from China are greater than those from India
Source: Central Bank of Russia.

32 A Rebalancing China and Resurging India: How will the pendulum swing for Russia?
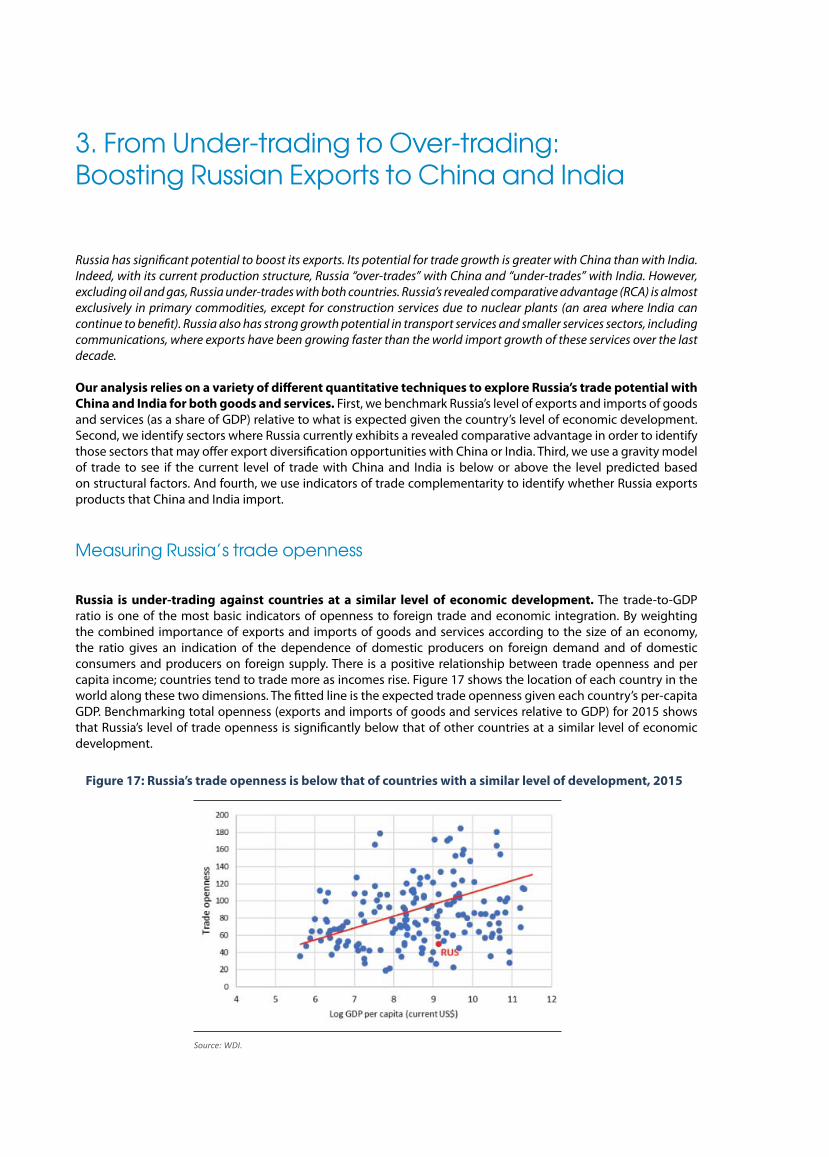
3. From Under-trading to Over-trading: Boosting Russian Exports to China and India
Russia has signifi cant potential to boost its exports. Its potential for trade growth is greater with China than with India. Indeed, with its current production structure, Russia “over-trades” with China and “under-trades” with India. However, excluding oil and gas, Russia under-trades with both countries. Russia’s revealed comparative advantage (RCA) is almost exclusively in primary commodities, except for construction services due to nuclear plants (an area where India can continue to benefi t). Russia also has strong growth potential in transport services and smaller services sectors, including communications, where exports have been growing faster than the world import growth of these services over the last decade.
Our analysis relies on a variety of diff erent quantitative techniques to explore Russia’s trade potential with
China and India for both goods and services. First, we benchmark Russia’s level of exports and imports of goods and services (as a share of GDP) relative to what is expected given the country’s level of economic development. Second, we identify sectors where Russia currently exhibits a revealed comparative advantage in order to identify those sectors that may off er export diversifi cation opportunities with China or India. Third, we use a gravity model of trade to see if the current level of trade with China and India is below or above the level predicted based on structural factors. And fourth, we use indicators of trade complementarity to identify whether Russia exports products that China and India import.
Measuring Russia’s trade openness
Russia is under-trading against countries at a similar level of economic development. The trade-to-GDP ratio is one of the most basic indicators of openness to foreign trade and economic integration. By weighting the combined importance of exports and imports of goods and services according to the size of an economy, the ratio gives an indication of the dependence of domestic producers on foreign demand and of domestic consumers and producers on foreign supply. There is a positive relationship between trade openness and per capita income; countries tend to trade more as incomes rise. Figure 17 shows the location of each country in the world along these two dimensions. The fi tted line is the expected trade openness given each country’s per-capita GDP. Benchmarking total openness (exports and imports of goods and services relative to GDP) for 2015 shows that Russia’s level of trade openness is signifi cantly below that of other countries at a similar level of economic development.
Figure 17: Russia’s trade openness is below that of countries with a similar level of development, 2015
Source: WDI.
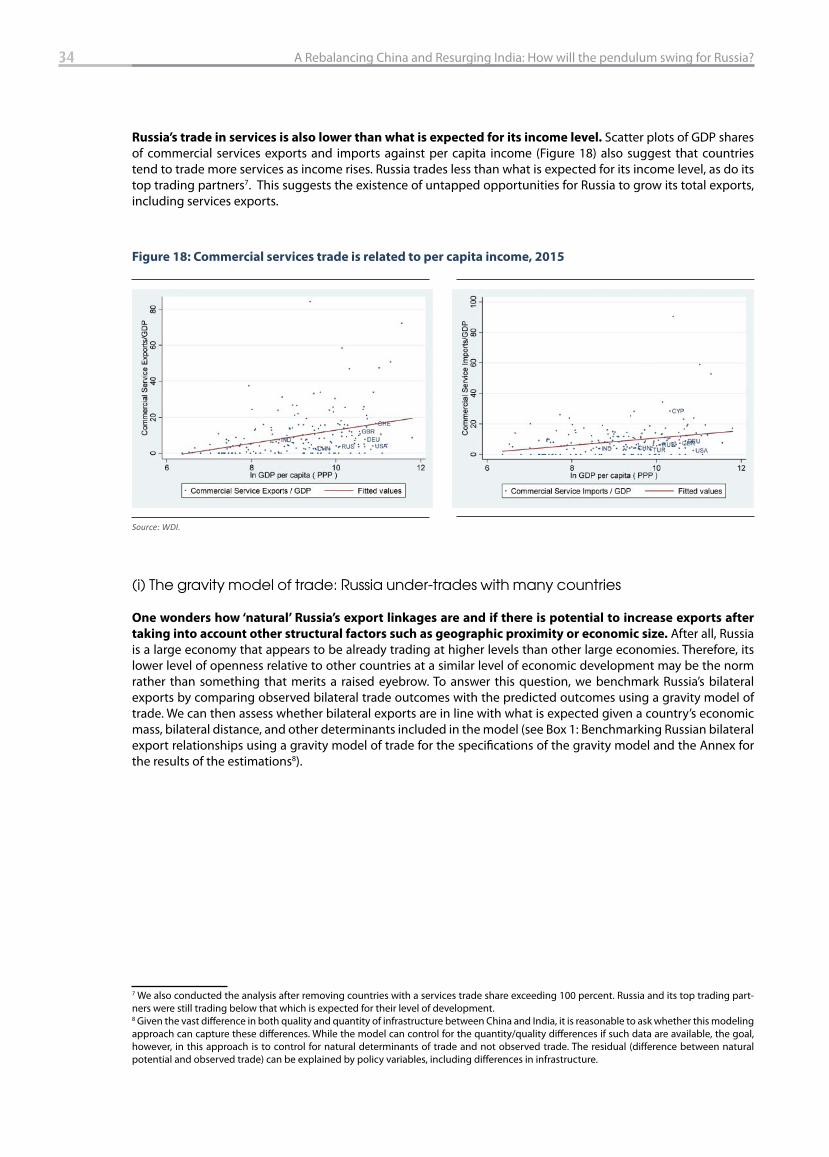
34 A Rebalancing China and Resurging India: How will the pendulum swing for Russia?
Russia’s trade in services is also lower than what is expected for its income level. Scatter plots of GDP shares of commercial services exports and imports against per capita income (Figure 18) also suggest that countries tend to trade more services as income rises. Russia trades less than what is expected for its income level, as do its top trading partners7. This suggests the existence of untapped opportunities for Russia to grow its total exports, including services exports.
(i) The gravity model of trade: Russia under-trades with many countries
One wonders how ‘natural’ Russia’s export linkages are and if there is potential to increase exports after
taking into account other structural factors such as geographic proximity or economic size. After all, Russia is a large economy that appears to be already trading at higher levels than other large economies. Therefore, its lower level of openness relative to other countries at a similar level of economic development may be the norm rather than something that merits a raised eyebrow. To answer this question, we benchmark Russia’s bilateral exports by comparing observed bilateral trade outcomes with the predicted outcomes using a gravity model of trade. We can then assess whether bilateral exports are in line with what is expected given a country’s economic mass, bilateral distance, and other determinants included in the model (see Box 1: Benchmarking Russian bilateral export relationships using a gravity model of trade for the specifi cations of the gravity model and the Annex for the results of the estimations8).
7 We also conducted the analysis after removing countries with a services trade share exceeding 100 percent. Russia and its top trading part-ners were still trading below that which is expected for their level of development.8 Given the vast diff erence in both quality and quantity of infrastructure between China and India, it is reasonable to ask whether this modeling approach can capture these diff erences. While the model can control for the quantity/quality diff erences if such data are available, the goal, however, in this approach is to control for natural determinants of trade and not observed trade. The residual (diff erence between natural potential and observed trade) can be explained by policy variables, including diff erences in infrastructure.
Figure 18: Commercial services trade is related to per capita income, 2015
Source: WDI.
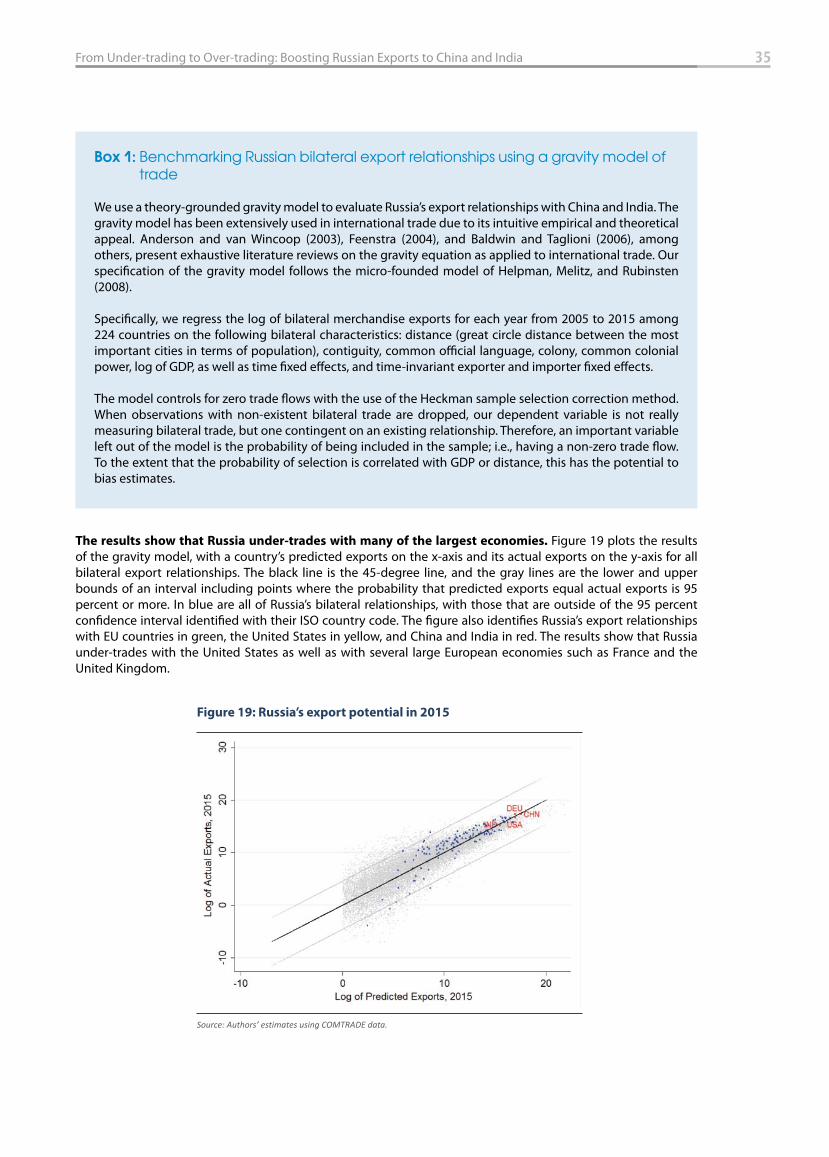
35From Under-trading to Over-trading: Boosting Russian Exports to China and India
The results show that Russia under-trades with many of the largest economies. Figure 19 plots the results of the gravity model, with a country’s predicted exports on the x-axis and its actual exports on the y-axis for all bilateral export relationships. The black line is the 45-degree line, and the gray lines are the lower and upper bounds of an interval including points where the probability that predicted exports equal actual exports is 95 percent or more. In blue are all of Russia’s bilateral relationships, with those that are outside of the 95 percent confi dence interval identifi ed with their ISO country code. The fi gure also identifi es Russia’s export relationships with EU countries in green, the United States in yellow, and China and India in red. The results show that Russia under-trades with the United States as well as with several large European economies such as France and the United Kingdom.
Box 1: Benchmarking Russian bilateral export relationships using a gravity model of trade
We use a theory-grounded gravity model to evaluate Russia’s export relationships with China and India. The gravity model has been extensively used in international trade due to its intuitive empirical and theoretical appeal. Anderson and van Wincoop (2003), Feenstra (2004), and Baldwin and Taglioni (2006), among others, present exhaustive literature reviews on the gravity equation as applied to international trade. Our specifi cation of the gravity model follows the micro-founded model of Helpman, Melitz, and Rubinsten (2008).
Specifi cally, we regress the log of bilateral merchandise exports for each year from 2005 to 2015 among 224 countries on the following bilateral characteristics: distance (great circle distance between the most important cities in terms of population), contiguity, common offi cial language, colony, common colonial power, log of GDP, as well as time fi xed eff ects, and time-invariant exporter and importer fi xed eff ects.
The model controls for zero trade fl ows with the use of the Heckman sample selection correction method. When observations with non-existent bilateral trade are dropped, our dependent variable is not really measuring bilateral trade, but one contingent on an existing relationship. Therefore, an important variable left out of the model is the probability of being included in the sample; i.e., having a non-zero trade fl ow. To the extent that the probability of selection is correlated with GDP or distance, this has the potential to bias estimates.
Figure 19: Russia’s export potential in 2015
Source: Authors’ estimates using COMTRADE data.
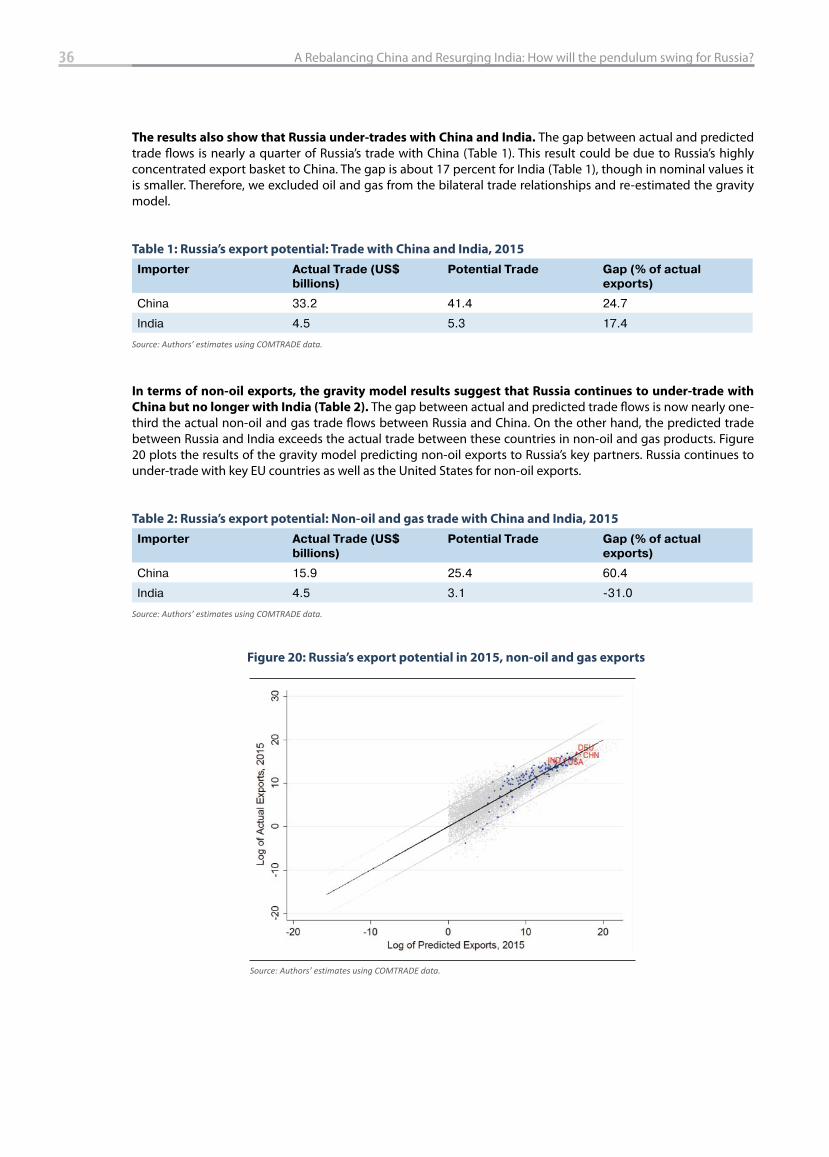
36 A Rebalancing China and Resurging India: How will the pendulum swing for Russia?
The results also show that Russia under-trades with China and India. The gap between actual and predicted trade fl ows is nearly a quarter of Russia’s trade with China (Table 1). This result could be due to Russia’s highly concentrated export basket to China. The gap is about 17 percent for India (Table 1), though in nominal values it is smaller. Therefore, we excluded oil and gas from the bilateral trade relationships and re-estimated the gravity model.
Table 1: Russia’s export potential: Trade with China and India, 2015
Importer Actual Trade (US$
billions)
Potential Trade Gap (% of actual
exports)
China 33.2 41.4 24.7
India 4.5 5.3 17.4
Source: Authors’ estimates using COMTRADE data.
In terms of non-oil exports, the gravity model results suggest that Russia continues to under-trade with
China but no longer with India (Table 2). The gap between actual and predicted trade fl ows is now nearly one-third the actual non-oil and gas trade fl ows between Russia and China. On the other hand, the predicted trade between Russia and India exceeds the actual trade between these countries in non-oil and gas products. Figure 20 plots the results of the gravity model predicting non-oil exports to Russia’s key partners. Russia continues to under-trade with key EU countries as well as the United States for non-oil exports.
Table 2: Russia’s export potential: Non-oil and gas trade with China and India, 2015
Importer Actual Trade (US$
billions)
Potential Trade Gap (% of actual
exports)
China 15.9 25.4 60.4
India 4.5 3.1 -31.0
Source: Authors’ estimates using COMTRADE data.
Figure 20: Russia’s export potential in 2015, non-oil and gas exports
Source: Authors’ estimates using COMTRADE data.
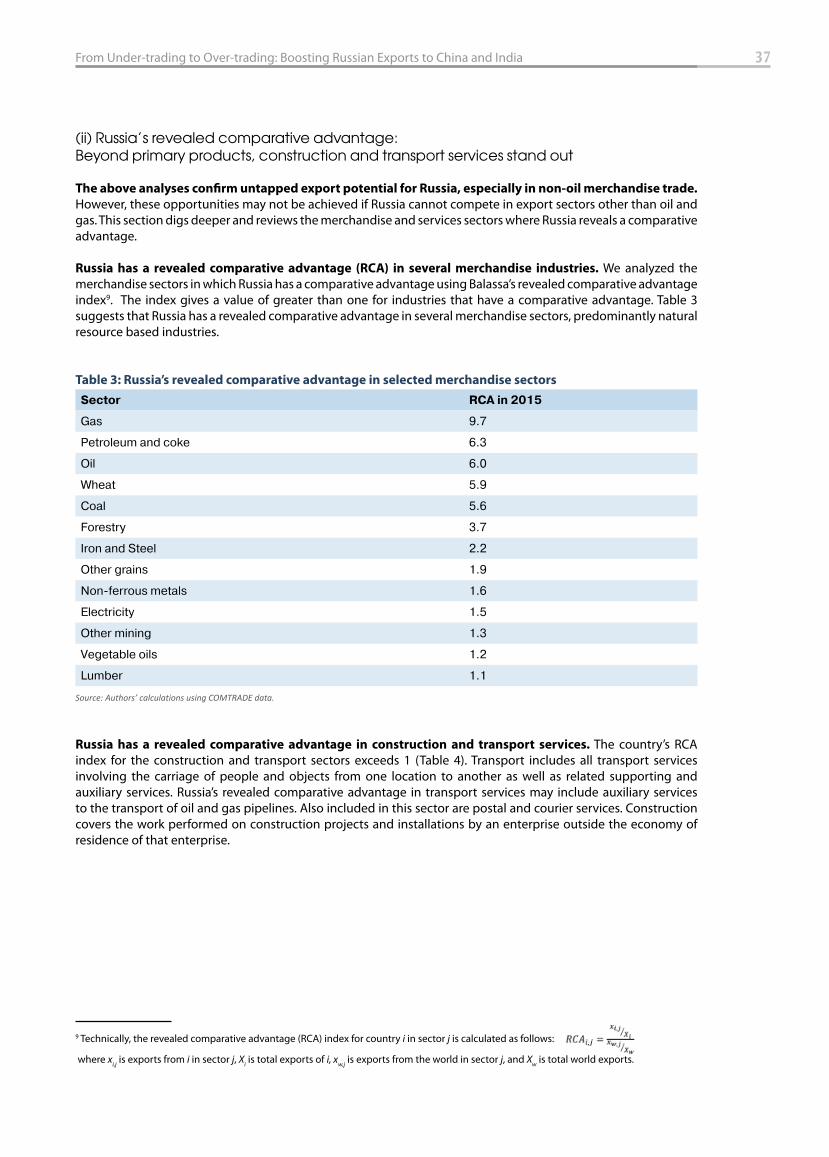
37From Under-trading to Over-trading: Boosting Russian Exports to China and India
(ii) Russia’s revealed comparative advantage: Beyond primary products, construction and transport services stand out
The above analyses confi rm untapped export potential for Russia, especially in non-oil merchandise trade.
However, these opportunities may not be achieved if Russia cannot compete in export sectors other than oil and gas. This section digs deeper and reviews the merchandise and services sectors where Russia reveals a comparative advantage.
Russia has a revealed comparative advantage (RCA) in several merchandise industries. We analyzed the merchandise sectors in which Russia has a comparative advantage using Balassa’s revealed comparative advantage index9. The index gives a value of greater than one for industries that have a comparative advantage. Table 3 suggests that Russia has a revealed comparative advantage in several merchandise sectors, predominantly natural resource based industries.
Table 3: Russia’s revealed comparative advantage in selected merchandise sectors
Sector RCA in 2015
Gas 9.7
Petroleum and coke 6.3
Oil 6.0
Wheat 5.9
Coal 5.6
Forestry 3.7
Iron and Steel 2.2
Other grains 1.9
Non-ferrous metals 1.6
Electricity 1.5
Other mining 1.3
Vegetable oils 1.2
Lumber 1.1
Source: Authors’ calculations using COMTRADE data.
Russia has a revealed comparative advantage in construction and transport services. The country’s RCA index for the construction and transport sectors exceeds 1 (Table 4). Transport includes all transport services involving the carriage of people and objects from one location to another as well as related supporting and auxiliary services. Russia’s revealed comparative advantage in transport services may include auxiliary services to the transport of oil and gas pipelines. Also included in this sector are postal and courier services. Construction covers the work performed on construction projects and installations by an enterprise outside the economy of residence of that enterprise.
9 Technically, the revealed comparative advantage (RCA) index for country i in sector j is calculated as follows:
where xi,j is exports from i in sector j, Xi is total exports of i, xw,j is exports from the world in sector j, and Xw is total world exports.
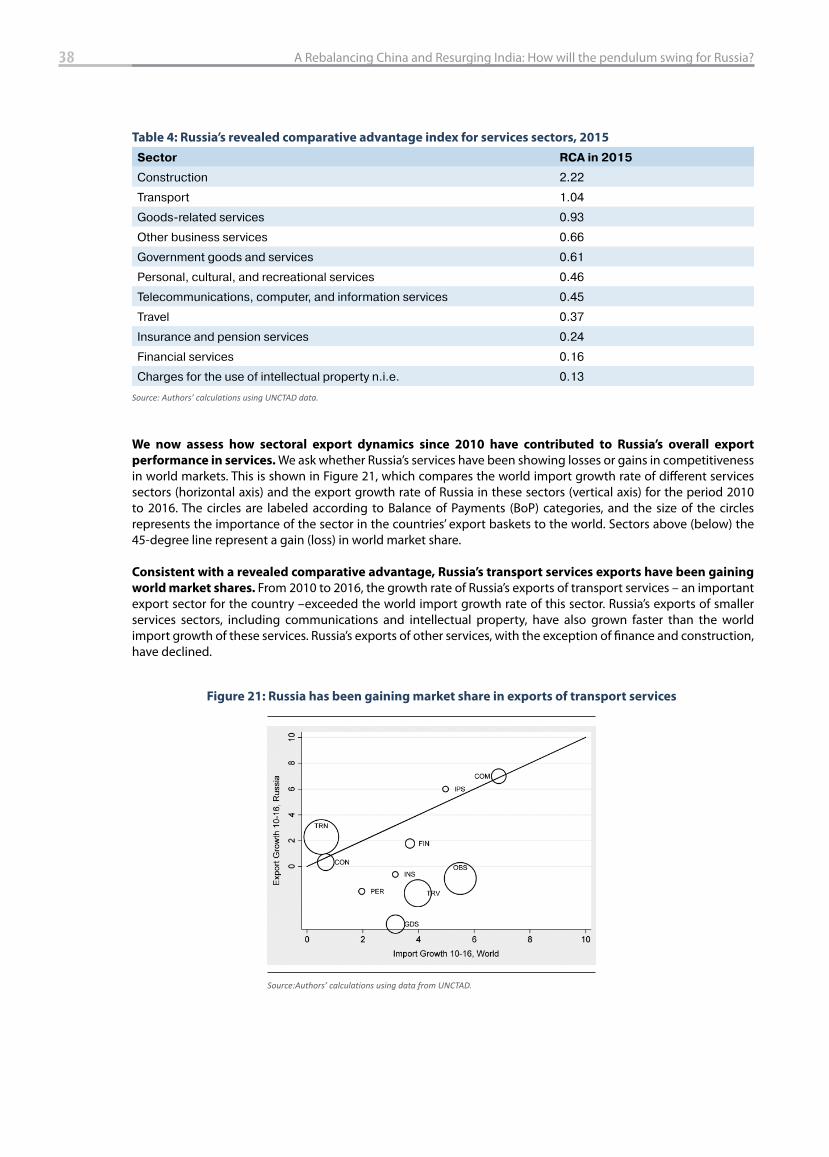
38 A Rebalancing China and Resurging India: How will the pendulum swing for Russia?
Table 4: Russia’s revealed comparative advantage index for services sectors, 2015
Sector RCA in 2015
Construction 2.22
Transport 1.04
Goods-related services 0.93
Other business services 0.66
Government goods and services 0.61
Personal, cultural, and recreational services 0.46
Telecommunications, computer, and information services 0.45
Travel 0.37
Insurance and pension services 0.24
Financial services 0.16
Charges for the use of intellectual property n.i.e. 0.13
Source: Authors’ calculations using UNCTAD data.
We now assess how sectoral export dynamics since 2010 have contributed to Russia’s overall export
performance in services. We ask whether Russia’s services have been showing losses or gains in competitiveness in world markets. This is shown in Figure 21, which compares the world import growth rate of diff erent services sectors (horizontal axis) and the export growth rate of Russia in these sectors (vertical axis) for the period 2010 to 2016. The circles are labeled according to Balance of Payments (BoP) categories, and the size of the circles represents the importance of the sector in the countries’ export baskets to the world. Sectors above (below) the 45-degree line represent a gain (loss) in world market share.
Consistent with a revealed comparative advantage, Russia’s transport services exports have been gaining
world market shares. From 2010 to 2016, the growth rate of Russia’s exports of transport services – an important export sector for the country –exceeded the world import growth rate of this sector. Russia’s exports of smaller services sectors, including communications and intellectual property, have also grown faster than the world import growth of these services. Russia’s exports of other services, with the exception of fi nance and construction, have declined.
Figure 21: Russia has been gaining market share in exports of transport services
Source:Authors’ calculations using data from UNCTAD.
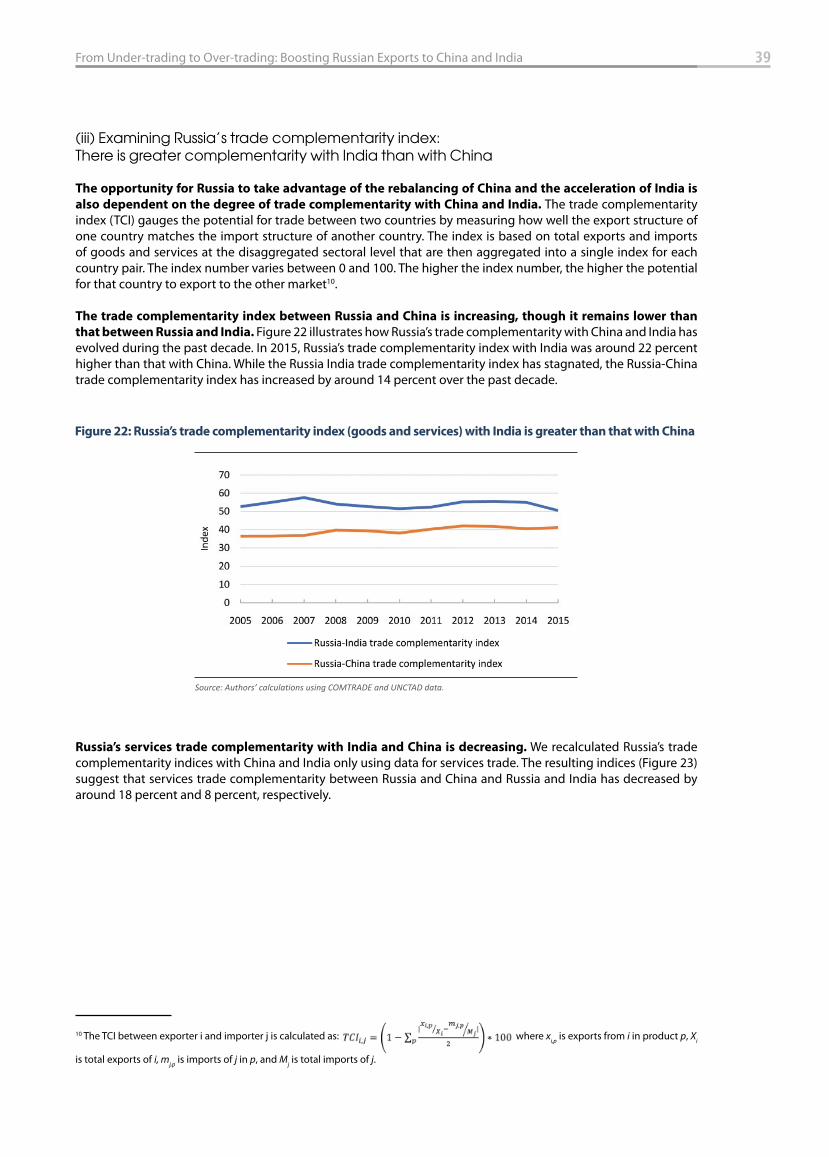
39From Under-trading to Over-trading: Boosting Russian Exports to China and India
(iii) Examining Russia’s trade complementarity index: There is greater complementarity with India than with China
The opportunity for Russia to take advantage of the rebalancing of China and the acceleration of India is
also dependent on the degree of trade complementarity with China and India. The trade complementarity index (TCI) gauges the potential for trade between two countries by measuring how well the export structure of one country matches the import structure of another country. The index is based on total exports and imports of goods and services at the disaggregated sectoral level that are then aggregated into a single index for each country pair. The index number varies between 0 and 100. The higher the index number, the higher the potential for that country to export to the other market10.
The trade complementarity index between Russia and China is increasing, though it remains lower than
that between Russia and India. Figure 22 illustrates how Russia’s trade complementarity with China and India has evolved during the past decade. In 2015, Russia’s trade complementarity index with India was around 22 percent higher than that with China. While the Russia India trade complementarity index has stagnated, the Russia-China trade complementarity index has increased by around 14 percent over the past decade.
Russia’s services trade complementarity with India and China is decreasing. We recalculated Russia’s trade complementarity indices with China and India only using data for services trade. The resulting indices (Figure 23) suggest that services trade complementarity between Russia and China and Russia and India has decreased by around 18 percent and 8 percent, respectively.
10 The TCI between exporter i and importer j is calculated as: where xi,p is exports from i in product p, Xi
is total exports of i, mj,p is imports of j in p, and Mj is total imports of j.
Figure 22: Russia’s trade complementarity index (goods and services) with India is greater than that with China
Source: Authors’ calculations using COMTRADE and UNCTAD data.
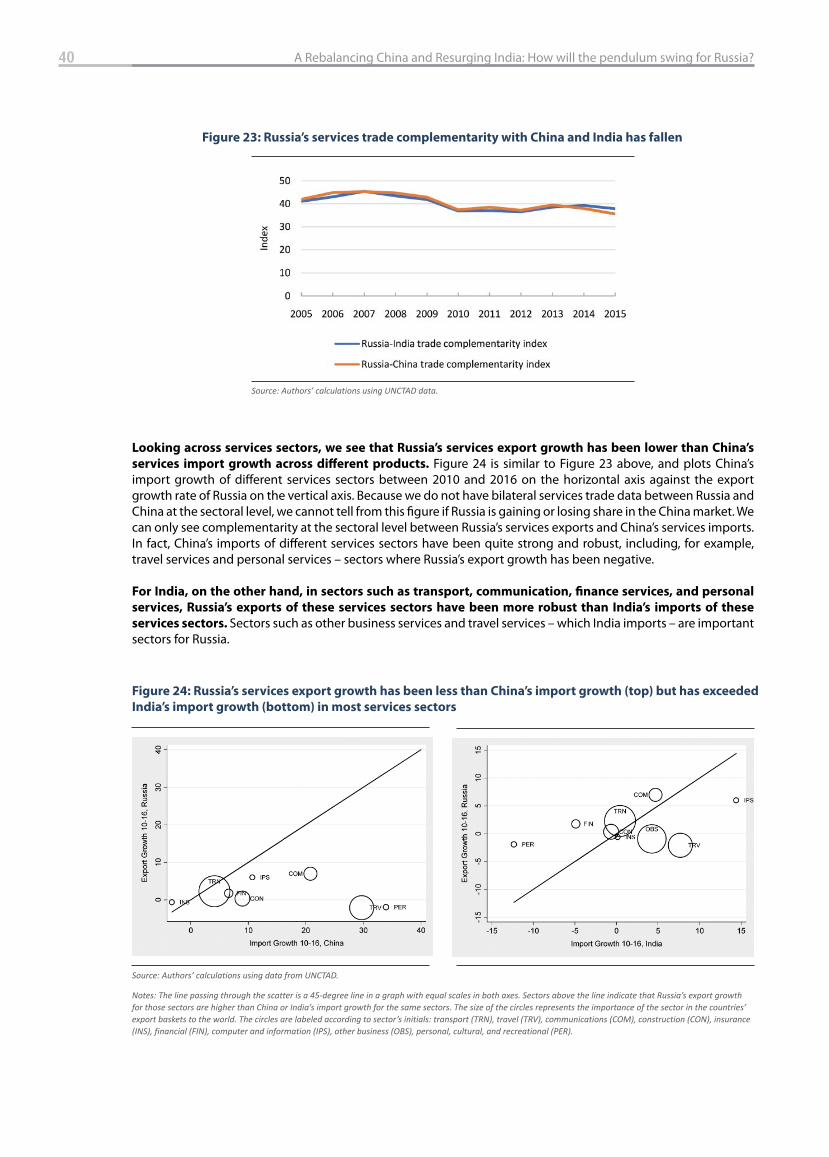
40 A Rebalancing China and Resurging India: How will the pendulum swing for Russia?
Looking across services sectors, we see that Russia’s services export growth has been lower than China’s
services import growth across diff erent products. Figure 24 is similar to Figure 23 above, and plots China’s import growth of diff erent services sectors between 2010 and 2016 on the horizontal axis against the export growth rate of Russia on the vertical axis. Because we do not have bilateral services trade data between Russia and China at the sectoral level, we cannot tell from this fi gure if Russia is gaining or losing share in the China market. We can only see complementarity at the sectoral level between Russia’s services exports and China’s services imports. In fact, China’s imports of diff erent services sectors have been quite strong and robust, including, for example, travel services and personal services – sectors where Russia’s export growth has been negative.
For India, on the other hand, in sectors such as transport, communication, fi nance services, and personal
services, Russia’s exports of these services sectors have been more robust than India’s imports of these
services sectors. Sectors such as other business services and travel services – which India imports – are important sectors for Russia.
Figure 23: Russia’s services trade complementarity with China and India has fallen
Source: Authors’ calculations using UNCTAD data.
Figure 24: Russia’s services export growth has been less than China’s import growth (top) but has exceeded
India’s import growth (bottom) in most services sectors
Source: Authors’ calculations using data from UNCTAD.
Notes: The line passing through the scatter is a 45-degree line in a graph with equal scales in both axes. Sectors above the line indicate that Russia’s export growth for those sectors are higher than China or India’s import growth for the same sectors. The size of the circles represents the importance of the sector in the countries’ export baskets to the world. The circles are labeled according to sector’s initials: transport (TRN), travel (TRV), communications (COM), construction (CON), insurance (INS), financial (FIN), computer and information (IPS), other business (OBS), personal, cultural, and recreational (PER).
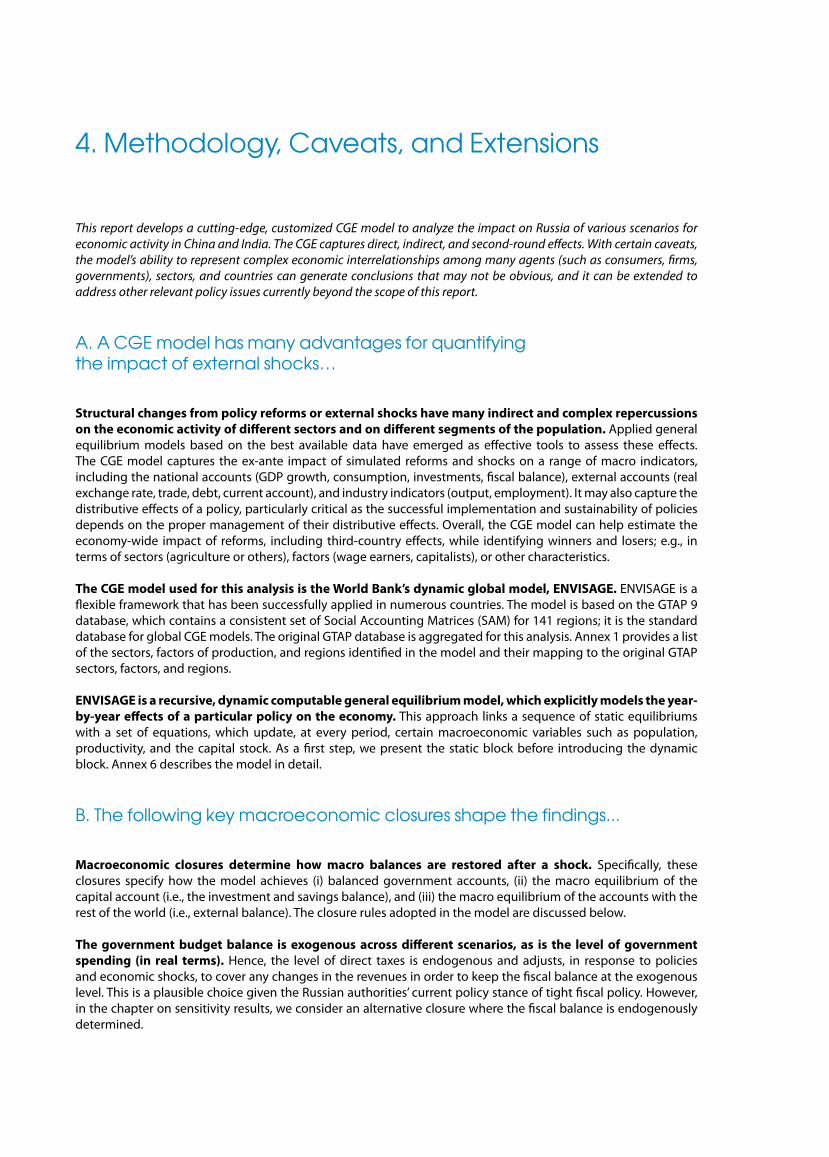
4. Methodology, Caveats, and Extensions
This report develops a cutting-edge, customized CGE model to analyze the impact on Russia of various scenarios for economic activity in China and India. The CGE captures direct, indirect, and second-round eff ects. With certain caveats, the model’s ability to represent complex economic interrelationships among many agents (such as consumers, fi rms, governments), sectors, and countries can generate conclusions that may not be obvious, and it can be extended to address other relevant policy issues currently beyond the scope of this report.
A. A CGE model has many advantages for quantifying the impact of external shocks…
Structural changes from policy reforms or external shocks have many indirect and complex repercussions
on the economic activity of diff erent sectors and on diff erent segments of the population. Applied general equilibrium models based on the best available data have emerged as eff ective tools to assess these eff ects. The CGE model captures the ex-ante impact of simulated reforms and shocks on a range of macro indicators, including the national accounts (GDP growth, consumption, investments, fi scal balance), external accounts (real exchange rate, trade, debt, current account), and industry indicators (output, employment). It may also capture the distributive eff ects of a policy, particularly critical as the successful implementation and sustainability of policies depends on the proper management of their distributive eff ects. Overall, the CGE model can help estimate the economy-wide impact of reforms, including third-country eff ects, while identifying winners and losers; e.g., in terms of sectors (agriculture or others), factors (wage earners, capitalists), or other characteristics.
The CGE model used for this analysis is the World Bank’s dynamic global model, ENVISAGE. ENVISAGE is a fl exible framework that has been successfully applied in numerous countries. The model is based on the GTAP 9 database, which contains a consistent set of Social Accounting Matrices (SAM) for 141 regions; it is the standard database for global CGE models. The original GTAP database is aggregated for this analysis. Annex 1 provides a list of the sectors, factors of production, and regions identifi ed in the model and their mapping to the original GTAP sectors, factors, and regions.
ENVISAGE is a recursive, dynamic computable general equilibrium model, which explicitly models the year-
by-year eff ects of a particular policy on the economy. This approach links a sequence of static equilibriums with a set of equations, which update, at every period, certain macroeconomic variables such as population, productivity, and the capital stock. As a fi rst step, we present the static block before introducing the dynamic block. Annex 6 describes the model in detail.
B. The following key macroeconomic closures shape the findings...
Macroeconomic closures determine how macro balances are restored after a shock. Specifi cally, these closures specify how the model achieves (i) balanced government accounts, (ii) the macro equilibrium of the capital account (i.e., the investment and savings balance), and (iii) the macro equilibrium of the accounts with the rest of the world (i.e., external balance). The closure rules adopted in the model are discussed below.
The government budget balance is exogenous across diff erent scenarios, as is the level of government
spending (in real terms). Hence, the level of direct taxes is endogenous and adjusts, in response to policies and economic shocks, to cover any changes in the revenues in order to keep the fi scal balance at the exogenous level. This is a plausible choice given the Russian authorities’ current policy stance of tight fi scal policy. However, in the chapter on sensitivity results, we consider an alternative closure where the fi scal balance is endogenously determined.
42 A Rebalancing China and Resurging India: How will the pendulum swing for Russia?
For the savings-investment balance, we assume a savings-driven closure. Aggregate investment—which together with an exogenous rate of depreciation determines the next period’s capital stock—is fl exible to ensure that the investment cost will be equal to the savings value. The volume of available savings is determined by an exogenous level of foreign savings, endogenous government savings, and endogenous household savings. In this context, an increase in government revenue, from a new source of tax revenue for example, would also be refl ected in higher public savings and therefore stimulate current investment and growth.
External balance ensures that the path of foreign liabilities is sustainable. This is achieved through adjustment of the real exchange rate, while the current account is fi xed by the available quantity of foreign saving. To maintain the current account constant, domestic prices adjust so as to generate appropriate changes in the volumes of imports and exports demanded. The main implication of this closure is that an increase in exports, for example, would generate an appreciation of the real exchange rate, penalizing the competitiveness of the non-mining sector (the “Dutch disease”).
C. Dynamic module
The dynamic path follows the neoclassical growth framework (Solow-Swan growth model), implying that the long-run growth rate of the economy is determined by three main factors: capital accumulation, labor supply growth, and increases in productivity. The stock of capital is endogenous, while the latter two are exogenously determined:
Capital accumulation. The capital stock in each period is the sum of depreciated capital from the previous period and new investment.
Labor supply. For each type of labor, the maximum stock of labor available in each period grows exogenously based on population projections by age cohort and cohort-specifi c participation rates.
Productivity. For the fi nal determinant of growth, ENVISAGE assumes exogenous technical progress specifi c to sector and production factors. Thus, in the simulations, the real GDP growth rate diff ers from the growth rate under the baseline scenario due to the policy or shock being simulated. Specifi cally, policies or shocks aff ect real GDP growth through their eff ects on the accumulation of labor and capital. The model can also refl ect productivity improvements due to higher energy effi ciency and changes in the cost of international trade and transport services.
Following the base year (2011), the model is solved year-by-year through 2030. In order to generate a dynamic solution, certain assumptions have been made regarding the evolution of the model’s exogenous variables. In general, GDP and population growth are exogenous and are taken from the scenarios of the shared socio-economic pathways (SSP) developed by the Integrated Assessment Modeling Consortium (IAMC) community. The IAMC scenario considered is the SSP2, “Middle of the Road”. Diff erent assumptions are made for Russia. BaU (business-as-usual, or reference) growth has been calibrated using the near and medium-term assumptions of the World Bank. For years beyond the projection period (2020-2030), GDP is assumed to increase by 2 percent a year11. The actual oil price is used through 2016, and the model determines the oil price endogenously from 2017 onwards.
D. But like all methodologies, it comes with caveats…
The methodology assumes no impediments to the movement of labor and capital across sectors. This is a simplifi cation of reality where they may be frictions preventing factors from moving out of sectors in decline and into expanding sectors. While the methodology has limitations, it illustrates Russia’s potential to reap the benefi ts of the changing structure of the Chinese economy and the economic emergence of India. The sensitivity analysis demonstrates the eff ects of relaxing some of these assumptions and hence goes some way to addressing the limitations of the methodology. The presence of rigidities means that the slowdown in China results in a larger reduction in Russia’s GDP as the economy is less able to adjust in response to lower Chinese demand for imports.
11 The SSP2 GDP growth for Russia for that period is around 3 percent.
43Methodology, Caveats, and Extensions
Similarly, there is a smaller increase in Russia’s GDP from India’s expansion in the presence of frictions. Moreover, like most CGE models, this model does not capture the productivity eff ect of policy shocks as technological progress is exogenous. This is another limitation as recent economic literature emphasizes the potential benefi ts of trade diversifi cation on productivity (Box 2). The main strength of the CGE approach remains its ability to capture long-term structural changes across sectors, and help in identifying new trade opportunities in the context of the quest for trade diversifi cation.
Box 2: Trade diversification and productivity: Literature review
Increasing trade diversifi cation can increase productivity and growth. Beginning in the early 2000s, trade theory increased the emphasis on the benefi ts of trade diversifi cation as opposed to the traditional Ricardian view that specialization according to comparative advantage provides the optimal allocation of resources. The theoretical arguments for the benefi ts of diversifi cation are clear. However, empirical results vary due to diff erent eff ects at diff erent levels of development as well as the problems in identifying causality.
Three issues have been highlighted for developing countries. First, countries specializing in a limited number of primary commodities may face high volatility in export prices and may have diffi culties in coping with sharp changes in prices by switching to alternative products. This rigidity can accentuate the impact of adverse shocks on growth. In addition, studies of the “natural-resource curse” hypothesis (Sachs and Warner, 1997) show how concentration in oil and minerals can impair production in potentially higher-productivity sectors over the long term.
Second, exports by developing countries may be associated with technology diff usion (e.g., new production, management or marketing techniques) from advanced countries that improves productivity. Empirical studies have been based on the idea that fi rms learn by exporting (see for example Aw and Hwang, 1995; Tybout and Westbrook, 1995; Haddad, 1993). Other papers using micro-level data have found some evidence of «learning-by-exporting» (Crespi et al. 2008; De Loecker, 2007, Aw et al., 2007; Van Biesebroeck, 2005; Girma et al., 2004). Empirical studies fi nd that trade leads to international diff usion of technology (see for example, Coe et al., 2009; Alcala and Ciccone, 2004). However, Clerides et al. (1998) and Melitz (2003) fi nd that exporting fi rms tend to have higher productivity than non-exporting fi rms because only the most productive fi rms become exporters, and not because exporting raises productivity. Other studies (Demidova et al., 2006; Eaton et al., 2004, 2007; Helpman et al., 2004; Bernard and Jensen, 1999) confi rmed this ‘selection eff ect’ at the fi rm level.
Some authors have focused on the relationship between export diversifi cation and productivity. Hausmann et al. (2007) fi nd that countries that export goods associated with higher levels of productivity grow more rapidly. Hesse (2008) fi nds a positive eff ect of export diversifi cation on per capita income growth for developing countries over 1961-2000 using dynamic panel growth models based on the GMM estimator. Some cross-country empirical studies fi nd a U-shaped relationship between export diversifi cation and GDP per capita (exporting is associated with declines in productivity at low income levels, but eventually with higher productivity as incomes rise—see Cadot et al., 2011; and Klinger and Lederman, 2006). Xuefeng and Yasar (2016) explain a U-shaped relationship in China between fi rms’ export market diversifi cation and their productivity by the evolution of costs: costs are initially high (and thus productivity low) due to a lack of knowledge and experience, but they eventually decline as export market expansion generates learning as well as economies of scope and scale.
Finally, increased import competition may force improvements in productivity by domestic fi rms that produce close substitutes, and it can increase overall productivity as less-productive fi rms are forced to exit (Carrère et al. 2011). Empirical studies fi nd that trade liberalization improved productivity in import competing sectors in Chile (Pavcnik, 2002) and increased productivity growth more in less protected sectors in Cote d’Ivoire. Other studies on developing countries (Fernandes, 2007, for Colombia; Krishna and Mitra, 1998, for India; Tybout and Westbrook, 1995, for Mexico) fi nd a positive eff ect of increased import competition on domestic productivity. Ethier (1982), Markusen (1989), and Grossman and Helpman (1991) provide evidence that productivity gains can arise from increasing varieties of imported inputs, leading to lower input prices, access to higher quality inputs, and access to new technologies incorporated in the imported varieties.
44 A Rebalancing China and Resurging India: How will the pendulum swing for Russia?
E. The methodology developed and data collected for this report could be extended…
While the focus of this particular report is on China, India, and Russia, the model is replicable and scalable, and it can be used to analyze other issues (currently beyond the scope of this report) as outlined below: (i) The model could be extended to other groups of countries; for example, the Eurasian trading bloc, the EU, or
the BRICS.(ii) Other scenarios could be addressed, such as a global rise in protectionism, shifts in China and India to clean
energy to reduce climate change, stronger productivity growth in Russia, or sharp changes in demand in one or more of Russia’s trading partners.
(iii) The CGE approach developed can be combined with spatial analysis to identify Russian regions that hold the most potential for mutually benefi cial cross-border linkages. While certain Russia–China border regions are obvious candidates, this work could usefully shed light on non-border Russian regions that can advance trade in services (which need not necessarily be constrained by geography or topography).
5. Simulating the Future: Presenting Four Key Scenarios
Scenarios simulating the impact on Russia of changes in economic activity in China and India include a slowdown in China, rebalancing in China, more rapid expansion in India, and a combination of all three scenarios. These four scenarios are based on realistic, credible assumptions for the evolution of these two economies over the next 15 years.
The goal is to evaluate the potential impact of changes in the level and pattern of growth in China and
India on production and trade in the Russian economy. In addition to a baseline (or reference scenario), we consider four scenarios: i) a growth slowdown in China; ii) economic rebalancing in China; iii) growth expansion in India; and iv) a combination of the Chinese slowdown, rebalancing, and India’s expansion. These scenarios could also aff ect the Russian economy through fi nancial channels, for example trade credit or foreign investment, or through remittances. However, we are only concerned with the real economy, while fi nancial fl ows are considered exogenous.
Scenario 1. China’s slowdown: Chinese growth slows from the current 6.5 percent to 4.6 percent in 2030 while maintaining the historical composition of growth (a similar scenario was considered in World Bank, 2015).
Scenario 2. China’s rebalancing: GDP growth remains at the historical trend, but the share of investment in GDP gradually falls from 46.7 percent in 2015 to 35.5 percent in 2030 while the diff erence accrues to household consumption. This implicitly assumes that the decline in investment is compensated by increases in labor productivity to achieve the same level of growth.
Scenario 3. India’s expansion: India’s growth improves from around 6 percent per year over 2015-30 in the reference scenario to around 8 percent.
Scenario 4. India’s growth improvement and China’s slowdown and rebalancing: This combines the assumptions in the above three scenarios.
Although results are available for a wide range of indicators for the eight groups of countries and regions considered in this model, our discussion will focus mainly on Russia and the eff ects on trade, sectoral output, growth, and welfare.
These scenarios are compared to a baseline (or reference scenario) based on past trends. The reference scenario assumes that growth in China and India equals the trend before 2013, and the composition of GDP remains unchanged. Specifi cally, the reference scenario assumes that: i) China grows at around 7 percent per year from 2015-30; ii) Indian growth averages around 6 percent between 2015-30, converging to 5 percent in 2030; and iii) China’s economic structure remains the same as it has in the last fi ve years (investment at 45 percent of GDP and fi nal consumption at 31 percent of GDP). The aim is not to present the most likely forecast, but rather to construct a counterfactual scenario not aff ected by the policy assumptions underlying the other scenarios in order to serve as a standard of comparison.
In the reference scenario, Russia’s share of world trade stagnates but China and India’s increase. Russia’s exports remain at around 3 percent of global exports from 2015 to 2030 (Figure 25). By contrast, China’s share of world exports rises from around 10 percent in 2011 to nearly 18 percent in 2030 due to the assumed rapid expansion of GDP. Similarly, India’s share of world exports rises from around 2 percent in 2015 to nearly 5 percent in 2030. The global export share of Russia’s top trade partner, the EU and the European Free Trade Association (EFTA) region, would fall from around 35 percent in 2015 to 25 percent in 2030.
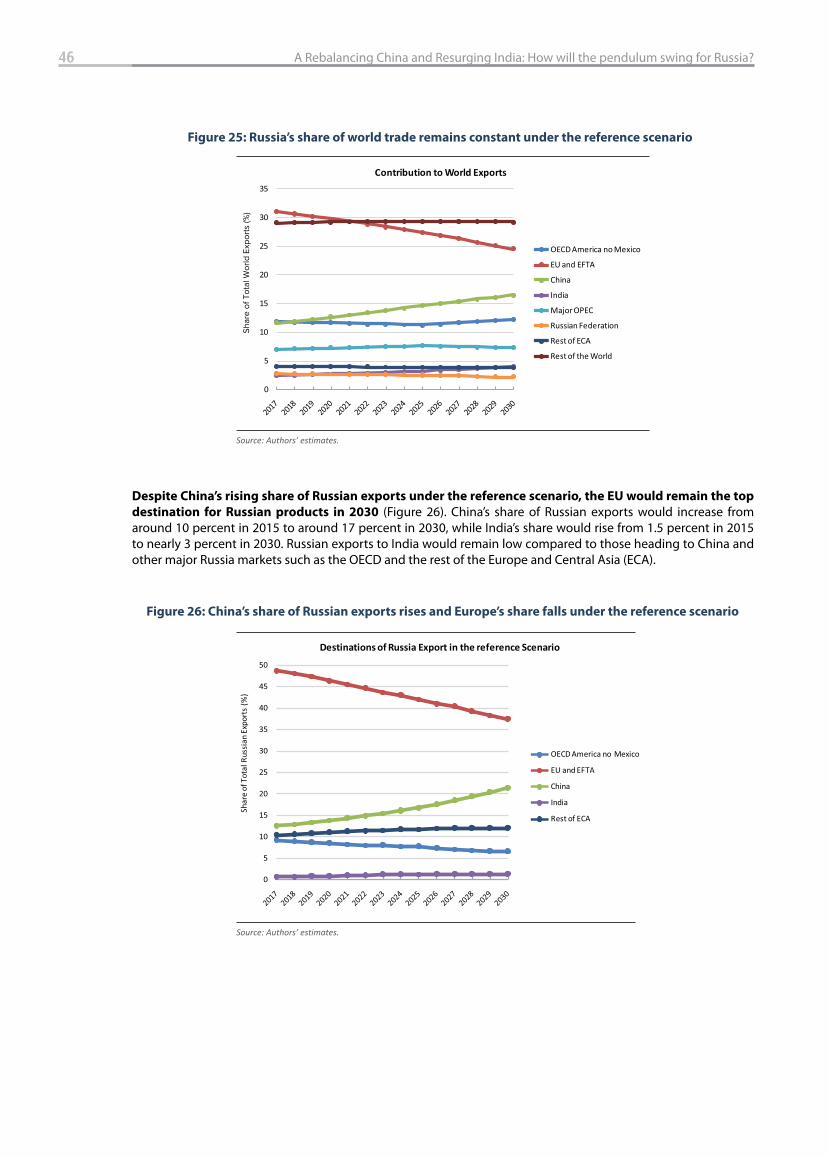
46 A Rebalancing China and Resurging India: How will the pendulum swing for Russia?
Despite China’s rising share of Russian exports under the reference scenario, the EU would remain the top
destination for Russian products in 2030 (Figure 26). China’s share of Russian exports would increase from around 10 percent in 2015 to around 17 percent in 2030, while India’s share would rise from 1.5 percent in 2015 to nearly 3 percent in 2030. Russian exports to India would remain low compared to those heading to China and other major Russia markets such as the OECD and the rest of the Europe and Central Asia (ECA).
Figure 25: Russia’s share of world trade remains constant under the reference scenario
Source: Authors’ estimates.
0
5
10
15
20
25
30
35
Shar
e of
tota
l wor
ld e
xpor
ts(%
)
Contribution to World Exports
OECD America no Mexico
EU and EFTA
China
India
Major OPEC
Russian Federation
Rest of ECA
Rest of the World
Figure 26: China’s share of Russian exports rises and Europe’s share falls under the reference scenario
Source: Authors’ estimates.
0
5
10
15
20
25
30
35
40
45
50
Shar
e of
Tot
al R
ussi
an E
xpor
ts (%
)
Destinations of Russia Export in the reference Scenario
OECD America no Mexico
EU and EFTA
China
India
Rest of ECA
Shar
e of
Tot
al W
orld
Exp
orts
(%)
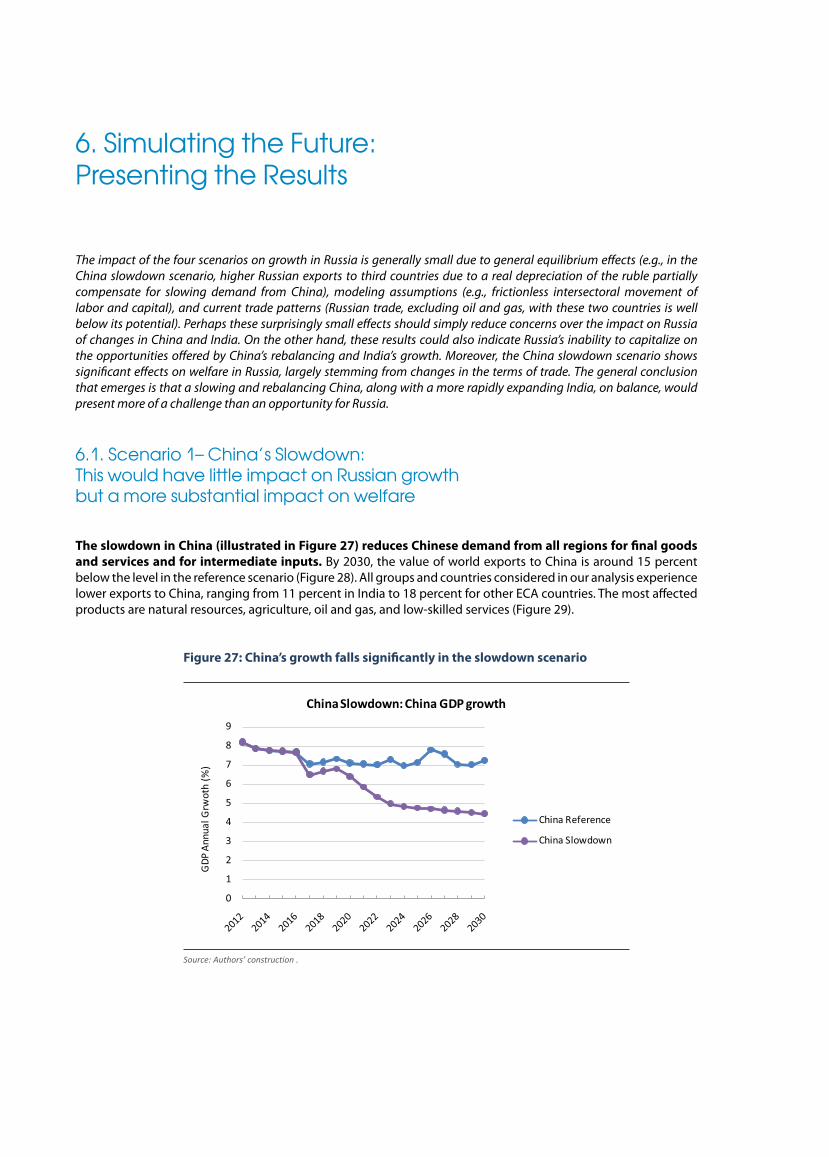
6. Simulating the Future: Presenting the Results
The impact of the four scenarios on growth in Russia is generally small due to general equilibrium eff ects (e.g., in the China slowdown scenario, higher Russian exports to third countries due to a real depreciation of the ruble partially compensate for slowing demand from China), modeling assumptions (e.g., frictionless intersectoral movement of labor and capital), and current trade patterns (Russian trade, excluding oil and gas, with these two countries is well below its potential). Perhaps these surprisingly small eff ects should simply reduce concerns over the impact on Russia of changes in China and India. On the other hand, these results could also indicate Russia’s inability to capitalize on the opportunities off ered by China’s rebalancing and India’s growth. Moreover, the China slowdown scenario shows signifi cant eff ects on welfare in Russia, largely stemming from changes in the terms of trade. The general conclusion that emerges is that a slowing and rebalancing China, along with a more rapidly expanding India, on balance, would present more of a challenge than an opportunity for Russia.
6.1. Scenario 1– China’s Slowdown: This would have little impact on Russian growth but a more substantial impact on welfare
The slowdown in China (illustrated in Figure 27) reduces Chinese demand from all regions for fi nal goods
and services and for intermediate inputs. By 2030, the value of world exports to China is around 15 percent below the level in the reference scenario (Figure 28). All groups and countries considered in our analysis experience lower exports to China, ranging from 11 percent in India to 18 percent for other ECA countries. The most aff ected products are natural resources, agriculture, oil and gas, and low-skilled services (Figure 29).
Figure 27: China’s growth falls signifi cantly in the slowdown scenario
Source: Authors’ construction .
0
1
2
3
4
5
6
7
8
9
GDP
Ann
ual G
rwot
h (%
)
China Slowdown: China GDP growth
China Reference
China Slowdown
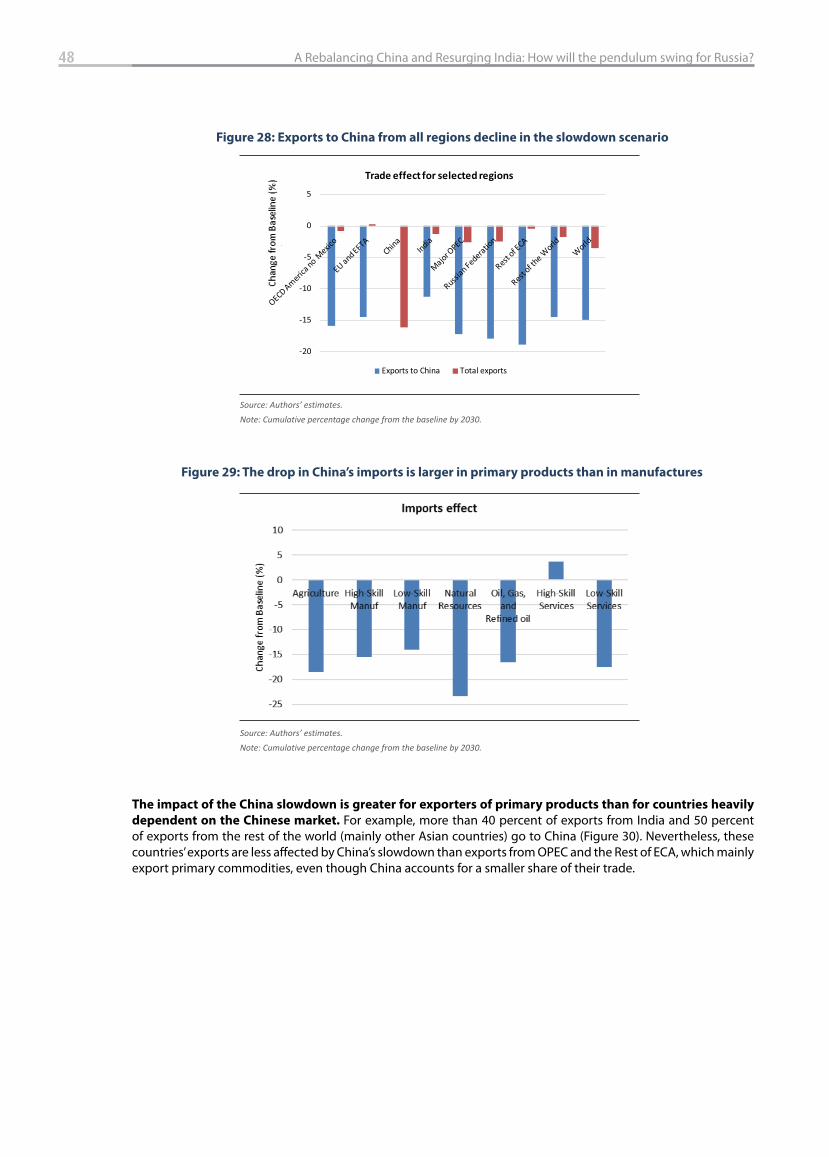
48 A Rebalancing China and Resurging India: How will the pendulum swing for Russia?
The impact of the China slowdown is greater for exporters of primary products than for countries heavily
dependent on the Chinese market. For example, more than 40 percent of exports from India and 50 percent of exports from the rest of the world (mainly other Asian countries) go to China (Figure 30). Nevertheless, these countries’ exports are less aff ected by China’s slowdown than exports from OPEC and the Rest of ECA, which mainly export primary commodities, even though China accounts for a smaller share of their trade.
Figure 28: Exports to China from all regions decline in the slowdown scenario
Source: Authors’ estimates.Note: Cumulative percentage change from the baseline by 2030.
-20
-15
-10
-5
0
5
Chan
ge fr
om B
aelin
e(%
)
Trade effect for selected regions
Exports to China Total exports
Figure 29: The drop in China’s imports is larger in primary products than in manufactures
Source: Authors’ estimates.Note: Cumulative percentage change from the baseline by 2030.
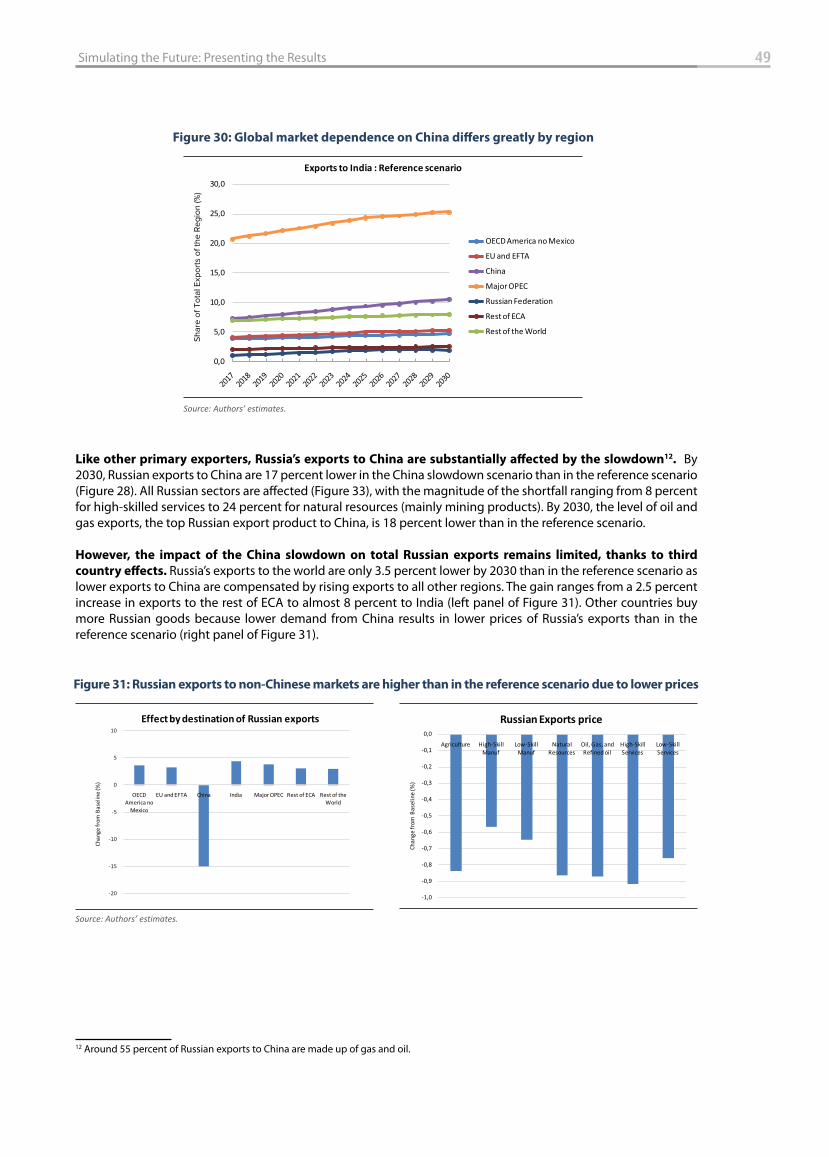
49 Simulating the Future: Presenting the Results
Like other primary exporters, Russia’s exports to China are substantially aff ected by the slowdown12. By 2030, Russian exports to China are 17 percent lower in the China slowdown scenario than in the reference scenario (Figure 28). All Russian sectors are aff ected (Figure 33), with the magnitude of the shortfall ranging from 8 percent for high-skilled services to 24 percent for natural resources (mainly mining products). By 2030, the level of oil and gas exports, the top Russian export product to China, is 18 percent lower than in the reference scenario.
However, the impact of the China slowdown on total Russian exports remains limited, thanks to third
country eff ects. Russia’s exports to the world are only 3.5 percent lower by 2030 than in the reference scenario as lower exports to China are compensated by rising exports to all other regions. The gain ranges from a 2.5 percent increase in exports to the rest of ECA to almost 8 percent to India (left panel of Figure 31). Other countries buy more Russian goods because lower demand from China results in lower prices of Russia’s exports than in the reference scenario (right panel of Figure 31).
12 Around 55 percent of Russian exports to China are made up of gas and oil.
Figure 31: Russian exports to non-Chinese markets are higher than in the reference scenario due to lower prices
Source: Authors’ estimates.
-20
-15
-10
-5
0
5
10
OECD America no
Mexico
EU and EFTA China India Major OPEC Rest of ECA Rest of the World
Chan
ge fr
om B
asel
ine
(%)
Effect by destination of Russian exports
-1,0
-0,9
-0,8
-0,7
-0,6
-0,5
-0,4
-0,3
-0,2
-0,1
0,0
Agriculture High-Skill Manuf
Low-Skill Manuf
Natural Resources
Oil, Gas, and Refined oil
High-Skill Services
Low-Skill Services
Chan
ge fr
om B
asel
ine
(%)
Russian Exports price
Figure 30: Global market dependence on China diff ers greatly by region
Source: Authors’ estimates.
0,0
5,0
10,0
15,0
20,0
25,0
30,0
Shar
e of
tota
l exp
orts
of t
eh re
gion
(%)
Exports to India : Reference scenario
OECD America no Mexico
EU and EFTA
China
Major OPEC
Russian Federation
Rest of ECA
Rest of the World
Shar
e of
Tot
al E
xpor
ts o
f the
Reg
ion
(%)
Russian Exports priceEffect by destination of Russian exports
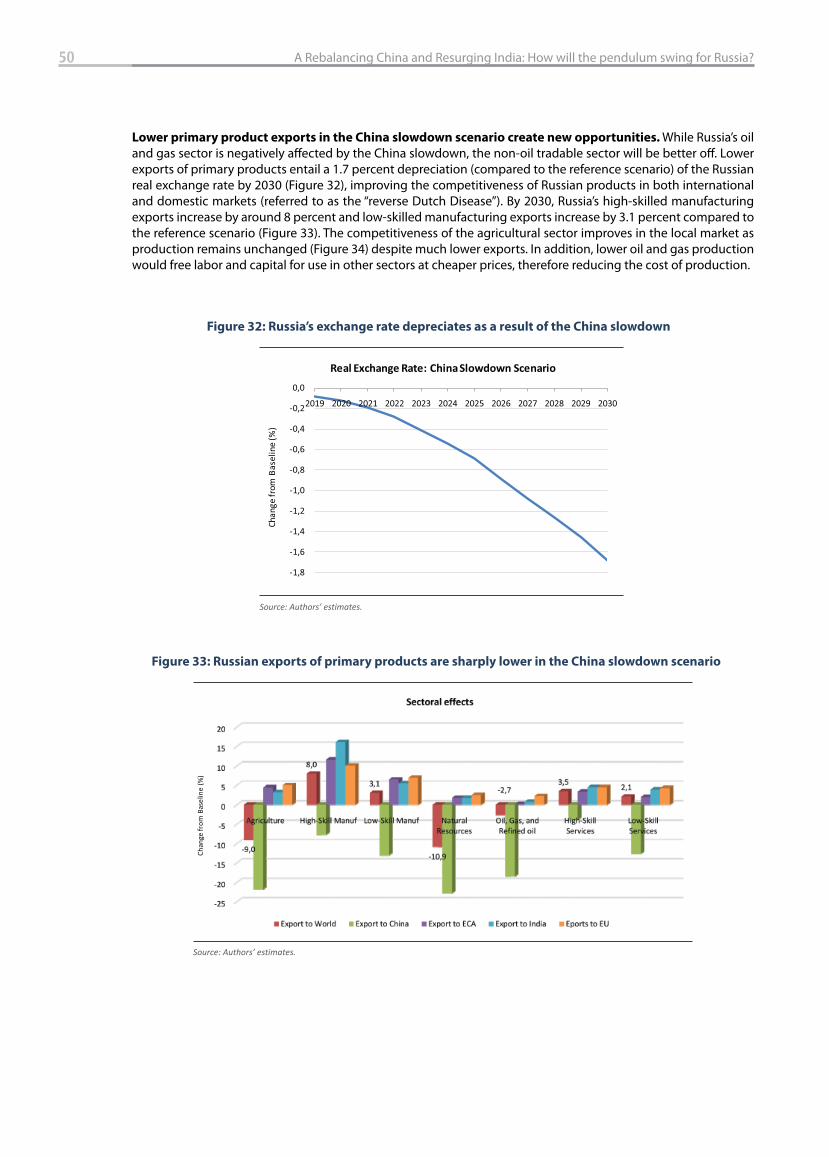
50 A Rebalancing China and Resurging India: How will the pendulum swing for Russia?
Lower primary product exports in the China slowdown scenario create new opportunities. While Russia’s oil and gas sector is negatively aff ected by the China slowdown, the non-oil tradable sector will be better off . Lower exports of primary products entail a 1.7 percent depreciation (compared to the reference scenario) of the Russian real exchange rate by 2030 (Figure 32), improving the competitiveness of Russian products in both international and domestic markets (referred to as the “reverse Dutch Disease”). By 2030, Russia’s high-skilled manufacturing exports increase by around 8 percent and low-skilled manufacturing exports increase by 3.1 percent compared to the reference scenario (Figure 33). The competitiveness of the agricultural sector improves in the local market as production remains unchanged (Figure 34) despite much lower exports. In addition, lower oil and gas production would free labor and capital for use in other sectors at cheaper prices, therefore reducing the cost of production.
Figure 32: Russia’s exchange rate depreciates as a result of the China slowdown
Source: Authors’ estimates.
-1,8
-1,6
-1,4
-1,2
-1,0
-0,8
-0,6
-0,4
-0,2
0,0
2019 2020 2021 2022 2023 2024 2025 2026 2027 2028 2029 2030
Chan
ge fr
om B
asel
ine
(%)
Real Exchange Rate: China Slowdown Scenario
Figure 33: Russian exports of primary products are sharply lower in the China slowdown scenario
Source: Authors’ estimates.
Chan
ge fr
om B
asel
ine
(%)
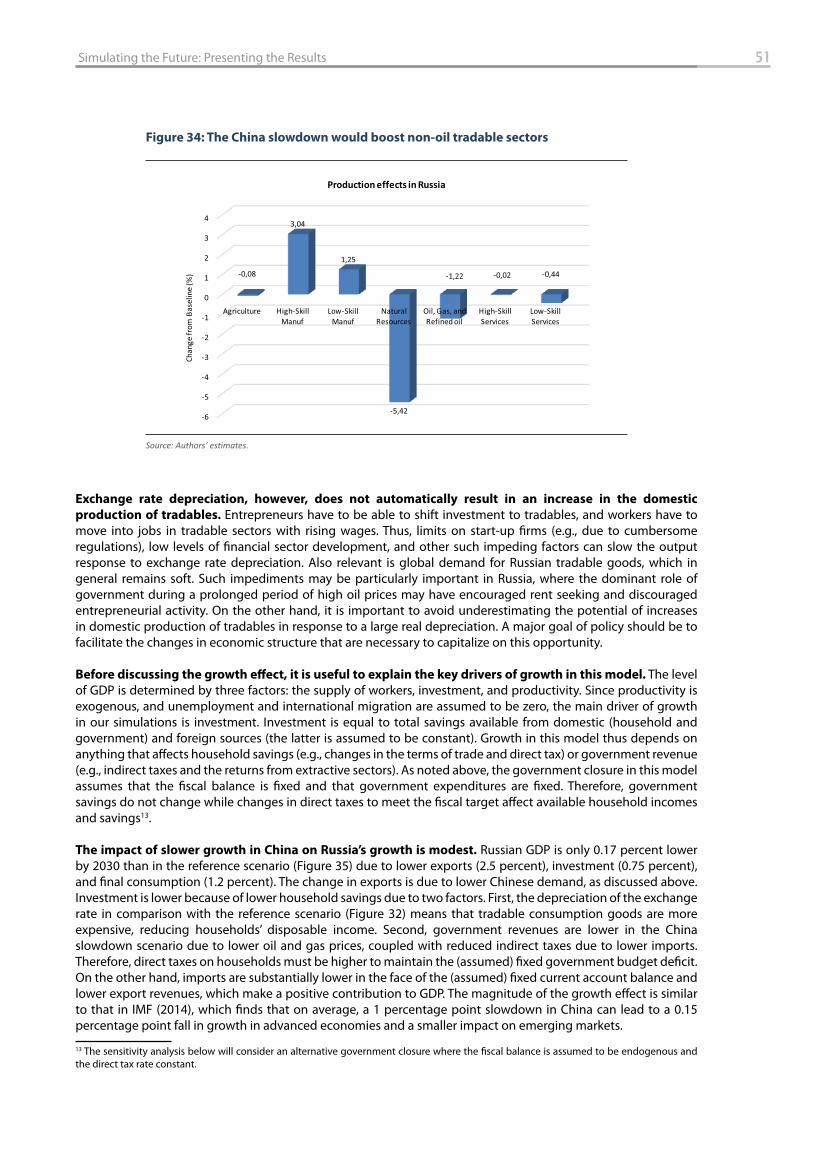
51 Simulating the Future: Presenting the Results
Exchange rate depreciation, however, does not automatically result in an increase in the domestic
production of tradables. Entrepreneurs have to be able to shift investment to tradables, and workers have to move into jobs in tradable sectors with rising wages. Thus, limits on start-up fi rms (e.g., due to cumbersome regulations), low levels of fi nancial sector development, and other such impeding factors can slow the output response to exchange rate depreciation. Also relevant is global demand for Russian tradable goods, which in general remains soft. Such impediments may be particularly important in Russia, where the dominant role of government during a prolonged period of high oil prices may have encouraged rent seeking and discouraged entrepreneurial activity. On the other hand, it is important to avoid underestimating the potential of increases in domestic production of tradables in response to a large real depreciation. A major goal of policy should be to facilitate the changes in economic structure that are necessary to capitalize on this opportunity.
Before discussing the growth eff ect, it is useful to explain the key drivers of growth in this model. The level of GDP is determined by three factors: the supply of workers, investment, and productivity. Since productivity is exogenous, and unemployment and international migration are assumed to be zero, the main driver of growth in our simulations is investment. Investment is equal to total savings available from domestic (household and government) and foreign sources (the latter is assumed to be constant). Growth in this model thus depends on anything that aff ects household savings (e.g., changes in the terms of trade and direct tax) or government revenue (e.g., indirect taxes and the returns from extractive sectors). As noted above, the government closure in this model assumes that the fi scal balance is fi xed and that government expenditures are fi xed. Therefore, government savings do not change while changes in direct taxes to meet the fi scal target aff ect available household incomes and savings13.
The impact of slower growth in China on Russia’s growth is modest. Russian GDP is only 0.17 percent lower by 2030 than in the reference scenario (Figure 35) due to lower exports (2.5 percent), investment (0.75 percent), and fi nal consumption (1.2 percent). The change in exports is due to lower Chinese demand, as discussed above. Investment is lower because of lower household savings due to two factors. First, the depreciation of the exchange rate in comparison with the reference scenario (Figure 32) means that tradable consumption goods are more expensive, reducing households’ disposable income. Second, government revenues are lower in the China slowdown scenario due to lower oil and gas prices, coupled with reduced indirect taxes due to lower imports. Therefore, direct taxes on households must be higher to maintain the (assumed) fi xed government budget defi cit. On the other hand, imports are substantially lower in the face of the (assumed) fi xed current account balance and lower export revenues, which make a positive contribution to GDP. The magnitude of the growth eff ect is similar to that in IMF (2014), which fi nds that on average, a 1 percentage point slowdown in China can lead to a 0.15 percentage point fall in growth in advanced economies and a smaller impact on emerging markets.
13 The sensitivity analysis below will consider an alternative government closure where the fi scal balance is assumed to be endogenous and the direct tax rate constant.
Figure 34: The China slowdown would boost non-oil tradable sectors
Source: Authors’ estimates.
-6
-5
-4
-3
-2
-1
0
1
2
3
4
Agriculture High-Skill Manuf
Low-Skill Manuf
Natural Resources
Oil, Gas, and Refined oil
High-Skill Services
Low-Skill Services
-0,08
3,04
1,25
-5,42
-1,22 -0,02 -0,44
Chan
ge fr
om B
asel
ine
(%)
Production effects in Russia
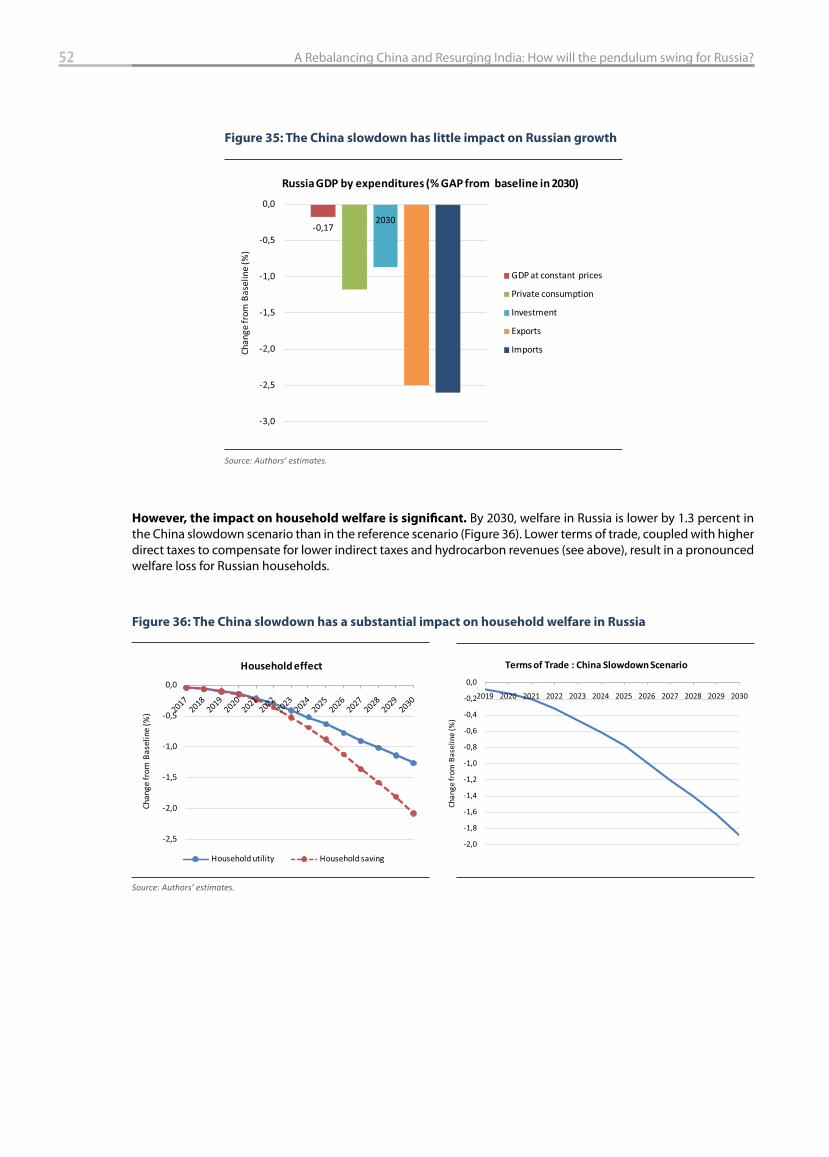
52 A Rebalancing China and Resurging India: How will the pendulum swing for Russia?
However, the impact on household welfare is signifi cant. By 2030, welfare in Russia is lower by 1.3 percent in the China slowdown scenario than in the reference scenario (Figure 36). Lower terms of trade, coupled with higher direct taxes to compensate for lower indirect taxes and hydrocarbon revenues (see above), result in a pronounced welfare loss for Russian households.
Figure 35: The China slowdown has little impact on Russian growth
Source: Authors’ estimates.
-0,17
-3,0
-2,5
-2,0
-1,5
-1,0
-0,5
0,0
2030
Chan
ge fr
om B
asel
ine
(%)
Russia GDP by expenditures (% GAP from baseline in 2030)
GDP at constant prices
Private consumption
Investment
Exports
Imports
Figure 36: The China slowdown has a substantial impact on household welfare in Russia
Source: Authors’ estimates.
-2,5
-2,0
-1,5
-1,0
-0,5
0,0
Chan
ge fr
om B
asel
ine
(%)
Household effect
Household utility Household saving
-2,0
-1,8
-1,6
-1,4
-1,2
-1,0
-0,8
-0,6
-0,4
-0,2
0,0
2019 2020 2021 2022 2023 2024 2025 2026 2027 2028 2029 2030
Chan
ge fr
om B
asel
ine
(%)
Terms of Trade : China Slowdown Scenario
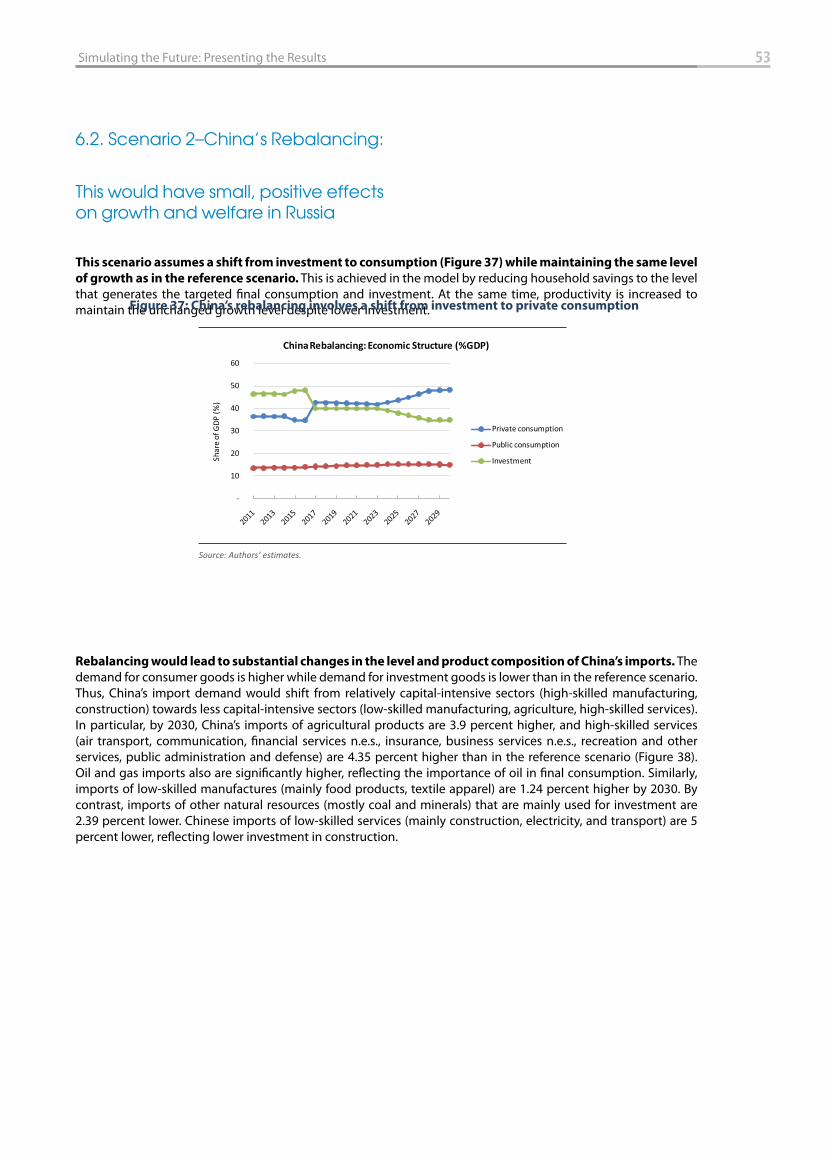
53 Simulating the Future: Presenting the Results
6.2. Scenario 2–China’s Rebalancing:
This would have small, positive effects on growth and welfare in Russia
This scenario assumes a shift from investment to consumption (Figure 37) while maintaining the same level
of growth as in the reference scenario. This is achieved in the model by reducing household savings to the level that generates the targeted fi nal consumption and investment. At the same time, productivity is increased to maintain the unchanged growth level despite lower investment.
Rebalancing would lead to substantial changes in the level and product composition of China’s imports. The demand for consumer goods is higher while demand for investment goods is lower than in the reference scenario. Thus, China’s import demand would shift from relatively capital-intensive sectors (high-skilled manufacturing, construction) towards less capital-intensive sectors (low-skilled manufacturing, agriculture, high-skilled services). In particular, by 2030, China’s imports of agricultural products are 3.9 percent higher, and high-skilled services (air transport, communication, fi nancial services n.e.s., insurance, business services n.e.s., recreation and other services, public administration and defense) are 4.35 percent higher than in the reference scenario (Figure 38). Oil and gas imports also are signifi cantly higher, refl ecting the importance of oil in fi nal consumption. Similarly, imports of low-skilled manufactures (mainly food products, textile apparel) are 1.24 percent higher by 2030. By contrast, imports of other natural resources (mostly coal and minerals) that are mainly used for investment are 2.39 percent lower. Chinese imports of low-skilled services (mainly construction, electricity, and transport) are 5 percent lower, refl ecting lower investment in construction.
Figure 37: China’s rebalancing involves a shift from investment to private consumption
Source: Authors’ estimates.
-
10
20
30
40
50
60
Shar
e of
GDP
(%)
China Rebalancing: Economic Structure (%GDP)
Private consumption
Public consumption
Investment
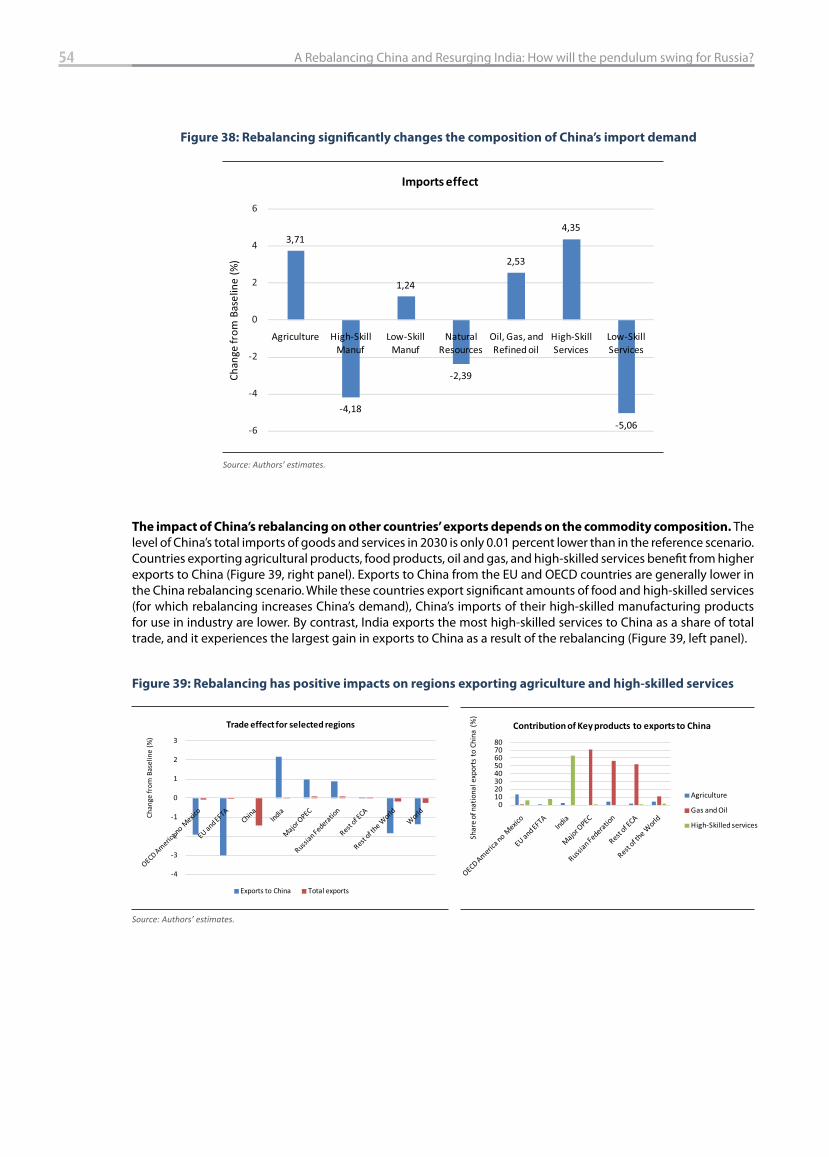
54 A Rebalancing China and Resurging India: How will the pendulum swing for Russia?
The impact of China’s rebalancing on other countries’ exports depends on the commodity composition. The level of China’s total imports of goods and services in 2030 is only 0.01 percent lower than in the reference scenario. Countries exporting agricultural products, food products, oil and gas, and high-skilled services benefi t from higher exports to China (Figure 39, right panel). Exports to China from the EU and OECD countries are generally lower in the China rebalancing scenario. While these countries export signifi cant amounts of food and high-skilled services (for which rebalancing increases China’s demand), China’s imports of their high-skilled manufacturing products for use in industry are lower. By contrast, India exports the most high-skilled services to China as a share of total trade, and it experiences the largest gain in exports to China as a result of the rebalancing (Figure 39, left panel).
Figure 38: Rebalancing signifi cantly changes the composition of China’s import demand
Source: Authors’ estimates.
Figure 39: Rebalancing has positive impacts on regions exporting agriculture and high-skilled services
-4
-3
-2
-1
0
1
2
3
Chan
ge fr
om B
aelin
e (%
)
Trade effect for selected regions
Exports to China Total exports
Source: Authors’ estimates.
01020304050607080
Shar
e of
nat
iona
l exp
orts
to C
hina
(%
)
Contribution of Key products to exports to China
Agriculture
Gas and Oil
High-Skilled services
Chan
ge fr
om B
asel
ine
(%)
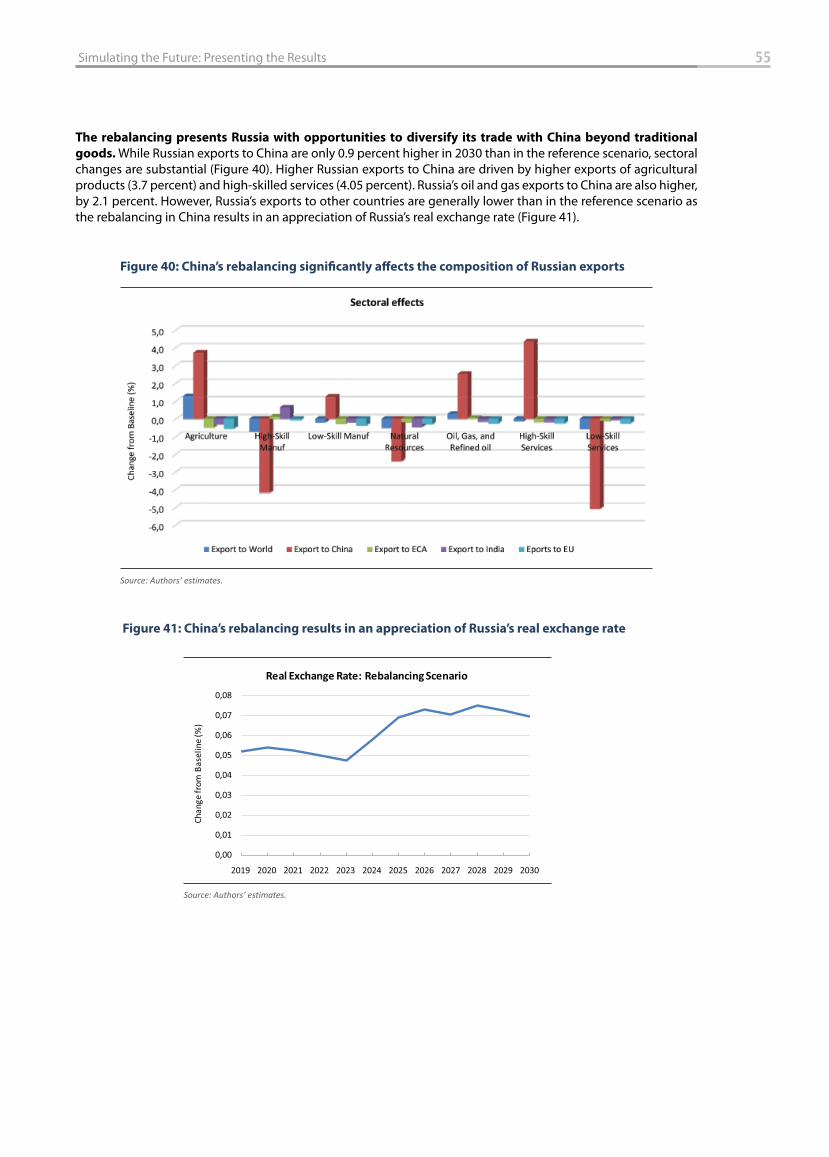
55 Simulating the Future: Presenting the Results
The rebalancing presents Russia with opportunities to diversify its trade with China beyond traditional
goods. While Russian exports to China are only 0.9 percent higher in 2030 than in the reference scenario, sectoral changes are substantial (Figure 40). Higher Russian exports to China are driven by higher exports of agricultural products (3.7 percent) and high-skilled services (4.05 percent). Russia’s oil and gas exports to China are also higher, by 2.1 percent. However, Russia’s exports to other countries are generally lower than in the reference scenario as the rebalancing in China results in an appreciation of Russia’s real exchange rate (Figure 41).
Figure 40: China’s rebalancing signifi cantly aff ects the composition of Russian exports
Source: Authors’ estimates.
Figure 41: China’s rebalancing results in an appreciation of Russia’s real exchange rate
Source: Authors’ estimates.
0,00
0,01
0,02
0,03
0,04
0,05
0,06
0,07
0,08
2019 2020 2021 2022 2023 2024 2025 2026 2027 2028 2029 2030
Chan
ge fr
om B
asel
ine
(%)
Real Exchange Rate: Rebalancing Scenario
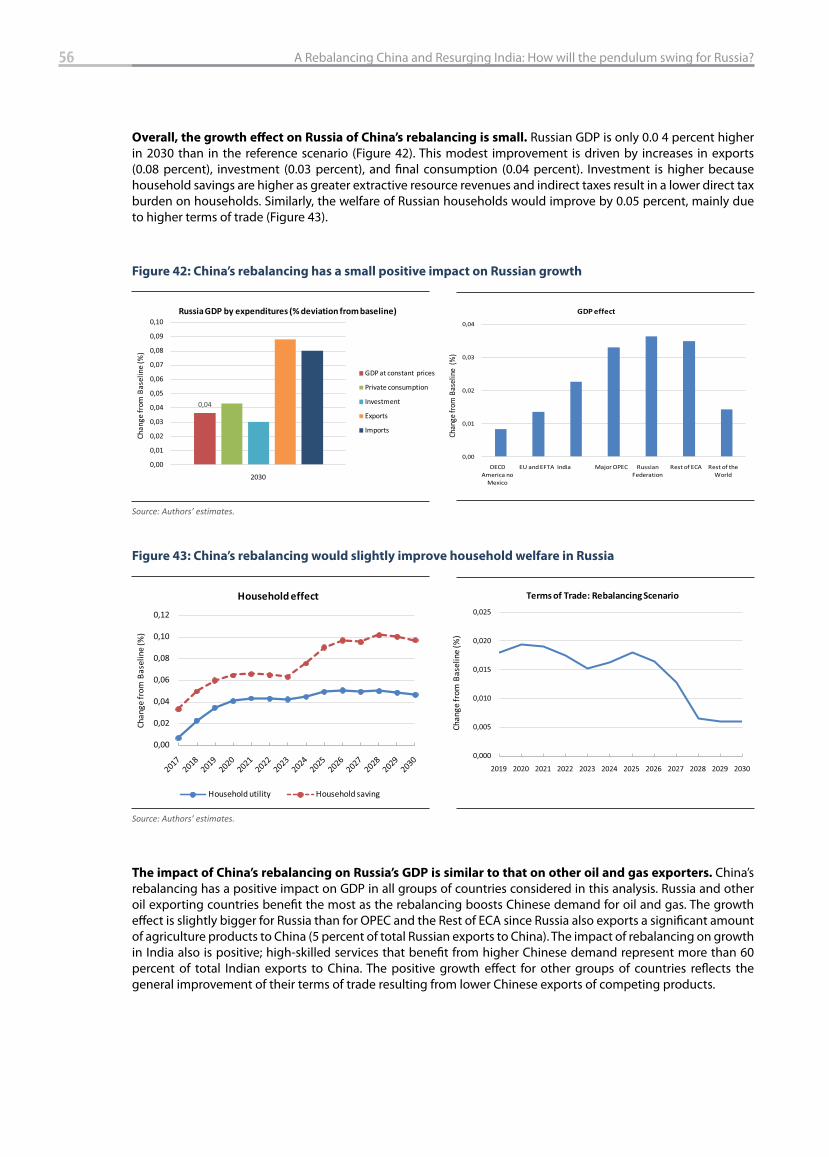
56 A Rebalancing China and Resurging India: How will the pendulum swing for Russia?
Overall, the growth eff ect on Russia of China’s rebalancing is small. Russian GDP is only 0.0 4 percent higher in 2030 than in the reference scenario (Figure 42). This modest improvement is driven by increases in exports (0.08 percent), investment (0.03 percent), and fi nal consumption (0.04 percent). Investment is higher because household savings are higher as greater extractive resource revenues and indirect taxes result in a lower direct tax burden on households. Similarly, the welfare of Russian households would improve by 0.05 percent, mainly due to higher terms of trade (Figure 43).
Figure 42: China’s rebalancing has a small positive impact on Russian growth
Source: Authors’ estimates.
0,04
0,00
0,01
0,02
0,03
0,04
0,05
0,06
0,07
0,08
0,09
0,10
2030
Сhan
ge fr
om B
asel
ine
(%)
Russia GDP by expenditures (% deviation from baseline)
GDP at constant prices
Private consumption
Investment
Exports
Imports
0,00
0,01
0,02
0,03
0,04
OECD America no
Mexico
EU and EFTA India Major OPEC Russian Federation
Rest of ECA Rest of the World
Chan
ge fr
om B
asel
ine
(%)
GDP effect
Figure 43: China’s rebalancing would slightly improve household welfare in Russia
Source: Authors’ estimates.
0,00
0,02
0,04
0,06
0,08
0,10
0,12
Chan
ge fr
om B
asel
ine
(%)
Household effect
Household utility Household saving
The impact of China’s rebalancing on Russia’s GDP is similar to that on other oil and gas exporters. China’s rebalancing has a positive impact on GDP in all groups of countries considered in this analysis. Russia and other oil exporting countries benefi t the most as the rebalancing boosts Chinese demand for oil and gas. The growth eff ect is slightly bigger for Russia than for OPEC and the Rest of ECA since Russia also exports a signifi cant amount of agriculture products to China (5 percent of total Russian exports to China). The impact of rebalancing on growth in India also is positive; high-skilled services that benefi t from higher Chinese demand represent more than 60 percent of total Indian exports to China. The positive growth eff ect for other groups of countries refl ects the general improvement of their terms of trade resulting from lower Chinese exports of competing products.
0,000
0,005
0,010
0,015
0,020
0,025
2019 2020 2021 2022 2023 2024 2025 2026 2027 2028 2029 2030
Chan
ge fr
om B
asel
ine
(%)
Terms of Trade: Rebalancing Scenario
Chan
ge fr
om B
asel
ine
(%)
Chan
ge fr
om B
asel
ine
(%)
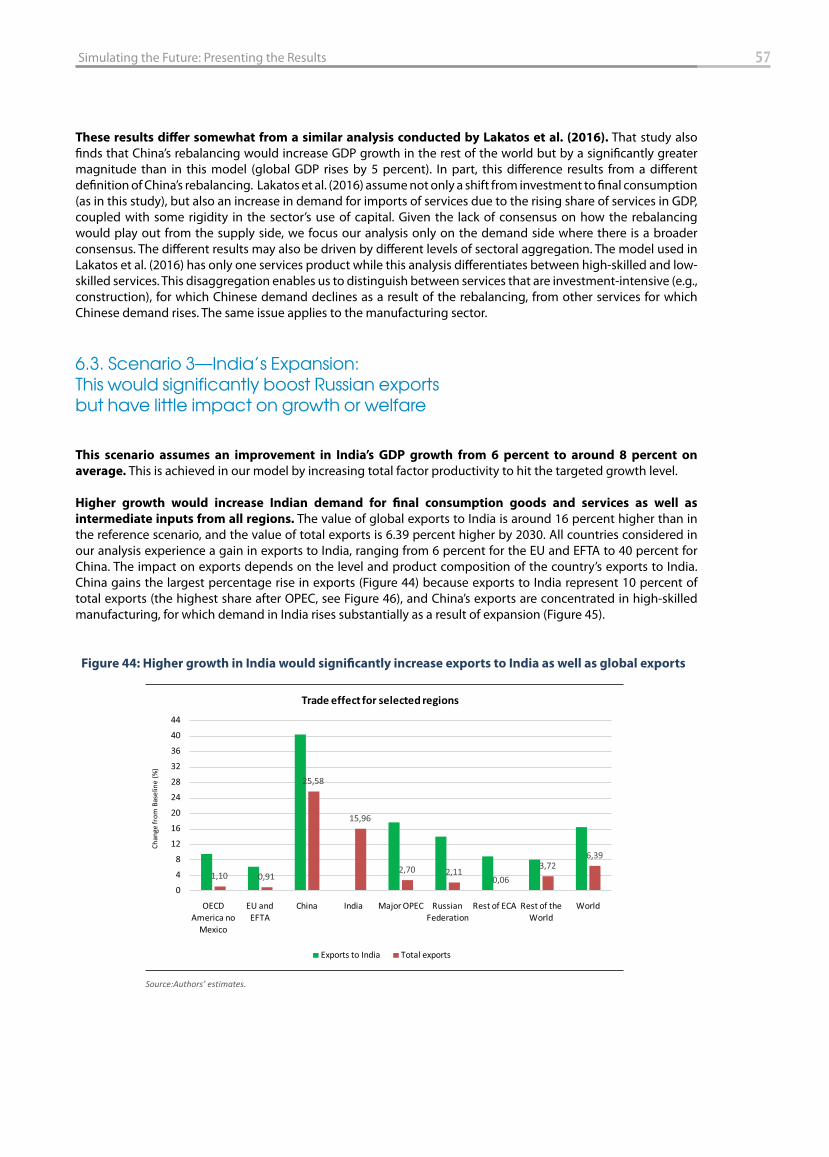
57 Simulating the Future: Presenting the Results
These results diff er somewhat from a similar analysis conducted by Lakatos et al. (2016). That study also fi nds that China’s rebalancing would increase GDP growth in the rest of the world but by a signifi cantly greater magnitude than in this model (global GDP rises by 5 percent). In part, this diff erence results from a diff erent defi nition of China’s rebalancing. Lakatos et al. (2016) assume not only a shift from investment to fi nal consumption (as in this study), but also an increase in demand for imports of services due to the rising share of services in GDP, coupled with some rigidity in the sector’s use of capital. Given the lack of consensus on how the rebalancing would play out from the supply side, we focus our analysis only on the demand side where there is a broader consensus. The diff erent results may also be driven by diff erent levels of sectoral aggregation. The model used in Lakatos et al. (2016) has only one services product while this analysis diff erentiates between high-skilled and low-skilled services. This disaggregation enables us to distinguish between services that are investment-intensive (e.g., construction), for which Chinese demand declines as a result of the rebalancing, from other services for which Chinese demand rises. The same issue applies to the manufacturing sector.
6.3. Scenario 3—India’s Expansion: This would significantly boost Russian exports but have little impact on growth or welfare
This scenario assumes an improvement in India’s GDP growth from 6 percent to around 8 percent on
average. This is achieved in our model by increasing total factor productivity to hit the targeted growth level.
Higher growth would increase Indian demand for fi nal consumption goods and services as well as
intermediate inputs from all regions. The value of global exports to India is around 16 percent higher than in the reference scenario, and the value of total exports is 6.39 percent higher by 2030. All countries considered in our analysis experience a gain in exports to India, ranging from 6 percent for the EU and EFTA to 40 percent for China. The impact on exports depends on the level and product composition of the country’s exports to India. China gains the largest percentage rise in exports (Figure 44) because exports to India represent 10 percent of total exports (the highest share after OPEC, see Figure 46), and China’s exports are concentrated in high-skilled manufacturing, for which demand in India rises substantially as a result of expansion (Figure 45).
Figure 44: Higher growth in India would signifi cantly increase exports to India as well as global exports
Source:Authors’ estimates.
1,10 0,91
25,58
15,96
2,70 2,110,06
3,726,39
0
4
8
12
16
20
24
28
32
36
40
44
OECD America no
Mexico
EU and EFTA
China India Major OPEC Russian Federation
Rest of ECA Rest of the World
World
Chan
ge fr
om B
aelin
e (%
)
Trade effect for selected regions
Exports to India Total exports
Chan
ge fr
om B
asel
ine
(%)
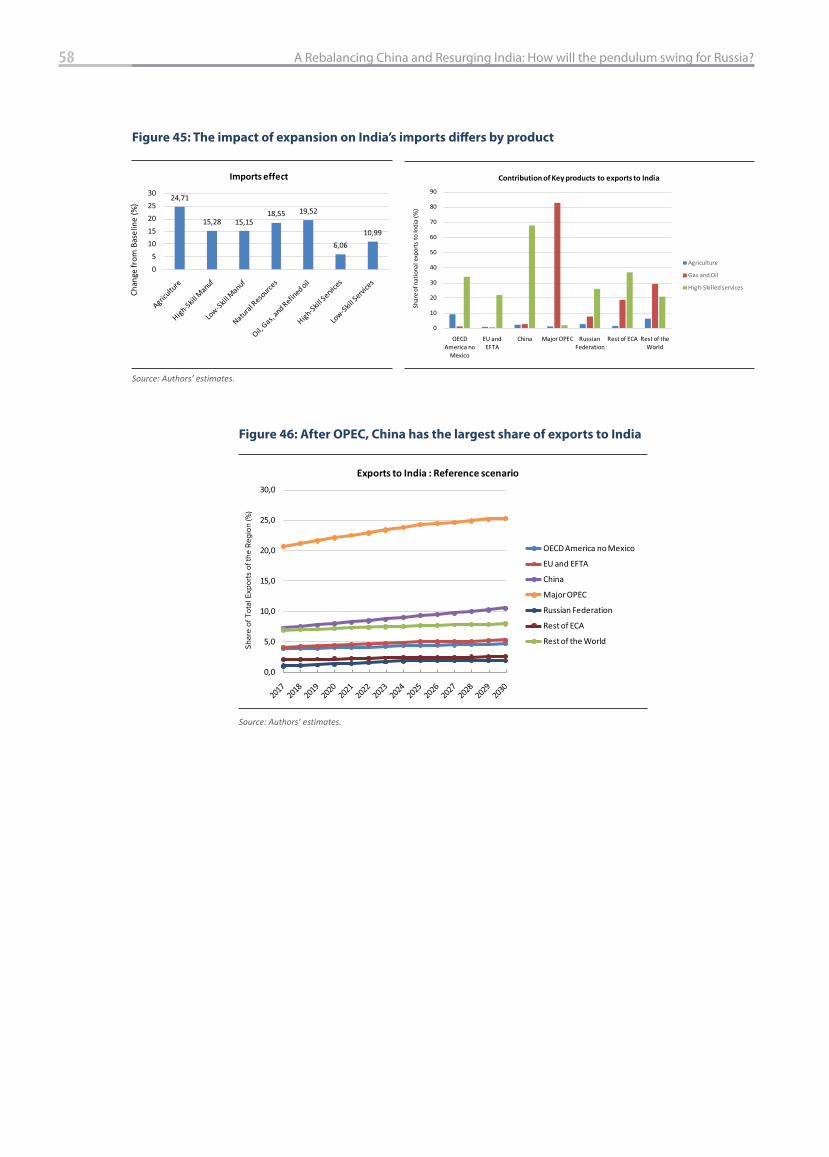
58 A Rebalancing China and Resurging India: How will the pendulum swing for Russia?
Figure 45: The impact of expansion on India’s imports diff ers by product
24,71
15,28 15,1518,55 19,52
6,0610,99
05
1015202530
Chan
ge fr
om B
asel
ine
(%)
Imports effect
Source: Authors’ estimates.
0
10
20
30
40
50
60
70
80
90
OECD America no
Mexico
EU and EFTA
China Major OPEC Russian Federation
Rest of ECA Rest of the World
Shar
e of
nat
iona
l exp
orts
to In
dia
(%)
Contribution of Key products to exports to India
Agriculture
Gas and Oil
High-Skilled services
Figure 46: After OPEC, China has the largest share of exports to India
Source: Authors’ estimates.
0,0
5,0
10,0
15,0
20,0
25,0
30,0
Shar
e of
tota
l exp
orts
of t
eh re
gion
(%)
Exports to India : Reference scenario
OECD America no Mexico
EU and EFTA
China
Major OPEC
Russian Federation
Rest of ECA
Rest of the World
Shar
e of
Tot
al E
xpor
ts o
f the
Reg
ion
(%)
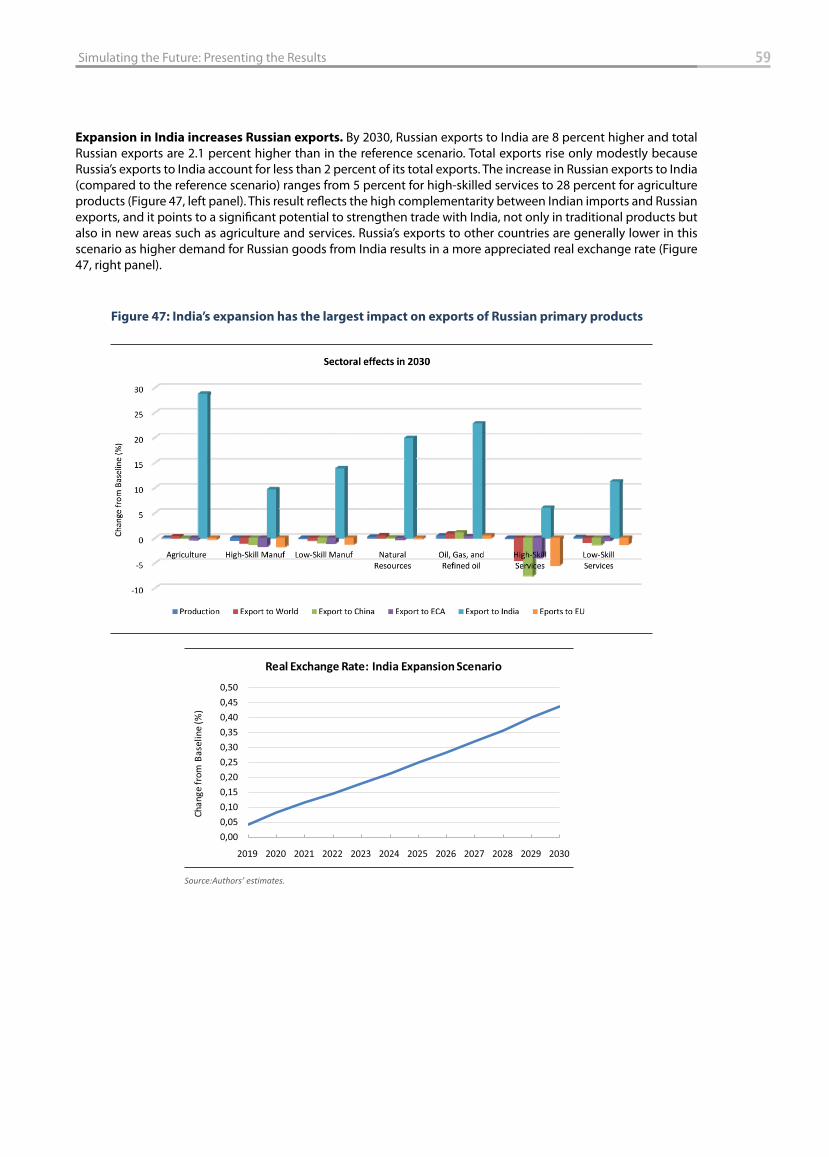
59 Simulating the Future: Presenting the Results
Expansion in India increases Russian exports. By 2030, Russian exports to India are 8 percent higher and total Russian exports are 2.1 percent higher than in the reference scenario. Total exports rise only modestly because Russia’s exports to India account for less than 2 percent of its total exports. The increase in Russian exports to India (compared to the reference scenario) ranges from 5 percent for high-skilled services to 28 percent for agriculture products (Figure 47, left panel). This result refl ects the high complementarity between Indian imports and Russian exports, and it points to a signifi cant potential to strengthen trade with India, not only in traditional products but also in new areas such as agriculture and services. Russia’s exports to other countries are generally lower in this scenario as higher demand for Russian goods from India results in a more appreciated real exchange rate (Figure 47, right panel).
Figure 47: India’s expansion has the largest impact on exports of Russian primary products
Source:Authors’ estimates.
0,000,050,100,150,200,250,300,350,400,450,50
2019 2020 2021 2022 2023 2024 2025 2026 2027 2028 2029 2030
Chan
ge fr
om B
asel
ine
(%)
Real Exchange Rate: India Expansion Scenario
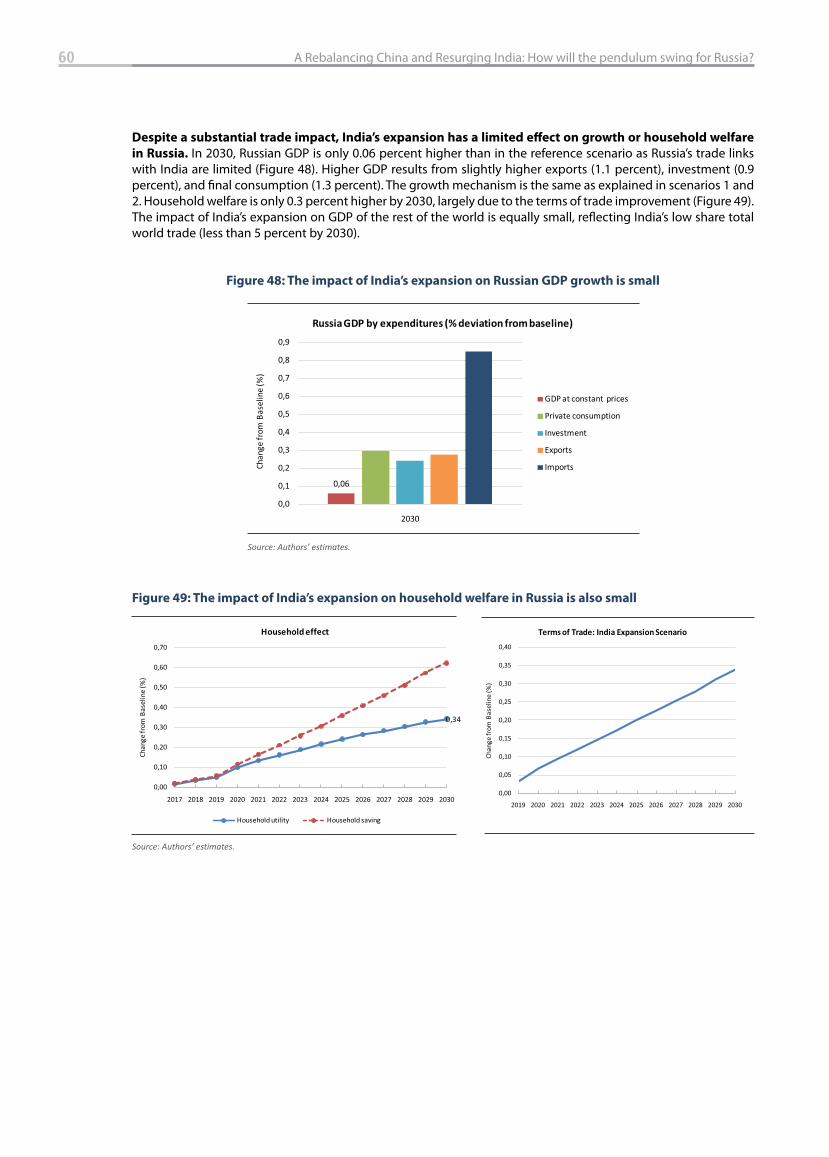
60 A Rebalancing China and Resurging India: How will the pendulum swing for Russia?
Despite a substantial trade impact, India’s expansion has a limited eff ect on growth or household welfare
in Russia. In 2030, Russian GDP is only 0.06 percent higher than in the reference scenario as Russia’s trade links with India are limited (Figure 48). Higher GDP results from slightly higher exports (1.1 percent), investment (0.9 percent), and fi nal consumption (1.3 percent). The growth mechanism is the same as explained in scenarios 1 and 2. Household welfare is only 0.3 percent higher by 2030, largely due to the terms of trade improvement (Figure 49). The impact of India’s expansion on GDP of the rest of the world is equally small, refl ecting India’s low share total world trade (less than 5 percent by 2030).
Figure 49: The impact of India’s expansion on household welfare in Russia is also small
Source: Authors’ estimates.
0,34
0,00
0,10
0,20
0,30
0,40
0,50
0,60
0,70
2017 2018 2019 2020 2021 2022 2023 2024 2025 2026 2027 2028 2029 2030
Chan
ge fr
om B
asel
ine
(%)
Household effect
Household utility Household saving
0,00
0,05
0,10
0,15
0,20
0,25
0,30
0,35
0,40
2019 2020 2021 2022 2023 2024 2025 2026 2027 2028 2029 2030
Chan
ge fr
om B
asel
ine
(%)
Terms of Trade: India Expansion Scenario
Figure 48: The impact of India’s expansion on Russian GDP growth is small
Source: Authors’ estimates.
0,06
0,0
0,1
0,2
0,3
0,4
0,5
0,6
0,7
0,8
0,9
2030
Chan
ge fr
om B
asel
ine
(%)
Russia GDP by expenditures (% deviation from baseline)
GDP at constant prices
Private consumption
Investment
Exports
Imports
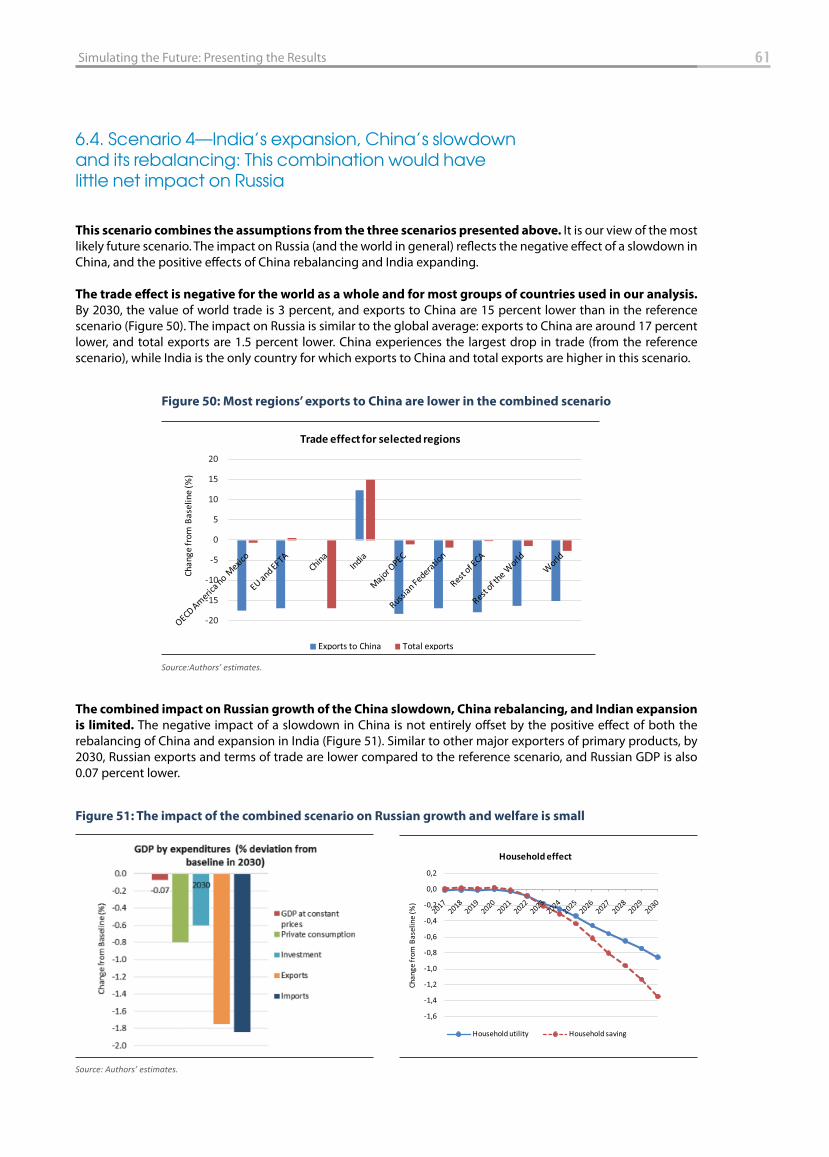
61 Simulating the Future: Presenting the Results
6.4. Scenario 4—India’s expansion, China’s slowdown and its rebalancing: This combination would have little net impact on Russia
This scenario combines the assumptions from the three scenarios presented above. It is our view of the most likely future scenario. The impact on Russia (and the world in general) refl ects the negative eff ect of a slowdown in China, and the positive eff ects of China rebalancing and India expanding.
The trade eff ect is negative for the world as a whole and for most groups of countries used in our analysis. By 2030, the value of world trade is 3 percent, and exports to China are 15 percent lower than in the reference scenario (Figure 50). The impact on Russia is similar to the global average: exports to China are around 17 percent lower, and total exports are 1.5 percent lower. China experiences the largest drop in trade (from the reference scenario), while India is the only country for which exports to China and total exports are higher in this scenario.
The combined impact on Russian growth of the China slowdown, China rebalancing, and Indian expansion
is limited. The negative impact of a slowdown in China is not entirely off set by the positive eff ect of both the rebalancing of China and expansion in India (Figure 51). Similar to other major exporters of primary products, by 2030, Russian exports and terms of trade are lower compared to the reference scenario, and Russian GDP is also 0.07 percent lower.
Figure 50: Most regions’ exports to China are lower in the combined scenario
Source:Authors’ estimates.
-20
-15
-10
-5
0
5
10
15
20
Chan
ge fr
om B
asel
ine
(%)
Trade effect for selected regions
Exports to China Total exports
Figure 51: The impact of the combined scenario on Russian growth and welfare is small
Source: Authors’ estimates.
-1,6
-1,4
-1,2
-1,0
-0,8
-0,6
-0,4
-0,2
0,0
0,2
Chan
ge fr
om B
asel
ine
(%)
Household effect
Household utility Household saving

62 A Rebalancing China and Resurging India: How will the pendulum swing for Russia?
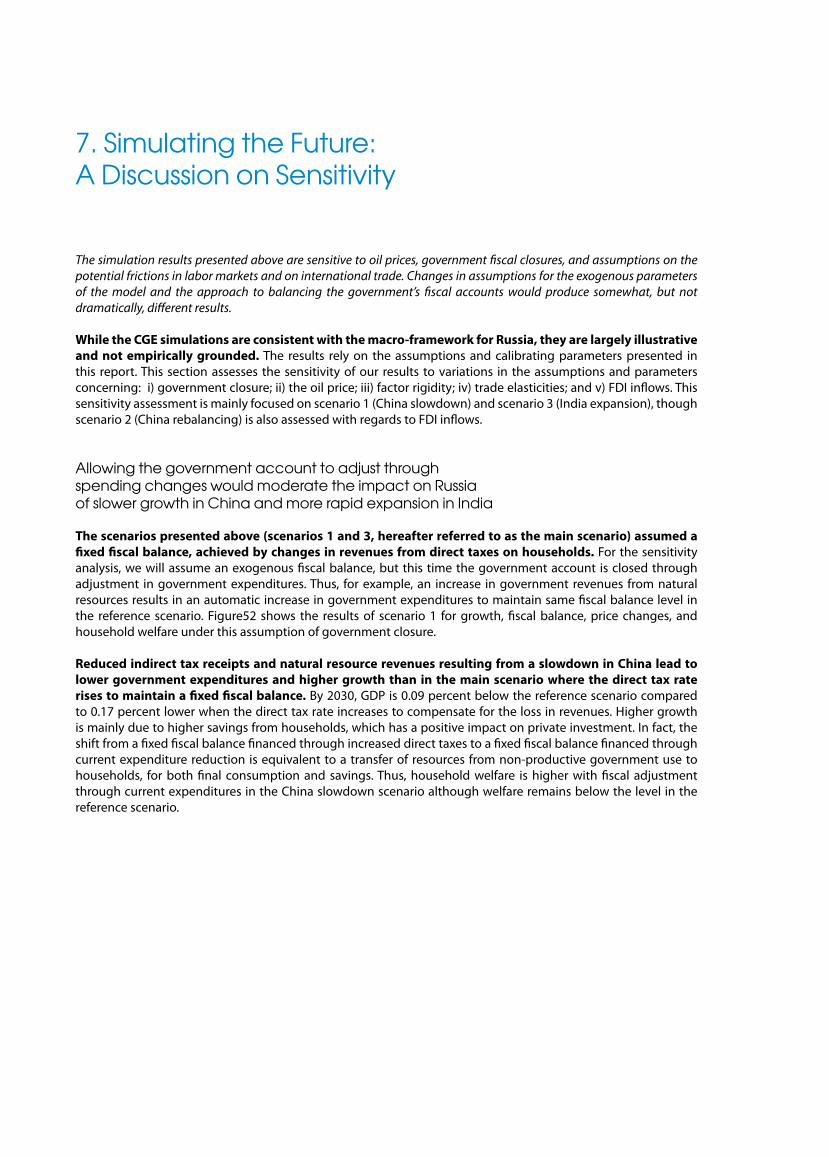
7. Simulating the Future: A Discussion on Sensitivity
The simulation results presented above are sensitive to oil prices, government fi scal closures, and assumptions on the potential frictions in labor markets and on international trade. Changes in assumptions for the exogenous parameters of the model and the approach to balancing the government’s fi scal accounts would produce somewhat, but not dramatically, diff erent results.
While the CGE simulations are consistent with the macro-framework for Russia, they are largely illustrative
and not empirically grounded. The results rely on the assumptions and calibrating parameters presented in this report. This section assesses the sensitivity of our results to variations in the assumptions and parameters concerning: i) government closure; ii) the oil price; iii) factor rigidity; iv) trade elasticities; and v) FDI infl ows. This sensitivity assessment is mainly focused on scenario 1 (China slowdown) and scenario 3 (India expansion), though scenario 2 (China rebalancing) is also assessed with regards to FDI infl ows.
Allowing the government account to adjust through spending changes would moderate the impact on Russia of slower growth in China and more rapid expansion in India
The scenarios presented above (scenarios 1 and 3, hereafter referred to as the main scenario) assumed a
fi xed fi scal balance, achieved by changes in revenues from direct taxes on households. For the sensitivity analysis, we will assume an exogenous fi scal balance, but this time the government account is closed through adjustment in government expenditures. Thus, for example, an increase in government revenues from natural resources results in an automatic increase in government expenditures to maintain same fi scal balance level in the reference scenario. Figure52 shows the results of scenario 1 for growth, fi scal balance, price changes, and household welfare under this assumption of government closure.
Reduced indirect tax receipts and natural resource revenues resulting from a slowdown in China lead to
lower government expenditures and higher growth than in the main scenario where the direct tax rate
rises to maintain a fi xed fi scal balance. By 2030, GDP is 0.09 percent below the reference scenario compared to 0.17 percent lower when the direct tax rate increases to compensate for the loss in revenues. Higher growth is mainly due to higher savings from households, which has a positive impact on private investment. In fact, the shift from a fi xed fi scal balance fi nanced through increased direct taxes to a fi xed fi scal balance fi nanced through current expenditure reduction is equivalent to a transfer of resources from non-productive government use to households, for both fi nal consumption and savings. Thus, household welfare is higher with fi scal adjustment through current expenditures in the China slowdown scenario although welfare remains below the level in the reference scenario.
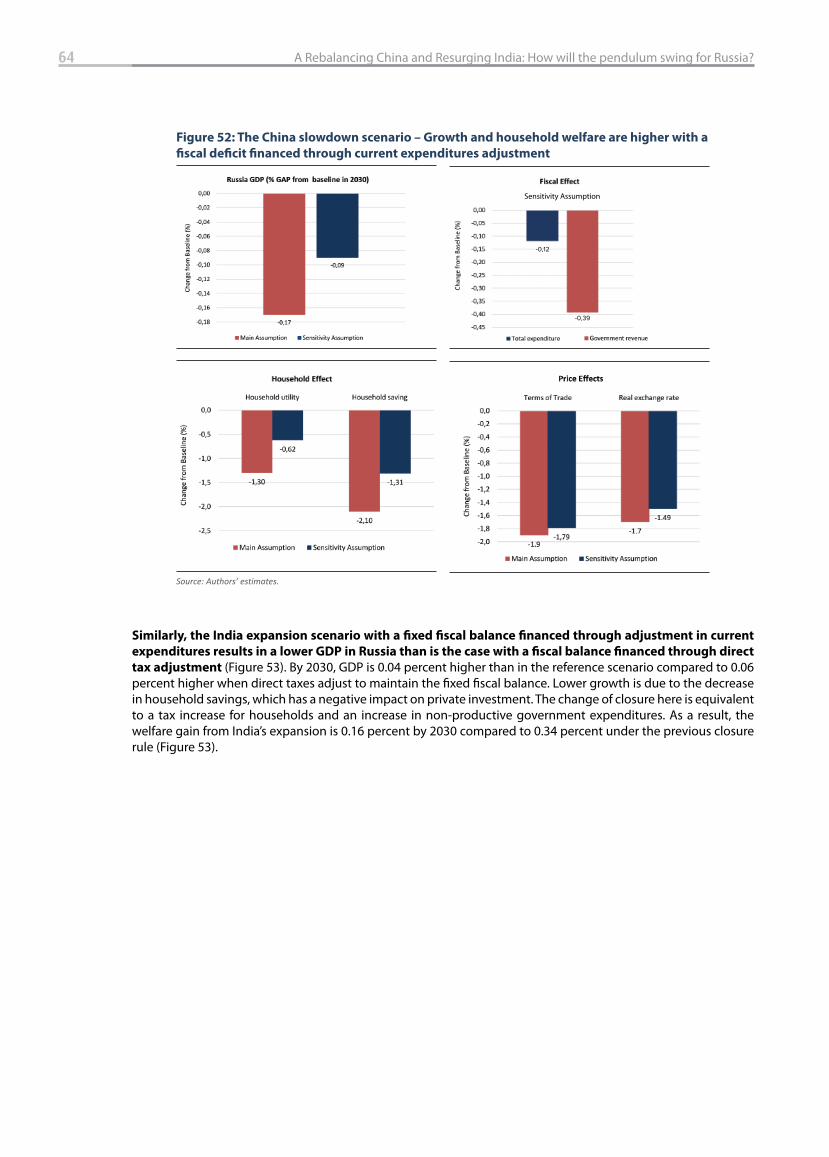
64 A Rebalancing China and Resurging India: How will the pendulum swing for Russia?
Similarly, the India expansion scenario with a fi xed fi scal balance fi nanced through adjustment in current
expenditures results in a lower GDP in Russia than is the case with a fi scal balance fi nanced through direct
tax adjustment (Figure 53). By 2030, GDP is 0.04 percent higher than in the reference scenario compared to 0.06 percent higher when direct taxes adjust to maintain the fi xed fi scal balance. Lower growth is due to the decrease in household savings, which has a negative impact on private investment. The change of closure here is equivalent to a tax increase for households and an increase in non-productive government expenditures. As a result, the welfare gain from India’s expansion is 0.16 percent by 2030 compared to 0.34 percent under the previous closure rule (Figure 53).
Figure 52: The China slowdown scenario – Growth and household welfare are higher with a
fi scal defi cit fi nanced through current expenditures adjustment
Source: Authors’ estimates.
-0,12
-0,39
Sensitivity Assumption
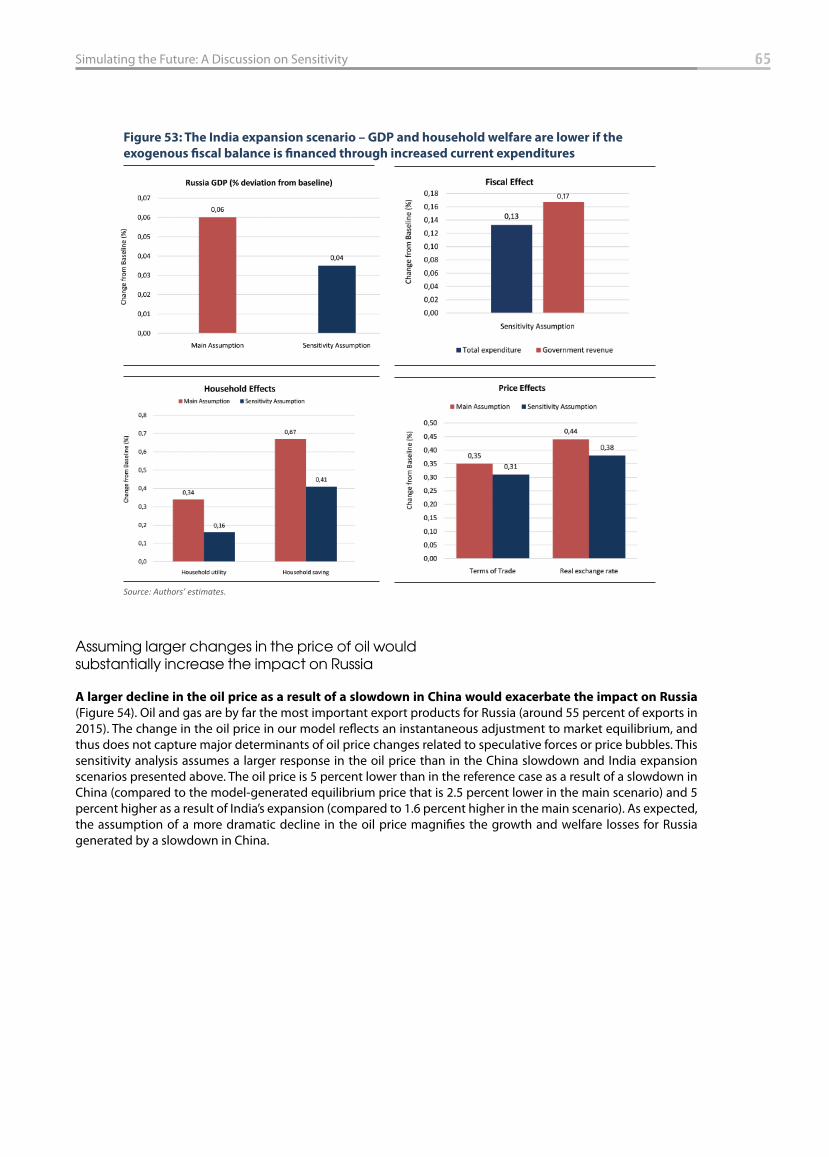
Assuming larger changes in the price of oil would substantially increase the impact on Russia
A larger decline in the oil price as a result of a slowdown in China would exacerbate the impact on Russia
(Figure 54). Oil and gas are by far the most important export products for Russia (around 55 percent of exports in 2015). The change in the oil price in our model refl ects an instantaneous adjustment to market equilibrium, and thus does not capture major determinants of oil price changes related to speculative forces or price bubbles. This sensitivity analysis assumes a larger response in the oil price than in the China slowdown and India expansion scenarios presented above. The oil price is 5 percent lower than in the reference case as a result of a slowdown in China (compared to the model-generated equilibrium price that is 2.5 percent lower in the main scenario) and 5 percent higher as a result of India’s expansion (compared to 1.6 percent higher in the main scenario). As expected, the assumption of a more dramatic decline in the oil price magnifi es the growth and welfare losses for Russia generated by a slowdown in China.
Figure 53: The India expansion scenario – GDP and household welfare are lower if the
exogenous fi scal balance is fi nanced through increased current expenditures
Source: Authors’ estimates.
65Simulating the Future: A Discussion on Sensitivity
0,17
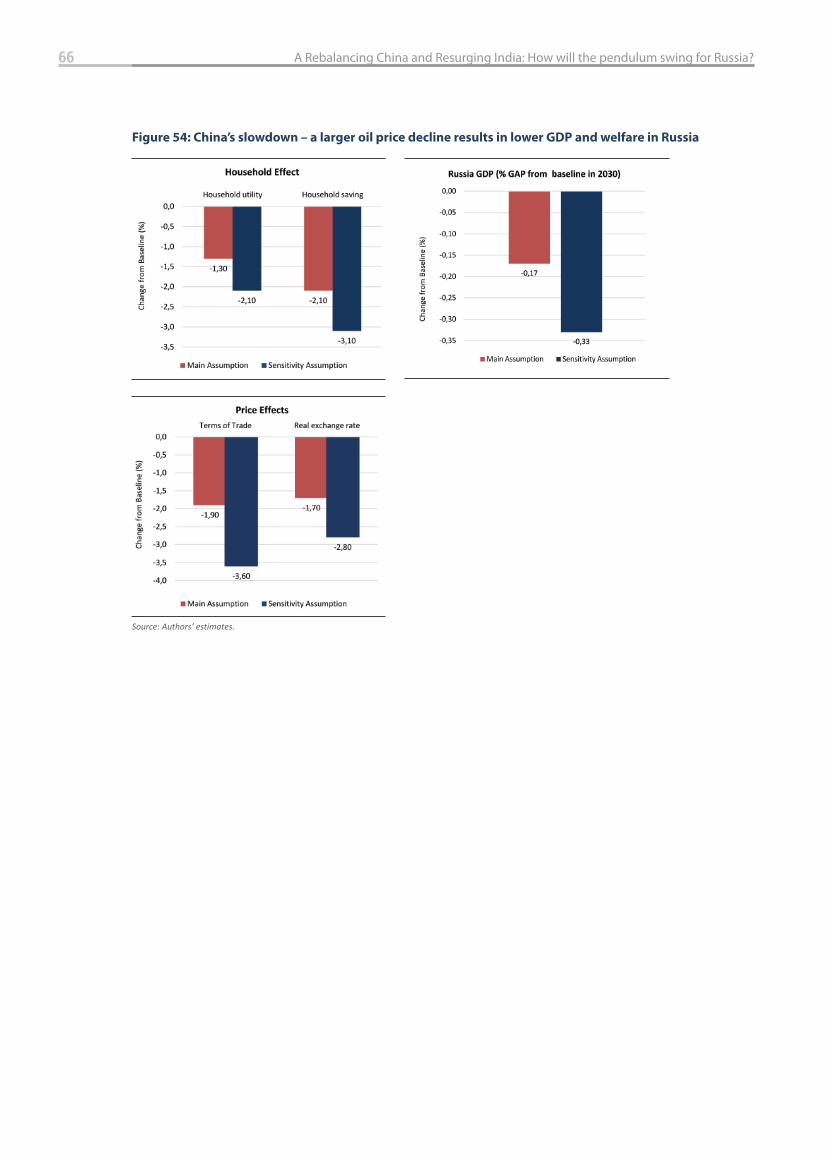
66 A Rebalancing China and Resurging India: How will the pendulum swing for Russia?
Figure 54: China’s slowdown – a larger oil price decline results in lower GDP and welfare in Russia
Source: Authors’ estimates.
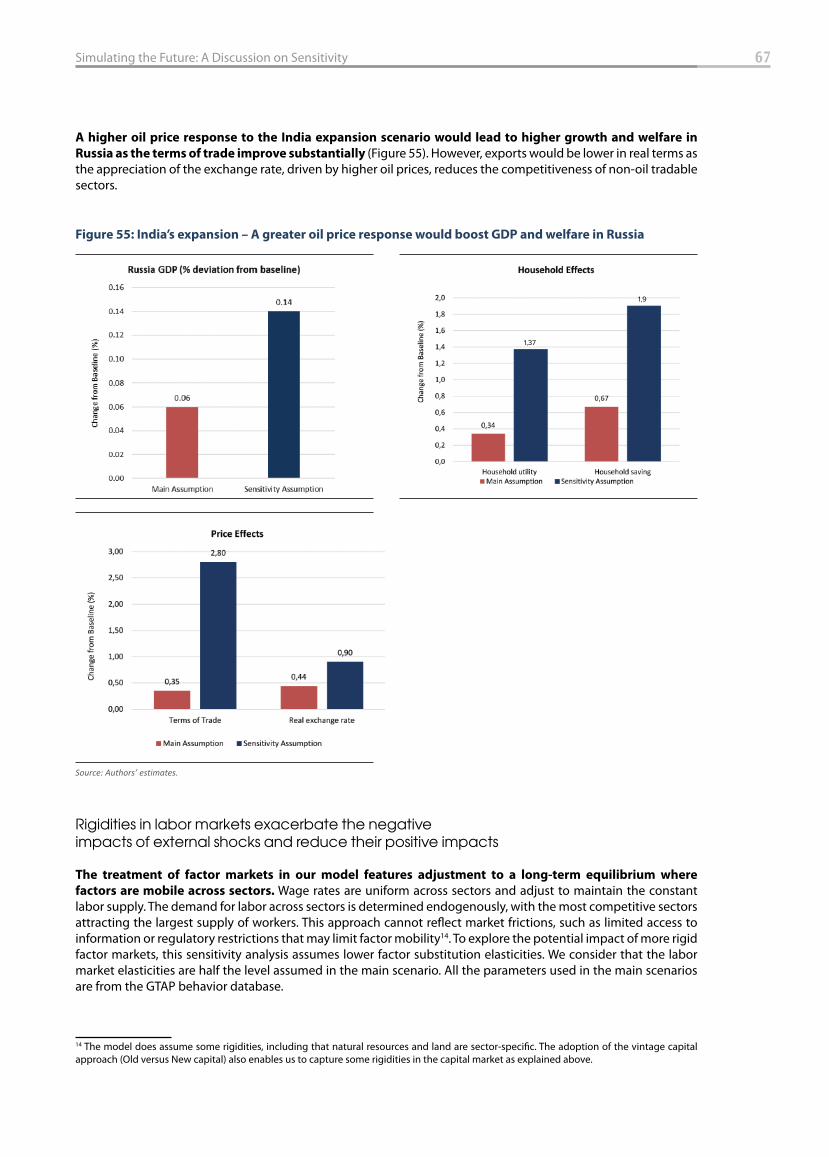
67Simulating the Future: A Discussion on Sensitivity
A higher oil price response to the India expansion scenario would lead to higher growth and welfare in
Russia as the terms of trade improve substantially (Figure 55). However, exports would be lower in real terms as the appreciation of the exchange rate, driven by higher oil prices, reduces the competitiveness of non-oil tradable sectors.
Rigidities in labor markets exacerbate the negative impacts of external shocks and reduce their positive impacts
The treatment of factor markets in our model features adjustment to a long-term equilibrium where
factors are mobile across sectors. Wage rates are uniform across sectors and adjust to maintain the constant labor supply. The demand for labor across sectors is determined endogenously, with the most competitive sectors attracting the largest supply of workers. This approach cannot refl ect market frictions, such as limited access to information or regulatory restrictions that may limit factor mobility14. To explore the potential impact of more rigid factor markets, this sensitivity analysis assumes lower factor substitution elasticities. We consider that the labor market elasticities are half the level assumed in the main scenario. All the parameters used in the main scenarios are from the GTAP behavior database.
14 The model does assume some rigidities, including that natural resources and land are sector-specifi c. The adoption of the vintage capital approach (Old versus New capital) also enables us to capture some rigidities in the capital market as explained above.
Figure 55: India’s expansion – A greater oil price response would boost GDP and welfare in Russia
Source: Authors’ estimates.
1,37
1,9
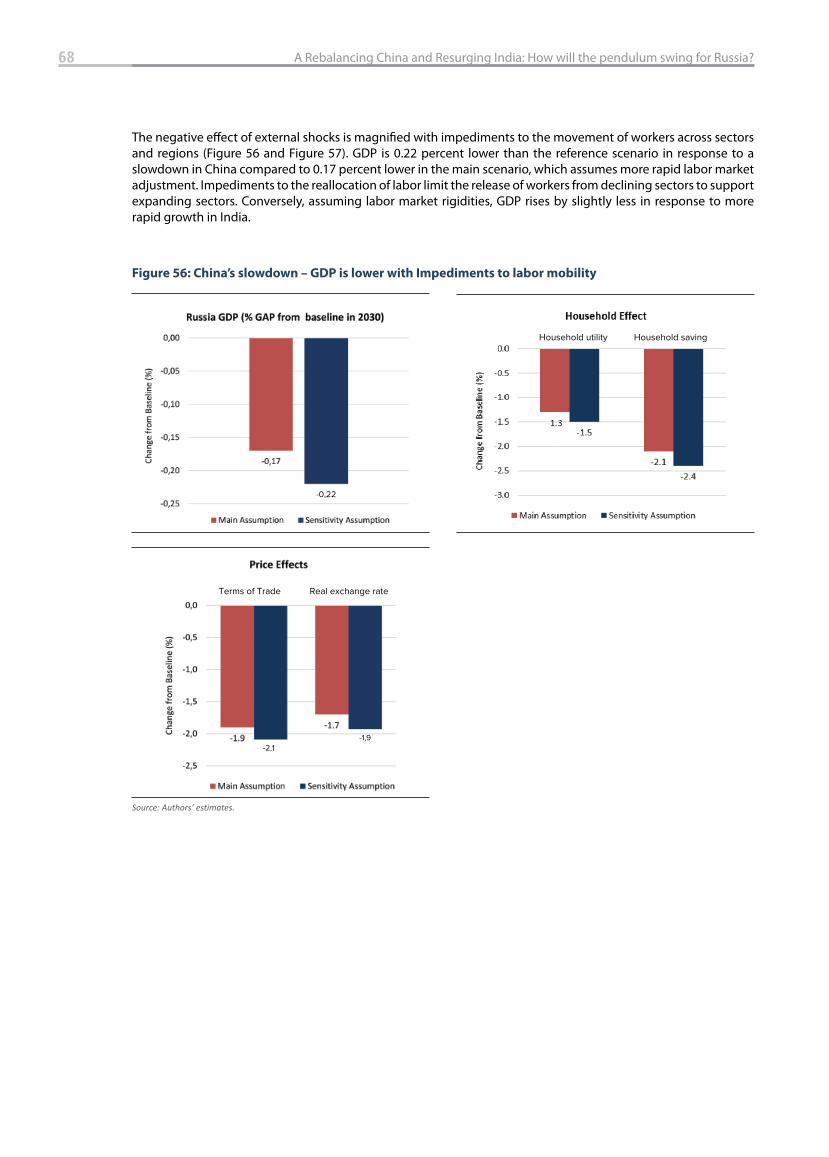
68 A Rebalancing China and Resurging India: How will the pendulum swing for Russia?
The negative eff ect of external shocks is magnifi ed with impediments to the movement of workers across sectors and regions (Figure 56 and Figure 57). GDP is 0.22 percent lower than the reference scenario in response to a slowdown in China compared to 0.17 percent lower in the main scenario, which assumes more rapid labor market adjustment. Impediments to the reallocation of labor limit the release of workers from declining sectors to support expanding sectors. Conversely, assuming labor market rigidities, GDP rises by slightly less in response to more rapid growth in India.
Figure 56: China’s slowdown – GDP is lower with Impediments to labor mobility
Source: Authors’ estimates.
-2,1-1,9
Household utility Household saving
Terms of Trade Real exchange rate
-0,22
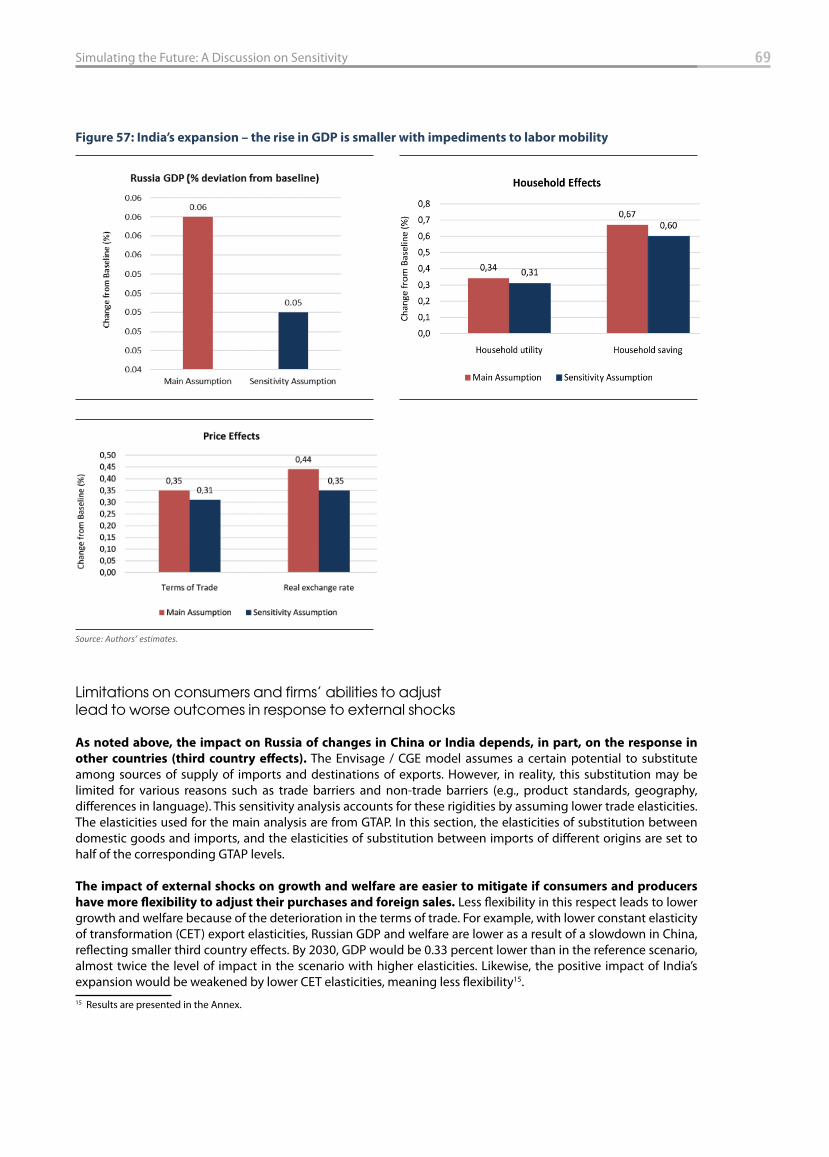
69Simulating the Future: A Discussion on Sensitivity
Limitations on consumers and firms’ abilities to adjust lead to worse outcomes in response to external shocks
As noted above, the impact on Russia of changes in China or India depends, in part, on the response in
other countries (third country eff ects). The Envisage / CGE model assumes a certain potential to substitute among sources of supply of imports and destinations of exports. However, in reality, this substitution may be limited for various reasons such as trade barriers and non-trade barriers (e.g., product standards, geography, diff erences in language). This sensitivity analysis accounts for these rigidities by assuming lower trade elasticities. The elasticities used for the main analysis are from GTAP. In this section, the elasticities of substitution between domestic goods and imports, and the elasticities of substitution between imports of diff erent origins are set to half of the corresponding GTAP levels.
The impact of external shocks on growth and welfare are easier to mitigate if consumers and producers
have more fl exibility to adjust their purchases and foreign sales. Less fl exibility in this respect leads to lower growth and welfare because of the deterioration in the terms of trade. For example, with lower constant elasticity of transformation (CET) export elasticities, Russian GDP and welfare are lower as a result of a slowdown in China, refl ecting smaller third country eff ects. By 2030, GDP would be 0.33 percent lower than in the reference scenario, almost twice the level of impact in the scenario with higher elasticities. Likewise, the positive impact of India’s expansion would be weakened by lower CET elasticities, meaning less fl exibility15. 15 Results are presented in the Annex.
Figure 57: India’s expansion – the rise in GDP is smaller with impediments to labor mobility
Source: Authors’ estimates.
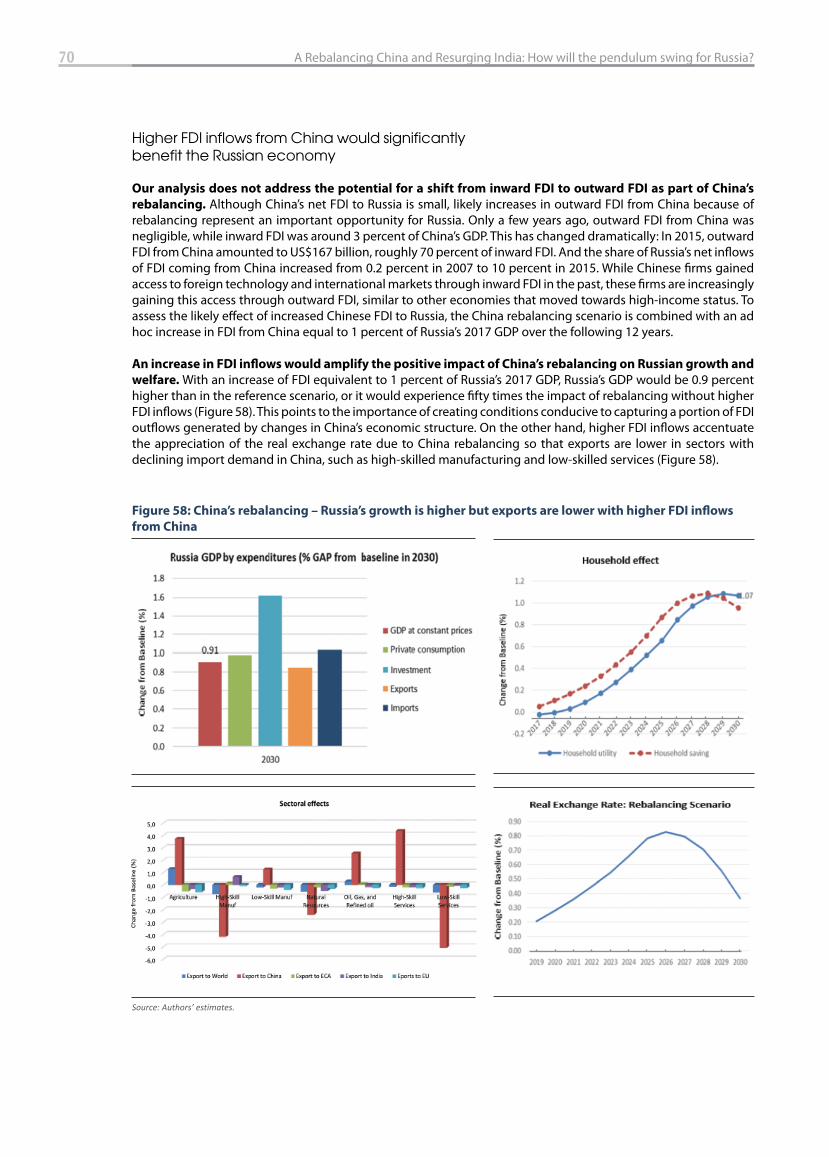
70 A Rebalancing China and Resurging India: How will the pendulum swing for Russia?
Higher FDI inflows from China would significantly benefit the Russian economy
Our analysis does not address the potential for a shift from inward FDI to outward FDI as part of China’s
rebalancing. Although China’s net FDI to Russia is small, likely increases in outward FDI from China because of rebalancing represent an important opportunity for Russia. Only a few years ago, outward FDI from China was negligible, while inward FDI was around 3 percent of China’s GDP. This has changed dramatically: In 2015, outward FDI from China amounted to US$167 billion, roughly 70 percent of inward FDI. And the share of Russia’s net infl ows of FDI coming from China increased from 0.2 percent in 2007 to 10 percent in 2015. While Chinese fi rms gained access to foreign technology and international markets through inward FDI in the past, these fi rms are increasingly gaining this access through outward FDI, similar to other economies that moved towards high-income status. To assess the likely eff ect of increased Chinese FDI to Russia, the China rebalancing scenario is combined with an ad hoc increase in FDI from China equal to 1 percent of Russia’s 2017 GDP over the following 12 years.
An increase in FDI infl ows would amplify the positive impact of China’s rebalancing on Russian growth and
welfare. With an increase of FDI equivalent to 1 percent of Russia’s 2017 GDP, Russia’s GDP would be 0.9 percent higher than in the reference scenario, or it would experience fi fty times the impact of rebalancing without higher FDI infl ows (Figure 58). This points to the importance of creating conditions conducive to capturing a portion of FDI outfl ows generated by changes in China’s economic structure. On the other hand, higher FDI infl ows accentuate the appreciation of the real exchange rate due to China rebalancing so that exports are lower in sectors with declining import demand in China, such as high-skilled manufacturing and low-skilled services (Figure 58).
Figure 58: China’s rebalancing – Russia’s growth is higher but exports are lower with higher FDI infl ows
from China
Source: Authors’ estimates.
8. The Swinging Pendulum: Policy Implications for Russia
Changes in the global economic environment have important implications for the Russian economy.
A slowdown in China, a shift in China from investment to consumption, and a more rapid expansion in India would aff ect Russia’s economy. The size and composition of Russian exports would be aff ected, leading to changes in the terms of trade and government revenues, thus aff ecting growth and welfare. Improving the fl exibility of Russia’s economy would increase its ability to mitigate the impact of adverse developments while enabling it to benefi t from positive ones.
This analysis has several policy implications:
(i) Overall, our analysis provides yet more reason for Russia to pursue domestic structural reforms, which would enable it to better capitalize on the opportunities that a dynamically changing China and India have to off er. This modeling exercise assumes a frictionless labor and goods market and low trade barriers. Reducing frictions in the Russian labor market (because of low immobility and rising informality) and in the goods market (because of poor connectivity) would enable Russia to take greater advantage of opportunities and cope more eff ectively with challenges presented by the global economic environment. Also, the potential for reductions in welfare due to adverse economic developments underlines the importance of improving protection for adversely aff ected households in Russia.
(ii) The RCA fi ndings, considering the necessary caveats associated with this approach, suggest sectors that hold promise for deepening trade relationships. These include not only predominantly natural resource based industries, but also key services sectors such as construction, transport services, and communications.
(iii) The results may overstate the third country trade eff ects from external shocks because non-tariff barriers are not considered (although the model does capture the impact of trade tariff s). This underlines the importance of reducing non-tariff barriers, particularly within the Eurasian trading bloc.
(iv) The fi nding that levels of Russian exports to both China and India are below their natural potential underscores the importance of export diversifi cation, particularly reducing dependence on natural resources and promoting trade in services between China to Russia, such as increased tourism.
(v) Finally, the results emphasize the importance of policy measures that increase mutually benefi cial trade and FDI fl ows between China, India, and Russia. For example, from being a consumer / importer of Russia’s nuclear machinery, equipment, and technology, India is now positioning itself as a low-cost supplier / exporter of such machinery, equipment, and technologies to Russia, thereby increasing Russia’s global competitiveness in this area. There may well be implications for China’s new Belt and Road Initiative (BRI). China, for example, has won a $375 million contract to build a high-speed railway line connecting Moscow to Kazan, with a possible future extension to Beijing.

72 A Rebalancing China and Resurging India: How will the pendulum swing for Russia?
Bibliography
Agosin, M. R. (2007). “Export Diversifi cation and Growth in Emerging Economies.” Working Paper No. 233. Departamento de Economía, Universidad de Chile.Ahuja, A., and A. Myrvoda.(2012). “The Spillover Eff ects of a Downturn in China’s Real Estate Investment.” IMF Working Paper, No. 12/266.
Ahuja, A., and M. Nabar. (2012). “Investment-Led Growth in China: Global Spillovers.” IMF Working Paper, No. 12/267.
Albert, M., C. Jude, and C. Rebillard. (2015). “The Long Landing Scenario: Rebalancing from overinvestment and excessive credit growth. Implications for potential growth in China.” Banque de France Eurosysteme, No. 572.
Alcala, F., and A. Ciccone. (2004). “Trade and Productivity.” The Quarterly Journal of Economics, Vol. 119(2), pp. 612–645.
Anderson, D., J. Kriljenko, P. Drummond, P. Espaillat, and D. Muir. (2015). “Spillovers from China onto Sub-Saharan Africa: Insights from the Flexible System of Global Models.” IMF Working Paper No. 15/221.
Aw, B.Y., and A. Hwang. (1995). “Productivity and the Export Market: A Firm-Level Analysis.”Journal of Development Economics, Vol. 47, pp.313-332.
Aw, B.Y., M. Roberts, and T. Winston. (2007). «Export Market Participation, Investments in R&D and Worker Training, and the Evolution of Firm Productivity.»The World Economy, Vol. 30(1), pp. 83-104.Bandara, A. (2012). “Growth spillovers: Do China’s trade and investment matter for African growth?” UNDP.
Bernard, A., and J.B. Jensen. (1999). “Exceptional exporter performance: Cause, eff ect, or both?” Journal of International Economics, Vol. 47, pp.1-25.
Cadot, O., C. Carrère, V. Strauss-Kahn.(2011). “Export diversifi cation: What’s behind the hump?” In The Review of Economics and Statistics, Vol. 93(2), pp. 590-605.
Carrere, C., O. Cadot,V. Strauss-Kahn. (2011). “Trade diversifi cation: drivers and impacts.” InTrade and Employment:From Myths to Facts,Jansen, M., R. Peters, and J.M Salazar-Xirinachs.ILO-EC International Labour Offi ce – European Commission, Geneva, pp. 253-307
Cashin, P., K. Mohaddes, and M. Raissi. (2016). “China’s Slowdown and Global Financial Market Volatility: Is World Growth Losing Out?” IMF Working Paper, No. 16/63.
Center for International Development at Harvard University. (2015). “New Global Growth Projections Predict the Decade of India.” Available at: http://atlas.cid.harvard.edu/rankings/growth-predictions/
Clerides, S., S. Lach, and J. Tybout. (1998). “Is learning-by-exporting important? Micro dynamic evidence from Colombia, Mexico, and Morocco.”Quarterly Journal of Economics (53), pp. 903–947.
Coe, D. T., E. Helpman, and A. W. Hoff maister. (2009). “International R&D spillovers and institutions.” European Economic Review, Vol. 53(7), pp.723–741.
Crespi, G., C. Criscuolo, and J. Haskel. (2008). «Productivity, exporting, and the learning-by-exporting hypothesis: Direct evidence from UK fi rms.» Canadian Journal of Economics, Vol. 41(2), pp. 619-638.
De Loecker, J. (2007). “Do Exports Generate Higher Productivity? Evidence from Slovenia.”Journal of International Economics, Vol. 73, pp.69–98.
Demidova, Svetlana, H.L. Kee, and K. Krishna. (2006). “Do Trade Policy Diff erences Induce Sorting? Theory and Evidence from Bangladeshi Apparel Exporters.” NBER working paper No. 12725.
74 A Rebalancing China and Resurging India: How will the pendulum swing for Russia?
Dizioli, A., J. Guajardo, V. Klyuev, R. Mano, and M. Raissi. (2016). “Spillovers from China’s Growth Slowdown and Rebalancing to the ASEAN-5 Economies.” IMF Working Paper No. 16/170.
Dollar, D. (1992). “Outward-Oriented Developing Economies Really Do Grow More Rapidly: Evidence from 95 LDCs, 1976-1985.” Economic Development and Cultural Change, Vol. 40(3), pp.523– 44.
Dorrucci, E., G. Pula, and D. Santabarbara. (2013). “China’s Economic Growth and Rebalancing.” European Central Bank Occasional Paper Series, No. 142.
Duval, R., K. Cheng, K. Oh, R. Saraf, and D. Seneviratne. (2014). “Trade Integration and Business Cycle Synchronization: A Reappraisal with Focus on Asia.” IMF Working PaperNo. 14/52.
Eaton, S. Kortum, and F. Kramarz. (2007). “An Anatomy of International Trade: Evidence from French Firms.”Mimeo.
Eaton, S. Kortum, and F. Kramarz. (2004). “Dissecting Trade: Firms, Industries, and Export Destinations.”American Economic Review, Vol. 94, pp.150-154.
The Economist. (2010). “India’s surprising economic miracle.” September 30. Available at: http://www.economist.com/node/17147648
Ethier, W. (1982). “National and International Returns to Scale in the Modern Theory of International Trade.”American Economic Review, Vol. 72(3), pp.389-405.
Fernandes, A. (2007). “Trade Policy, Trade Volumes and Plant-Level Productivity in Columbian Manufacturing Industries.”Journal of International Economics, Vol. 71(1), pp.52-71.
Gauvin, L., and C. Rebillard. (2015). “Towards Recoupling? Assessing the Global Impact of a Chinese Hard Landing through Trade and Commodity Price Channels.” Banque de France Working Paper, No. 562.
Gill, Indermit S., Ivailo Izvorski, Willem van Eeghen, and Donato De Rosa. (2014). “Diversifi ed development: Making the most of natural resources in Eurasia.” World Bank, Washington, DC. ISBN 978-1-4648-0119-8 (alk. paper) — ISBN 978-1-4648-0120-4 (ebook).
Girma, S., D. Greenaway, and R. Kneller. (2004). «Does Exporting Increase Productivity? A Microeconometric Analysis of Matched Firms.» Review of International Economics, Vol. 12(5), pp.855-866.
Grossman, G.M.,and E. Helpman. (1991). Innovation and Growth in the Global Economy Cambridge, MIT Press.
Haddad, M. (1993). “How Trade Liberalization Aff ected Productivity in Morocco.”World Bank Policy Research Working Paper 1096.
Halpern, L., M. Koren, and A. Szeidl. (2009).“Imported Inputs and Productivity.”Working Paper Central European University.
Hausmann, R., J. Hwang, and D. Rodrik. (2007). “What you export matters.” Journal of Economic Growth, Vol.12(1), pp.1–25.
Hesse H. (2008) “Export Diversifi cation and Economic Growth.” Commission on Growth and Development, The International Bank for Reconstruction and Development / The World Bank, Working paper No. 21.
Hicks, B., and L. Kilian. (2013). “Did Unexpectedly Strong Economic Growth Cause the Oil Price Shock of 2003-2008?” Journal of Forecasting, 32(5), 385–394.
Imbs, J., and R. Wacziarg. (2003). “Stages of Diversifi cation.”American Economic Review, Vol. 93(1), pp. 63–86.IMF. (2017). “A Shifting Global Economic Landscape.” January 2017. Available at: https://www.imf.org/external/pubs/ft/weo/2017/update/01/#footT1
IMF. (2016). “Asia: Maintaining Robust Growth amid Heightened Uncertainty.” Regional Economic Update, Asia and Pacifi c Department.
IMF. (2013). “World Economic Outlook, October 2013: Transitions and Tensions.”
Kawai, M., and F. Zhai. (2009). “China–Japan–United States integration amid global rebalancing: A computable general equilibrium analysis.” Journal of Asian Economics, Vol. 20 (6), pp. 688-699.
Klinger, B., D. Lederman. (2006). “Diversifi cation, innovation, and imitation inside the global technology frontier.” World Bank Policy Research Working Paper No. 3872.
Krishna, Pravin, and D. Mitra. (1998). “Trade Liberalization, Market Discipline and Productivity Growth: New Evidence From India.” Journal of Development Economics, Vol. 56 (2), pp.447-462.
Lakatos, Csilla, Maryla Maliszewska, Israel Osorio‐Rodarte, and Delfi n Go. (2016). “China’s Slowdown and Rebalancing: Potential Growth and Poverty Impacts on Sub‐Saharan Africa.” Policy Research Working Paper 7666, World Bank, Washington, DC.
Markusen, J. (1989); “Trade in Producer Services and in Other Specialized Intermediate Inputs.”American Economic Review, Vol. 79(1), pp.85-95.
Melitz, M. (2003). “The Impact of Trade on Intra-Industry Reallocations and Aggregate Industry Productivity.” Econometrica, Vol. 71(6), pp. 1695-1725.
Nabar, M., and P. N’Diaye. (2013). “Enhancing China’s Medium-Term Growth Prospects: The Path to a High-Income Economy.” IMF Working Paper13/204.
Pavcnik, N. (2002). “Trade Liberalization, Exit and Productivity Improvement: Evidence from Chilean Plants.”Review of Economic Studies, Vol. 69(1), pp. 245-276.
Pettis, M. (2014). “The Impact of Reform on Growth.” Blog post, available at https://web.archive.org/web/20140130204630/http://blog.mpettis.com/2014/01/the-impact-of-reform-on-growth/
PWC. (2017). “Global Economy Watch: Predictions for 2017: Globalisation takes a backseat.” January 2017.
Roache, S. (2012). “China’s Impact on World Commodity Markets.” IMF Working Paper.
Rodrik, D. (2015). Economic Rules: The Rights and Wrongs of the Dismal Science. W.W. Norton & Company.
Sachs, J.D., and A. Warner. (1997). “Natural resource abundance and economic growth.”NBER Working Paper No. 5398.
Tybout, J., and D. Westbrook. (1995). “Trade Liberalization and the Dimensions of Effi ciency Change in Mexican Manufacturing Industries.” Journal of International Economics, Vol. 39, pp.53-78.
Van Biesebroeck, J. (2005). «Exporting raises productivity in sub-Saharan African manufacturing fi rms.» Journal of International Economics, Vol. 67(2), pp. 373-391.
World Bank. (2016). “The Impact of China on Europe and Central Asia.” ECA Economic Update Spring 2016 (April), Washington, DC. Doi: 10.1596/978-1-4648-0912-5.
World Bank. (2017). “Global Outlook: Subdued Growth, Shifting Policies, Heightened Uncertainty.” In Global Economic Prospects: “Weak Investment in Uncertain Times.” January 2017.
Xuefeng, Q., and M. Yasar. (2016). “Export Market Diversifi cation and Firm Productivity: Evidence from a Large Developing Country.”World Development, Vol. 82, pp. 28–47.
75Bibliography

76 A Rebalancing China and Resurging India: How will the pendulum swing for Russia?
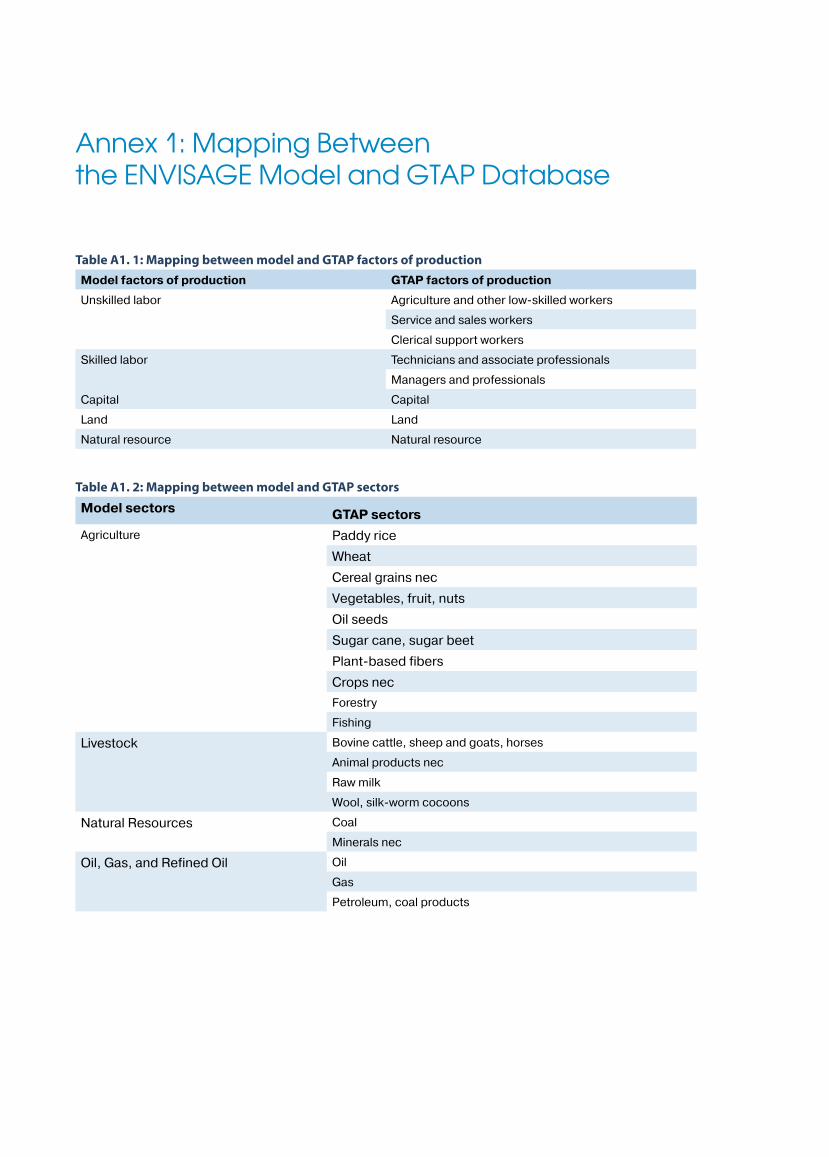
Annex 1: Mapping Between the ENVISAGE Model and GTAP Database
Table A1. 1: Mapping between model and GTAP factors of production
Model factors of production GTAP factors of production
Unskilled labor Agriculture and other low-skilled workers
Service and sales workers
Clerical support workers
Skilled labor Technicians and associate professionals
Managers and professionals
Capital Capital
Land Land
Natural resource Natural resource
Table A1. 2: Mapping between model and GTAP sectors
Model sectorsGTAP sectors
Agriculture Paddy rice
Wheat
Cereal grains nec
Vegetables, fruit, nuts
Oil seeds
Sugar cane, sugar beet
Plant-based fibers
Crops nec
Forestry
Fishing
Livestock Bovine cattle, sheep and goats, horses
Animal products nec
Raw milk
Wool, silk-worm cocoons
Natural Resources Coal
Minerals nec
Oil, Gas, and Refined Oil Oil
Gas
Petroleum, coal products
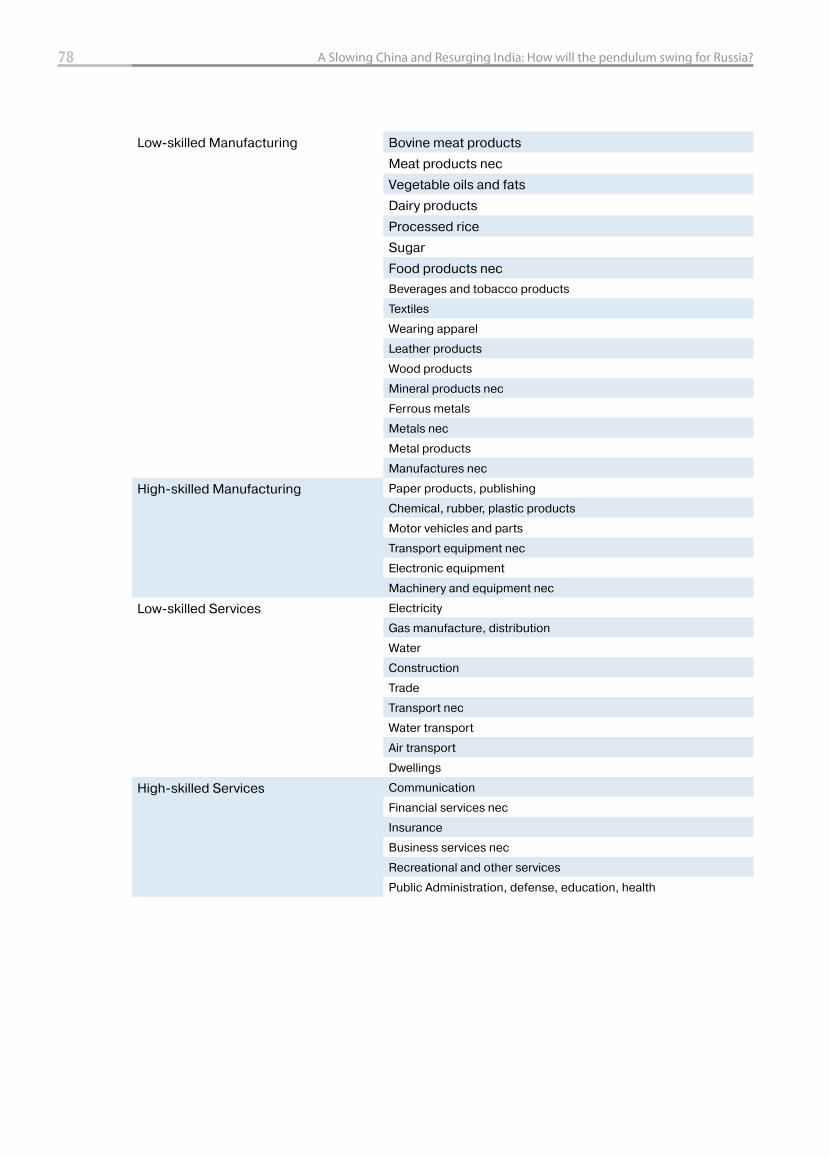
78 A Slowing China and Resurging India: How will the pendulum swing for Russia?
Low-skilled Manufacturing Bovine meat products
Meat products nec
Vegetable oils and fats
Dairy products
Processed rice
Sugar
Food products nec
Beverages and tobacco products
Textiles
Wearing apparel
Leather products
Wood products
Mineral products nec
Ferrous metals
Metals nec
Metal products
Manufactures nec
High-skilled Manufacturing Paper products, publishing
Chemical, rubber, plastic products
Motor vehicles and parts
Transport equipment nec
Electronic equipment
Machinery and equipment nec
Low-skilled Services Electricity
Gas manufacture, distribution
Water
Construction
Trade
Transport nec
Water transport
Air transport
Dwellings
High-skilled Services Communication
Financial services nec
Insurance
Business services nec
Recreational and other services
Public Administration, defense, education, health
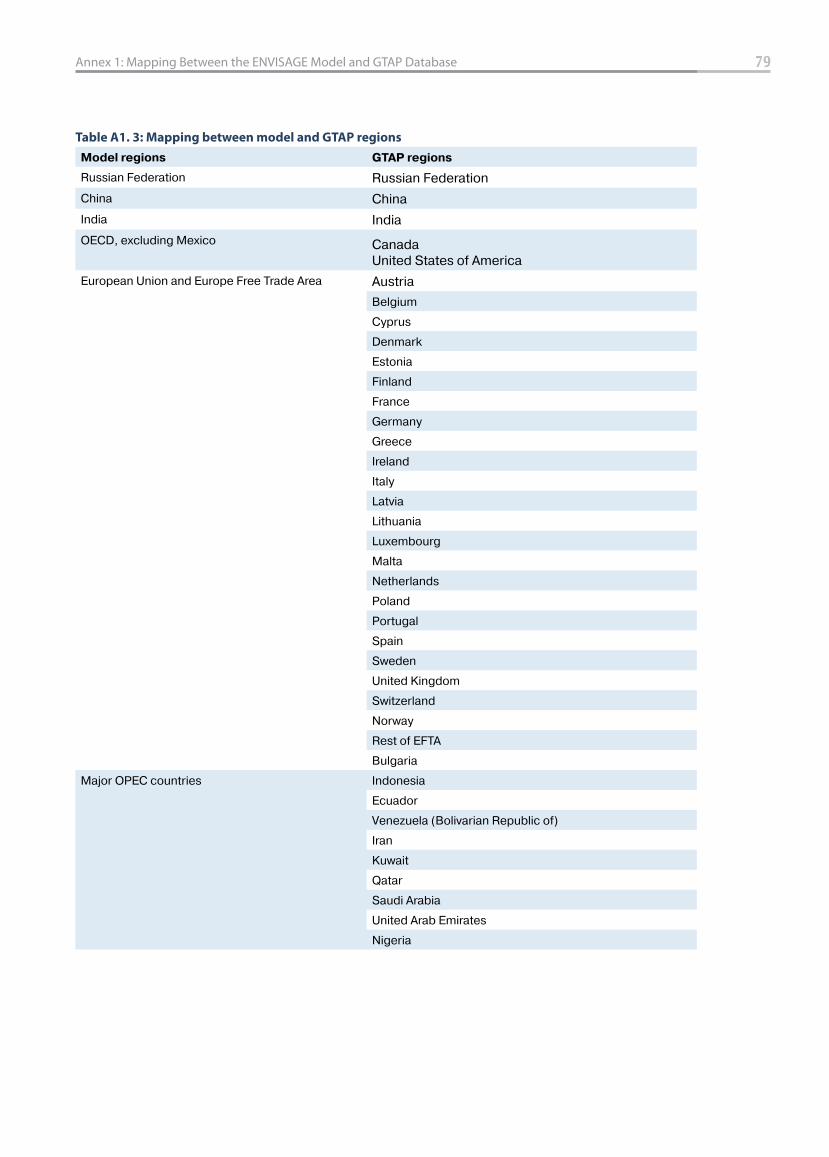
Table A1. 3: Mapping between model and GTAP regions
Model regions GTAP regions
Russian Federation Russian Federation
China China
India India
OECD, excluding Mexico CanadaUnited States of America
European Union and Europe Free Trade Area Austria
Belgium
Cyprus
Denmark
Estonia
Finland
France
Germany
Greece
Ireland
Italy
Latvia
Lithuania
Luxembourg
Malta
Netherlands
Poland
Portugal
Spain
Sweden
United Kingdom
Switzerland
Norway
Rest of EFTA
Bulgaria
Major OPEC countries Indonesia
Ecuador
Venezuela (Bolivarian Republic of)
Iran
Kuwait
Qatar
Saudi Arabia
United Arab Emirates
Nigeria
79Annex 1: Mapping Between the ENVISAGE Model and GTAP Database
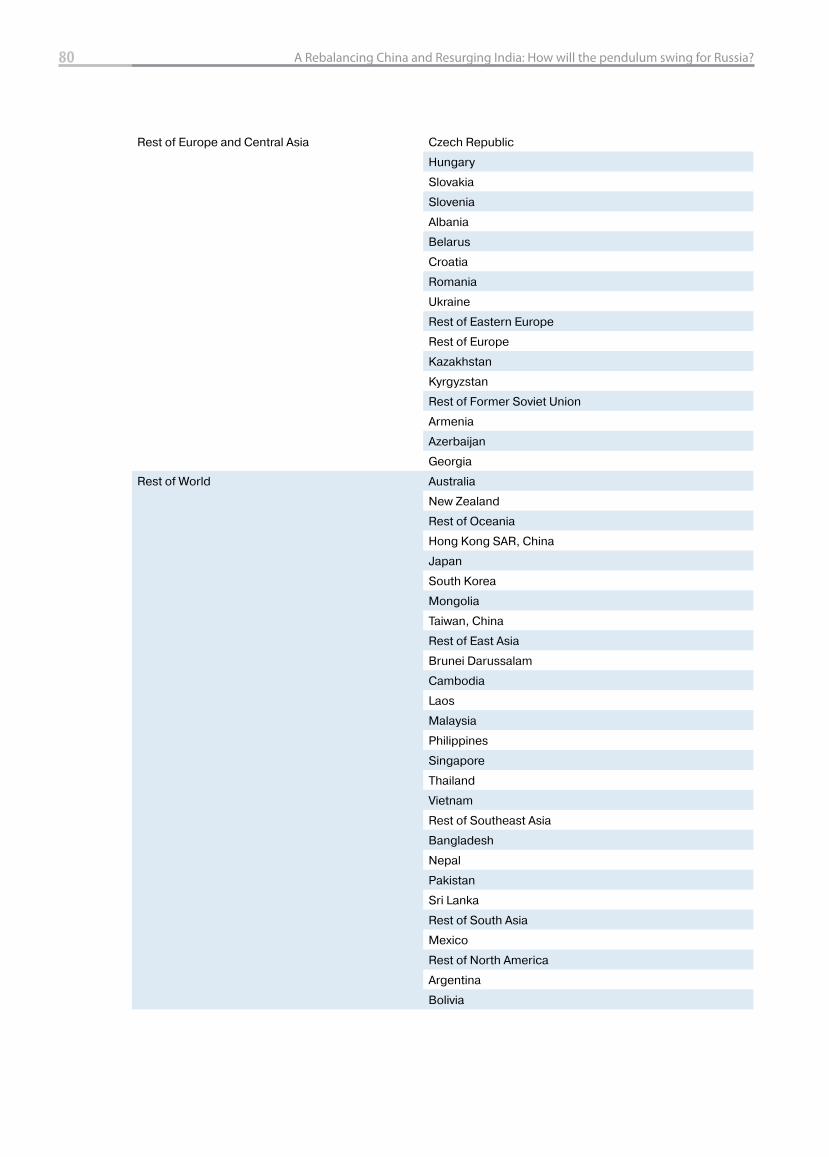
80 A Rebalancing China and Resurging India: How will the pendulum swing for Russia?
Rest of Europe and Central Asia Czech Republic
Hungary
Slovakia
Slovenia
Albania
Belarus
Croatia
Romania
Ukraine
Rest of Eastern Europe
Rest of Europe
Kazakhstan
Kyrgyzstan
Rest of Former Soviet Union
Armenia
Azerbaijan
Georgia
Rest of World Australia
New Zealand
Rest of Oceania
Hong Kong SAR, China
Japan
South Korea
Mongolia
Taiwan, China
Rest of East Asia
Brunei Darussalam
Cambodia
Laos
Malaysia
Philippines
Singapore
Thailand
Vietnam
Rest of Southeast Asia
Bangladesh
Nepal
Pakistan
Sri Lanka
Rest of South Asia
Mexico
Rest of North America
Argentina
Bolivia
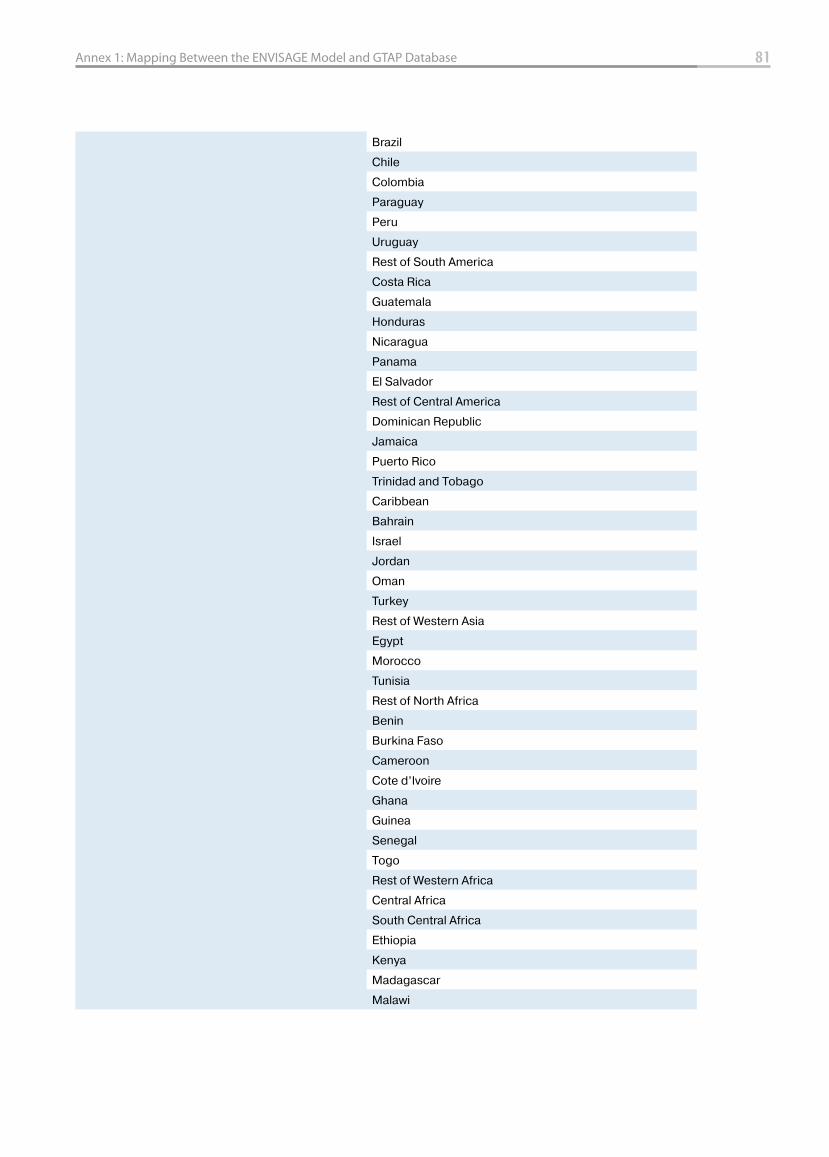
81Annex 1: Mapping Between the ENVISAGE Model and GTAP Database
Brazil
Chile
Colombia
Paraguay
Peru
Uruguay
Rest of South America
Costa Rica
Guatemala
Honduras
Nicaragua
Panama
El Salvador
Rest of Central America
Dominican Republic
Jamaica
Puerto Rico
Trinidad and Tobago
Caribbean
Bahrain
Israel
Jordan
Oman
Turkey
Rest of Western Asia
Egypt
Morocco
Tunisia
Rest of North Africa
Benin
Burkina Faso
Cameroon
Cote d’Ivoire
Ghana
Guinea
Senegal
Togo
Rest of Western Africa
Central Africa
South Central Africa
Ethiopia
Kenya
Madagascar
Malawi
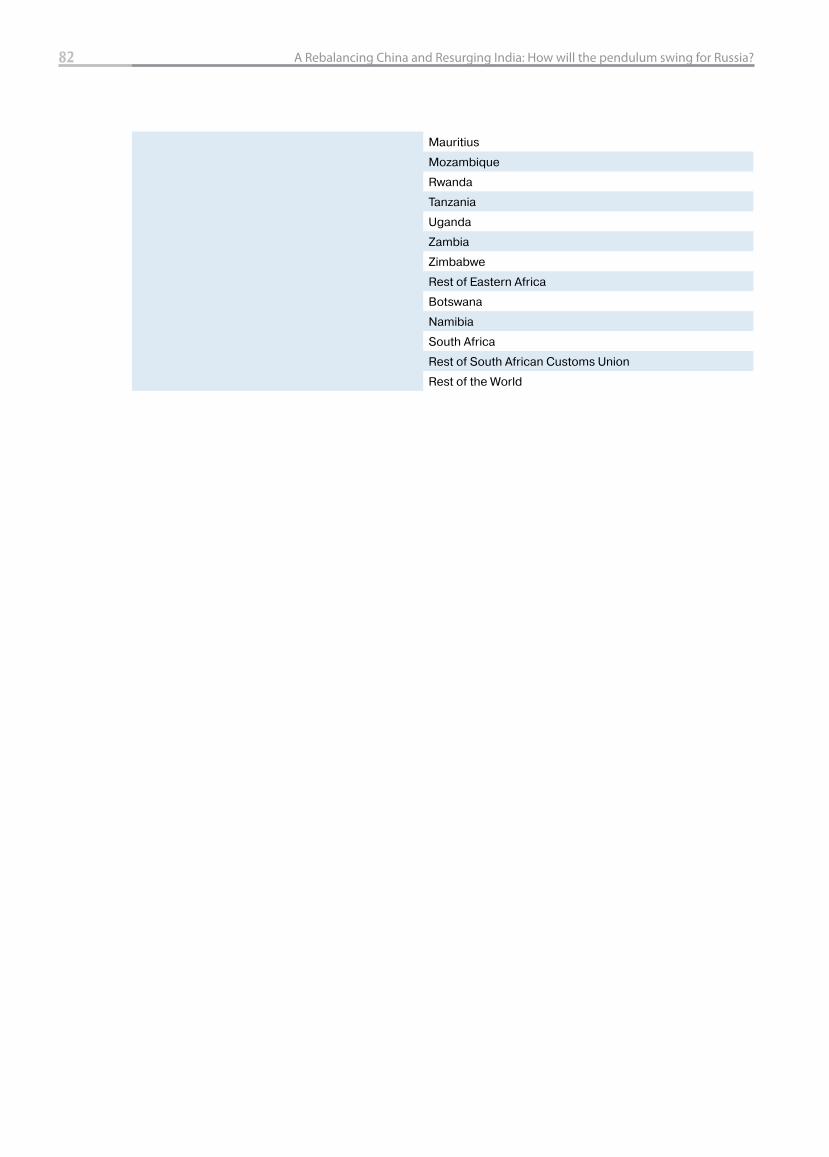
82 A Rebalancing China and Resurging India: How will the pendulum swing for Russia?
Mauritius
Mozambique
Rwanda
Tanzania
Uganda
Zambia
Zimbabwe
Rest of Eastern Africa
Botswana
Namibia
South Africa
Rest of South African Customs Union
Rest of the World
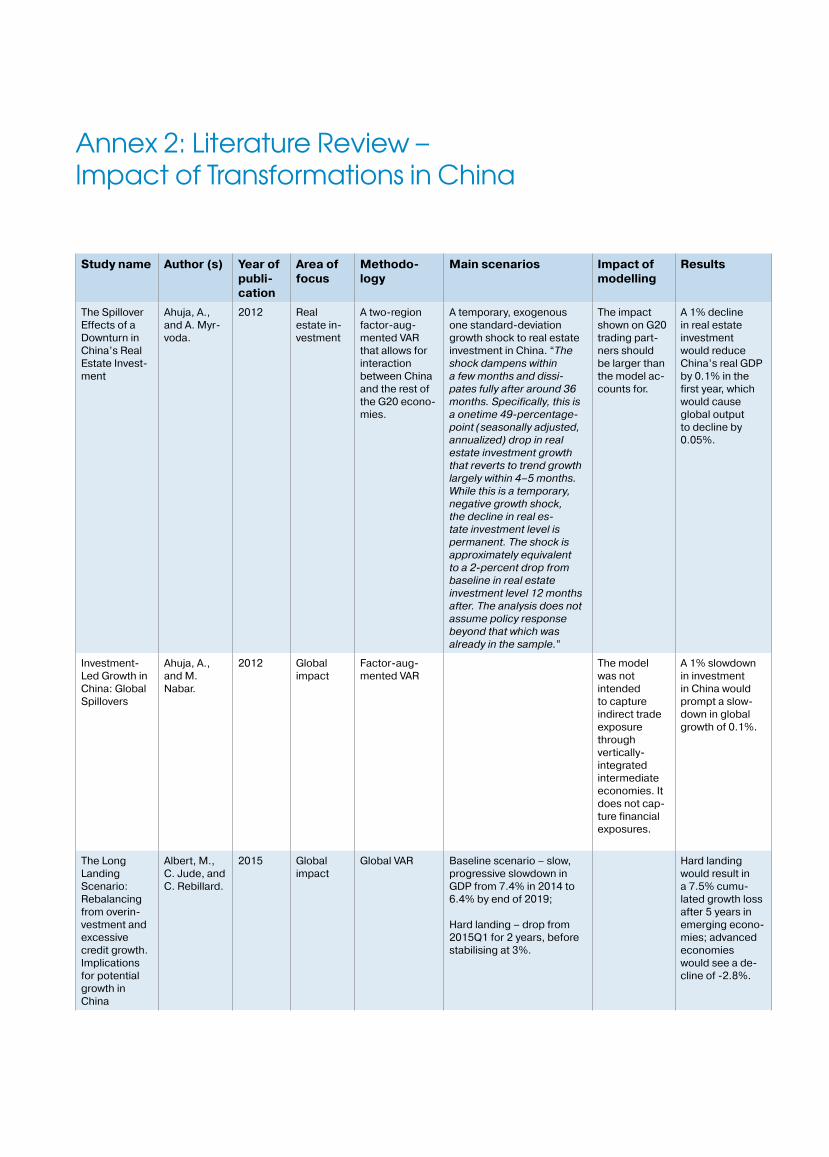
Annex 2: Literature Review – Impact of Transformations in China
Study name Author (s) Year of
publi-
cation
Area of
focus
Methodo-
logy
Main scenarios Impact of
modelling
Results
The Spillover Effects of a Downturn in China’s Real Estate Invest-ment
Ahuja, A., and A. Myr-voda.
2012 Real estate in-vestment
A two-region factor-aug-mented VAR that allows for interaction between China and the rest of the G20 econo-mies.
A temporary, exogenous one standard-deviation growth shock to real estate investment in China. “The shock dampens within a few months and dissi-pates fully after around 36 months. Specifically, this is a onetime 49-percentage-point (seasonally adjusted, annualized) drop in real estate investment growth that reverts to trend growth largely within 4–5 months. While this is a temporary, negative growth shock, the decline in real es-tate investment level is permanent. The shock is approximately equivalent to a 2-percent drop from baseline in real estate investment level 12 months after. The analysis does not assume policy response beyond that which was already in the sample.”
The impact shown on G20 trading part-ners should be larger than the model ac-counts for.
A 1% decline in real estate investment would reduce China’s real GDP by 0.1% in the first year, which would cause global output to decline by 0.05%.
Investment-Led Growth in China: Global Spillovers
Ahuja, A., and M. Nabar.
2012 Global impact
Factor-aug-mented VAR
The model was not intended to capture indirect trade exposure through vertically-integrated intermediate economies. It does not cap-ture financial exposures.
A 1% slowdown in investment in China would prompt a slow-down in global growth of 0.1%.
The Long Landing Scenario: Rebalancing from overin-vestment and excessive credit growth. Implications for potential growth in China
Albert, M., C. Jude, and C. Rebillard.
2015 Global impact
Global VAR Baseline scenario – slow, progressive slowdown in GDP from 7.4% in 2014 to 6.4% by end of 2019;
Hard landing – drop from 2015Q1 for 2 years, before stabilising at 3%.
Hard landing would result in a 7.5% cumu-lated growth loss after 5 years in emerging econo-mies; advanced economies would see a de-cline of -2.8%.
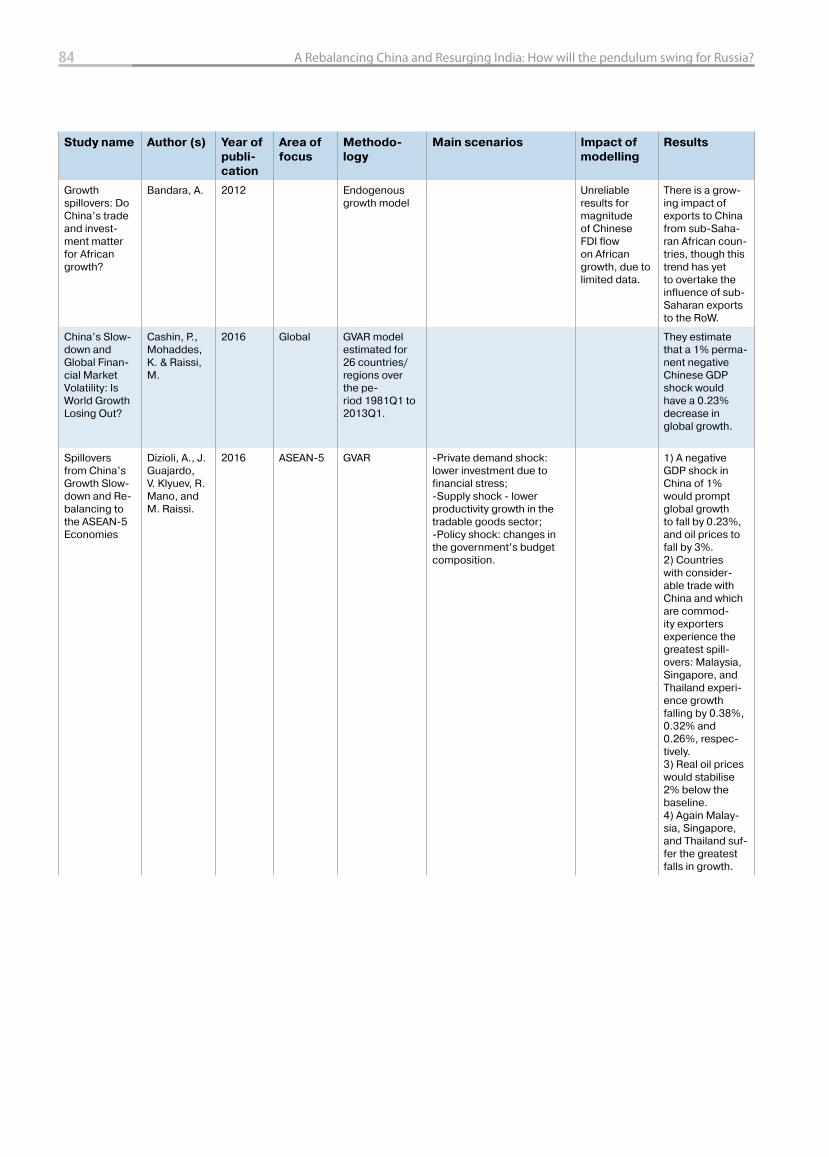
84 A Rebalancing China and Resurging India: How will the pendulum swing for Russia?
Study name Author (s) Year of
publi-
cation
Area of
focus
Methodo-
logy
Main scenarios Impact of
modelling
Results
Growth spillovers: Do China’s trade and invest-ment matter for African growth?
Bandara, A. 2012 Endogenous growth model
Unreliable results for magnitude of Chinese FDI flow on African growth, due to limited data.
There is a grow-ing impact of exports to China from sub-Saha-ran African coun-tries, though this trend has yet to overtake the influence of sub-Saharan exports to the RoW.
China’s Slow-down and Global Finan-cial Market Volatility: Is World Growth Losing Out?
Cashin, P., Mohaddes, K. & Raissi, M.
2016 Global GVAR model estimated for 26 countries/regions over the pe-riod 1981Q1 to 2013Q1.
They estimate that a 1% perma-nent negative Chinese GDP shock would have a 0.23% decrease in global growth.
Spillovers from China’s Growth Slow-down and Re-balancing to the ASEAN-5 Economies
Dizioli, A., J. Guajardo, V. Klyuev, R. Mano, and M. Raissi.
2016 ASEAN-5 GVAR -Private demand shock: lower investment due to financial stress;-Supply shock - lower productivity growth in the tradable goods sector;-Policy shock: changes in the government’s budget composition.
1) A negative GDP shock in China of 1% would prompt global growth to fall by 0.23%, and oil prices to fall by 3%.2) Countries with consider-able trade with China and which are commod-ity exporters experience the greatest spill-overs: Malaysia, Singapore, and Thailand experi-ence growth falling by 0.38%, 0.32% and 0.26%, respec-tively. 3) Real oil prices would stabilise 2% below the baseline. 4) Again Malay-sia, Singapore, and Thailand suf-fer the greatest falls in growth.
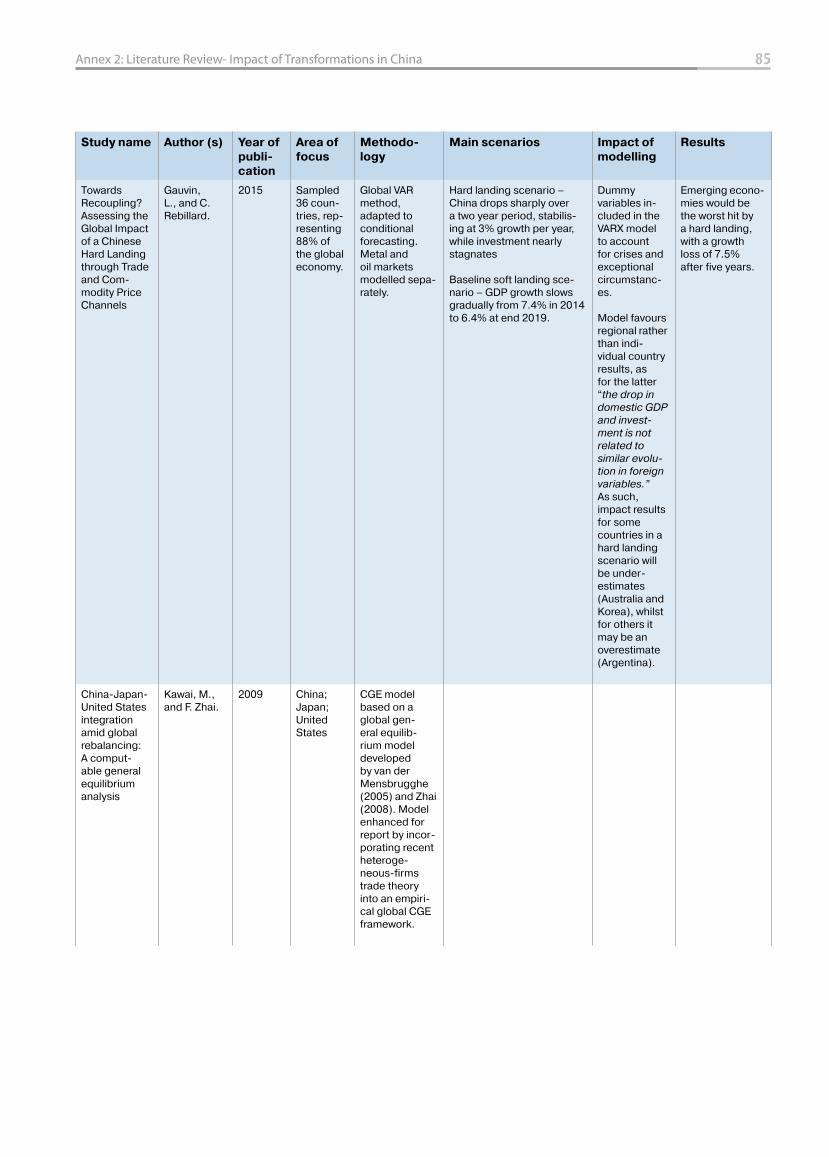
Study name Author (s) Year of
publi-
cation
Area of
focus
Methodo-
logy
Main scenarios Impact of
modelling
Results
Towards Recoupling? Assessing the Global Impact of a Chinese Hard Landing through Trade and Com-modity Price Channels
Gauvin, L., and C. Rebillard.
2015 Sampled 36 coun-tries, rep-resenting 88% of the global economy.
Global VAR method, adapted to conditional forecasting. Metal and oil markets modelled sepa-rately.
Hard landing scenario – China drops sharply over a two year period, stabilis-ing at 3% growth per year, while investment nearly stagnates
Baseline soft landing sce-nario – GDP growth slows gradually from 7.4% in 2014 to 6.4% at end 2019.
Dummy variables in-cluded in the VARX model to account for crises and exceptional circumstanc-es.
Model favours regional rather than indi-vidual country results, as for the latter “the drop in domestic GDP and invest-ment is not related to similar evolu-tion in foreign variables.” As such, impact results for some countries in a hard landing scenario will be under-estimates (Australia and Korea), whilst for others it may be an overestimate (Argentina).
Emerging econo-mies would be the worst hit by a hard landing, with a growth loss of 7.5% after five years.
China-Japan-United States integration amid global rebalancing: A comput-able general equilibrium analysis
Kawai, M., and F. Zhai.
2009 China; Japan; United States
CGE model based on a global gen-eral equilib-rium model developed by van der Mensbrugghe (2005) and Zhai (2008). Model enhanced for report by incor-porating recent heteroge-neous-firms trade theory into an empiri-cal global CGE framework.
85Annex 2: Literature Review- Impact of Transformations in China
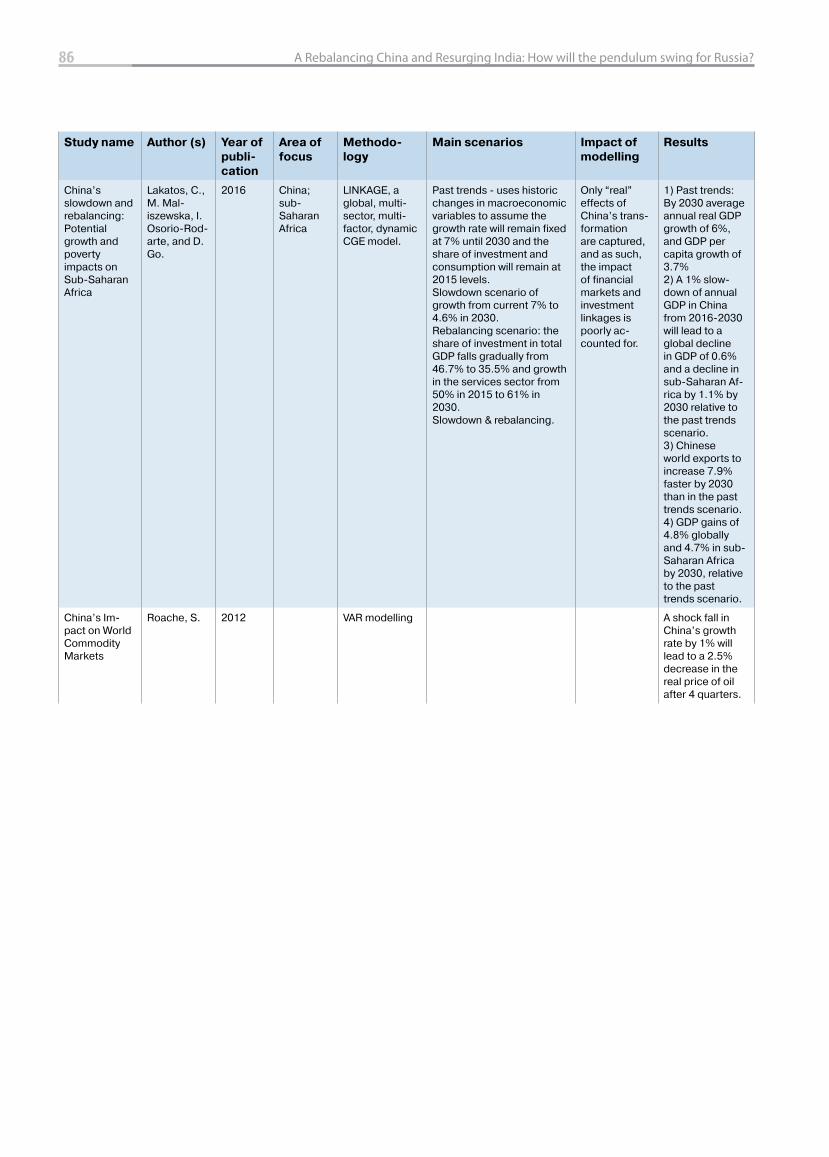
86 A Rebalancing China and Resurging India: How will the pendulum swing for Russia?
Study name Author (s) Year of
publi-
cation
Area of
focus
Methodo-
logy
Main scenarios Impact of
modelling
Results
China’s slowdown and rebalancing: Potential growth and poverty impacts on Sub-Saharan Africa
Lakatos, C., M. Mal-iszewska, I. Osorio-Rod-arte, and D. Go.
2016 China; sub-Saharan Africa
LINKAGE, a global, multi-sector, multi-factor, dynamic CGE model.
Past trends - uses historic changes in macroeconomic variables to assume the growth rate will remain fixed at 7% until 2030 and the share of investment and consumption will remain at 2015 levels.Slowdown scenario of growth from current 7% to 4.6% in 2030.Rebalancing scenario: the share of investment in total GDP falls gradually from 46.7% to 35.5% and growth in the services sector from 50% in 2015 to 61% in 2030. Slowdown & rebalancing.
Only “real” effects of China’s trans-formation are captured, and as such, the impact of financial markets and investment linkages is poorly ac-counted for.
1) Past trends: By 2030 average annual real GDP growth of 6%, and GDP per capita growth of 3.7%2) A 1% slow-down of annual GDP in China from 2016-2030 will lead to a global decline in GDP of 0.6% and a decline in sub-Saharan Af-rica by 1.1% by 2030 relative to the past trends scenario. 3) Chinese world exports to increase 7.9% faster by 2030 than in the past trends scenario.4) GDP gains of 4.8% globally and 4.7% in sub-Saharan Africa by 2030, relative to the past trends scenario.
China’s Im-pact on World Commodity Markets
Roache, S. 2012 VAR modelling A shock fall in China’s growth rate by 1% will lead to a 2.5% decrease in the real price of oil after 4 quarters.
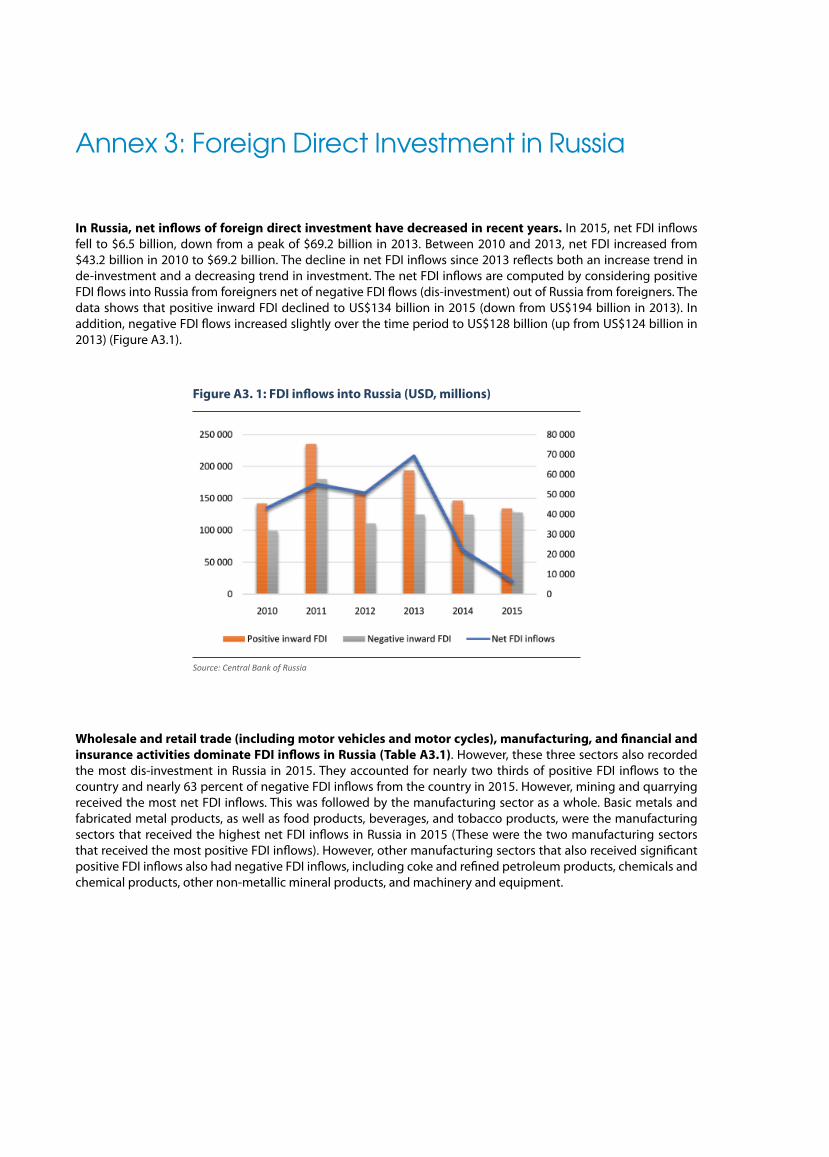
Annex 3: Foreign Direct Investment in Russia
In Russia, net infl ows of foreign direct investment have decreased in recent years. In 2015, net FDI infl ows fell to $6.5 billion, down from a peak of $69.2 billion in 2013. Between 2010 and 2013, net FDI increased from $43.2 billion in 2010 to $69.2 billion. The decline in net FDI infl ows since 2013 refl ects both an increase trend in de-investment and a decreasing trend in investment. The net FDI infl ows are computed by considering positive FDI fl ows into Russia from foreigners net of negative FDI fl ows (dis-investment) out of Russia from foreigners. The data shows that positive inward FDI declined to US$134 billion in 2015 (down from US$194 billion in 2013). In addition, negative FDI fl ows increased slightly over the time period to US$128 billion (up from US$124 billion in 2013) (Figure A3.1).
Wholesale and retail trade (including motor vehicles and motor cycles), manufacturing, and fi nancial and
insurance activities dominate FDI infl ows in Russia (Table A3.1). However, these three sectors also recorded the most dis-investment in Russia in 2015. They accounted for nearly two thirds of positive FDI infl ows to the country and nearly 63 percent of negative FDI infl ows from the country in 2015. However, mining and quarrying received the most net FDI infl ows. This was followed by the manufacturing sector as a whole. Basic metals and fabricated metal products, as well as food products, beverages, and tobacco products, were the manufacturing sectors that received the highest net FDI infl ows in Russia in 2015 (These were the two manufacturing sectors that received the most positive FDI infl ows). However, other manufacturing sectors that also received signifi cant positive FDI infl ows also had negative FDI infl ows, including coke and refi ned petroleum products, chemicals and chemical products, other non-metallic mineral products, and machinery and equipment.
Figure A3. 1: FDI infl ows into Russia (USD, millions)
Source: Central Bank of Russia
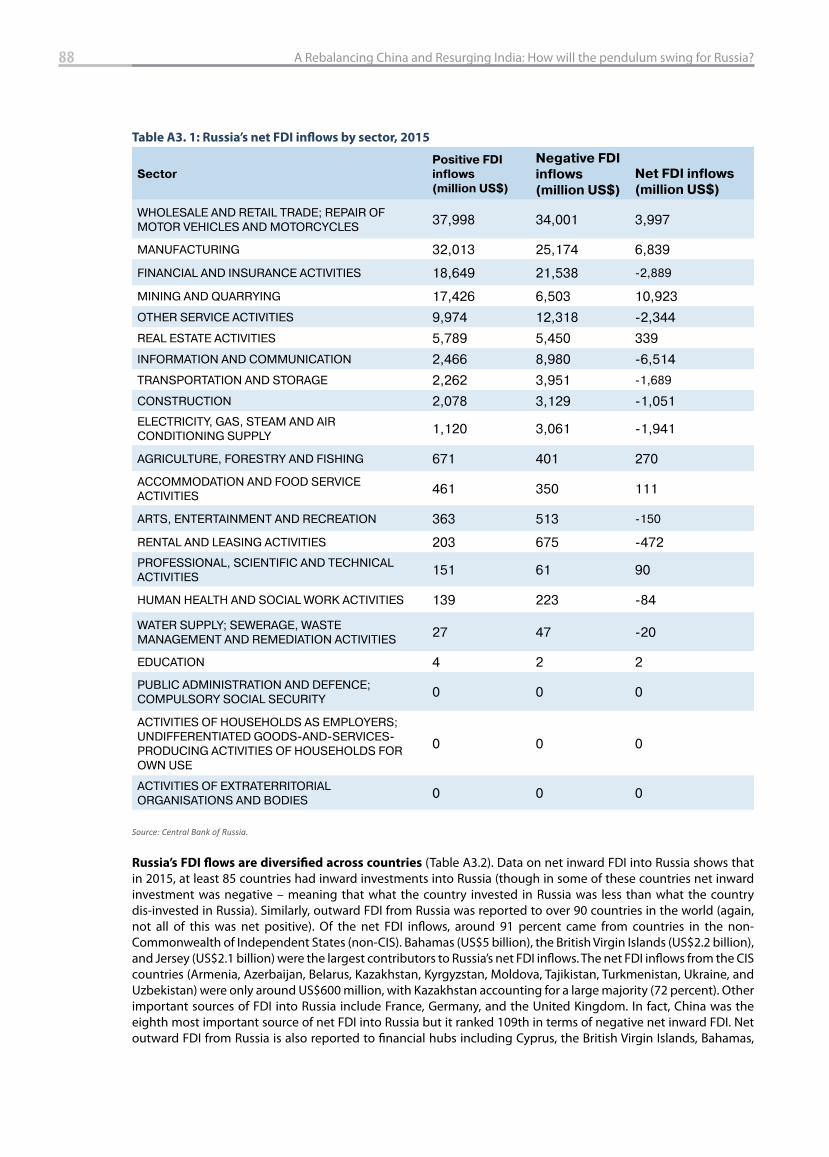
88 A Rebalancing China and Resurging India: How will the pendulum swing for Russia?
Table A3. 1: Russia’s net FDI infl ows by sector, 2015
Sector
Positive FDI
inflows
(million US$)
Negative FDI
inflows
(million US$)
Net FDI inflows
(million US$)
WHOLESALE AND RETAIL TRADE; REPAIR OF MOTOR VEHICLES AND MOTORCYCLES 37,998 34,001 3,997
MANUFACTURING 32,013 25,174 6,839
FINANCIAL AND INSURANCE ACTIVITIES 18,649 21,538 -2,889
MINING AND QUARRYING 17,426 6,503 10,923
OTHER SERVICE ACTIVITIES 9,974 12,318 -2,344
REAL ESTATE ACTIVITIES 5,789 5,450 339
INFORMATION AND COMMUNICATION 2,466 8,980 -6,514
TRANSPORTATION AND STORAGE 2,262 3,951 -1,689
CONSTRUCTION 2,078 3,129 -1,051
ELECTRICITY, GAS, STEAM AND AIR CONDITIONING SUPPLY 1,120 3,061 -1,941
AGRICULTURE, FORESTRY AND FISHING 671 401 270
ACCOMMODATION AND FOOD SERVICE ACTIVITIES 461 350 111
ARTS, ENTERTAINMENT AND RECREATION 363 513 -150
RENTAL AND LEASING ACTIVITIES 203 675 -472
PROFESSIONAL, SCIENTIFIC AND TECHNICAL ACTIVITIES 151 61 90
HUMAN HEALTH AND SOCIAL WORK ACTIVITIES 139 223 -84
WATER SUPPLY; SEWERAGE, WASTE MANAGEMENT AND REMEDIATION ACTIVITIES 27 47 -20
EDUCATION 4 2 2
PUBLIC ADMINISTRATION AND DEFENCE; COMPULSORY SOCIAL SECURITY 0 0 0
ACTIVITIES OF HOUSEHOLDS AS EMPLOYERS; UNDIFFERENTIATED GOODS-AND-SERVICES-PRODUCING ACTIVITIES OF HOUSEHOLDS FOR OWN USE
0 0 0
ACTIVITIES OF EXTRATERRITORIAL ORGANISATIONS AND BODIES 0 0 0
Source: Central Bank of Russia.
Russia’s FDI fl ows are diversifi ed across countries (Table A3.2). Data on net inward FDI into Russia shows that in 2015, at least 85 countries had inward investments into Russia (though in some of these countries net inward investment was negative – meaning that what the country invested in Russia was less than what the country dis-invested in Russia). Similarly, outward FDI from Russia was reported to over 90 countries in the world (again, not all of this was net positive). Of the net FDI infl ows, around 91 percent came from countries in the non-Commonwealth of Independent States (non-CIS). Bahamas (US$5 billion), the British Virgin Islands (US$2.2 billion), and Jersey (US$2.1 billion) were the largest contributors to Russia’s net FDI infl ows. The net FDI infl ows from the CIS countries (Armenia, Azerbaijan, Belarus, Kazakhstan, Kyrgyzstan, Moldova, Tajikistan, Turkmenistan, Ukraine, and Uzbekistan) were only around US$600 million, with Kazakhstan accounting for a large majority (72 percent). Other important sources of FDI into Russia include France, Germany, and the United Kingdom. In fact, China was the eighth most important source of net FDI into Russia but it ranked 109th in terms of negative net inward FDI. Net outward FDI from Russia is also reported to fi nancial hubs including Cyprus, the British Virgin Islands, Bahamas,
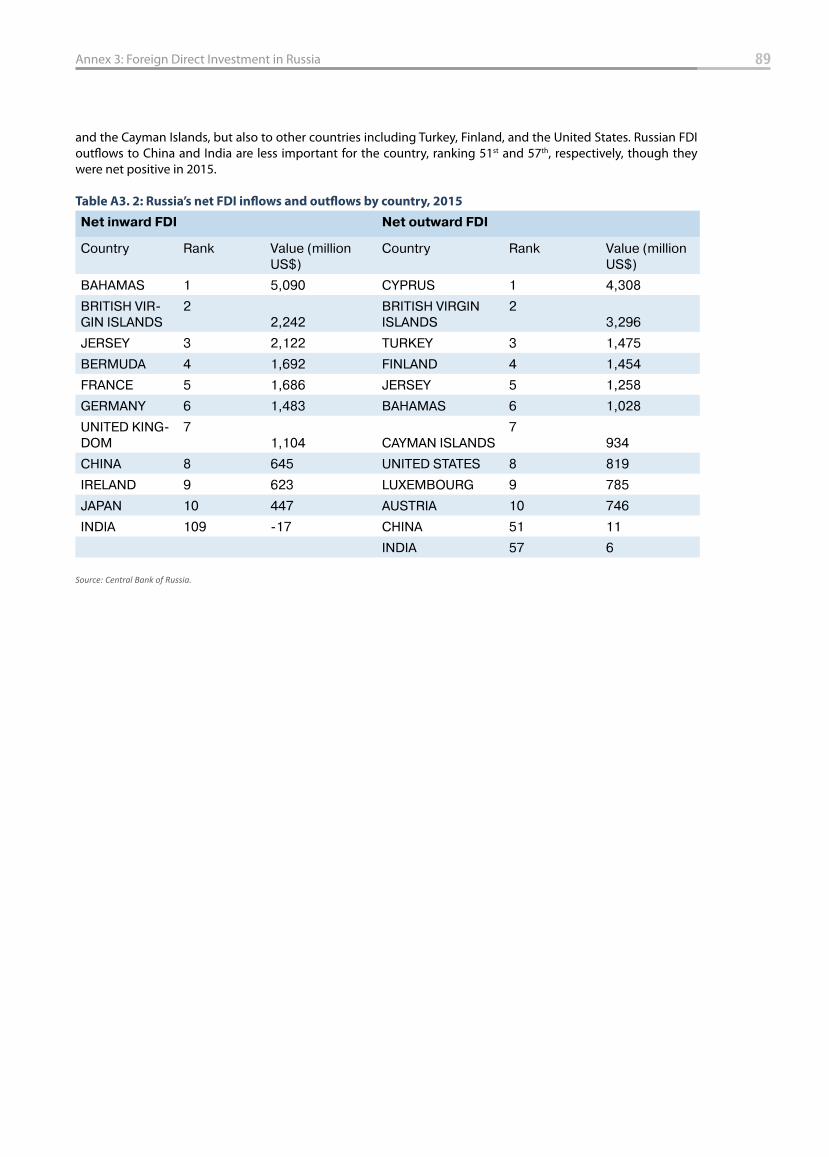
and the Cayman Islands, but also to other countries including Turkey, Finland, and the United States. Russian FDI outfl ows to China and India are less important for the country, ranking 51st and 57th, respectively, though they were net positive in 2015.
Table A3. 2: Russia’s net FDI infl ows and outfl ows by country, 2015
Net inward FDI Net outward FDI
Country Rank Value (million US$)
Country Rank Value (million US$)
BAHAMAS 1 5,090 CYPRUS 1 4,308
BRITISH VIR-GIN ISLANDS
22,242
BRITISH VIRGIN ISLANDS
23,296
JERSEY 3 2,122 TURKEY 3 1,475
BERMUDA 4 1,692 FINLAND 4 1,454
FRANCE 5 1,686 JERSEY 5 1,258
GERMANY 6 1,483 BAHAMAS 6 1,028
UNITED KING-DOM
71,104 CAYMAN ISLANDS
7934
CHINA 8 645 UNITED STATES 8 819
IRELAND 9 623 LUXEMBOURG 9 785
JAPAN 10 447 AUSTRIA 10 746
INDIA 109 -17 CHINA 51 11
INDIA 57 6
Source: Central Bank of Russia.
89Annex 3: Foreign Direct Investment in Russia

90 A Rebalancing China and Resurging India: How will the pendulum swing for Russia?
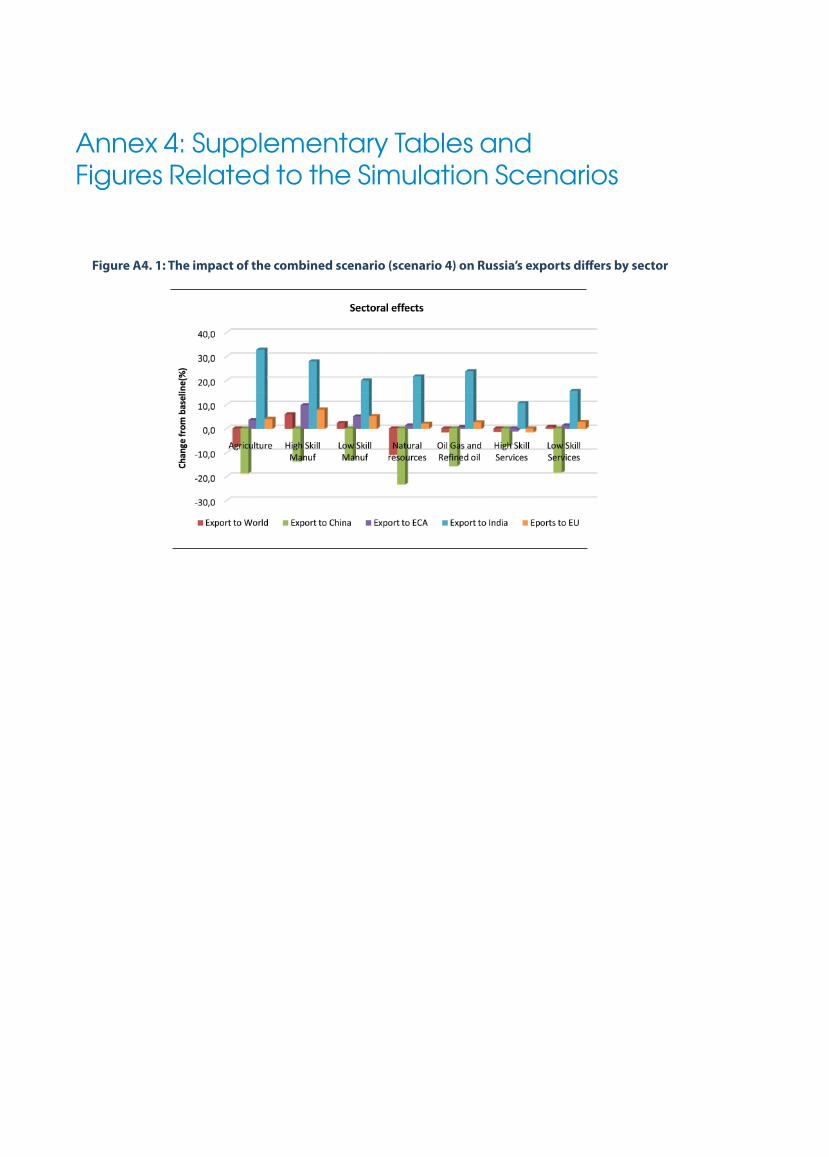
Annex 4: Supplementary Tables and Figures Related to the Simulation Scenarios
Figure A4. 1: The impact of the combined scenario (scenario 4) on Russia’s exports diff ers by sector

92 A Rebalancing China and Resurging India: How will the pendulum swing for Russia?
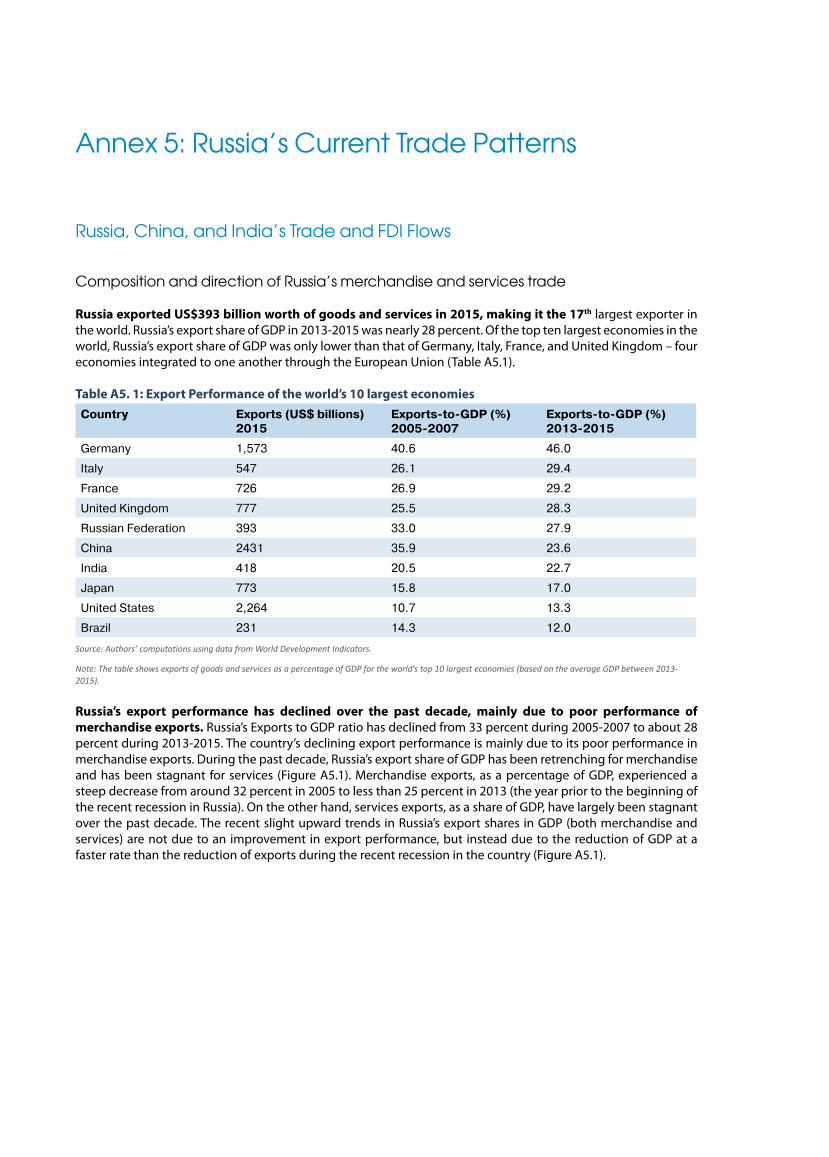
Annex 5: Russia’s Current Trade Patterns
Russia, China, and India’s Trade and FDI Flows
Composition and direction of Russia’s merchandise and services trade
Russia exported US$393 billion worth of goods and services in 2015, making it the 17th largest exporter in the world. Russia’s export share of GDP in 2013-2015 was nearly 28 percent. Of the top ten largest economies in the world, Russia’s export share of GDP was only lower than that of Germany, Italy, France, and United Kingdom – four economies integrated to one another through the European Union (Table A5.1).
Table A5. 1: Export Performance of the world’s 10 largest economies
Country Exports (US$ billions)
2015
Exports-to-GDP (%)
2005-2007
Exports-to-GDP (%)
2013-2015
Germany 1,573 40.6 46.0
Italy 547 26.1 29.4
France 726 26.9 29.2
United Kingdom 777 25.5 28.3
Russian Federation 393 33.0 27.9
China 2431 35.9 23.6
India 418 20.5 22.7
Japan 773 15.8 17.0
United States 2,264 10.7 13.3
Brazil 231 14.3 12.0
Source: Authors’ computations using data from World Development Indicators.
Note: The table shows exports of goods and services as a percentage of GDP for the world’s top 10 largest economies (based on the average GDP between 2013-2015).
Russia’s export performance has declined over the past decade, mainly due to poor performance of
merchandise exports. Russia’s Exports to GDP ratio has declined from 33 percent during 2005-2007 to about 28 percent during 2013-2015. The country’s declining export performance is mainly due to its poor performance in merchandise exports. During the past decade, Russia’s export share of GDP has been retrenching for merchandise and has been stagnant for services (Figure A5.1). Merchandise exports, as a percentage of GDP, experienced a steep decrease from around 32 percent in 2005 to less than 25 percent in 2013 (the year prior to the beginning of the recent recession in Russia). On the other hand, services exports, as a share of GDP, have largely been stagnant over the past decade. The recent slight upward trends in Russia’s export shares in GDP (both merchandise and services) are not due to an improvement in export performance, but instead due to the reduction of GDP at a faster rate than the reduction of exports during the recent recession in the country (Figure A5.1).
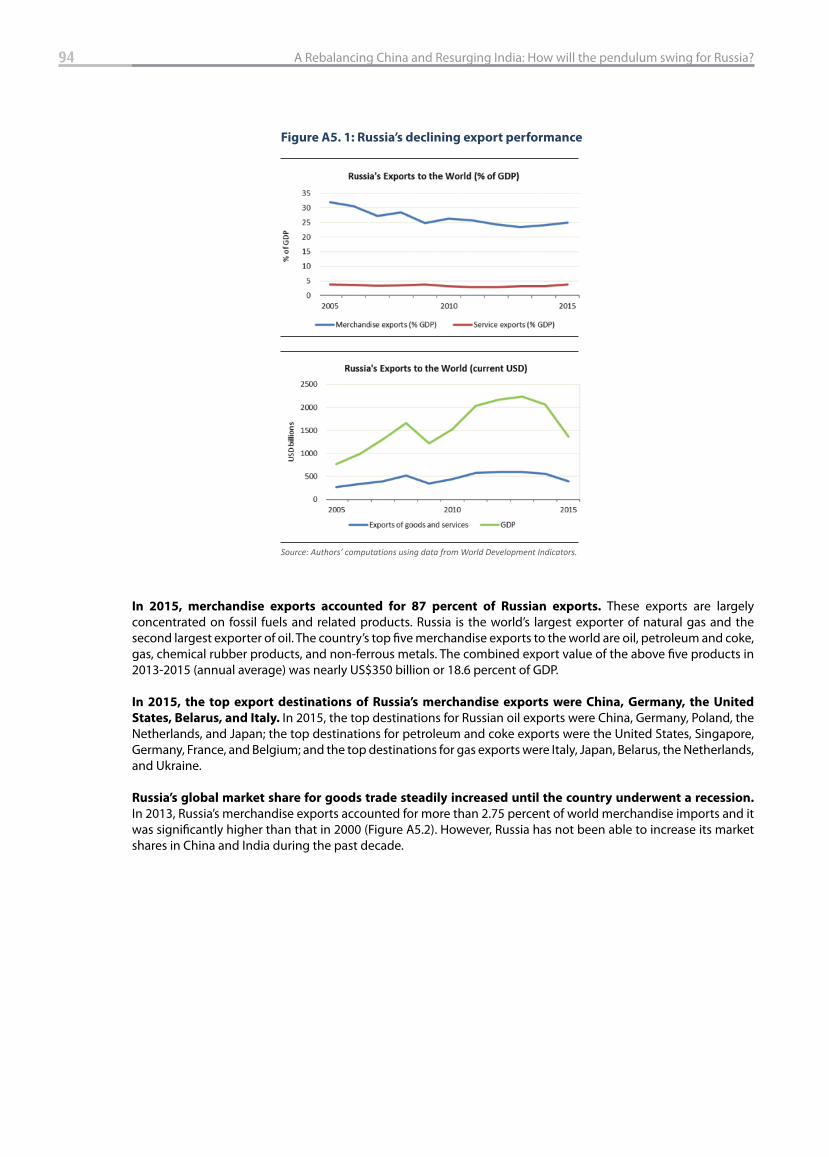
94 A Rebalancing China and Resurging India: How will the pendulum swing for Russia?
Figure A5. 1: Russia’s declining export performance
Source: Authors’ computations using data from World Development Indicators.
In 2015, merchandise exports accounted for 87 percent of Russian exports. These exports are largely concentrated on fossil fuels and related products. Russia is the world’s largest exporter of natural gas and the second largest exporter of oil. The country’s top fi ve merchandise exports to the world are oil, petroleum and coke, gas, chemical rubber products, and non-ferrous metals. The combined export value of the above fi ve products in 2013-2015 (annual average) was nearly US$350 billion or 18.6 percent of GDP.
In 2015, the top export destinations of Russia’s merchandise exports were China, Germany, the United
States, Belarus, and Italy. In 2015, the top destinations for Russian oil exports were China, Germany, Poland, the Netherlands, and Japan; the top destinations for petroleum and coke exports were the United States, Singapore, Germany, France, and Belgium; and the top destinations for gas exports were Italy, Japan, Belarus, the Netherlands, and Ukraine.
Russia’s global market share for goods trade steadily increased until the country underwent a recession. In 2013, Russia’s merchandise exports accounted for more than 2.75 percent of world merchandise imports and it was signifi cantly higher than that in 2000 (Figure A5.2). However, Russia has not been able to increase its market shares in China and India during the past decade.
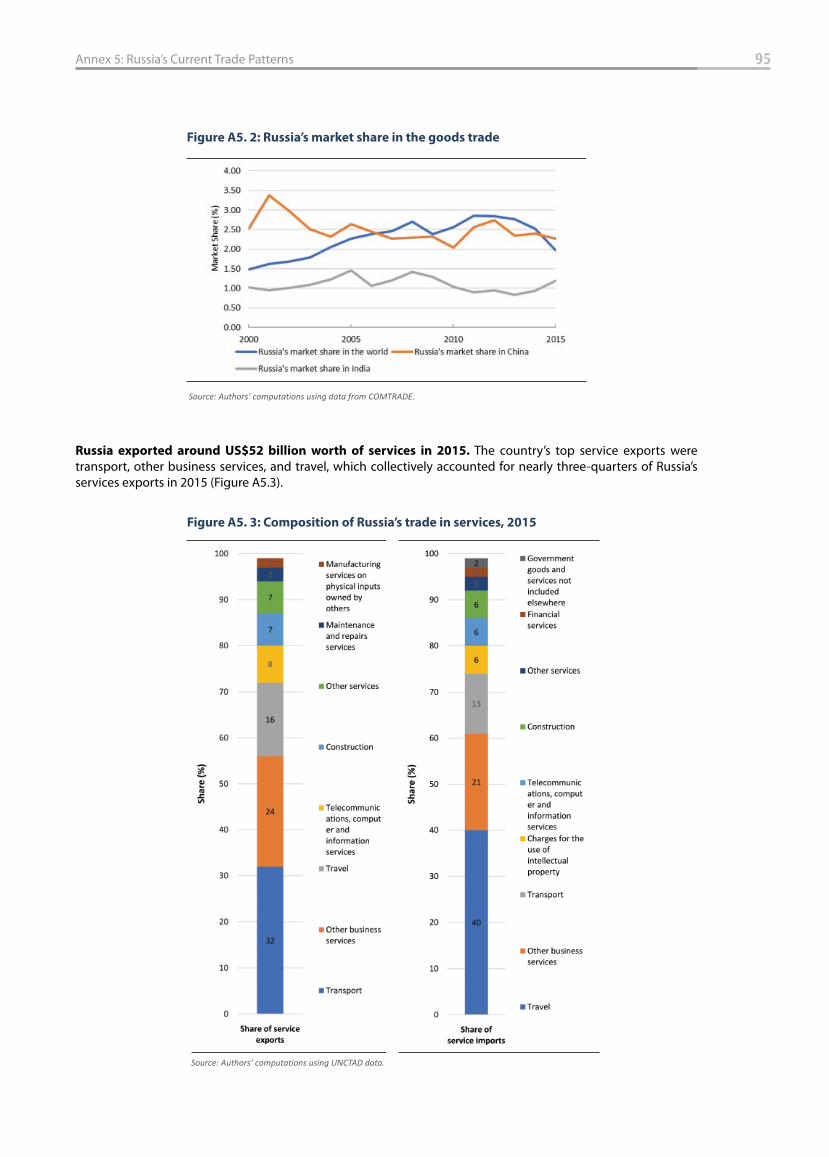
Russia exported around US$52 billion worth of services in 2015. The country’s top service exports were transport, other business services, and travel, which collectively accounted for nearly three-quarters of Russia’s services exports in 2015 (Figure A5.3).
Figure A5. 3: Composition of Russia’s trade in services, 2015
Source: Authors’ computations using UNCTAD data.
Figure A5. 2: Russia’s market share in the goods trade
Source: Authors’ computations using data from COMTRADE.
95Annex 5: Russia’s Current Trade Patterns
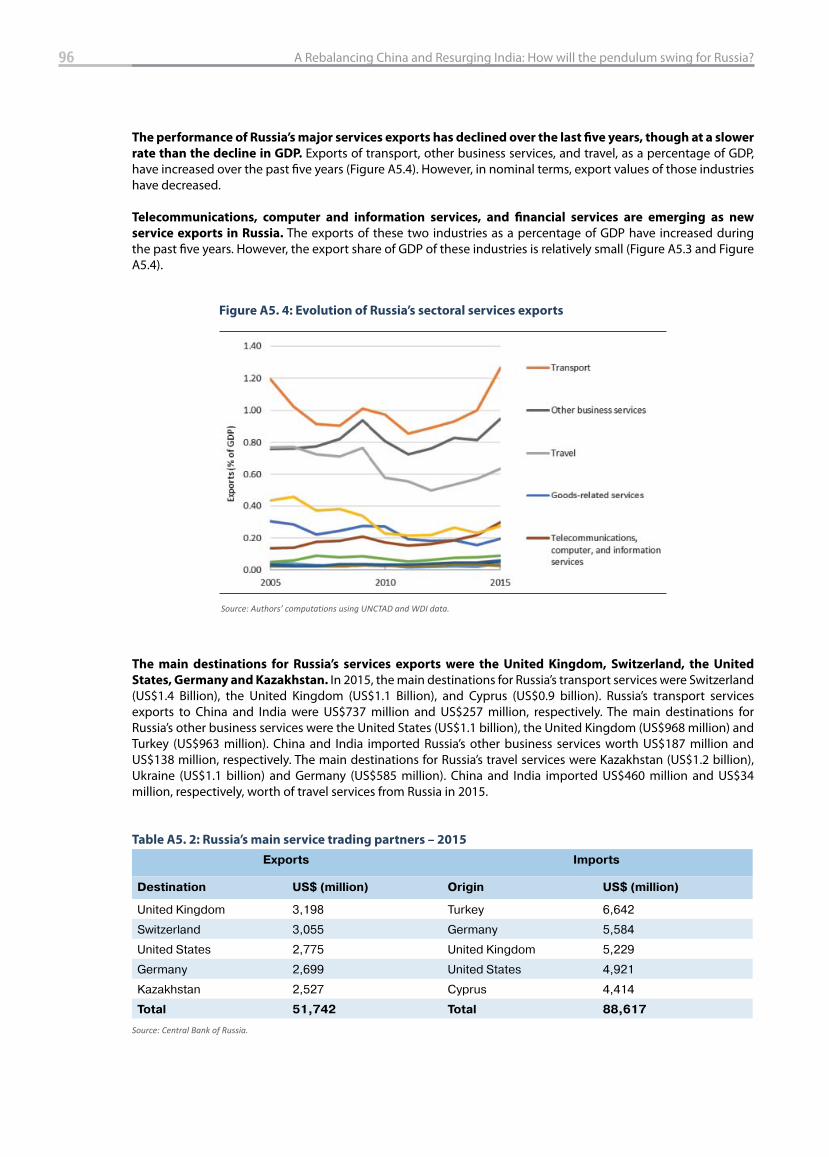
96 A Rebalancing China and Resurging India: How will the pendulum swing for Russia?
The performance of Russia’s major services exports has declined over the last fi ve years, though at a slower
rate than the decline in GDP. Exports of transport, other business services, and travel, as a percentage of GDP, have increased over the past fi ve years (Figure A5.4). However, in nominal terms, export values of those industries have decreased.
Telecommunications, computer and information services, and fi nancial services are emerging as new
service exports in Russia. The exports of these two industries as a percentage of GDP have increased during the past fi ve years. However, the export share of GDP of these industries is relatively small (Figure A5.3 and Figure A5.4).
The main destinations for Russia’s services exports were the United Kingdom, Switzerland, the United
States, Germany and Kazakhstan. In 2015, the main destinations for Russia’s transport services were Switzerland (US$1.4 Billion), the United Kingdom (US$1.1 Billion), and Cyprus (US$0.9 billion). Russia’s transport services exports to China and India were US$737 million and US$257 million, respectively. The main destinations for Russia’s other business services were the United States (US$1.1 billion), the United Kingdom (US$968 million) and Turkey (US$963 million). China and India imported Russia’s other business services worth US$187 million and US$138 million, respectively. The main destinations for Russia’s travel services were Kazakhstan (US$1.2 billion), Ukraine (US$1.1 billion) and Germany (US$585 million). China and India imported US$460 million and US$34 million, respectively, worth of travel services from Russia in 2015.
Table A5. 2: Russia’s main service trading partners – 2015
Exports Imports
Destination US$ (million) Origin US$ (million)
United Kingdom 3,198 Turkey 6,642
Switzerland 3,055 Germany 5,584
United States 2,775 United Kingdom 5,229
Germany 2,699 United States 4,921
Kazakhstan 2,527 Cyprus 4,414
Total 51,742 Total 88,617
Source: Central Bank of Russia.
Figure A5. 4: Evolution of Russia’s sectoral services exports
Source: Authors’ computations using UNCTAD and WDI data.
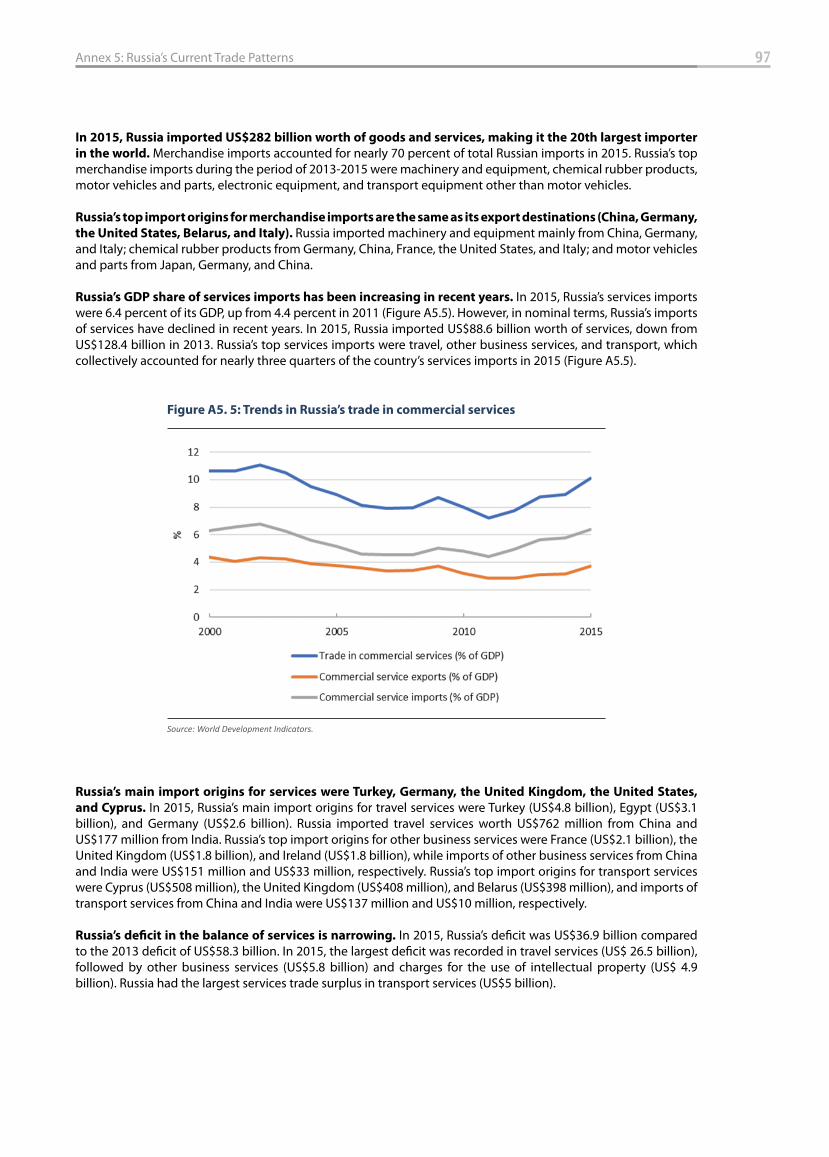
97Annex 5: Russia’s Current Trade Patterns
In 2015, Russia imported US$282 billion worth of goods and services, making it the 20th largest importer
in the world. Merchandise imports accounted for nearly 70 percent of total Russian imports in 2015. Russia’s top merchandise imports during the period of 2013-2015 were machinery and equipment, chemical rubber products, motor vehicles and parts, electronic equipment, and transport equipment other than motor vehicles.
Russia’s top import origins for merchandise imports are the same as its export destinations (China, Germany,
the United States, Belarus, and Italy). Russia imported machinery and equipment mainly from China, Germany, and Italy; chemical rubber products from Germany, China, France, the United States, and Italy; and motor vehicles and parts from Japan, Germany, and China.
Russia’s GDP share of services imports has been increasing in recent years. In 2015, Russia’s services imports were 6.4 percent of its GDP, up from 4.4 percent in 2011 (Figure A5.5). However, in nominal terms, Russia’s imports of services have declined in recent years. In 2015, Russia imported US$88.6 billion worth of services, down from US$128.4 billion in 2013. Russia’s top services imports were travel, other business services, and transport, which collectively accounted for nearly three quarters of the country’s services imports in 2015 (Figure A5.5).
Russia’s main import origins for services were Turkey, Germany, the United Kingdom, the United States,
and Cyprus. In 2015, Russia’s main import origins for travel services were Turkey (US$4.8 billion), Egypt (US$3.1 billion), and Germany (US$2.6 billion). Russia imported travel services worth US$762 million from China and US$177 million from India. Russia’s top import origins for other business services were France (US$2.1 billion), the United Kingdom (US$1.8 billion), and Ireland (US$1.8 billion), while imports of other business services from China and India were US$151 million and US$33 million, respectively. Russia’s top import origins for transport services were Cyprus (US$508 million), the United Kingdom (US$408 million), and Belarus (US$398 million), and imports of transport services from China and India were US$137 million and US$10 million, respectively.
Russia’s defi cit in the balance of services is narrowing. In 2015, Russia’s defi cit was US$36.9 billion compared to the 2013 defi cit of US$58.3 billion. In 2015, the largest defi cit was recorded in travel services (US$ 26.5 billion), followed by other business services (US$5.8 billion) and charges for the use of intellectual property (US$ 4.9 billion). Russia had the largest services trade surplus in transport services (US$5 billion).
Figure A5. 5: Trends in Russia’s trade in commercial services
Source: World Development Indicators.
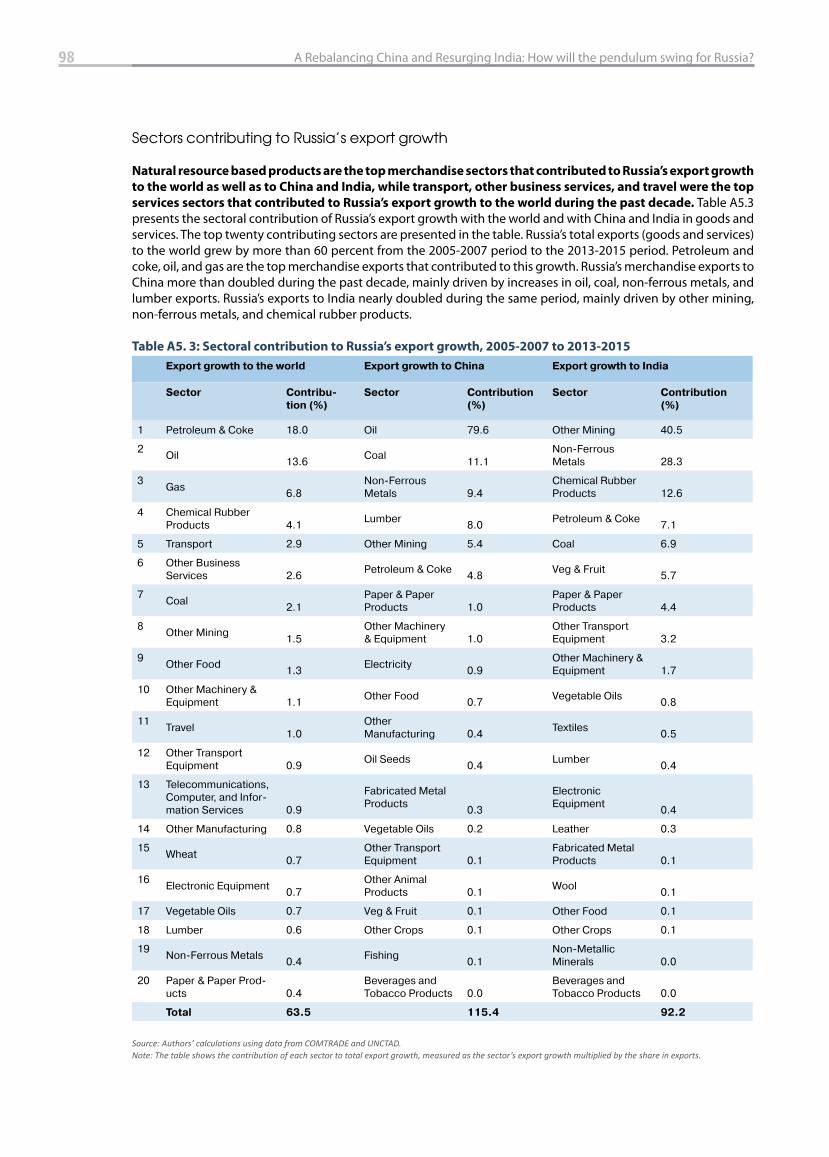
98 A Rebalancing China and Resurging India: How will the pendulum swing for Russia?
Sectors contributing to Russia’s export growth
Natural resource based products are the top merchandise sectors that contributed to Russia’s export growth
to the world as well as to China and India, while transport, other business services, and travel were the top
services sectors that contributed to Russia’s export growth to the world during the past decade. Table A5.3 presents the sectoral contribution of Russia’s export growth with the world and with China and India in goods and services. The top twenty contributing sectors are presented in the table. Russia’s total exports (goods and services) to the world grew by more than 60 percent from the 2005-2007 period to the 2013-2015 period. Petroleum and coke, oil, and gas are the top merchandise exports that contributed to this growth. Russia’s merchandise exports to China more than doubled during the past decade, mainly driven by increases in oil, coal, non-ferrous metals, and lumber exports. Russia’s exports to India nearly doubled during the same period, mainly driven by other mining, non-ferrous metals, and chemical rubber products.
Table A5. 3: Sectoral contribution to Russia’s export growth, 2005-2007 to 2013-2015
Export growth to the world Export growth to China Export growth to India
Sector Contribu-
tion (%)
Sector Contribution
(%)
Sector Contribution
(%)
1 Petroleum & Coke 18.0 Oil 79.6 Other Mining 40.5
2Oil
13.6Coal
11.1Non-Ferrous Metals 28.3
3Gas
6.8Non-Ferrous Metals 9.4
Chemical Rubber Products 12.6
4 Chemical Rubber Products 4.1
Lumber8.0
Petroleum & Coke7.1
5 Transport 2.9 Other Mining 5.4 Coal 6.9
6 Other Business Services 2.6
Petroleum & Coke4.8
Veg & Fruit5.7
7Coal
2.1Paper & Paper Products 1.0
Paper & Paper Products 4.4
8Other Mining
1.5Other Machinery & Equipment 1.0
Other Transport Equipment 3.2
9Other Food
1.3Electricity
0.9Other Machinery & Equipment 1.7
10 Other Machinery & Equipment 1.1
Other Food0.7
Vegetable Oils0.8
11Travel
1.0Other Manufacturing 0.4
Textiles0.5
12 Other Transport Equipment 0.9
Oil Seeds0.4
Lumber0.4
13 Telecommunications, Computer, and Infor-mation Services 0.9
Fabricated Metal Products
0.3
Electronic Equipment
0.4
14 Other Manufacturing 0.8 Vegetable Oils 0.2 Leather 0.3
15Wheat
0.7Other Transport Equipment 0.1
Fabricated Metal Products 0.1
16Electronic Equipment
0.7Other Animal Products 0.1
Wool0.1
17 Vegetable Oils 0.7 Veg & Fruit 0.1 Other Food 0.1
18 Lumber 0.6 Other Crops 0.1 Other Crops 0.1
19Non-Ferrous Metals
0.4Fishing
0.1Non-Metallic Minerals 0.0
20 Paper & Paper Prod-ucts 0.4
Beverages and Tobacco Products 0.0
Beverages and Tobacco Products 0.0
Total 63.5 115.4 92.2
Source: Authors’ calculations using data from COMTRADE and UNCTAD.Note: The table shows the contribution of each sector to total export growth, measured as the sector’s export growth multiplied by the share in exports.
Annex 6: Presentation of the CGE model
Static module
The following sections provide an overview of the key relationships in the CGE model; a detailed discussion of the model can be found in Van der Mensbrugghe (2017)16. The model is developed from the neoclassical structural modeling approach presented in de Melo et al. (1982)17. The underlying assumptions are mainly those encountered in the standard CGE literature (de Melo and Tarr, 1992). Therefore, only three key aspects are laid out in this note: (i) the production function; (ii) the modeling of household income and consumption; and (iii) international trade.
The production function
The model considers an economy with eight sectors producing eight commodities. All sectors are assumed to produce under conditions of constant returns to scale and perfect competition, implying that prices equal the marginal costs of output. Producers maximize their profi ts by minimizing their unit variable cost under the constraint of a multi-level production function (illustrated in Figure A6.1). At the top level, output is obtained by combining value added and the intermediate aggregates, following a Leontief production technology. Therefore, any policy aff ecting a particular sector would aff ect that sector directly, but also indirectly aff ect them using the output of the sector as intermediate consumption.
At the second level, the intermediate aggregates are obtained by combining all products in fi xed proportions
(Leontief structure), and total value added is obtained by aggregating the primary factors (capital, labor, land and natural resources) and energy using a nested structure. At each nest, fi rms make price-sensitive decisions regarding the inputs into production. For example, in the fi rst nest, capital and skilled labor are combined into a bundle (KS bundle) based on the rental price of capital relative to the wage for skilled workers. An increase in wages would cause fi rms to substitute away from skilled labor towards capital. Using a nest allows the model to better capture the production decisions made by fi rms by tailoring the degree of sensitivity of each decision to relative prices.
16 Interested readers can fi nd the model’s equations in this reference.17 The theoretical framework relies on neoclassical assumptions of constant returns to scale and perfect competition, where fi rms maximize profi ts to determine output supply and factor demands.
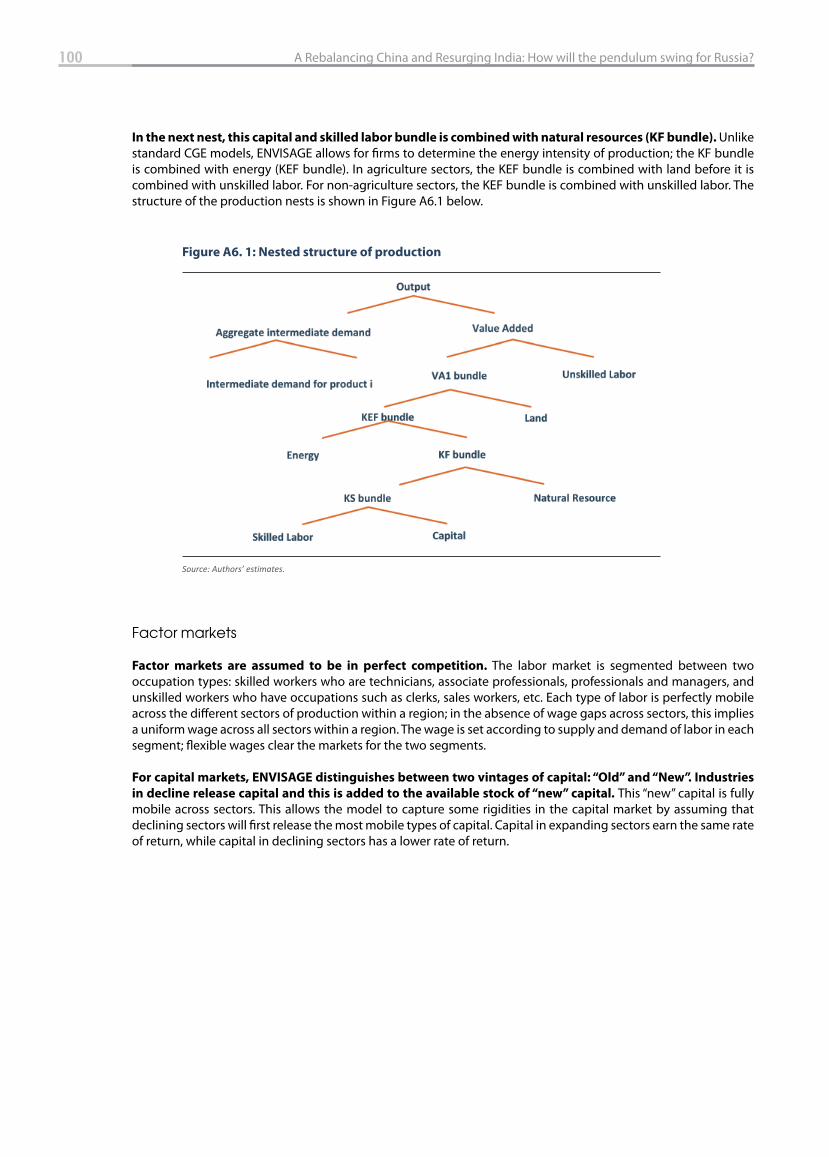
100 A Rebalancing China and Resurging India: How will the pendulum swing for Russia?
In the next nest, this capital and skilled labor bundle is combined with natural resources (KF bundle). Unlike standard CGE models, ENVISAGE allows for fi rms to determine the energy intensity of production; the KF bundle is combined with energy (KEF bundle). In agriculture sectors, the KEF bundle is combined with land before it is combined with unskilled labor. For non-agriculture sectors, the KEF bundle is combined with unskilled labor. The structure of the production nests is shown in Figure A6.1 below.
Factor markets
Factor markets are assumed to be in perfect competition. The labor market is segmented between two occupation types: skilled workers who are technicians, associate professionals, professionals and managers, and unskilled workers who have occupations such as clerks, sales workers, etc. Each type of labor is perfectly mobile across the diff erent sectors of production within a region; in the absence of wage gaps across sectors, this implies a uniform wage across all sectors within a region. The wage is set according to supply and demand of labor in each segment; fl exible wages clear the markets for the two segments.
For capital markets, ENVISAGE distinguishes between two vintages of capital: “Old” and “New”. Industries
in decline release capital and this is added to the available stock of “new” capital. This “new” capital is fully mobile across sectors. This allows the model to capture some rigidities in the capital market by assuming that declining sectors will fi rst release the most mobile types of capital. Capital in expanding sectors earn the same rate of return, while capital in declining sectors has a lower rate of return.
Figure A6. 1: Nested structure of production
Source: Authors’ estimates.
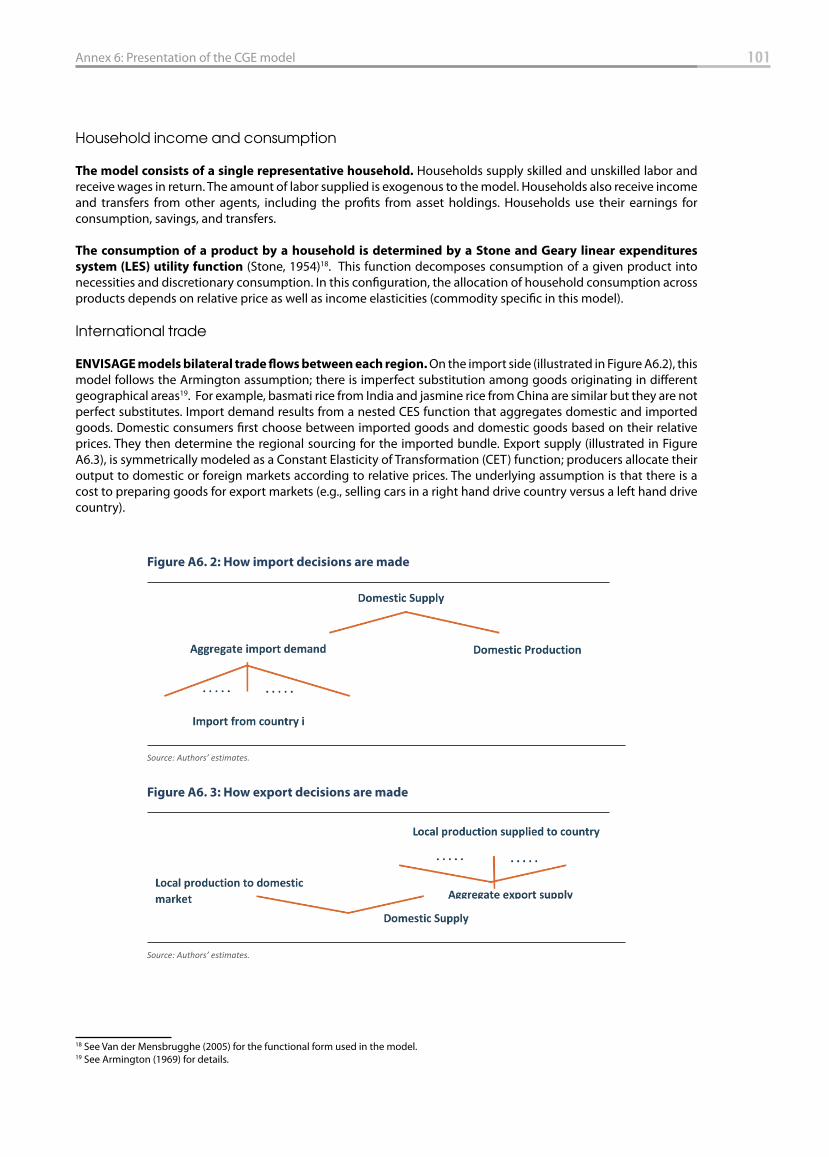
101Annex 6: Presentation of the CGE model
Household income and consumption
The model consists of a single representative household. Households supply skilled and unskilled labor and receive wages in return. The amount of labor supplied is exogenous to the model. Households also receive income and transfers from other agents, including the profi ts from asset holdings. Households use their earnings for consumption, savings, and transfers.
The consumption of a product by a household is determined by a Stone and Geary linear expenditures
system (LES) utility function (Stone, 1954)18. This function decomposes consumption of a given product into necessities and discretionary consumption. In this confi guration, the allocation of household consumption across products depends on relative price as well as income elasticities (commodity specifi c in this model).
International trade
ENVISAGE models bilateral trade fl ows between each region. On the import side (illustrated in Figure A6.2), this model follows the Armington assumption; there is imperfect substitution among goods originating in diff erent geographical areas19. For example, basmati rice from India and jasmine rice from China are similar but they are not perfect substitutes. Import demand results from a nested CES function that aggregates domestic and imported goods. Domestic consumers fi rst choose between imported goods and domestic goods based on their relative prices. They then determine the regional sourcing for the imported bundle. Export supply (illustrated in Figure A6.3), is symmetrically modeled as a Constant Elasticity of Transformation (CET) function; producers allocate their output to domestic or foreign markets according to relative prices. The underlying assumption is that there is a cost to preparing goods for export markets (e.g., selling cars in a right hand drive country versus a left hand drive country).
18 See Van der Mensbrugghe (2005) for the functional form used in the model.19 See Armington (1969) for details.
Figure A6. 2: How import decisions are made
Source: Authors’ estimates.
Figure A6. 3: How export decisions are made
Source: Authors’ estimates.

102 A Rebalancing China and Resurging India: How will the pendulum swing for Russia?
Each bilateral trade node is associated with four prices: the price received by producers (farm-gate prices), border price of exports (Free On Board), border price of imports (Cost Insurance Freight), and tariff -inclusive price of imports. Distinguishing between these four prices is needed because consumers make purchasing decisions based on prices that include tariff s, trade, and transport margins, while producers make production decisions based on prices excluding these items.
Unlike single country models, the prices for goods and services traded (imported and exported) with the
rest of the world are endogenous. World prices adjust to clear the global market for traded goods and services. Similarly, for non-traded goods, domestic prices adjust to clear the domestic market (domestic supply meets domestic demand).

103WB report

104 A Rebalancing China and Resurging India: How will the pendulum swing for Russia?