Embed Size (px)
Citation preview
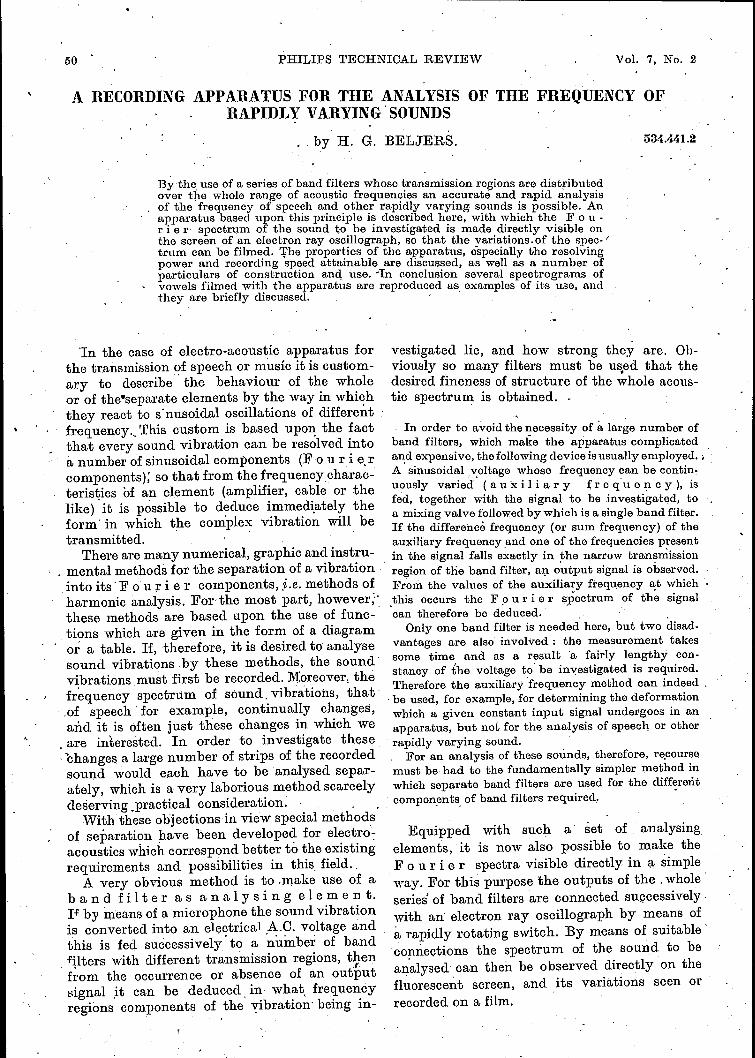
50 PHILIPS TECHNICAL REVIEW Vol. 7, No. 2
A RECORDING APPARATUS FOR THE ANALYSIS OF THE FREQUENCY O.FRAPIDLY VARYING'SOUNDS
by H. G. BELJERS. 531A~1.2
By the. use of a series of band filters whose transmission regions are distributedover the whole range. of acoustic frequencies an accurate and rapid analysisof the frequency of speech and other rapidly varying sounds is possible. Anapparatus based upon this principle is described here, with which the l!' 0 u -r i e r- spectrum of the sound to he investigated is made directly visible onthe screen of ~n electron ray osc~llograph, so that the yaria:tions.of the spec- /trum can be filmed. The properties of the apparatus, especially the resolvingpower and recording speed attainable are discussed, as well as a number ofpart.iculars of c~mstruction and, use. -In conclusion several spectrograms ofvowels filmed with the apparatus are reproduced as examples of it.s use andthey are briefly discussed. . '
In the case of electro-acoustic apparatus forthe transmission of speech or music it is custom-ary to describe' the behaviour of the wholeor of the·separate elements by the way in whichthey react to s'nusoidal oscillations of differeiltfrequency._ This custom is based upo~ the factthat every sound vibration can be resolved intoa number of sinusoidal components (F 0 u r i ercomponente), so that from the frequenoycharac-terietics of an element (amplifier, cable or thelike) it is possible to deduce immediately theform' in which the complex vibration will betransmitted. .
There are many numerical, graphic and instru-, mental methods for the separation of a vibration "into its' F 0u r i e r components, i.e. methods ofharmonic analysis. For-the most part, however;'these methods are based upon the use of func-tions which are given in the form of a diagramor a table. If, therefore, it is desired to analysesound vibrations by these methods, the sound'vibrations must first be recorded. Moreover, thèfrequency spectrum of sound, vibrations, that
. of speech' for example, continually changes,and it is often just these changes in which we. are interested. In order to investigate these'changes a large number of strips of the recorded.sound would each have to be analysed separ-ately, which is a very laborious method scarcelydeserving .practdcal consideration. ,
With these objections in view special methodsof separation have been developed for electro-acoustics which correspond better to the existingrequirements and possibilities in this, field..
A very obvious method is to .make use of aban cl f i1ter a san a 1y sin ge] e men t.1" by means of a microphone the sound vibrationis converted into an electrical ,A.C. voltage andthis is fed successively to a number of bandf!lters with different transmission regions, t%enfrom the occurrence or absence of an outputsignal ~t can be deduced, in what, frequencyregions components of the vibra.tion being in-
vestigated lie, and how strong they are. Oh-viously so many filters must be used that thedesired fineness of structure of the ;hole acous-tic spectrum is obtained. -
In order to avoid the necessity of a large number ofband filters, which make the apparatus complicatedand expensive, the following device is usually employed .•.A sinusoidal .v:oltage whose frequency can be contin-uously varied (a u 'x i I i a r y 1;" r e q' u e ~ c y), isfed, together with the signal to be investigated, toa mixing valve followed by which is a single band filter.If the difference frequency (or sum frequency) of theauxiliary frequencyand one of the frequencies presentin the signal falls exactly in the narrow transmissionregion of tlie band filter, an output signal is observed.From the. values of the auxiliary frequency at which.this occurs the F.o u r ier s,pectrum of th~ signalcan therefore be deduced.
Only one band filter is needed here, but two disad-vantages are also involved: the measurement takessome time and as a result a fairly lengthy con-stancy of the voltage to' be Investigated is required.Therefore the auxiliary frequency method can indeed ,.be used, for example, for determining the deformationwhich a given constant input signal undergoes in anapparatus, but not for the analysis of speech or otherrapidly varying sound.
For an analysis of these sounds, therefore, recoursemust be had to the fundamentally simpler method inwhich separate band filters are used for the differenteomponenta of band filters required. .
Equipped with such a' set of analysingelements, it is now also possible to make theF 0 u r i e r spectra visible directly in a simpleway. For this purpose the outputs of the < whole'series of band filters are connected sugcessively.with an electron ray oscillograph by means ofà rapidly rotating switch. By means of suitable'connections the spectrum of the sound to beanalysed can then be observed directlyon thefluorescent screen, and its variations seen orrecorded on a film.
FEBRUARY 1942 THE ANALYSIS Ol( THE FREQUENCY 0]; RAPIDLY VARYING SOUNDS 51
, Anapparatus working on thisprinciple andcon-structed in this laboratory will be described inthis article .1), while in conclusion some resultsobtained with the 'apparatus will be dealt ,with.
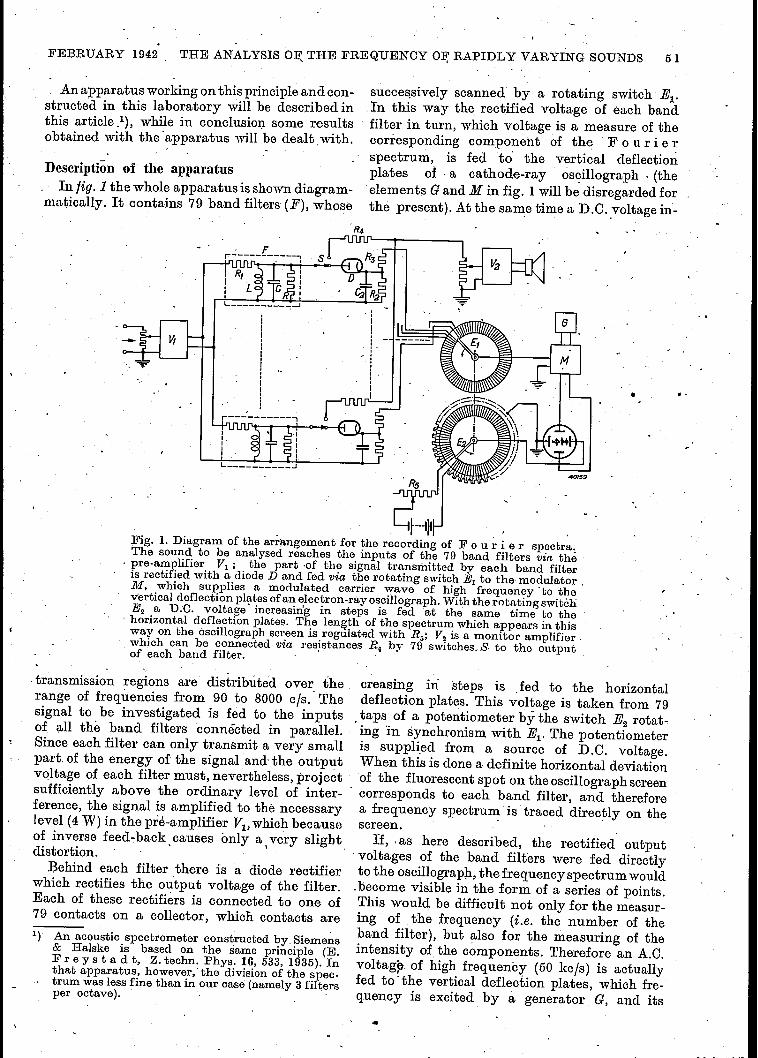
Descrlption of' the apparatusIn fig. 1the whole apparatus is showndiagram-
matically. It contains 79 band filters (F), whose
successively scanned by a rotating switch El'In this way the rectified voltage of each bandfilter in turn, which voltage is a measure of theeorresponding component of the 'F 0 u r ierspectrum, is fed to' the vertical deflectionplates of a cathode-ray cscillograph . (theelements G and M in fig. 1will be disregarded forthè present). At the sa~e time a D.e ..voltage in-
•
Fig. 1. Diagram of the arrangement for the recording of F 0 u ~ ier spectra,The sound to be analysed reaches the inputs of the 79 band filters via the
. pre-amplifier VI; the part -of the signal bransrnitted byeach band filteris rectified with a diode D and fed via the rotating switch El to the modulator ,M, which supplies a modulated carrier wave of high frequency 'to thevertical deflection plates of an electron-ray oscillograph. With the rotating switchE2 a U.C. voltage' increasin'g in steps is fed at the same time to the
, horizontal deflection plates. The length of the spectrum which appears in thisway on the óscillograph screen is regulated with Rs; V2 is a monitor amplifierwhich can be connected via resistancss R.l by 79 switohes.B' to tho outputof each band filter.
transmission regions are distributed over the, creasing in: 'steps is fed to the horizontalrange of frequencies from 90 to 8000 el«. The deflection plates. This voltage is taken from 79signal to be investigated is fed to the inputs . taps of a potentiometer by the switch E
2rotat-
of all the band filters connected in parallel. ' ing In synchronism with El' The potentiometerSince each filter can only transmit a very small is supplied from a source of D.e. voltage.part of the energy of the signal and' the output When this is done a definite horizontal deviationvoltage of each filter must, nevertheless, project of the fluorescent spot on the oscillograph screensufficiently above the ordinary level of inter- corresponds to each band filter, and thereforeference, the signal is amplified to the necessary a frequency speetrum is traced directlyon thelevel (4W) in the pre-amplifier VI>which because screen.of inverse feed-back causes only a very' slight If, -as here described, the rectified outputdistortion.' " , , 'voltages of the band filters were fed directlyBehind each filter there is a diode rectifier to the oscillograph, the frequency spectrum would
which rectifies the output voltage of the filter. .becorne visible in the form of a series of points.Each of these rectifiers is connected to one of This would be difficult not only for the measur-79 contacts on a collector, which contacts are ing of the frequency (i.e. the number of the1) An acoustic spectrometer constructed by Siemens band filter), but also for the measuring of the
& Halske is based on the same principle (E. intensity of the components. Therefore an A.C.Fr e y sta d t, Z. techno Phys. 16, 533, 1935). In voltag~ of high frequency (50 kc/s) is actuallythat apparatus, however,' the division of the spec- f d t th . 1 d fl .. 1trum was less fine than in our case (namely 3 filters eo' e vertica e eetion pates, which fre-per octave). quency is excited, by a generator G, and its
..
52 PHILIPS TECHNICAL REVIEW "01. 7, No. 2
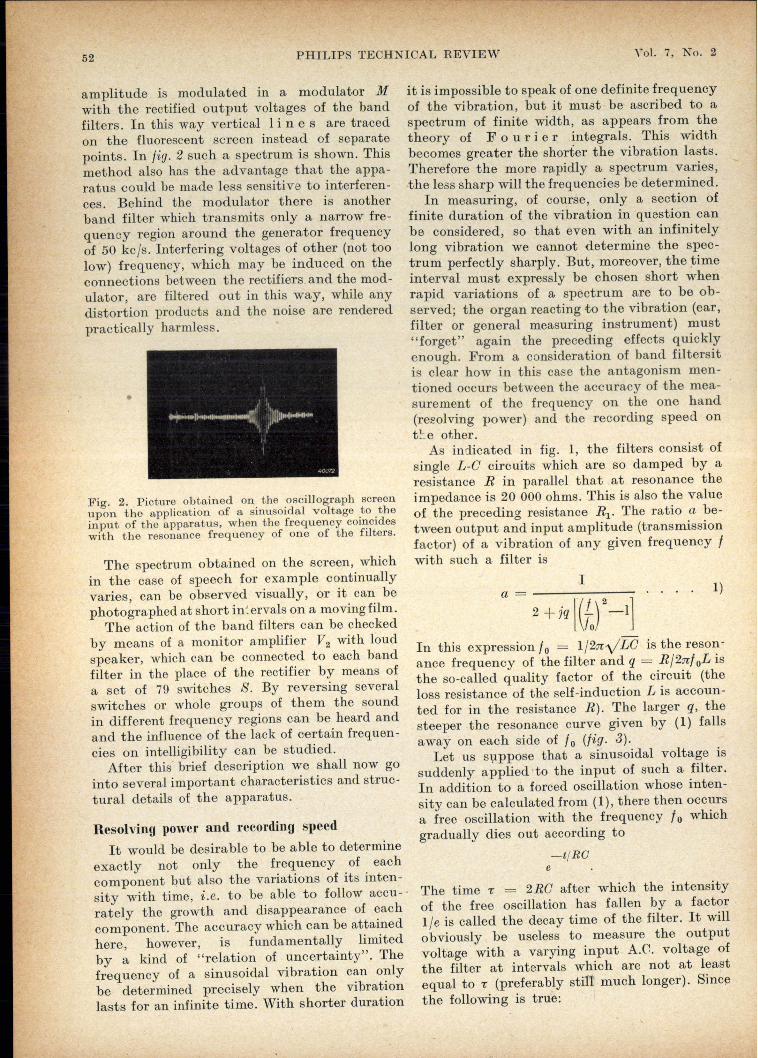
amplitude is modulated in a modulator Mwith the rectified output voltages of the bandfilters. In this way vertical Ii nes are tracedon the fluorescent screen instead of separatepoints. In fig. 2 such a spectrum is shown. Thismethod also has the advantage that the appa-ratus could be made less sensitive to interferen-ces. Behind the modulator there is anotherband filter which transmits only a narrow fre-quency region around the generator frequencyof 50 kc/so Interfering voltages of other (not toolow) frequency, which may be induced on theconnections between the rectifiers. and the mod-ulator, are filtered out in this way, while anydistortion products and the noise are renderedpractically harmless.
•
Fig. 2. .Picture obtained on the oscillograph screenupon the application of a sinusoidal voltage .to .theinput of the apparatus, when the frequency coincideswith the resonance frequency of one of the filters.
The spectrum obtained on the screen, whichin the case of speech for example continuallyvaries, can be observed visually, or it can bephotographed at short in',ervals on a movingfilm.
The action of the band filters can be checkedby means of a monitor amplifier V2 with loudspeaker, which can be connected to each bandfilter in the place of the rectifier by means ofa set of 79 switches S. By reversing severalswitches or whole groups of them the soundin different frequency regions can be heard andand the influence of the lack of certain frequen-cies on intelligibility can be studied.
After this' brief description we shall now gointo several important characteristics and struc-tural details of the apparatus.
Resolving power and recording speedIt would be desirable to be able to determine
exactly not only the frequency of eachcomponent but also the variations of its inten-sity with time, i.e. to be able to follow accu-'rately the growth and disappearance of eachcomponent. The accuracy which can be attainedhere, however, is fundamentally limitedby a kind of "relation of uncertainty". Thefrequency of a sinusoidal vibration can onlybe determined precisely when the vibrationlasts for an infinite time. With shorter duration
it is impossible to speak of one definite frequencyof the vibration, but it must be ascribed to aspectrum of finite width, as appears from thetheory of F 0 u r ier integrals. This widthbecomes greater the shorter the vibration lasts.Therefore the more rapidly a spectrum varies,-the less sharp will the frequencies be determined.
In measuring, of course, only a section offinite duration of the vibration in question canbe considered, so that even with an infinitelylong vibration we cannot determine the spec-trum perfectly sharply. But, moreover, the t.imeinterval must expressly be chosen short whenrapid variations of a spectrum are to be ob-served; the organ reacting to the vibration (ear,filter or general measuring instrument) must"forget" again the preceding effects quicklyenough. From a consideration of band filtersitis clear how in this case the antagonism men-tioned occurs between the accuracy of the mea-surement of the frequency on the one hand(resolving power) and the recording speed ont~_e other.
As indicated in fig. 1, the filters consist ofsingle L-G circuits which are so damped by aresistance R in parallel that .at resonance theimpedance is 20 000 ohms. This is also the valueof the preceding resistance RI' The ratio a be-tween output and input amplitude (transmissionfactor) of a vibration of any given frequency fwith such a filter is
I 1)a = --------------2 + jq ['(hf --1]
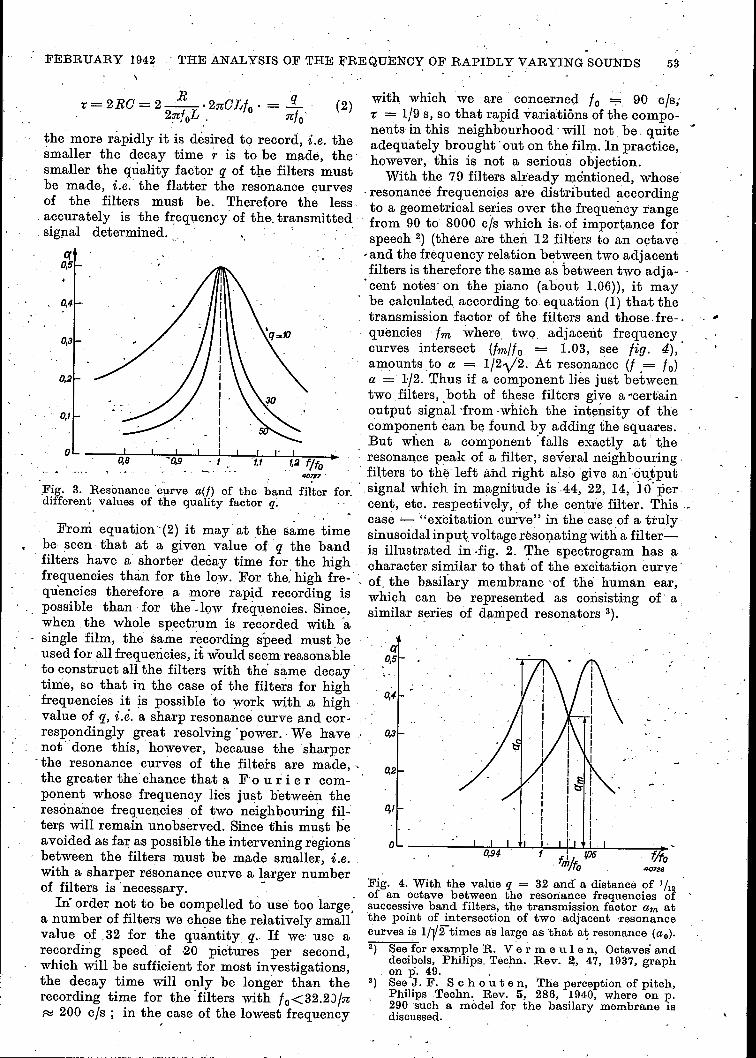
In this expression fo = 1/2nyLC is the reson-ance frequency of the filter and q = R/2nf oL isthe so-called quality factor of the circuit (theloss resistance of the self-induction L is accoun-ted for in the resistance R). The larger q, thesteeper the resonance curve given by (1) fallsaway on each side of to (fig. 3).
Let us s,\!ppose that a sinusoidal voltage issuddenly applied -to the input of such a filter.In addition to a forced oscillation whose inten-sity can be calculated from (1), there then occursa free oscillation with the frequency to whichgradually dies' out according to
-tjRO
The time i = 2RC after which the intensityof the free oscillation has fallen by a factor1/ e is called the decay time of the filter. It willobviously be useless to measure the outputvoltage with a varying input A.C. voltage ofthe filter at intervals which are not at leastequal to i (preferably sti1'tmuch longer). Sincethe following is true:
(2) with which we are' concerned f 0 " 90 cis;7: = l/9 s, so that rapid variatións of the compo-nents in this neighbourhood' will not be. quiteadequately brought' out on the film, In practice,however, this is not a serious objection.
With the 79 filters already mentioned, whose. resonance frequencies are distributed accordingto a geometrical series over the frequency rangefrom 90 to 8000 cis which is, of importance forspeech 2.) (there are then 12 filters to an octave"and the frequency relation between two adjacentfilters is therefore the same as between two adja-'cent notes on the piano (about 1.06)), it maybe calculated according to equation (1) that thetransmission factor of the filters and those. fre-.queneies fm where, two adjacent frequency,curves interseet (fmilo = 1.03, see fig. 4),amounts to a = 1/2v'2. At resonance (f .= 10)a = 1-/2.Thus if a component lies just betweentwo filters, both of these filters give a -certainoutput signal from -which the intensity of thecomponent can be found by adding the squares.But when a component' falls exactly at theresonance peak of a filter, several neighbouring.
. filters to the left and right also give anoubputsignal which in magnitude is .44, 22, 14,'] i)'percent, etc. respectively, of the centre filter. This .,-case '- "excitation curve" in the case of a trulysinusoidal input voltagerèsona.ting with a filter-e-is illustrated in -fig. 2. The spectrogram has ftcharacter similar to that' of the excitation curve'
, of. the basilary membrane 'of the human ear,which can be represented as consisting of' asimilar series of damped resonators 3).
FEBRUARY 1942 . THE ANALYSIS OF THE JrREQUENCY OF RAPIDLY VARYING SOUNDS 53
't'= 2RG = 2_!!:_. 2nOL/o . = .!L2?tfoL . n/o
the more rapidly it is desired to record, i.e. thesmaller the decay time r is to be made, the',smaller the quality factor q of the filters mustbe made, i.e. the flatter the resonance _curvesof the filters must be. Therefore the less.. accurately is the frequency of the. transmitted. signal determined. '. - . .
0.2
( (, ( ..0,8 . t 't,t 1,2 f/fo
40127 "
,Fig. 3. Resonance' curve aU) of the band filter for.different values of the quality factor q:From equation '(2) it may at the same time
be seen that at a given value of q the bandfilters have a. shorter decay time for, the highfrequencies than for the low. For the. high fre-
.. quencies therefore a more rapid recording ispossible than for the -.low frequencies. Since,when the whole spectrum is recorded with 'asingle film, the sarne recording speed must be. used for all frequencies, it would seem reasonableto construct all the filters with the' same decay-time, so that in the case of the filters for highfrequencies it is possible to work with .,a highvalue of q, i.e. a sharp resonance curve and cor-respondingly great resolving "power, We havenot vdone this, however, because the sharper'the resonance curves of the filters are made"the greater the chance that a F:o u i ier com-ponent whose frequency lies just between theresonance frequencies of two neighbouring fil-ters will remain unobserved. Since this must beavoidedas far as possible the intervening regionsbetween the filters must be made smaller, i.e.with a sharper resonance curve a larger numberof filters is 'necessary. - '.In' order not to be compelled to use too large,
a number of filters Wechose the relatively smallvalue of 32 for the quantity s. If we' use arecording speed of ·20. pictures per second,which will be sufficient for most investigations,the decay time will only be longer than therecording time for the .filters with lo<32.2J/nF:::! 200 cIs; in the case of the lowest frequency
0,5
0,4
o
Fig. 4. With the value q = 32 and' a distance of 1/12of an octave between the resonance frequencies ofsuccessive band filters, the transmission factor am. atthe point of intersection of two adjacent 'resonancecurves is lfll2times a's large as that a~ resonance (ao)'
2) See for example R. Ver m e u le n, Octaves anddecibels, Philips. Techn. Rev. 2, 47, 1937, graphon p. 49. .'
3) See J. F. S e h 0 u ten, The perception of pitch,Philips Techn. Rev. 5, 286, 1940, where on p.290 such a model for the basilary membrane isdiscussed.
54 PHILIPS TECHNICAL REVIEW Vol. 7, No. 2
..
If the construction of the filters is based on a re-cording speed of 20 times per second, it is of coursedesirable that there should be no other elements inthe apparatus which prevent- recording. at such aspeed. Critical points in this respect are the outputsof the rectifiers, the input of the modulator and theelectron ray tube. The rectified voltages are takenfrom a resistance' Ra inserted in every rectifier circuit,through which resistance the rectified current flows,while a condenser Ca in parallel with Ra serves tosmooth the voltage to the required degree. The timeconstant RaC2 of this circuit must be so small thatthe condenser C2 can be practically discharged betweentwo recordings. RaC! 'cannot be made indefinitelysmall, since Ra must be large ènough to obtain a highvoltage and also in order not to affect the band filterby too high a consumption of current, and also sinceCa must be large enough to obtain the desired smooth-ing effect. Nevertheless, it was found possible to givethe product R2C2 exactly the value 1/20 sec, so thatthe recording of 20 pictures per second was not hin-dered by this. In fact, apart from the impossibilityof making R2Ca indefinitely small, a much smallervalue of RaCs would not even be desirable, since thenthe consequences of a short-lived change in the signaldisappear again so quickly that there would be a greatchance that it would be unnoticed with a time intervalof 1/20 sec between successive recordings.
Similar considerations are also valid for the inputof the modulator. As soon as the switch. El makescontact with a certain lamella of the collector, theinput capacity Ca of. the modulator is loaded vic~ theresistance' Ra in the connections between rectifierand, collector. ·It was now found necessary to make, Ca large enough to' limib the' effects of the switchingimpulses' occurring; ,at, the same 'time, howeverthe èharging time CaRa of the modulator input must
\ be made extremely small. For the i'ecordingof 20spectrograms per- second, each consisting of about 80
, 1 I"measured points, only -. - = 0.000,6 sec is avail-
, ' 20 80 ' . ,able for- the scanningof each lamella; since there mustalso be sufficient space between the lamellae of thecollector, the actual time of contact is only about, half as long. In order to record the correct voltagevalue, the ,time CaRa must therefore be chosen appre-ciably smaller than 0.0003 sec. With the values chosenof Ra = 0.22 Mil and Ca = 500 p.p.F, RaCa became'0.00011 sec, which is small enough .. ' Finally there is -the. electron ray oscillograph. Fortracing one vertical line in .the spectrum, with thedesired recording speed of 20 pictures per second,0.0003 sec is available according to the above. Witha maximum length of the' lines of for instance 4 cmthe, tracing speed of the oscillograph 4) thereforeamounts to 4 cm/0.0003 sec = 120 m/so Althoughin ordinary cases, for instance with the electron rayoscillograph GM 3152, exposures can easily be madewith such a tracing speed, in this case this is not imme-diately true, since we must also pay attention to the,. resolving power. With a length of the spectrogramof about 8 cm the width of each of the 79 verticallines may not be greater than about l/a mm in orderthat they may not overlap. With the required veryfine fluorescent spot the necessary light intensity forexposures with the tracing speed mentioned couldonly be obtained by the use of an electron ray tubewith post-acceleration 6).
4) Actually, of course, the fluorescent spot moves 16times as fast, since it. makes a vibration with afrequency of 50 kc/s along the line. It comes topractically the same thing, however, for photo-graphy, whether the spot describes the line oncewith a given velocity or 16 times with a velocity16 times as great. " ,\
6) See J. de G i e r, An electron ray tube withpost-acceleration, Philip~ Te~hn. Rev. 5,245, 1940
Relation between the length of line 'on the screenand the amplitude of the I? 0 u r ier component
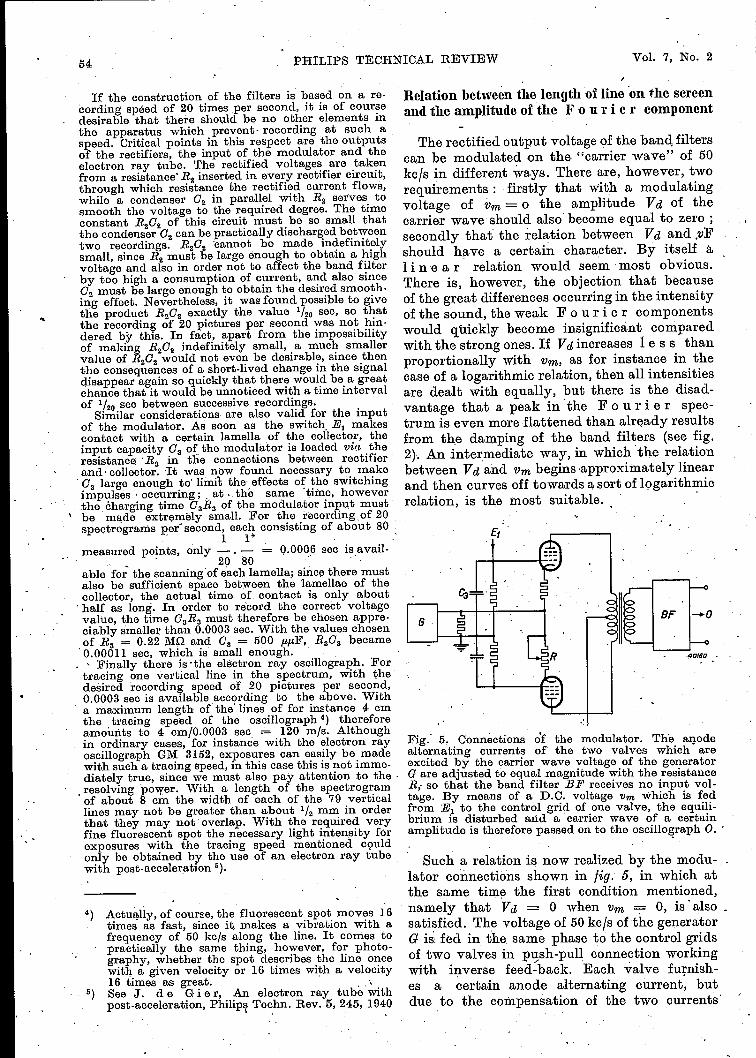
The rectified output voltage of the band. filterscan be modulated on the "carrier wave" of 50kcls in different ways. There are, however, tworequirements: firstly that with a modulatingvoltage of vm = 0 the amplitude Vd of thecarrier wave should also become equal to zero;secondly that the relation between Vd and ,vFshould have a certain character. By itself aI i n ear relation would seem most obvious.There is, however, the objection that becauseof the great differences occurring in the intensityof the sound, the weak F 0 u r ier componentswould quickly become insignificant comparedwith the strong ones. If Vd increases les s thanproportionally with Vm, as for instance in thecase of a logarithmic relation, then all intensitiesare dealt with equally, but there is the disad-vantage that a peak in' the F 0 u r ier spec-trum is even more flatberied than already resultsfrom the damping of the band filters (see fig.2). An .intermediabe way, in which the relationbetween Vd and Vm begins approximately linearand then curves off towards a sort of logarithmicrelation, is the most suitable. .
Fig: 5. Connections o'f the modulator. The anodealternating currents of the two valves which areexcited by the carrier wave voltage of the generatorG are adjusted to equal magnitude with the resistanceR, so that the band filter BF receives no input vol-tage. By means of a D.C. voltage Vm which is fedfr~m 1£,1 to, the control grid of .one valve, the equili-brium IS disturbed and a carrier wave of a certainamplitude is therefore passed on to the oscillograph O..
Such a relation is now realized by the modu-lator connections shown in fig. 5, in which atthe same time the first condition mentioned,namely that Vd = 0 when Vm = 0, is' also -satdsfied. 'I'he voltage of 50 kcls of the generatorG is fed in the, same phase to the control gridsof two valves in push-pull connection workingwith inverse feed-back. Each valve furnish-es a certain anode alternating current, butdue to the compensation of the two currents'
FEBRUARY 1942 THE ANALYSIS OF THE FREQUENCY OF RAPIDLY VARYING SOUNDS 55
in the output transformer - which cernpen-sation can be precisely adjusted by the regula-tory resistance R - no carrier wave is ordinarilytransmitted to the band filter BF (Vd = 0).If by means of the rotating switch El a D.C.voltage Vm is applied to the control grid of oneof the two valves, the operating point of thisis displaced on its characteristic to a point witha steeper slope, the anode alternating currentof this valve becomes larger, the compensationis sufficient and the excess is transmitted asoutput signal (with 50 kcjs) to the band filter.If the matter is considered more carefully, inthe case of the valve with inverse feed-back therelation between the anode alternating currentia and the grid A.C. voltage Vg is given by
8
1+ 8R Vg,
where 8 stands for the slope and R for the resis-tance in the cathode connection which effectsthe inverse feed-back. The slope 8 is chieflydetermined by the grid D.C. voltage Vm and(at least in the beginning) increases proportion-ally with um , The expression 8/(1 + 8R), how-ever, increases less rapidly than in proportionto 8 and finally approaches the constant valuel/R. From the cooperation of these two func-tions, upon suitable choice of the point oh thecharacteristic at which the valve operates withVm = 0, exactly the desired relation betweenVd and Vm is obtained, approximately linearat first and later curving.Actually it is not a question of the relation
between Vd and Vm, but of that between thelength of line on the fluorescent screen and theintensity of the corresponding F 0 u r ier com-ponent. Now the whole apparatus is about linear,
mm40
20
I --~/
~
VV
30
la
oo 25 SO, 75 100 125 mV ISO4016'
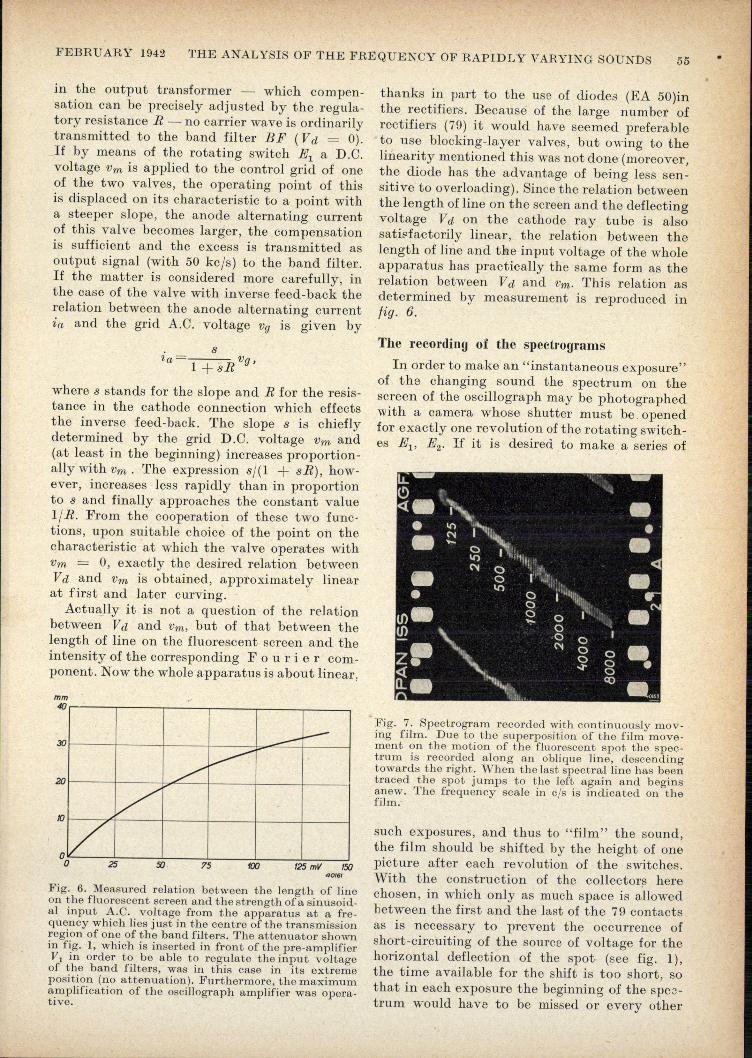
Fig. 6. Measured relation between the length of lineon the fluorescent screen and the strength of a sinusoid-al input A.C. voltage from the apparatus at a fre-quency which lies just in the centre of the transmissionregion of one of the band filters. The attenuator shownin fig. 1, which is inserted in front of the pre-amplifierV 1 in order to be able to regulate the input voltageof the band filters, was in this case in its extremeposition (no attenuation). Furthermore, the maximumamplification of the oscillograph amplifier was opera-tive.
thanks in part to the use of diodes (EA 50)inthe rectifiers. Because of the large number ofrectifiers (7D) it would have seemed preferableto use blocking-layer valves, but owing to thelinearity mentioned this was not done (moreover,the diode has the advantage of being less sen-sitive to overloading). Since the relation betweenthe length of line on the screen and the deflectingvoltage Vd on the cathode ray tube is alsosatisfactorily linear, the relation between thelength of line and the input voltage of the wholeapparatus has practically the same form as therelation between Vd and Vm. This relation asdetermined by measurement is reprcduced infig. 6.
The recording of the spectrogramsIn order to make an "instantaneous exposure"
of the changing sound the spectrum on thescreen of the oscillograph may be photographedwith a camera whose shutter must be. openedfor exactly one revolution of the rotating switch-es El' E2. If it is desired to make a series of
Fig. 7. Spectrogram recorded with continuously mov-ing film. Due 'to the superposition of the film move-ment on the motion of the fluorescent spot the spec-trum is recorded along an oblique line, descendingtowards the right. When the last spectralline has beentraced the spot jumps to the left again and beginsanew. The frequency scale in els is indicated on thefilm;
such exposures, and thus to "film" the sound,the film should be shifted by the height of onepicture after each revolution of the switches.With the construction of the collectors herechosen, in which only as much space is allowedbetween the first and the last of the 79 contactsas is necessary to prevent the occurrence ofahort-circuiting of the source of voltage for thehorizontal deflection of the spot (see fig. I),the time available for the shift is too short, sothat in each exposure the beginning of the spec-trum would have to be missed or every other
56 PHILIPS TECHNICAL REVIEW Vol. 7, }.jo. 2
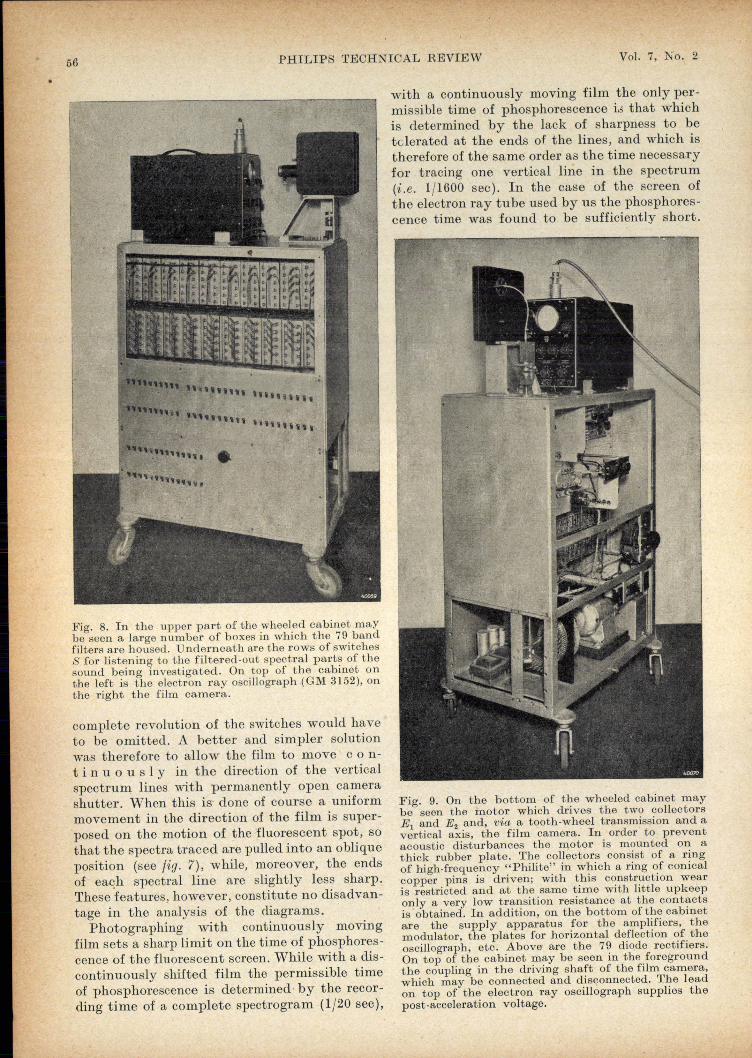
Fig. 8. In the upper part of the wheeled cabinet maybe seen a large number of boxes in which the 79 bandfilters are housed. Underneath are the rows of switchesS for listening to the filtered-out spectral parts of thesound being investigated. On top of the cabinet onthe left is the electron ray oscillograph (GM 3152), onthe right the film camera.
complete revolution of the switches would haveto be omitted. A better and simpler solutionwas therefore to allow the fÜm to move co n-t i n u 0 u sly in the direction of the verticalspectrum lines with permanently open camerashutter. When this is- done of course a uniformmovement in the direction of the film is super-posed on the motion of the "fluorescent spot, sothat the spectra traced are pulled into an obliqueposition (see fig. 7), while, moreover, the endsof each spectral line are slightly less sharp.These features, however, constitute no disadvan-tage in the analysis of the diagrams.Photographing with continuously moving
film sets a sharp limit on the time of phosphores-cence of the fluorescent screen. While with a dis-continuously shifted film the permissible timeof phosphorescence is determined· by the recor-ding time of a complete spectrogram (1/20 sec),
with a continuously moving film the only per-missible time of phosphorescence id that whichis determined by the lack of sharpness to betclerated at the ends of the lines, and which istherefore of the same order as the time necessaryfor tracing one vertical line in the spectrum(i.e. 1/1600 sec). In the case of the screen ofthe electron ray tube used by us the phosphores-cence time was found to be sufficiently short.
Fig. 9. On the bottom of the wheeled cabinet maybe seen the motor which drives the two collectorsEl and E2 and, via a tooth-wheel transmission and avertical axis, the film camera. In order to preventacoustic disturbances the motor is mounted on athick rubber plate. The collectors consist of a ringof high-frequency "Philite" in which a ring of conicalcopper pins is driven; with this construction wearis restricted and at the same time with little upkeeponly a very low transition resistance at the contactsis obtained. In addition, on the bottom of the cabinetare the supply apparatus for the amplifiers, themodulator, the plates for horizontal deflection of theoscillograph, etc. Above- are the 79 diode rectifiers.On toopof the cabinet may be seen in the foregroundthe coupling in the driving shaft of the film camera,which may be connected and disconnected. The leadon top of the electron ray oscillograph supplies thepost-acceleration voltage.
FEBRUARY 1942 THE ANALYSIS OF THE FREQUENCY OF RAPIDLY VARYING SOUNDS 57
During one revolution of the rotating switchesthe film movement must be such that even withthe largest amplitudes occurring successive spec-tra must not overlap. In order to ensure thisonce and for all at different speeds of revolutionof the switches, the camera is driven, via atooth-wheel transmission and a flexible shaft,by the same motor (a D.e. motor with variablespeed) to the axle of which the switch arms arefastened. The camera is set in motion or stoppedby means of a simple ·coupling mechanism.
As described in detail above, a maximum.recording speed of 20 spectrograms per secondcan be attained. For many purposes a lowerspeed, for instance 10 pictures per second (thushalf the speed of revolution of the switches)will suffice, and the recording speed then CO~Tes-ponds to the longest decay time of the filtersoccurring (1/9 sec with the filter for 90 cis). .
As a conclusion to this description, in figs. 8and 9 two photographs of the apparatus con-structed are given. Several structural details arepointed out in the text below the figures.
Several results obtained with the apparatus
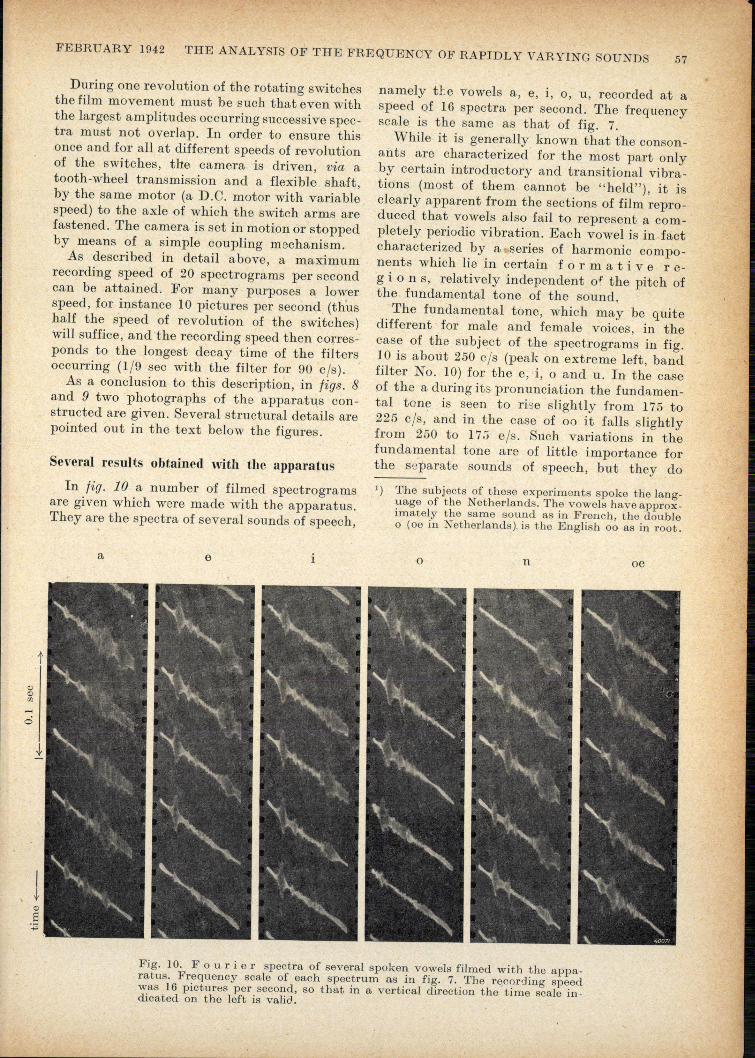
In fig. 10 a number of filmed spectrogramsare given which were made with the apparatus.They are the spectra of several sounds of speech,
a e i
namely tte vowels a, e, i, 0, u, recorded at aspeed of 16 spectra per second. The frequencyscale is the same as that of fig. 7.
While it is generally known that the consen-ants are characterized for the most part onlyby certain introductory and transitional vibra-tions (most of them cannot be "held"), it isclearly apparent from the sections of film repro-duced that vowels also fail to represent a com-pletely periodic vibration. Each vowel is in factcharacterized by a series of harmonic cornpo-nents which lie in certain for m a t i ver e-g ion s, relatively independent 0-1' the pitch ofthe fundamental tone of the sound.
The fundamental tone, which may be quitedifferent· for male and female voices, in thecase of the subject of the spectrograms in fig.10 is about 250 cis (peak on extreme left, bandfilter No. 10) for the e, i, 0 and u. In the caseof the a during its pronunciation the fundamen-tal tone is seen to rise slightly from 175 to225 c]«, and in the case of 00 it falls slightlyfrom 250 to 17:5 els. Such variations in thefundamental tone are of little importance forthe separate sounds of speech, but they do
1) The subjects of these experiments spoke the lang-uage of the Netherlands. The vowels have approx-imately the same sound as in French, the doubleo (oe in NetherIands). is the English 00 as in root.
o n oe
Fig. 10. F 0 u r ier spectra of several spoken vowels filmed with the appa-ratus. Frequency scale of each spectrum as in fig. 7. Tbe recor-ding speedwas 16 pictures per second, so that in a vertical direction the time scale in"dicated on the left is valid.
58 PHILIPS TECHNICAL REVIEW Vol. 7, No. 2
playun important part in the capacity of the- language for expression. This is' an importantpoint for investigation in phonetics. If the posi-tion and intensity. of the other peaks in thespèctrum are measured, the following' data(table IJ are found Ior instance for the a (thirdspectrum from the.top) (applying the calibrationcurve of fig. 6).
Table I
Filter No.Frequency Voltage
els mV
16 ' 210 828 421 1435 630 . 19.544 1060 7556 2120 4064 3360 - 30.5
As may be expected·theoretically 6), these fre-quencies are multiples of the fundamental tone(210 cis). The strongest overtone is found at1060 cis, in which region lies the most importantîormatäve of the-a. The weaker maxima usuallyoccurring as well, which in this case 'for instanceoccur ÇLt2120 and 3360 cfs, are less essential tothe character of the' vowel. ' '
Upon investigation of. a series of dÜférent', voices ,we found for the most important forma-tive of each of the vowels mentioned the fre-quency regions'given in table II"column A. For .the, sake of comparison the values given by
Table 11Most important formative regions of six vowels, accord-ing to' II\easureménts with the apparatus described.For the main formatives our own measurements(oolurnn A) are to be cOII\pared with values given inthe literature 1) (column E), . ,
.Main formativeSubordinate
Vowel formative elsels A I B
oe 150-300 .... - -o' 4C'0-500 366.548a - 950-1498 548-1304u 150.300 1888,2520 1843-2926e 300-600 2378·2996 2069·2762i 150-30J 2828-3786 2192-3687
6) The spectra .of thê vowels are formed due to thefact that certain harmonics of the vocal chordvibration; which contains the fundamental tone, wibhia large number of harmonics, are amplifiedby :resonancè of the cavity of mouth, throat andnose. See.also J. cl e Boe rand K. cl e BOEl r,The LaryngophoIle, Philips Techn: Rev. 5,6,1940.
"
S t u m P f on the basis of detailed investiga-tions are given in cólumn B 7). It. IS evidentthat the individual differences may be quiteconsiderable and that the frequency regionsby which, according to the' current conception,a vowel is charactèrized' 8:re anything butsharply defined. This is the more striking sincein the synthetic production of vowels with thehelp of a number of. band filters it is foundthat fairly accurately determined formatives arenecessary for the recognition of a vowel; forexample in our experiments on this subject aformative which deviated only little from 1500 'cis was necessary for the production. of a clearly"pron~unced" a.
Such experiments with synthetic' vowels"alsofurnish a good illustration of the above-men-tioned fact that the filmed- spectra clearlyshow a' fluctuation of the components duringthe pronunciation of a vowel. In the case ofartificial vowels'where this fluctuation is lackingthe vowel can indeed be recognized, but the '"sound. is not "human" in' character. For theappearance or-the human character the naturalVibration which is given to the sound by themuscles which contract' the vocal chords and,determine the shape, of the cavity of the mouth,' 'throat and nose (see footnote 6~ seems to beessential S). ' ',' ., In conclusion we should like to point. out'that the possibilities of application 'of the aeons-tic specbrograph described here are not limited'to the investigation of speech. The apparatus'undoubtedly offers important possibilities for'the investigation 'of musical instruments, of theacoustics of halls (reverberation), 'ofinterferences -'on connection lines or of 'interfering noises ofmachines and the like. '
7) According to C. ,S t u III P r. Die Sprachlaute.Experimentell-phonetische Untersuchungen, .J. ,Springer, Berlin 1926, p. 66. His values are for'vowels sung with a fundamental tone of 183 els.In comparing it must be taken into account that.bhé language of St u m p f's subjects was not· the Dutch but the German. .· ,t
~) This wS:s also confirmed in unpublished -experi-.ments by J. F. Sc hou ten in this laboratory. ,Vowels were imitated with the help of the opticalsiren (Philips Techn. Rev. 4, 167, 1939), in which,stencils with a cut-out vibrational form were placed'in a beam of light. When the stencil was fastenedrigidly the sound obtained was not "human" but· lifeless in character; it became much more human, however, when th'e 'stencil was held in the lightbeam ,w i t h the ha n d. The "vibrato" of theband is then a substitute for the 'vibrato of the: vocal chords and of the resonating cavities. '