Embed Size (px)
Citation preview

Jacob Wiest || Structural
A REEVALUATION OF MONTGOMERY COUNTY’S
JUDICIAL CENTER ANNEX
THE PENNSYLVANIA STATE UNIVERSITY
SCHREYER HONORS COLLEGE
Department of Architectural Engineering
Jacob Wiest
Spring 2012
A thesis submitted in
partial requirement for degree in Architectural Engineering
with honors in Architectural Engineering
Review and approved by the following:
Andres Lepage
Assistant Professor
Thesis Supervisor
Richard Mistrick
Associate Professor
Honors Advisor
Signatures on file with the honors college*

Jacob Wiest || Structural
i
Abstract
The Judicial Center Annex is a 210,000 square foot addition to Montgomery County’s Judicial Center
located in Rockville, MD. The $67 million dollar project is currently under construction and slated to
finish in April of 2013.
The structural system, as designed is a post tensioned slab supported by reinforced concrete columns.
The lateral force resisting system is reinforced concrete shear walls and the foundations are core drilled
piers.
This report is the result of a semester of research upon the existing structural design. Based upon the
findings a proposal was created for a system redesign. Due to the fact that the building lacked a height
restriction it was determined to explore a steel alternative to the concrete construction. Also, as seismic
design was an interest, the building was “moved” to San Francisco where the greater seismic forces
would need to be dealt with.
The redesign in Maryland necessitated a cost and schedule comparison to determine the viability of the
change in systems, so this was chosen as one breadth for further exploration. The other breadth was
inspired by the sustainable features found upon the roof. The JCA has both green roof and photovoltaic
panels. It was determined to investigate if changing the green roof portions to PV panels would be more
beneficial for the owner by comparing the life cycle cost, carbon emissions, and LEED impacts of the two
systems. The LEED checklist would also be further explored looking for opportunities to improve upon
the Gold rated building.
The steel structure was able to be implemented effectively, using braced frames in lieu of the shear
walls and maintaining the current grid to avoid impacting the layout. The large floor to floor heights and
generous plenum spaces made a height adjustment largely unnecessary, with the total height only
increasing by a 1.5’. It was estimated that the system could save in the order of $700k in cost and a
month in schedule.
The steel move to California necessitated changing the ordinary concentrically braced frames to special
concentrically braced frames in order to deal with the increased forces. This required special detailing
and turned out to be slightly uneconomical due to the one chevron configuration. Changing this to an
eccentrically braced frame saved in the order of $200k and 70 tons of steel. Adding additional frames
also took advantage of certain code provisions and helped mitigate torsion problems.
The sustainability study showed that the green roof was the better option, as it had a lower initial
investment which it paid back quicker. It also had other benefits in the form of net negative carbon
emissions, storm water runoff control, urban heat island reduction, as well as impacting a possible 7
LEED points.
Jacob Wiest || Structural
ii
TableofContentsChapter 1: Existing Building ......................................................................................................................... 1
1.1: Structural Overview ................................................................................................................. 2
1.2: Gravity Loads ............................................................................................................................ 8
1.3: Lateral Loads .......................................................................................................................... 10
1.4: Proposal/Problem Statement ................................................................................................ 12
Chapter 2: Structural Depth ....................................................................................................................... 14
2.1: MD Gravity Design ................................................................................................................. 14
2.2: MD Lateral System & Foundation Design ............................................................................. 16
2.3: CA Lateral Design, Layout 1 ................................................................................................... 27
2.4: CA Lateral Design, Layout 2 ................................................................................................... 34
2.5: CA Lateral Design, Layout 3 ................................................................................................... 36
2.6: MAE Requirements ............................................................................................................... 39
2.7: Summary ................................................................................................................................ 39
Chapter 3: Construction Management Breadth ........................................................................................ 40
3.1: Cost ......................................................................................................................................... 40
3.2: Schedule ................................................................................................................................. 41
3.3: Summary ................................................................................................................................ 42
Chapter 4: Sustainability Breadth .............................................................................................................. 44
4.1: Green Roof ............................................................................................................................. 44
4.2: PV Panels ................................................................................................................................ 48
4.3: LEED Investigation .................................................................................................................. 50
4.4: Summary ................................................................................................................................ 51
Chapter 5: Conclusion ................................................................................................................................ 52
References .................................................................................................................................................. 53
Appendix A: Typical Plans .......................................................................................................................... 54
Appendix B: Wind Calculations .................................................................................................................. 56

Jacob Wiest || Structural
iii
Appendix C: Seismic Calculations .............................................................................................................. 57
Appendix D: Steel Framing Calculations .................................................................................................... 58
Appendix E: RAM Gravity System .............................................................................................................. 62
Appendix F: MD Design Lateral Sizing ....................................................................................................... 63
Appendix G: MD Story Drifts ...................................................................................................................... 65
Appendix H: Foundation Sizing .................................................................................................................. 66
Appendix I: SCBF Design ............................................................................................................................. 68
Appendix J: MRSA ...................................................................................................................................... 73
Appendix K: CA Layout 1 Preliminary Sizes ............................................................................................... 74
Appendix L: CA Layout 1 Story Drifts ......................................................................................................... 76
Appendix M: CA Layout 2 Preliminary Sizing ............................................................................................ 77
Appendix N: Brace Removal Study ............................................................................................................ 80
Appendix O: CA Layout 2 Story Drifts and Torsional Irregularity ............................................................. 87
Appendix P: CA Layout 2 Brace Configuration .......................................................................................... 88
Appendix Q: Eccentric Braced Frame Design ............................................................................................ 89
Appendix R: Detailed Cost Breakdown ...................................................................................................... 94
Appendix S: Original Schedule ................................................................................................................... 99
Appendix T: Vasari Energy Model ............................................................................................................ 101
Appendix U: Sunpower T5 Roof Tiles ...................................................................................................... 102
Appendix V: SAM Cash Flow .................................................................................................................... 103

Jacob Wiest || Structural
iv
List of Figures
Figure 1‐1: Site Location, Bing.com .............................................................................................................. 1
Figure 1‐2: West Elevation ............................................................................................................................ 1
Figure 1.1‐1: Foundation Layout ................................................................................................................... 3
Figure 1.1‐2: Lantern Framing Plan ............................................................................................................... 4
Figure 1.1‐3: Lateral Elements ...................................................................................................................... 5
Figure 1.2‐4: Roof Snow Diagram ................................................................................................................. 9
Figure 2.1‐1: Steel Gravity System Layout .................................................................................................. 15
Figure 2.2‐1: Concentrically Braced Frame Configurations ........................................................................ 20
Figure 2.2‐2: BF Layout ............................................................................................................................... 21
Figure 2.2‐3: Core Drilled Pier Sizes and Locations ..................................................................................... 24
Figure 2.2‐4: BF 1 ........................................................................................................................................ 25
Figure 2.2‐5: BF 2 ........................................................................................................................................ 25
Figure 2.2‐6: BF 3 ........................................................................................................................................ 25
Figure 2.2‐7: BF 4&5 .................................................................................................................................... 26
Figure 2.3‐1: Design Response Spectrum ................................................................................................... 28
Figure 2.3‐2: Chevron Brace to Beam Connection ...................................................................................... 31
Figure 2.3‐3: CA BF 1 ................................................................................................................................... 33
Figure 2.3‐4: CA BF 2 ................................................................................................................................... 33
Figure 2.3‐5: CA BF 3 ................................................................................................................................... 33
Figure 2.3‐6: CA BF 4&5 .............................................................................................................................. 33
Figure 2.4‐1: BF Layout ............................................................................................................................... 34
Figure 2.4‐2: ETABS Model, CA Layout 2 ..................................................................................................... 35
Figure 2.5‐1: Eccentric Braced Frame Beam Design ................................................................................... 37
Figure 2.5‐2: CA 2 BF 1&6 ........................................................................................................................... 38
Figure 2.5‐3: CA 2 BF 2 ................................................................................................................................ 38
Figure 2.5‐4: CA 2 BF 3 ................................................................................................................................ 38
Figure 2.5‐5: CA 2 BF 4&5 ........................................................................................................................... 38
Figure 2.5‐6: CA 2 BF 7 ................................................................................................................................ 38
Figure 2.5‐7: CA 2 BF 8 ................................................................................................................................ 38
Figure 3.2‐1: Redesign Schedule ................................................................................................................. 42
Figure 4‐1: Sustainable Roof Features ........................................................................................................ 44
Figure 4.1‐1 Extensive Green Roof Photo .................................................................................................. 45
Figure 4.1‐2: Autodesk Vasari Model .......................................................................................................... 45
Figure 4.2‐1: Sunpower T5 Solar Roof Tiles ................................................................................................ 48
Figure 4.2‐2: Schematic Wiring Diagram .................................................................................................... 49
Figure 4.2‐3: Solar Study ............................................................................................................................. 49
Figure 4.4‐1: Sustainability Summary ......................................................................................................... 51

Jacob Wiest || Structural
v
List of Tables
Table 1.1‐1: Materials Used .......................................................................................................................... 7
Table 1.2‐1: Dead Loads ................................................................................................................................ 8
Table 1.2‐2: Live Loads .................................................................................................................................. 8
Table 1.2‐3: Flat Roof Snow Load.................................................................................................................. 9
Table 1.2‐4: Snow Drift Calculations ............................................................................................................. 9
Table 1.3‐1: Wind Force NS ......................................................................................................................... 10
Table 1.3‐2: Wind Force EW ....................................................................................................................... 10
Table 1.3‐3: Seismic Forces NS .................................................................................................................... 11
Table 1.3‐4: Seismic Forces EW................................................................................................................... 11
Table 1.3‐5: Modal Information, JCA Concrete ........................................................................................... 11
Table 2.2‐1: Seismic Design Parameters ..................................................................................................... 16
Table 2.2‐2: Seismic Forces, Both Directions .............................................................................................. 17
Table 2.2‐3: Wind Load Criteria .................................................................................................................. 17
Table 2.2‐4: Kz and qz Values ...................................................................................................................... 17
Table 2.2‐5: Wind Pressure NS .................................................................................................................... 18
Table 2.2‐6: Wind Pressure EW .................................................................................................................. 18
Table 2.2‐7: Wind Forces and Shears NS .................................................................................................... 19
Table 2.2‐8: Wind Forces and Shears EW ................................................................................................... 19
Table 2.2‐9:Brace Configuration Comparison ............................................................................................. 20
Table 2.2‐10: MD Modes and Participating Mass ....................................................................................... 21
Table 2.2‐11: Seismic X Direction Deflection .............................................................................................. 22
Table 2.2‐12: Seismic Y Direction Deflection .............................................................................................. 22
Table 2.2‐13: Wind X Direction Deflection ................................................................................................. 23
Table 2.2‐14: Wind Y Direction Deflection .................................................................................................. 23
Table 2.2‐12: Seismic Y Direction Deflection .............................................................................................. 22
Table 2.3‐1: CA Seismic Design Parameters ................................................................................................ 27
Table 2.3‐2: CA Seismic Forces .................................................................................................................... 28
Table 2.3‐3: CA Wind Forces EW ................................................................................................................. 29
Table 2.3‐4: CA SWind Forces NS ................................................................................................................ 29
Table 2.3‐5: Torsional Irregularity X Direction ............................................................................................ 31
Table 2.3‐6: Torsional Irregularity Y DIrection ............................................................................................ 32
Table 2.3‐7: Modal Information, CA Layout 1 ............................................................................................. 32
Table 2.4‐1: Brace Strength Summary ........................................................................................................ 35
Table 2.4‐2: Modal Information, CA Layout 2 ............................................................................................. 36
Table 2.5‐1: Modal Information, CA Layout 3 ............................................................................................. 37
Table 2.7‐1: Steel Design Summary ............................................................................................................ 39
Table 3.1‐1: Cost Comparison ..................................................................................................................... 40
Table 3.1‐2: Cost Breakdown ...................................................................................................................... 41
Table 3.3‐1: Cost/Schedule Sumamry ......................................................................................................... 42
Table 3.3‐2: AECOM System Comparison ................................................................................................... 43

Jacob Wiest || Structural
vi
Table 4.1‐1: Green Roof Life Cycle Cost ...................................................................................................... 46
Table 4.1‐2: Green Roof Stats ..................................................................................................................... 47
Table 4.2‐1: SAM Study ............................................................................................................................... 49
Jacob Wiest || Structural
vii
Acknowledgements
I owe a debt of gratitude to the AECOM for providing me with the opportunity to work on this project
and to Montgomery County for giving me the necessary permissions. In particular I’d like to thank the
following individuals who provided me with prompt responses and valuable information.
Phil Antis
Jeannie Gasper
Lee Ressler
Carl Hubben
I would also like to thank the entire AE faculty for their tireless dedication to our education, without
which this thesis would have been insurmountable. I am especially grateful to the structural faculty who
have provided me with a great foundation upon with which to enter the field. Special thanks go to the
following:
Andres Lepage, my thesis advisor whose insights proved invaluable
Kevin Parfitt and Robert Holland, who patiently dealt with us throughout this process
Truly though none of this would have been possible without my fellow students, who helped me get
through thesis with a smile on my face. A special shout out to the following:
Daniel Zartman
Alex Ward
Nathan McGraw
Britt Kern
TJ Kleinosky
Chris Dunlay
Raffi Kayat
David Tran
Finally I’d like to thank my friends and family who have provided me with support throughout this whole
process, and never lost faith that I would get it accomplished, even when I did.
Jacob Wiest || Structural
1
Chapter 1 ‐Building Introduction
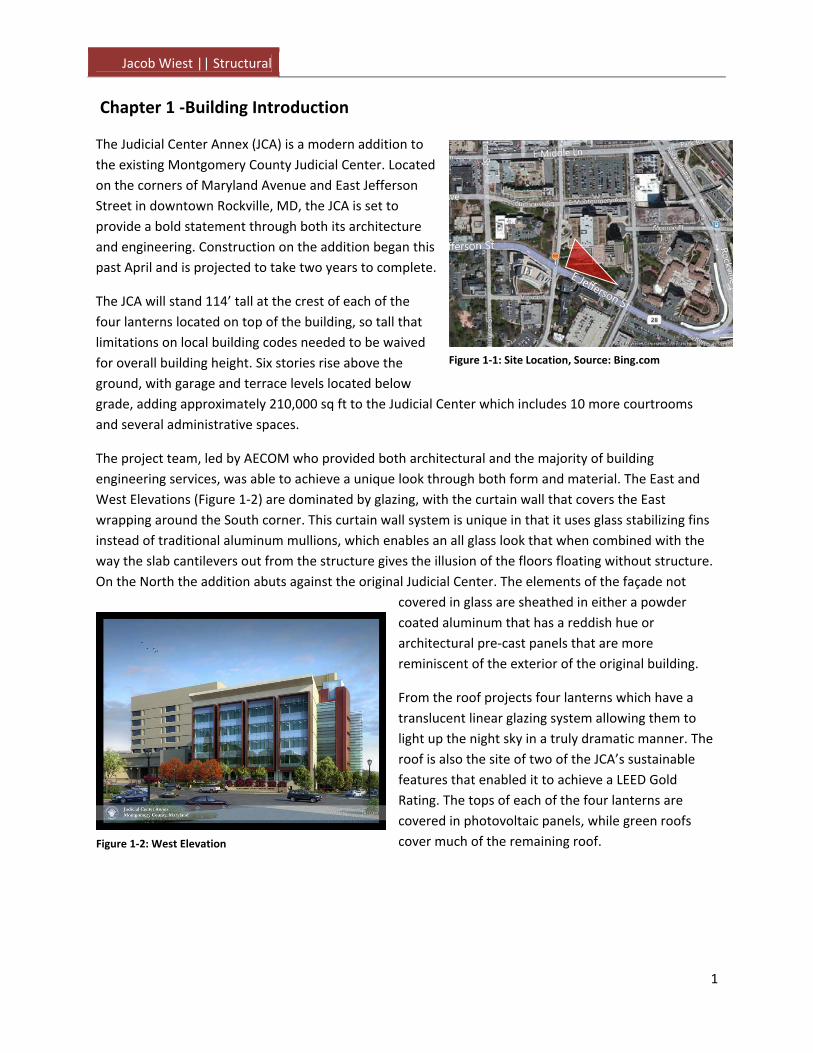
The Judicial Center Annex (JCA) is a modern addition to
the existing Montgomery County Judicial Center. Located
on the corners of Maryland Avenue and East Jefferson
Street in downtown Rockville, MD, the JCA is set to
provide a bold statement through both its architecture
and engineering. Construction on the addition began this
past April and is projected to take two years to complete.
The JCA will stand 114’ tall at the crest of each of the
four lanterns located on top of the building, so tall that
limitations on local building codes needed to be waived
for overall building height. Six stories rise above the
ground, with garage and terrace levels located below
grade, adding approximately 210,000 sq ft to the Judicial Center which includes 10 more courtrooms
and several administrative spaces.
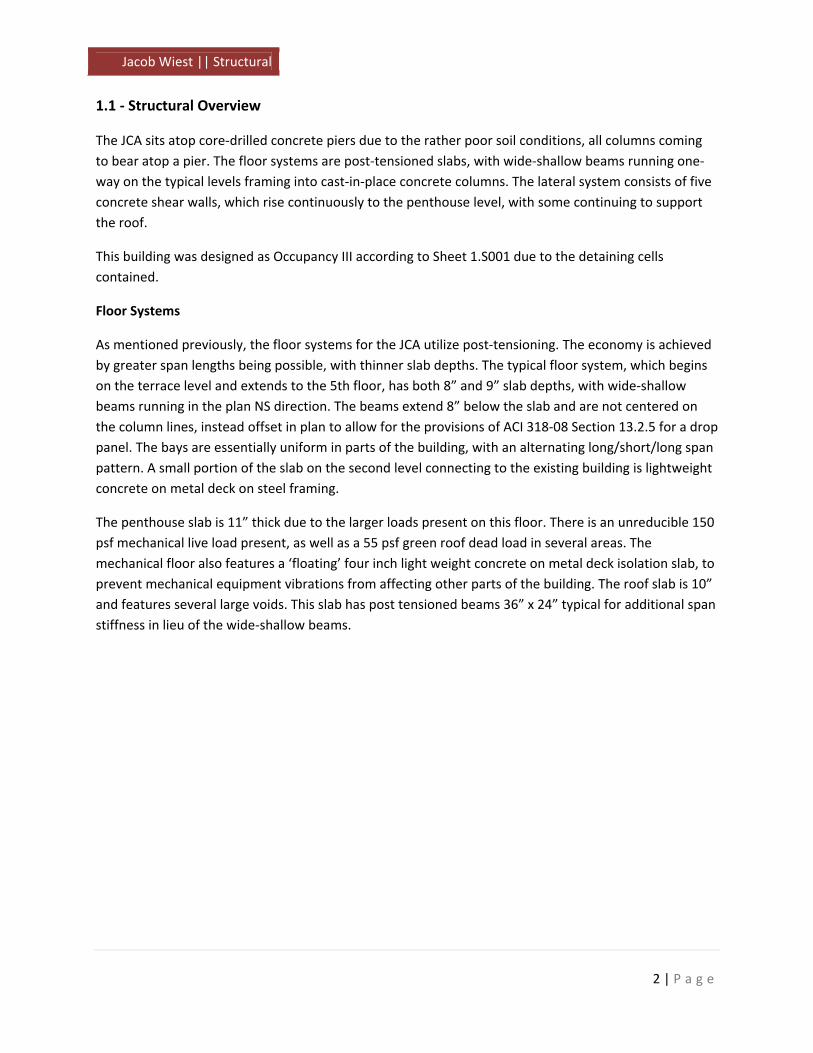
The project team, led by AECOM who provided both architectural and the majority of building
engineering services, was able to achieve a unique look through both form and material. The East and
West Elevations (Figure 1‐2) are dominated by glazing, with the curtain wall that covers the East
wrapping around the South corner. This curtain wall system is unique in that it uses glass stabilizing fins
instead of traditional aluminum mullions, which enables an all glass look that when combined with the
way the slab cantilevers out from the structure gives the illusion of the floors floating without structure.
On the North the addition abuts against the original Judicial Center. The elements of the façade not
covered in glass are sheathed in either a powder
coated aluminum that has a reddish hue or
architectural pre‐cast panels that are more
reminiscent of the exterior of the original building.
From the roof projects four lanterns which have a
translucent linear glazing system allowing them to
light up the night sky in a truly dramatic manner. The
roof is also the site of two of the JCA’s sustainable
features that enabled it to achieve a LEED Gold
Rating. The tops of each of the four lanterns are
covered in photovoltaic panels, while green roofs
cover much of the remaining roof.
Figure 1‐1: Site Location, Source: Bing.com
Figure 1‐2: West Elevation
Jacob Wiest || Structural
2 | P a g e
1.1 ‐ Structural Overview
The JCA sits atop core‐drilled concrete piers due to the rather poor soil conditions, all columns coming
to bear atop a pier. The floor systems are post‐tensioned slabs, with wide‐shallow beams running one‐
way on the typical levels framing into cast‐in‐place concrete columns. The lateral system consists of five
concrete shear walls, which rise continuously to the penthouse level, with some continuing to support
the roof.
This building was designed as Occupancy III according to Sheet 1.S001 due to the detaining cells
contained.
Floor Systems
As mentioned previously, the floor systems for the JCA utilize post‐tensioning. The economy is achieved
by greater span lengths being possible, with thinner slab depths. The typical floor system, which begins
on the terrace level and extends to the 5th floor, has both 8” and 9” slab depths, with wide‐shallow
beams running in the plan NS direction. The beams extend 8” below the slab and are not centered on
the column lines, instead offset in plan to allow for the provisions of ACI 318‐08 Section 13.2.5 for a drop
panel. The bays are essentially uniform in parts of the building, with an alternating long/short/long span
pattern. A small portion of the slab on the second level connecting to the existing building is lightweight
concrete on metal deck on steel framing.
The penthouse slab is 11” thick due to the larger loads present on this floor. There is an unreducible 150
psf mechanical live load present, as well as a 55 psf green roof dead load in several areas. The
mechanical floor also features a ‘floating’ four inch light weight concrete on metal deck isolation slab, to
prevent mechanical equipment vibrations from affecting other parts of the building. The roof slab is 10”
and features several large voids. This slab has post tensioned beams 36” x 24” typical for additional span
stiffness in lieu of the wide‐shallow beams.

Jacob Wiest || Structural
3 | P a g e
Foundations
Schnabel Engineering performed the geotechnical services on the JCA project. Reports indicated that for
the purposes of shallow continuous wall footings the soil has a bearing capacity of 2 ksf, with any
unsuitable conditions requiring excavation and replacement with lean concrete. Core‐drilled piers
ranging in diameter from 2.5’ to 7’ are located beneath every column and support much of the shallow
wall footings. The soil report from Schnabel Engineering indicates that the core drilled piers have an
end‐bearing capacity of 80 ksf and a skin friction capacity of 800 psf. The slab on grade is 5” thick and
reinforced with WWF.
Figure 1.1‐1 Foundation Layout

Jacob Wiest || Structural
4 | P a g e
Framing Systems
Cast‐in‐place columns rise from the garage level to the roof, with the four lanterns extending the extra
fourteen feet with steel framing. The column concrete has a compressive strength of 7000 psi at the
base, which is reduced to 5000 psi at level 2. Typical column sizes are 24”x24”
Each lantern has a flat roof framed in structural steel with a slight slope on the edges. HSS tubes make
up the columns, with the majority of the framing being small steel shapes with spans in the range of 5’
and typical sizes of L3x3x1/4, HSS4x4x1/4, and C6x13. In the center of the roof are several W12x40
girders with a maximum span of 33’ that are framed into by smaller wide flange shapes. These heavier
shapes are intended to carry the photovoltaic panels mounted on top of the lanterns. Several HSS
braced frames provide lateral stability to the lanterns. The lanterns were given a 30 psf dead load in the
shaded region to account for the photovoltaic panels.
Figure 1.1‐2 Lantern Framing Plan

Jacob Wiest || Structural
5 | P a g e
Lateral System
The main lateral resisting elements of the JCA are the five cast‐in‐place reinforced concrete shear walls
that rise continuously through the building. Analysis performed in Technical Report 3 showed that the
concrete frames also had a significant contribution to resisting lateral loads on certain levels, particularly
the frames running in the North/South direction and formed by the wide/shallow beams.
Figure 1.1‐3: Lateral Elements
Shear Walls
Wide/Shallow Beams
E/W Frames
N/S Frames
North

Jacob Wiest || Structural
6 | P a g e
Roof Systems
The roof varies in height in several locations with the floor slabs described earlier in Floor Systems. The
varying heights made snow drift a concern, and the large loads associated with the penthouse floor,
which is the heaviest floor on the building, add a significant contribution to both seismic base shear and
overturning. The green roof and pavers on the penthouse and upper roof levels lay overtop a hot
applied fluid membrane.
Design Codes
The list of Major Codes and Standards on Sheet 1.S001 is as follows:
2009 International Building Code
ACI 318‐08
AISC LRFD, 13th Edition, 2005
AWS D1.1, D1.3, D1.4, Current Edition
ASTM, Current Edition
Steel Deck Institute Design Manual for Composite Deck, Form Decks and Roof Decks., 2007
ASCE 7‐05 Minimum Design Loads

Jacob Wiest || Structural
7 | P a g e
Materials Used
Sheet 1.S001 was used as the reference for materials used in the construction of this project and
summarized in Tables 1.1‐1.
Table 1.1‐1 Materials Used
Usage Weight f'c (psi)
Column (Levels 2‐Rf) Normal 5000
Column (Levels G1‐1) Normal 7000
Floor Slab Normal 5000
Wall Footings Normal 3000
Beams Normal 5000
Slab on Grade Normal 4500
Walls, Piers, & Pilasters Normal 5000
Drilled Piers Normal 4000
LW Concrete Fill on Deck Light 4000
Isolation Slab @ Penthouse Light 4000
Type STM Standa Grade
W Shapes A992
Plates, Angles, Channels A36
High‐Strength Bolts A325 or A490
Anchor Rods F1554 36
Tubes A500 B
Pipes A53 E or S B
Reinforcing Steel A615 60
Reinforcing Steel, Welded A706 60
Roof Deck A653 A ‐ F
Floor Deck A653 C, D, or E
Post‐Tensioned Reinforcment A416‐96
Type STM Standa F'm (psi)
CMU C90 1500
Masonry Mortar C270
Grout C476
Aggregate C404
Concrete
Steel
Masonry

Jacob Wiest || Structural
8 | P a g e
1.2 ‐ Gravity Loads
This section will describe how dead, live, and snow loads were calculated and compared to loadings
given on the structural drawings. Three gravity checks were performed once the loadings were
determined for an interior column, the typical long span for the post tensioned slab, and a doubly
reinforced beam with full hand calculations available in Appendix A.
Dead and Live Loads
The dead loads listed on 1.S001 shown in Figure
7 were used for the purposes of analyses. The
non‐load‐bearing CMU walls were assumed to be
fully grouted for the purposes of worst‐case load
calculations. The weight of the building was
calculated neglecting voids in slabs and with an
assumption of 10 psf for the steel lantern framing,
which would not have much effect on the building
weight were it too small an assumption. The total building weight which was used for the seismic
calculations was in the order of 28000 kips.
Based upon ASCE 7‐05 the 100 psf typical live load was found to be correct, possibly for different
reasons than the designer decided for, and the 40 psf holding cell load was neglected in favor of using
the 100 psf live load in all locations except for the mechanical penthouse and the roof loading.
Design Student
Vegetated Roof 55 55
MEP/Celing 15 15
CMU Partitions Actual Weight
91 pcf (Fully
Grouted
Assumption)
Dead Loads
Table 1.2‐1 Summary of Dead Loads
Design ASCE 7‐05
Typical 10080 (Corrider Above First Floor)
+ 20 (Partition) = 100
Holding Cells 40 ‐
Mechanical
Penthouse150 150
Roof ‐ 20
Live Loads
Table 1.2‐2 Summary of Live Loads

Jacob Wiest || Structural
9 | P a g e
Snow Loads
The flat roof snow load was calculated via the method
outlined in Chapter 7 of ASCE 7‐05. A discrepancy arose as
the importance factor, I, listed on the drawings had a value
of 1.0, whereas the appropriate importance factor for an
Occupancy III building is 1.1. This led to flat roof snow load
value of 22 psf which differs from the calculated value of
23.1 psf. Curiously the design load is higher despite the
lower importance factor which may be a result of a higher
design ground snow load, though this isn’t available on the
drawings.
The varying roof levels led to eight different drift
calculations. Figure 1.2‐1 and Table 1.2‐4 summarize the
snow drift calculations performed.
Ce 1 ASCE 7‐05 Tab. 7‐2
Ct 1 ASCE 7‐05 Tab. 7‐3
pg 25 ASCE 7‐05 Fig. 7‐1
I 1.1 ASCE 7‐05 Tab. 7‐4
pf = 0
20*I= 500
pf = 22
Flat Roof Snow Load
pf = .7 CeCtIpg > 20*I
Table 1.2‐3 Snow Load Parameters and Flat Roof Calculation
Table 1.2‐4 Snow Drift Calculations
1
23 4
5
6
7
8
Figure 1.2‐1 Roof Snow Drift Diagram
γ= 17.25
Lu Ll hc hd Lee hd Wind hd (ft) w (ft) Max psf
Drift 1 130 50 16 3.8 1.8 3.8 3.8 15.2 65.5
Drift 2 93 30.33 18 3.2 1.3 3.2 3.2 13.0 55.9
Drift 3 70 50 18 2.8 1.8 2.8 2.8 11.2 48.5
Drift 4 70 20 21 2.8 1.0 2.8 2.8 11.2 48.5
Drift 5 70 20 14 2.8 1.0 2.8 2.8 11.2 48.5
Drift 6 38 12 14 2.0 0.7 2.0 2.0 8.1 34.8
Drift 7 21 147 16 1.4 3.0 3.0 3.0 12.1 52.0
Drift 8 83 24 52 3.1 1.1 3.1 3.1 12.2 52.8
Snow Drift
Jacob Wiest || Structural
10 | P a g e
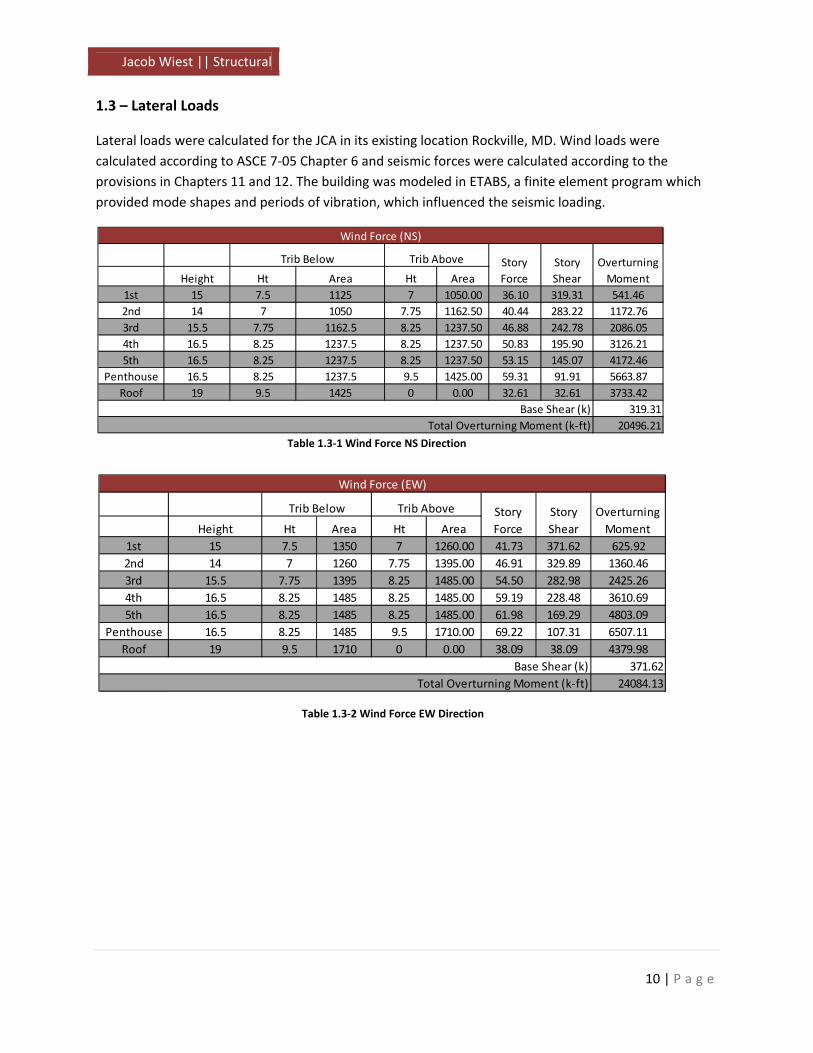
1.3 – Lateral Loads
Lateral loads were calculated for the JCA in its existing location Rockville, MD. Wind loads were
calculated according to ASCE 7‐05 Chapter 6 and seismic forces were calculated according to the
provisions in Chapters 11 and 12. The building was modeled in ETABS, a finite element program which
provided mode shapes and periods of vibration, which influenced the seismic loading.
Height Ht Area Ht Area
1st 15 7.5 1125 7 1050.00 36.10 319.31 541.46
2nd 14 7 1050 7.75 1162.50 40.44 283.22 1172.76
3rd 15.5 7.75 1162.5 8.25 1237.50 46.88 242.78 2086.05
4th 16.5 8.25 1237.5 8.25 1237.50 50.83 195.90 3126.21
5th 16.5 8.25 1237.5 8.25 1237.50 53.15 145.07 4172.46
Penthouse 16.5 8.25 1237.5 9.5 1425.00 59.31 91.91 5663.87
Roof 19 9.5 1425 0 0.00 32.61 32.61 3733.42
319.31
20496.21
Base Shear (k)
Total Overturning Moment (k‐ft)
Wind Force (NS)
Trib Below Trib Above Story
Force
Story
Shear
Overturning
Moment
Height Ht Area Ht Area
1st 15 7.5 1350 7 1260.00 41.73 371.62 625.92
2nd 14 7 1260 7.75 1395.00 46.91 329.89 1360.46
3rd 15.5 7.75 1395 8.25 1485.00 54.50 282.98 2425.26
4th 16.5 8.25 1485 8.25 1485.00 59.19 228.48 3610.69
5th 16.5 8.25 1485 8.25 1485.00 61.98 169.29 4803.09
Penthouse 16.5 8.25 1485 9.5 1710.00 69.22 107.31 6507.11
Roof 19 9.5 1710 0 0.00 38.09 38.09 4379.98
371.62
24084.13
Story
Shear
Overturning
Moment
Trib Above
Base Shear (k)
Total Overturning Moment (k‐ft)
Wind Force (EW)
Trib Below Story
Force
Table 1.3‐1 Wind Force NS Direction
Table 1.3‐2 Wind Force EW Direction

Jacob Wiest || Structural
11 | P a g e
LevelStory Ht
(ft)
Story
Weight (k)Cvx
Story
Force (k)
Shear
Shear (k)
Overturning
Moment (k‐ft)
1 15 4421.1 0.031 23.4 755.2 350.6
2 29 4868.4 0.067 50.2 731.8 1457.2
3 44.5 4954.1 0.104 78.6 681.6 3497.7
4 61 4977.9 0.143 108.3 603.0 6607.2
5 77.5 4967.1 0.182 137.3 494.7 10639.3
PentHouse 94 6902.0 0.317 239.1 357.4 22476.6
Roof 113 3078.7 0.157 118.3 118.3 13364.6
755.2
58393.3
Seismic Forces N/S (X) Direction
Base Shear (k)
Total Overturning Moment (k‐ft)
LevelStory Ht
(ft)
Story
Weight (k)Cvx
Story
Force (k)
Shear
Shear (k)
Overturning
Moment (k‐ft)
1 15 4421.1 0.031 18.3 591.5 274.6
2 29 4868.4 0.067 39.4 573.2 1141.4
3 44.5 4954.1 0.104 61.6 533.9 2739.7
4 61 4977.9 0.143 84.8 472.3 5175.2
5 77.5 4967.1 0.182 107.5 387.5 8333.5
PentHouse 94 6902.0 0.317 187.3 279.9 17605.3
Roof 113 3078.7 0.157 92.6 92.6 10468.2
591.5
45738.0
Base Shear (k)
Total Overturning Moment (k‐ft)
Seismic Forces E/W (Y) Direction
Mode Period
1 1.24 Y Translational
2 1.20 Z Rotational
3 0.92 X Translational
Modal Information, JCA Concrete
Table 1.3‐3 Seismic Forces NS Direction
Table 1.3‐4 Seismic Forces EW Direction
Table 1.3‐5 Modal Information JCA As Designed
Jacob Wiest || Structural
12 | P a g e
1.4 –Proposal/Problem Statement
Structural Depth
The current reinforced concrete building, with post‐tensioned floor slabs and cast‐in‐place shear walls
was analyzed in three previous technical reports and found to be adequate in all respects. It is
hypothesized however, that with no height restrictions, converting the building to steel would be a
competitive solution.
The conversion to steel will mean changing the floor system to concrete on metal deck, employing
either the composite metal deck construction with light weight concrete that was explored in Technical
Report 2 or a more cost effective deck should one be found. The gravity system will be designed based
upon the loading outlined in Technical Report 1, with the initial framing based upon existing locations of
columns, though this may need to be adjusted as the design is further developed. Composite steel
beams and girders will be used to take advantage of the slab strength so that smaller member sizes can
be employed.
After the initial framing has been completed lateral loads will be recalculated using ASCE 7‐05 prescribed
procedures. Braced frames are proposed to replace the existing reinforced concrete shear walls, acting
in their stead as the lateral system of the JCA. As with the columns, the initial trials will use the locations
of the shear walls to place the braced frames, to minimize architectural impacts and due to the
symmetrical layout that did not have torsion issues as reported in Technical Report 3.
Once both gravity loads and lateral loads have been recalculated the existing foundation system will be
investigated to see if it can be reduced to a more efficient solution.
As seismic design is of particular interest to part 2 of the proposal will involve moving the building to San
Francisco where it will be in Seismic Design Category D. The system will be kept as steel braced frames
and the lateral system will be redesigned for the larger seismic loading.

Jacob Wiest || Structural
13 | P a g e
Breadth Study One: Cost and Schedule Analysis
Breadth One will explore a common question in today’s industry, “Concrete or Steel?”, by evaluating the
impacts that changing the system will have on the overall cost and schedule of building. Often designers
will push one concrete and one steel solution deep into the design phase before one ends up being
chosen, a scenario being emulated by the Structural Depth. The object here is to see if the redesign will
lead to a cheaper, faster to construct building that performs on par with the concrete design, and
determine if steel was truly a feasible solution for this project. This depth requires that a schedule be
established for both the existing construction and the redesign and that both options be priced based
upon their materials, associated construction costs, and schedules; the better option will therefore be
based upon which structure is completed quicker and for less cost. The critical path of the building will
be reevaluated and the cost impact of schedule days included in the evaluation of both systems.
Breadth Study Two: Sustainability
The JCA has achieved a LEED Gold rating which was in part made possible by the sustainable rooftop
features. There is approximately 6000 sq ft of green roof as well as photovoltaic panels on the various
levels of the roof. It was thought that perhaps utilizing the entire space for PV panels could prove more
beneficial. Therefore a life cycle analysis would be performed on both systems, taking into account
payback period, carbon output and other factors.
Additionally a comparison of their LEED impacts would be evaluated as well. Areas of possible
improvement in LEED rating not related to the green roof and PV panels would also be explored. A
summary of the findings will be provided.

Jacob Wiest || Structural
14
Chapter 2 – Structural Depth
The Judicial Center Annex is a reinforced concrete structure located in Rockville, MD. As the building is
owned by Montgomery County normal height restrictions have been waived and the building features
larger than typical floor to floor heights. A typical advantage of concrete construction is the thinner
structural framing which allows either for additional floors in a given height or a height reduction for a
given number of floors, allowing for more profitable space or less building envelope for the owner of the
building.
For this reason it is thought that, despite being an area typically dominated by concrete construction, a
design in steel would be a competitive solution. The proposal is therefore to perform a system redesign
of the JCA using steel framing. The floor slab will be converted from post‐tensioned to a composite slab
on metal deck. Gravity members will be designed as composite in an effort to keep the framing shallow.
The lateral system which was made of shear walls will be converted to braced frames.
The new structural system is anticipated to be much lighter than the existing system. This makes it likely
that wind will control the design which was previously dominated by seismic. As seismic design is of
particular interest to the author a further step was proposed for the structural design. The building will
be ‘moved’ to San Francisco, CA. The west coast is well known for its greater seismicity, so making this
move will result in an exploration into seismic design.
2.1 – MD Gravity Design
For this redesign it was attempted to leave the architecture and layout of spaces as unchanged as
possible. The structural grid was therefore kept largely unchanged, choosing to keep column locations
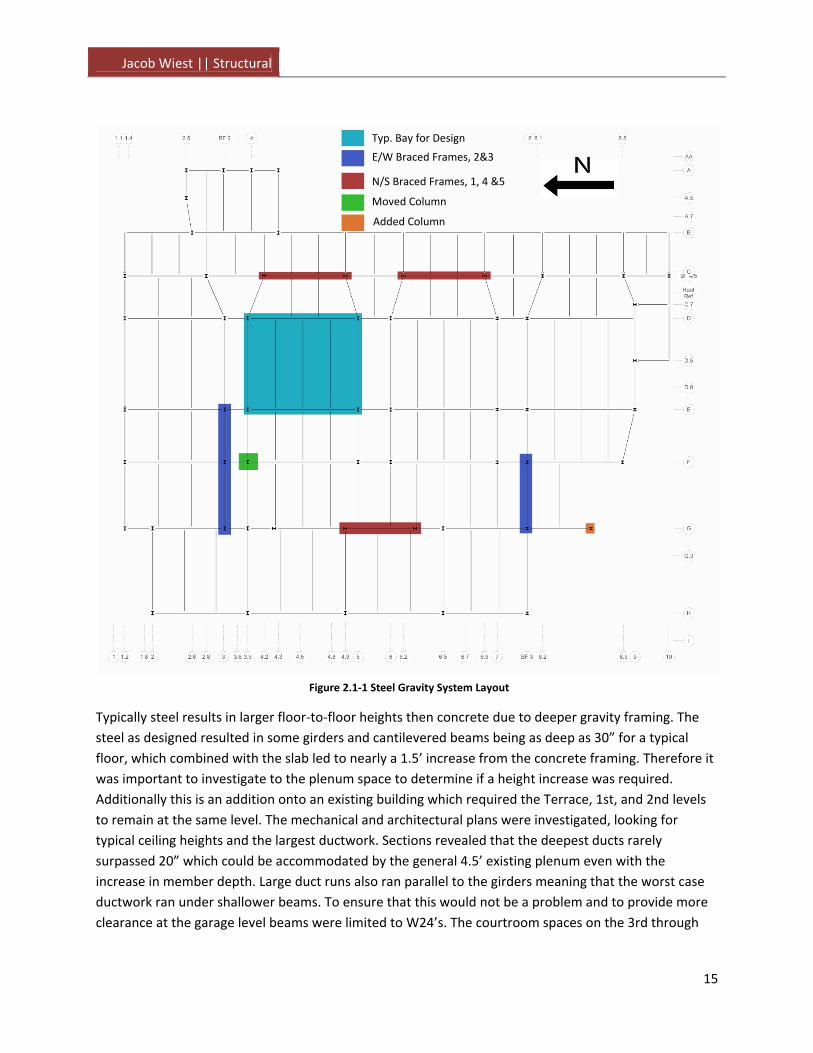
intact and to work around the existing building. Figure 2.1‐1 shows the finalized structural grid with the
girders running in the North/South direction. The original thought was that economy could be achieved
as the smaller bays on either side of the typical design bay shown in the figure would not require an infill
beam and therefore there was the potential for fewer beams. Also of note is that one column was
moved and one column was added to the layout as highlighted in Figure 2.1‐1. In both cases the
architectural plans were checked to ensure that it was possible to do so with little or no impact.
RAM Structural was the primary software used for the design of the gravity system, and with the ability
to easily change the framing and determine if the earlier hypothesis was in fact more economical two
RAM models were created with girders running in either direction. As hypothesized the N/S girder
design was more economical in terms of steel tonnage, though it turns out less pieces were used
framing it in the E/W direction. In order to accommodate the 12’ bays with no infill beams the deck
selected was 2VLI18 to allow for un‐shored construction which would have the potential for cost
savings. This was increased to a 3VLI16 for the penthouse level. The gravity design was compared to the
typical bay designed by hand as well as a gravity check in ETABS. The numbers were all found to be
satisfactorily close. Appendix D contains the hand check.
Jacob Wiest || Structural
15
Typically steel results in larger floor‐to‐floor heights then concrete due to deeper gravity framing. The
steel as designed resulted in some girders and cantilevered beams being as deep as 30” for a typical
floor, which combined with the slab led to nearly a 1.5’ increase from the concrete framing. Therefore it
was important to investigate to the plenum space to determine if a height increase was required.
Additionally this is an addition onto an existing building which required the Terrace, 1st, and 2nd levels
to remain at the same level. The mechanical and architectural plans were investigated, looking for
typical ceiling heights and the largest ductwork. Sections revealed that the deepest ducts rarely
surpassed 20” which could be accommodated by the general 4.5’ existing plenum even with the
increase in member depth. Large duct runs also ran parallel to the girders meaning that the worst case
ductwork ran under shallower beams. To ensure that this would not be a problem and to provide more
clearance at the garage level beams were limited to W24’s. The courtroom spaces on the 3rd through
Typ. Bay for Design
E/W Braced Frames, 2&3
N/S Braced Frames, 1, 4 &5
Moved Column
Added Column
Figure 2.1‐1 Steel Gravity System Layout

Jacob Wiest || Structural
16
5th levels, while not featuring large ductwork, were of concern so these levels were increased by 6”
each resulting in an overall building height increase of 1.5’.
2.2 – MD Lateral System & Foundation Design
The first step of the lateral system redesign was recalculating the lateral wind and seismic loading. As
the building system had changed markedly the weight of the structure needed recalculating to
determine the new seismic loads. The wind load was also recalculated, though the 1.5’ increase in
height did not make a large difference. The terrace level was used as the seismic base.
Seismic
The weight of the building was recalculated to approximately 15500 kips. This meant that the building
mass affecting the seismic forces had changed from approximately 160 psf to 80 psf. The Equivalent
Lateral Force Procedure as detailed in ASCE7‐05 section 12.8 was used to calculate story forces that
would represent the inertial response of the building due to seismic loading. The seismic parameters
are shown in Table 2.2‐1 and the story forces and shears are shown in Table 2.2‐2.
Table 2.2‐1 Seismic Design Parameters
I 1.25
R 3
SDs 0.1664
SD1 0.0816
Ct 0.02
x 0.75
hn 114
Ta 0.707
Cu 1.7
T 1.202
SDS/(R/I) SD1/(T(R/I))
Cs 0.069 0.028
W (kips) 15448
V (kips) 437
Seismic Design Parameters
Jacob Wiest || Structural
17
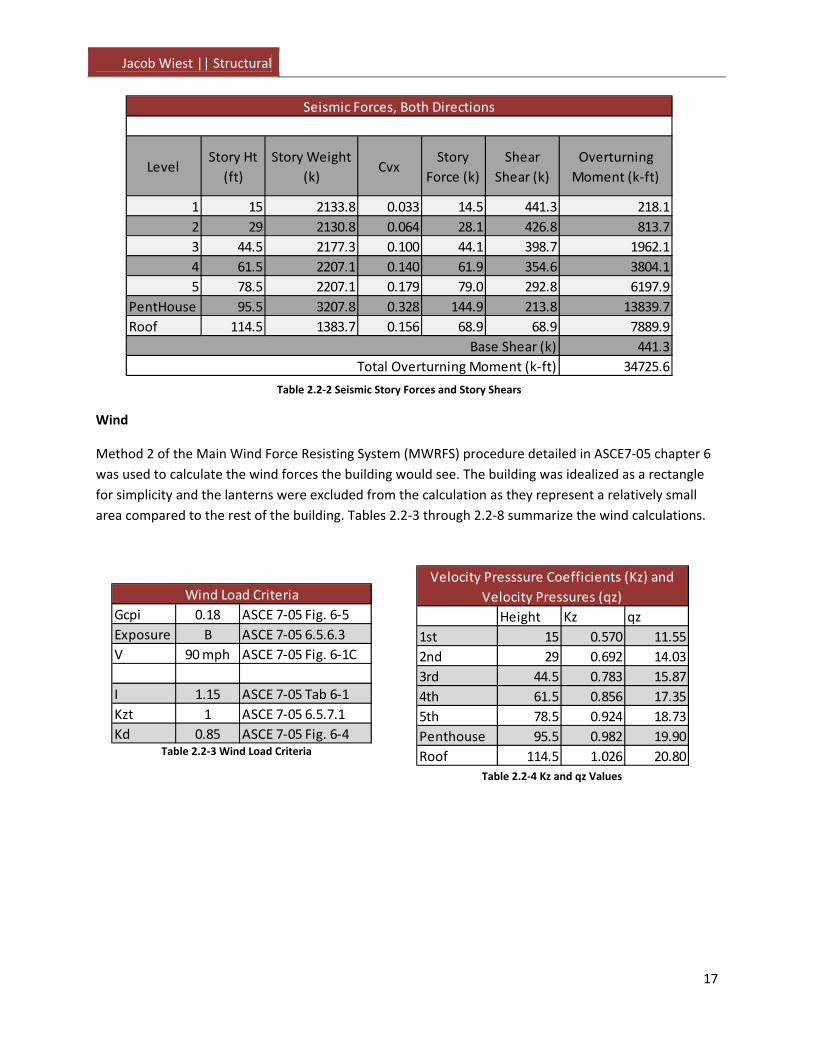
Wind
Method 2 of the Main Wind Force Resisting System (MWRFS) procedure detailed in ASCE7‐05 chapter 6
was used to calculate the wind forces the building would see. The building was idealized as a rectangle
for simplicity and the lanterns were excluded from the calculation as they represent a relatively small
area compared to the rest of the building. Tables 2.2‐3 through 2.2‐8 summarize the wind calculations.
LevelStory Ht
(ft)
Story Weight
(k)Cvx
Story
Force (k)
Shear
Shear (k)
Overturning
Moment (k‐ft)
1 15 2133.8 0.033 14.5 441.3 218.1
2 29 2130.8 0.064 28.1 426.8 813.7
3 44.5 2177.3 0.100 44.1 398.7 1962.1
4 61.5 2207.1 0.140 61.9 354.6 3804.1
5 78.5 2207.1 0.179 79.0 292.8 6197.9
PentHouse 95.5 3207.8 0.328 144.9 213.8 13839.7
Roof 114.5 1383.7 0.156 68.9 68.9 7889.9
441.3
34725.6Total Overturning Moment (k‐ft)
Seismic Forces, Both Directions
Base Shear (k)
Gcpi 0.18 ASCE 7‐05 Fig. 6‐5
Exposure B ASCE 7‐05 6.5.6.3
V 90 mph ASCE 7‐05 Fig. 6‐1C
I 1.15 ASCE 7‐05 Tab 6‐1
Kzt 1 ASCE 7‐05 6.5.7.1
Kd 0.85 ASCE 7‐05 Fig. 6‐4
Wind Load Criteria
Height Kz qz
1st 15 0.570 11.55
2nd 29 0.692 14.03
3rd 44.5 0.783 15.87
4th 61.5 0.856 17.35
5th 78.5 0.924 18.73
Penthouse 95.5 0.982 19.90
Roof 114.5 1.026 20.80
Velocity Presssure Coefficients (Kz) and
Velocity Pressures (qz)
Table 2.2‐2 Seismic Story Forces and Story Shears
Table 2.2‐3 Wind Load Criteria
Table 2.2‐4 Kz and qz Values

Jacob Wiest || Structural
18
(+) Gcpi (‐) Gcpi (+) Gcpi (‐) Gcpi
1st 15 7.86 3.74 ‐3.74 4.11 11.60
2nd 29 9.54 3.74 ‐3.74 5.79 13.28
3rd 44.5 10.79 3.74 ‐3.74 7.05 14.54
4th 61 11.80 3.74 ‐3.74 8.06 15.54
5th 77.5 12.74 3.74 ‐3.74 8.99 16.48
Penthouse 94 13.54 3.74 ‐3.74 9.79 17.28
Roof 115 14.14 3.74 ‐3.74 10.40 17.88
Leeward All ‐ ‐8.13 3.74 ‐3.74 ‐11.87 ‐4.39
Side Walls All ‐ ‐12.37 3.74 ‐3.74 ‐16.12 ‐8.63
0 ‐ 50 ‐16.76 3.74 ‐3.74 ‐20.50 ‐13.01
> 50 ‐15.49 3.74 ‐3.74 ‐19.23 ‐11.74
Net Pressure
Roof
Windward
Design Wind Pressure E/W
Distance Wind PressureInternal Pressure
(+) Gcpi (‐) Gcpi (+) Gcpi (‐) Gcpi
1st 15 7.86 3.74 ‐3.74 4.11 11.60
2nd 29 9.54 3.74 ‐3.74 5.79 13.28
3rd 44.5 10.79 3.74 ‐3.74 7.05 14.54
4th 61.5 11.80 3.74 ‐3.74 8.06 15.54
5th 78.5 12.74 3.74 ‐3.74 8.99 16.48
Penthouse 95.5 13.54 3.74 ‐3.74 9.79 17.28
Roof 114.5 14.14 3.74 ‐3.74 10.40 17.88
Leeward All ‐ ‐8.74 3.74 ‐3.74 ‐12.48 ‐5.00
Side Walls All ‐ ‐12.24 3.74 ‐3.74 ‐15.98 ‐8.50
0 ‐ 50 ‐18.19 3.74 ‐3.74 ‐21.93 ‐14.45
> 50 ‐14.55 3.74 ‐3.74 ‐18.29 ‐10.81Roof
Windward
Design Wind Pressure N/S
Distance Wind PressureInternal Pressure Net Pressure
Table 2.2‐5 Design Wind Pressure in the North/South Direction
Table 2.2‐6 Design Wind Pressure in the North/South Direction

Jacob Wiest || Structural
19
The seismic forces were still found to generate a higher un‐factored base shear. It can be seen though
that the strength design of the structure will in general be controlled by the wind forces. Seismic will
likely control drift as it will be modified by Cd/I and drift due to wind can be reduced by a factor of 0.7
according to ASCE7‐05 load combination CC‐3.
Height Ht Area Ht Area
1st 15 7.5 1350 7 1260.00 41.73 377.12 625.92
2nd 14 7 1260 7.75 1395.00 46.91 335.39 1360.46
3rd 15.5 7.75 1395 8.5 1530.00 55.35 288.48 2463.15
4th 17 8.5 1530 8.5 1530.00 60.99 233.13 3720.11
5th 17 8.5 1530 8.5 1530.00 63.85 172.14 4948.63
Penthouse 17 8.5 1530 9.5 1710.00 70.20 108.29 6598.76
Roof 19 9.5 1710 0 0.00 38.09 38.09 4379.98
377.12
24474.13
Base Shear (k)
Total Overturning Moment (k‐ft)
Wind Force (EW)
Trib Below Story
Force
Story
Shear
Overturning
Moment
Trib Above
Table 2.2‐7 Wind Story Forces and Story Shears in the North/South Direction
Table 2.2‐8 Wind Story Forces and Story Shears in the East/West Direction
Height Ht Area Ht Area
1st 15 7.5 1125 7 1050.00 36.10 324.03 541.46
2nd 14 7 1050 7.75 1162.50 40.44 287.94 1172.76
3rd 15.5 7.75 1162.5 8.5 1275.00 47.61 247.50 2118.64
4th 17 8.5 1275 8.5 1275.00 52.37 199.89 3220.94
5th 17 8.5 1275 8.5 1275.00 54.76 147.51 4298.90
Penthouse 17 8.5 1275 9.5 1425.00 60.14 92.75 5743.64
Roof 19 9.5 1425 0 0.00 32.61 32.61 3733.42
324.03
20829.75
Base Shear (k)
Total Overturning Moment (k‐ft)
Wind Force (NS)
Trib Below Trib Above Story
Force
Story
Shear
Overturning
Moment
Jacob Wiest || Structural
20
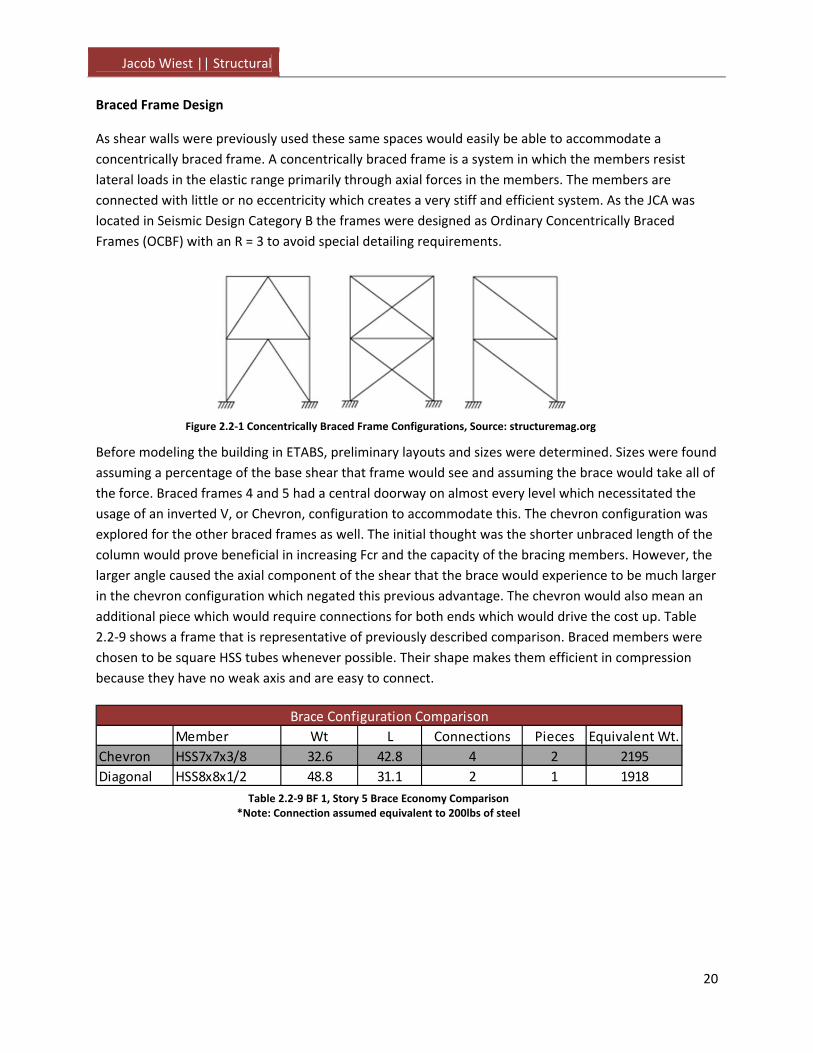
Braced Frame Design
As shear walls were previously used these same spaces would easily be able to accommodate a
concentrically braced frame. A concentrically braced frame is a system in which the members resist
lateral loads in the elastic range primarily through axial forces in the members. The members are
connected with little or no eccentricity which creates a very stiff and efficient system. As the JCA was
located in Seismic Design Category B the frames were designed as Ordinary Concentrically Braced
Frames (OCBF) with an R = 3 to avoid special detailing requirements.
Before modeling the building in ETABS, preliminary layouts and sizes were determined. Sizes were found
assuming a percentage of the base shear that frame would see and assuming the brace would take all of
the force. Braced frames 4 and 5 had a central doorway on almost every level which necessitated the
usage of an inverted V, or Chevron, configuration to accommodate this. The chevron configuration was
explored for the other braced frames as well. The initial thought was the shorter unbraced length of the
column would prove beneficial in increasing Fcr and the capacity of the bracing members. However, the
larger angle caused the axial component of the shear that the brace would experience to be much larger
in the chevron configuration which negated this previous advantage. The chevron would also mean an
additional piece which would require connections for both ends which would drive the cost up. Table
2.2‐9 shows a frame that is representative of previously described comparison. Braced members were
chosen to be square HSS tubes whenever possible. Their shape makes them efficient in compression
because they have no weak axis and are easy to connect.
Col
Figure 2.2‐1 Concentrically Braced Frame Configurations, Source: structuremag.org
Member Wt L Connections Pieces Equivalent Wt.
Chevron HSS7x7x3/8 32.6 42.8 4 2 2195
Diagonal HSS8x8x1/2 48.8 31.1 2 1 1918
Brace Configuration Comparison
Table 2.2‐9 BF 1, Story 5 Brace Economy Comparison *Note: Connection assumed equivalent to 200lbs of steel

Jacob Wiest || Structural
21
.
ETABS, a finite element program, was used to model the structural system. Only the lateral system was
modeled, which is an acceptable simplification. Centerline modeling was used and since connections
were modeled as pinned (no moment frames) Panel Zones were not explicitly modeled and a rigid end
offset factor was kept as 0. The diaphragms were modeled as rigid and the mass of each story was
assumed lumped at the respective diaphragm. The X‐direction in the model corresponds to the N/S
direction in plan.
Table 2.2‐10 shows the building period for the first three modes. The number seems unusually high
which may be a result of a very flexible system. As the periods for the motion in both the X and Y
directions were found to be greater than Cu*Ta the seismic forces required no adjustment.
E/W Braces 2 and 3
Chevron Braces 4 & 5
Brace 1
Figure 2.2‐2 BF Layout
Mode Period UX UY
1 2.61 3.67 59.94 Y‐Translational
2 2.45 35.82 8.69 Z‐Rotational
3 2.02 32.10 0.23 X‐Translational
MD Modes and Participating Mass
Table 2.2‐10 Mode Shapes and Participating Mass

Jacob Wiest || Structural
22
The initial sizes were downsized as much as the strength design would allow, but drifts still easily passed
the requirements. Tables 2.2‐11 through 14 show the worst case seismic and wind drift for both
directions.
Story Height δxe δye δx δy Δx Δy
Roof 19.50 2.56 ‐ 6.66 ‐ 1.38 ‐ 3.51
Penthouse 18.50 2.03 ‐ 5.28 ‐ 1.07 ‐ 3.33
Level 5 18.00 1.62 ‐ 4.21 ‐ 1.07 ‐ 3.24
Level 4 18.00 1.21 ‐ 3.15 ‐ 1.07 ‐ 3.24
Level 3 17.00 0.80 ‐ 2.08 ‐ 0.88 ‐ 3.06
Level 2 15.50 0.46 ‐ 1.20 ‐ 0.73 ‐ 2.79
Level 1 16.60 0.18 ‐ 0.47 ‐ 0.42 ‐ 2.99
Terrace 11.50 0.02 ‐ 0.05 ‐ 0.05 ‐ 2.07
QCXE
Amplified by Cd/IΔa = .015sx
Story Height δxe δye δx δy Δx Δy
Roof 19.50 ‐ 2.70 ‐ 7.02 ‐ 1.22 3.51
Penthouse 18.50 ‐ 2.23 ‐ 5.80 ‐ 1.27 3.33
Level 5 18.00 ‐ 1.74 ‐ 4.52 ‐ 1.30 3.24
Level 4 18.00 ‐ 1.24 ‐ 3.22 ‐ 1.17 3.24
Level 3 17.00 ‐ 0.79 ‐ 2.05 ‐ 1.01 3.06
Level 2 15.50 ‐ 0.40 ‐ 1.04 ‐ 0.73 2.79
Level 1 16.60 ‐ 0.12 ‐ 0.31 ‐ 0.26 2.99
Terrace 11.50 ‐ 0.02 ‐ 0.05 ‐ 0.05 2.07
QCY
Amplified by Cd/IΔa = .015sx
Table 2.2‐11 Deflection and Story Drift Due to Seismic Forces Applied in the N/S + Eccentricity
Table 2.2‐12 Deflection and Story Drift Due to Seismic Forces Applied Directly in the E/W Direction

Jacob Wiest || Structural
23
Story Height δxw δyw Δx Δy
Roof 19.50 1.88 ‐ 0.38 ‐ 0.59
Penthouse 18.50 1.5 ‐ 0.28 ‐ 0.56
Level 5 18.00 1.22 ‐ 0.29 ‐ 0.54
Level 4 18.00 0.93 ‐ 0.29 ‐ 0.54
Level 3 17.00 0.64 ‐ 0.27 ‐ 0.51
Level 2 15.50 0.37 ‐ 0.21 ‐ 0.47
Level 1 16.60 0.16 ‐ 0.15 ‐ 0.50
Terrace 11.50 0.01 ‐ 0.01 ‐ 0.35
WC2XEA
Δa = H/400
Story Height δxw δyw Δx Δy
Roof 19.50 ‐ 2.49 ‐ 0.43 0.59
Penthouse 18.50 ‐ 2.06 ‐ 0.44 0.56
Level 5 18.00 ‐ 1.62 ‐ 0.42 0.54
Level 4 18.00 ‐ 1.20 ‐ 0.41 0.54
Level 3 17.00 ‐ 0.79 ‐ 0.38 0.51
Level 2 15.50 ‐ 0.41 ‐ 0.28 0.47
Level 1 16.60 ‐ 0.13 ‐ 0.12 0.50
Terrace 11.50 ‐ 0.01 ‐ 0.01 0.35
Δa = H/400
WC2YEB
Table 2.2‐13 Deflection and Story Drift Due to Wind Forces: Wind Case 2 N/S Direction, Positive Eccentricity
Table 2.2‐14 Deflection and Story Drift Due to Wind Forces: Wind Case 2 E/W Direction, Negative Eccentricity
Jacob Wiest || Structural
24
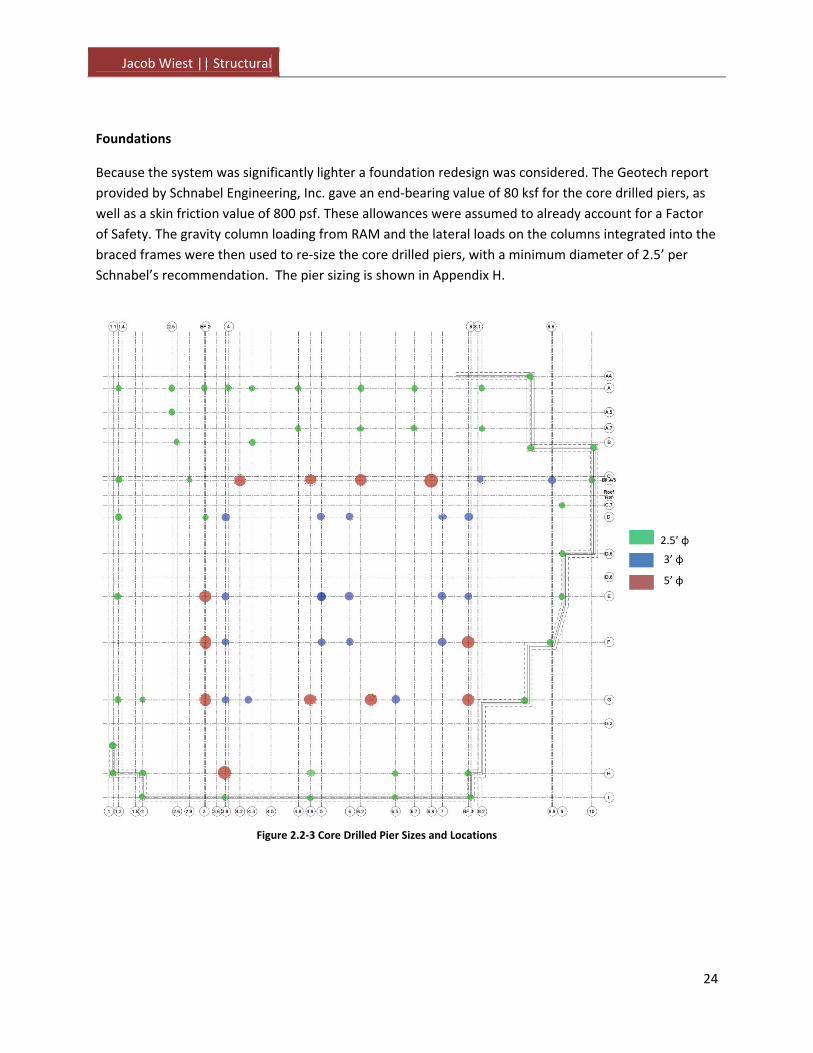
Foundations
Because the system was significantly lighter a foundation redesign was considered. The Geotech report
provided by Schnabel Engineering, Inc. gave an end‐bearing value of 80 ksf for the core drilled piers, as
well as a skin friction value of 800 psf. These allowances were assumed to already account for a Factor
of Safety. The gravity column loading from RAM and the lateral loads on the columns integrated into the
braced frames were then used to re‐size the core drilled piers, with a minimum diameter of 2.5’ per
Schnabel’s recommendation. The pier sizing is shown in Appendix H.
2.5’ φ
3’ φ
5’ φ
Figure 2.2‐3 Core Drilled Pier Sizes and Locations

Jacob Wiest || Structural
25
Summary
The braced frames were able to adequately replace the former shear wall system. Torsional
irregularities were not considered in the scope of the first part of this depth as it is not required in SDC
B. The weight in steel of the redesign came in at 9.9 lbs/sq ft, with 15% of that accounted for by the
lateral system. Figures 2.2‐5 through 2.2‐8 show the elevations of the braced frames with the sections.
Figure 2.2‐4 BF 1 Figure 2.2‐5 BF 2 Figure 2.2‐6 BF 3

Jacob Wiest || Structural
26
Figure 2.2‐8 BF 4 & 5
Jacob Wiest || Structural
27
2.3 – CA Lateral Design, Layout 1
The second phase to be investigated for the structural depth is the move to a region of greater
seismicity, which in this case was arbitrarily chosen as San Francisco. Assuming Site Class D the Seismic
Design Category increased from B to D. The change in SDC results in a host of provisions from ASCE7‐05
needing accounted for that did not previously apply.
One such factor is ρ, the redundancy factor, which drove the seismic exploration. ASCE7‐05 section
12.3.4.2 requires that the horizontal and vertical seismic load effects be multiplied by 1.3 unless stories
which resist more than 35% of the base shear do not face a 33% strength reduction by the removal of an
individual brace or develop an extreme torsion irregularity due to this removal. The current layout
would not have a chance of earning this as in the East/West direction there are two frames, so removing
one brace would drop the strength by 50%. To remedy this frames would be added in an effort to keep
ρ = 1, but for comparison purposes the braces would be sized using the layout from Rockville initially.
Seismic
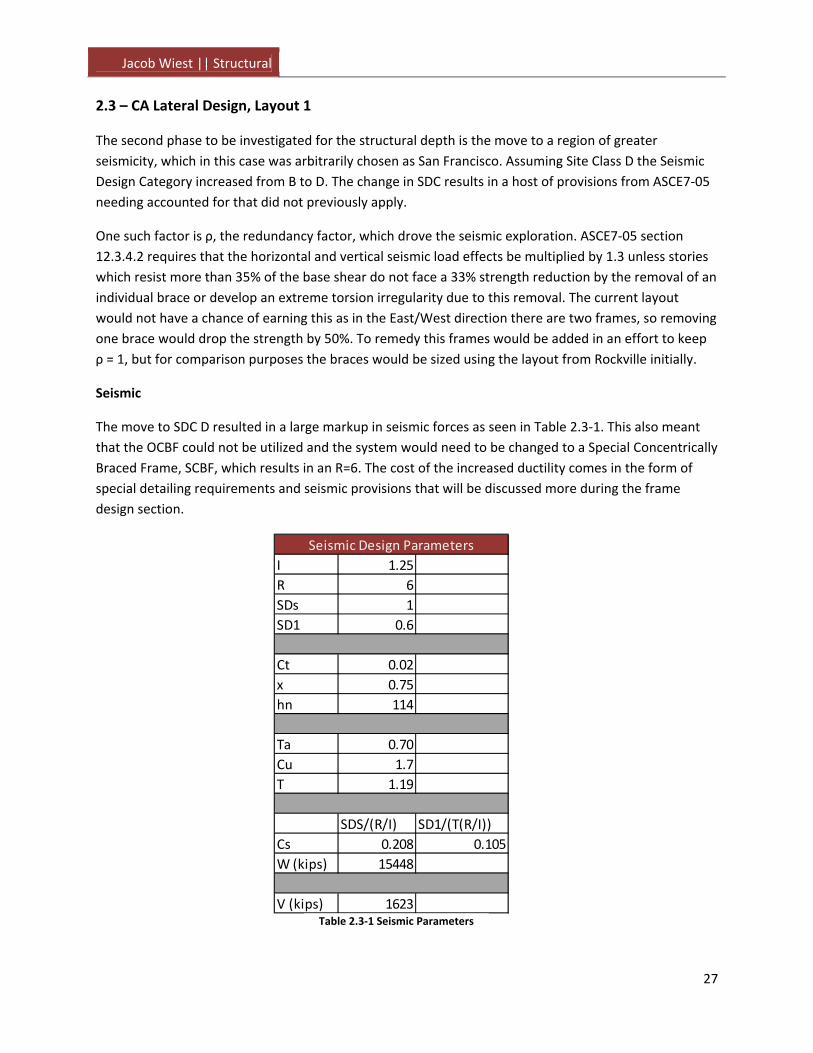
The move to SDC D resulted in a large markup in seismic forces as seen in Table 2.3‐1. This also meant
that the OCBF could not be utilized and the system would need to be changed to a Special Concentrically
Braced Frame, SCBF, which results in an R=6. The cost of the increased ductility comes in the form of
special detailing requirements and seismic provisions that will be discussed more during the frame
design section.
I 1.25
R 6
SDs 1
SD1 0.6
Ct 0.02
x 0.75
hn 114
Ta 0.70
Cu 1.7
T 1.19
SDS/(R/I) SD1/(T(R/I))
Cs 0.208 0.105
W (kips) 15448
V (kips) 1623
Seismic Design Parameters
Table 2.3‐1 Seismic Parameters

Jacob Wiest || Structural
28
Due to the large loading it was thought prudent to invoke ASCE7‐05 section 12.9 and perform a Modal
Response Spectrum Analysis. The number of modes used was dictated by having over 90% modal mass
participation in both directions. Section 11.4.5 was used to determine the design spectrum as shown in
Figure 2.3‐1, and the response parameters were combined using square root of the sum squares
method, which is included in Appendix J. The resultant base shear in both directions was limited to a
reduction of 85% of the base shear calculated using the Equivalent Lateral Force Procedure. Table 2.3‐2
shows the revised lateral forces the building experiences do to seismic response.
Table 2.3‐2 Seismic Parameters
LevelStory Ht
(ft)
Story Weight
(k)Cvx
Story
Force (k)
Shear
Shear (k)
Overturning
Moment (k‐ft)
1 15 2133.8 0.033 45.6 1383.7 683.7
2 29 2130.8 0.064 88.0 1338.1 2551.3
3 44.5 2177.3 0.100 138.2 1250.1 6151.7
4 61.5 2207.1 0.140 193.9 1111.9 11927.0
5 78.5 2207.1 0.179 247.5 917.9 19432.1
PentHouse 95.5 3207.8 0.328 454.4 670.4 43391.3
Roof 114.5 1383.7 0.156 216.0 216.0 24737.0
1383.7
108874.1Total Overturning Moment (k‐ft)
Seismic Forces, Both Directions
Base Shear (k)
Figure 2.3‐1 Design Response Spectrum, ASCE7‐05
Jacob Wiest || Structural
29
Wind
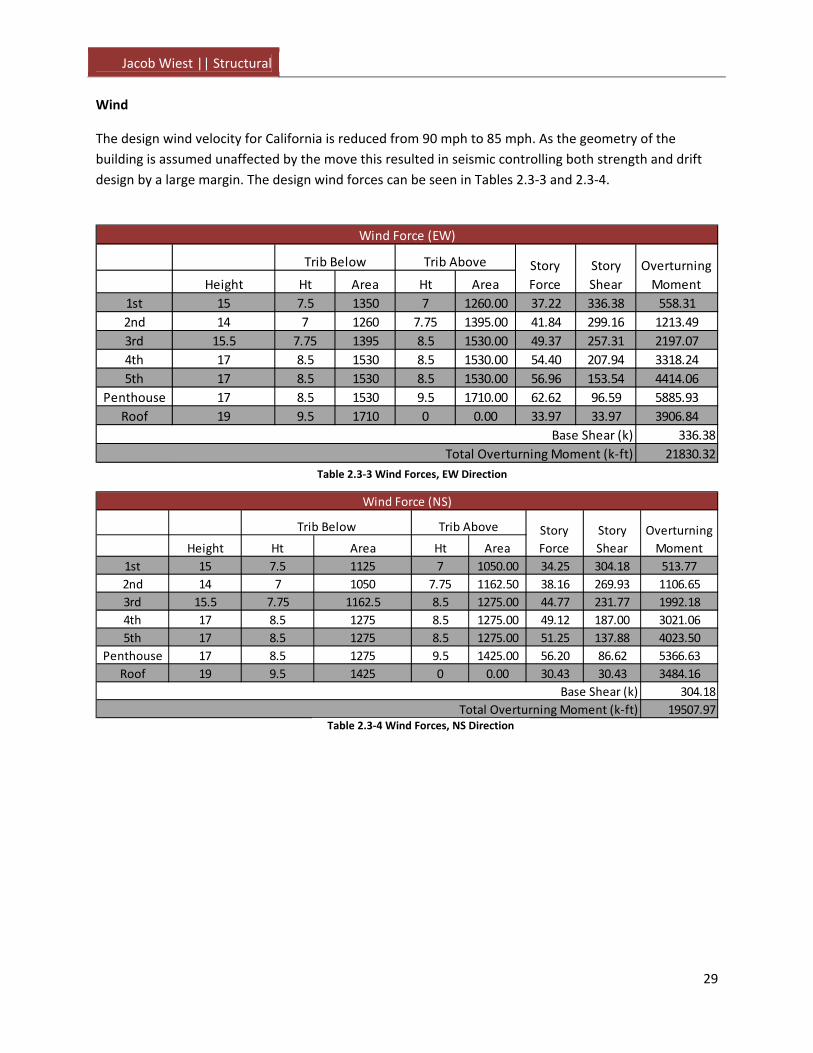
The design wind velocity for California is reduced from 90 mph to 85 mph. As the geometry of the
building is assumed unaffected by the move this resulted in seismic controlling both strength and drift
design by a large margin. The design wind forces can be seen in Tables 2.3‐3 and 2.3‐4.
Height Ht Area Ht Area
1st 15 7.5 1350 7 1260.00 37.22 336.38 558.31
2nd 14 7 1260 7.75 1395.00 41.84 299.16 1213.49
3rd 15.5 7.75 1395 8.5 1530.00 49.37 257.31 2197.07
4th 17 8.5 1530 8.5 1530.00 54.40 207.94 3318.24
5th 17 8.5 1530 8.5 1530.00 56.96 153.54 4414.06
Penthouse 17 8.5 1530 9.5 1710.00 62.62 96.59 5885.93
Roof 19 9.5 1710 0 0.00 33.97 33.97 3906.84
336.38
21830.32
Base Shear (k)
Total Overturning Moment (k‐ft)
Wind Force (EW)
Trib Below Story
Force
Story
Shear
Overturning
Moment
Trib Above
Height Ht Area Ht Area
1st 15 7.5 1125 7 1050.00 34.25 304.18 513.77
2nd 14 7 1050 7.75 1162.50 38.16 269.93 1106.65
3rd 15.5 7.75 1162.5 8.5 1275.00 44.77 231.77 1992.18
4th 17 8.5 1275 8.5 1275.00 49.12 187.00 3021.06
5th 17 8.5 1275 8.5 1275.00 51.25 137.88 4023.50
Penthouse 17 8.5 1275 9.5 1425.00 56.20 86.62 5366.63
Roof 19 9.5 1425 0 0.00 30.43 30.43 3484.16
304.18
19507.97
Base Shear (k)
Total Overturning Moment (k‐ft)
Wind Force (NS)
Trib Below Trib Above Story
Force
Story
Shear
Overturning
Moment
Table 2.3‐4 Wind Forces, NS Direction
Table 2.3‐3 Wind Forces, EW Direction
Jacob Wiest || Structural
30
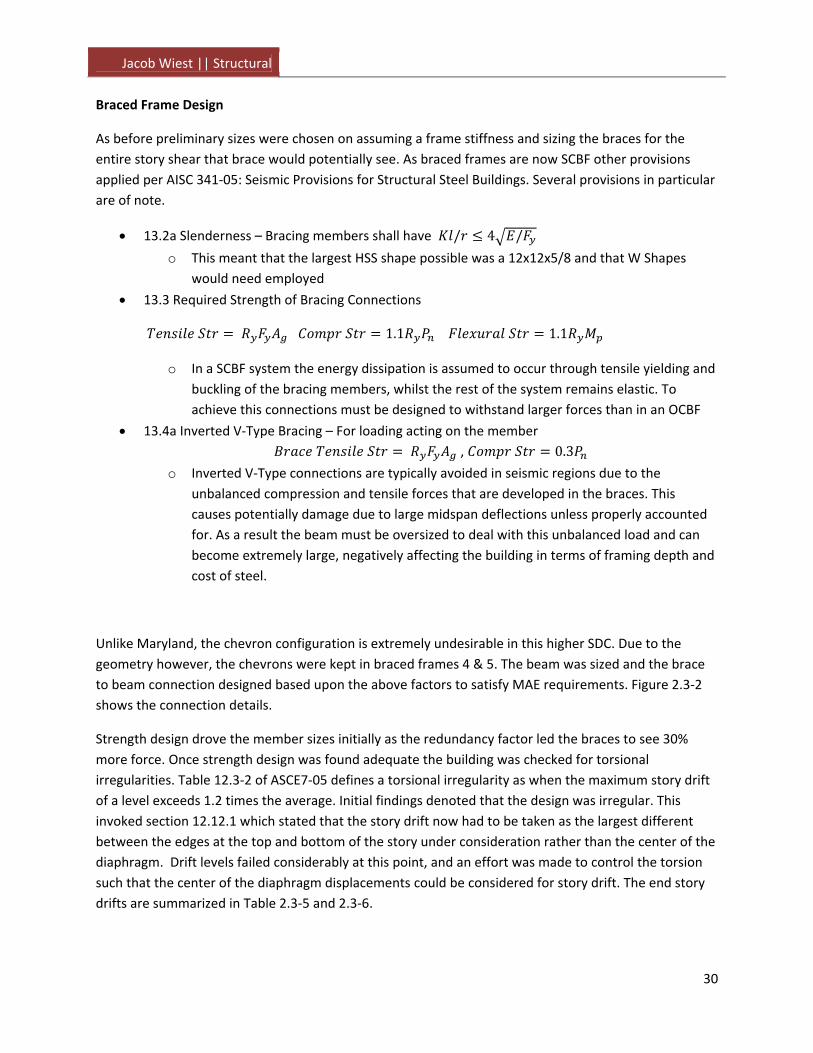
Braced Frame Design
As before preliminary sizes were chosen on assuming a frame stiffness and sizing the braces for the
entire story shear that brace would potentially see. As braced frames are now SCBF other provisions
applied per AISC 341‐05: Seismic Provisions for Structural Steel Buildings. Several provisions in particular
are of note.
13.2a Slenderness – Bracing members shall have / 4 /
o This meant that the largest HSS shape possible was a 12x12x5/8 and that W Shapes
would need employed
13.3 Required Strength of Bracing Connections
1.1 1.1
o In a SCBF system the energy dissipation is assumed to occur through tensile yielding and
buckling of the bracing members, whilst the rest of the system remains elastic. To
achieve this connections must be designed to withstand larger forces than in an OCBF
13.4a Inverted V‐Type Bracing – For loading acting on the member
, 0.3
o Inverted V‐Type connections are typically avoided in seismic regions due to the
unbalanced compression and tensile forces that are developed in the braces. This
causes potentially damage due to large midspan deflections unless properly accounted
for. As a result the beam must be oversized to deal with this unbalanced load and can
become extremely large, negatively affecting the building in terms of framing depth and
cost of steel.
Unlike Maryland, the chevron configuration is extremely undesirable in this higher SDC. Due to the
geometry however, the chevrons were kept in braced frames 4 & 5. The beam was sized and the brace
to beam connection designed based upon the above factors to satisfy MAE requirements. Figure 2.3‐2
shows the connection details.
Strength design drove the member sizes initially as the redundancy factor led the braces to see 30%
more force. Once strength design was found adequate the building was checked for torsional
irregularities. Table 12.3‐2 of ASCE7‐05 defines a torsional irregularity as when the maximum story drift
of a level exceeds 1.2 times the average. Initial findings denoted that the design was irregular. This
invoked section 12.12.1 which stated that the story drift now had to be taken as the largest different
between the edges at the top and bottom of the story under consideration rather than the center of the
diaphragm. Drift levels failed considerably at this point, and an effort was made to control the torsion
such that the center of the diaphragm displacements could be considered for story drift. The end story
drifts are summarized in Table 2.3‐5 and 2.3‐6.

Jacob Wiest || Structural
31
HSS8x8x1/2
TYP.
W33x354 (2) 3/8” x 3 ½” PL
1/4
1/4 TYP.
TYP.
3/8
3/8
1” PL
3/8 + Gap
5/8” x 5 1/4” PL
Figure 2.3‐2 Designed Chevron SCBF Brace to Beam Connection
Story δmax δmin δavg δmax/δavg Δ1 Δ2 Δavg Δmax/Δavg Ax
Roof 4.53 3.13 3.83 1.18 0.84 0.69 0.77 1.1 0.97
Penthouse 3.69 2.44 3.065 1.20 0.79 0.50 0.65 1.2 1.01
Level 5 2.9 1.94 2.42 1.20 0.78 0.51 0.65 1.2 1.00
Level 4 2.12 1.43 1.775 1.19 0.74 0.50 0.62 1.2 0.99
Level 3 1.38 0.93 1.155 1.19 0.58 0.39 0.49 1.2 0.99
Level 2 0.8 0.54 0.67 1.19 0.45 0.31 0.38 1.2 0.99
Level 1 0.35 0.23 0.29 1.21 0.35 0.23 0.29 1.2 1.01
Torsional Irregularity X Direction
Table 2.3‐5 Torsional Irregularity Check X Direction

Jacob Wiest || Structural
32
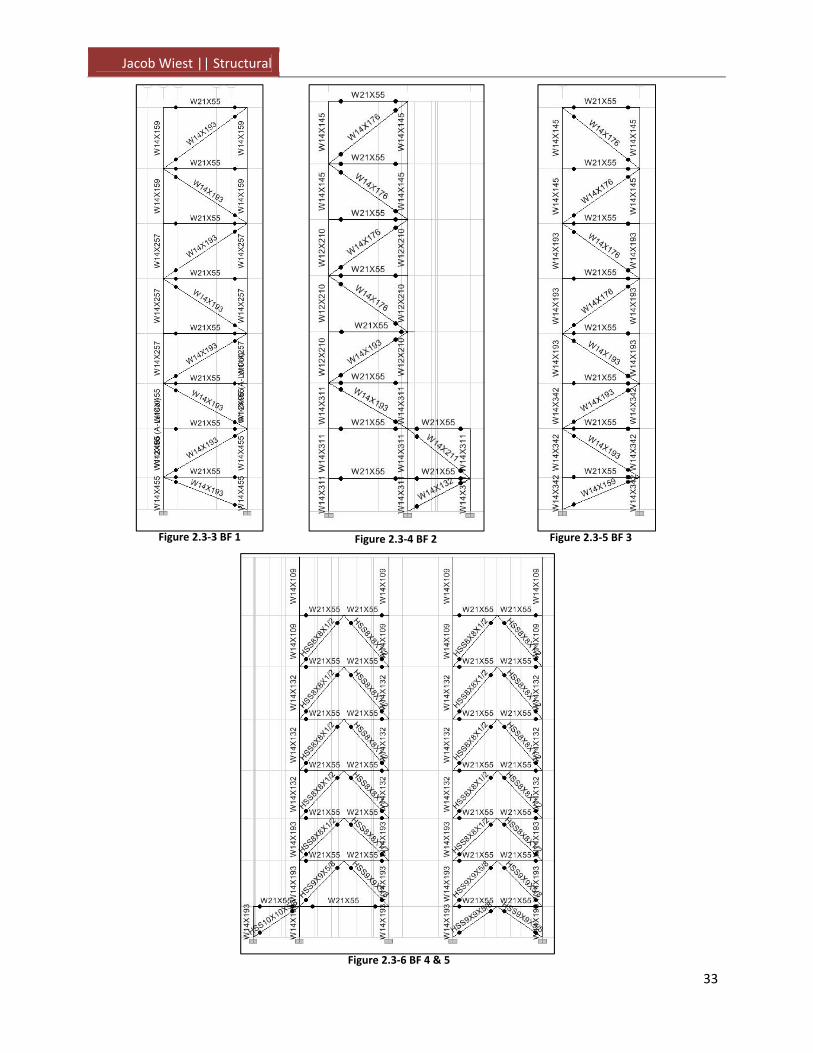
Summary
Difficulties controlling story drift resulted in very large members. The virtual work feature embedded
within ETABS indicated that the lower story columns contributed the most and therefore these were
typically targeted rather than upsizing the braces adequate for strength conditions. To accommodate
the new seismic forces the weight of steel in the lateral system increased by a factor of 2.2, bringing the
weight of steel per square foot in the building to 11.7 lbs.
Story δmax δmin δavg δmax/δavg Δ1 Δ2 Δavg Δmax/Δavg
Roof 5.31 4.38 4.845 1.10 0.97 0.85 0.91 1.1 0.83
Penthouse 4.34 3.53 3.935 1.10 0.95 0.82 0.89 1.1 0.84
Level 5 3.39 2.71 3.05 1.11 0.95 0.82 0.89 1.1 0.86
Level 4 2.44 1.89 2.165 1.13 0.85 0.75 0.80 1.1 0.88
Level 3 1.59 1.14 1.365 1.16 0.69 0.59 0.64 1.1 0.94
Level 2 0.9 0.55 0.725 1.24 0.51 0.25 0.38 1.1 1.07
Level 1 0.39 0.3 0.345 1.13 0.39 0.30 0.35 1.1 0.89
Torsional Irregularity Y Direction
Table 2.3‐6 Torsional Irregularity Check Y Direction
Mode Period UX UY
1 1.75 0.10 68.14 Y Translational
2 1.55 34.61 0.35 Z Rotational
3 1.39 37.30 0.02 X Tranlational
Modal Information, CA Layout 1
Table 2.3‐7 Modal Information
Jacob Wiest || Structural
33
Figure 2.3‐3 BF 1
Figure 2.3‐4 BF 2
Figure 2.3‐5 BF 3
Figure 2.3‐6 BF 4 & 5

Jacob Wiest || Structural
34
2.4 – CA Lateral Design, Layout 2
The first lateral design seemed rather inefficient due to the low number of braces. It was hypothesized
that a more efficient design could be achieved (less steel tonnage) by adding frames, which would also
allow a ρ = 1, creating less strength demand on the structure. Three areas were highlighted for addition,
two in the EW direction and one in the NS direction. The addition would remove 4 parking spaces of the
available 60 which was deemed an acceptable impact. An additional column was added as well, to avoid
a beam cantilevering from the weak axis of a column involved in Brace Frame 8.
In order to use ρ = 1 two requirements needed to be met. The first was the confirmation that losing a
brace would not cause the story to lose more than 33% of its strength. Table 2.4‐1 shows the brace
strengths and percentages per floor for the two orthogonal directions. Additionally it needed proved
that extreme torsional irregularity was not encountered when a brace was removed on a given level. To
accomplish this each brace was deleted one by one, the model run, and the results viewed. This data is
included in Appendix N. Both conditions were satisfied.
Figure 2.4‐1 BF Layout
Added Frames
Existing Frames BF 6 BF1
BF 4 BF5
BF7
BF 8
BF 2
BF 3
Jacob Wiest || Structural
35
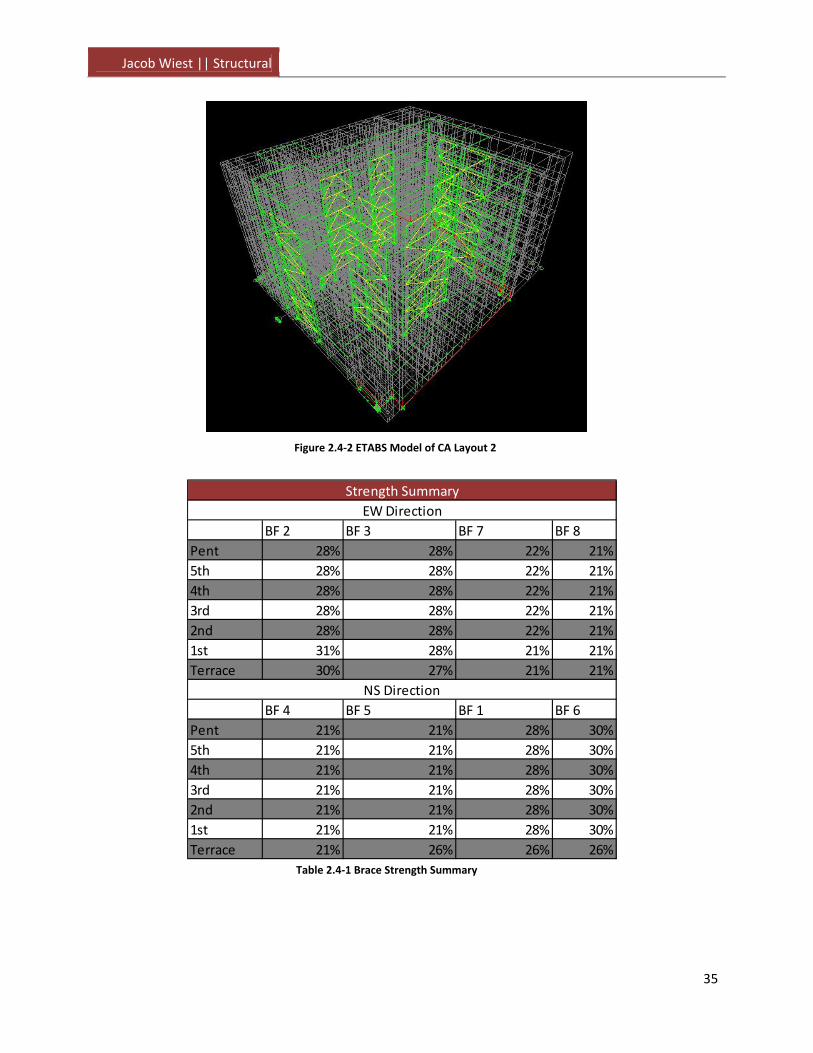
Figure 2.4‐2 ETABS Model of CA Layout 2
BF 2 BF 3 BF 7 BF 8
Pent 28% 28% 22% 21%
5th 28% 28% 22% 21%
4th 28% 28% 22% 21%
3rd 28% 28% 22% 21%
2nd 28% 28% 22% 21%
1st 31% 28% 21% 21%
Terrace 30% 27% 21% 21%
BF 4 BF 5 BF 1 BF 6
Pent 21% 21% 28% 30%
5th 21% 21% 28% 30%
4th 21% 21% 28% 30%
3rd 21% 21% 28% 30%
2nd 21% 21% 28% 30%
1st 21% 21% 28% 30%
Terrace 21% 26% 26% 26%
Strength Summary
EW Direction
NS Direction
Table 2.4‐1 Brace Strength Summary

Jacob Wiest || Structural
36
Summary
Similarly to Layout 1, drift caused members to be upsized from the preliminary sizing. Minimal steel
tonnage was saved, which may be offset by the cost of the additional connections for the bracing
members and shipping related to the increased number of pieces involved. Layout 2 had a steel weight
of 11.6 psf, but dealt markedly better with torsional issues. Appendix P contains the braced frame
elevations for this layout.
2.5 CA Lateral Design, Layout 3
Earlier it was noted how chevron frames are typically avoided in seismic applications do to the large
beams necessary for the system to perform properly. It was seen that of the 331 tons of steel used for
Layout 2’s lateral system over 25% of this could be attributed to the beams in the chevrons of frame 4
and 5. Therefore it was decided to investigate an Eccentrically Braced Frame, EBF. Eccentrically braced
frames resist lateral forces through shear, flexure and axial forces in members, and are a hybrid of
braced frame and moment frames, approaching the stiffness and ductility of each system respectively.
In an eccentrically braced frame the brace intersects the beam/column or beam/brace centerlines on
one end with the other end intersecting a distance, the eccentricity, away from the centerline. The “link”
section of the beam helps the system dissipate energy through shear and is typically the focus of the
design. Because EBF’s offer greater ductility they have a higher R value, however the SCBF R value would
still control. For this study the braced frames were chosen to have non‐moment resisting (shear)
connections at columns away from links.
The design provisions of particular interest from AISC 341‐05 are as follows:
15.2a Limitations – Web of a link shall be a single thickness
o The design of the beam will rely on balancing the shear strength vs. shear demand of
the link versus the moment demand on the exterior beam. This provision states that
doubler plates are not permitted to increase the shear strength of the link as this is the
portion of the system intended to experience inelastic behavior.
15.2c Link Rotation Angle – The link rotation shall not exceed 0.08 radians for links of length
1.6 / or less
o Links less than this length are dominated by shear yielding, which is an effective means
for energy dissipation. The link rotation angle is the angle between the link beam and
beam outside the link at the design story drift.
Mode Period UX UY
1 1.60 0.00 70.84 Y Translational
2 1.48 73.12 0.00 X Translational
3 1.15 0.04 1.41 Z Rotational
Modal Information, CA Layout 2
Table 2.4‐2 Modal Information CA Layout 2

Jacob Wiest || Structural
37
The eccentric braced frame designed resulted in a W18x86 shape being used as opposed to the
W33x354 that was used for the SCBF. Figure 2.5‐1 shows the beam design including detailing.
Connections are purely schematic, but they adhere to the provision which prevents the any part of the
connection from entering the link portion of the beam.
Summary
The replacement of the chevron SCBF’s with EBF’s proved very beneficial. The frames were more
flexible, but despite increasing the bracing to HSS9x9x5/8 from HSS8x8x1/2 the new layout saved
approximately 70 tons of steel, resulting in a total steel weight of 10.9psf for the building.
HSS 9x9x5/8 Brace
¼” x 10” x 36” A36 Cover PL
½” x 5 1/8” Intermediate Web Stiffener
(2) 3/8” x 5 1/8” Link Stiffener
W18x86
Figure 2.5‐1 Eccentric Braced Frame Beam Design
Mode Period UX UY
1 1.60 12.26 58.04 Y Translational
2 1.57 61.07 12.86 X Translational
3 1.16 1.10 1.81 Z Rotational
Modal Information, CA Layout 3
Table 2.5‐1 Modal Information CA Layout 3

Jacob Wiest || Structural
38
Figure 2.5‐2 BF 1 & 6 Figure 2.5‐3 BF 2 Figure 2.5‐4 BF 3
Figure 2.5‐5 BF 4 & 5 Figure 2.5‐6 BF 7 Figure 2.5‐7 BF 8

Jacob Wiest || Structural
39
2.6 ‐ MAE Requirements
Throughout the structural redesign graduate level coursework was applied. AE 597A – Computer
Modeling was relied upon extensively. The complexity of designing a building is drastically reduced by
the ability to create finite element models of the structure of concern. This is not to say that the
program does all of the work, because to get accurate results one must accurately model and
understand the proper assumptions to make. This course provided background knowledge relied upon
heavily to create the four different iterations, as well as the original concrete structure.
AE 538‐Earthquake Engineering provided many general concepts and design tips for the structure when
it was moved to the region of high seismicity. Prior knowledge of code provisions and experience with
seismic design were of paramount importance.
The SBCF and EBF details were done by hand using concepts introduced in AE 534 – Steel Connections.
The brace to beam connection in particular was of difficult geometry that needed careful thought to
complete.
2.7 ‐ Summary
In conclusion it was found that the steel redesign in Rockville could be accommodated with minimal
impact to the height and layout of the building. The building also remains almost completely
architecturally unaffected as well, accept for the addition of beams to the Eastern elevation which
features a 14’ cantilever.
The move to a higher seismic region proved to be more challenging to make the system work. The
addition of braces reduced steel tonnage, though it would not necessarily have reduced the cost due to
the additional shipping and connections required. A factor not directly evaluated, the foundations, may
make Layout 2 more economically viable over Layout 3 as ρ would be applied to the foundation design.
Layout 2 also had less torsional problems, and would be preferred due to the redundancy in the system.
What proved to be the most beneficial was the conversion of the chevron SCBF to EBF which dropped
the steel tonnage by 21%. A summary of the system weights and estimated costs are shown in Table 2.6‐
1. Factors not considered would be the design of diaphragm collector elements to channel the load into
the braced frames, which would likely increase the cost of the system as a whole and change certain
gravity elements.
MD CA 1 CA 2 CA 3
Steel Tonnage 154 339 331 261
Est. Cost 511,808.30$ 1,085,139.94$ 1,072,457.85$ 851,582.56$
Steel Designs
Figure 2.7‐1 Steel Design Summary

Jacob Wiest || Structural
40
Chapter 3 – Construction Management Breadth: Cost and Schedule Comparison
Due to the changes made in the substructure and superstructure of the building it was of interest to
determine impacts made to both the cost and the schedule of work. The changing height of the building
was taken into account by increasing the cost of the building skin proportionally to the height
adjustment. While finished floor to ceiling heights were maintained, meaning a possible zero impact to
interior finishes and partitions, the CMU and gypsum assemblies were similarly adjusted.
As the original concrete structure would likely require adjustments to meet the demands of a higher
seismic design category, and this redesign was not considered in the depth, it was only pertinent to
compare cost and schedule of the original structure in Rockville, MD to the redesign that was performed
in this location.
Original costs and schedules were provided courtesy of AECOM and Tompkins Builders, Inc.
3.1 – Cost
As the buildings substructure was changed from concrete to steel construction the new prices for the
materials had to be tallied and compared. The lighter system also warranted a foundation redesign
driven by the smaller column loads present upon the drilled piers. The slab on grade and basement walls
was left unchanged. Table 3.1‐1 below displays the original estimate as compared to the costs compiled
through using RS Means 2011 data for the newly designed system. A detailed cost estimate and the
original cost estimate are provided in Appendix R.
Table 3.1‐1 Cost of Old System Compared to Redesign
As Designed ReDesign
Cast‐In‐Place Concrete 6,281,783.00$ 1,839,890.40$
Structural Steel 1,784,892.00$ 5,726,574.58$
Drilled Piers 953,320.00$ 510,787.59$
Arch. Precast 598,000.00$ 609,960.00$
Metal Wall Panels 2,125,533.00$ 2,168,043.66$
Curtain Wall 6,456,000.00$ 6,585,120.00$
Interior Glass (CW) 683,223.00$ 696,887.46$
Louvers & Vents 38,167.00$ 38,930.34$
Masonry 1,801,768.00$ 1,837,803.36$
Gypsum Board 3,559,255.00$ 3,630,440.10$
Comparison 24,281,941.00$ 23,644,437.49$
637,503.51$
Interior
Savings
Value Adj for
O&P
Substructure
Exterior Enclosure
Cost Comparison
ValueSuper Structure

Jacob Wiest || Structural
41
The estimated savings on the structural system were approximately $0.64million, offset to the number
shown in the table by the cost increase of the shell and certain interior elements. This number seems
high considering Rockville is in an area typically dominated by concrete, but several factors need
considered. The large story heights present in the building allowed steel to be implemented with little
adjustment. This meant that the cost of extra building skin was not as impactful as is typical in a cost
comparison of the two materials, and also meant an increase in the amount of concrete and reinforcing
and associated costs due to the higher floor to floor heights. If the building height had to be increased
by 10’, which may have occurred were the floor heights more conventional, the increase in the building
skin alone would be $1 million. A typical cost for the building superstructure is in the order of 10%. As
shown in Table 3.1‐2 the superstructure is slightly higher than normal, which may be a combination of
the large floor heights and the large cantilevered portioned of the slab on the East Elevation.
3.2 ‐ Schedule
An advantage steel construction has over concrete is typically in the duration the building structure
takes to build. A schedule was compiled using RS Means 2011 for the newly designed structure and the
original schedule as a reference and then compared to the original schedule. Foundations, while
reduced in size, were assumed to take the same duration as the number of drilled piers was increased
from 71 to 73. Exterior skin and roofing schedules were similarly assumed to remain consistent with
those from the original schedule.
Table 3.1‐2 Cost Breakdown
Super Structure 8,066,675.00$ 12.9% 7,566,464.98$ 12.3%
Exterior Enclosure 9,900,923.00$ 15.9% 10,098,941.46$ 16.4%
Roofing 965,381.00$ 1.5% 965,381.00$ 1.6%
Subtotal Subtotal
62,332,586.00$ 61,695,082.49$
Percentage Breakdown of Building Costs
Original Cost Redesign Cost% Total % Total
Shell

Jacob Wiest || Structural
42
Figure 3.2‐1 above shows the redesign schedule from Microsoft Project. Total project duration was
decreased by a month due to the material change. The end date for the exterior skin originally was
dated for 11/16/12 but it is estimated that with a steel structure this can be dropped to 10/17/12. The
amount of work days required to complete the building structure was reduced from 161 days original
estimated to 99 days which may have the potential to cause a larger impact on areas of the schedule
that were not considered in the scope of this analysis, such as work done upon the interior.
3.3 ‐ Summary
The results of the findings in the cost and schedule analysis are summarized in Table 3.3‐1. The
scheduled construction time was reduced by a month, which potentially larger impacts due to the
completion of the structure 62 work days ahead of the estimate for the concrete construction.
Figure 3.2‐1 Redesign Schedule
Table 3.3‐1 Cost/Schedule Summary
Original Redesign
Schedule 9 months 8 months
Cost 24,281,941$ 23,644,437$
Cost/Schedule Summary

Jacob Wiest || Structural
43
The building cost associated with the changes made was also found to be reduced by $1.2 million. Due
to the unusually large floor to floor heights, in part present to accommodate the attachment to an
existing structure, may have made steel such a competitive choice with regards to concrete in this
application. While location factors were accounted for in the usage of RS Means, the fact that in this
area concrete construction is typical may have led to cost increases in steel design not fully accounted
for. Table 3.3‐2 shows the factors looked at by the AECOM team when choosing a structural system,
two of which that were highlighted being the cost and the experienced bidders. As was discussed earlier
in Chapter 2 it is believed that vibration would not be as large a factor due to the irregular bay sizes and
that the framing depth could be overcome with careful attention to coordination.
In summary it would appear that steel could be a very competitive alternative to concrete in this
situation in terms of building cost and schedule, though limitations in cost knowledge make it unclear
exactly how competitive.
Composite PT Concrete Concrete Ranking
Steel Skip Joist Factor
Cost 2 3 1
20 30 10 10
Vibration 1 3 2
7 21 14 7
3 1 2
24 8 16 8
Weight of Structure 3 1 2
(Fdtion Savings) 6 2 4 2
Same Subcontractor for 1 2 3
Whole Structure 2 4 6 2
Smallest Column Size 3 1 2
6 2 4 2
Commonly Constructed 3 2 1
18 12 6 6
Structural Framing Depth
1 3 2
5 15 10 5
Fire Protection 1 3 2
5 15 10 5
Total 18 93 19 109 17 80
Structural System Comparison Chart
Ease of Future Modification
System with Many Experienced Bidders
Table 3.3‐2 AECOM System Comparison

Jacob Wiest || Structural
44
Chapter 4 – Sustainability Study
The rooftop of the Judicial Center Annex has a distinct, multi‐tiered shape that gives the building
architectural character. It was also an area that the designers took advantage of to provide sustainable
energy features that allowed the addition to gain LEED Gold accreditation. Between the penthouse and
the lower roof the building features 6270 square feet of extensive green roof as well as photovoltaic
panels installed on top of the lantern structures as can be seen in Figure 4‐1.
This study was conducted to see if the area used as a green roof space would be better used through
additional PV panels. This required both systems to be analyzed in terms of life cycle cost over the
chosen 30 year span as PV Panels typically last 25‐30 years, carbon output, LEED impact, and other less
tangible factors. Additional areas of the LEED checklist will be explored to highlight achievable points.
4.1 – Green Roof
As stated, the JCA will feature an extensive green roof system in the green areas of Figure 4‐1. An
extensive system features a soil substrate of 4‐6 inches of a lightweight growing medium as opposed to
intensive systems which will have a heavier growing medium in depths ranging to 24”. Extensive systems
can be utilized on sloped roofs, are low‐maintenance and drought‐tolerant due to their makeup of
grasses, mosses, and flowers. Intensive roofs can feature much more diverse fauna ranging from bushes
to trees and require larger degree maintenance. Figure 4.1‐1 shows what an extensive green roof might
look like when fully installed.
Lantern PV
Low Roof Green Roof
Penthouse Green
Roof, Area of Study
Figure 4‐1: Sustainable Roof Features

Jacob Wiest || Structural
45
Green roof systems typically cost from $10‐$15 per square foot, twice as much as a normal roof system.
However they reduce building energy costs by as much as 25% depending upon roof coverage, help curb
the urban heat island effect and mitigate storm water runoff.
Life‐Cycle Assessment
For the life cycle analysis the cost of the system needed to be determined over a 30 year period using
net present values with an interest rate of 5% to account for future expenses or gains. The system was
priced at $15 a square foot, on the high end of system costs. A maintenance rate of $0.50 per square
foot for the first year was included with the assumption that it would no longer require heavy
maintenance after this point. After ten years it was assumed that 10% of the system would require
replacement and after 20 years an additional 20% due to damages and disrepair. However the green
roof typically protects the roof membrane which has a life cycle of 15 years which would not need to be
replaced, which was priced at $7.50 per square foot covered by the green roof. A summary of the
system value and the prices is shown in Table 4.1‐1.
Figure 4.1‐1: Extensive Green Roof, nemo.uconn.edu Figure 4.1‐2: Autodesk Vasari Energy Model

Jacob Wiest || Structural
46
Direct Energy
The paper, Cost‐Effectiveness of Green Roofs, was used to as a reference point to quantify cost savings
for the analysis of the system. In this paper it is noted that only the top two floors see a significant
energy reduction due to a lower cooling load, so a conservative value of 1% of the total buildings energy
usage was determined to be saved due to the green roof as recommended by the paper. To determine
the energy savings possible it was necessary to have an estimate for the amount of energy the building
used. A model was created using AutoDesk Vasari, a program used for preliminary planning that can
help give better insight into a buildings energy usage and green potential. The building mass was
modeled and divided into levels; the garage was excluded as minimal energy use was anticipated. The
spaces were assigned an open‐office occupancy and a percentage of exterior glazing was estimated
based off of exterior elevations of the JCA. Based upon the energy usage the green roof saved an
estimated $ 4,139 annually. The Vasari output is attached in Appendix T.
Storm Water Treatment
The reduction in storm water is another benefit of a green roof system. Extensive roofs have the
capability of reducing storm water by as much as 50%. To determine the annual reduction in run off the
area of coverage was multiplied by the half the annual rainfall. Rockville, MD sees 43 inches of rain per
year, which results in 80.4 kgal of water reduced annually. Fisher et al.(2008) indicated a market value
of $2.27 per kgal of storm water processed. This results in an annual savings of $182.50.
CO2 Emissions
Electricity use can also be quantified in an equivalent weight in CO2 emissions. According to Blackhurst
et al.(2010) 1.5 lb. of CO2/kWh is the electricity emissions factor. Due to the reduction in energy use the
Cost Yr NPV Adj Final Cost
Initial Cost ‐94050 1 ‐94050.00
Maintenance ‐3000 1 0.9524 ‐2857.20
Replacement ‐9405 10 0.613 ‐5765.27
‐18810 20 0.377 ‐7091.37
Savings on Roof Repair 30,000 15 0.481 14430.00
Salvage 18810 30 0.231 4345.11
(90,988.73)$ Total Cost
Green Roof Cost
Table 4.1‐1: Green Roof Life‐Cycle Cost
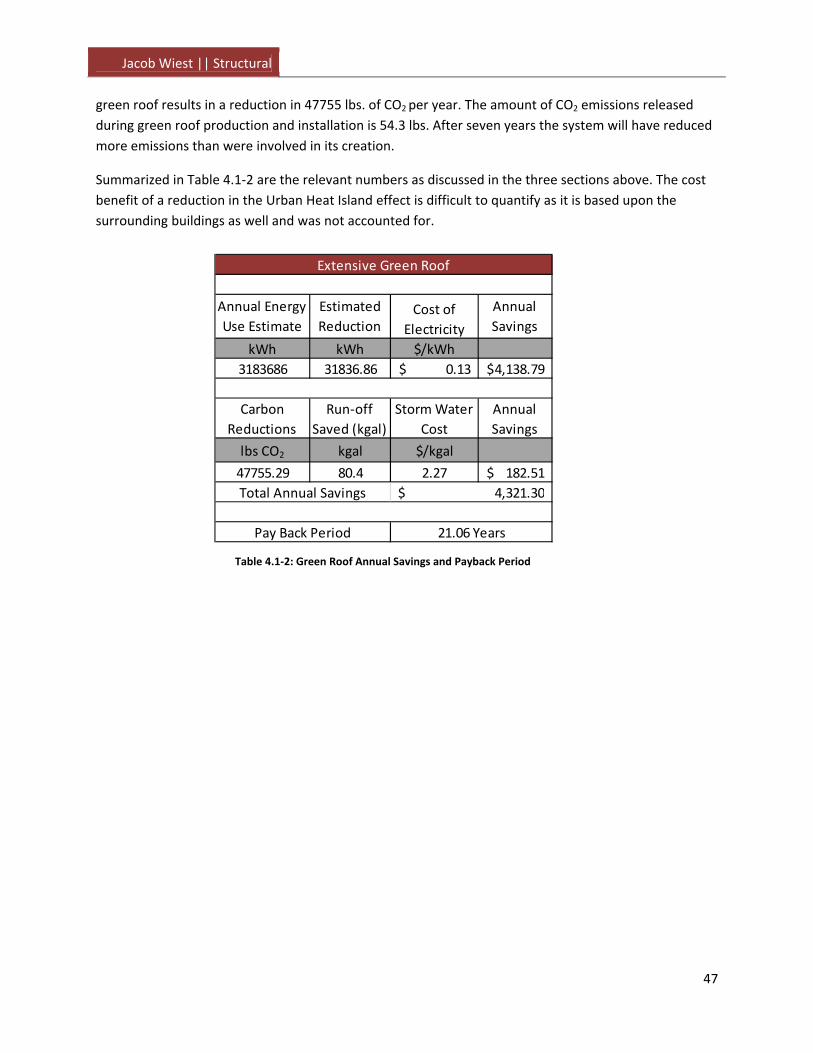
Jacob Wiest || Structural
47
green roof results in a reduction in 47755 lbs. of CO2 per year. The amount of CO2 emissions released
during green roof production and installation is 54.3 lbs. After seven years the system will have reduced
more emissions than were involved in its creation.
Summarized in Table 4.1‐2 are the relevant numbers as discussed in the three sections above. The cost
benefit of a reduction in the Urban Heat Island effect is difficult to quantify as it is based upon the
surrounding buildings as well and was not accounted for.
kWh kWh $/kWh
3183686 31836.86 0.13$ 4,138.79$
lbs CO2 kgal $/kgal
47755.29 80.4 2.27 182.51$
Carbon
Reductions
Run‐off
Saved (kgal)
Storm Water
Cost
Extensive Green Roof
Annual
Savings
Annual Energy
Use Estimate
Estimated
ReductionCost of
Electricity
Annual
Savings
Total Annual Savings 4,321.30$
Pay Back Period 21.06 Years
Table 4.1‐2: Green Roof Annual Savings and Payback Period

Jacob Wiest || Structural
48
4.2 – PV Panels
PV panels are made of a crystalline silicon material, a semi‐conductor that has the ability to convert
sunlight into electricity. Solar energy has become increasingly popular, resulting in more efficient
systems that are much more cost effective. Additionally federal and state grants for solar products and
producing renewable electricity make PV panels an attractive and feasible addition to most buildings.
PV panels vary with efficiency based upon the material used as the semi‐conductor as well as by
geographic location, tilt, and orientation. Sunpower is one of the leading manufacturers, making
extremely efficient panels. Their T5 Solar Roof tiles shown in Figure 4.2‐1 were chosen, as their
efficiency can offset the poor tilt angle of 5 degrees. The tilt angle is often by default chosen as the
latitude of the location of interest. The Solar Roof tiles require no penetration yet are highly resistant to
wind forces and lightweight due to their interlocking design meaning little to no impact on the structural
system, additional system specifications are included in Appendix U. This also results in a high density of
panels with the potential for greater energy gains from a smaller area. To determine the amount of
energy the system could produce the number of panels the space permitted had to be determined. A
typical system uses panels in increments of eight, forming a string, a schematic wiring diagram for a
string and for the system shown in Figure 4.2‐2. Based upon the square footage available the larger
western portion of the penthouse roof as seen in Figure 4‐1 could hold 136 panels and the eastern
portion of the roof could hold 40 panels. At 320 watts per panel this resulted in a 56.3 kW system.
Figure 4.2‐1: Sunpower T5 Solar Roof Tiles, Source: sunpowercopr.com
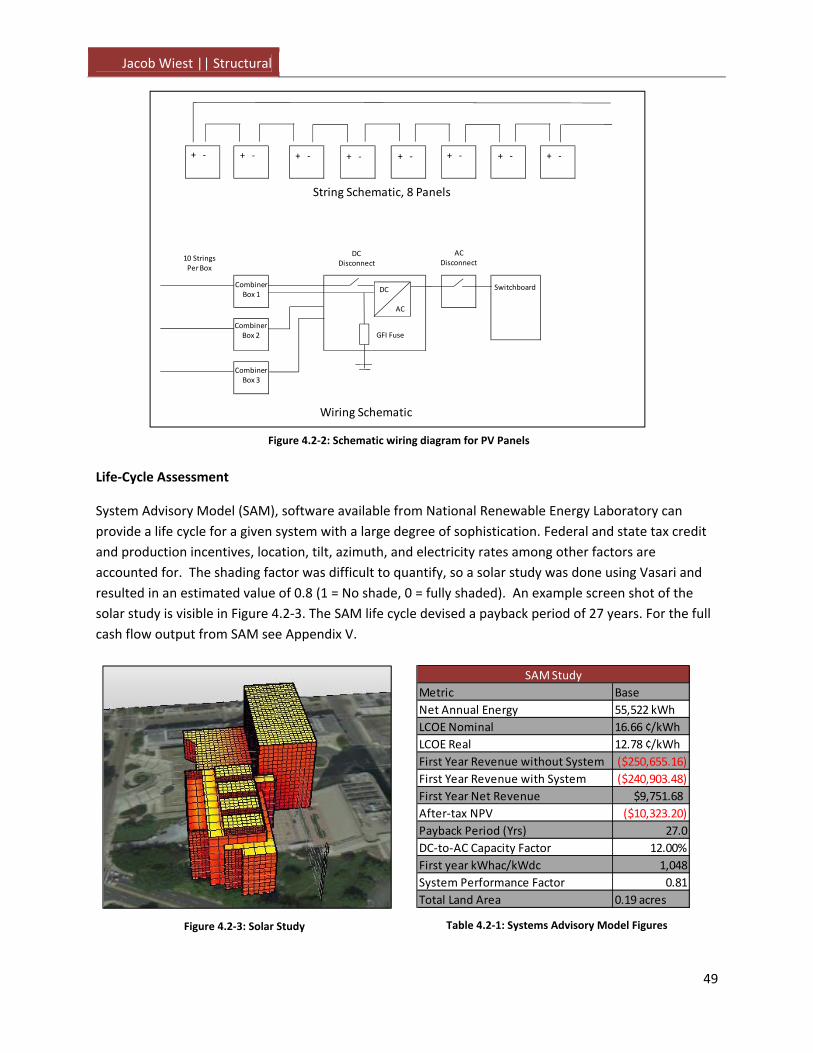
Jacob Wiest || Structural
49
Life‐Cycle Assessment
System Advisory Model (SAM), software available from National Renewable Energy Laboratory can
provide a life cycle for a given system with a large degree of sophistication. Federal and state tax credit
and production incentives, location, tilt, azimuth, and electricity rates among other factors are
accounted for. The shading factor was difficult to quantify, so a solar study was done using Vasari and
resulted in an estimated value of 0.8 (1 = No shade, 0 = fully shaded). An example screen shot of the
solar study is visible in Figure 4.2‐3. The SAM life cycle devised a payback period of 27 years. For the full
cash flow output from SAM see Appendix V.
GFI Fuse
+ ‐ + ‐ + ‐ + ‐ + ‐ + ‐ + ‐ + ‐
DC
AC
Combiner Box 1
Combiner Box 2
Combiner Box 3
DC Disconnect
AC Disconnect
Switchboard
10 Strings Per Box
String Schematic, 8 Panels
Wiring Schematic
Metric Base
Net Annual Energy 55,522 kWh
LCOE Nominal 16.66 ¢/kWh
LCOE Real 12.78 ¢/kWh
First Year Revenue without System ($250,655.16)
First Year Revenue with System ($240,903.48)
First Year Net Revenue $9,751.68
After‐tax NPV ($10,323.20)
Payback Period (Yrs) 27.0
DC‐to‐AC Capacity Factor 12.00%
First year kWhac/kWdc 1,048
System Performance Factor 0.81
Total Land Area 0.19 acres
SAM Study
Figure 4.2‐2: Schematic wiring diagram for PV Panels
Figure 4.2‐3: Solar Study Table 4.2‐1: Systems Advisory Model Figures

Jacob Wiest || Structural
50
CO2 Emissions
PV panels are a source of renewable energy and thus are often considered ‘carbon neutral’. This is a
misnomer however, as while they may not produce carbon while in use their manufacturing, deliver,
and installation result in carbon emissions. Carbon Footprint of Electricity Generation claims the lifecycle
carbon production of PV panels results in an equivalent CO2 emission of 58 g/kWh. This results in the
production of over 7000 lbs. of CO2 annually.
4.3 LEED Investigation
The original LEED checklist was obtained courtesy of AECOM which was completed in 9/9/2008. The
building has since received a Gold rating while it was originally striving for Silver during this planning
period which is based upon LEED‐NC Version 2.2.
Going through the LEED checklist it was determined that the green roof system could impact the earning
of 7 credits, of which 5 were confirmed as very likely to be achieved by AECOM’s design team. In the
Sustainable Site section, credits 6.1 and 6.2 for Storm water Design were both earned which would be
highly impacted by the green roof assembly. Credits 7.1 and 7.2, Heat Island Effect Roof, were also in
large part earned due to the usage of a vegetated assembly, though a high albedo roof such as a
thermoplastic polyolefin (TPO) membrane could be used in conjunction with the PV panels to possibly
earn this credit. Credit 5.2, Site Development, requires that the vegetated open space in the project
exceed the local zonings requirement by 25% and vegetated roofs count towards this. Additionally
Water Efficiency credits 3.1 and 3.2 could be influenced if a grey water system were incorporated with
the green roof.
The PV Panels only influenced one item on the LEED checklist, Energy and Atmosphere credit 2. This can
award up to 3 LEED points based upon the percentage of renewable energy generated. The designed PV
system earns approximately 1.5% of the annual energy usage, and when combined with the high roof PV
panels would likely surpass 2.5% which is enough to earn a point. For 2 points they would need to
produce 7.5% of the buildings energy use which is less likely, and finally 12.5% for 3 points which is
unfeasible based upon the current study.
There are several additional credits that could be earned with little effort. Energy and Atmosphere
credits 5, measurement and verification, is easily earned and potentially at no cost if the mechanical and
electrical engineers are involved early on and align their systems so the quantities can be measured in a
simple fashion by such means as placing all lighting circuits on one panel so that data can be broken
down in a simple manner. Credit 6, green power, could be attained by contacting the local energy
provider and exploring the possibilities of certified green power, however this may come at some cost as
this energy would likely be cost slightly more.
Interestingly the structure could have a large impact on LEED credits Materials and Reuse 4.2 and 5.2.
Credit 4.2 for recycled materials and 5.2 for local materials could be strongly impacted by the structural
system. These require 20% of the base cost to be recycled or local respectively, and most of the

Jacob Wiest || Structural
51
structure which currently accounts for 13% of the cost as seen in Table 3.1‐2 would qualify as both of
these.
4.4 ‐ Summary
In summary, due to the multitude of benefits, lower start‐up cost and quicker payback period it was
determined that the green roof is the more viable option and should be kept as designed. The green
roof cost roughly half the initial investment the PV panels did and paid it back in 7 less years. Net carbon
output was in the negative and storm water mitigation was improved. Urban heat island effects were
reduced. Additionally the green roof heavily impacted 4 LEED credits with the possible influence of 3
more while the PV panels were only seen to account for 2 at most, Table 4.3‐1 summarized this. The
roof geometry caused shading which reduced the effectiveness of the PV panels in the areas accounted
for, but depending on the planned system for the high roof a LEED point might still be earned for
renewable energy.
Photovoltaics Green Roof
215,769$ $90,989
106.3 ‐505.0
‐ 80.4
27.0 21.1
3 20
NA Moderate
2[3] 4[7]
Structural Impact
Sustainability Summary
LEED Credits (gained[possible])
System Cost
Carbon Footprint ( tons CO2)
Stormwater Mitigation (kgal)
Payback Period (yr)
Weight (psf)
Table 4.4‐1: Sustainability Summary

Jacob Wiest || Structural
52
Chapter 5 ‐ Conclusion
This thesis has proven that for the Judicial Center Annex a steel structural system employing braced
frames is a viable solution. Though cost data may not be entirely accurate, the system would have the
potential to save money or compare favorably due in part to the large story heights. The increased
schedule which may have further impact beyond the month that was shown to be saved would be
another benefit of this system. The steel system was able to adequately maintain the architecture and
floor layout with less perceived impact.
The seismic exploration was of great interest. The steel systems developed, like their predecessor in MD,
were able to handle the situation, though a greater effort had to be made to deal with the much larger
forces. Layout 3 was seen as the most economical, utilizing eccentric braced frames to reduce the cost
of the lateral system by 21%. The impact of chevron frames in a seismic region was proven to be very
large. Redundancy was also seen as beneficial; not only in terms of the ρ factor but in terms of better
torsional performance which was seen to very adversely affect the building. Additionally the “cost” of
detailing a system for an R value greater than 3 was seen.
The sustainability study showed that for this situation the green roofs were the appropriate choice. The
tiered roof provided shade and prevented a large enough layout to produce enough electricity to quickly
offset the initial cost. The low maintenance green roof was able to pay off its initial cost approximately 6
years earlier and provided other benefits in the form of storm water mitigation and a negative carbon
emission. The green roof also had many more potential impacts upon the LEED accreditation process.

Jacob Wiest || Structural
53
References
Blackhurst, M., Hendrickson, C., Matthews, H. S. (2010). “Cost‐effectiveness of green roofs.” J. of
Arch. Eng. 16(4), 136‐143.
“Carbon Footprint of Electricity Generation,” postnote: Parliamentary Office of Science and
Technology. Number 268, Oct 2006.
Hanagan, Linda. “Steel Connections.” AE 534. The Pennsylvania State University. University Park,
PA. Fall 2011. Notes and Lectures.
Kibert, Charles J. Sustainable Construction: Green Building Design and Delivery. Hoboken, NJ: John
Wiley & Sons, 2005.
Lepage, Andres. “Computer Modeling.” AE 597A. The Pennsylvania State University. University Park,
PA. Spring 2011. Notes and Lectures.
Memari, Ali. “Earthquake Engineering.” AE 538. The Pennsylvania State University. University Park,
PA. Fall 2011. Notes and Lectures.
Sunpower, Corp. “T5 Roof Tiles.” < ussunpowercorp.com > March 20th 2012.
Waier, P. R., ed. (2011). RS Means Building Construction Cost Data 2011, 69th ed., RS Means
Company, Kingston, MA.