Embed Size (px)
Citation preview
A Reference guide to Minnesotaelectric and natural-gas utilities1965-2005
A Reference guide to Minnesotaelectric and natural-gas utilities1965-2005
1
Introduction.......................................................................................................................................................... 2
Section I: Electric Utilities.................................................................................................................................. 3
Overview........................................................................................................................................................... 3
Introduction to Electric Tables.......................................................................................................................... 4
Table 1: Minnesota Historical Electric Consumption ...................................................................................... 6
Table 1A: Electric Consumption for Investor-Owned Utilities ....................................................................... 7
Table 1B: Electric Consumption for Cooperative Utilities .............................................................................. 8
Table 1C: Electric Consumption for Municipal Utilities ................................................................................. 9
Table 2: Number of Minnesota Electric Customers....................................................................................... 10
Table 2A: Number of Electric Customers for Investor-Owned Utilities ....................................................... 11
Table 2B: Number of Electric Customers for Cooperative Utilities .............................................................. 12
Table 2C: Number of Electric Customers for Municipal Utilities ................................................................. 13
Table 3: Minnesota Electric Sales Revenue................................................................................................... 14
Table 3A: Electric Sales Revenue for Investor-Owned Utilities ................................................................... 15
Table 3B: Electric Sales Revenue for Cooperative Utilities .......................................................................... 16
Table 3C: Electric Sales Revenue for Municipal Utilities ............................................................................. 17
Table 4: Minnesota Electric Consumption by Utility .................................................................................... 18 2005 Electric Consumption for Investor-Owned Utilities (Megawatt-Hours) ........................................... 18 2005 Electric Consumption for Cooperative Utilities (Megawatt-Hours) ................................................. 18 2005 Minnesota Electric Consumption for Municipal Utilities ................................................................. 21
Table 5: Number of Minnesota Electric Customers by Utility ...................................................................... 25 2005 Number of Minnesota Electric Customers for Investor-Owned Utilities .......................................... 25 2005 Number of Minnesota Electric Customers for Cooperative Utilities ................................................ 25 2005 Number of Minnesota Electric Customers for Municipal Utilities.................................................... 28
Table 6: Minnesota Electric Sales Revenue by Utility .................................................................................. 32 2005 Minnesota Electric Sales Revenue for Investor-Owned Utilities ...................................................... 32 2005 Minnesota Electric Sales Revenue for Cooperative Utilities ............................................................ 32 2005 Minnesota Electric Sales Revenue for Municipal Utilities................................................................ 35
Table 7: Minnesota Residential Electric Space Heating Customers .............................................................. 39 2005 Minnesota Electric Space Heating Customers for Investor-Owned Utilities .................................... 39 2005 Minnesota Electric Space Heating Customers for Cooperative Utilities .......................................... 39 2005 Minnesota Electric Space Heating Customers for Municipal Utilities ............................................. 42
Table 8: Minnesota Electric Consumption by County ................................................................................... 46
Table 9: Utility-Owned Electric Generating Plants Serving Minnesota ........................................................ 48
Table 10: Net Generation and Fuel Consumption for Utility-Owned Electric Generating Plants Serving Minnesota........................................................................................................................................................ 81
2
Section II: Natural-Gas Utilities .................................................................................................................... 120
Overview....................................................................................................................................................... 120
Introduction to Natural-Gas Tables............................................................................................................... 122
Table 11: Total Minnesota Historical Natural Gas Consumption................................................................ 123
Table 12: Number of Minnesota Natural Gas Customers ............................................................................ 125
Table 13: Minnesota Natural Gas Consumption by Company .................................................................... 126
Table 14: Minnesota Natural Gas Customers by Company......................................................................... 128
Table 15: Minnesota Natural Gas Revenue by Company ............................................................................ 130
Section III: Attachments ................................................................................................................................ 132
General Notes on Data .................................................................................................................................. 132
Glossary of Terms and Abbreviations .......................................................................................................... 133
Introduction
The Minnesota Department of Commerce regulates the financial services industries and promotes and implements policies regarding energy and telecommunications. We work with other state agencies to provide education, information and programs to the public and work to enhance Minnesota's environment and quality of life. This report is one tool in that process.
The Minnesota Utility Data Book compiles information reported by electric and natural-gas utilities serving Minnesota. Most of Minnesota's energy use occurs through service provided by various investor-owned, cooperative and municipal and private utilities. To track energy trends, the Minnesota Department of Commerce uses data in its Regional Energy Information System (REIS), which contains information collected through Minnesota Rules parts 7610.0100 to 7610.1130.
The 2005 Minnesota Utility Data Book provides aggregate information reported by Minnesota utilities through 2005. It also provides data reported by individual companies for the year 2005.
The tables in this report may use certain assumptions that are not obvious to the reader. Where feasible, this report lists assumptions either at the bottom of relevant pages or in the General Notes on Data section.
Staff who prepared this report include Steve Loomis, Susan Medhaug, and Rochelle Barnhart. If you have any questions about the report, please contact Susan Medhaug at 651-297-2103.
We hope that the 2005 Minnesota Utility Data Book will promote discussion, inquiries and interest about energy consumed through Minnesota's natural-gas and electric utilities. To obtain this report in an alternative format (i.e., large print, Braille, CD-ROM), please see our website at http://www.commerce.state.mn.us or call our Energy Information Center at 651-296-5175. If you are outside the Twin Cities area, please dial 1-800-657-3710. Our TTY number is 651-297-3067. The Information Center may also be contacted through e-mail at: [email protected].
3
Section I: Electric Utilities
Overview
Minnesota’s electric utilities are classified as investor-owned utilities (IOUs), cooperative utilities (co-ops), or municipal utilities (munis). The Minnesota Public Utilities Commission regulates the rates of all IOUs. Co-ops’ and munis’ rates are not regulated unless they choose such regulation. (Dakota Electric Association is the only utility that has chosen such regulation.)
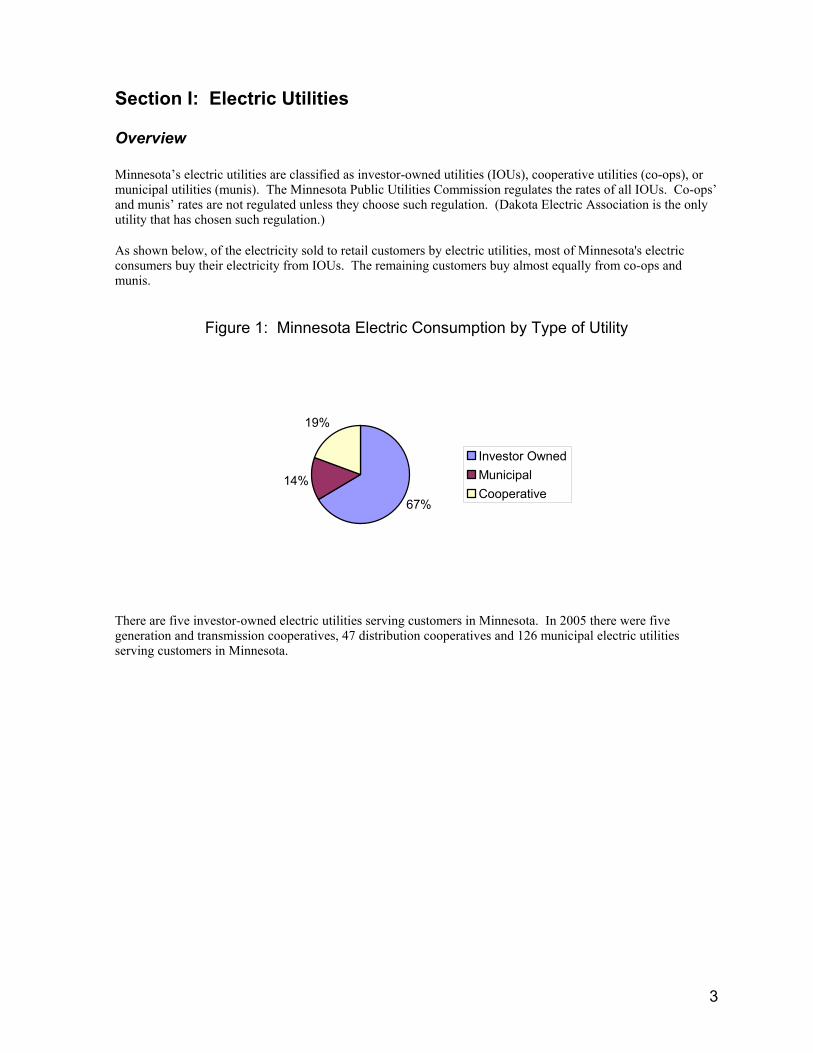
As shown below, of the electricity sold to retail customers by electric utilities, most of Minnesota's electric consumers buy their electricity from IOUs. The remaining customers buy almost equally from co-ops and munis.
Figure 1: Minnesota Electric Consumption by Type of Utility
67%
14%
19%
Investor OwnedMunicipalCooperative
There are five investor-owned electric utilities serving customers in Minnesota. In 2005 there were five generation and transmission cooperatives, 47 distribution cooperatives and 126 municipal electric utilities serving customers in Minnesota.
4
Introduction to Electric Tables
The tables in this section provide both aggregate and individual company information reported by electric utilities serving Minnesota. Tables 1 through 3 provide overall electric consumption, numbers of electric customers and electric revenues in Minnesota. These tables also show this information for the general types of companies: investor-owned utilities, cooperative utilities, and municipal utilities.
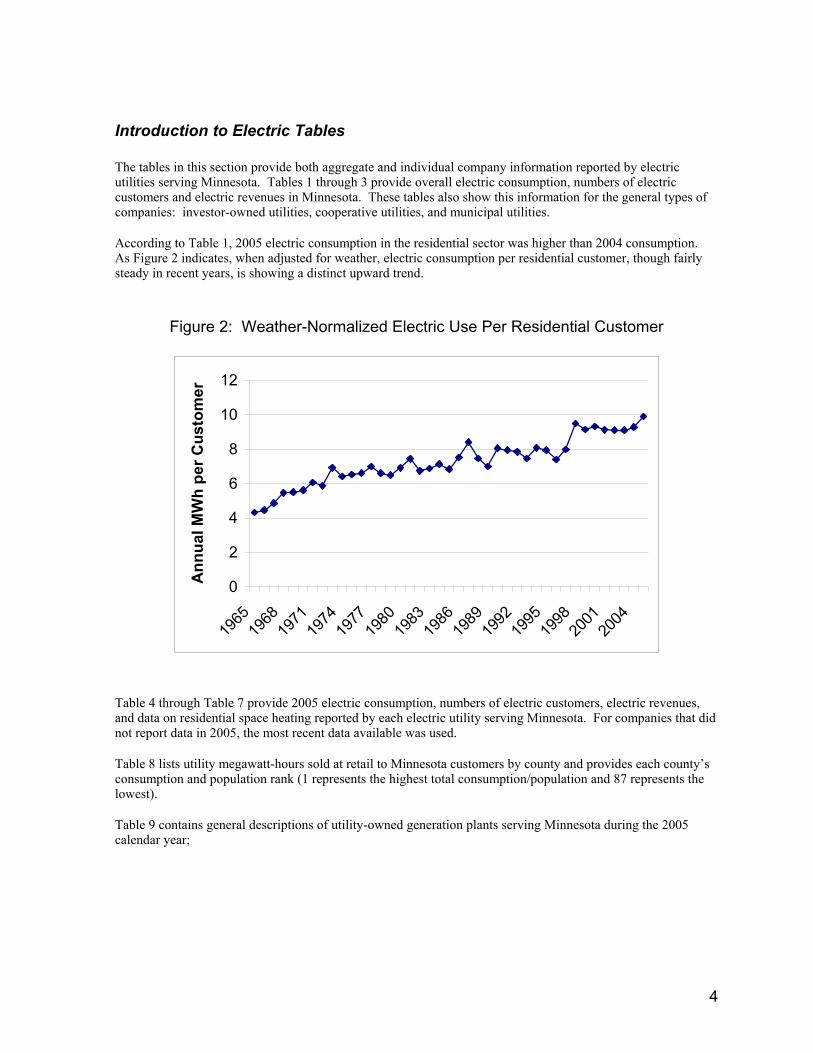
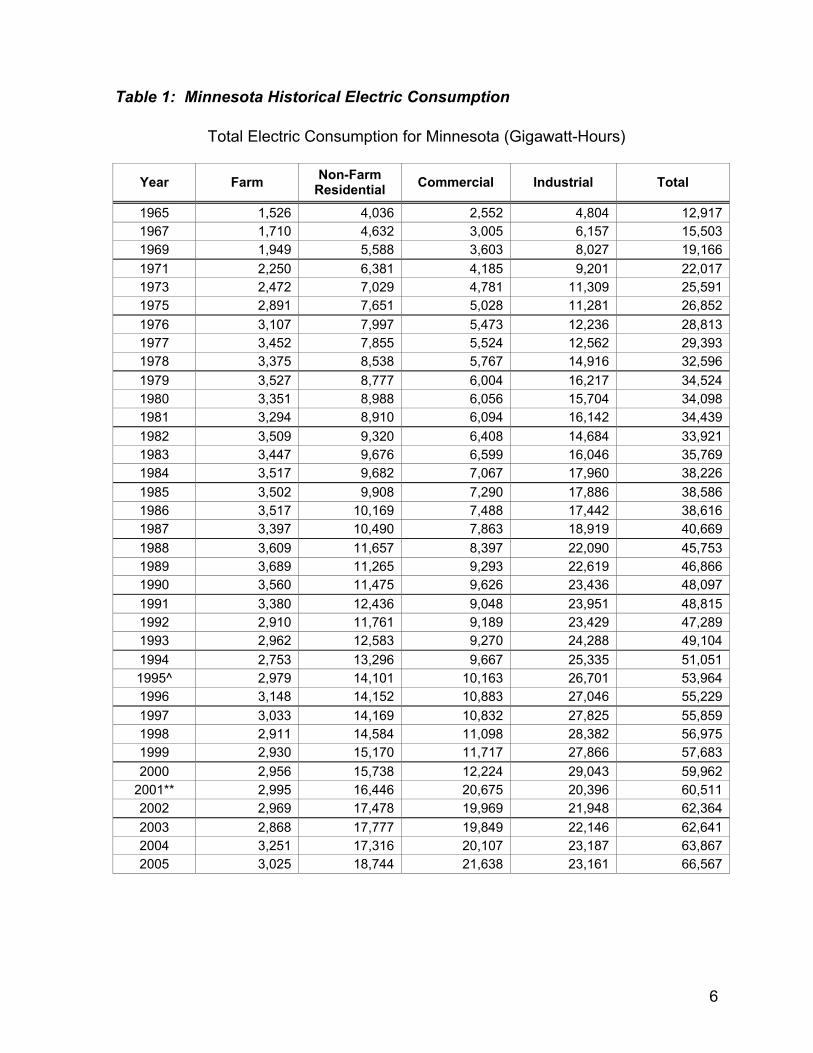
According to Table 1, 2005 electric consumption in the residential sector was higher than 2004 consumption. As Figure 2 indicates, when adjusted for weather, electric consumption per residential customer, though fairly steady in recent years, is showing a distinct upward trend.
Figure 2: Weather-Normalized Electric Use Per Residential Customer
0
2
4
6
8
10
12
1965
1968
1971
1974
1977
1980
1983
1986
1989
1992
1995
1998
2001
2004
Ann
ual M
Wh
per C
usto
mer
Table 4 through Table 7 provide 2005 electric consumption, numbers of electric customers, electric revenues, and data on residential space heating reported by each electric utility serving Minnesota. For companies that did not report data in 2005, the most recent data available was used.
Table 8 lists utility megawatt-hours sold at retail to Minnesota customers by county and provides each county’s consumption and population rank (1 represents the highest total consumption/population and 87 represents the lowest).
Table 9 contains general descriptions of utility-owned generation plants serving Minnesota during the 2005 calendar year;
5
Table 10 provides net generation and fuel consumption for utility-owned generation plants producing energy during calendar year 2005 for the following utilities:
Adrian Public Utilities Marshall Municipal Uilities
Alexandria Light & Power Melrose Public Utilities Alliant Energy-Interstate Power Co. Minnesota Power
Austin Utilities Minnkota Power Cooperative Benson Municipal Utilities Moorhead Public Service
Blooming Prairie Public Utilities Moose Lake Water and Light Blue Earth Light & Water Mora Municipal Utilities
Dairyland Power Cooperative New Prague Utilities Commission Delano Municipal Utilities New Ulm Public Utilities
Detroit Lakes Public Utilities North Branch Water & Light East Grand Forks Otter Tail Power Company
Elk River Municipal Utilities Princeton Public Utilities Fairfax Public Utilities Redwood Falls Public Utilities
Fairmont Public Utilities Rochester Public Utilities Glencoe Municipal Utilities Roseau Municipal Water and Light
Grand Marais Utilities St. James Municipal Light & Power Granite Falls Municipal Utilities Sleepy Eye Public Utilities
Great River Energy Southern MN Municipal Power Agency Halstad Municipal Utilities Spring Valley Public Utilities
Hastings, City of Springfield Public Utilities Hawley Public Utilities Steele Waseca Cooperative Electric Hibbing Public Utilities Thief River Falls Municipal Utility
Hutchinson Utilities Truman Municipal Utility Janesville Municipal Utilities Two Harbors Water and Light Kenyon Municipal Utilities Virginia Public Utilities
Lake Crystal Municipal Utilities Warren, City of Lakefield Public Utilities Wells Public Utilities
Lanesboro Public Utilities Willmar Municipal Utilities Litchfield Public Utilities Windom Municipal Utilities
Madelia Municipal Light & Power Worthington Public Utilities Xcel Energy
6
Table 1: Minnesota Historical Electric Consumption
Total Electric Consumption for Minnesota (Gigawatt-Hours)
Year Farm Non-Farm Residential Commercial Industrial Total
1965 1,526 4,036 2,552 4,804 12,917 1967 1,710 4,632 3,005 6,157 15,503 1969 1,949 5,588 3,603 8,027 19,166 1971 2,250 6,381 4,185 9,201 22,017 1973 2,472 7,029 4,781 11,309 25,591 1975 2,891 7,651 5,028 11,281 26,852 1976 3,107 7,997 5,473 12,236 28,813 1977 3,452 7,855 5,524 12,562 29,393 1978 3,375 8,538 5,767 14,916 32,596 1979 3,527 8,777 6,004 16,217 34,524 1980 3,351 8,988 6,056 15,704 34,098 1981 3,294 8,910 6,094 16,142 34,439 1982 3,509 9,320 6,408 14,684 33,921 1983 3,447 9,676 6,599 16,046 35,769 1984 3,517 9,682 7,067 17,960 38,226 1985 3,502 9,908 7,290 17,886 38,586 1986 3,517 10,169 7,488 17,442 38,616 1987 3,397 10,490 7,863 18,919 40,669 1988 3,609 11,657 8,397 22,090 45,753 1989 3,689 11,265 9,293 22,619 46,866 1990 3,560 11,475 9,626 23,436 48,097 1991 3,380 12,436 9,048 23,951 48,815 1992 2,910 11,761 9,189 23,429 47,289 1993 2,962 12,583 9,270 24,288 49,104 1994 2,753 13,296 9,667 25,335 51,051 1995^ 2,979 14,101 10,163 26,701 53,964 1996 3,148 14,152 10,883 27,046 55,229 1997 3,033 14,169 10,832 27,825 55,859 1998 2,911 14,584 11,098 28,382 56,975 1999 2,930 15,170 11,717 27,866 57,683 2000 2,956 15,738 12,224 29,043 59,962
2001** 2,995 16,446 20,675 20,396 60,511 2002 2,969 17,478 19,969 21,948 62,364 2003 2,868 17,777 19,849 22,146 62,641 2004 3,251 17,316 20,107 23,187 63,867 2005 3,025 18,744 21,638 23,161 66,567
7
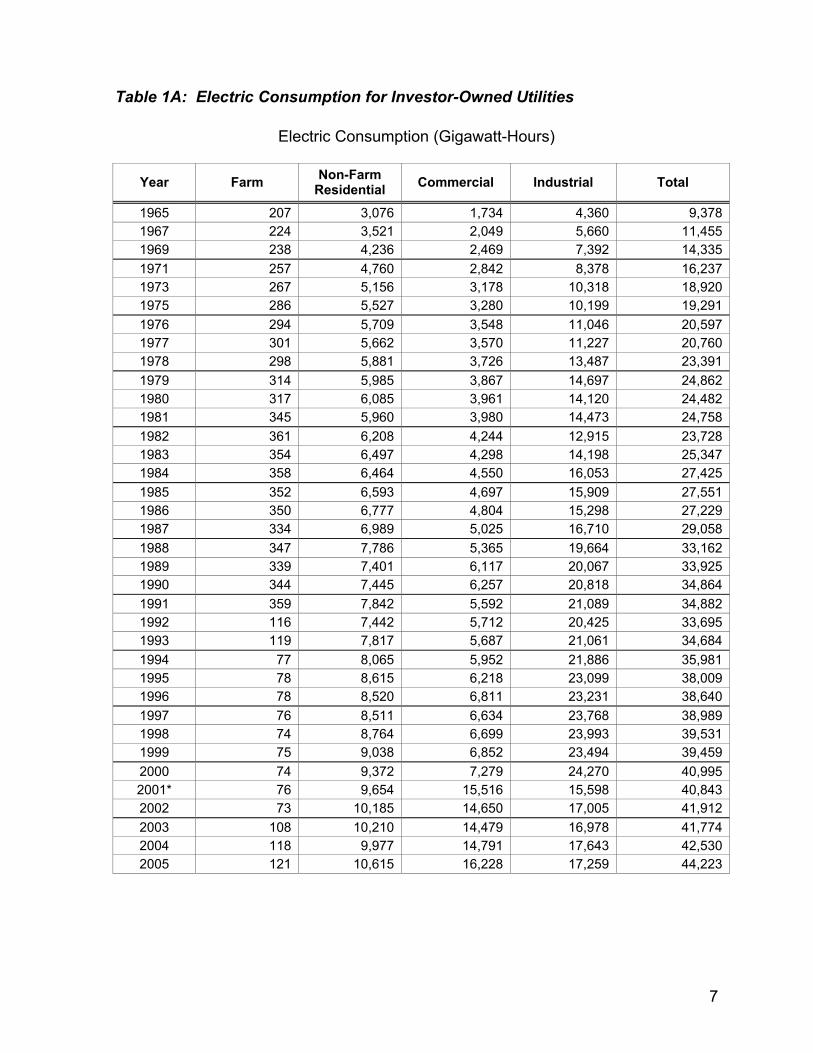
Table 1A: Electric Consumption for Investor-Owned Utilities
Electric Consumption (Gigawatt-Hours)
Year Farm Non-Farm Residential Commercial Industrial Total
1965 207 3,076 1,734 4,360 9,378 1967 224 3,521 2,049 5,660 11,455 1969 238 4,236 2,469 7,392 14,335 1971 257 4,760 2,842 8,378 16,237 1973 267 5,156 3,178 10,318 18,920 1975 286 5,527 3,280 10,199 19,291 1976 294 5,709 3,548 11,046 20,597 1977 301 5,662 3,570 11,227 20,760 1978 298 5,881 3,726 13,487 23,391 1979 314 5,985 3,867 14,697 24,862 1980 317 6,085 3,961 14,120 24,482 1981 345 5,960 3,980 14,473 24,758 1982 361 6,208 4,244 12,915 23,728 1983 354 6,497 4,298 14,198 25,347 1984 358 6,464 4,550 16,053 27,425 1985 352 6,593 4,697 15,909 27,551 1986 350 6,777 4,804 15,298 27,229 1987 334 6,989 5,025 16,710 29,058 1988 347 7,786 5,365 19,664 33,162 1989 339 7,401 6,117 20,067 33,925 1990 344 7,445 6,257 20,818 34,864 1991 359 7,842 5,592 21,089 34,882 1992 116 7,442 5,712 20,425 33,695 1993 119 7,817 5,687 21,061 34,684 1994 77 8,065 5,952 21,886 35,981 1995 78 8,615 6,218 23,099 38,009 1996 78 8,520 6,811 23,231 38,640 1997 76 8,511 6,634 23,768 38,989 1998 74 8,764 6,699 23,993 39,531 1999 75 9,038 6,852 23,494 39,459 2000 74 9,372 7,279 24,270 40,995 2001* 76 9,654 15,516 15,598 40,843 2002 73 10,185 14,650 17,005 41,912 2003 108 10,210 14,479 16,978 41,774 2004 118 9,977 14,791 17,643 42,530 2005 121 10,615 16,228 17,259 44,223
8
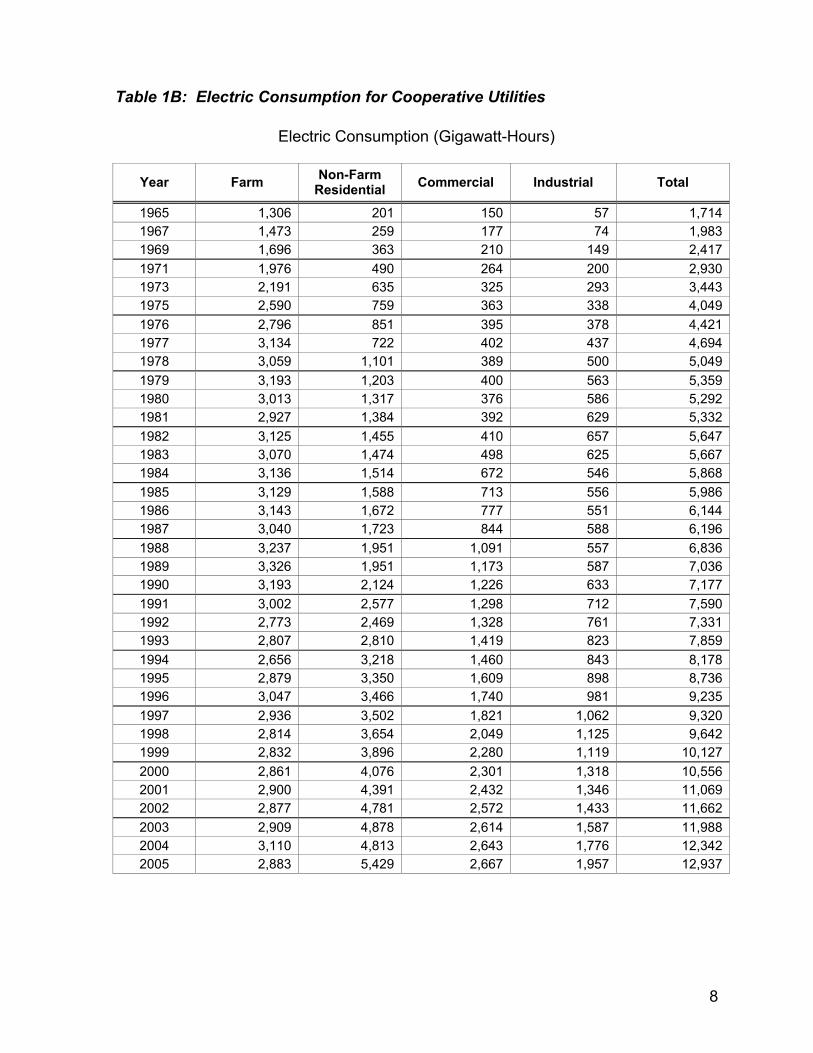
Table 1B: Electric Consumption for Cooperative Utilities
Electric Consumption (Gigawatt-Hours)
Year Farm Non-Farm Residential Commercial Industrial Total
1965 1,306 201 150 57 1,714 1967 1,473 259 177 74 1,983 1969 1,696 363 210 149 2,417 1971 1,976 490 264 200 2,930 1973 2,191 635 325 293 3,443 1975 2,590 759 363 338 4,049 1976 2,796 851 395 378 4,421 1977 3,134 722 402 437 4,694 1978 3,059 1,101 389 500 5,049 1979 3,193 1,203 400 563 5,359 1980 3,013 1,317 376 586 5,292 1981 2,927 1,384 392 629 5,332 1982 3,125 1,455 410 657 5,647 1983 3,070 1,474 498 625 5,667 1984 3,136 1,514 672 546 5,868 1985 3,129 1,588 713 556 5,986 1986 3,143 1,672 777 551 6,144 1987 3,040 1,723 844 588 6,196 1988 3,237 1,951 1,091 557 6,836 1989 3,326 1,951 1,173 587 7,036 1990 3,193 2,124 1,226 633 7,177 1991 3,002 2,577 1,298 712 7,590 1992 2,773 2,469 1,328 761 7,331 1993 2,807 2,810 1,419 823 7,859 1994 2,656 3,218 1,460 843 8,178 1995 2,879 3,350 1,609 898 8,736 1996 3,047 3,466 1,740 981 9,235 1997 2,936 3,502 1,821 1,062 9,320 1998 2,814 3,654 2,049 1,125 9,642 1999 2,832 3,896 2,280 1,119 10,127 2000 2,861 4,076 2,301 1,318 10,556 2001 2,900 4,391 2,432 1,346 11,069 2002 2,877 4,781 2,572 1,433 11,662 2003 2,909 4,878 2,614 1,587 11,988 2004 3,110 4,813 2,643 1,776 12,342 2005 2,883 5,429 2,667 1,957 12,937
9
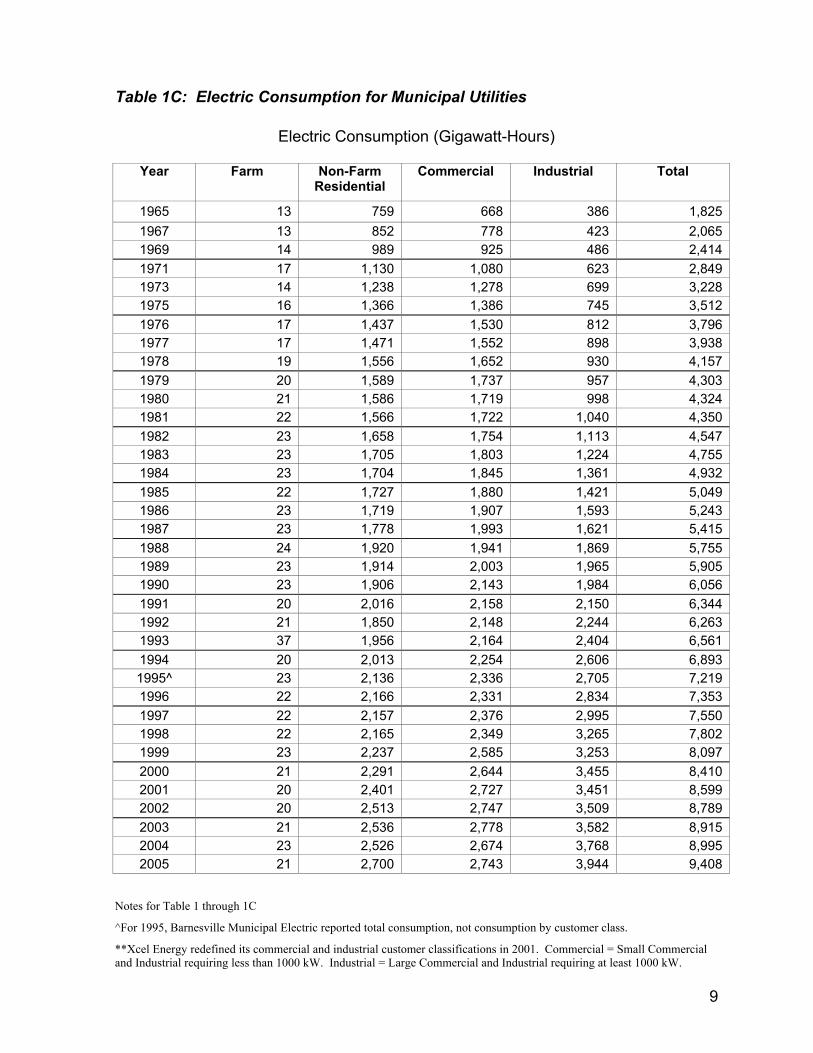
Table 1C: Electric Consumption for Municipal Utilities
Electric Consumption (Gigawatt-Hours)
Year Farm Non-Farm Residential
Commercial Industrial Total
1965 13 759 668 386 1,825 1967 13 852 778 423 2,065 1969 14 989 925 486 2,414 1971 17 1,130 1,080 623 2,849 1973 14 1,238 1,278 699 3,228 1975 16 1,366 1,386 745 3,512 1976 17 1,437 1,530 812 3,796 1977 17 1,471 1,552 898 3,938 1978 19 1,556 1,652 930 4,157 1979 20 1,589 1,737 957 4,303 1980 21 1,586 1,719 998 4,324 1981 22 1,566 1,722 1,040 4,350 1982 23 1,658 1,754 1,113 4,547 1983 23 1,705 1,803 1,224 4,755 1984 23 1,704 1,845 1,361 4,932 1985 22 1,727 1,880 1,421 5,049 1986 23 1,719 1,907 1,593 5,243 1987 23 1,778 1,993 1,621 5,415 1988 24 1,920 1,941 1,869 5,755 1989 23 1,914 2,003 1,965 5,905 1990 23 1,906 2,143 1,984 6,056 1991 20 2,016 2,158 2,150 6,344 1992 21 1,850 2,148 2,244 6,263 1993 37 1,956 2,164 2,404 6,561 1994 20 2,013 2,254 2,606 6,893 1995^ 23 2,136 2,336 2,705 7,2191996 22 2,166 2,331 2,834 7,353 1997 22 2,157 2,376 2,995 7,550 1998 22 2,165 2,349 3,265 7,802 1999 23 2,237 2,585 3,253 8,097 2000 21 2,291 2,644 3,455 8,410 2001 20 2,401 2,727 3,451 8,599 2002 20 2,513 2,747 3,509 8,789 2003 21 2,536 2,778 3,582 8,915 2004 23 2,526 2,674 3,768 8,995 2005 21 2,700 2,743 3,944 9,408
Notes for Table 1 through 1C
^For 1995, Barnesville Municipal Electric reported total consumption, not consumption by customer class.
**Xcel Energy redefined its commercial and industrial customer classifications in 2001. Commercial = Small Commercial and Industrial requiring less than 1000 kW. Industrial = Large Commercial and Industrial requiring at least 1000 kW.
10
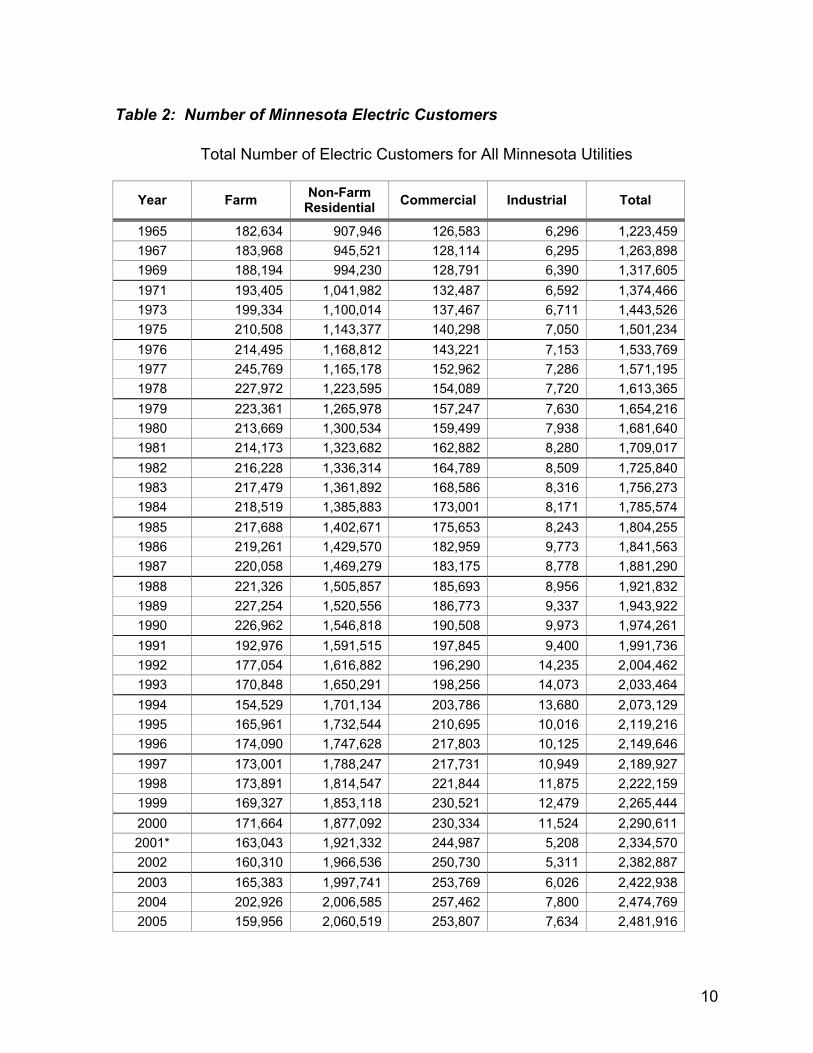
Table 2: Number of Minnesota Electric Customers
Total Number of Electric Customers for All Minnesota Utilities
Year Farm Non-Farm Residential Commercial Industrial Total
1965 182,634 907,946 126,583 6,296 1,223,459 1967 183,968 945,521 128,114 6,295 1,263,898 1969 188,194 994,230 128,791 6,390 1,317,605 1971 193,405 1,041,982 132,487 6,592 1,374,466 1973 199,334 1,100,014 137,467 6,711 1,443,526 1975 210,508 1,143,377 140,298 7,050 1,501,234 1976 214,495 1,168,812 143,221 7,153 1,533,769 1977 245,769 1,165,178 152,962 7,286 1,571,195 1978 227,972 1,223,595 154,089 7,720 1,613,365 1979 223,361 1,265,978 157,247 7,630 1,654,216 1980 213,669 1,300,534 159,499 7,938 1,681,640 1981 214,173 1,323,682 162,882 8,280 1,709,017 1982 216,228 1,336,314 164,789 8,509 1,725,840 1983 217,479 1,361,892 168,586 8,316 1,756,273 1984 218,519 1,385,883 173,001 8,171 1,785,574 1985 217,688 1,402,671 175,653 8,243 1,804,255 1986 219,261 1,429,570 182,959 9,773 1,841,563 1987 220,058 1,469,279 183,175 8,778 1,881,290 1988 221,326 1,505,857 185,693 8,956 1,921,832 1989 227,254 1,520,556 186,773 9,337 1,943,922 1990 226,962 1,546,818 190,508 9,973 1,974,261 1991 192,976 1,591,515 197,845 9,400 1,991,736 1992 177,054 1,616,882 196,290 14,235 2,004,462 1993 170,848 1,650,291 198,256 14,073 2,033,464 1994 154,529 1,701,134 203,786 13,680 2,073,129 1995 165,961 1,732,544 210,695 10,016 2,119,216 1996 174,090 1,747,628 217,803 10,125 2,149,646 1997 173,001 1,788,247 217,731 10,949 2,189,927 1998 173,891 1,814,547 221,844 11,875 2,222,159 1999 169,327 1,853,118 230,521 12,479 2,265,444 2000 171,664 1,877,092 230,334 11,524 2,290,611 2001* 163,043 1,921,332 244,987 5,208 2,334,570 2002 160,310 1,966,536 250,730 5,311 2,382,887 2003 165,383 1,997,741 253,769 6,026 2,422,938 2004 202,926 2,006,585 257,462 7,800 2,474,769 2005 159,956 2,060,519 253,807 7,634 2,481,916
11
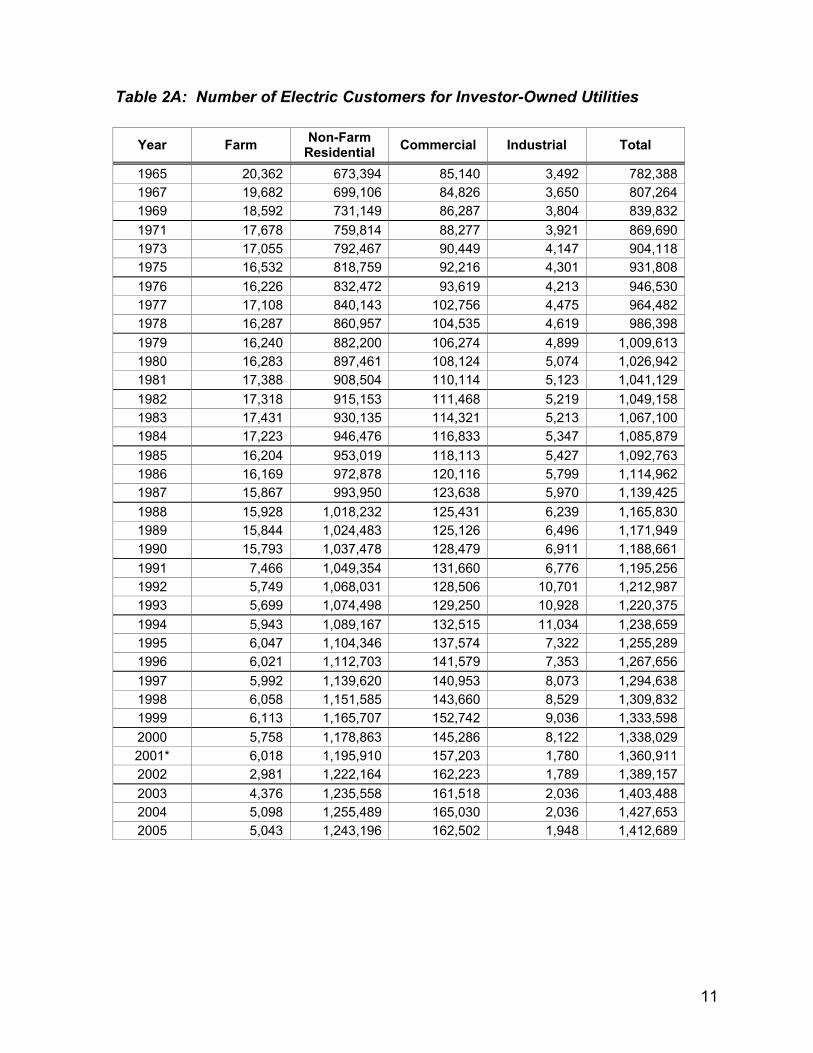
Table 2A: Number of Electric Customers for Investor-Owned Utilities
Year Farm Non-Farm Residential Commercial Industrial Total
1965 20,362 673,394 85,140 3,492 782,388 1967 19,682 699,106 84,826 3,650 807,264 1969 18,592 731,149 86,287 3,804 839,832 1971 17,678 759,814 88,277 3,921 869,690 1973 17,055 792,467 90,449 4,147 904,118 1975 16,532 818,759 92,216 4,301 931,808 1976 16,226 832,472 93,619 4,213 946,530 1977 17,108 840,143 102,756 4,475 964,482 1978 16,287 860,957 104,535 4,619 986,398 1979 16,240 882,200 106,274 4,899 1,009,613 1980 16,283 897,461 108,124 5,074 1,026,942 1981 17,388 908,504 110,114 5,123 1,041,129 1982 17,318 915,153 111,468 5,219 1,049,158 1983 17,431 930,135 114,321 5,213 1,067,100 1984 17,223 946,476 116,833 5,347 1,085,879 1985 16,204 953,019 118,113 5,427 1,092,763 1986 16,169 972,878 120,116 5,799 1,114,962 1987 15,867 993,950 123,638 5,970 1,139,425 1988 15,928 1,018,232 125,431 6,239 1,165,830 1989 15,844 1,024,483 125,126 6,496 1,171,949 1990 15,793 1,037,478 128,479 6,911 1,188,661 1991 7,466 1,049,354 131,660 6,776 1,195,256 1992 5,749 1,068,031 128,506 10,701 1,212,987 1993 5,699 1,074,498 129,250 10,928 1,220,375 1994 5,943 1,089,167 132,515 11,034 1,238,659 1995 6,047 1,104,346 137,574 7,322 1,255,289 1996 6,021 1,112,703 141,579 7,353 1,267,656 1997 5,992 1,139,620 140,953 8,073 1,294,638 1998 6,058 1,151,585 143,660 8,529 1,309,832 1999 6,113 1,165,707 152,742 9,036 1,333,598 2000 5,758 1,178,863 145,286 8,122 1,338,029 2001* 6,018 1,195,910 157,203 1,780 1,360,911 2002 2,981 1,222,164 162,223 1,789 1,389,157 2003 4,376 1,235,558 161,518 2,036 1,403,488 2004 5,098 1,255,489 165,030 2,036 1,427,653 2005 5,043 1,243,196 162,502 1,948 1,412,689
12
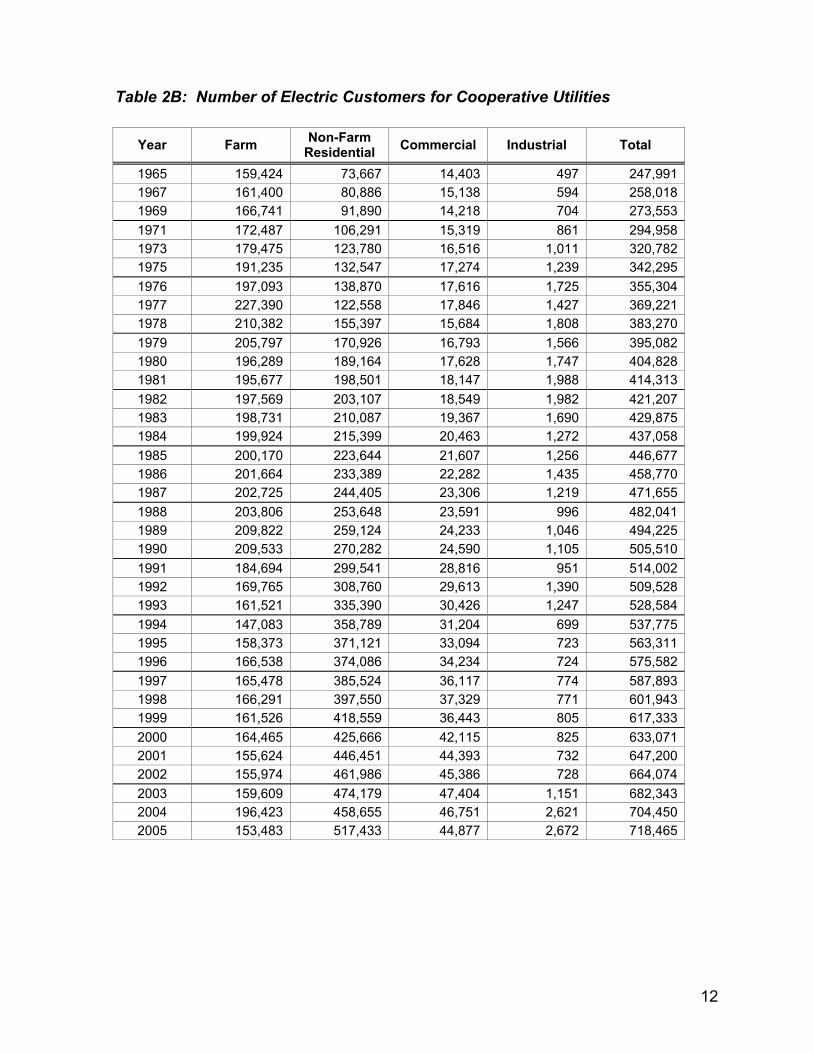
Table 2B: Number of Electric Customers for Cooperative Utilities
Year Farm Non-Farm Residential Commercial Industrial Total
1965 159,424 73,667 14,403 497 247,991 1967 161,400 80,886 15,138 594 258,018 1969 166,741 91,890 14,218 704 273,553 1971 172,487 106,291 15,319 861 294,958 1973 179,475 123,780 16,516 1,011 320,782 1975 191,235 132,547 17,274 1,239 342,295 1976 197,093 138,870 17,616 1,725 355,304 1977 227,390 122,558 17,846 1,427 369,221 1978 210,382 155,397 15,684 1,808 383,270 1979 205,797 170,926 16,793 1,566 395,082 1980 196,289 189,164 17,628 1,747 404,828 1981 195,677 198,501 18,147 1,988 414,313 1982 197,569 203,107 18,549 1,982 421,207 1983 198,731 210,087 19,367 1,690 429,875 1984 199,924 215,399 20,463 1,272 437,058 1985 200,170 223,644 21,607 1,256 446,677 1986 201,664 233,389 22,282 1,435 458,770 1987 202,725 244,405 23,306 1,219 471,655 1988 203,806 253,648 23,591 996 482,041 1989 209,822 259,124 24,233 1,046 494,225 1990 209,533 270,282 24,590 1,105 505,510 1991 184,694 299,541 28,816 951 514,002 1992 169,765 308,760 29,613 1,390 509,528 1993 161,521 335,390 30,426 1,247 528,584 1994 147,083 358,789 31,204 699 537,775 1995 158,373 371,121 33,094 723 563,311 1996 166,538 374,086 34,234 724 575,582 1997 165,478 385,524 36,117 774 587,893 1998 166,291 397,550 37,329 771 601,943 1999 161,526 418,559 36,443 805 617,333 2000 164,465 425,666 42,115 825 633,071 2001 155,624 446,451 44,393 732 647,200 2002 155,974 461,986 45,386 728 664,074 2003 159,609 474,179 47,404 1,151 682,343 2004 196,423 458,655 46,751 2,621 704,450 2005 153,483 517,433 44,877 2,672 718,465
13
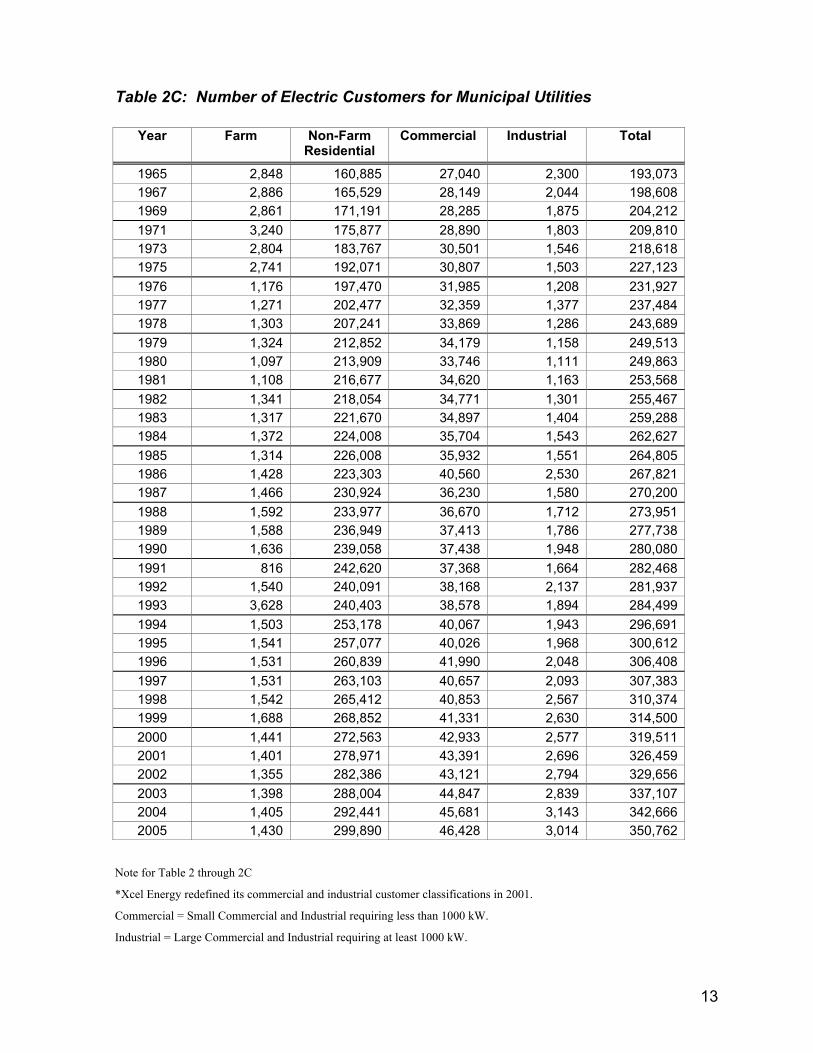
Table 2C: Number of Electric Customers for Municipal Utilities
Year Farm Non-Farm Residential
Commercial Industrial Total
1965 2,848 160,885 27,040 2,300 193,073 1967 2,886 165,529 28,149 2,044 198,608 1969 2,861 171,191 28,285 1,875 204,212 1971 3,240 175,877 28,890 1,803 209,810 1973 2,804 183,767 30,501 1,546 218,618 1975 2,741 192,071 30,807 1,503 227,123 1976 1,176 197,470 31,985 1,208 231,927 1977 1,271 202,477 32,359 1,377 237,484 1978 1,303 207,241 33,869 1,286 243,689 1979 1,324 212,852 34,179 1,158 249,513 1980 1,097 213,909 33,746 1,111 249,863 1981 1,108 216,677 34,620 1,163 253,568 1982 1,341 218,054 34,771 1,301 255,467 1983 1,317 221,670 34,897 1,404 259,288 1984 1,372 224,008 35,704 1,543 262,627 1985 1,314 226,008 35,932 1,551 264,805 1986 1,428 223,303 40,560 2,530 267,821 1987 1,466 230,924 36,230 1,580 270,200 1988 1,592 233,977 36,670 1,712 273,951 1989 1,588 236,949 37,413 1,786 277,738 1990 1,636 239,058 37,438 1,948 280,080 1991 816 242,620 37,368 1,664 282,468 1992 1,540 240,091 38,168 2,137 281,937 1993 3,628 240,403 38,578 1,894 284,499 1994 1,503 253,178 40,067 1,943 296,691 1995 1,541 257,077 40,026 1,968 300,612 1996 1,531 260,839 41,990 2,048 306,408 1997 1,531 263,103 40,657 2,093 307,383 1998 1,542 265,412 40,853 2,567 310,374 1999 1,688 268,852 41,331 2,630 314,500 2000 1,441 272,563 42,933 2,577 319,511 2001 1,401 278,971 43,391 2,696 326,459 2002 1,355 282,386 43,121 2,794 329,656 2003 1,398 288,004 44,847 2,839 337,107 2004 1,405 292,441 45,681 3,143 342,666 2005 1,430 299,890 46,428 3,014 350,762
Note for Table 2 through 2C
*Xcel Energy redefined its commercial and industrial customer classifications in 2001.
Commercial = Small Commercial and Industrial requiring less than 1000 kW.
Industrial = Large Commercial and Industrial requiring at least 1000 kW.
14
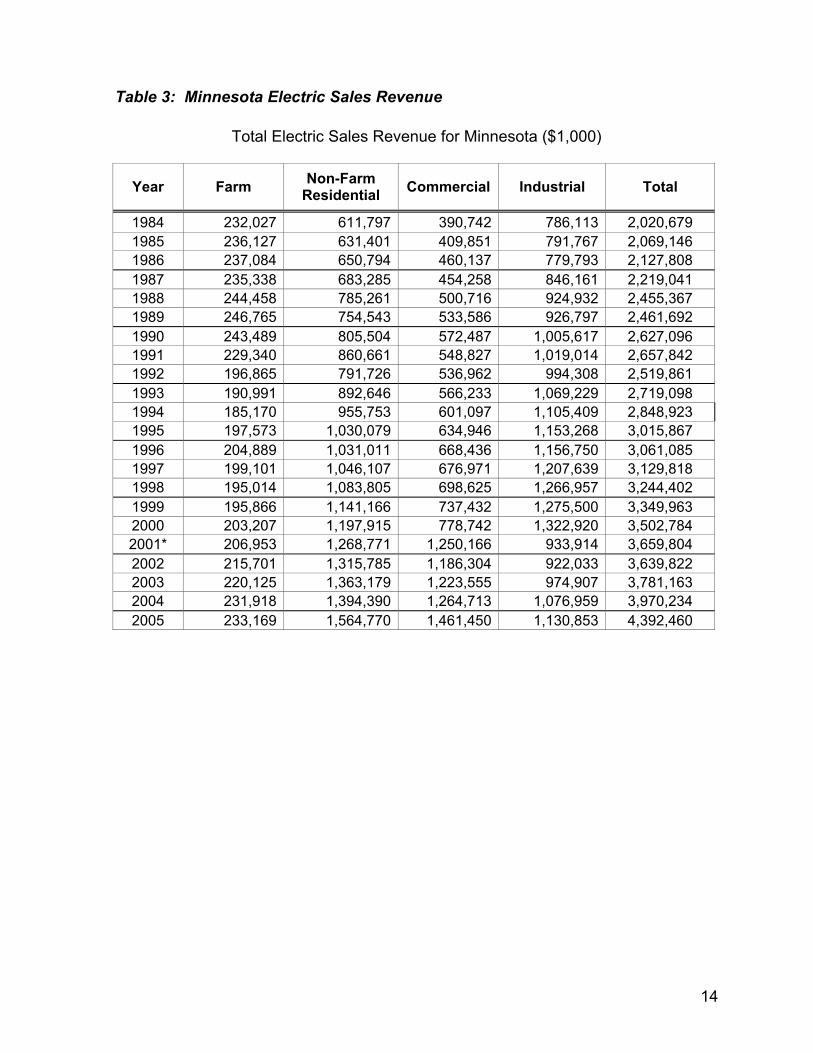
Table 3: Minnesota Electric Sales Revenue
Total Electric Sales Revenue for Minnesota ($1,000)
Year Farm Non-Farm Residential Commercial Industrial Total
1984 232,027 611,797 390,742 786,113 2,020,679 1985 236,127 631,401 409,851 791,767 2,069,146 1986 237,084 650,794 460,137 779,793 2,127,808 1987 235,338 683,285 454,258 846,161 2,219,041 1988 244,458 785,261 500,716 924,932 2,455,367 1989 246,765 754,543 533,586 926,797 2,461,692 1990 243,489 805,504 572,487 1,005,617 2,627,096 1991 229,340 860,661 548,827 1,019,014 2,657,842 1992 196,865 791,726 536,962 994,308 2,519,861 1993 190,991 892,646 566,233 1,069,229 2,719,098 1994 185,170 955,753 601,097 1,105,409 2,848,923 1995 197,573 1,030,079 634,946 1,153,268 3,015,867 1996 204,889 1,031,011 668,436 1,156,750 3,061,085 1997 199,101 1,046,107 676,971 1,207,639 3,129,818 1998 195,014 1,083,805 698,625 1,266,957 3,244,402 1999 195,866 1,141,166 737,432 1,275,500 3,349,963 2000 203,207 1,197,915 778,742 1,322,920 3,502,784 2001* 206,953 1,268,771 1,250,166 933,914 3,659,804 2002 215,701 1,315,785 1,186,304 922,033 3,639,822 2003 220,125 1,363,179 1,223,555 974,907 3,781,163 2004 231,918 1,394,390 1,264,713 1,076,959 3,970,234 2005 233,169 1,564,770 1,461,450 1,130,853 4,392,460
15
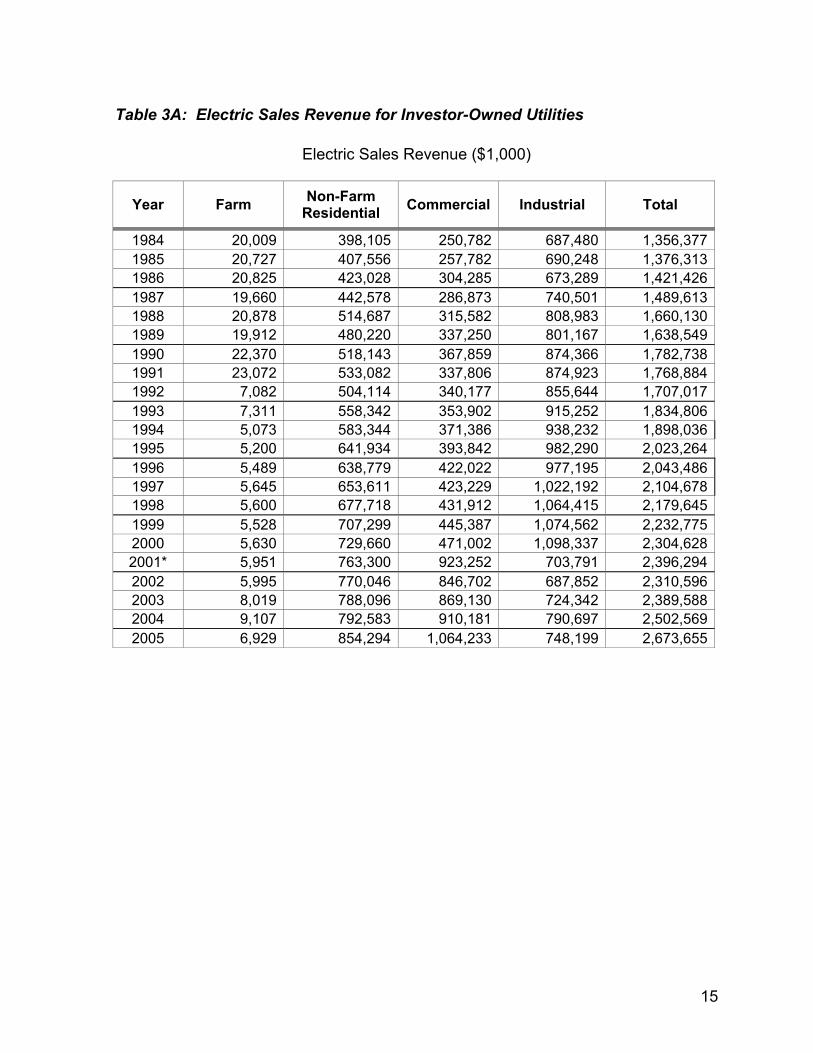
Table 3A: Electric Sales Revenue for Investor-Owned Utilities
Electric Sales Revenue ($1,000)
Year Farm Non-Farm Residential Commercial Industrial Total
1984 20,009 398,105 250,782 687,480 1,356,377 1985 20,727 407,556 257,782 690,248 1,376,313 1986 20,825 423,028 304,285 673,289 1,421,426 1987 19,660 442,578 286,873 740,501 1,489,613 1988 20,878 514,687 315,582 808,983 1,660,130 1989 19,912 480,220 337,250 801,167 1,638,549 1990 22,370 518,143 367,859 874,366 1,782,738 1991 23,072 533,082 337,806 874,923 1,768,884 1992 7,082 504,114 340,177 855,644 1,707,017 1993 7,311 558,342 353,902 915,252 1,834,806 1994 5,073 583,344 371,386 938,232 1,898,036 1995 5,200 641,934 393,842 982,290 2,023,264 1996 5,489 638,779 422,022 977,195 2,043,486 1997 5,645 653,611 423,229 1,022,192 2,104,678 1998 5,600 677,718 431,912 1,064,415 2,179,645 1999 5,528 707,299 445,387 1,074,562 2,232,775 2000 5,630 729,660 471,002 1,098,337 2,304,628 2001* 5,951 763,300 923,252 703,791 2,396,294 2002 5,995 770,046 846,702 687,852 2,310,596 2003 8,019 788,096 869,130 724,342 2,389,588 2004 9,107 792,583 910,181 790,697 2,502,569 2005 6,929 854,294 1,064,233 748,199 2,673,655
16
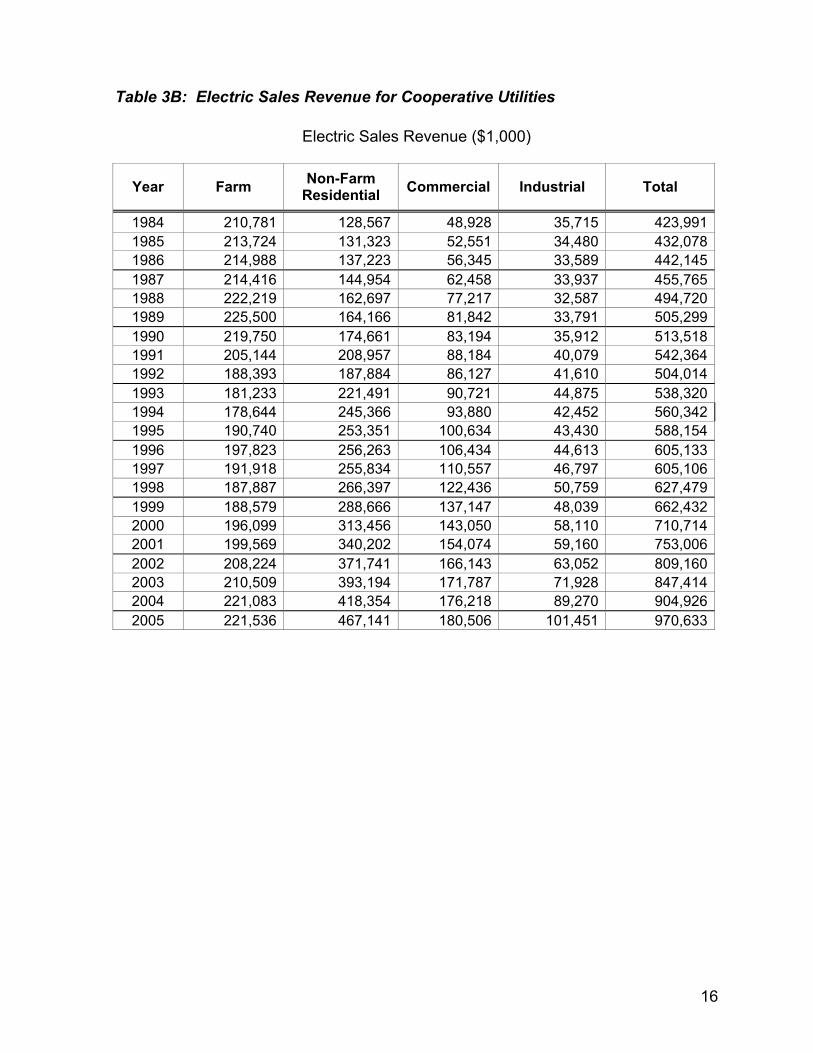
Table 3B: Electric Sales Revenue for Cooperative Utilities
Electric Sales Revenue ($1,000)
Year Farm Non-Farm Residential Commercial Industrial Total
1984 210,781 128,567 48,928 35,715 423,991 1985 213,724 131,323 52,551 34,480 432,078 1986 214,988 137,223 56,345 33,589 442,145 1987 214,416 144,954 62,458 33,937 455,765 1988 222,219 162,697 77,217 32,587 494,720 1989 225,500 164,166 81,842 33,791 505,299 1990 219,750 174,661 83,194 35,912 513,518 1991 205,144 208,957 88,184 40,079 542,364 1992 188,393 187,884 86,127 41,610 504,014 1993 181,233 221,491 90,721 44,875 538,320 1994 178,644 245,366 93,880 42,452 560,342 1995 190,740 253,351 100,634 43,430 588,154 1996 197,823 256,263 106,434 44,613 605,133 1997 191,918 255,834 110,557 46,797 605,106 1998 187,887 266,397 122,436 50,759 627,479 1999 188,579 288,666 137,147 48,039 662,432 2000 196,099 313,456 143,050 58,110 710,714 2001 199,569 340,202 154,074 59,160 753,006 2002 208,224 371,741 166,143 63,052 809,160 2003 210,509 393,194 171,787 71,928 847,414 2004 221,083 418,354 176,218 89,270 904,926 2005 221,536 467,141 180,506 101,451 970,633
17
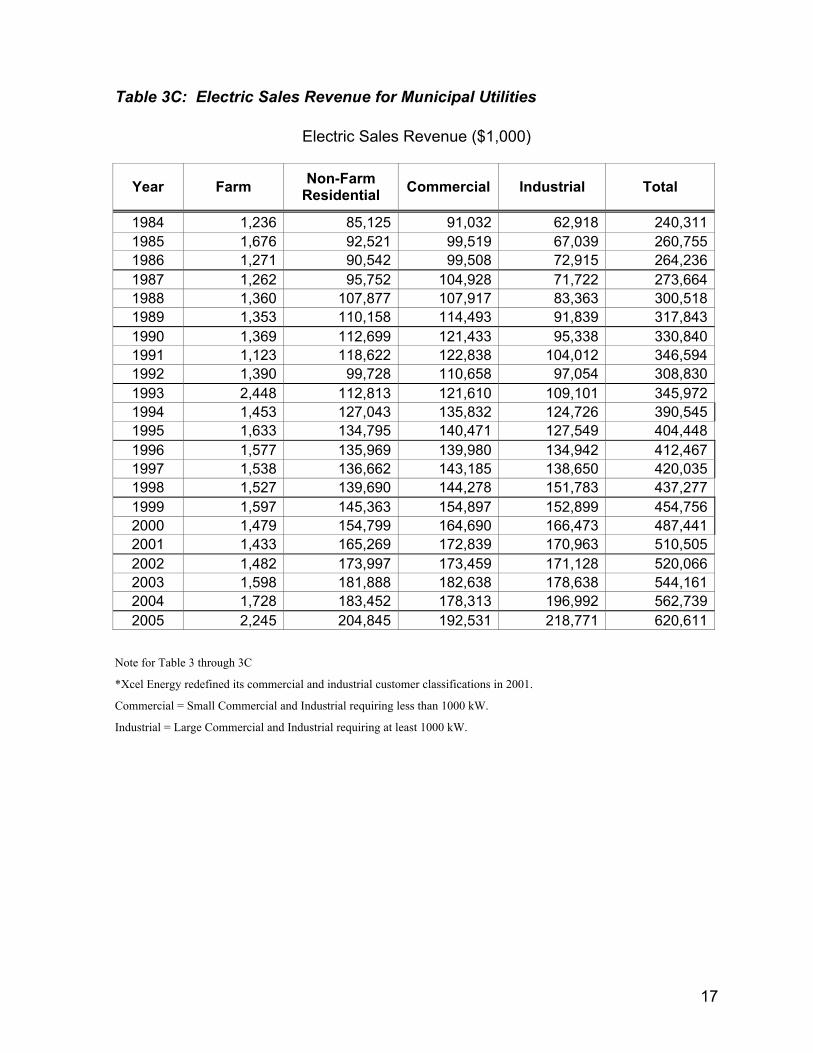
Table 3C: Electric Sales Revenue for Municipal Utilities
Electric Sales Revenue ($1,000)
Year Farm Non-Farm Residential Commercial Industrial Total
1984 1,236 85,125 91,032 62,918 240,311 1985 1,676 92,521 99,519 67,039 260,755 1986 1,271 90,542 99,508 72,915 264,236 1987 1,262 95,752 104,928 71,722 273,664 1988 1,360 107,877 107,917 83,363 300,518 1989 1,353 110,158 114,493 91,839 317,843 1990 1,369 112,699 121,433 95,338 330,840 1991 1,123 118,622 122,838 104,012 346,594 1992 1,390 99,728 110,658 97,054 308,830 1993 2,448 112,813 121,610 109,101 345,972 1994 1,453 127,043 135,832 124,726 390,545 1995 1,633 134,795 140,471 127,549 404,448 1996 1,577 135,969 139,980 134,942 412,467 1997 1,538 136,662 143,185 138,650 420,035 1998 1,527 139,690 144,278 151,783 437,277 1999 1,597 145,363 154,897 152,899 454,756 2000 1,479 154,799 164,690 166,473 487,441 2001 1,433 165,269 172,839 170,963 510,505 2002 1,482 173,997 173,459 171,128 520,066 2003 1,598 181,888 182,638 178,638 544,161 2004 1,728 183,452 178,313 196,992 562,739 2005 2,245 204,845 192,531 218,771 620,611
Note for Table 3 through 3C
*Xcel Energy redefined its commercial and industrial customer classifications in 2001.
Commercial = Small Commercial and Industrial requiring less than 1000 kW.
Industrial = Large Commercial and Industrial requiring at least 1000 kW.
18
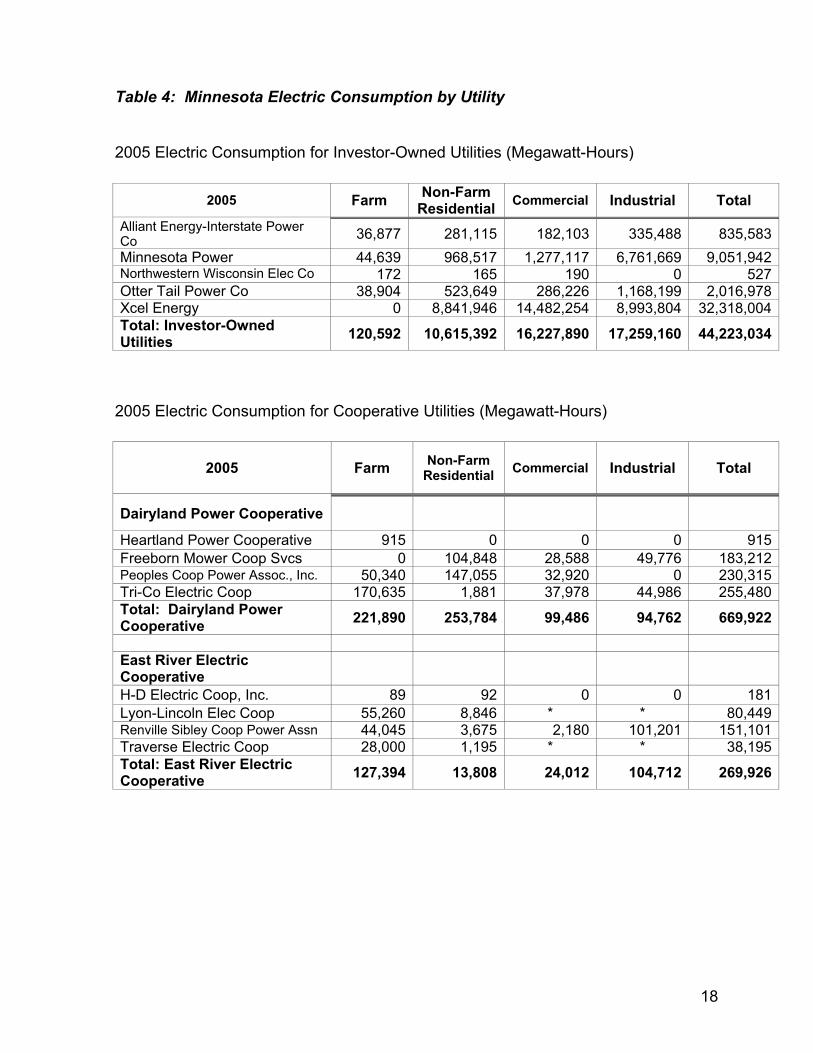
Table 4: Minnesota Electric Consumption by Utility
2005 Electric Consumption for Investor-Owned Utilities (Megawatt-Hours)
2005 Farm Non-Farm Residential Commercial Industrial Total
Alliant Energy-Interstate Power Co 36,877 281,115 182,103 335,488 835,583 Minnesota Power 44,639 968,517 1,277,117 6,761,669 9,051,942 Northwestern Wisconsin Elec Co 172 165 190 0 527 Otter Tail Power Co 38,904 523,649 286,226 1,168,199 2,016,978 Xcel Energy 0 8,841,946 14,482,254 8,993,804 32,318,004 Total: Investor-Owned Utilities 120,592 10,615,392 16,227,890 17,259,160 44,223,034
2005 Electric Consumption for Cooperative Utilities (Megawatt-Hours)
2005 Farm Non-Farm Residential Commercial Industrial Total
Dairyland Power Cooperative
Heartland Power Cooperative 915 0 0 0 915 Freeborn Mower Coop Svcs 0 104,848 28,588 49,776 183,212 Peoples Coop Power Assoc., Inc. 50,340 147,055 32,920 0 230,315 Tri-Co Electric Coop 170,635 1,881 37,978 44,986 255,480 Total: Dairyland Power Cooperative 221,890 253,784 99,486 94,762 669,922
East River Electric Cooperative
H-D Electric Coop, Inc. 89 92 0 0 181 Lyon-Lincoln Elec Coop 55,260 8,846 * * 80,449 Renville Sibley Coop Power Assn 44,045 3,675 2,180 101,201 151,101 Traverse Electric Coop 28,000 1,195 * * 38,195 Total: East River Electric Cooperative 127,394 13,808 24,012 104,712 269,926
19
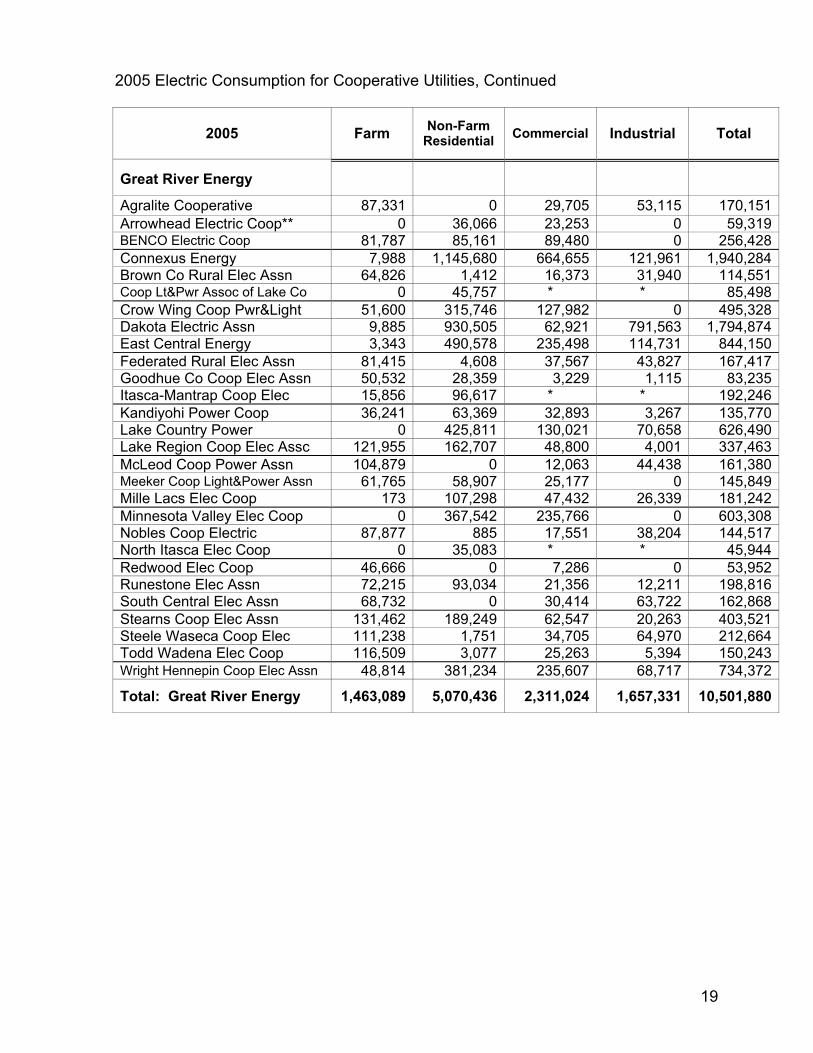
2005 Electric Consumption for Cooperative Utilities, Continued
2005 Farm Non-Farm Residential Commercial Industrial Total
Great River Energy
Agralite Cooperative 87,331 0 29,705 53,115 170,151 Arrowhead Electric Coop** 0 36,066 23,253 0 59,319 BENCO Electric Coop 81,787 85,161 89,480 0 256,428 Connexus Energy 7,988 1,145,680 664,655 121,961 1,940,284 Brown Co Rural Elec Assn 64,826 1,412 16,373 31,940 114,551 Coop Lt&Pwr Assoc of Lake Co 0 45,757 * * 85,498 Crow Wing Coop Pwr&Light 51,600 315,746 127,982 0 495,328 Dakota Electric Assn 9,885 930,505 62,921 791,563 1,794,874 East Central Energy 3,343 490,578 235,498 114,731 844,150 Federated Rural Elec Assn 81,415 4,608 37,567 43,827 167,417 Goodhue Co Coop Elec Assn 50,532 28,359 3,229 1,115 83,235 Itasca-Mantrap Coop Elec 15,856 96,617 * * 192,246 Kandiyohi Power Coop 36,241 63,369 32,893 3,267 135,770 Lake Country Power 0 425,811 130,021 70,658 626,490 Lake Region Coop Elec Assc 121,955 162,707 48,800 4,001 337,463 McLeod Coop Power Assn 104,879 0 12,063 44,438 161,380 Meeker Coop Light&Power Assn 61,765 58,907 25,177 0 145,849 Mille Lacs Elec Coop 173 107,298 47,432 26,339 181,242 Minnesota Valley Elec Coop 0 367,542 235,766 0 603,308 Nobles Coop Electric 87,877 885 17,551 38,204 144,517 North Itasca Elec Coop 0 35,083 * * 45,944 Redwood Elec Coop 46,666 0 7,286 0 53,952 Runestone Elec Assn 72,215 93,034 21,356 12,211 198,816 South Central Elec Assn 68,732 0 30,414 63,722 162,868 Stearns Coop Elec Assn 131,462 189,249 62,547 20,263 403,521 Steele Waseca Coop Elec 111,238 1,751 34,705 64,970 212,664 Todd Wadena Elec Coop 116,509 3,077 25,263 5,394 150,243 Wright Hennepin Coop Elec Assn 48,814 381,234 235,607 68,717 734,372
Total: Great River Energy 1,463,089 5,070,436 2,311,024 1,657,331 10,501,880
20
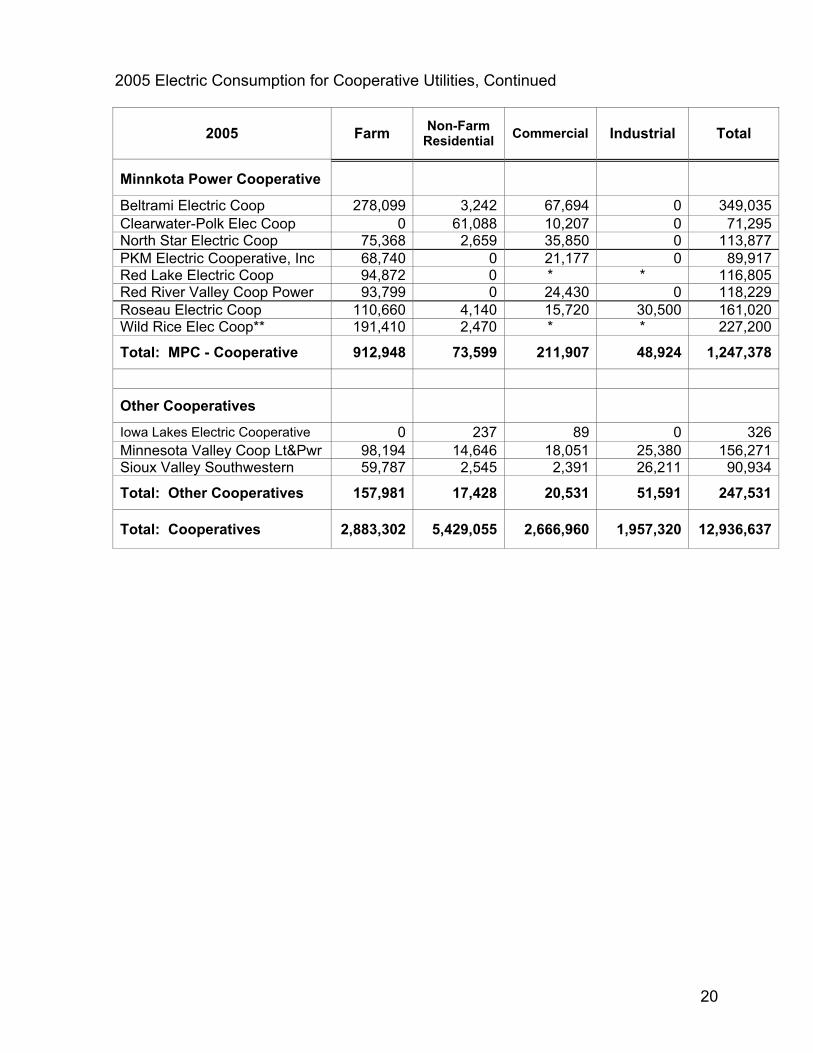
2005 Electric Consumption for Cooperative Utilities, Continued
2005 Farm Non-Farm Residential Commercial Industrial Total
Minnkota Power Cooperative
Beltrami Electric Coop 278,099 3,242 67,694 0 349,035 Clearwater-Polk Elec Coop 0 61,088 10,207 0 71,295 North Star Electric Coop 75,368 2,659 35,850 0 113,877 PKM Electric Cooperative, Inc 68,740 0 21,177 0 89,917 Red Lake Electric Coop 94,872 0 * * 116,805 Red River Valley Coop Power 93,799 0 24,430 0 118,229 Roseau Electric Coop 110,660 4,140 15,720 30,500 161,020 Wild Rice Elec Coop** 191,410 2,470 * * 227,200
Total: MPC - Cooperative 912,948 73,599 211,907 48,924 1,247,378
Other Cooperatives
Iowa Lakes Electric Cooperative 0 237 89 0 326 Minnesota Valley Coop Lt&Pwr 98,194 14,646 18,051 25,380 156,271 Sioux Valley Southwestern 59,787 2,545 2,391 26,211 90,934
Total: Other Cooperatives 157,981 17,428 20,531 51,591 247,531
Total: Cooperatives 2,883,302 5,429,055 2,666,960 1,957,320 12,936,637
21
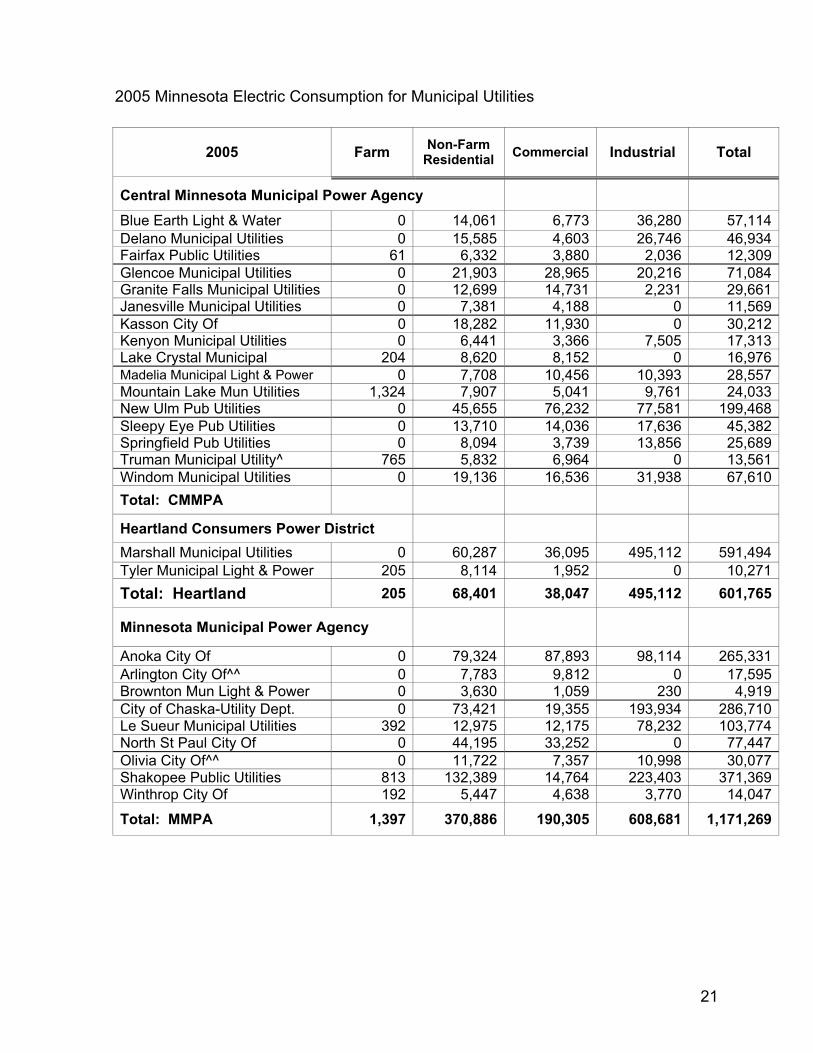
2005 Minnesota Electric Consumption for Municipal Utilities
2005 Farm Non-Farm Residential Commercial Industrial Total
Central Minnesota Municipal Power Agency Blue Earth Light & Water 0 14,061 6,773 36,280 57,114 Delano Municipal Utilities 0 15,585 4,603 26,746 46,934 Fairfax Public Utilities 61 6,332 3,880 2,036 12,309 Glencoe Municipal Utilities 0 21,903 28,965 20,216 71,084 Granite Falls Municipal Utilities 0 12,699 14,731 2,231 29,661 Janesville Municipal Utilities 0 7,381 4,188 0 11,569 Kasson City Of 0 18,282 11,930 0 30,212 Kenyon Municipal Utilities 0 6,441 3,366 7,505 17,313 Lake Crystal Municipal 204 8,620 8,152 0 16,976 Madelia Municipal Light & Power 0 7,708 10,456 10,393 28,557 Mountain Lake Mun Utilities 1,324 7,907 5,041 9,761 24,033 New Ulm Pub Utilities 0 45,655 76,232 77,581 199,468 Sleepy Eye Pub Utilities 0 13,710 14,036 17,636 45,382 Springfield Pub Utilities 0 8,094 3,739 13,856 25,689 Truman Municipal Utility^ 765 5,832 6,964 0 13,561 Windom Municipal Utilities 0 19,136 16,536 31,938 67,610 Total: CMMPA
Heartland Consumers Power District Marshall Municipal Utilities 0 60,287 36,095 495,112 591,494 Tyler Municipal Light & Power 205 8,114 1,952 0 10,271 Total: Heartland 205 68,401 38,047 495,112 601,765
Minnesota Municipal Power Agency
Anoka City Of 0 79,324 87,893 98,114 265,331 Arlington City Of^^ 0 7,783 9,812 0 17,595 Brownton Mun Light & Power 0 3,630 1,059 230 4,919 City of Chaska-Utility Dept. 0 73,421 19,355 193,934 286,710 Le Sueur Municipal Utilities 392 12,975 12,175 78,232 103,774 North St Paul City Of 0 44,195 33,252 0 77,447 Olivia City Of^^ 0 11,722 7,357 10,998 30,077 Shakopee Public Utilities 813 132,389 14,764 223,403 371,369 Winthrop City Of 192 5,447 4,638 3,770 14,047
Total: MMPA 1,397 370,886 190,305 608,681 1,171,269
22
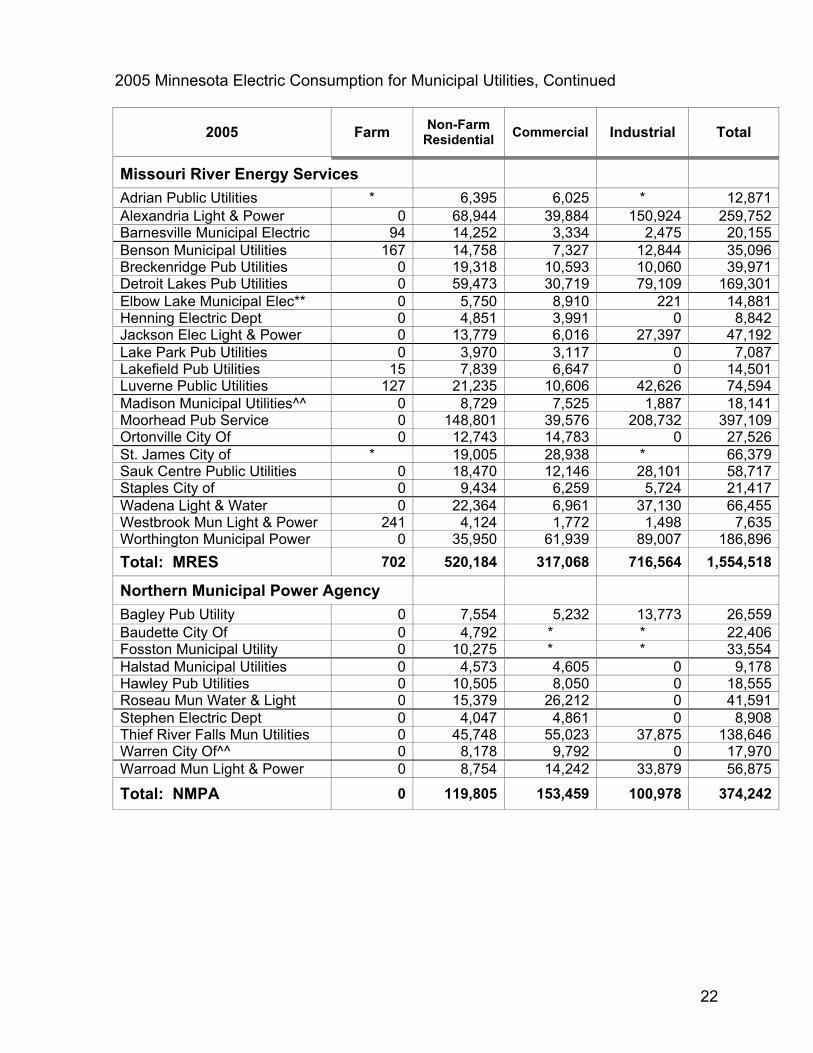
2005 Minnesota Electric Consumption for Municipal Utilities, Continued
2005 Farm Non-Farm Residential Commercial Industrial Total
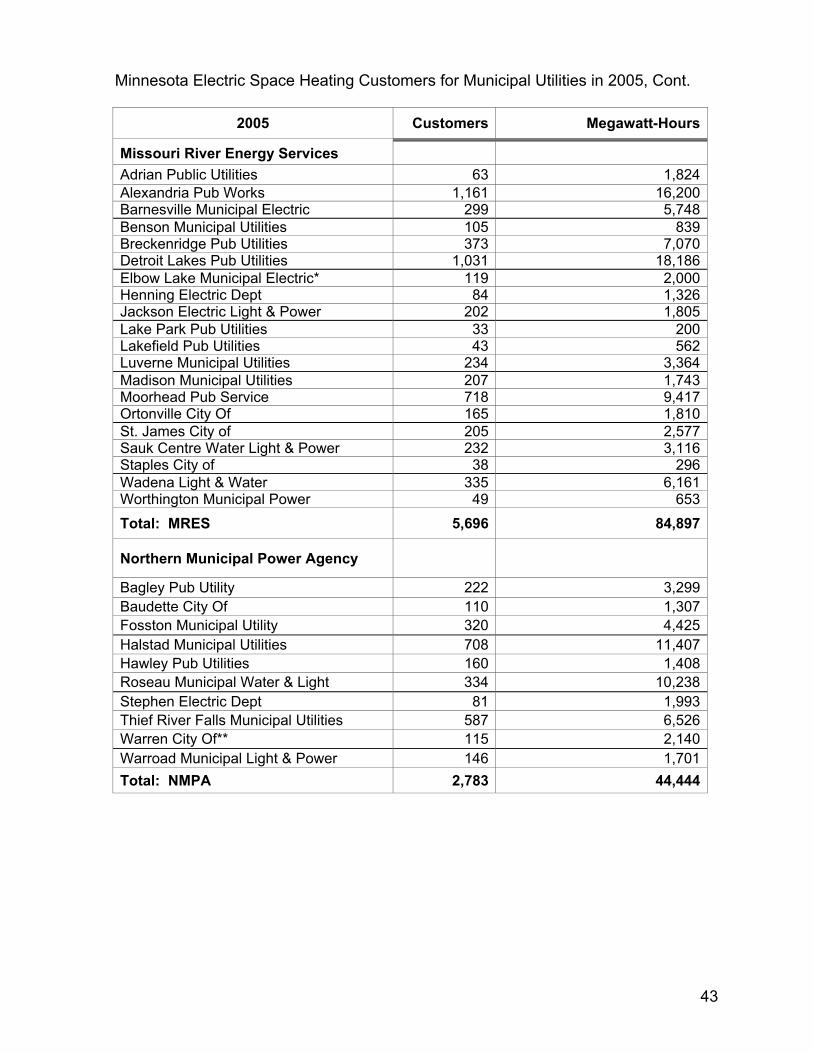
Missouri River Energy Services Adrian Public Utilities * 6,395 6,025 * 12,871 Alexandria Light & Power 0 68,944 39,884 150,924 259,752 Barnesville Municipal Electric 94 14,252 3,334 2,475 20,155 Benson Municipal Utilities 167 14,758 7,327 12,844 35,096 Breckenridge Pub Utilities 0 19,318 10,593 10,060 39,971 Detroit Lakes Pub Utilities 0 59,473 30,719 79,109 169,301 Elbow Lake Municipal Elec** 0 5,750 8,910 221 14,881 Henning Electric Dept 0 4,851 3,991 0 8,842 Jackson Elec Light & Power 0 13,779 6,016 27,397 47,192 Lake Park Pub Utilities 0 3,970 3,117 0 7,087 Lakefield Pub Utilities 15 7,839 6,647 0 14,501 Luverne Public Utilities 127 21,235 10,606 42,626 74,594 Madison Municipal Utilities^^ 0 8,729 7,525 1,887 18,141 Moorhead Pub Service 0 148,801 39,576 208,732 397,109 Ortonville City Of 0 12,743 14,783 0 27,526 St. James City of * 19,005 28,938 * 66,379 Sauk Centre Public Utilities 0 18,470 12,146 28,101 58,717 Staples City of 0 9,434 6,259 5,724 21,417 Wadena Light & Water 0 22,364 6,961 37,130 66,455 Westbrook Mun Light & Power 241 4,124 1,772 1,498 7,635 Worthington Municipal Power 0 35,950 61,939 89,007 186,896 Total: MRES 702 520,184 317,068 716,564 1,554,518
Northern Municipal Power Agency Bagley Pub Utility 0 7,554 5,232 13,773 26,559 Baudette City Of 0 4,792 * * 22,406 Fosston Municipal Utility 0 10,275 * * 33,554 Halstad Municipal Utilities 0 4,573 4,605 0 9,178 Hawley Pub Utilities 0 10,505 8,050 0 18,555 Roseau Mun Water & Light 0 15,379 26,212 0 41,591 Stephen Electric Dept 0 4,047 4,861 0 8,908 Thief River Falls Mun Utilities 0 45,748 55,023 37,875 138,646 Warren City Of^^ 0 8,178 9,792 0 17,970 Warroad Mun Light & Power 0 8,754 14,242 33,879 56,875
Total: NMPA 0 119,805 153,459 100,978 374,242
23
2005 Minnesota Electric Consumption for Municipal Utilities, Continued
2005 Farm Non-Farm Residential Commercial Industrial Total
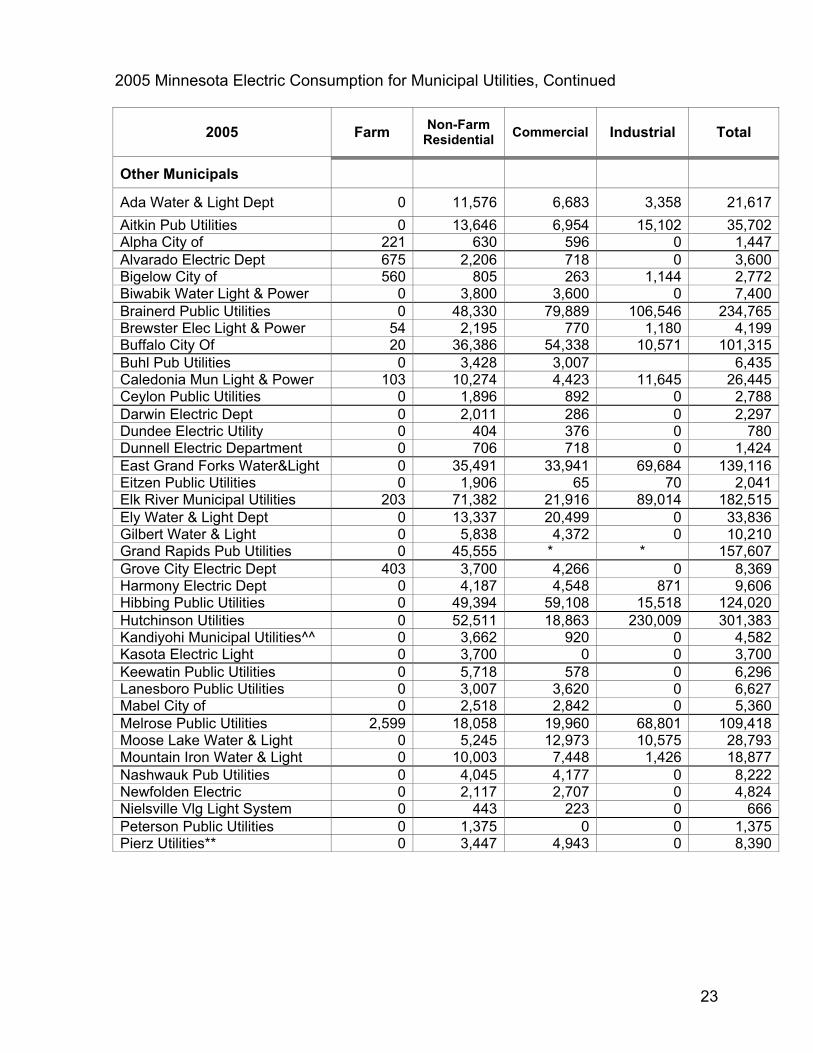
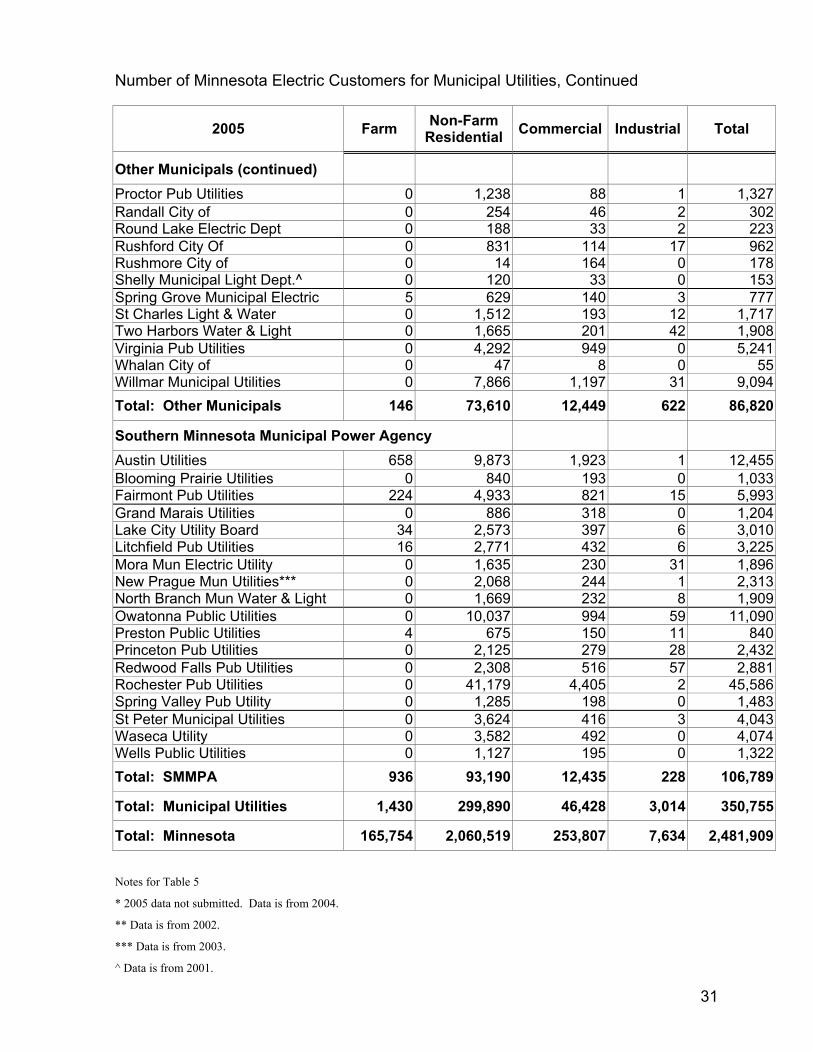
Other Municipals
Ada Water & Light Dept 0 11,576 6,683 3,358 21,617 Aitkin Pub Utilities 0 13,646 6,954 15,102 35,702 Alpha City of 221 630 596 0 1,447 Alvarado Electric Dept 675 2,206 718 0 3,600 Bigelow City of 560 805 263 1,144 2,772 Biwabik Water Light & Power 0 3,800 3,600 0 7,400 Brainerd Public Utilities 0 48,330 79,889 106,546 234,765 Brewster Elec Light & Power 54 2,195 770 1,180 4,199 Buffalo City Of 20 36,386 54,338 10,571 101,315 Buhl Pub Utilities 0 3,428 3,007 6,435 Caledonia Mun Light & Power 103 10,274 4,423 11,645 26,445 Ceylon Public Utilities 0 1,896 892 0 2,788 Darwin Electric Dept 0 2,011 286 0 2,297 Dundee Electric Utility 0 404 376 0 780 Dunnell Electric Department 0 706 718 0 1,424 East Grand Forks Water&Light 0 35,491 33,941 69,684 139,116 Eitzen Public Utilities 0 1,906 65 70 2,041 Elk River Municipal Utilities 203 71,382 21,916 89,014 182,515 Ely Water & Light Dept 0 13,337 20,499 0 33,836 Gilbert Water & Light 0 5,838 4,372 0 10,210 Grand Rapids Pub Utilities 0 45,555 * * 157,607 Grove City Electric Dept 403 3,700 4,266 0 8,369 Harmony Electric Dept 0 4,187 4,548 871 9,606 Hibbing Public Utilities 0 49,394 59,108 15,518 124,020 Hutchinson Utilities 0 52,511 18,863 230,009 301,383 Kandiyohi Municipal Utilities^^ 0 3,662 920 0 4,582 Kasota Electric Light 0 3,700 0 0 3,700 Keewatin Public Utilities 0 5,718 578 0 6,296 Lanesboro Public Utilities 0 3,007 3,620 0 6,627 Mabel City of 0 2,518 2,842 0 5,360 Melrose Public Utilities 2,599 18,058 19,960 68,801 109,418 Moose Lake Water & Light 0 5,245 12,973 10,575 28,793 Mountain Iron Water & Light 0 10,003 7,448 1,426 18,877 Nashwauk Pub Utilities 0 4,045 4,177 0 8,222 Newfolden Electric 0 2,117 2,707 0 4,824 Nielsville Vlg Light System 0 443 223 0 666 Peterson Public Utilities 0 1,375 0 0 1,375 Pierz Utilities** 0 3,447 4,943 0 8,390
24
2005 Minnesota Electric Consumption for Municipal Utilities, Continued
2005 Farm Non-Farm Residential Commercial Industrial Total
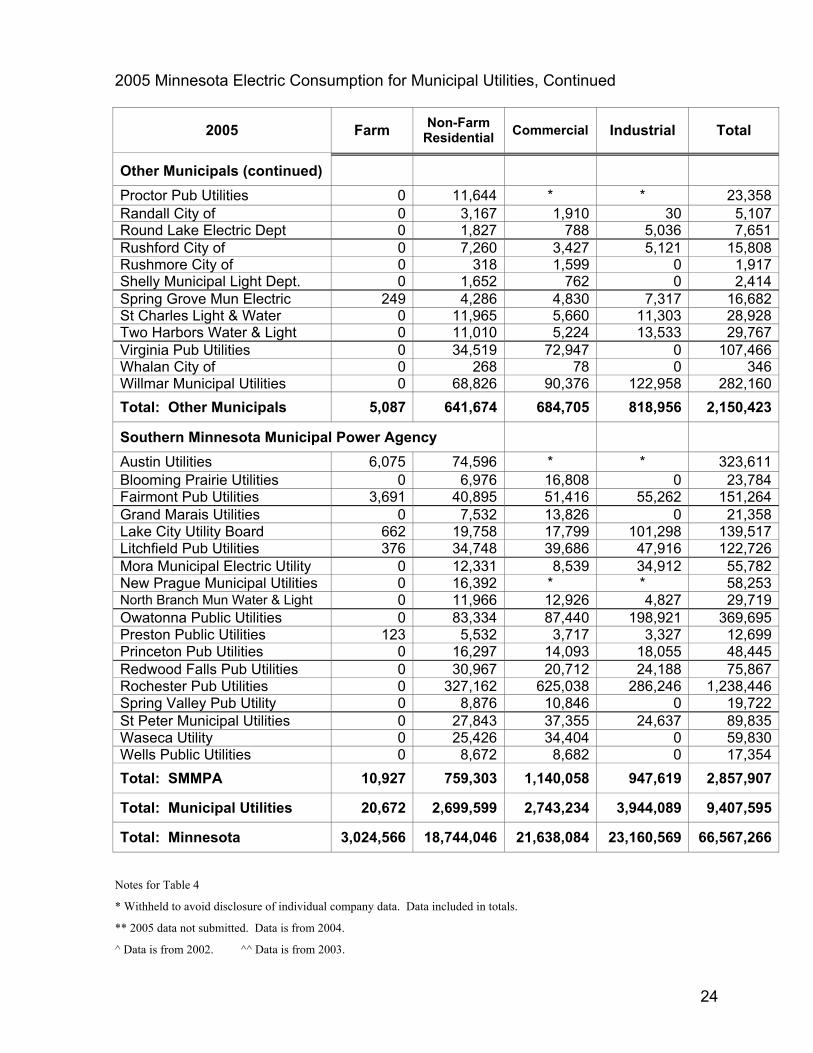
Other Municipals (continued)
Proctor Pub Utilities 0 11,644 * * 23,358 Randall City of 0 3,167 1,910 30 5,107 Round Lake Electric Dept 0 1,827 788 5,036 7,651 Rushford City of 0 7,260 3,427 5,121 15,808 Rushmore City of 0 318 1,599 0 1,917 Shelly Municipal Light Dept. 0 1,652 762 0 2,414 Spring Grove Mun Electric 249 4,286 4,830 7,317 16,682 St Charles Light & Water 0 11,965 5,660 11,303 28,928 Two Harbors Water & Light 0 11,010 5,224 13,533 29,767 Virginia Pub Utilities 0 34,519 72,947 0 107,466 Whalan City of 0 268 78 0 346 Willmar Municipal Utilities 0 68,826 90,376 122,958 282,160 Total: Other Municipals 5,087 641,674 684,705 818,956 2,150,423
Southern Minnesota Municipal Power Agency
Austin Utilities 6,075 74,596 * * 323,611 Blooming Prairie Utilities 0 6,976 16,808 0 23,784 Fairmont Pub Utilities 3,691 40,895 51,416 55,262 151,264 Grand Marais Utilities 0 7,532 13,826 0 21,358 Lake City Utility Board 662 19,758 17,799 101,298 139,517 Litchfield Pub Utilities 376 34,748 39,686 47,916 122,726 Mora Municipal Electric Utility 0 12,331 8,539 34,912 55,782 New Prague Municipal Utilities 0 16,392 * * 58,253 North Branch Mun Water & Light 0 11,966 12,926 4,827 29,719 Owatonna Public Utilities 0 83,334 87,440 198,921 369,695 Preston Public Utilities 123 5,532 3,717 3,327 12,699 Princeton Pub Utilities 0 16,297 14,093 18,055 48,445 Redwood Falls Pub Utilities 0 30,967 20,712 24,188 75,867 Rochester Pub Utilities 0 327,162 625,038 286,246 1,238,446 Spring Valley Pub Utility 0 8,876 10,846 0 19,722 St Peter Municipal Utilities 0 27,843 37,355 24,637 89,835 Waseca Utility 0 25,426 34,404 0 59,830 Wells Public Utilities 0 8,672 8,682 0 17,354 Total: SMMPA 10,927 759,303 1,140,058 947,619 2,857,907
Total: Municipal Utilities 20,672 2,699,599 2,743,234 3,944,089 9,407,595
Total: Minnesota 3,024,566 18,744,046 21,638,084 23,160,569 66,567,266 Notes for Table 4
* Withheld to avoid disclosure of individual company data. Data included in totals.
** 2005 data not submitted. Data is from 2004.
^ Data is from 2002. ^^ Data is from 2003.
25
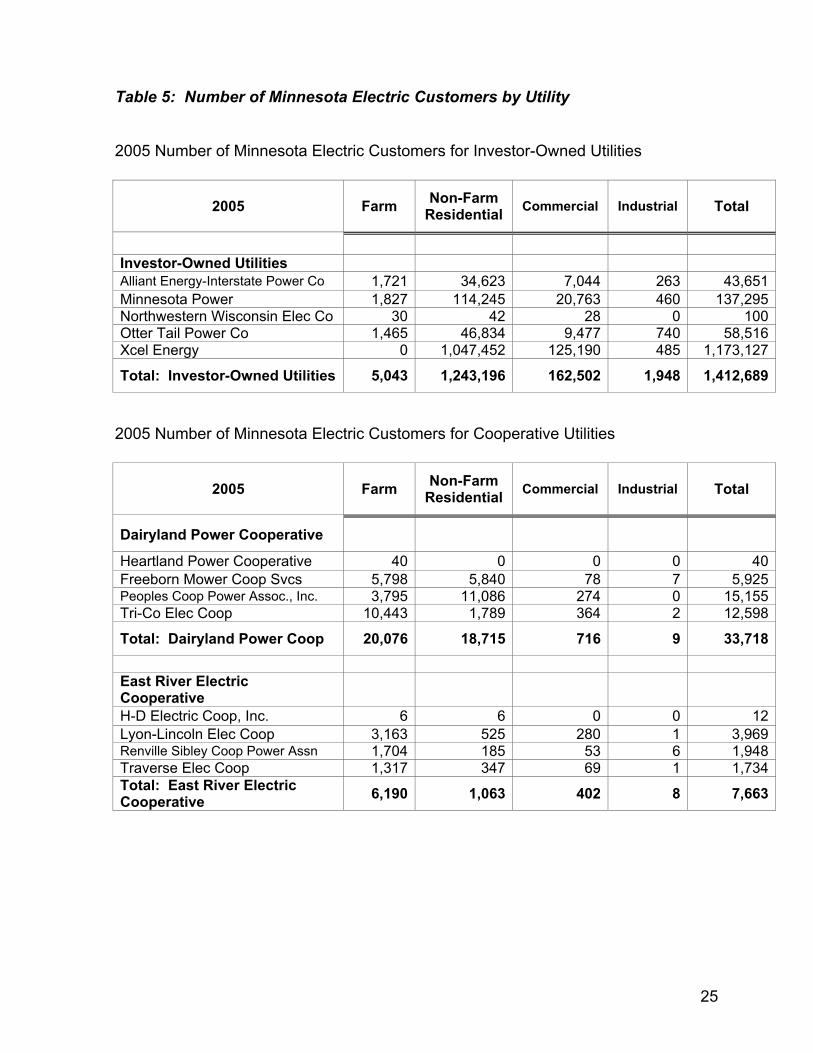
Table 5: Number of Minnesota Electric Customers by Utility
2005 Number of Minnesota Electric Customers for Investor-Owned Utilities
2005 Farm Non-Farm Residential Commercial Industrial Total
Investor-Owned Utilities Alliant Energy-Interstate Power Co 1,721 34,623 7,044 263 43,651 Minnesota Power 1,827 114,245 20,763 460 137,295 Northwestern Wisconsin Elec Co 30 42 28 0 100 Otter Tail Power Co 1,465 46,834 9,477 740 58,516 Xcel Energy 0 1,047,452 125,190 485 1,173,127
Total: Investor-Owned Utilities 5,043 1,243,196 162,502 1,948 1,412,689
2005 Number of Minnesota Electric Customers for Cooperative Utilities
2005 Farm Non-Farm Residential Commercial Industrial Total
Dairyland Power Cooperative
Heartland Power Cooperative 40 0 0 0 40 Freeborn Mower Coop Svcs 5,798 5,840 78 7 5,925 Peoples Coop Power Assoc., Inc. 3,795 11,086 274 0 15,155 Tri-Co Elec Coop 10,443 1,789 364 2 12,598
Total: Dairyland Power Coop 20,076 18,715 716 9 33,718
East River Electric Cooperative
H-D Electric Coop, Inc. 6 6 0 0 12 Lyon-Lincoln Elec Coop 3,163 525 280 1 3,969 Renville Sibley Coop Power Assn 1,704 185 53 6 1,948 Traverse Elec Coop 1,317 347 69 1 1,734 Total: East River Electric Cooperative 6,190 1,063 402 8 7,663
26
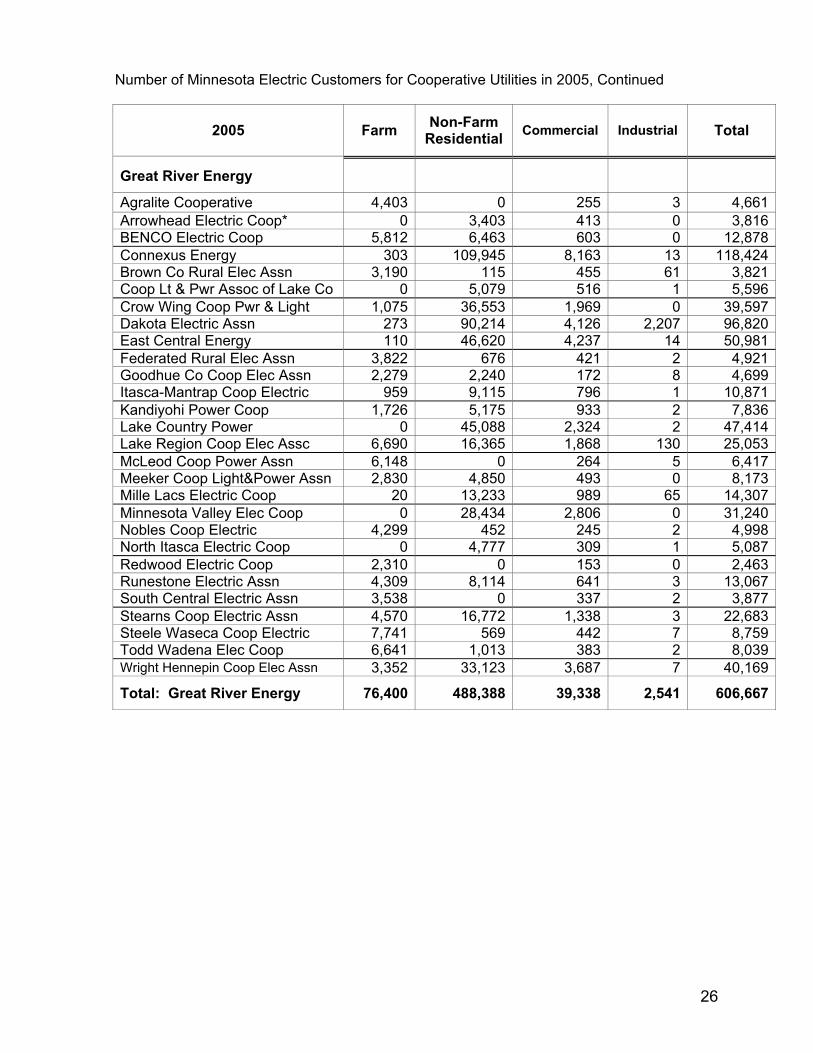
Number of Minnesota Electric Customers for Cooperative Utilities in 2005, Continued
2005 Farm Non-Farm Residential Commercial Industrial Total
Great River Energy
Agralite Cooperative 4,403 0 255 3 4,661 Arrowhead Electric Coop* 0 3,403 413 0 3,816 BENCO Electric Coop 5,812 6,463 603 0 12,878 Connexus Energy 303 109,945 8,163 13 118,424 Brown Co Rural Elec Assn 3,190 115 455 61 3,821 Coop Lt & Pwr Assoc of Lake Co 0 5,079 516 1 5,596 Crow Wing Coop Pwr & Light 1,075 36,553 1,969 0 39,597 Dakota Electric Assn 273 90,214 4,126 2,207 96,820 East Central Energy 110 46,620 4,237 14 50,981 Federated Rural Elec Assn 3,822 676 421 2 4,921 Goodhue Co Coop Elec Assn 2,279 2,240 172 8 4,699 Itasca-Mantrap Coop Electric 959 9,115 796 1 10,871 Kandiyohi Power Coop 1,726 5,175 933 2 7,836 Lake Country Power 0 45,088 2,324 2 47,414 Lake Region Coop Elec Assc 6,690 16,365 1,868 130 25,053 McLeod Coop Power Assn 6,148 0 264 5 6,417 Meeker Coop Light&Power Assn 2,830 4,850 493 0 8,173 Mille Lacs Electric Coop 20 13,233 989 65 14,307 Minnesota Valley Elec Coop 0 28,434 2,806 0 31,240 Nobles Coop Electric 4,299 452 245 2 4,998 North Itasca Electric Coop 0 4,777 309 1 5,087 Redwood Electric Coop 2,310 0 153 0 2,463 Runestone Electric Assn 4,309 8,114 641 3 13,067 South Central Electric Assn 3,538 0 337 2 3,877 Stearns Coop Electric Assn 4,570 16,772 1,338 3 22,683 Steele Waseca Coop Electric 7,741 569 442 7 8,759 Todd Wadena Elec Coop 6,641 1,013 383 2 8,039 Wright Hennepin Coop Elec Assn 3,352 33,123 3,687 7 40,169
Total: Great River Energy 76,400 488,388 39,338 2,541 606,667
27
Number of Minnesota Electric Customers for Cooperative Utilities in 2005, Continued
2005 Farm Non-Farm Residential Commercial Industrial Total
Minnkota Power Cooperative
Beltrami Electric Coop 16,461 1,345 1,230 0 19,036 Clearwater-Polk Elec Coop 0 3,962 294 0 4,256 North Star Electric Coop 4,269 1,501 556 0 6,326 PKM Electric Cooperative, Inc 3,378 0 257 0 3,635 Red Lake Electric Coop 4,663 0 308 49 5,020 Red River Valley Coop Power 4,179 0 478 0 4,657 Roseau Electric Coop 5,608 354 292 2 6,256 Wild Rice Electric Coop 11,345 1,107 670 1 13,123
Total: MPC - Cooperative 49,903 8,269 4,085 52 62,309
Other Cooperatives
Iowa Lakes Electric Cooperative 0 16 3 0 19 Minnesota Valley Coop Lt & Pwr 4,198 810 244 3 5,255 Sioux Valley Southwestern 2,514 172 89 59 2,834
Total: Other Cooperatives 6,712 998 336 62 8,108
Total: Cooperatives 159,281 517,433 44,877 2,672 718,465
28
2005 Number of Minnesota Electric Customers for Municipal Utilities
2005 Farm Non-Farm Residential Commercial Industrial Total
Central Minnesota Municipal Power Agency Blue Earth Light & Water 0 1,678 327 59 2,064 Delano Municipal Utilities 0 1,853 292 81 2,226 Fairfax Public Utilities 4 575 103 6 688 Glencoe Municipal Utilities 0 2,437 385 3 2,825 Granite Falls Municipal Utilities 0 1,389 252 7 1,648 Janesville Municipal Utilities 0 996 155 0 1,151 Kasson City Of* 0 2,156 238 0 2,394 Kenyon Municipal Utilities 0 804 108 23 935 Lake Crystal Municipal 18 1,024 178 0 1,220 Madelia Municipal Light & Power 0 1,028 201 9 1,238 Mountain Lake Mun Utilities 36 822 163 13 1,034 New Ulm Pub Utilities 0 5,858 1,035 7 6,900 Sleepy Eye Pub Utilities 0 1,523 393 14 1,930 Springfield Pub Utilities 0 1,012 205 12 1,229 Truman Municipal Utility** 6 506 103 0 615 Windom Municipal Utilities 0 2,068 330 26 2,424 Total: CMMPA 64 25,729 4,468 260 30,521
Heartland Consumers Power District Marshall Municipal Utilities*** 0 5,328 870 87 6,285 Tyler Municipal Light & Power 11 511 119 0 641 Total: Heartland 11 5,839 989 87 6,926
Minnesota Municipal Power Agency
Anoka City Of 0 10,437 1,281 17 11,735 Arlington City Of*** 0 891 135 0 1,026 Brownton Mun Light & Power 0 348 45 5 398 City of Chaska-Utility Dept. 0 7,621 892 240 8,753 Le Sueur Municipal Utilities 189 1,642 298 51 2,180 North St Paul City Of 0 5,709 631 0 6,340 Olivia City Of*** 0 1,143 156 50 1,349 Shakopee Public Utilities 29 13,377 873 419 14,698 Winthrop City Of 12 664 122 2 800
Total: MMPA 230 41,832 4,433 784 47,279
29
Number of Minnesota Electric Customers for Municipal Utilities, Continued
2005 Farm Non-Farm Residential Commercial Industrial Total
Missouri River Energy Services Adrian Public Utilities 1 530 90 2 623 Alexandria Light & Power 0 7,357 1,508 161 9,026 Barnesville Municipal Electric 3 1,046 115 12 1,176 Benson Municipal Utilities 3 1,512 239 50 1,804 Breckenridge Pub Utilities 0 1,554 259 21 1,834 Detroit Lakes Pub Utilities 0 5,255 1,033 109 6,397 Elbow Lake Municipal Electric* 0 665 77 25 767 Henning Electric Dept 0 425 99 0 524 Jackson Electric Light & Power 0 1,576 266 48 1,890 Lake Park Pub Utilities 0 360 81 0 441 Lakefield Pub Utilities 2 895 157 0 1,054 Luverne Public Utilities 12 2,056 324 105 2,497 Madison Municipal Utilities*** 0 851 177 13 1,041 Moorhead Pub Service 0 13,194 1,646 185 15,025 Ortonville City Of 0 1,066 1,169 0 2,235 St. James City of 3 1,885 376 1 2,265 Sauk Centre Public Utilities 0 1,887 359 73 2,319 Staples City of 0 1,093 209 7 1,309 Wadena Light & Water 0 2,140 453 108 2,701 Westbrook Mun Light & Power 19 339 78 2 438 Worthington Municipal Power 0 4,374 802 7 5,183 Total: MRES 43 50,060 9,517 929 60,549
Northern Municipal Power Agency Bagley Pub Utility 0 557 151 61 769 Baudette City Of 0 578 188 1 767 Fosston Municipal Utility 0 718 222 10 950 Halstad Municipal Utilities 0 266 66 0 332 Hawley Pub Utilities 0 876 185 0 1,061 Roseau Municipal Water & Light 0 1,136 270 0 1,406 Stephen Electric Dept 0 296 96 0 392 Thief River Falls Mun Utilities 0 3,784 680 28 4,492 Warren City Of*** 0 668 145 0 813 Warroad Mun Light & Power 0 751 134 4 889
Total: NMPA 0 9,630 2,137 104 11,871
30
Number of Minnesota Electric Customers for Municipal Utilities, Continued
2005 Farm Non-Farm Residential Commercial Industrial Total
Other Municipals Ada Water & Light Dept 0 871 146 32 1,049 Aitkin Pub Utilities 0 1,449 342 48 1,839 Alpha City of 2 64 14 0 80 Alvarado Electric Dept 5 193 40 0 238 Bigelow City of 25 95 25 7 152 Biwabik Water Light & Power 0 615 121 0 736 Brainerd Public Utilities 0 6,330 1,254 32 7,616 Brewster Electric Light & Power 4 224 35 2 258 Buffalo City Of 2 4,407 707 15 5,131 Buhl Pub Utilities 0 529 43 0 572 Caledonia Mun Light & Power 8 1,334 186 73 1,601 Ceylon Public Utilities 0 191 46 0 237 Darwin Electric Dept 0 176 25 0 201 Dundee Electric Utility 0 50 16 0 66 Dunnell Electric Department 0 92 30 0 122 East Grand Forks Water & Light 0 3,447 495 11 3,953 Eitzen Public Utilities 0 130 19 4 153 Elk River Municipal Utilities 19 7,379 773 135 8,306 Ely Water & Light Dept 0 1,750 398 0 2,148 Gilbert Water & Light 0 909 79 0 988 Grand Rapids Pub Utilities 0 5,245 1,475 1 6,721 Grove City Electric Dept 22 337 64 0 423 Harmony Electric Dept 0 561 155 9 725 Hibbing Public Utilities 0 6,161 879 14 7,054 Hutchinson Utilities 0 5,938 803 119 6,860 Kandiyohi Municipal Utilities* 0 265 35 0 300 Kasota Electric Light 0 335 0 0 335 Keewatin Public Utilities*** 0 547 11 0 558 Lanesboro Pub Utilities 0 453 154 0 607 Mabel City of 0 384 92 0 476 Melrose Public Utilities 54 1,285 245 2 1,586 Moose Lake Water & Light 0 745 268 2 1,015 Mountain Iron Water & Light 0 1,110 108 6 1,224 Nashwauk Pub Utilities 0 465 60 0 525 Newfolden Electric 0 167 31 0 198 Nielsville Vlg Light System 0 50 7 0 57 Peterson Public Utilities 0 115 0 0 115 Pierz Utilities* 0 556 102 0 658
31
Number of Minnesota Electric Customers for Municipal Utilities, Continued
2005 Farm Non-Farm Residential Commercial Industrial Total
Other Municipals (continued)
Proctor Pub Utilities 0 1,238 88 1 1,327 Randall City of 0 254 46 2 302 Round Lake Electric Dept 0 188 33 2 223 Rushford City Of 0 831 114 17 962 Rushmore City of 0 14 164 0 178 Shelly Municipal Light Dept.^ 0 120 33 0 153 Spring Grove Municipal Electric 5 629 140 3 777 St Charles Light & Water 0 1,512 193 12 1,717 Two Harbors Water & Light 0 1,665 201 42 1,908 Virginia Pub Utilities 0 4,292 949 0 5,241 Whalan City of 0 47 8 0 55 Willmar Municipal Utilities 0 7,866 1,197 31 9,094 Total: Other Municipals 146 73,610 12,449 622 86,820
Southern Minnesota Municipal Power Agency
Austin Utilities 658 9,873 1,923 1 12,455 Blooming Prairie Utilities 0 840 193 0 1,033 Fairmont Pub Utilities 224 4,933 821 15 5,993 Grand Marais Utilities 0 886 318 0 1,204 Lake City Utility Board 34 2,573 397 6 3,010 Litchfield Pub Utilities 16 2,771 432 6 3,225 Mora Mun Electric Utility 0 1,635 230 31 1,896 New Prague Mun Utilities*** 0 2,068 244 1 2,313 North Branch Mun Water & Light 0 1,669 232 8 1,909 Owatonna Public Utilities 0 10,037 994 59 11,090 Preston Public Utilities 4 675 150 11 840 Princeton Pub Utilities 0 2,125 279 28 2,432 Redwood Falls Pub Utilities 0 2,308 516 57 2,881 Rochester Pub Utilities 0 41,179 4,405 2 45,586 Spring Valley Pub Utility 0 1,285 198 0 1,483 St Peter Municipal Utilities 0 3,624 416 3 4,043 Waseca Utility 0 3,582 492 0 4,074 Wells Public Utilities 0 1,127 195 0 1,322 Total: SMMPA 936 93,190 12,435 228 106,789
Total: Municipal Utilities 1,430 299,890 46,428 3,014 350,755
Total: Minnesota 165,754 2,060,519 253,807 7,634 2,481,909 Notes for Table 5
* 2005 data not submitted. Data is from 2004.
** Data is from 2002.
*** Data is from 2003.
^ Data is from 2001.
32
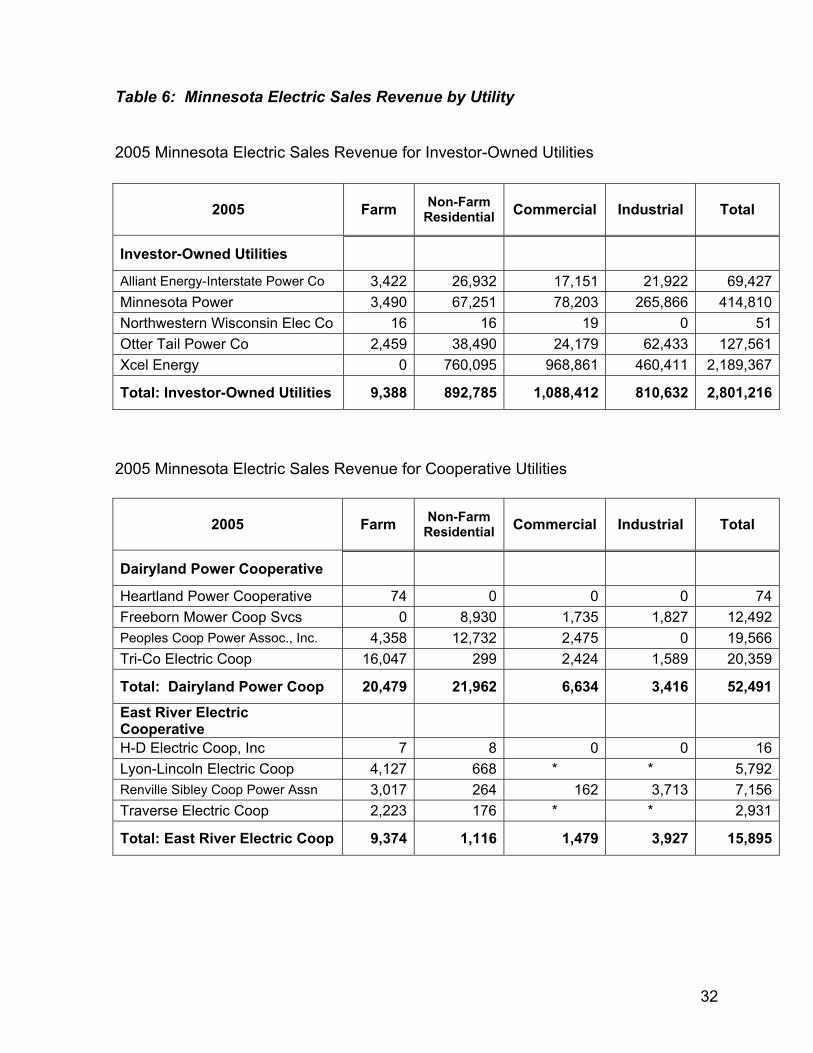
Table 6: Minnesota Electric Sales Revenue by Utility
2005 Minnesota Electric Sales Revenue for Investor-Owned Utilities
2005 Farm Non-Farm Residential Commercial Industrial Total
Investor-Owned Utilities
Alliant Energy-Interstate Power Co 3,422 26,932 17,151 21,922 69,427 Minnesota Power 3,490 67,251 78,203 265,866 414,810 Northwestern Wisconsin Elec Co 16 16 19 0 51 Otter Tail Power Co 2,459 38,490 24,179 62,433 127,561 Xcel Energy 0 760,095 968,861 460,411 2,189,367
Total: Investor-Owned Utilities 9,388 892,785 1,088,412 810,632 2,801,216
2005 Minnesota Electric Sales Revenue for Cooperative Utilities
2005 Farm Non-Farm Residential Commercial Industrial Total
Dairyland Power Cooperative
Heartland Power Cooperative 74 0 0 0 74 Freeborn Mower Coop Svcs 0 8,930 1,735 1,827 12,492 Peoples Coop Power Assoc., Inc. 4,358 12,732 2,475 0 19,566 Tri-Co Electric Coop 16,047 299 2,424 1,589 20,359
Total: Dairyland Power Coop 20,479 21,962 6,634 3,416 52,491
East River Electric Cooperative
H-D Electric Coop, Inc 7 8 0 0 16 Lyon-Lincoln Electric Coop 4,127 668 * * 5,792 Renville Sibley Coop Power Assn 3,017 264 162 3,713 7,156 Traverse Electric Coop 2,223 176 * * 2,931
Total: East River Electric Coop 9,374 1,116 1,479 3,927 15,895
33
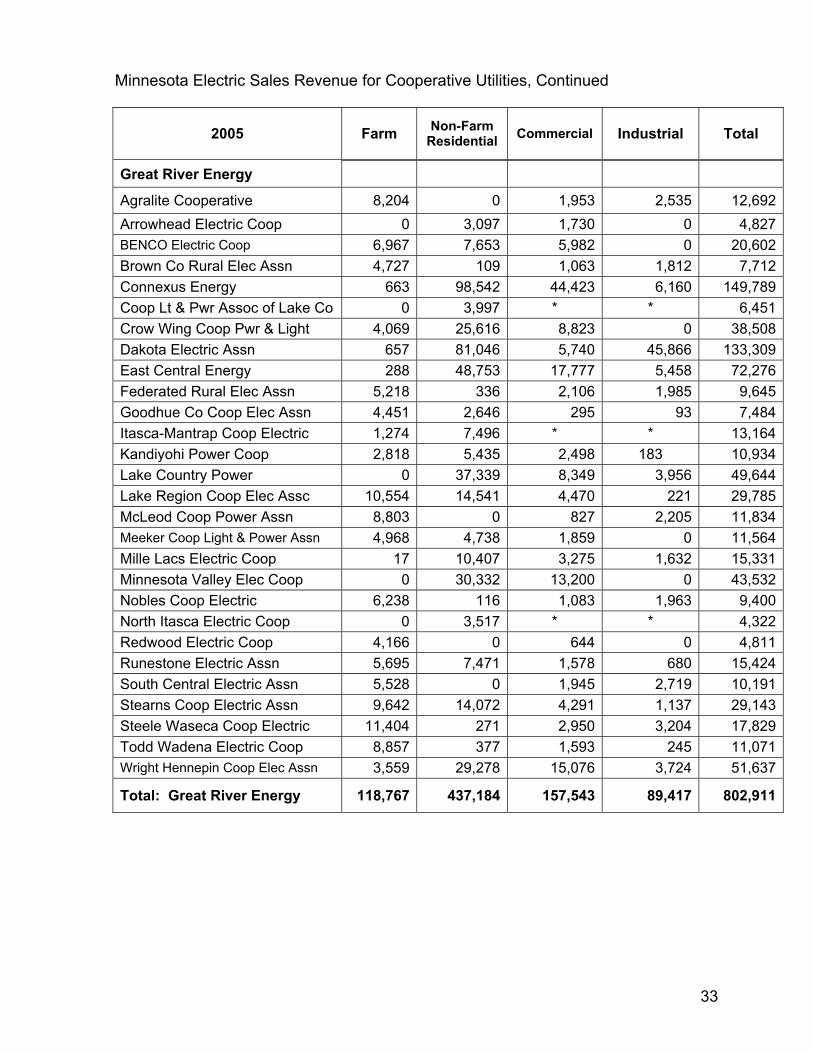
Minnesota Electric Sales Revenue for Cooperative Utilities, Continued
2005 Farm Non-Farm Residential Commercial Industrial Total
Great River Energy
Agralite Cooperative 8,204 0 1,953 2,535 12,692 Arrowhead Electric Coop 0 3,097 1,730 0 4,827 BENCO Electric Coop 6,967 7,653 5,982 0 20,602 Brown Co Rural Elec Assn 4,727 109 1,063 1,812 7,712 Connexus Energy 663 98,542 44,423 6,160 149,789 Coop Lt & Pwr Assoc of Lake Co 0 3,997 * * 6,451 Crow Wing Coop Pwr & Light 4,069 25,616 8,823 0 38,508 Dakota Electric Assn 657 81,046 5,740 45,866 133,309 East Central Energy 288 48,753 17,777 5,458 72,276 Federated Rural Elec Assn 5,218 336 2,106 1,985 9,645 Goodhue Co Coop Elec Assn 4,451 2,646 295 93 7,484 Itasca-Mantrap Coop Electric 1,274 7,496 * * 13,164 Kandiyohi Power Coop 2,818 5,435 2,498 183 10,934 Lake Country Power 0 37,339 8,349 3,956 49,644 Lake Region Coop Elec Assc 10,554 14,541 4,470 221 29,785 McLeod Coop Power Assn 8,803 0 827 2,205 11,834 Meeker Coop Light & Power Assn 4,968 4,738 1,859 0 11,564 Mille Lacs Electric Coop 17 10,407 3,275 1,632 15,331 Minnesota Valley Elec Coop 0 30,332 13,200 0 43,532 Nobles Coop Electric 6,238 116 1,083 1,963 9,400 North Itasca Electric Coop 0 3,517 * * 4,322 Redwood Electric Coop 4,166 0 644 0 4,811 Runestone Electric Assn 5,695 7,471 1,578 680 15,424 South Central Electric Assn 5,528 0 1,945 2,719 10,191 Stearns Coop Electric Assn 9,642 14,072 4,291 1,137 29,143 Steele Waseca Coop Electric 11,404 271 2,950 3,204 17,829 Todd Wadena Electric Coop 8,857 377 1,593 245 11,071 Wright Hennepin Coop Elec Assn 3,559 29,278 15,076 3,724 51,637
Total: Great River Energy 118,767 437,184 157,543 89,417 802,911
34
Minnesota Electric Sales Revenue for Cooperative Utilities, Continued
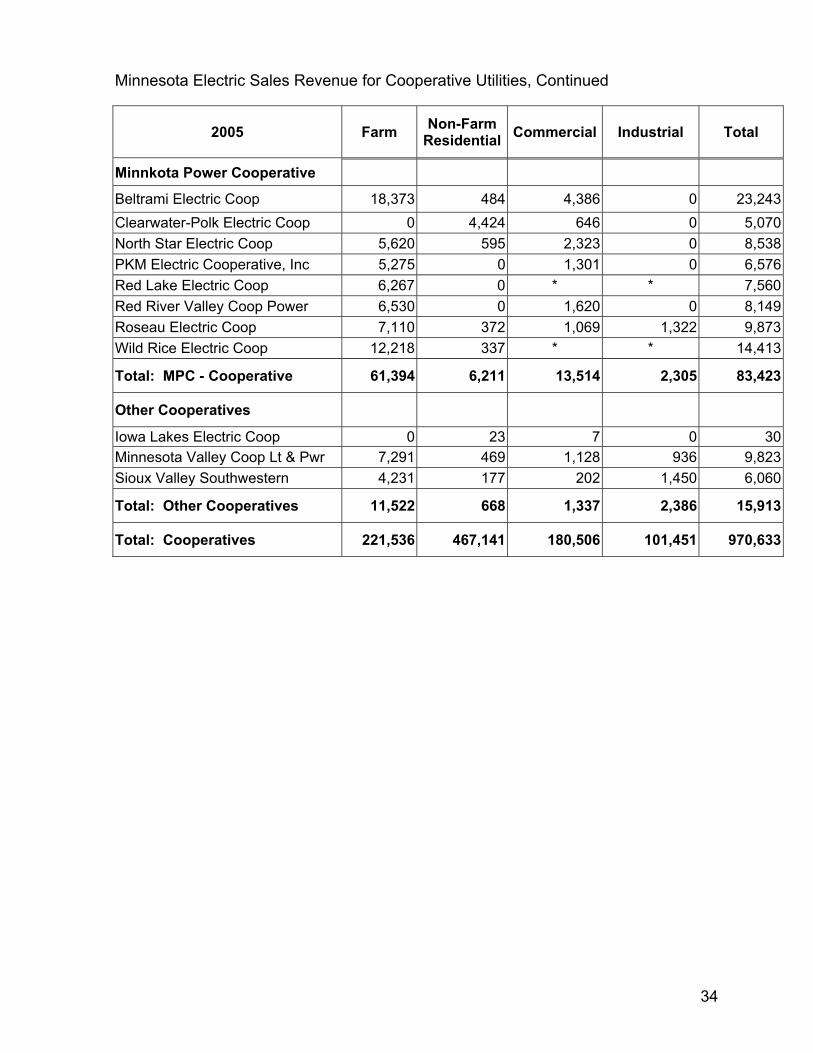
2005 Farm Non-Farm Residential Commercial Industrial Total
Minnkota Power Cooperative
Beltrami Electric Coop 18,373 484 4,386 0 23,243 Clearwater-Polk Electric Coop 0 4,424 646 0 5,070 North Star Electric Coop 5,620 595 2,323 0 8,538 PKM Electric Cooperative, Inc 5,275 0 1,301 0 6,576 Red Lake Electric Coop 6,267 0 * * 7,560 Red River Valley Coop Power 6,530 0 1,620 0 8,149 Roseau Electric Coop 7,110 372 1,069 1,322 9,873 Wild Rice Electric Coop 12,218 337 * * 14,413
Total: MPC - Cooperative 61,394 6,211 13,514 2,305 83,423
Other Cooperatives
Iowa Lakes Electric Coop 0 23 7 0 30 Minnesota Valley Coop Lt & Pwr 7,291 469 1,128 936 9,823 Sioux Valley Southwestern 4,231 177 202 1,450 6,060
Total: Other Cooperatives 11,522 668 1,337 2,386 15,913
Total: Cooperatives 221,536 467,141 180,506 101,451 970,633
35
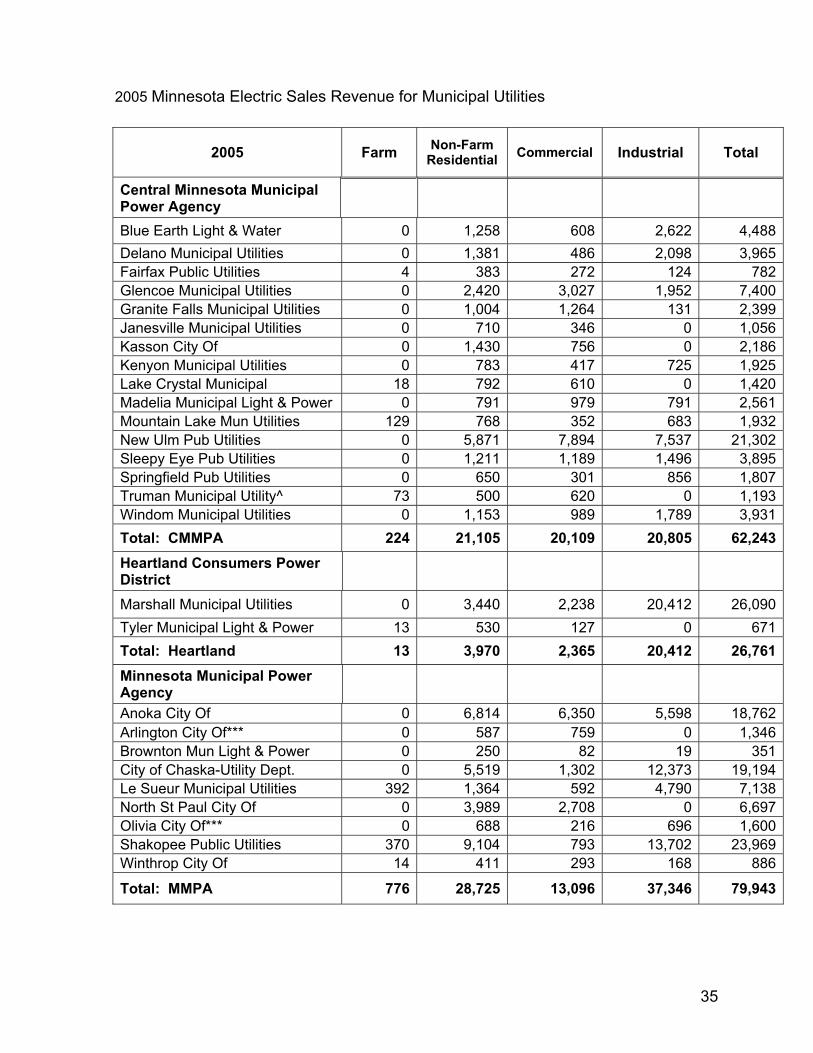
2005 Minnesota Electric Sales Revenue for Municipal Utilities
2005 Farm Non-Farm Residential Commercial Industrial Total
Central Minnesota Municipal Power Agency
Blue Earth Light & Water 0 1,258 608 2,622 4,488 Delano Municipal Utilities 0 1,381 486 2,098 3,965 Fairfax Public Utilities 4 383 272 124 782 Glencoe Municipal Utilities 0 2,420 3,027 1,952 7,400 Granite Falls Municipal Utilities 0 1,004 1,264 131 2,399 Janesville Municipal Utilities 0 710 346 0 1,056 Kasson City Of 0 1,430 756 0 2,186 Kenyon Municipal Utilities 0 783 417 725 1,925 Lake Crystal Municipal 18 792 610 0 1,420 Madelia Municipal Light & Power 0 791 979 791 2,561 Mountain Lake Mun Utilities 129 768 352 683 1,932 New Ulm Pub Utilities 0 5,871 7,894 7,537 21,302 Sleepy Eye Pub Utilities 0 1,211 1,189 1,496 3,895 Springfield Pub Utilities 0 650 301 856 1,807 Truman Municipal Utility^ 73 500 620 0 1,193 Windom Municipal Utilities 0 1,153 989 1,789 3,931 Total: CMMPA 224 21,105 20,109 20,805 62,243 Heartland Consumers Power District
Marshall Municipal Utilities 0 3,440 2,238 20,412 26,090 Tyler Municipal Light & Power 13 530 127 0 671 Total: Heartland 13 3,970 2,365 20,412 26,761 Minnesota Municipal Power Agency
Anoka City Of 0 6,814 6,350 5,598 18,762 Arlington City Of*** 0 587 759 0 1,346 Brownton Mun Light & Power 0 250 82 19 351 City of Chaska-Utility Dept. 0 5,519 1,302 12,373 19,194 Le Sueur Municipal Utilities 392 1,364 592 4,790 7,138 North St Paul City Of 0 3,989 2,708 0 6,697 Olivia City Of*** 0 688 216 696 1,600 Shakopee Public Utilities 370 9,104 793 13,702 23,969 Winthrop City Of 14 411 293 168 886
Total: MMPA 776 28,725 13,096 37,346 79,943
36
Minnesota Electric Sales Revenue for Municipal Utilities, Continued
2005 Farm Non-Farm Residential Commercial Industrial Total
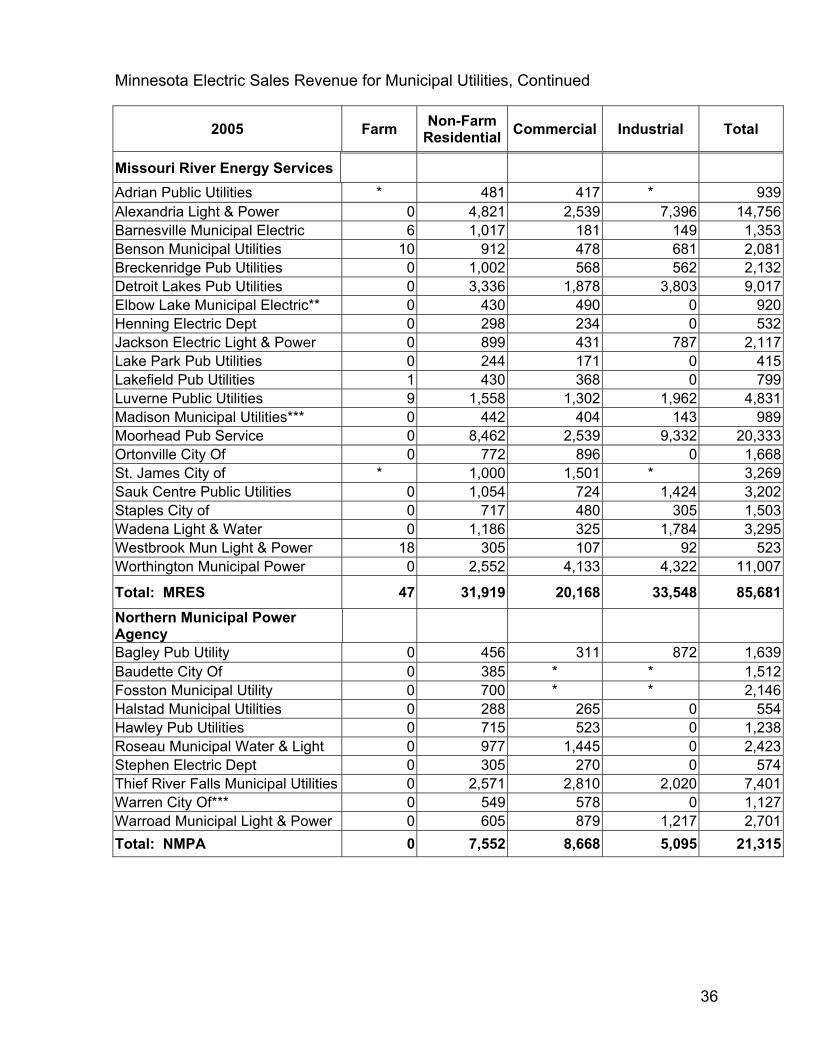
Missouri River Energy Services Adrian Public Utilities * 481 417 * 939 Alexandria Light & Power 0 4,821 2,539 7,396 14,756 Barnesville Municipal Electric 6 1,017 181 149 1,353 Benson Municipal Utilities 10 912 478 681 2,081 Breckenridge Pub Utilities 0 1,002 568 562 2,132 Detroit Lakes Pub Utilities 0 3,336 1,878 3,803 9,017 Elbow Lake Municipal Electric** 0 430 490 0 920 Henning Electric Dept 0 298 234 0 532 Jackson Electric Light & Power 0 899 431 787 2,117 Lake Park Pub Utilities 0 244 171 0 415 Lakefield Pub Utilities 1 430 368 0 799 Luverne Public Utilities 9 1,558 1,302 1,962 4,831 Madison Municipal Utilities*** 0 442 404 143 989 Moorhead Pub Service 0 8,462 2,539 9,332 20,333 Ortonville City Of 0 772 896 0 1,668 St. James City of * 1,000 1,501 * 3,269 Sauk Centre Public Utilities 0 1,054 724 1,424 3,202 Staples City of 0 717 480 305 1,503 Wadena Light & Water 0 1,186 325 1,784 3,295 Westbrook Mun Light & Power 18 305 107 92 523 Worthington Municipal Power 0 2,552 4,133 4,322 11,007
Total: MRES 47 31,919 20,168 33,548 85,681 Northern Municipal Power Agency
Bagley Pub Utility 0 456 311 872 1,639 Baudette City Of 0 385 * * 1,512 Fosston Municipal Utility 0 700 * * 2,146 Halstad Municipal Utilities 0 288 265 0 554 Hawley Pub Utilities 0 715 523 0 1,238 Roseau Municipal Water & Light 0 977 1,445 0 2,423 Stephen Electric Dept 0 305 270 0 574 Thief River Falls Municipal Utilities 0 2,571 2,810 2,020 7,401 Warren City Of*** 0 549 578 0 1,127 Warroad Municipal Light & Power 0 605 879 1,217 2,701 Total: NMPA 0 7,552 8,668 5,095 21,315
37
Minnesota Electric Sales Revenue for Municipal Utilities, Continued
2005 Farm Non-Farm Residential Commercial Industrial Total
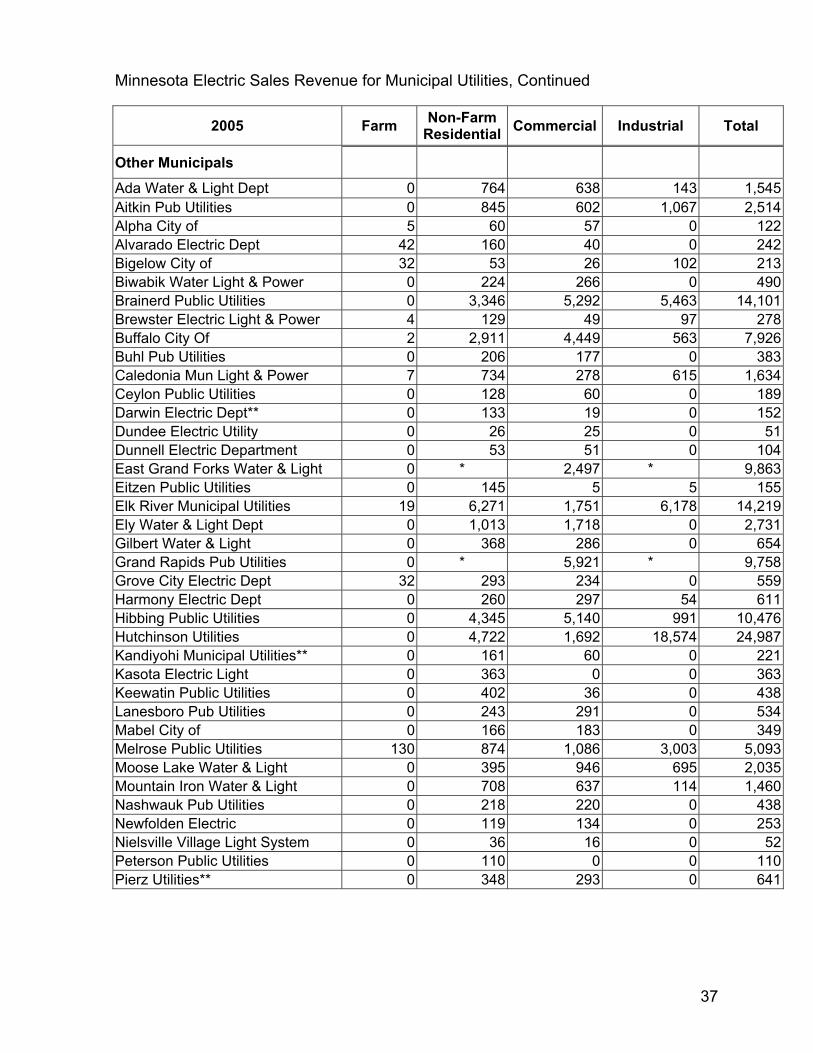
Other Municipals
Ada Water & Light Dept 0 764 638 143 1,545 Aitkin Pub Utilities 0 845 602 1,067 2,514 Alpha City of 5 60 57 0 122 Alvarado Electric Dept 42 160 40 0 242 Bigelow City of 32 53 26 102 213 Biwabik Water Light & Power 0 224 266 0 490 Brainerd Public Utilities 0 3,346 5,292 5,463 14,101 Brewster Electric Light & Power 4 129 49 97 278 Buffalo City Of 2 2,911 4,449 563 7,926 Buhl Pub Utilities 0 206 177 0 383 Caledonia Mun Light & Power 7 734 278 615 1,634 Ceylon Public Utilities 0 128 60 0 189 Darwin Electric Dept** 0 133 19 0 152 Dundee Electric Utility 0 26 25 0 51 Dunnell Electric Department 0 53 51 0 104 East Grand Forks Water & Light 0 * 2,497 * 9,863 Eitzen Public Utilities 0 145 5 5 155 Elk River Municipal Utilities 19 6,271 1,751 6,178 14,219 Ely Water & Light Dept 0 1,013 1,718 0 2,731 Gilbert Water & Light 0 368 286 0 654 Grand Rapids Pub Utilities 0 * 5,921 * 9,758 Grove City Electric Dept 32 293 234 0 559 Harmony Electric Dept 0 260 297 54 611 Hibbing Public Utilities 0 4,345 5,140 991 10,476 Hutchinson Utilities 0 4,722 1,692 18,574 24,987 Kandiyohi Municipal Utilities** 0 161 60 0 221 Kasota Electric Light 0 363 0 0 363 Keewatin Public Utilities 0 402 36 0 438 Lanesboro Pub Utilities 0 243 291 0 534 Mabel City of 0 166 183 0 349 Melrose Public Utilities 130 874 1,086 3,003 5,093 Moose Lake Water & Light 0 395 946 695 2,035 Mountain Iron Water & Light 0 708 637 114 1,460 Nashwauk Pub Utilities 0 218 220 0 438 Newfolden Electric 0 119 134 0 253 Nielsville Village Light System 0 36 16 0 52 Peterson Public Utilities 0 110 0 0 110 Pierz Utilities** 0 348 293 0 641
38
Minnesota Electric Sales Revenue for Municipal Utilities, Continued
2005 Farm Non-Farm Residential Commercial Industrial Total
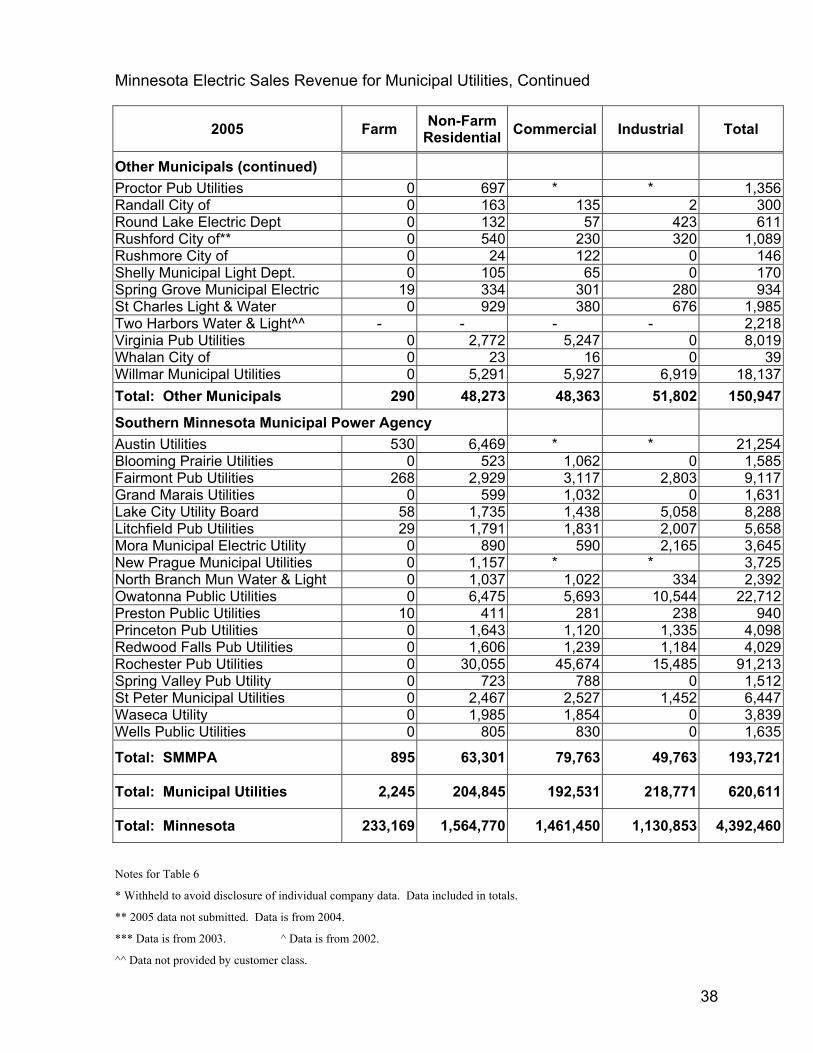
Other Municipals (continued) Proctor Pub Utilities 0 697 * * 1,356 Randall City of 0 163 135 2 300 Round Lake Electric Dept 0 132 57 423 611 Rushford City of** 0 540 230 320 1,089 Rushmore City of 0 24 122 0 146 Shelly Municipal Light Dept. 0 105 65 0 170 Spring Grove Municipal Electric 19 334 301 280 934 St Charles Light & Water 0 929 380 676 1,985 Two Harbors Water & Light^^ - - - - 2,218 Virginia Pub Utilities 0 2,772 5,247 0 8,019 Whalan City of 0 23 16 0 39 Willmar Municipal Utilities 0 5,291 5,927 6,919 18,137 Total: Other Municipals 290 48,273 48,363 51,802 150,947
Southern Minnesota Municipal Power Agency Austin Utilities 530 6,469 * * 21,254 Blooming Prairie Utilities 0 523 1,062 0 1,585 Fairmont Pub Utilities 268 2,929 3,117 2,803 9,117 Grand Marais Utilities 0 599 1,032 0 1,631 Lake City Utility Board 58 1,735 1,438 5,058 8,288 Litchfield Pub Utilities 29 1,791 1,831 2,007 5,658 Mora Municipal Electric Utility 0 890 590 2,165 3,645 New Prague Municipal Utilities 0 1,157 * * 3,725 North Branch Mun Water & Light 0 1,037 1,022 334 2,392 Owatonna Public Utilities 0 6,475 5,693 10,544 22,712 Preston Public Utilities 10 411 281 238 940 Princeton Pub Utilities 0 1,643 1,120 1,335 4,098 Redwood Falls Pub Utilities 0 1,606 1,239 1,184 4,029 Rochester Pub Utilities 0 30,055 45,674 15,485 91,213 Spring Valley Pub Utility 0 723 788 0 1,512 St Peter Municipal Utilities 0 2,467 2,527 1,452 6,447 Waseca Utility 0 1,985 1,854 0 3,839 Wells Public Utilities 0 805 830 0 1,635
Total: SMMPA 895 63,301 79,763 49,763 193,721
Total: Municipal Utilities 2,245 204,845 192,531 218,771 620,611
Total: Minnesota 233,169 1,564,770 1,461,450 1,130,853 4,392,460 Notes for Table 6
* Withheld to avoid disclosure of individual company data. Data included in totals.
** 2005 data not submitted. Data is from 2004.
*** Data is from 2003. ^ Data is from 2002.
^^ Data not provided by customer class.
39
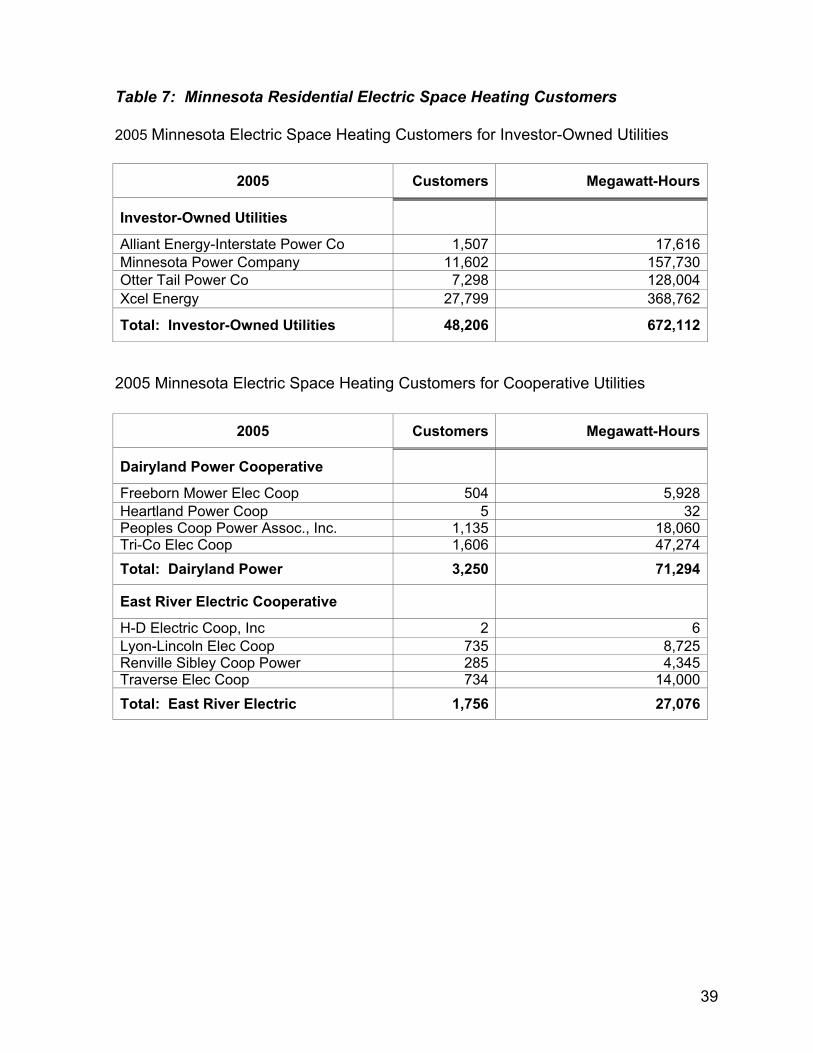
Table 7: Minnesota Residential Electric Space Heating Customers
2005 Minnesota Electric Space Heating Customers for Investor-Owned Utilities
2005 Customers Megawatt-Hours
Investor-Owned Utilities
Alliant Energy-Interstate Power Co 1,507 17,616 Minnesota Power Company 11,602 157,730 Otter Tail Power Co 7,298 128,004 Xcel Energy 27,799 368,762
Total: Investor-Owned Utilities 48,206 672,112
2005 Minnesota Electric Space Heating Customers for Cooperative Utilities
2005 Customers Megawatt-Hours
Dairyland Power Cooperative
Freeborn Mower Elec Coop 504 5,928 Heartland Power Coop 5 32 Peoples Coop Power Assoc., Inc. 1,135 18,060 Tri-Co Elec Coop 1,606 47,274 Total: Dairyland Power 3,250 71,294
East River Electric Cooperative
H-D Electric Coop, Inc 2 6Lyon-Lincoln Elec Coop 735 8,725Renville Sibley Coop Power 285 4,345Traverse Elec Coop 734 14,000Total: East River Electric 1,756 27,076
40
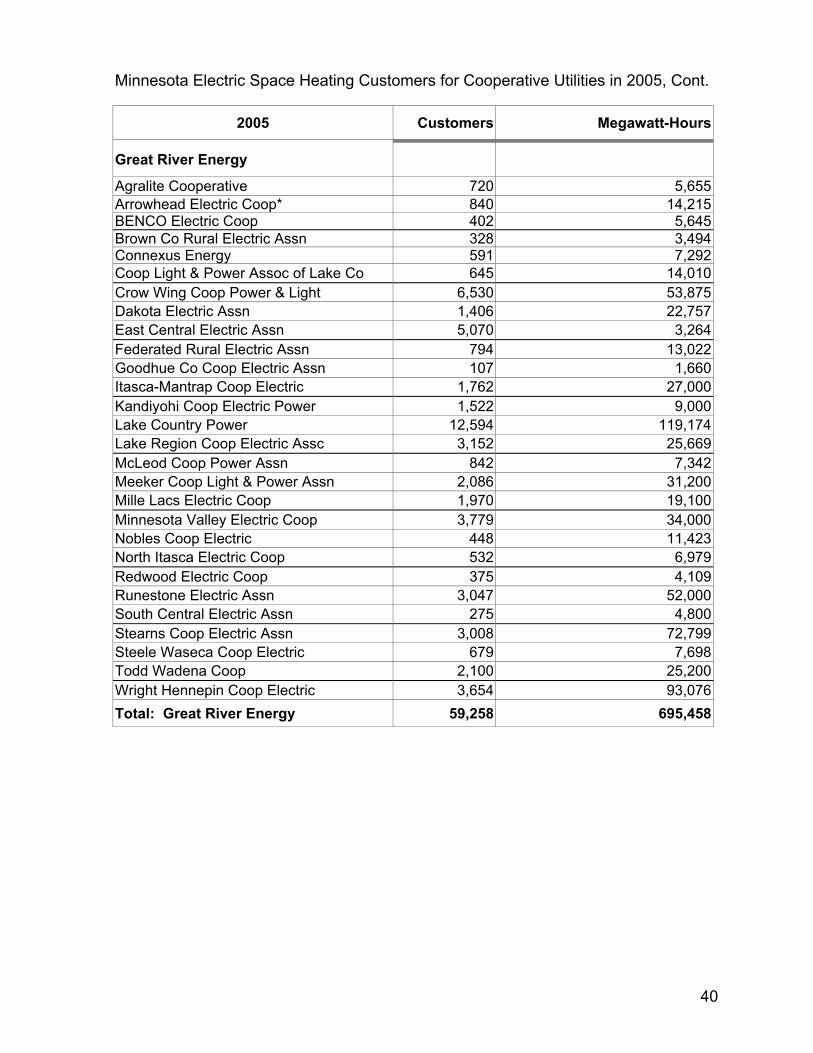
Minnesota Electric Space Heating Customers for Cooperative Utilities in 2005, Cont.
2005 Customers Megawatt-Hours
Great River Energy
Agralite Cooperative 720 5,655 Arrowhead Electric Coop* 840 14,215 BENCO Electric Coop 402 5,645 Brown Co Rural Electric Assn 328 3,494 Connexus Energy 591 7,292 Coop Light & Power Assoc of Lake Co 645 14,010 Crow Wing Coop Power & Light 6,530 53,875 Dakota Electric Assn 1,406 22,757 East Central Electric Assn 5,070 3,264 Federated Rural Electric Assn 794 13,022 Goodhue Co Coop Electric Assn 107 1,660 Itasca-Mantrap Coop Electric 1,762 27,000 Kandiyohi Coop Electric Power 1,522 9,000 Lake Country Power 12,594 119,174 Lake Region Coop Electric Assc 3,152 25,669 McLeod Coop Power Assn 842 7,342 Meeker Coop Light & Power Assn 2,086 31,200 Mille Lacs Electric Coop 1,970 19,100 Minnesota Valley Electric Coop 3,779 34,000 Nobles Coop Electric 448 11,423 North Itasca Electric Coop 532 6,979 Redwood Electric Coop 375 4,109 Runestone Electric Assn 3,047 52,000 South Central Electric Assn 275 4,800 Stearns Coop Electric Assn 3,008 72,799 Steele Waseca Coop Electric 679 7,698 Todd Wadena Coop 2,100 25,200 Wright Hennepin Coop Electric 3,654 93,076 Total: Great River Energy 59,258 695,458
41
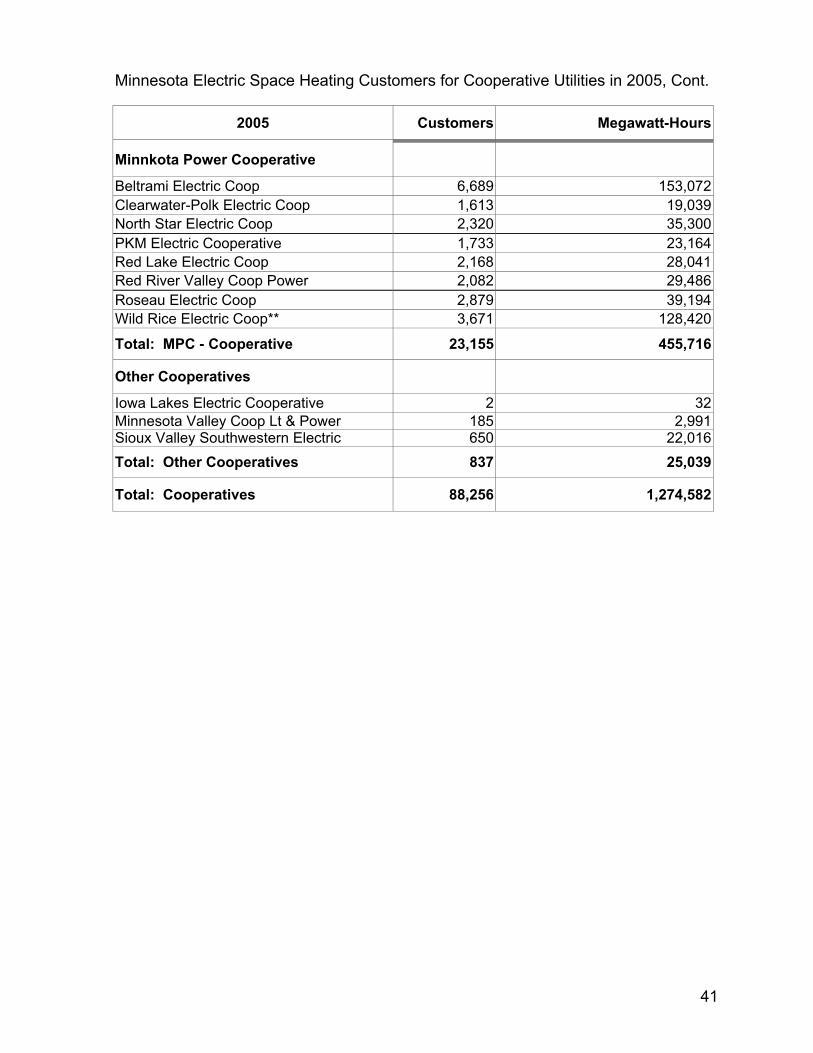
Minnesota Electric Space Heating Customers for Cooperative Utilities in 2005, Cont.
2005 Customers Megawatt-Hours
Minnkota Power Cooperative
Beltrami Electric Coop 6,689 153,072 Clearwater-Polk Electric Coop 1,613 19,039 North Star Electric Coop 2,320 35,300 PKM Electric Cooperative 1,733 23,164 Red Lake Electric Coop 2,168 28,041 Red River Valley Coop Power 2,082 29,486 Roseau Electric Coop 2,879 39,194 Wild Rice Electric Coop** 3,671 128,420
Total: MPC - Cooperative 23,155 455,716
Other Cooperatives
Iowa Lakes Electric Cooperative 2 32 Minnesota Valley Coop Lt & Power 185 2,991 Sioux Valley Southwestern Electric 650 22,016 Total: Other Cooperatives 837 25,039
Total: Cooperatives 88,256 1,274,582
42
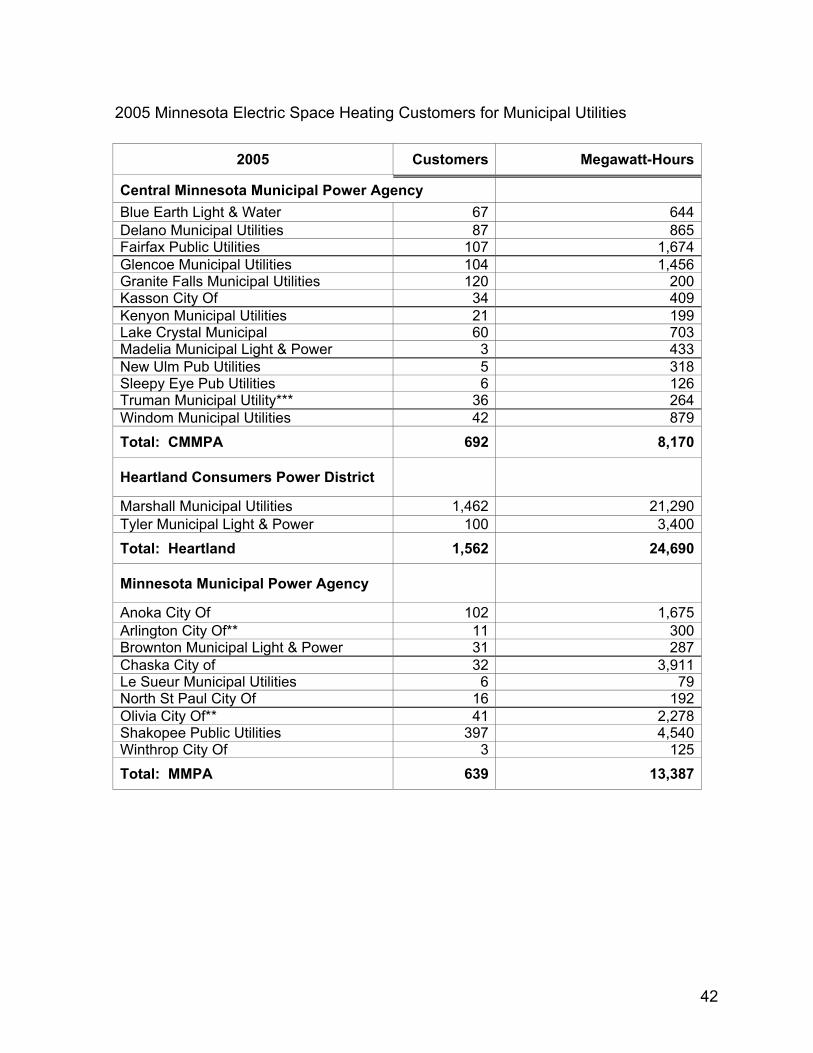
2005 Minnesota Electric Space Heating Customers for Municipal Utilities
2005 Customers Megawatt-Hours
Central Minnesota Municipal Power Agency Blue Earth Light & Water 67 644 Delano Municipal Utilities 87 865 Fairfax Public Utilities 107 1,674 Glencoe Municipal Utilities 104 1,456 Granite Falls Municipal Utilities 120 200 Kasson City Of 34 409 Kenyon Municipal Utilities 21 199 Lake Crystal Municipal 60 703 Madelia Municipal Light & Power 3 433 New Ulm Pub Utilities 5 318 Sleepy Eye Pub Utilities 6 126 Truman Municipal Utility*** 36 264 Windom Municipal Utilities 42 879 Total: CMMPA 692 8,170
Heartland Consumers Power District
Marshall Municipal Utilities 1,462 21,290 Tyler Municipal Light & Power 100 3,400 Total: Heartland 1,562 24,690
Minnesota Municipal Power Agency
Anoka City Of 102 1,675 Arlington City Of** 11 300 Brownton Municipal Light & Power 31 287 Chaska City of 32 3,911 Le Sueur Municipal Utilities 6 79 North St Paul City Of 16 192 Olivia City Of** 41 2,278 Shakopee Public Utilities 397 4,540 Winthrop City Of 3 125 Total: MMPA 639 13,387
43
Minnesota Electric Space Heating Customers for Municipal Utilities in 2005, Cont.
2005 Customers Megawatt-Hours
Missouri River Energy Services Adrian Public Utilities 63 1,824 Alexandria Pub Works 1,161 16,200 Barnesville Municipal Electric 299 5,748 Benson Municipal Utilities 105 839 Breckenridge Pub Utilities 373 7,070 Detroit Lakes Pub Utilities 1,031 18,186 Elbow Lake Municipal Electric* 119 2,000 Henning Electric Dept 84 1,326 Jackson Electric Light & Power 202 1,805 Lake Park Pub Utilities 33 200 Lakefield Pub Utilities 43 562 Luverne Municipal Utilities 234 3,364 Madison Municipal Utilities 207 1,743 Moorhead Pub Service 718 9,417 Ortonville City Of 165 1,810 St. James City of 205 2,577 Sauk Centre Water Light & Power 232 3,116 Staples City of 38 296 Wadena Light & Water 335 6,161 Worthington Municipal Power 49 653 Total: MRES 5,696 84,897
Northern Municipal Power Agency
Bagley Pub Utility 222 3,299 Baudette City Of 110 1,307 Fosston Municipal Utility 320 4,425 Halstad Municipal Utilities 708 11,407 Hawley Pub Utilities 160 1,408 Roseau Municipal Water & Light 334 10,238 Stephen Electric Dept 81 1,993 Thief River Falls Municipal Utilities 587 6,526 Warren City Of** 115 2,140 Warroad Municipal Light & Power 146 1,701 Total: NMPA 2,783 44,444
44
Minnesota Electric Space Heating Customers for Municipal Utilities in 2005, Cont.
2005 Customers Megawatt-Hours
Other Municipals
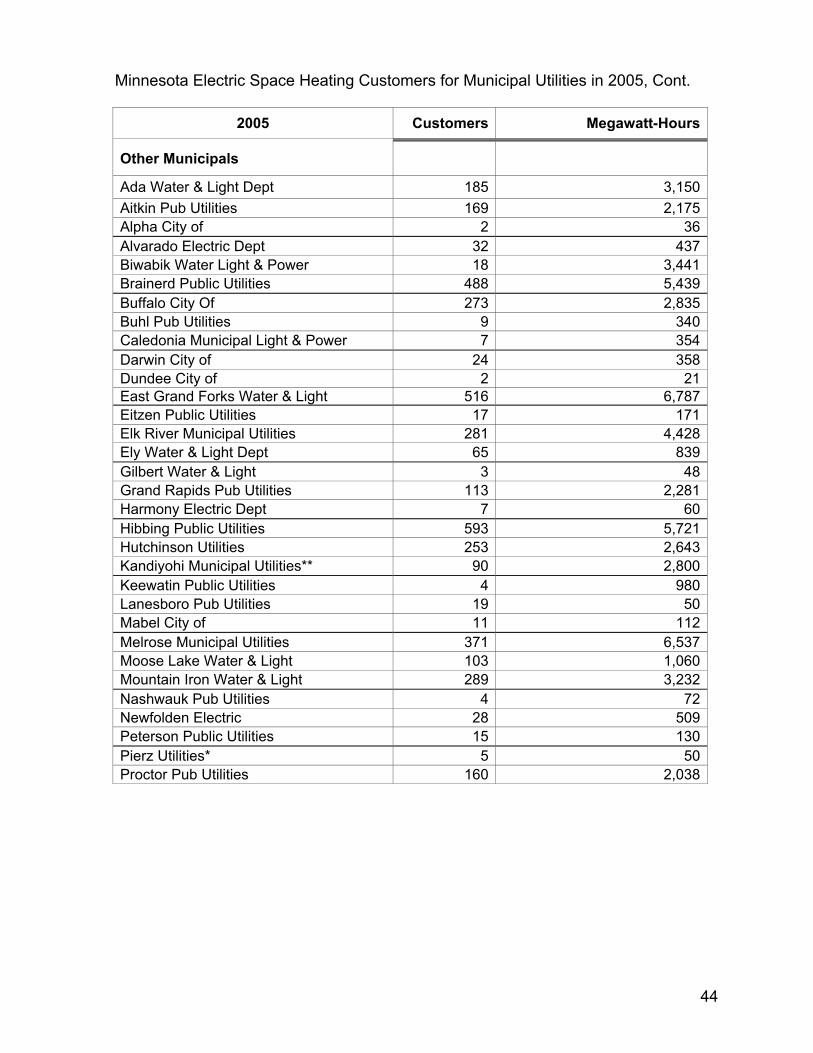
Ada Water & Light Dept 185 3,150 Aitkin Pub Utilities 169 2,175 Alpha City of 2 36 Alvarado Electric Dept 32 437 Biwabik Water Light & Power 18 3,441 Brainerd Public Utilities 488 5,439 Buffalo City Of 273 2,835 Buhl Pub Utilities 9 340 Caledonia Municipal Light & Power 7 354 Darwin City of 24 358 Dundee City of 2 21 East Grand Forks Water & Light 516 6,787 Eitzen Public Utilities 17 171 Elk River Municipal Utilities 281 4,428 Ely Water & Light Dept 65 839 Gilbert Water & Light 3 48 Grand Rapids Pub Utilities 113 2,281 Harmony Electric Dept 7 60 Hibbing Public Utilities 593 5,721 Hutchinson Utilities 253 2,643 Kandiyohi Municipal Utilities** 90 2,800 Keewatin Public Utilities 4 980 Lanesboro Pub Utilities 19 50 Mabel City of 11 112 Melrose Municipal Utilities 371 6,537 Moose Lake Water & Light 103 1,060 Mountain Iron Water & Light 289 3,232 Nashwauk Pub Utilities 4 72 Newfolden Electric 28 509 Peterson Public Utilities 15 130 Pierz Utilities* 5 50 Proctor Pub Utilities 160 2,038
45
Minnesota Electric Space Heating Customers for Municipal Utilities in 2005, Cont.
2005 Customers Megawatt-Hours
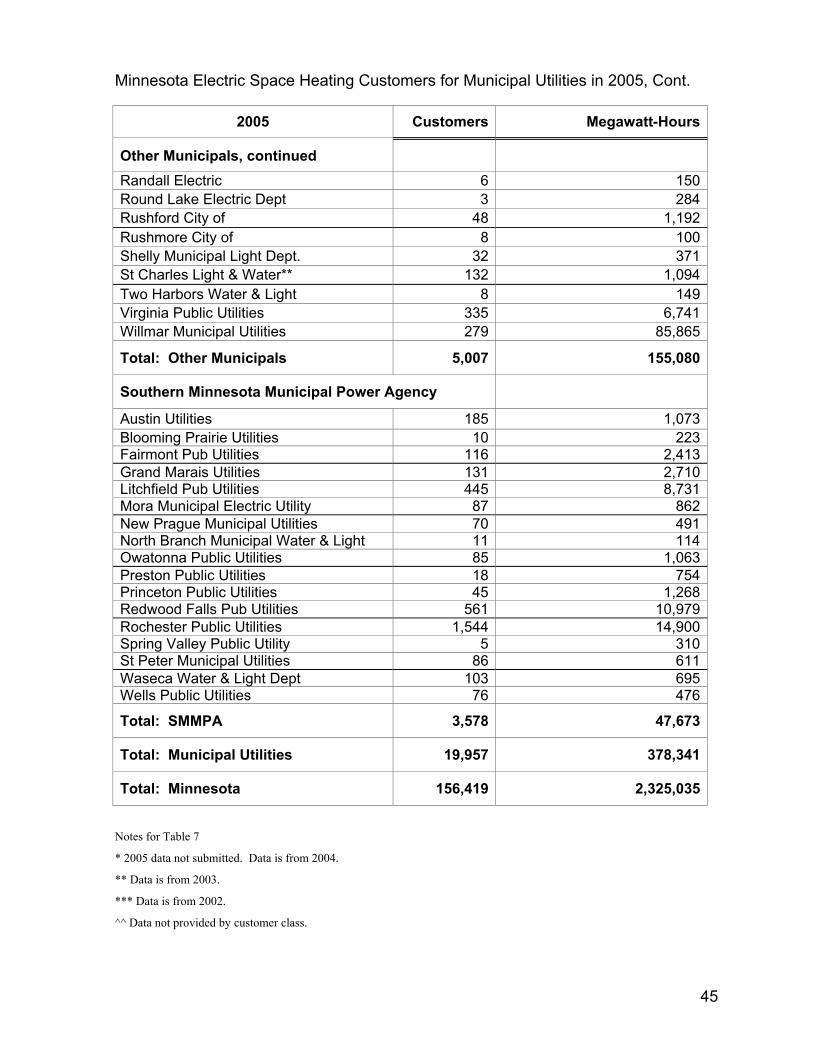
Other Municipals, continued Randall Electric 6 150 Round Lake Electric Dept 3 284 Rushford City of 48 1,192 Rushmore City of 8 100 Shelly Municipal Light Dept. 32 371 St Charles Light & Water** 132 1,094 Two Harbors Water & Light 8 149 Virginia Public Utilities 335 6,741 Willmar Municipal Utilities 279 85,865
Total: Other Municipals 5,007 155,080
Southern Minnesota Municipal Power Agency
Austin Utilities 185 1,073 Blooming Prairie Utilities 10 223 Fairmont Pub Utilities 116 2,413 Grand Marais Utilities 131 2,710 Litchfield Pub Utilities 445 8,731 Mora Municipal Electric Utility 87 862 New Prague Municipal Utilities 70 491 North Branch Municipal Water & Light 11 114 Owatonna Public Utilities 85 1,063 Preston Public Utilities 18 754 Princeton Public Utilities 45 1,268 Redwood Falls Pub Utilities 561 10,979 Rochester Public Utilities 1,544 14,900 Spring Valley Public Utility 5 310 St Peter Municipal Utilities 86 611 Waseca Water & Light Dept 103 695 Wells Public Utilities 76 476
Total: SMMPA 3,578 47,673
Total: Municipal Utilities 19,957 378,341
Total: Minnesota 156,419 2,325,035 Notes for Table 7
* 2005 data not submitted. Data is from 2004.
** Data is from 2003.
*** Data is from 2002.
^^ Data not provided by customer class.
46
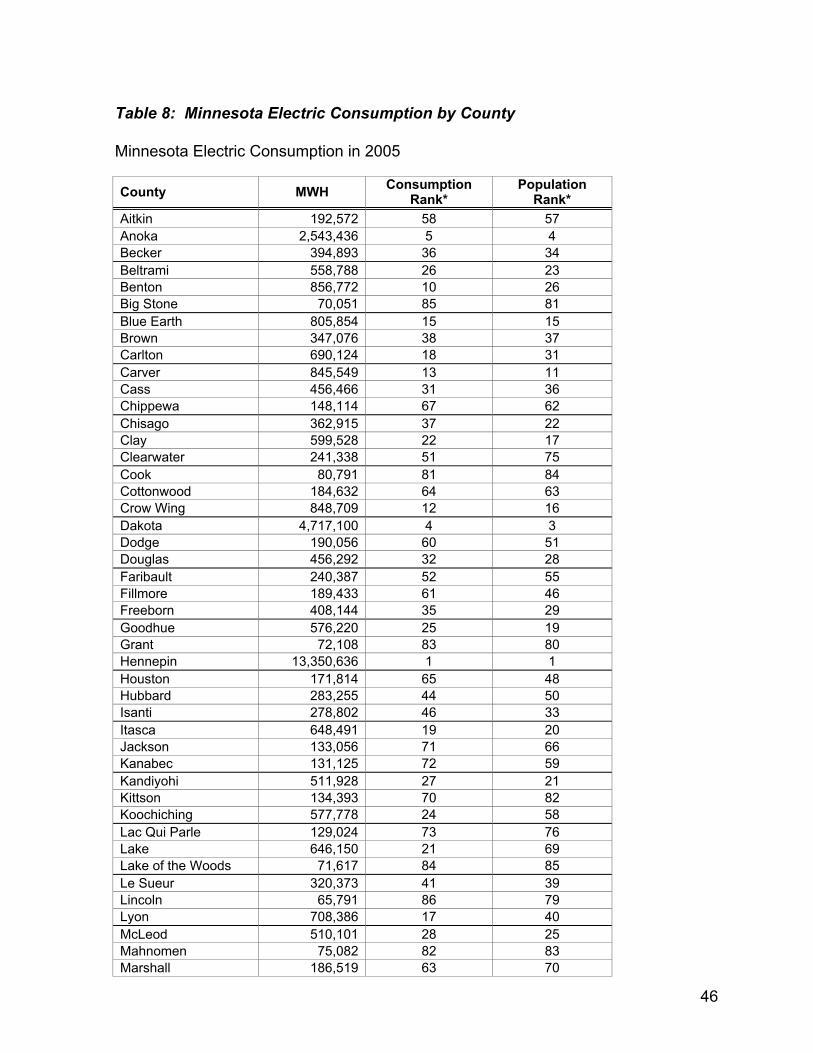
Table 8: Minnesota Electric Consumption by County Minnesota Electric Consumption in 2005 County MWH Consumption
Rank* Population
Rank* Aitkin 192,572 58 57 Anoka 2,543,436 5 4 Becker 394,893 36 34 Beltrami 558,788 26 23 Benton 856,772 10 26 Big Stone 70,051 85 81 Blue Earth 805,854 15 15 Brown 347,076 38 37 Carlton 690,124 18 31 Carver 845,549 13 11 Cass 456,466 31 36 Chippewa 148,114 67 62 Chisago 362,915 37 22 Clay 599,528 22 17 Clearwater 241,338 51 75 Cook 80,791 81 84 Cottonwood 184,632 64 63 Crow Wing 848,709 12 16 Dakota 4,717,100 4 3 Dodge 190,056 60 51 Douglas 456,292 32 28 Faribault 240,387 52 55 Fillmore 189,433 61 46 Freeborn 408,144 35 29 Goodhue 576,220 25 19 Grant 72,108 83 80 Hennepin 13,350,636 1 1 Houston 171,814 65 48 Hubbard 283,255 44 50 Isanti 278,802 46 33 Itasca 648,491 19 20 Jackson 133,056 71 66 Kanabec 131,125 72 59 Kandiyohi 511,928 27 21 Kittson 134,393 70 82 Koochiching 577,778 24 58 Lac Qui Parle 129,024 73 76 Lake 646,150 21 69 Lake of the Woods 71,617 84 85 Le Sueur 320,373 41 39 Lincoln 65,791 86 79 Lyon 708,386 17 40 McLeod 510,101 28 25 Mahnomen 75,082 82 83 Marshall 186,519 63 70
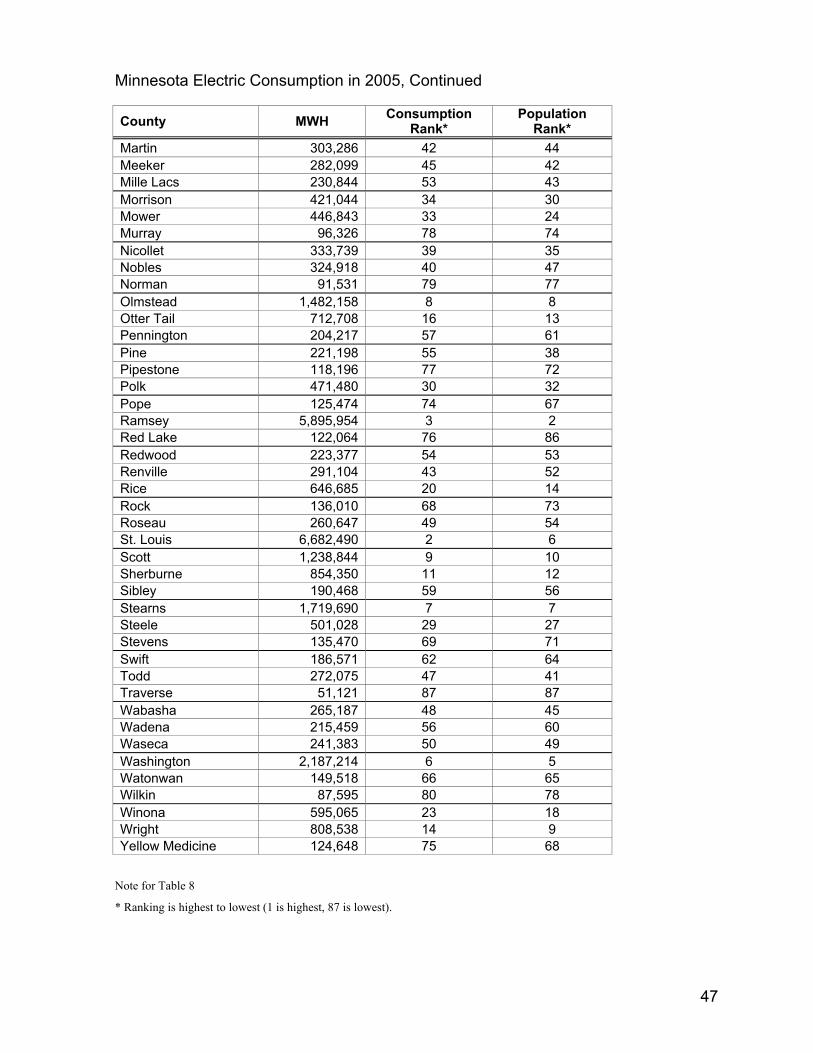
47
Minnesota Electric Consumption in 2005, Continued County MWH Consumption
Rank* Population
Rank* Martin 303,286 42 44 Meeker 282,099 45 42 Mille Lacs 230,844 53 43 Morrison 421,044 34 30 Mower 446,843 33 24 Murray 96,326 78 74 Nicollet 333,739 39 35 Nobles 324,918 40 47 Norman 91,531 79 77 Olmstead 1,482,158 8 8 Otter Tail 712,708 16 13 Pennington 204,217 57 61 Pine 221,198 55 38 Pipestone 118,196 77 72 Polk 471,480 30 32 Pope 125,474 74 67 Ramsey 5,895,954 3 2 Red Lake 122,064 76 86 Redwood 223,377 54 53 Renville 291,104 43 52 Rice 646,685 20 14 Rock 136,010 68 73 Roseau 260,647 49 54 St. Louis 6,682,490 2 6 Scott 1,238,844 9 10 Sherburne 854,350 11 12 Sibley 190,468 59 56 Stearns 1,719,690 7 7 Steele 501,028 29 27 Stevens 135,470 69 71 Swift 186,571 62 64 Todd 272,075 47 41 Traverse 51,121 87 87 Wabasha 265,187 48 45 Wadena 215,459 56 60 Waseca 241,383 50 49 Washington 2,187,214 6 5 Watonwan 149,518 66 65 Wilkin 87,595 80 78 Winona 595,065 23 18 Wright 808,538 14 9 Yellow Medicine 124,648 75 68
Note for Table 8
* Ranking is highest to lowest (1 is highest, 87 is lowest).
48
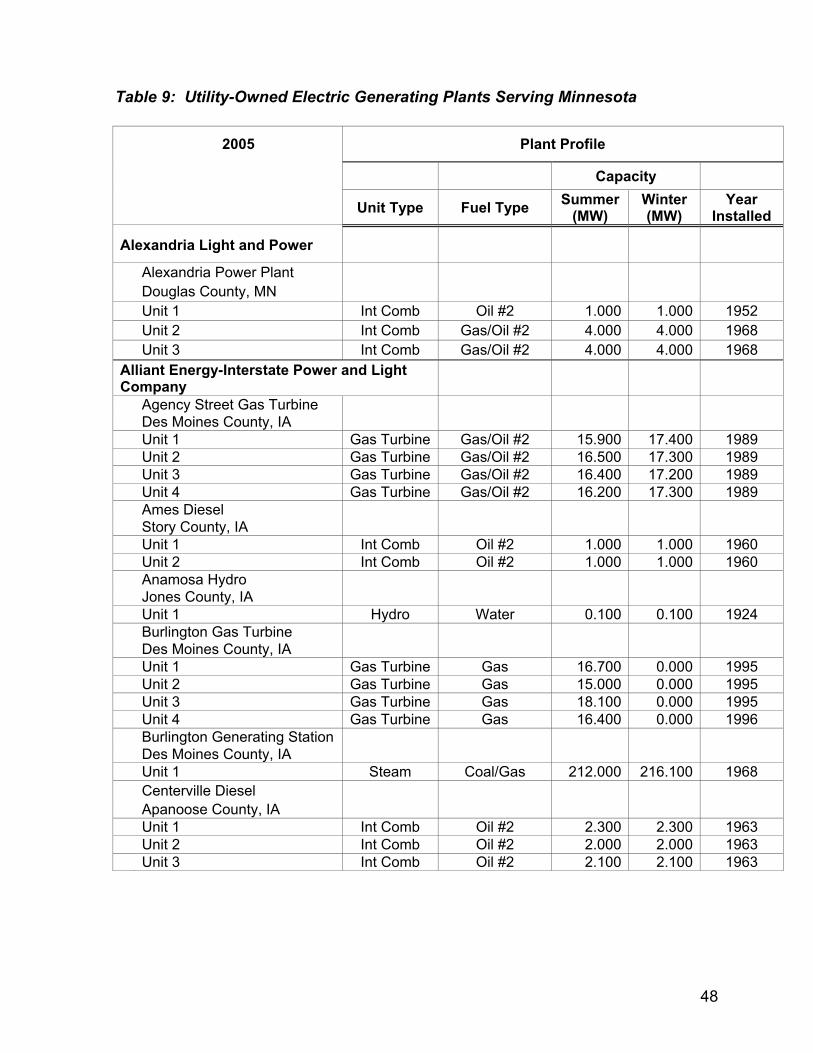
Table 9: Utility-Owned Electric Generating Plants Serving Minnesota
2005 Plant Profile
Capacity
Unit Type Fuel Type Summer (MW)
Winter (MW)
Year Installed
Alexandria Light and Power
Alexandria Power Plant Douglas County, MN Unit 1 Int Comb Oil #2 1.000 1.000 1952 Unit 2 Int Comb Gas/Oil #2 4.000 4.000 1968 Unit 3 Int Comb Gas/Oil #2 4.000 4.000 1968
Alliant Energy-Interstate Power and Light Company
Agency Street Gas Turbine Des Moines County, IA Unit 1 Gas Turbine Gas/Oil #2 15.900 17.400 1989 Unit 2 Gas Turbine Gas/Oil #2 16.500 17.300 1989 Unit 3 Gas Turbine Gas/Oil #2 16.400 17.200 1989 Unit 4 Gas Turbine Gas/Oil #2 16.200 17.300 1989 Ames Diesel Story County, IA Unit 1 Int Comb Oil #2 1.000 1.000 1960 Unit 2 Int Comb Oil #2 1.000 1.000 1960 Anamosa Hydro Jones County, IA Unit 1 Hydro Water 0.100 0.100 1924 Burlington Gas Turbine Des Moines County, IA Unit 1 Gas Turbine Gas 16.700 0.000 1995 Unit 2 Gas Turbine Gas 15.000 0.000 1995 Unit 3 Gas Turbine Gas 18.100 0.000 1995 Unit 4 Gas Turbine Gas 16.400 0.000 1996 Burlington Generating Station Des Moines County, IA Unit 1 Steam Coal/Gas 212.000 216.100 1968 Centerville Diesel Apanoose County, IA Unit 1 Int Comb Oil #2 2.300 2.300 1963 Unit 2 Int Comb Oil #2 2.000 2.000 1963 Unit 3 Int Comb Oil #2 2.100 2.100 1963
49
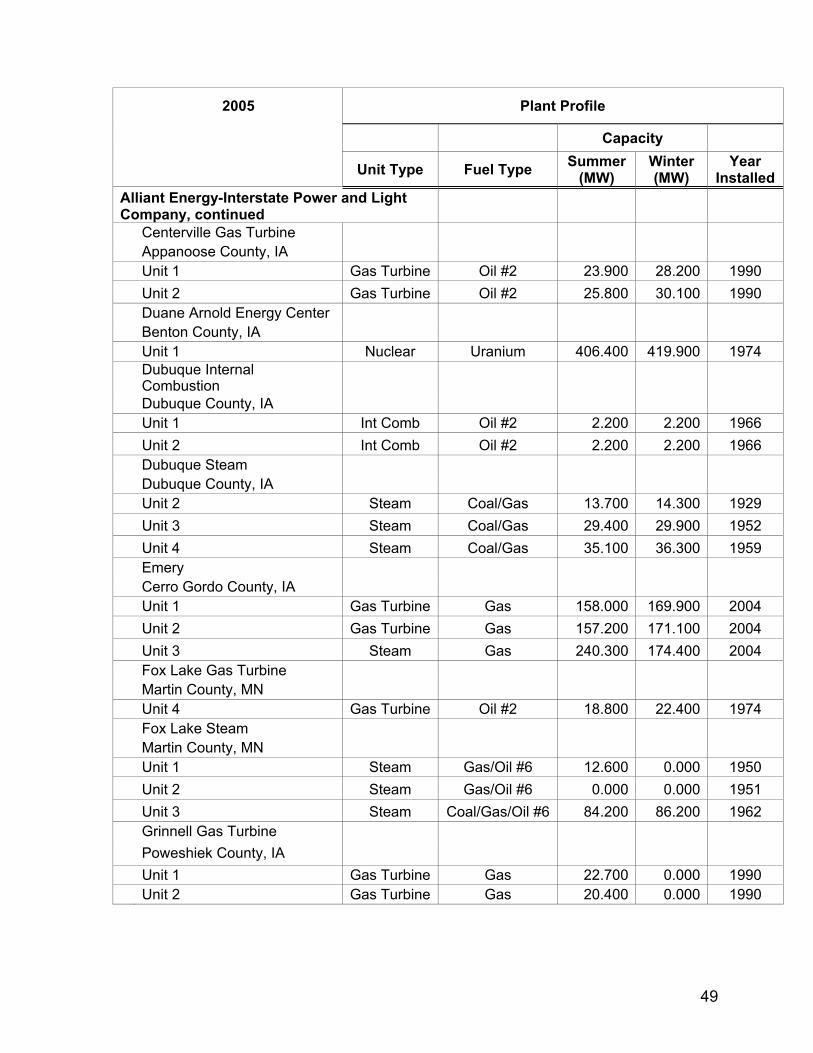
2005 Plant Profile
Capacity
Unit Type Fuel Type Summer (MW)
Winter (MW)
Year Installed
Alliant Energy-Interstate Power and Light Company, continued
Centerville Gas Turbine Appanoose County, IA Unit 1 Gas Turbine Oil #2 23.900 28.200 1990 Unit 2 Gas Turbine Oil #2 25.800 30.100 1990 Duane Arnold Energy Center Benton County, IA Unit 1 Nuclear Uranium 406.400 419.900 1974
Dubuque Internal Combustion
Dubuque County, IA Unit 1 Int Comb Oil #2 2.200 2.200 1966 Unit 2 Int Comb Oil #2 2.200 2.200 1966 Dubuque Steam Dubuque County, IA Unit 2 Steam Coal/Gas 13.700 14.300 1929 Unit 3 Steam Coal/Gas 29.400 29.900 1952 Unit 4 Steam Coal/Gas 35.100 36.300 1959 Emery Cerro Gordo County, IA Unit 1 Gas Turbine Gas 158.000 169.900 2004 Unit 2 Gas Turbine Gas 157.200 171.100 2004 Unit 3 Steam Gas 240.300 174.400 2004 Fox Lake Gas Turbine Martin County, MN Unit 4 Gas Turbine Oil #2 18.800 22.400 1974 Fox Lake Steam Martin County, MN Unit 1 Steam Gas/Oil #6 12.600 0.000 1950 Unit 2 Steam Gas/Oil #6 0.000 0.000 1951 Unit 3 Steam Coal/Gas/Oil #6 84.200 86.200 1962 Grinnell Gas Turbine Poweshiek County, IA Unit 1 Gas Turbine Gas 22.700 0.000 1990 Unit 2 Gas Turbine Gas 20.400 0.000 1990
50
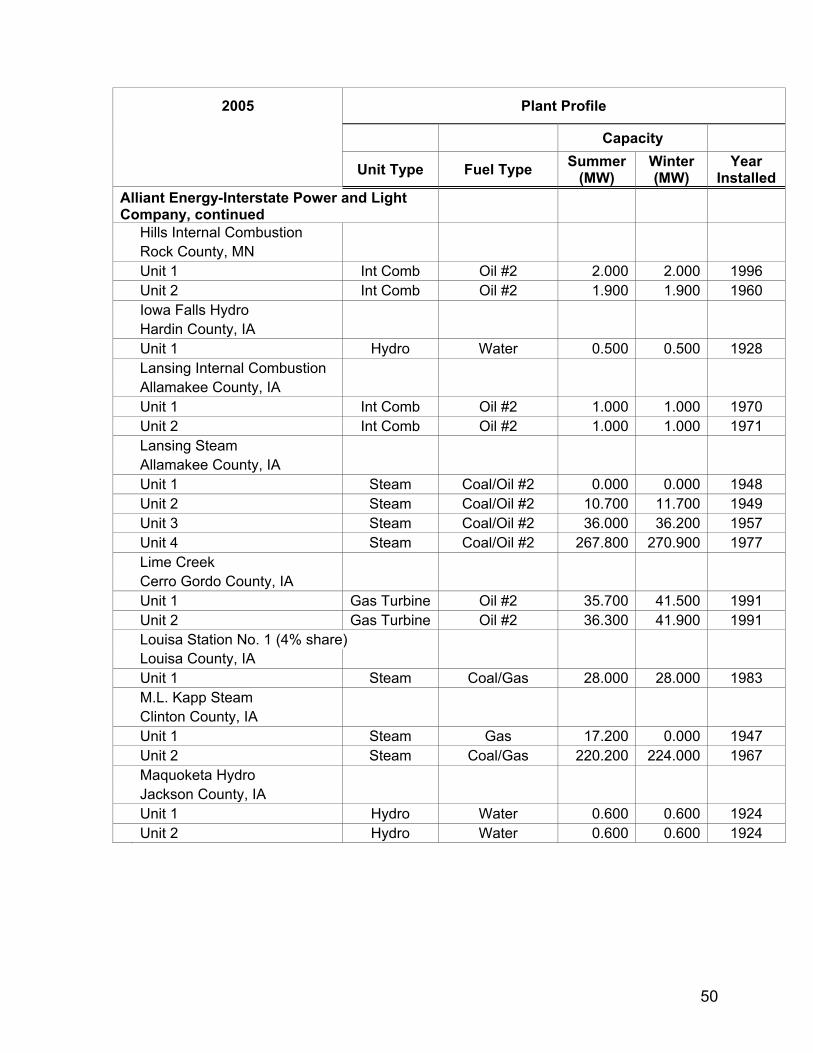
2005 Plant Profile
Capacity
Unit Type Fuel Type Summer (MW)
Winter (MW)
Year Installed
Alliant Energy-Interstate Power and Light Company, continued
Hills Internal Combustion Rock County, MN Unit 1 Int Comb Oil #2 2.000 2.000 1996 Unit 2 Int Comb Oil #2 1.900 1.900 1960 Iowa Falls Hydro Hardin County, IA Unit 1 Hydro Water 0.500 0.500 1928 Lansing Internal Combustion Allamakee County, IA Unit 1 Int Comb Oil #2 1.000 1.000 1970 Unit 2 Int Comb Oil #2 1.000 1.000 1971 Lansing Steam Allamakee County, IA Unit 1 Steam Coal/Oil #2 0.000 0.000 1948 Unit 2 Steam Coal/Oil #2 10.700 11.700 1949 Unit 3 Steam Coal/Oil #2 36.000 36.200 1957 Unit 4 Steam Coal/Oil #2 267.800 270.900 1977 Lime Creek Cerro Gordo County, IA Unit 1 Gas Turbine Oil #2 35.700 41.500 1991 Unit 2 Gas Turbine Oil #2 36.300 41.900 1991 Louisa Station No. 1 (4% share) Louisa County, IA Unit 1 Steam Coal/Gas 28.000 28.000 1983 M.L. Kapp Steam Clinton County, IA Unit 1 Steam Gas 17.200 0.000 1947 Unit 2 Steam Coal/Gas 220.200 224.000 1967 Maquoketa Hydro Jackson County, IA Unit 1 Hydro Water 0.600 0.600 1924 Unit 2 Hydro Water 0.600 0.600 1924
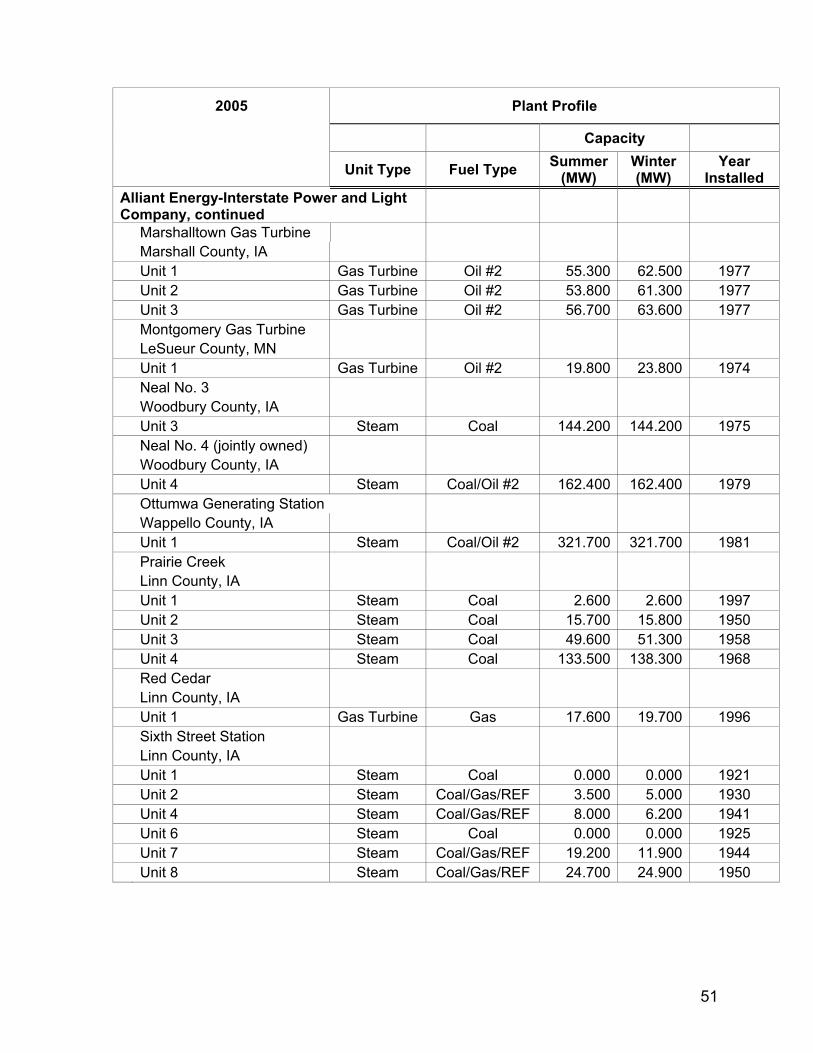
51
2005 Plant Profile
Capacity
Unit Type Fuel Type Summer (MW)
Winter (MW)
Year Installed
Alliant Energy-Interstate Power and Light Company, continued
Marshalltown Gas Turbine Marshall County, IA Unit 1 Gas Turbine Oil #2 55.300 62.500 1977 Unit 2 Gas Turbine Oil #2 53.800 61.300 1977 Unit 3 Gas Turbine Oil #2 56.700 63.600 1977 Montgomery Gas Turbine LeSueur County, MN Unit 1 Gas Turbine Oil #2 19.800 23.800 1974 Neal No. 3 Woodbury County, IA Unit 3 Steam Coal 144.200 144.200 1975 Neal No. 4 (jointly owned) Woodbury County, IA Unit 4 Steam Coal/Oil #2 162.400 162.400 1979 Ottumwa Generating Station Wappello County, IA Unit 1 Steam Coal/Oil #2 321.700 321.700 1981 Prairie Creek Linn County, IA Unit 1 Steam Coal 2.600 2.600 1997 Unit 2 Steam Coal 15.700 15.800 1950 Unit 3 Steam Coal 49.600 51.300 1958 Unit 4 Steam Coal 133.500 138.300 1968 Red Cedar Linn County, IA Unit 1 Gas Turbine Gas 17.600 19.700 1996 Sixth Street Station Linn County, IA Unit 1 Steam Coal 0.000 0.000 1921 Unit 2 Steam Coal/Gas/REF 3.500 5.000 1930 Unit 4 Steam Coal/Gas/REF 8.000 6.200 1941 Unit 6 Steam Coal 0.000 0.000 1925 Unit 7 Steam Coal/Gas/REF 19.200 11.900 1944 Unit 8 Steam Coal/Gas/REF 24.700 24.900 1950
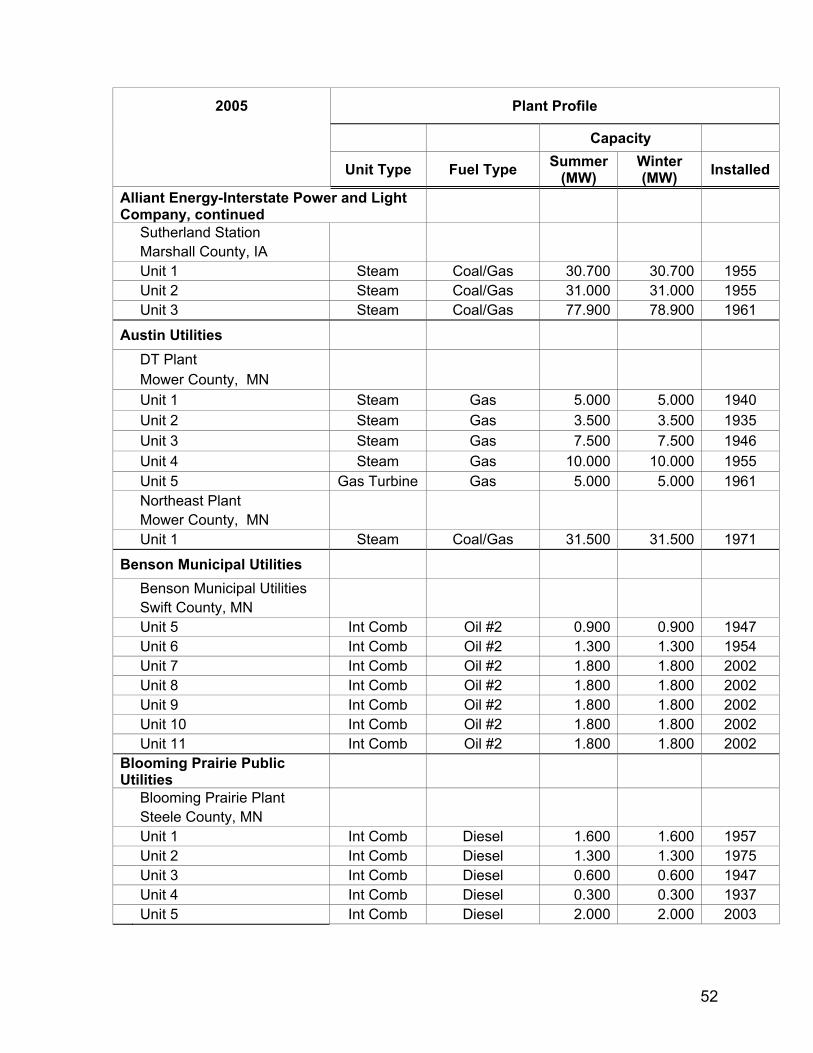
52
2005 Plant Profile
Capacity
Unit Type Fuel Type Summer (MW)
Winter (MW) Installed
Alliant Energy-Interstate Power and Light Company, continued
Sutherland Station Marshall County, IA Unit 1 Steam Coal/Gas 30.700 30.700 1955 Unit 2 Steam Coal/Gas 31.000 31.000 1955 Unit 3 Steam Coal/Gas 77.900 78.900 1961
Austin Utilities
DT Plant Mower County, MN Unit 1 Steam Gas 5.000 5.000 1940 Unit 2 Steam Gas 3.500 3.500 1935 Unit 3 Steam Gas 7.500 7.500 1946 Unit 4 Steam Gas 10.000 10.000 1955 Unit 5 Gas Turbine Gas 5.000 5.000 1961 Northeast Plant Mower County, MN Unit 1 Steam Coal/Gas 31.500 31.500 1971
Benson Municipal Utilities Benson Municipal Utilities Swift County, MN Unit 5 Int Comb Oil #2 0.900 0.900 1947 Unit 6 Int Comb Oil #2 1.300 1.300 1954 Unit 7 Int Comb Oil #2 1.800 1.800 2002 Unit 8 Int Comb Oil #2 1.800 1.800 2002 Unit 9 Int Comb Oil #2 1.800 1.800 2002 Unit 10 Int Comb Oil #2 1.800 1.800 2002 Unit 11 Int Comb Oil #2 1.800 1.800 2002
Blooming Prairie Public Utilities
Blooming Prairie Plant Steele County, MN Unit 1 Int Comb Diesel 1.600 1.600 1957 Unit 2 Int Comb Diesel 1.300 1.300 1975 Unit 3 Int Comb Diesel 0.600 0.600 1947 Unit 4 Int Comb Diesel 0.300 0.300 1937 Unit 5 Int Comb Diesel 2.000 2.000 2003
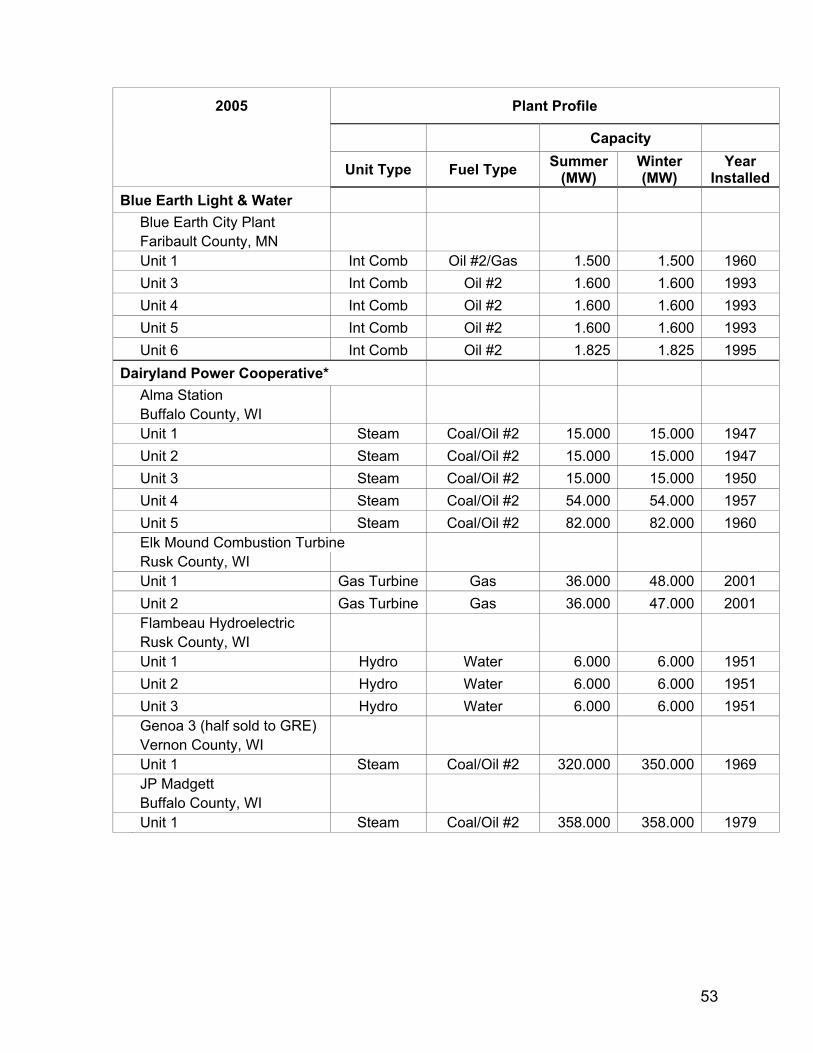
53
2005 Plant Profile
Capacity
Unit Type Fuel Type Summer (MW)
Winter (MW)
Year Installed
Blue Earth Light & Water Blue Earth City Plant Faribault County, MN Unit 1 Int Comb Oil #2/Gas 1.500 1.500 1960 Unit 3 Int Comb Oil #2 1.600 1.600 1993 Unit 4 Int Comb Oil #2 1.600 1.600 1993 Unit 5 Int Comb Oil #2 1.600 1.600 1993 Unit 6 Int Comb Oil #2 1.825 1.825 1995
Dairyland Power Cooperative* Alma Station Buffalo County, WI Unit 1 Steam Coal/Oil #2 15.000 15.000 1947 Unit 2 Steam Coal/Oil #2 15.000 15.000 1947 Unit 3 Steam Coal/Oil #2 15.000 15.000 1950 Unit 4 Steam Coal/Oil #2 54.000 54.000 1957 Unit 5 Steam Coal/Oil #2 82.000 82.000 1960 Elk Mound Combustion Turbine Rusk County, WI Unit 1 Gas Turbine Gas 36.000 48.000 2001 Unit 2 Gas Turbine Gas 36.000 47.000 2001 Flambeau Hydroelectric Rusk County, WI Unit 1 Hydro Water 6.000 6.000 1951 Unit 2 Hydro Water 6.000 6.000 1951 Unit 3 Hydro Water 6.000 6.000 1951 Genoa 3 (half sold to GRE) Vernon County, WI Unit 1 Steam Coal/Oil #2 320.000 350.000 1969 JP Madgett Buffalo County, WI Unit 1 Steam Coal/Oil #2 358.000 358.000 1979
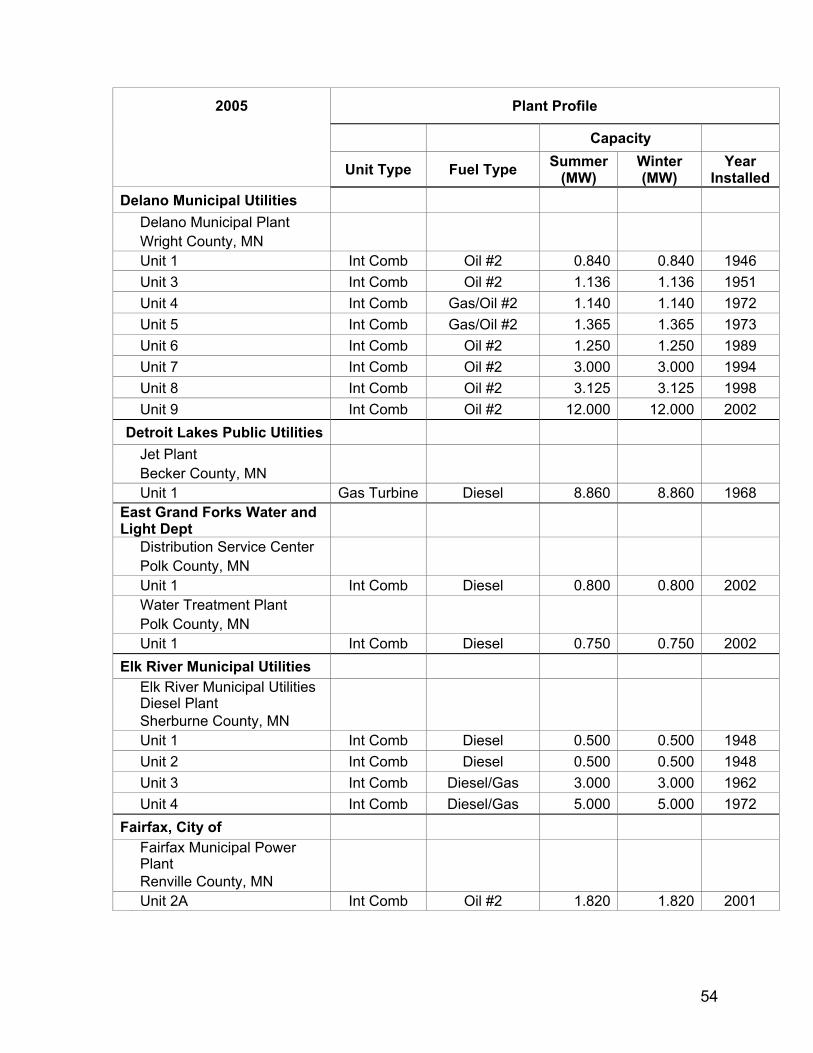
54
2005 Plant Profile
Capacity
Unit Type Fuel Type Summer (MW)
Winter (MW)
Year Installed
Delano Municipal Utilities Delano Municipal Plant Wright County, MN Unit 1 Int Comb Oil #2 0.840 0.840 1946 Unit 3 Int Comb Oil #2 1.136 1.136 1951 Unit 4 Int Comb Gas/Oil #2 1.140 1.140 1972 Unit 5 Int Comb Gas/Oil #2 1.365 1.365 1973 Unit 6 Int Comb Oil #2 1.250 1.250 1989 Unit 7 Int Comb Oil #2 3.000 3.000 1994 Unit 8 Int Comb Oil #2 3.125 3.125 1998 Unit 9 Int Comb Oil #2 12.000 12.000 2002 Detroit Lakes Public Utilities Jet Plant Becker County, MN Unit 1 Gas Turbine Diesel 8.860 8.860 1968
East Grand Forks Water and Light Dept
Distribution Service Center Polk County, MN Unit 1 Int Comb Diesel 0.800 0.800 2002 Water Treatment Plant Polk County, MN Unit 1 Int Comb Diesel 0.750 0.750 2002
Elk River Municipal Utilities
Elk River Municipal Utilities Diesel Plant
Sherburne County, MN Unit 1 Int Comb Diesel 0.500 0.500 1948 Unit 2 Int Comb Diesel 0.500 0.500 1948 Unit 3 Int Comb Diesel/Gas 3.000 3.000 1962 Unit 4 Int Comb Diesel/Gas 5.000 5.000 1972
Fairfax, City of
Fairfax Municipal Power Plant
Renville County, MN Unit 2A Int Comb Oil #2 1.820 1.820 2001
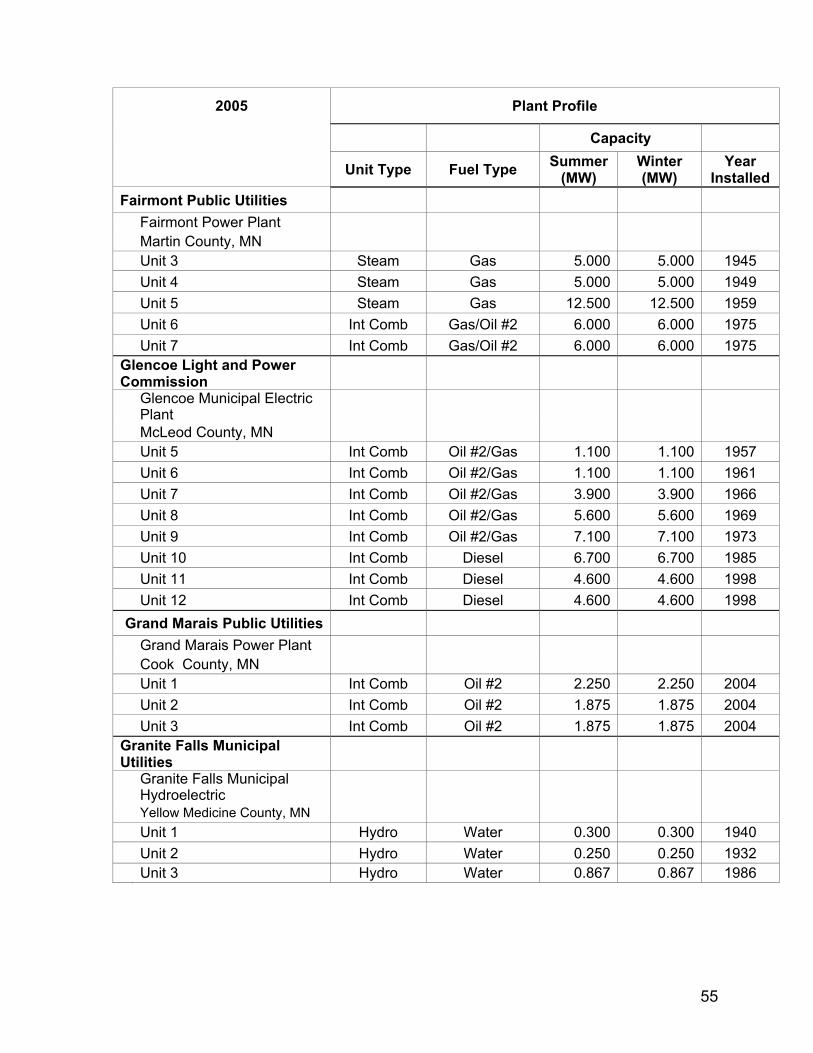
55
2005 Plant Profile
Capacity
Unit Type Fuel Type Summer (MW)
Winter (MW)
Year Installed
Fairmont Public Utilities Fairmont Power Plant Martin County, MN Unit 3 Steam Gas 5.000 5.000 1945 Unit 4 Steam Gas 5.000 5.000 1949 Unit 5 Steam Gas 12.500 12.500 1959 Unit 6 Int Comb Gas/Oil #2 6.000 6.000 1975 Unit 7 Int Comb Gas/Oil #2 6.000 6.000 1975
Glencoe Light and Power Commission
Glencoe Municipal Electric Plant
McLeod County, MN Unit 5 Int Comb Oil #2/Gas 1.100 1.100 1957 Unit 6 Int Comb Oil #2/Gas 1.100 1.100 1961 Unit 7 Int Comb Oil #2/Gas 3.900 3.900 1966 Unit 8 Int Comb Oil #2/Gas 5.600 5.600 1969 Unit 9 Int Comb Oil #2/Gas 7.100 7.100 1973 Unit 10 Int Comb Diesel 6.700 6.700 1985 Unit 11 Int Comb Diesel 4.600 4.600 1998 Unit 12 Int Comb Diesel 4.600 4.600 1998 Grand Marais Public Utilities Grand Marais Power Plant Cook County, MN Unit 1 Int Comb Oil #2 2.250 2.250 2004 Unit 2 Int Comb Oil #2 1.875 1.875 2004 Unit 3 Int Comb Oil #2 1.875 1.875 2004
Granite Falls Municipal Utilities
Granite Falls Municipal Hydroelectric
Yellow Medicine County, MN Unit 1 Hydro Water 0.300 0.300 1940 Unit 2 Hydro Water 0.250 0.250 1932 Unit 3 Hydro Water 0.867 0.867 1986
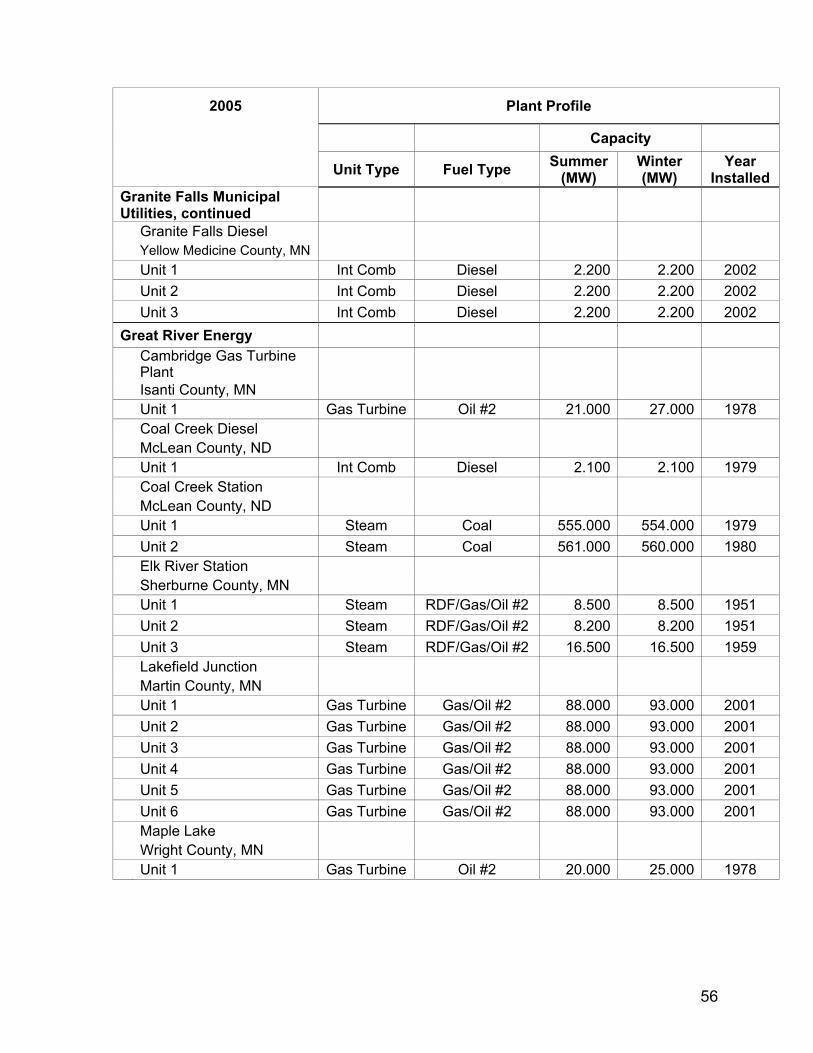
56
2005 Plant Profile
Capacity
Unit Type Fuel Type Summer (MW)
Winter (MW)
Year Installed
Granite Falls Municipal Utilities, continued
Granite Falls Diesel Yellow Medicine County, MN Unit 1 Int Comb Diesel 2.200 2.200 2002 Unit 2 Int Comb Diesel 2.200 2.200 2002 Unit 3 Int Comb Diesel 2.200 2.200 2002
Great River Energy
Cambridge Gas Turbine Plant
Isanti County, MN Unit 1 Gas Turbine Oil #2 21.000 27.000 1978 Coal Creek Diesel McLean County, ND Unit 1 Int Comb Diesel 2.100 2.100 1979 Coal Creek Station McLean County, ND Unit 1 Steam Coal 555.000 554.000 1979 Unit 2 Steam Coal 561.000 560.000 1980 Elk River Station Sherburne County, MN Unit 1 Steam RDF/Gas/Oil #2 8.500 8.500 1951 Unit 2 Steam RDF/Gas/Oil #2 8.200 8.200 1951 Unit 3 Steam RDF/Gas/Oil #2 16.500 16.500 1959 Lakefield Junction Martin County, MN Unit 1 Gas Turbine Gas/Oil #2 88.000 93.000 2001 Unit 2 Gas Turbine Gas/Oil #2 88.000 93.000 2001 Unit 3 Gas Turbine Gas/Oil #2 88.000 93.000 2001 Unit 4 Gas Turbine Gas/Oil #2 88.000 93.000 2001 Unit 5 Gas Turbine Gas/Oil #2 88.000 93.000 2001 Unit 6 Gas Turbine Gas/Oil #2 88.000 93.000 2001 Maple Lake Wright County, MN Unit 1 Gas Turbine Oil #2 20.000 25.000 1978
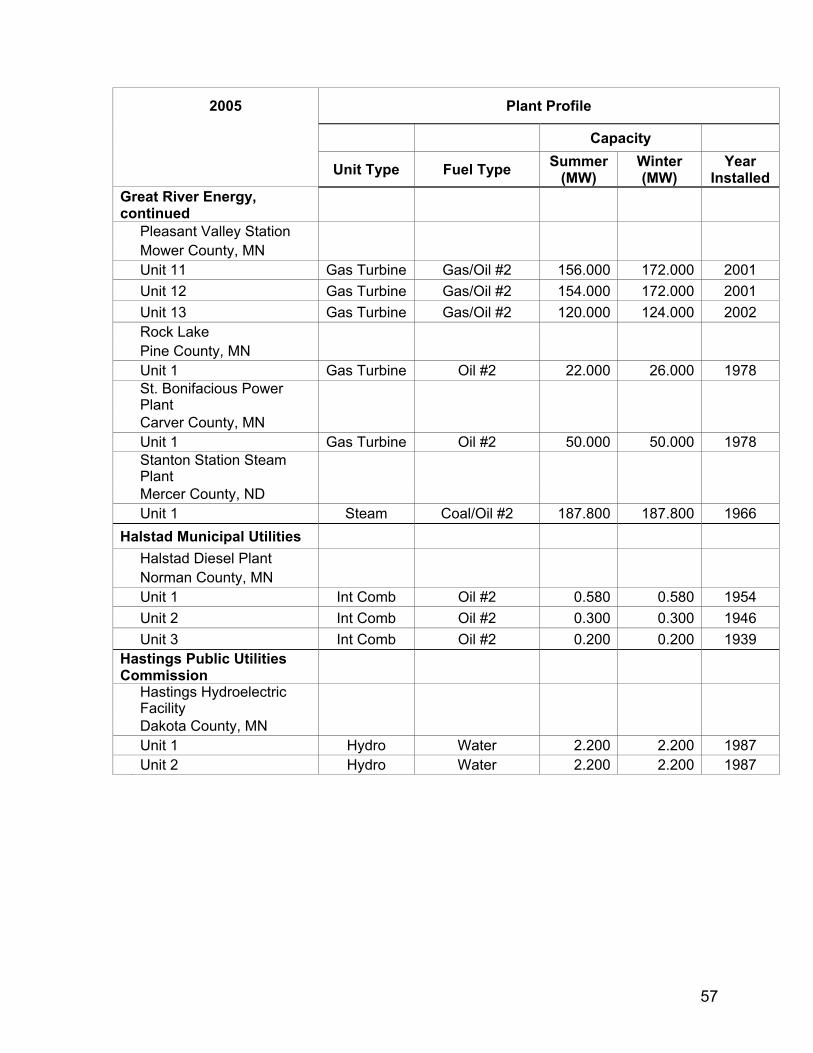
57
2005 Plant Profile
Capacity
Unit Type Fuel Type Summer (MW)
Winter (MW)
Year Installed
Great River Energy, continued
Pleasant Valley Station Mower County, MN Unit 11 Gas Turbine Gas/Oil #2 156.000 172.000 2001 Unit 12 Gas Turbine Gas/Oil #2 154.000 172.000 2001 Unit 13 Gas Turbine Gas/Oil #2 120.000 124.000 2002 Rock Lake Pine County, MN Unit 1 Gas Turbine Oil #2 22.000 26.000 1978
St. Bonifacious Power Plant
Carver County, MN Unit 1 Gas Turbine Oil #2 50.000 50.000 1978
Stanton Station Steam Plant
Mercer County, ND Unit 1 Steam Coal/Oil #2 187.800 187.800 1966
Halstad Municipal Utilities Halstad Diesel Plant Norman County, MN Unit 1 Int Comb Oil #2 0.580 0.580 1954 Unit 2 Int Comb Oil #2 0.300 0.300 1946 Unit 3 Int Comb Oil #2 0.200 0.200 1939
Hastings Public Utilities Commission
Hastings Hydroelectric Facility
Dakota County, MN Unit 1 Hydro Water 2.200 2.200 1987 Unit 2 Hydro Water 2.200 2.200 1987
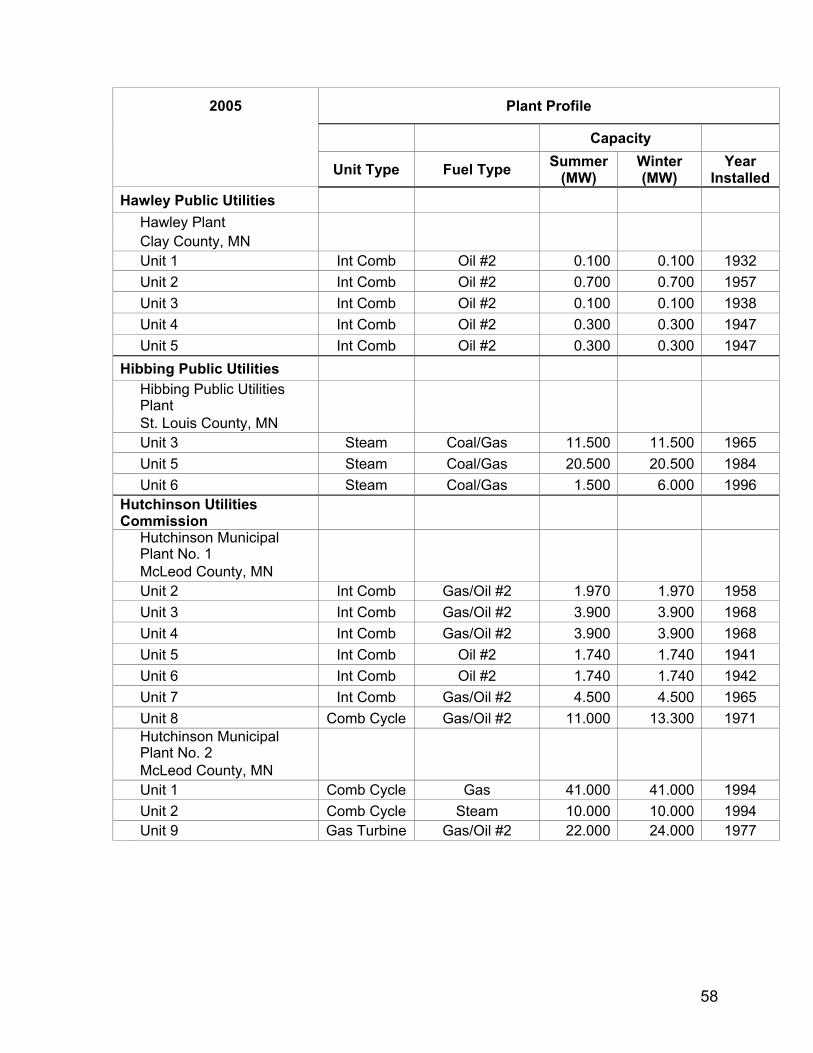
58
2005 Plant Profile
Capacity
Unit Type Fuel Type Summer (MW)
Winter (MW)
Year Installed
Hawley Public Utilities Hawley Plant Clay County, MN Unit 1 Int Comb Oil #2 0.100 0.100 1932 Unit 2 Int Comb Oil #2 0.700 0.700 1957 Unit 3 Int Comb Oil #2 0.100 0.100 1938 Unit 4 Int Comb Oil #2 0.300 0.300 1947 Unit 5 Int Comb Oil #2 0.300 0.300 1947
Hibbing Public Utilities
Hibbing Public Utilities Plant
St. Louis County, MN Unit 3 Steam Coal/Gas 11.500 11.500 1965 Unit 5 Steam Coal/Gas 20.500 20.500 1984 Unit 6 Steam Coal/Gas 1.500 6.000 1996
Hutchinson Utilities Commission
Hutchinson Municipal Plant No. 1
McLeod County, MN Unit 2 Int Comb Gas/Oil #2 1.970 1.970 1958 Unit 3 Int Comb Gas/Oil #2 3.900 3.900 1968 Unit 4 Int Comb Gas/Oil #2 3.900 3.900 1968 Unit 5 Int Comb Oil #2 1.740 1.740 1941 Unit 6 Int Comb Oil #2 1.740 1.740 1942 Unit 7 Int Comb Gas/Oil #2 4.500 4.500 1965 Unit 8 Comb Cycle Gas/Oil #2 11.000 13.300 1971
Hutchinson Municipal Plant No. 2
McLeod County, MN Unit 1 Comb Cycle Gas 41.000 41.000 1994 Unit 2 Comb Cycle Steam 10.000 10.000 1994 Unit 9 Gas Turbine Gas/Oil #2 22.000 24.000 1977
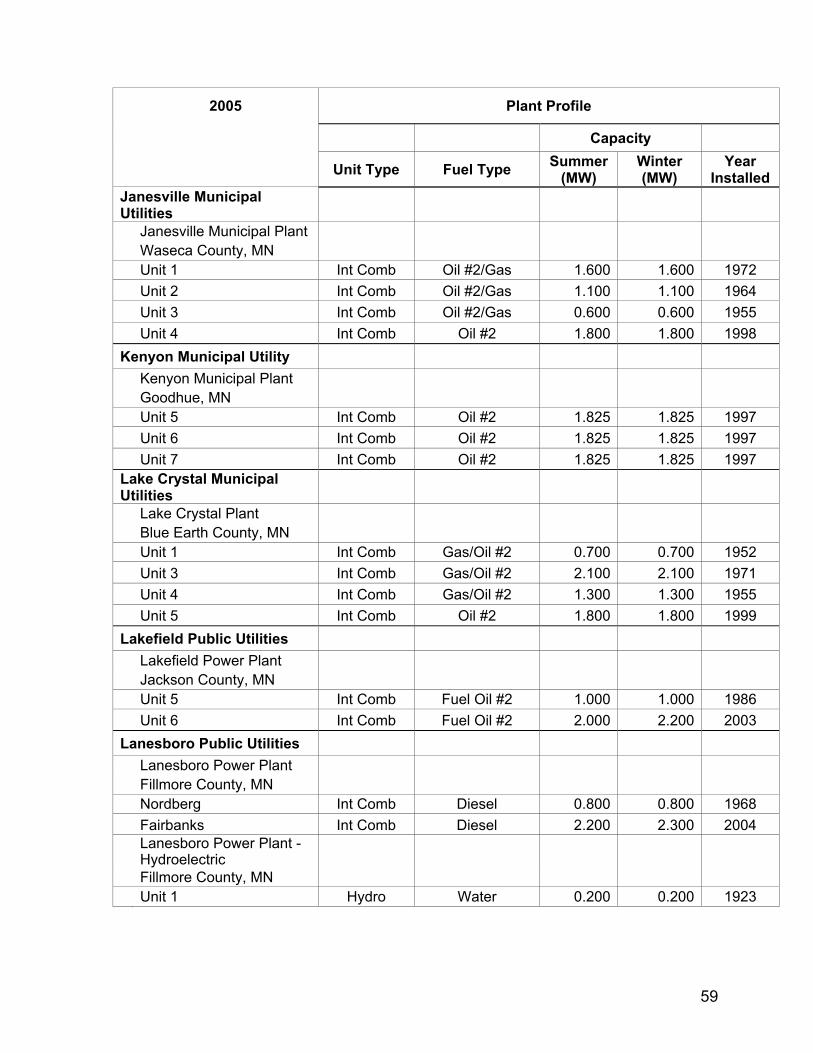
59
2005 Plant Profile
Capacity
Unit Type Fuel Type Summer (MW)
Winter (MW)
Year Installed
Janesville Municipal Utilities
Janesville Municipal Plant Waseca County, MN Unit 1 Int Comb Oil #2/Gas 1.600 1.600 1972 Unit 2 Int Comb Oil #2/Gas 1.100 1.100 1964 Unit 3 Int Comb Oil #2/Gas 0.600 0.600 1955 Unit 4 Int Comb Oil #2 1.800 1.800 1998
Kenyon Municipal Utility Kenyon Municipal Plant Goodhue, MN Unit 5 Int Comb Oil #2 1.825 1.825 1997 Unit 6 Int Comb Oil #2 1.825 1.825 1997 Unit 7 Int Comb Oil #2 1.825 1.825 1997
Lake Crystal Municipal Utilities
Lake Crystal Plant Blue Earth County, MN Unit 1 Int Comb Gas/Oil #2 0.700 0.700 1952 Unit 3 Int Comb Gas/Oil #2 2.100 2.100 1971 Unit 4 Int Comb Gas/Oil #2 1.300 1.300 1955 Unit 5 Int Comb Oil #2 1.800 1.800 1999
Lakefield Public Utilities Lakefield Power Plant Jackson County, MN Unit 5 Int Comb Fuel Oil #2 1.000 1.000 1986 Unit 6 Int Comb Fuel Oil #2 2.000 2.200 2003
Lanesboro Public Utilities Lanesboro Power Plant Fillmore County, MN Nordberg Int Comb Diesel 0.800 0.800 1968 Fairbanks Int Comb Diesel 2.200 2.300 2004
Lanesboro Power Plant - Hydroelectric
Fillmore County, MN Unit 1 Hydro Water 0.200 0.200 1923
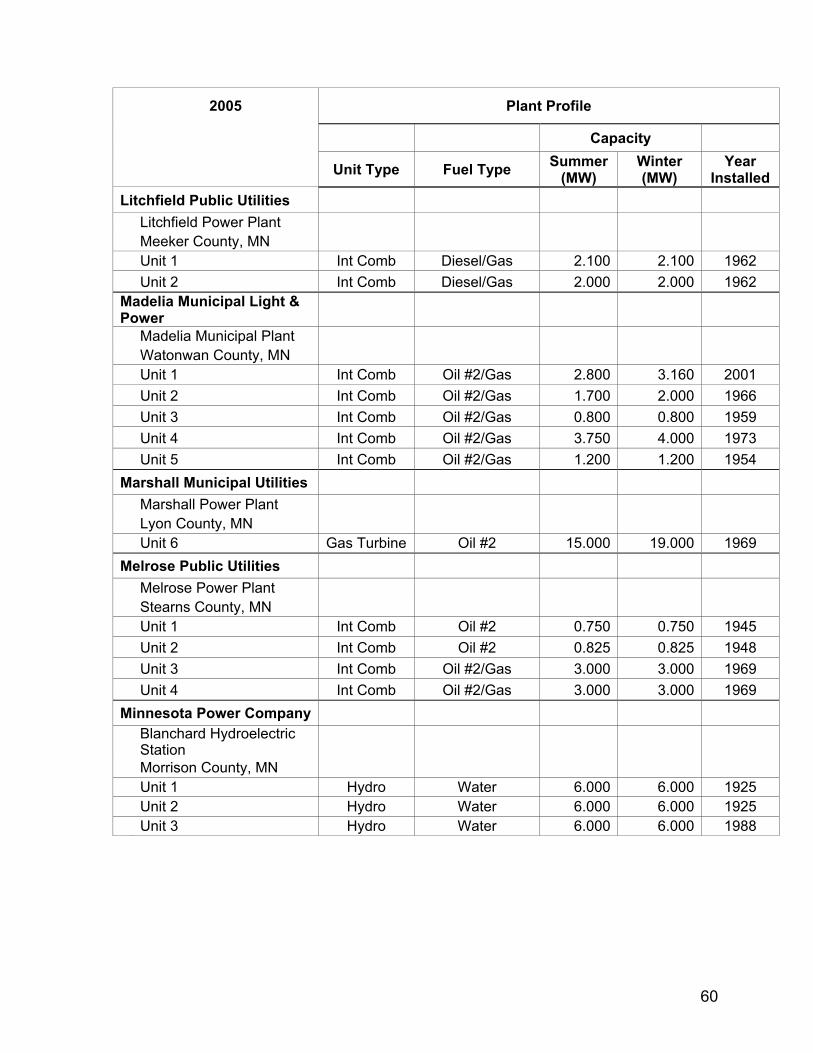
60
2005 Plant Profile
Capacity
Unit Type Fuel Type Summer (MW)
Winter (MW)
Year Installed
Litchfield Public Utilities Litchfield Power Plant Meeker County, MN Unit 1 Int Comb Diesel/Gas 2.100 2.100 1962 Unit 2 Int Comb Diesel/Gas 2.000 2.000 1962
Madelia Municipal Light & Power
Madelia Municipal Plant Watonwan County, MN Unit 1 Int Comb Oil #2/Gas 2.800 3.160 2001 Unit 2 Int Comb Oil #2/Gas 1.700 2.000 1966 Unit 3 Int Comb Oil #2/Gas 0.800 0.800 1959 Unit 4 Int Comb Oil #2/Gas 3.750 4.000 1973 Unit 5 Int Comb Oil #2/Gas 1.200 1.200 1954
Marshall Municipal Utilities Marshall Power Plant Lyon County, MN Unit 6 Gas Turbine Oil #2 15.000 19.000 1969
Melrose Public Utilities Melrose Power Plant Stearns County, MN Unit 1 Int Comb Oil #2 0.750 0.750 1945 Unit 2 Int Comb Oil #2 0.825 0.825 1948 Unit 3 Int Comb Oil #2/Gas 3.000 3.000 1969 Unit 4 Int Comb Oil #2/Gas 3.000 3.000 1969
Minnesota Power Company
Blanchard Hydroelectric Station
Morrison County, MN Unit 1 Hydro Water 6.000 6.000 1925 Unit 2 Hydro Water 6.000 6.000 1925 Unit 3 Hydro Water 6.000 6.000 1988
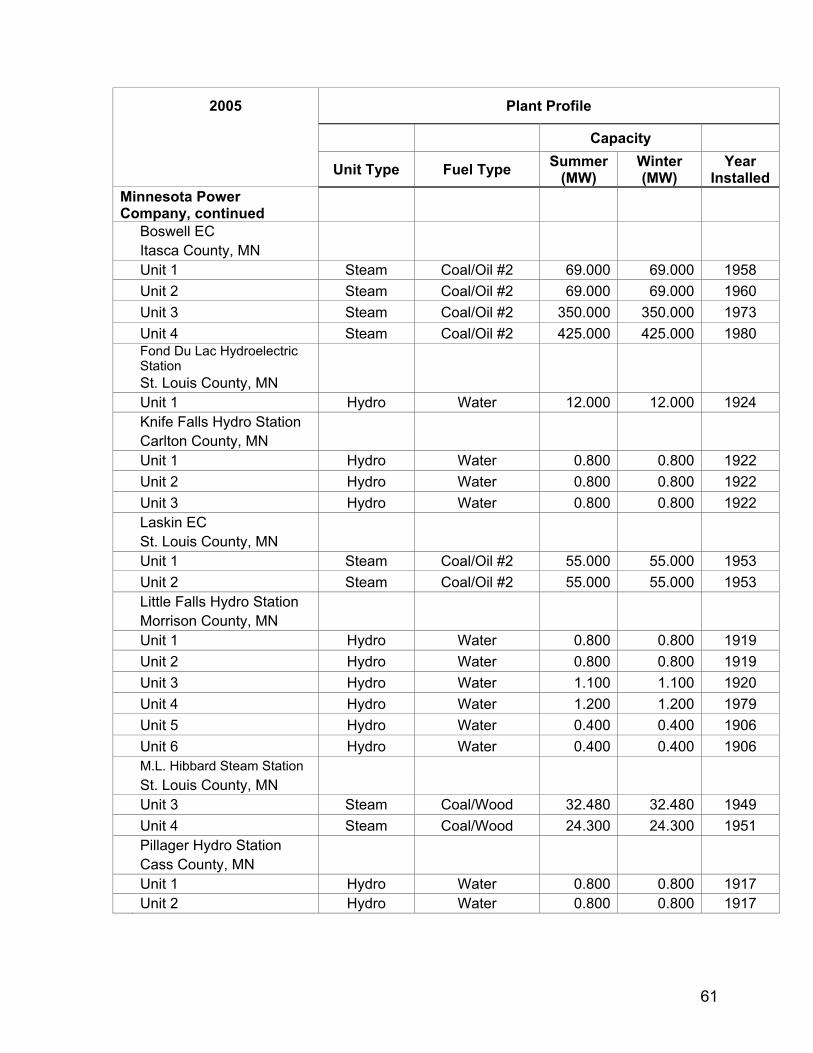
61
2005 Plant Profile
Capacity
Unit Type Fuel Type Summer (MW)
Winter (MW)
Year Installed
Minnesota Power Company, continued
Boswell EC Itasca County, MN Unit 1 Steam Coal/Oil #2 69.000 69.000 1958 Unit 2 Steam Coal/Oil #2 69.000 69.000 1960 Unit 3 Steam Coal/Oil #2 350.000 350.000 1973 Unit 4 Steam Coal/Oil #2 425.000 425.000 1980
Fond Du Lac Hydroelectric Station
St. Louis County, MN Unit 1 Hydro Water 12.000 12.000 1924 Knife Falls Hydro Station Carlton County, MN Unit 1 Hydro Water 0.800 0.800 1922 Unit 2 Hydro Water 0.800 0.800 1922 Unit 3 Hydro Water 0.800 0.800 1922 Laskin EC St. Louis County, MN Unit 1 Steam Coal/Oil #2 55.000 55.000 1953 Unit 2 Steam Coal/Oil #2 55.000 55.000 1953 Little Falls Hydro Station Morrison County, MN Unit 1 Hydro Water 0.800 0.800 1919 Unit 2 Hydro Water 0.800 0.800 1919 Unit 3 Hydro Water 1.100 1.100 1920 Unit 4 Hydro Water 1.200 1.200 1979 Unit 5 Hydro Water 0.400 0.400 1906 Unit 6 Hydro Water 0.400 0.400 1906 M.L. Hibbard Steam Station St. Louis County, MN Unit 3 Steam Coal/Wood 32.480 32.480 1949 Unit 4 Steam Coal/Wood 24.300 24.300 1951 Pillager Hydro Station Cass County, MN Unit 1 Hydro Water 0.800 0.800 1917 Unit 2 Hydro Water 0.800 0.800 1917
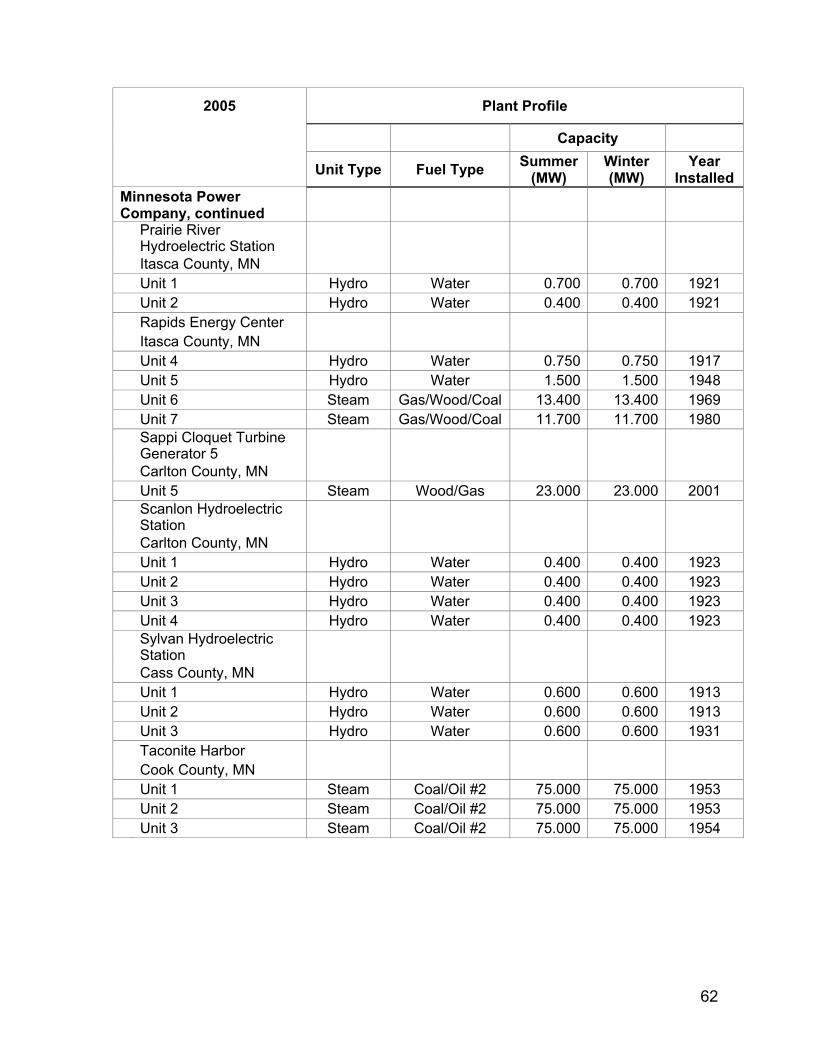
62
2005 Plant Profile
Capacity
Unit Type Fuel Type Summer (MW)
Winter (MW)
Year Installed
Minnesota Power Company, continued
Prairie River Hydroelectric Station
Itasca County, MN Unit 1 Hydro Water 0.700 0.700 1921 Unit 2 Hydro Water 0.400 0.400 1921 Rapids Energy Center Itasca County, MN Unit 4 Hydro Water 0.750 0.750 1917 Unit 5 Hydro Water 1.500 1.500 1948 Unit 6 Steam Gas/Wood/Coal 13.400 13.400 1969 Unit 7 Steam Gas/Wood/Coal 11.700 11.700 1980
Sappi Cloquet Turbine Generator 5
Carlton County, MN Unit 5 Steam Wood/Gas 23.000 23.000 2001
Scanlon Hydroelectric Station
Carlton County, MN Unit 1 Hydro Water 0.400 0.400 1923 Unit 2 Hydro Water 0.400 0.400 1923 Unit 3 Hydro Water 0.400 0.400 1923 Unit 4 Hydro Water 0.400 0.400 1923
Sylvan Hydroelectric Station
Cass County, MN Unit 1 Hydro Water 0.600 0.600 1913 Unit 2 Hydro Water 0.600 0.600 1913 Unit 3 Hydro Water 0.600 0.600 1931 Taconite Harbor Cook County, MN Unit 1 Steam Coal/Oil #2 75.000 75.000 1953 Unit 2 Steam Coal/Oil #2 75.000 75.000 1953 Unit 3 Steam Coal/Oil #2 75.000 75.000 1954
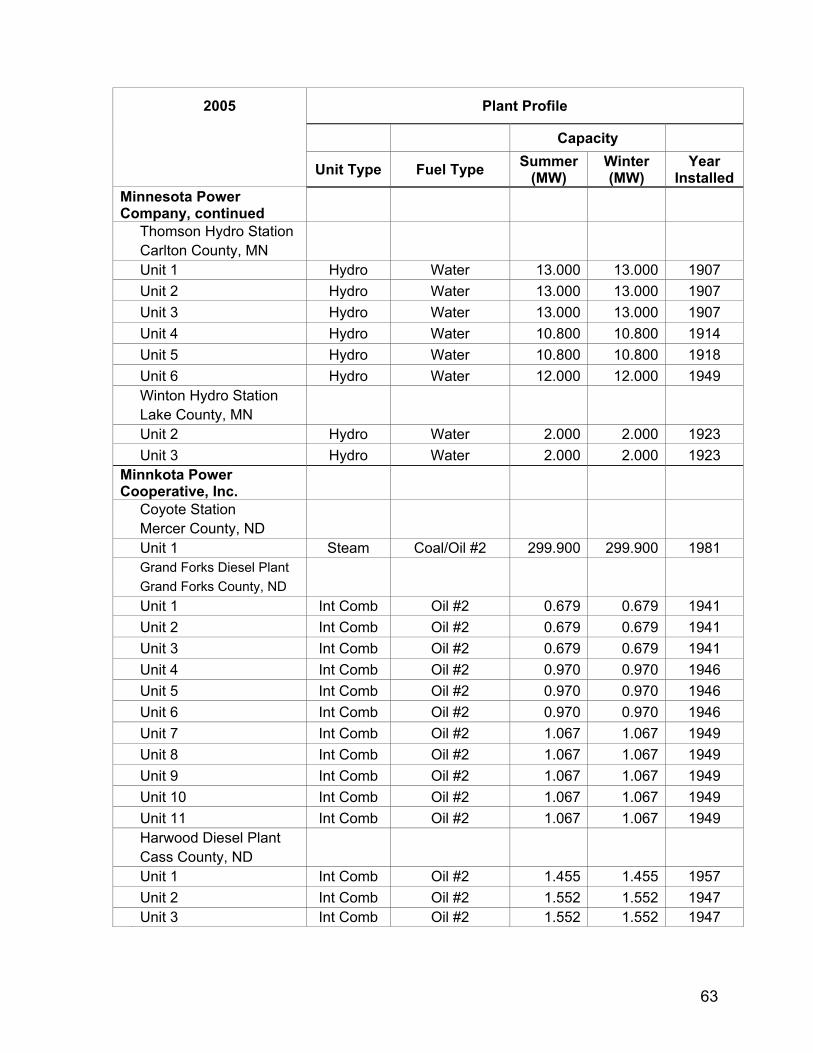
63
2005 Plant Profile
Capacity
Unit Type Fuel Type Summer (MW)
Winter (MW)
Year Installed
Minnesota Power Company, continued
Thomson Hydro Station Carlton County, MN Unit 1 Hydro Water 13.000 13.000 1907 Unit 2 Hydro Water 13.000 13.000 1907 Unit 3 Hydro Water 13.000 13.000 1907 Unit 4 Hydro Water 10.800 10.800 1914 Unit 5 Hydro Water 10.800 10.800 1918 Unit 6 Hydro Water 12.000 12.000 1949 Winton Hydro Station Lake County, MN Unit 2 Hydro Water 2.000 2.000 1923 Unit 3 Hydro Water 2.000 2.000 1923
Minnkota Power Cooperative, Inc.
Coyote Station Mercer County, ND Unit 1 Steam Coal/Oil #2 299.900 299.900 1981 Grand Forks Diesel Plant Grand Forks County, ND Unit 1 Int Comb Oil #2 0.679 0.679 1941 Unit 2 Int Comb Oil #2 0.679 0.679 1941 Unit 3 Int Comb Oil #2 0.679 0.679 1941 Unit 4 Int Comb Oil #2 0.970 0.970 1946 Unit 5 Int Comb Oil #2 0.970 0.970 1946 Unit 6 Int Comb Oil #2 0.970 0.970 1946 Unit 7 Int Comb Oil #2 1.067 1.067 1949 Unit 8 Int Comb Oil #2 1.067 1.067 1949 Unit 9 Int Comb Oil #2 1.067 1.067 1949 Unit 10 Int Comb Oil #2 1.067 1.067 1949 Unit 11 Int Comb Oil #2 1.067 1.067 1949 Harwood Diesel Plant Cass County, ND Unit 1 Int Comb Oil #2 1.455 1.455 1957 Unit 2 Int Comb Oil #2 1.552 1.552 1947 Unit 3 Int Comb Oil #2 1.552 1.552 1947
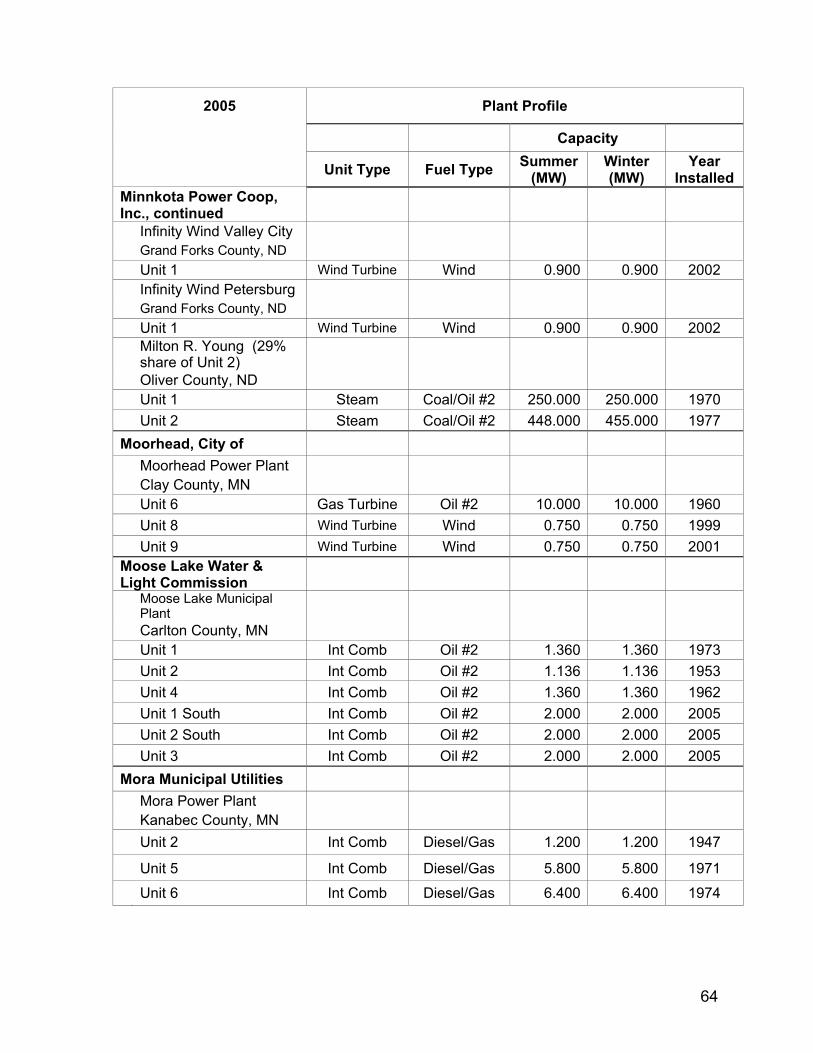
64
2005 Plant Profile
Capacity
Unit Type Fuel Type Summer (MW)
Winter (MW)
Year Installed
Minnkota Power Coop, Inc., continued
Infinity Wind Valley City Grand Forks County, ND Unit 1 Wind Turbine Wind 0.900 0.900 2002 Infinity Wind Petersburg Grand Forks County, ND Unit 1 Wind Turbine Wind 0.900 0.900 2002
Milton R. Young (29% share of Unit 2)
Oliver County, ND Unit 1 Steam Coal/Oil #2 250.000 250.000 1970 Unit 2 Steam Coal/Oil #2 448.000 455.000 1977
Moorhead, City of Moorhead Power Plant Clay County, MN Unit 6 Gas Turbine Oil #2 10.000 10.000 1960 Unit 8 Wind Turbine Wind 0.750 0.750 1999 Unit 9 Wind Turbine Wind 0.750 0.750 2001
Moose Lake Water & Light Commission
Moose Lake Municipal Plant
Carlton County, MN Unit 1 Int Comb Oil #2 1.360 1.360 1973 Unit 2 Int Comb Oil #2 1.136 1.136 1953 Unit 4 Int Comb Oil #2 1.360 1.360 1962 Unit 1 South Int Comb Oil #2 2.000 2.000 2005 Unit 2 South Int Comb Oil #2 2.000 2.000 2005 Unit 3 Int Comb Oil #2 2.000 2.000 2005
Mora Municipal Utilities Mora Power Plant Kanabec County, MN Unit 2 Int Comb Diesel/Gas 1.200 1.200 1947
Unit 5 Int Comb Diesel/Gas 5.800 5.800 1971
Unit 6 Int Comb Diesel/Gas 6.400 6.400 1974
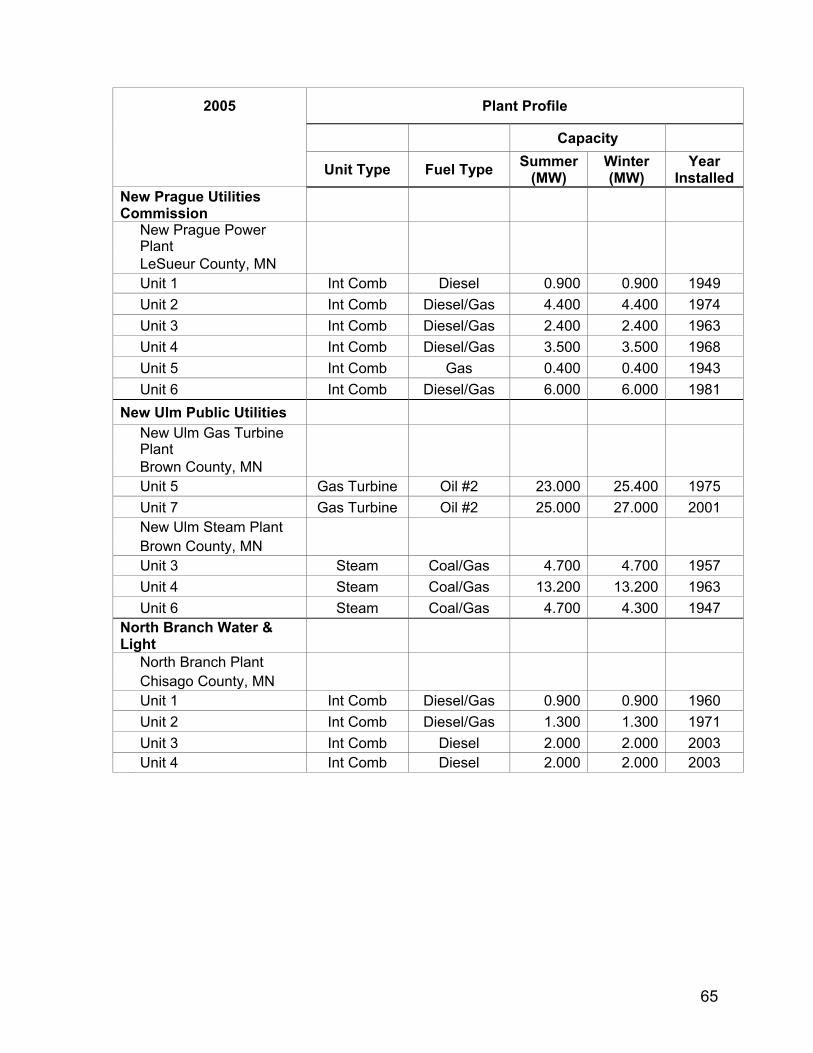
65
2005 Plant Profile
Capacity
Unit Type Fuel Type Summer (MW)
Winter (MW)
Year Installed
New Prague Utilities Commission
New Prague Power Plant
LeSueur County, MN Unit 1 Int Comb Diesel 0.900 0.900 1949 Unit 2 Int Comb Diesel/Gas 4.400 4.400 1974 Unit 3 Int Comb Diesel/Gas 2.400 2.400 1963 Unit 4 Int Comb Diesel/Gas 3.500 3.500 1968 Unit 5 Int Comb Gas 0.400 0.400 1943 Unit 6 Int Comb Diesel/Gas 6.000 6.000 1981
New Ulm Public Utilities
New Ulm Gas Turbine Plant
Brown County, MN Unit 5 Gas Turbine Oil #2 23.000 25.400 1975 Unit 7 Gas Turbine Oil #2 25.000 27.000 2001 New Ulm Steam Plant Brown County, MN Unit 3 Steam Coal/Gas 4.700 4.700 1957 Unit 4 Steam Coal/Gas 13.200 13.200 1963 Unit 6 Steam Coal/Gas 4.700 4.300 1947
North Branch Water & Light
North Branch Plant Chisago County, MN Unit 1 Int Comb Diesel/Gas 0.900 0.900 1960 Unit 2 Int Comb Diesel/Gas 1.300 1.300 1971 Unit 3 Int Comb Diesel 2.000 2.000 2003 Unit 4 Int Comb Diesel 2.000 2.000 2003
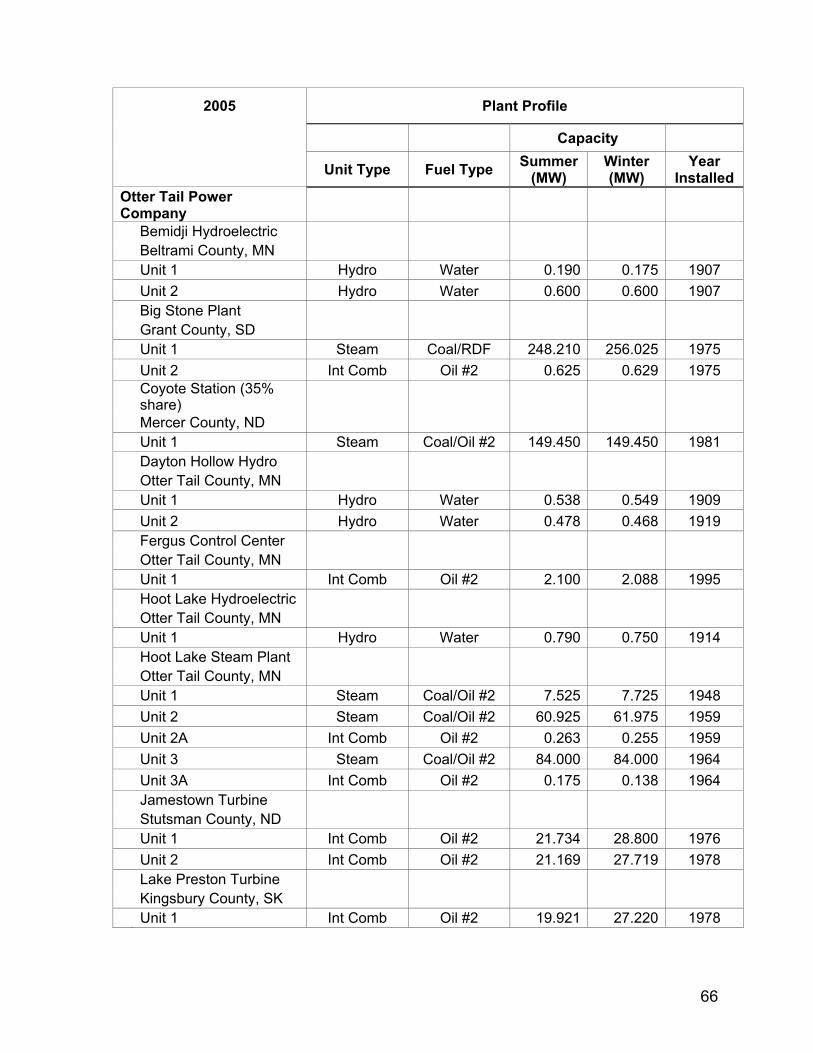
66
2005 Plant Profile
Capacity
Unit Type Fuel Type Summer (MW)
Winter (MW)
Year Installed
Otter Tail Power Company
Bemidji Hydroelectric Beltrami County, MN Unit 1 Hydro Water 0.190 0.175 1907 Unit 2 Hydro Water 0.600 0.600 1907 Big Stone Plant Grant County, SD Unit 1 Steam Coal/RDF 248.210 256.025 1975 Unit 2 Int Comb Oil #2 0.625 0.629 1975
Coyote Station (35% share)
Mercer County, ND Unit 1 Steam Coal/Oil #2 149.450 149.450 1981 Dayton Hollow Hydro Otter Tail County, MN Unit 1 Hydro Water 0.538 0.549 1909 Unit 2 Hydro Water 0.478 0.468 1919 Fergus Control Center Otter Tail County, MN Unit 1 Int Comb Oil #2 2.100 2.088 1995 Hoot Lake Hydroelectric Otter Tail County, MN Unit 1 Hydro Water 0.790 0.750 1914 Hoot Lake Steam Plant Otter Tail County, MN Unit 1 Steam Coal/Oil #2 7.525 7.725 1948 Unit 2 Steam Coal/Oil #2 60.925 61.975 1959 Unit 2A Int Comb Oil #2 0.263 0.255 1959 Unit 3 Steam Coal/Oil #2 84.000 84.000 1964 Unit 3A Int Comb Oil #2 0.175 0.138 1964 Jamestown Turbine Stutsman County, ND Unit 1 Int Comb Oil #2 21.734 28.800 1976 Unit 2 Int Comb Oil #2 21.169 27.719 1978 Lake Preston Turbine Kingsbury County, SK Unit 1 Int Comb Oil #2 19.921 27.220 1978
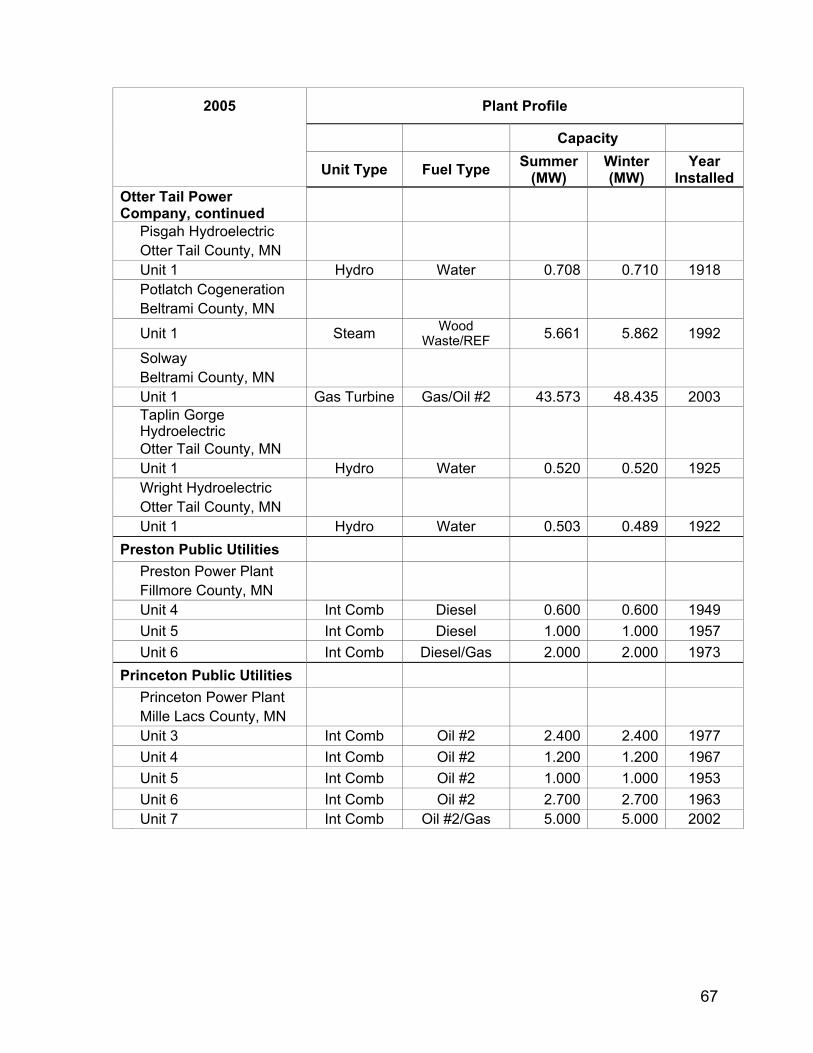
67
2005 Plant Profile
Capacity
Unit Type Fuel Type Summer (MW)
Winter (MW)
Year Installed
Otter Tail Power Company, continued
Pisgah Hydroelectric Otter Tail County, MN Unit 1 Hydro Water 0.708 0.710 1918 Potlatch Cogeneration Beltrami County, MN
Unit 1 Steam Wood Waste/REF 5.661 5.862 1992
Solway Beltrami County, MN Unit 1 Gas Turbine Gas/Oil #2 43.573 48.435 2003
Taplin Gorge Hydroelectric
Otter Tail County, MN Unit 1 Hydro Water 0.520 0.520 1925 Wright Hydroelectric Otter Tail County, MN Unit 1 Hydro Water 0.503 0.489 1922
Preston Public Utilities Preston Power Plant Fillmore County, MN Unit 4 Int Comb Diesel 0.600 0.600 1949 Unit 5 Int Comb Diesel 1.000 1.000 1957 Unit 6 Int Comb Diesel/Gas 2.000 2.000 1973
Princeton Public Utilities Princeton Power Plant Mille Lacs County, MN Unit 3 Int Comb Oil #2 2.400 2.400 1977 Unit 4 Int Comb Oil #2 1.200 1.200 1967 Unit 5 Int Comb Oil #2 1.000 1.000 1953 Unit 6 Int Comb Oil #2 2.700 2.700 1963 Unit 7 Int Comb Oil #2/Gas 5.000 5.000 2002
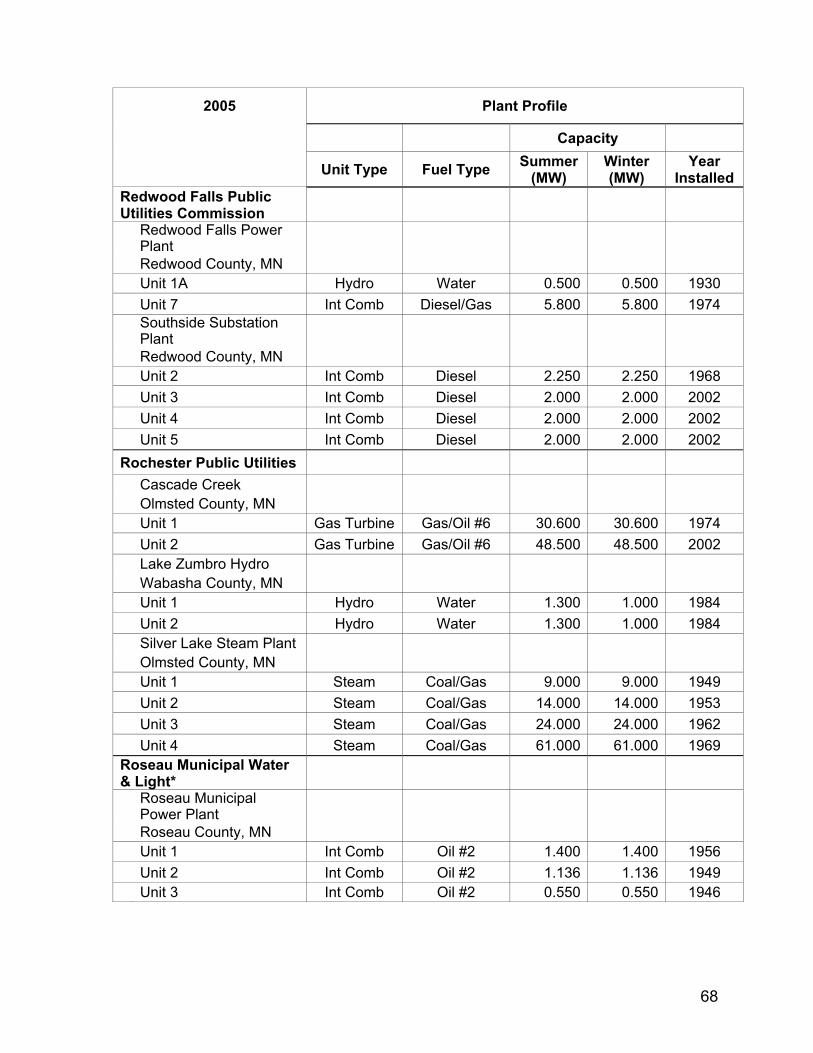
68
2005 Plant Profile
Capacity
Unit Type Fuel Type Summer (MW)
Winter (MW)
Year Installed
Redwood Falls Public Utilities Commission
Redwood Falls Power Plant
Redwood County, MN Unit 1A Hydro Water 0.500 0.500 1930 Unit 7 Int Comb Diesel/Gas 5.800 5.800 1974
Southside Substation Plant
Redwood County, MN Unit 2 Int Comb Diesel 2.250 2.250 1968 Unit 3 Int Comb Diesel 2.000 2.000 2002 Unit 4 Int Comb Diesel 2.000 2.000 2002 Unit 5 Int Comb Diesel 2.000 2.000 2002
Rochester Public Utilities Cascade Creek Olmsted County, MN Unit 1 Gas Turbine Gas/Oil #6 30.600 30.600 1974 Unit 2 Gas Turbine Gas/Oil #6 48.500 48.500 2002 Lake Zumbro Hydro Wabasha County, MN Unit 1 Hydro Water 1.300 1.000 1984 Unit 2 Hydro Water 1.300 1.000 1984 Silver Lake Steam Plant Olmsted County, MN Unit 1 Steam Coal/Gas 9.000 9.000 1949 Unit 2 Steam Coal/Gas 14.000 14.000 1953 Unit 3 Steam Coal/Gas 24.000 24.000 1962 Unit 4 Steam Coal/Gas 61.000 61.000 1969
Roseau Municipal Water & Light*
Roseau Municipal Power Plant
Roseau County, MN Unit 1 Int Comb Oil #2 1.400 1.400 1956 Unit 2 Int Comb Oil #2 1.136 1.136 1949 Unit 3 Int Comb Oil #2 0.550 0.550 1946
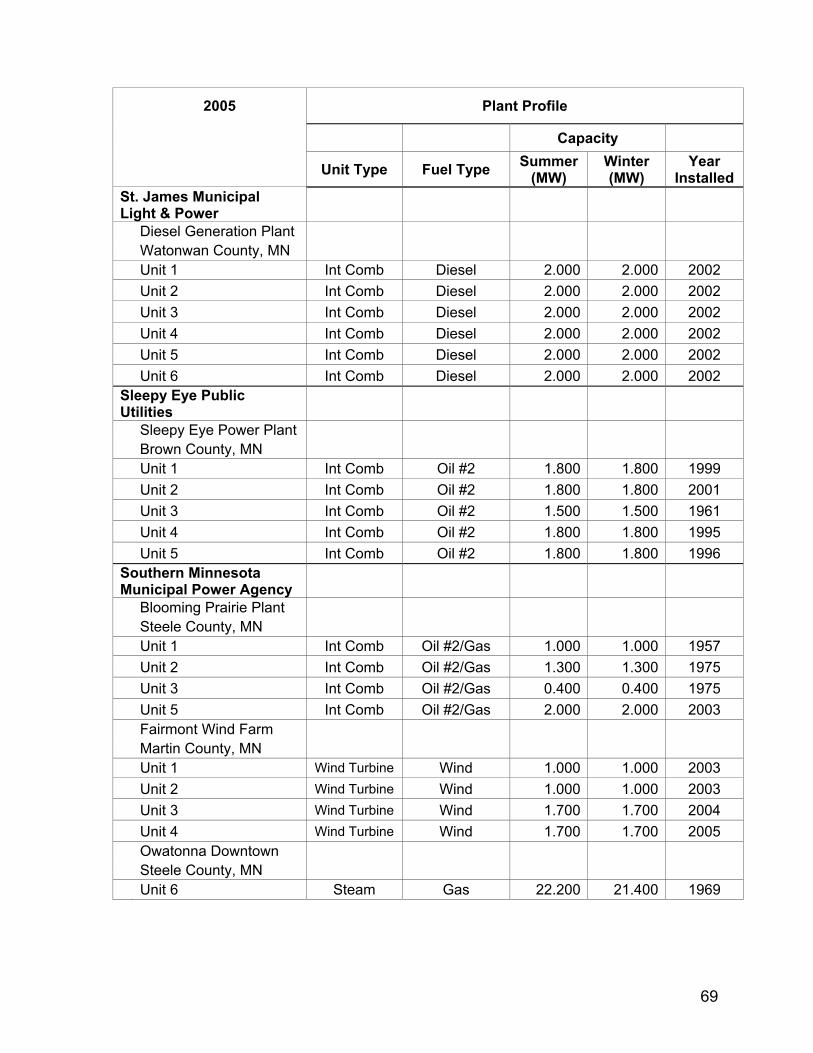
69
2005 Plant Profile
Capacity
Unit Type Fuel Type Summer (MW)
Winter (MW)
Year Installed
St. James Municipal Light & Power
Diesel Generation Plant Watonwan County, MN Unit 1 Int Comb Diesel 2.000 2.000 2002 Unit 2 Int Comb Diesel 2.000 2.000 2002 Unit 3 Int Comb Diesel 2.000 2.000 2002 Unit 4 Int Comb Diesel 2.000 2.000 2002 Unit 5 Int Comb Diesel 2.000 2.000 2002 Unit 6 Int Comb Diesel 2.000 2.000 2002
Sleepy Eye Public Utilities
Sleepy Eye Power Plant Brown County, MN Unit 1 Int Comb Oil #2 1.800 1.800 1999 Unit 2 Int Comb Oil #2 1.800 1.800 2001 Unit 3 Int Comb Oil #2 1.500 1.500 1961 Unit 4 Int Comb Oil #2 1.800 1.800 1995 Unit 5 Int Comb Oil #2 1.800 1.800 1996
Southern Minnesota Municipal Power Agency
Blooming Prairie Plant Steele County, MN Unit 1 Int Comb Oil #2/Gas 1.000 1.000 1957 Unit 2 Int Comb Oil #2/Gas 1.300 1.300 1975 Unit 3 Int Comb Oil #2/Gas 0.400 0.400 1975 Unit 5 Int Comb Oil #2/Gas 2.000 2.000 2003 Fairmont Wind Farm Martin County, MN Unit 1 Wind Turbine Wind 1.000 1.000 2003 Unit 2 Wind Turbine Wind 1.000 1.000 2003 Unit 3 Wind Turbine Wind 1.700 1.700 2004 Unit 4 Wind Turbine Wind 1.700 1.700 2005 Owatonna Downtown Steele County, MN Unit 6 Steam Gas 22.200 21.400 1969
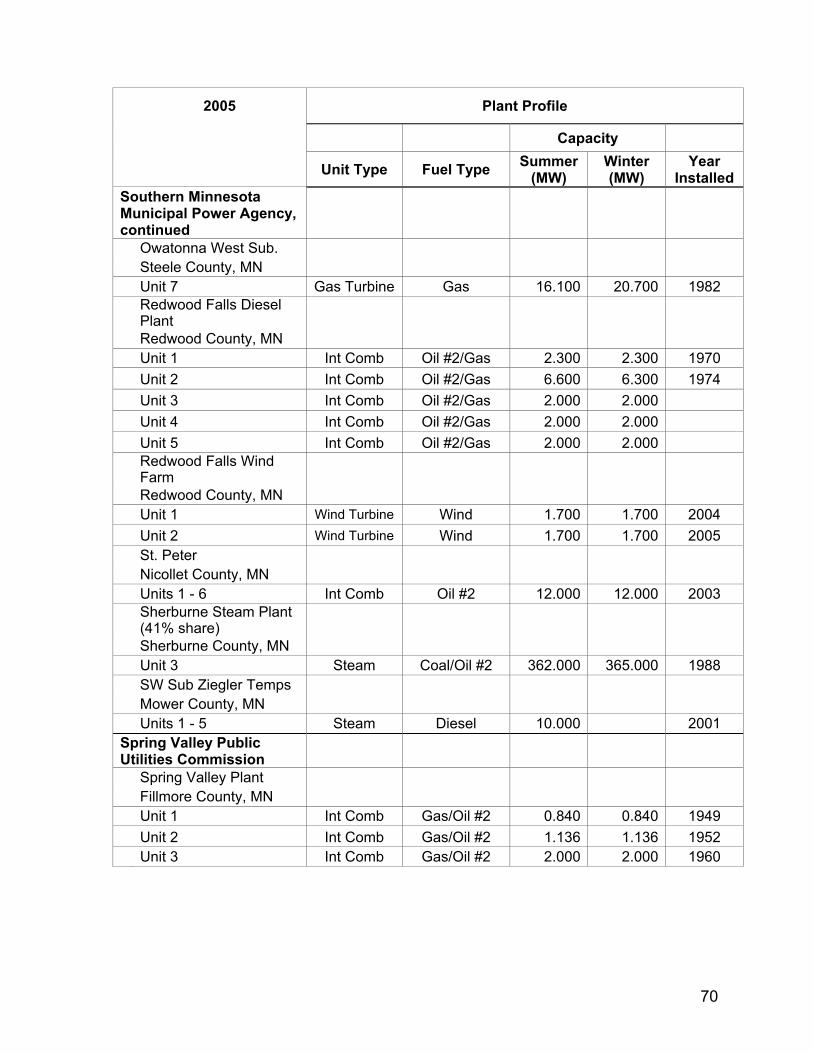
70
2005 Plant Profile
Capacity
Unit Type Fuel Type Summer (MW)
Winter (MW)
Year Installed
Southern Minnesota Municipal Power Agency, continued
Owatonna West Sub. Steele County, MN Unit 7 Gas Turbine Gas 16.100 20.700 1982
Redwood Falls Diesel Plant
Redwood County, MN Unit 1 Int Comb Oil #2/Gas 2.300 2.300 1970 Unit 2 Int Comb Oil #2/Gas 6.600 6.300 1974 Unit 3 Int Comb Oil #2/Gas 2.000 2.000 Unit 4 Int Comb Oil #2/Gas 2.000 2.000 Unit 5 Int Comb Oil #2/Gas 2.000 2.000
Redwood Falls Wind Farm
Redwood County, MN Unit 1 Wind Turbine Wind 1.700 1.700 2004 Unit 2 Wind Turbine Wind 1.700 1.700 2005 St. Peter Nicollet County, MN Units 1 - 6 Int Comb Oil #2 12.000 12.000 2003
Sherburne Steam Plant (41% share)
Sherburne County, MN Unit 3 Steam Coal/Oil #2 362.000 365.000 1988 SW Sub Ziegler Temps Mower County, MN Units 1 - 5 Steam Diesel 10.000 2001
Spring Valley Public Utilities Commission
Spring Valley Plant Fillmore County, MN Unit 1 Int Comb Gas/Oil #2 0.840 0.840 1949 Unit 2 Int Comb Gas/Oil #2 1.136 1.136 1952 Unit 3 Int Comb Gas/Oil #2 2.000 2.000 1960
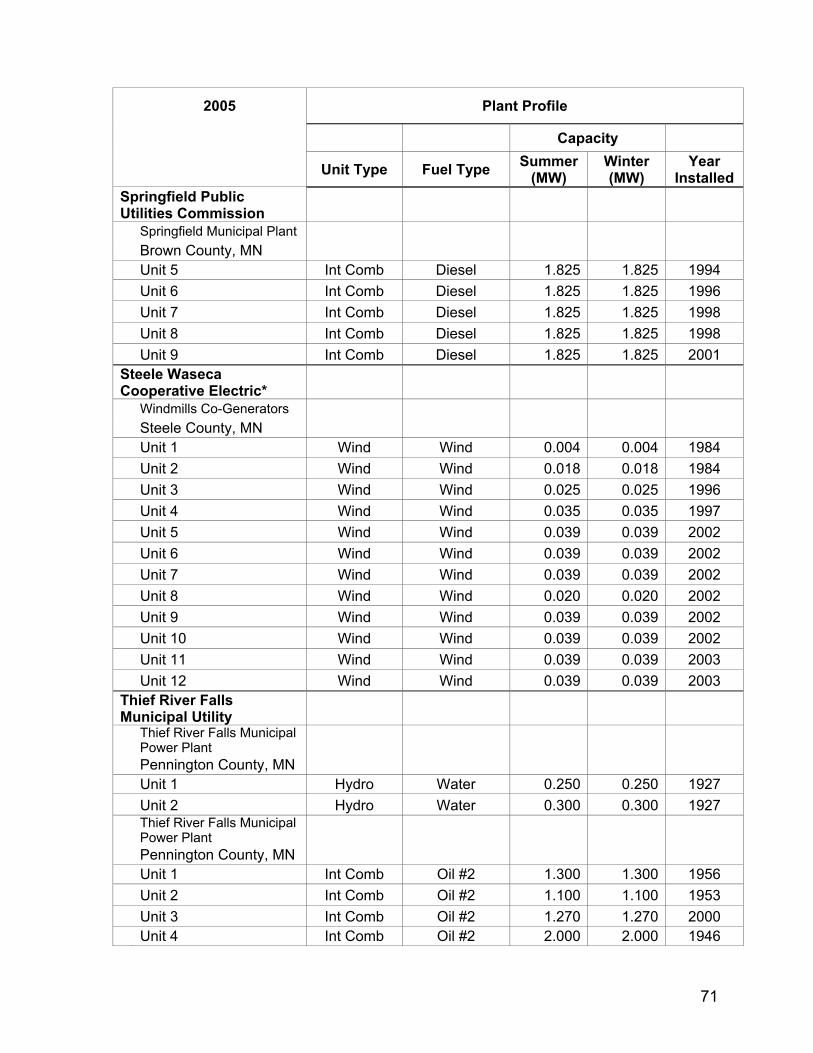
71
2005 Plant Profile
Capacity
Unit Type Fuel Type Summer (MW)
Winter (MW)
Year Installed
Springfield Public Utilities Commission
Springfield Municipal Plant Brown County, MN Unit 5 Int Comb Diesel 1.825 1.825 1994 Unit 6 Int Comb Diesel 1.825 1.825 1996 Unit 7 Int Comb Diesel 1.825 1.825 1998 Unit 8 Int Comb Diesel 1.825 1.825 1998 Unit 9 Int Comb Diesel 1.825 1.825 2001
Steele Waseca Cooperative Electric*
Windmills Co-Generators Steele County, MN
Unit 1 Wind Wind 0.004 0.004 1984 Unit 2 Wind Wind 0.018 0.018 1984 Unit 3 Wind Wind 0.025 0.025 1996 Unit 4 Wind Wind 0.035 0.035 1997 Unit 5 Wind Wind 0.039 0.039 2002 Unit 6 Wind Wind 0.039 0.039 2002 Unit 7 Wind Wind 0.039 0.039 2002 Unit 8 Wind Wind 0.020 0.020 2002 Unit 9 Wind Wind 0.039 0.039 2002 Unit 10 Wind Wind 0.039 0.039 2002 Unit 11 Wind Wind 0.039 0.039 2003 Unit 12 Wind Wind 0.039 0.039 2003
Thief River Falls Municipal Utility
Thief River Falls Municipal Power Plant
Pennington County, MN Unit 1 Hydro Water 0.250 0.250 1927 Unit 2 Hydro Water 0.300 0.300 1927
Thief River Falls Municipal Power Plant
Pennington County, MN Unit 1 Int Comb Oil #2 1.300 1.300 1956 Unit 2 Int Comb Oil #2 1.100 1.100 1953 Unit 3 Int Comb Oil #2 1.270 1.270 2000 Unit 4 Int Comb Oil #2 2.000 2.000 1946
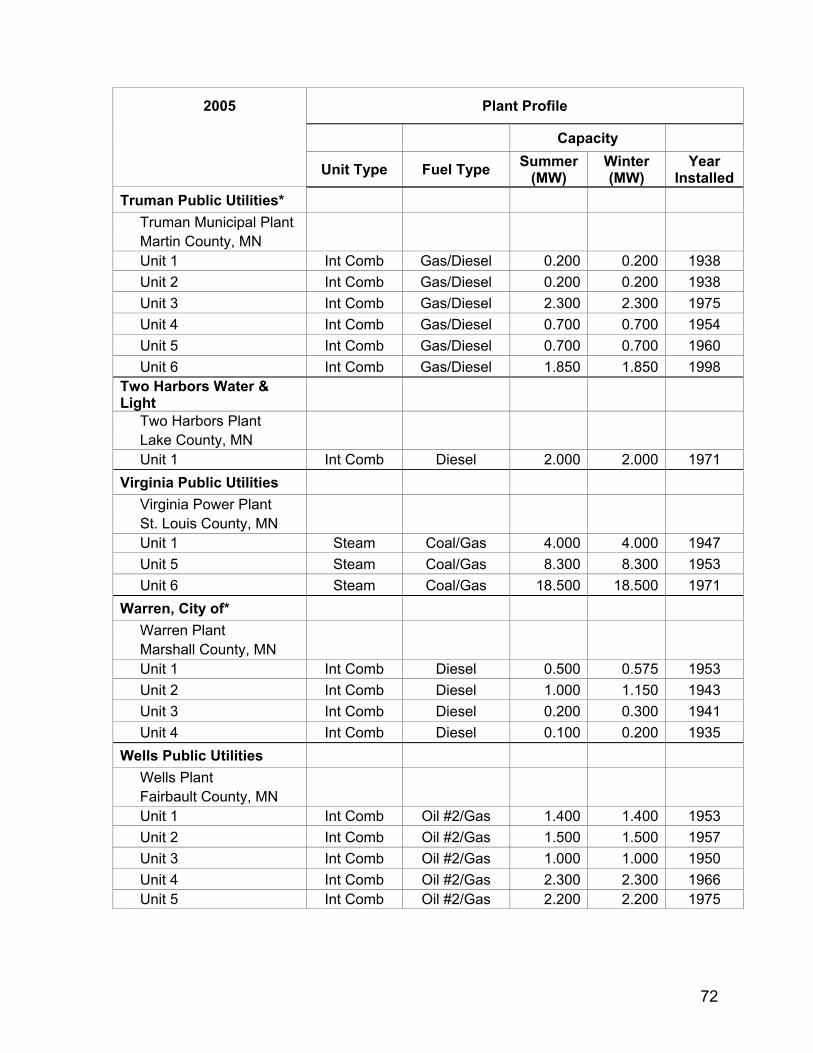
72
2005 Plant Profile
Capacity
Unit Type Fuel Type Summer (MW)
Winter (MW)
Year Installed
Truman Public Utilities* Truman Municipal Plant Martin County, MN Unit 1 Int Comb Gas/Diesel 0.200 0.200 1938 Unit 2 Int Comb Gas/Diesel 0.200 0.200 1938 Unit 3 Int Comb Gas/Diesel 2.300 2.300 1975 Unit 4 Int Comb Gas/Diesel 0.700 0.700 1954 Unit 5 Int Comb Gas/Diesel 0.700 0.700 1960 Unit 6 Int Comb Gas/Diesel 1.850 1.850 1998
Two Harbors Water & Light
Two Harbors Plant Lake County, MN Unit 1 Int Comb Diesel 2.000 2.000 1971
Virginia Public Utilities Virginia Power Plant St. Louis County, MN Unit 1 Steam Coal/Gas 4.000 4.000 1947 Unit 5 Steam Coal/Gas 8.300 8.300 1953 Unit 6 Steam Coal/Gas 18.500 18.500 1971
Warren, City of* Warren Plant Marshall County, MN Unit 1 Int Comb Diesel 0.500 0.575 1953 Unit 2 Int Comb Diesel 1.000 1.150 1943 Unit 3 Int Comb Diesel 0.200 0.300 1941 Unit 4 Int Comb Diesel 0.100 0.200 1935
Wells Public Utilities Wells Plant Fairbault County, MN Unit 1 Int Comb Oil #2/Gas 1.400 1.400 1953 Unit 2 Int Comb Oil #2/Gas 1.500 1.500 1957 Unit 3 Int Comb Oil #2/Gas 1.000 1.000 1950 Unit 4 Int Comb Oil #2/Gas 2.300 2.300 1966 Unit 5 Int Comb Oil #2/Gas 2.200 2.200 1975
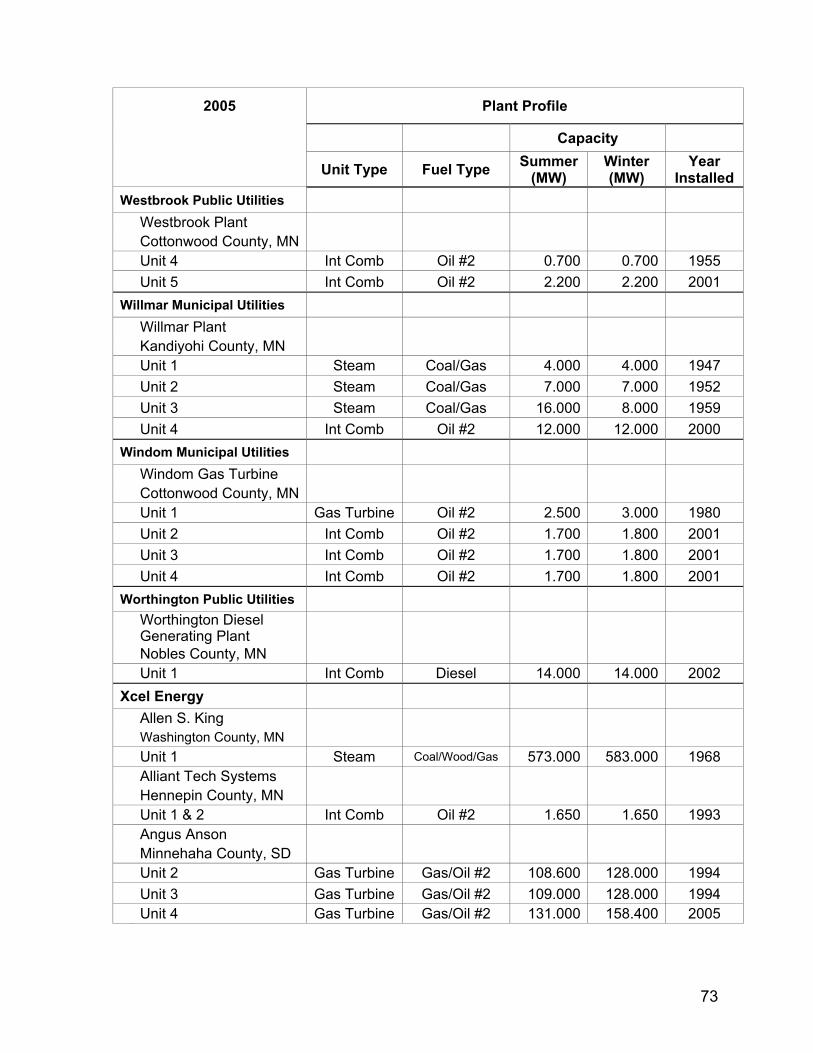
73
2005 Plant Profile
Capacity
Unit Type Fuel Type Summer (MW)
Winter (MW)
Year Installed
Westbrook Public Utilities Westbrook Plant Cottonwood County, MN Unit 4 Int Comb Oil #2 0.700 0.700 1955 Unit 5 Int Comb Oil #2 2.200 2.200 2001
Willmar Municipal Utilities Willmar Plant Kandiyohi County, MN Unit 1 Steam Coal/Gas 4.000 4.000 1947 Unit 2 Steam Coal/Gas 7.000 7.000 1952 Unit 3 Steam Coal/Gas 16.000 8.000 1959 Unit 4 Int Comb Oil #2 12.000 12.000 2000
Windom Municipal Utilities Windom Gas Turbine Cottonwood County, MN Unit 1 Gas Turbine Oil #2 2.500 3.000 1980 Unit 2 Int Comb Oil #2 1.700 1.800 2001 Unit 3 Int Comb Oil #2 1.700 1.800 2001 Unit 4 Int Comb Oil #2 1.700 1.800 2001
Worthington Public Utilities
Worthington Diesel Generating Plant
Nobles County, MN Unit 1 Int Comb Diesel 14.000 14.000 2002
Xcel Energy Allen S. King Washington County, MN Unit 1 Steam Coal/Wood/Gas 573.000 583.000 1968
Alliant Tech Systems Hennepin County, MN Unit 1 & 2 Int Comb Oil #2 1.650 1.650 1993
Angus Anson Minnehaha County, SD Unit 2 Gas Turbine Gas/Oil #2 108.600 128.000 1994 Unit 3 Gas Turbine Gas/Oil #2 109.000 128.000 1994 Unit 4 Gas Turbine Gas/Oil #2 131.000 158.400 2005
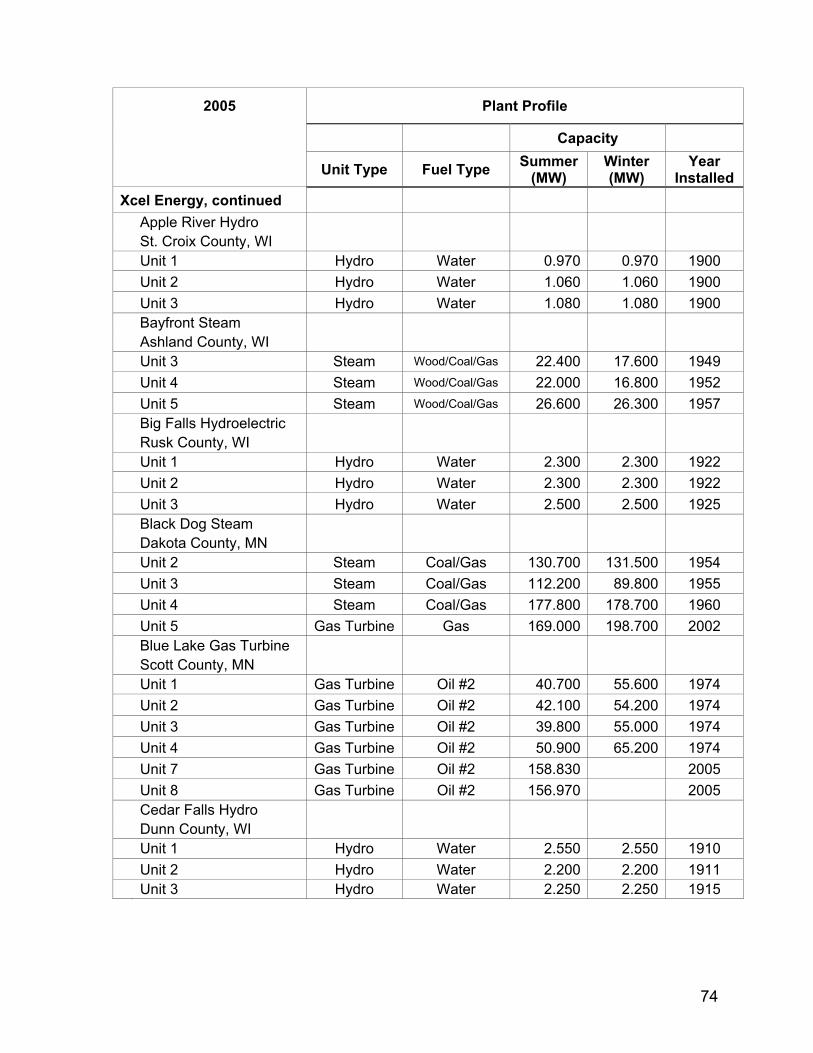
74
2005 Plant Profile
Capacity
Unit Type Fuel Type Summer (MW)
Winter (MW)
Year Installed
Xcel Energy, continued Apple River Hydro St. Croix County, WI Unit 1 Hydro Water 0.970 0.970 1900 Unit 2 Hydro Water 1.060 1.060 1900 Unit 3 Hydro Water 1.080 1.080 1900 Bayfront Steam Ashland County, WI Unit 3 Steam Wood/Coal/Gas 22.400 17.600 1949 Unit 4 Steam Wood/Coal/Gas 22.000 16.800 1952 Unit 5 Steam Wood/Coal/Gas 26.600 26.300 1957
Big Falls Hydroelectric Rusk County, WI Unit 1 Hydro Water 2.300 2.300 1922 Unit 2 Hydro Water 2.300 2.300 1922 Unit 3 Hydro Water 2.500 2.500 1925
Black Dog Steam Dakota County, MN Unit 2 Steam Coal/Gas 130.700 131.500 1954 Unit 3 Steam Coal/Gas 112.200 89.800 1955 Unit 4 Steam Coal/Gas 177.800 178.700 1960 Unit 5 Gas Turbine Gas 169.000 198.700 2002
Blue Lake Gas Turbine Scott County, MN Unit 1 Gas Turbine Oil #2 40.700 55.600 1974 Unit 2 Gas Turbine Oil #2 42.100 54.200 1974 Unit 3 Gas Turbine Oil #2 39.800 55.000 1974 Unit 4 Gas Turbine Oil #2 50.900 65.200 1974 Unit 7 Gas Turbine Oil #2 158.830 2005 Unit 8 Gas Turbine Oil #2 156.970 2005
Cedar Falls Hydro Dunn County, WI Unit 1 Hydro Water 2.550 2.550 1910 Unit 2 Hydro Water 2.200 2.200 1911 Unit 3 Hydro Water 2.250 2.250 1915
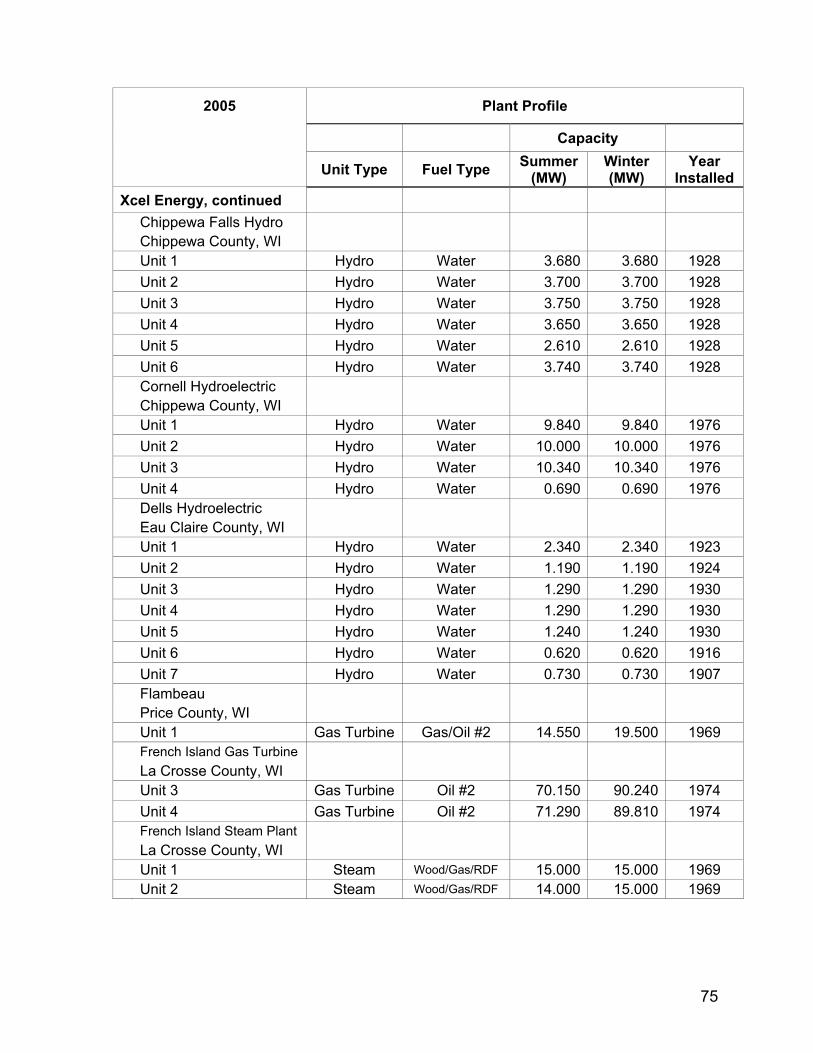
75
2005 Plant Profile
Capacity
Unit Type Fuel Type Summer (MW)
Winter (MW)
Year Installed
Xcel Energy, continued Chippewa Falls Hydro Chippewa County, WI Unit 1 Hydro Water 3.680 3.680 1928 Unit 2 Hydro Water 3.700 3.700 1928 Unit 3 Hydro Water 3.750 3.750 1928 Unit 4 Hydro Water 3.650 3.650 1928 Unit 5 Hydro Water 2.610 2.610 1928 Unit 6 Hydro Water 3.740 3.740 1928
Cornell Hydroelectric Chippewa County, WI Unit 1 Hydro Water 9.840 9.840 1976 Unit 2 Hydro Water 10.000 10.000 1976 Unit 3 Hydro Water 10.340 10.340 1976 Unit 4 Hydro Water 0.690 0.690 1976
Dells Hydroelectric Eau Claire County, WI Unit 1 Hydro Water 2.340 2.340 1923 Unit 2 Hydro Water 1.190 1.190 1924 Unit 3 Hydro Water 1.290 1.290 1930 Unit 4 Hydro Water 1.290 1.290 1930 Unit 5 Hydro Water 1.240 1.240 1930 Unit 6 Hydro Water 0.620 0.620 1916 Unit 7 Hydro Water 0.730 0.730 1907
Flambeau Price County, WI Unit 1 Gas Turbine Gas/Oil #2 14.550 19.500 1969
French Island Gas Turbine La Crosse County, WI Unit 3 Gas Turbine Oil #2 70.150 90.240 1974 Unit 4 Gas Turbine Oil #2 71.290 89.810 1974
French Island Steam Plant La Crosse County, WI Unit 1 Steam Wood/Gas/RDF 15.000 15.000 1969 Unit 2 Steam Wood/Gas/RDF 14.000 15.000 1969
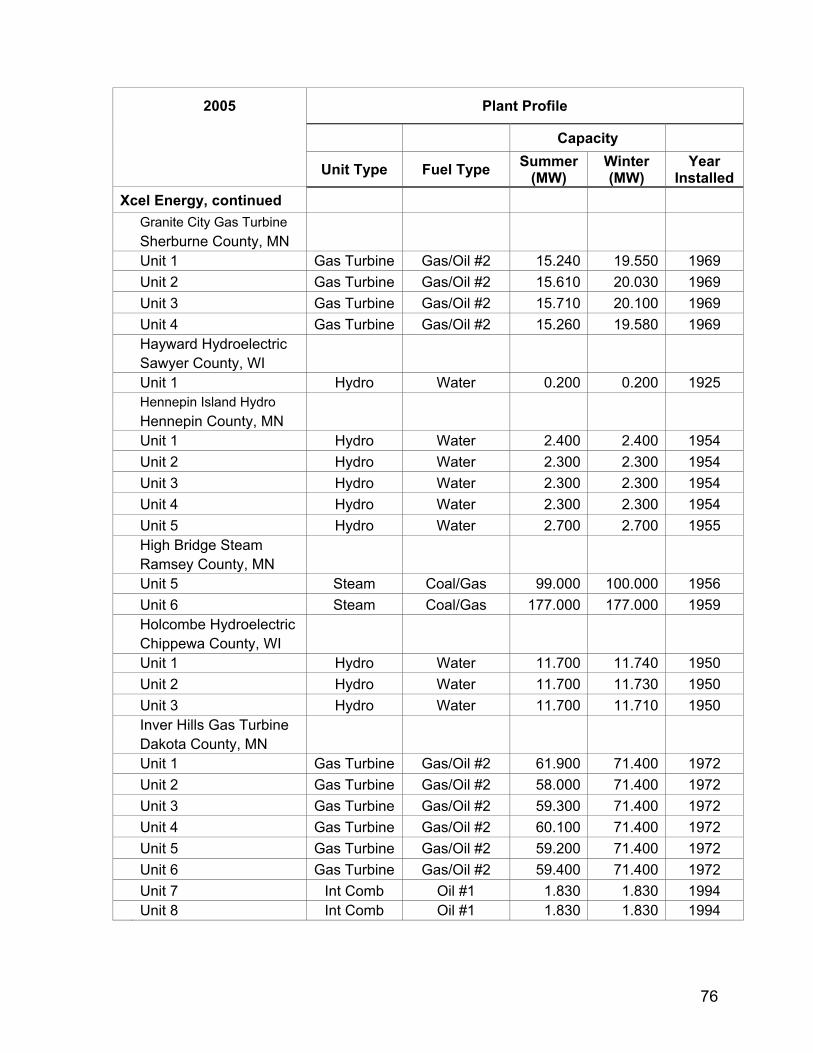
76
2005 Plant Profile
Capacity
Unit Type Fuel Type Summer (MW)
Winter (MW)
Year Installed
Xcel Energy, continued Granite City Gas Turbine Sherburne County, MN Unit 1 Gas Turbine Gas/Oil #2 15.240 19.550 1969 Unit 2 Gas Turbine Gas/Oil #2 15.610 20.030 1969 Unit 3 Gas Turbine Gas/Oil #2 15.710 20.100 1969 Unit 4 Gas Turbine Gas/Oil #2 15.260 19.580 1969
Hayward Hydroelectric Sawyer County, WI Unit 1 Hydro Water 0.200 0.200 1925
Hennepin Island Hydro Hennepin County, MN Unit 1 Hydro Water 2.400 2.400 1954 Unit 2 Hydro Water 2.300 2.300 1954 Unit 3 Hydro Water 2.300 2.300 1954 Unit 4 Hydro Water 2.300 2.300 1954 Unit 5 Hydro Water 2.700 2.700 1955
High Bridge Steam Ramsey County, MN Unit 5 Steam Coal/Gas 99.000 100.000 1956 Unit 6 Steam Coal/Gas 177.000 177.000 1959
Holcombe Hydroelectric Chippewa County, WI Unit 1 Hydro Water 11.700 11.740 1950 Unit 2 Hydro Water 11.700 11.730 1950 Unit 3 Hydro Water 11.700 11.710 1950
Inver Hills Gas Turbine Dakota County, MN Unit 1 Gas Turbine Gas/Oil #2 61.900 71.400 1972 Unit 2 Gas Turbine Gas/Oil #2 58.000 71.400 1972 Unit 3 Gas Turbine Gas/Oil #2 59.300 71.400 1972 Unit 4 Gas Turbine Gas/Oil #2 60.100 71.400 1972 Unit 5 Gas Turbine Gas/Oil #2 59.200 71.400 1972 Unit 6 Gas Turbine Gas/Oil #2 59.400 71.400 1972 Unit 7 Int Comb Oil #1 1.830 1.830 1994 Unit 8 Int Comb Oil #1 1.830 1.830 1994
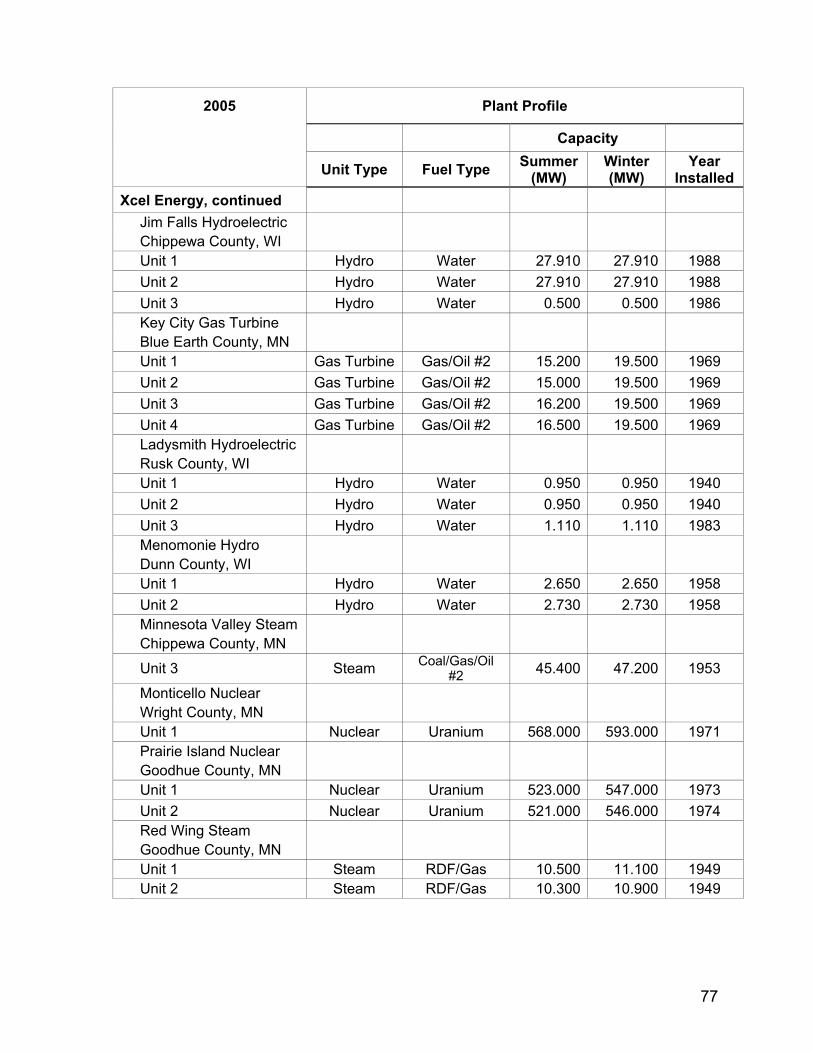
77
2005 Plant Profile
Capacity
Unit Type Fuel Type Summer (MW)
Winter (MW)
Year Installed
Xcel Energy, continued Jim Falls Hydroelectric Chippewa County, WI Unit 1 Hydro Water 27.910 27.910 1988 Unit 2 Hydro Water 27.910 27.910 1988 Unit 3 Hydro Water 0.500 0.500 1986
Key City Gas Turbine Blue Earth County, MN Unit 1 Gas Turbine Gas/Oil #2 15.200 19.500 1969 Unit 2 Gas Turbine Gas/Oil #2 15.000 19.500 1969 Unit 3 Gas Turbine Gas/Oil #2 16.200 19.500 1969 Unit 4 Gas Turbine Gas/Oil #2 16.500 19.500 1969
Ladysmith Hydroelectric Rusk County, WI Unit 1 Hydro Water 0.950 0.950 1940 Unit 2 Hydro Water 0.950 0.950 1940 Unit 3 Hydro Water 1.110 1.110 1983
Menomonie Hydro Dunn County, WI Unit 1 Hydro Water 2.650 2.650 1958 Unit 2 Hydro Water 2.730 2.730 1958
Minnesota Valley Steam Chippewa County, MN
Unit 3 Steam Coal/Gas/Oil #2 45.400 47.200 1953
Monticello Nuclear Wright County, MN Unit 1 Nuclear Uranium 568.000 593.000 1971
Prairie Island Nuclear Goodhue County, MN Unit 1 Nuclear Uranium 523.000 547.000 1973 Unit 2 Nuclear Uranium 521.000 546.000 1974
Red Wing Steam Goodhue County, MN Unit 1 Steam RDF/Gas 10.500 11.100 1949 Unit 2 Steam RDF/Gas 10.300 10.900 1949
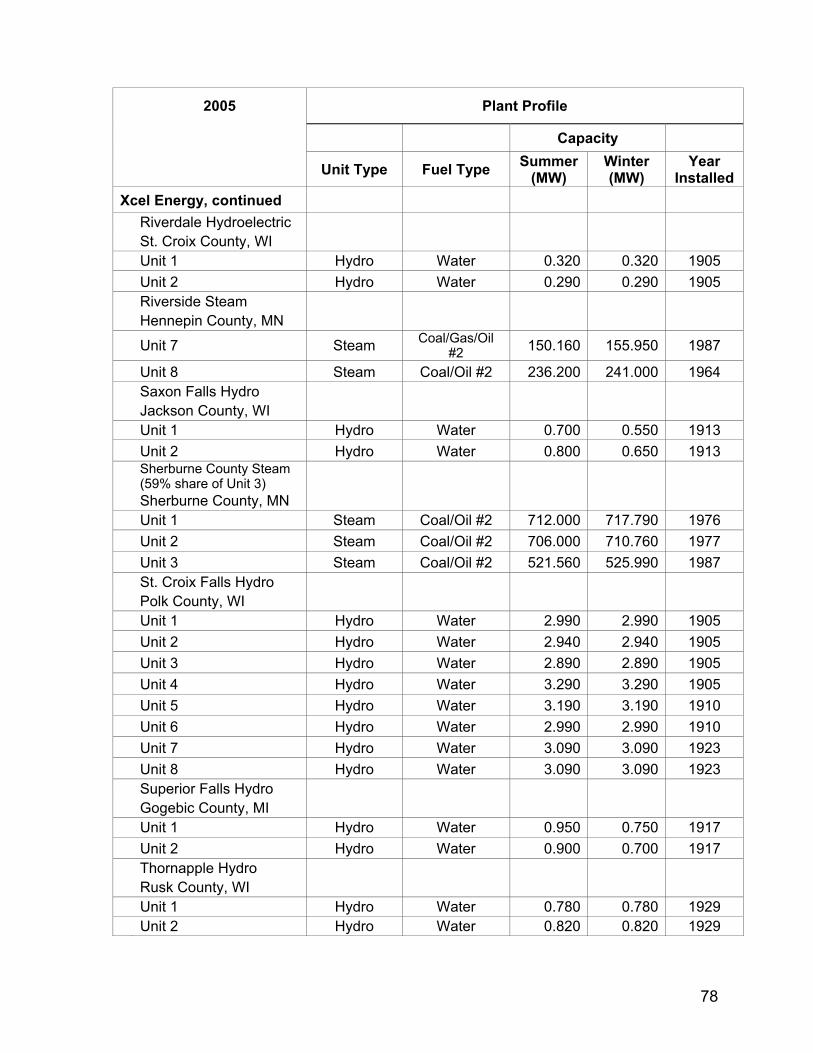
78
2005 Plant Profile
Capacity
Unit Type Fuel Type Summer (MW)
Winter (MW)
Year Installed
Xcel Energy, continued Riverdale Hydroelectric St. Croix County, WI Unit 1 Hydro Water 0.320 0.320 1905 Unit 2 Hydro Water 0.290 0.290 1905
Riverside Steam Hennepin County, MN
Unit 7 Steam Coal/Gas/Oil #2 150.160 155.950 1987
Unit 8 Steam Coal/Oil #2 236.200 241.000 1964 Saxon Falls Hydro Jackson County, WI Unit 1 Hydro Water 0.700 0.550 1913 Unit 2 Hydro Water 0.800 0.650 1913
Sherburne County Steam (59% share of Unit 3)
Sherburne County, MN Unit 1 Steam Coal/Oil #2 712.000 717.790 1976 Unit 2 Steam Coal/Oil #2 706.000 710.760 1977 Unit 3 Steam Coal/Oil #2 521.560 525.990 1987
St. Croix Falls Hydro Polk County, WI Unit 1 Hydro Water 2.990 2.990 1905 Unit 2 Hydro Water 2.940 2.940 1905 Unit 3 Hydro Water 2.890 2.890 1905 Unit 4 Hydro Water 3.290 3.290 1905 Unit 5 Hydro Water 3.190 3.190 1910 Unit 6 Hydro Water 2.990 2.990 1910 Unit 7 Hydro Water 3.090 3.090 1923 Unit 8 Hydro Water 3.090 3.090 1923
Superior Falls Hydro Gogebic County, MI Unit 1 Hydro Water 0.950 0.750 1917 Unit 2 Hydro Water 0.900 0.700 1917
Thornapple Hydro Rusk County, WI Unit 1 Hydro Water 0.780 0.780 1929 Unit 2 Hydro Water 0.820 0.820 1929
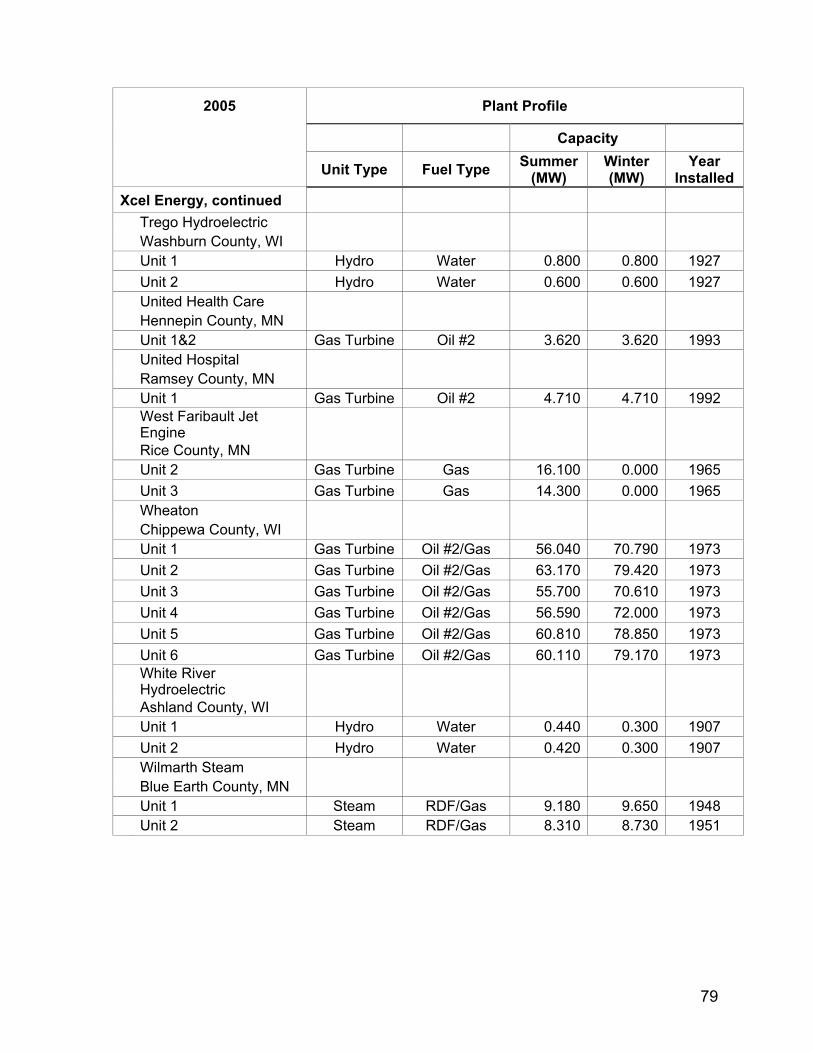
79
2005 Plant Profile
Capacity
Unit Type Fuel Type Summer (MW)
Winter (MW)
Year Installed
Xcel Energy, continued Trego Hydroelectric Washburn County, WI Unit 1 Hydro Water 0.800 0.800 1927 Unit 2 Hydro Water 0.600 0.600 1927
United Health Care Hennepin County, MN Unit 1&2 Gas Turbine Oil #2 3.620 3.620 1993
United Hospital Ramsey County, MN Unit 1 Gas Turbine Oil #2 4.710 4.710 1992
West Faribault Jet Engine
Rice County, MN Unit 2 Gas Turbine Gas 16.100 0.000 1965 Unit 3 Gas Turbine Gas 14.300 0.000 1965
Wheaton Chippewa County, WI Unit 1 Gas Turbine Oil #2/Gas 56.040 70.790 1973 Unit 2 Gas Turbine Oil #2/Gas 63.170 79.420 1973 Unit 3 Gas Turbine Oil #2/Gas 55.700 70.610 1973 Unit 4 Gas Turbine Oil #2/Gas 56.590 72.000 1973 Unit 5 Gas Turbine Oil #2/Gas 60.810 78.850 1973 Unit 6 Gas Turbine Oil #2/Gas 60.110 79.170 1973
White River Hydroelectric
Ashland County, WI Unit 1 Hydro Water 0.440 0.300 1907 Unit 2 Hydro Water 0.420 0.300 1907
Wilmarth Steam Blue Earth County, MN Unit 1 Steam RDF/Gas 9.180 9.650 1948 Unit 2 Steam RDF/Gas 8.310 8.730 1951
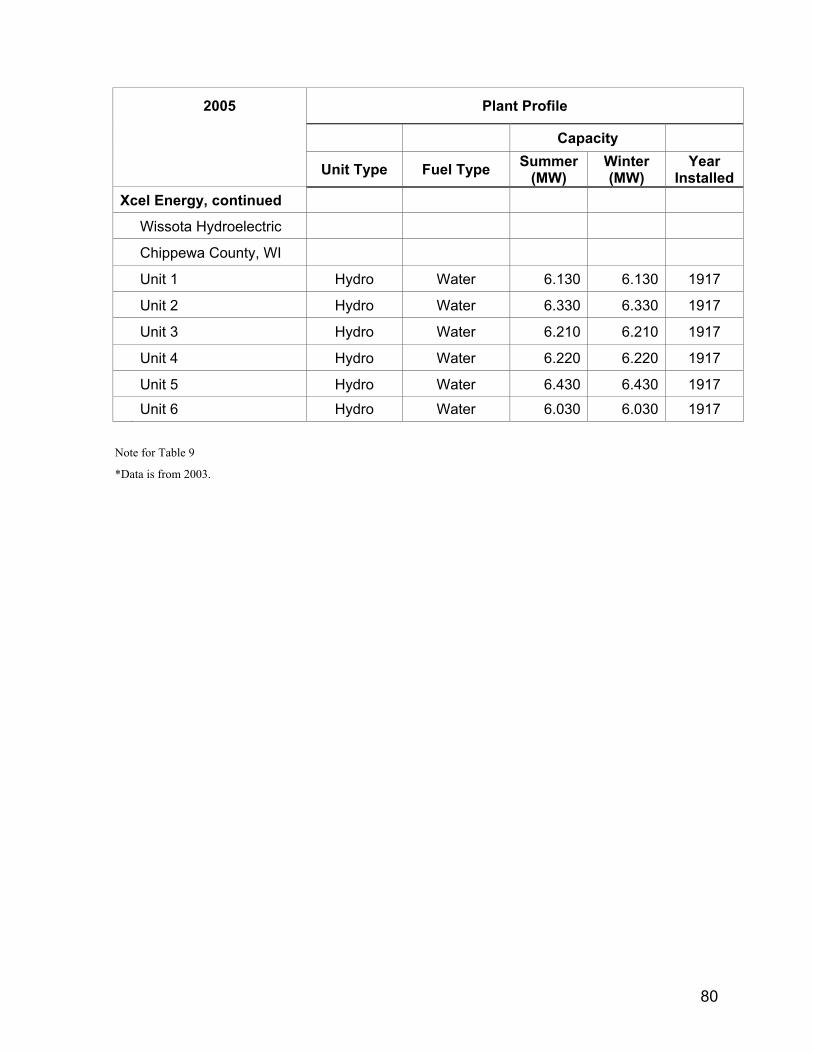
80
2005 Plant Profile
Capacity
Unit Type Fuel Type Summer (MW)
Winter (MW)
Year Installed
Xcel Energy, continued
Wissota Hydroelectric
Chippewa County, WI
Unit 1 Hydro Water 6.130 6.130 1917
Unit 2 Hydro Water 6.330 6.330 1917
Unit 3 Hydro Water 6.210 6.210 1917
Unit 4 Hydro Water 6.220 6.220 1917
Unit 5 Hydro Water 6.430 6.430 1917
Unit 6 Hydro Water 6.030 6.030 1917 Note for Table 9
*Data is from 2003.
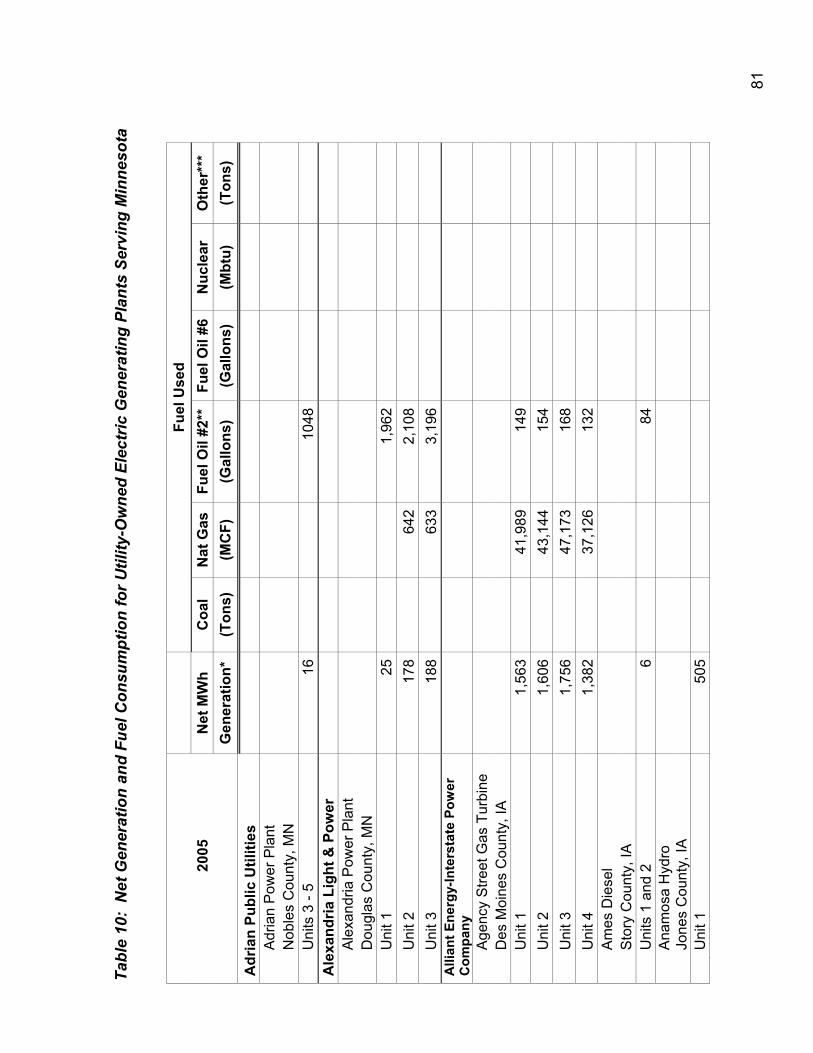
81
Tabl
e 10
: N
et G
ener
atio
n an
d Fu
el C
onsu
mpt
ion
for U
tility
-Ow
ned
Elec
tric
Gen
erat
ing
Plan
ts S
ervi
ng M
inne
sota
Fuel
Use
d
2005
N
et M
Wh
Coa
l N
at G
as
Fuel
Oil
#2**
Fu
el O
il #6
Nuc
lear
O
ther
***
Gen
erat
ion*
(T
ons)
(M
CF)
(G
allo
ns)
(Gal
lons
) (M
btu)
(T
ons)
A
dria
n Pu
blic
Util
ities
A
dria
n P
ower
Pla
nt
Nob
les
Cou
nty,
MN
U
nits
3 -
5 16
1048
Ale
xand
ria L
ight
& P
ower
A
lexa
ndria
Pow
er P
lant
D
ougl
as C
ount
y, M
N
Uni
t 1
251,
962
U
nit 2
17
864
22,
108
U
nit 3
18
863
33,
196
Alli
ant E
nerg
y-In
ters
tate
Pow
er
Com
pany
A
genc
y S
treet
Gas
Tur
bine
D
es M
oine
s C
ount
y, IA
U
nit 1
1,
563
41,9
8914
9
Uni
t 2
1,60
643
,144
154
U
nit 3
1,
756
47,1
7316
8
Uni
t 4
1,38
237
,126
132
A
mes
Die
sel
Sto
ry C
ount
y, IA
U
nits
1 a
nd 2
6
84
A
nam
osa
Hyd
ro
Jone
s C
ount
y, IA
U
nit 1
50
5
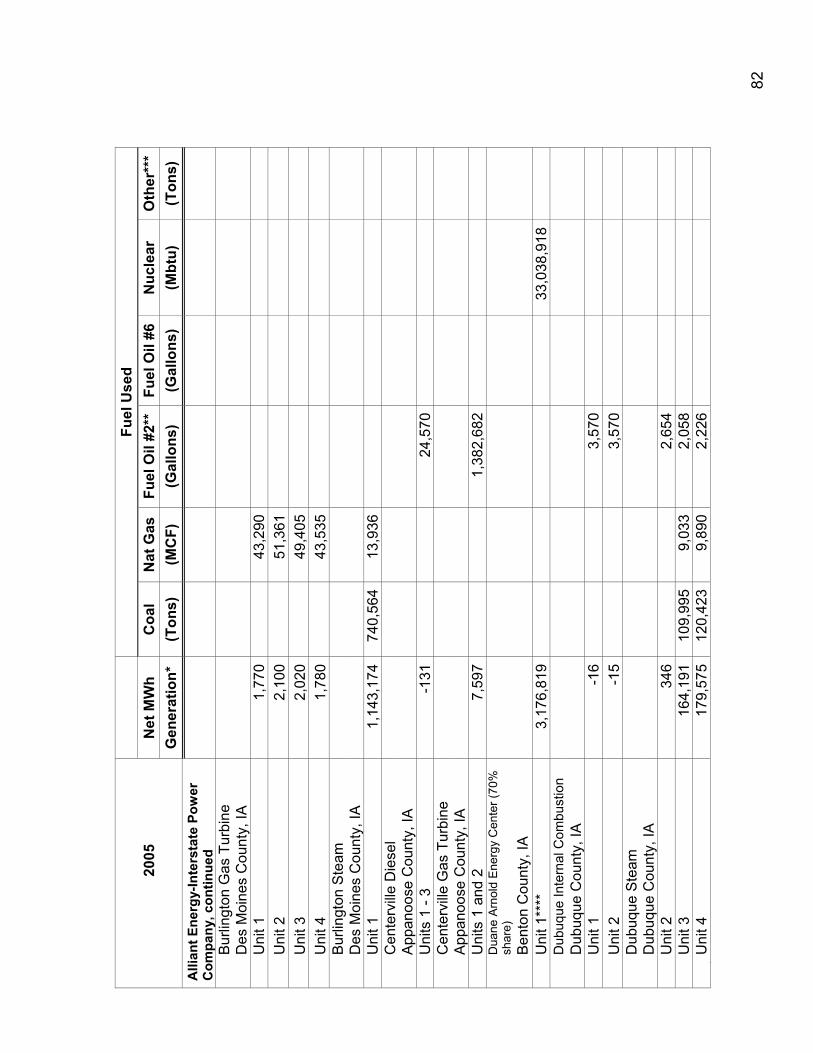
82
Fuel
Use
d
2005
N
et M
Wh
Coa
l N
at G
as
Fuel
Oil
#2**
Fu
el O
il #6
Nuc
lear
O
ther
***
Gen
erat
ion*
(T
ons)
(M
CF)
(G
allo
ns)
(Gal
lons
) (M
btu)
(T
ons)
A
llian
t Ene
rgy-
Inte
rsta
te P
ower
C
ompa
ny, c
ontin
ued
B
urlin
gton
Gas
Tur
bine
D
es M
oine
s C
ount
y, IA
U
nit 1
1,
770
43,2
90
U
nit 2
2,
100
51,3
61
U
nit 3
2,
020
49,4
05
U
nit 4
1,
780
43,5
35
B
urlin
gton
Ste
am
Des
Moi
nes
Cou
nty,
IA
Uni
t 1
1,14
3,17
474
0,56
413
,936
Cen
terv
ille
Die
sel
App
anoo
se C
ount
y, IA
U
nits
1 -
3 -1
3124
,570
Cen
terv
ille
Gas
Tur
bine
A
ppan
oose
Cou
nty,
IA
Uni
ts 1
and
2
7,59
71,
382,
682
D
uane
Arn
old
Ener
gy C
ente
r (70
%
shar
e)
Ben
ton
Cou
nty,
IA
Uni
t 1**
**
3,17
6,81
9
33,0
38,9
18
Dub
uque
Inte
rnal
Com
bust
ion
Dub
uque
Cou
nty,
IA
Uni
t 1
-16
3,
570
U
nit 2
-1
53,
570
D
ubuq
ue S
team
D
ubuq
ue C
ount
y, IA
U
nit 2
34
6
2,
654
U
nit 3
16
4,19
110
9,99
59,
033
2,05
8
Uni
t 4
179,
575
120,
423
9,89
02,
226
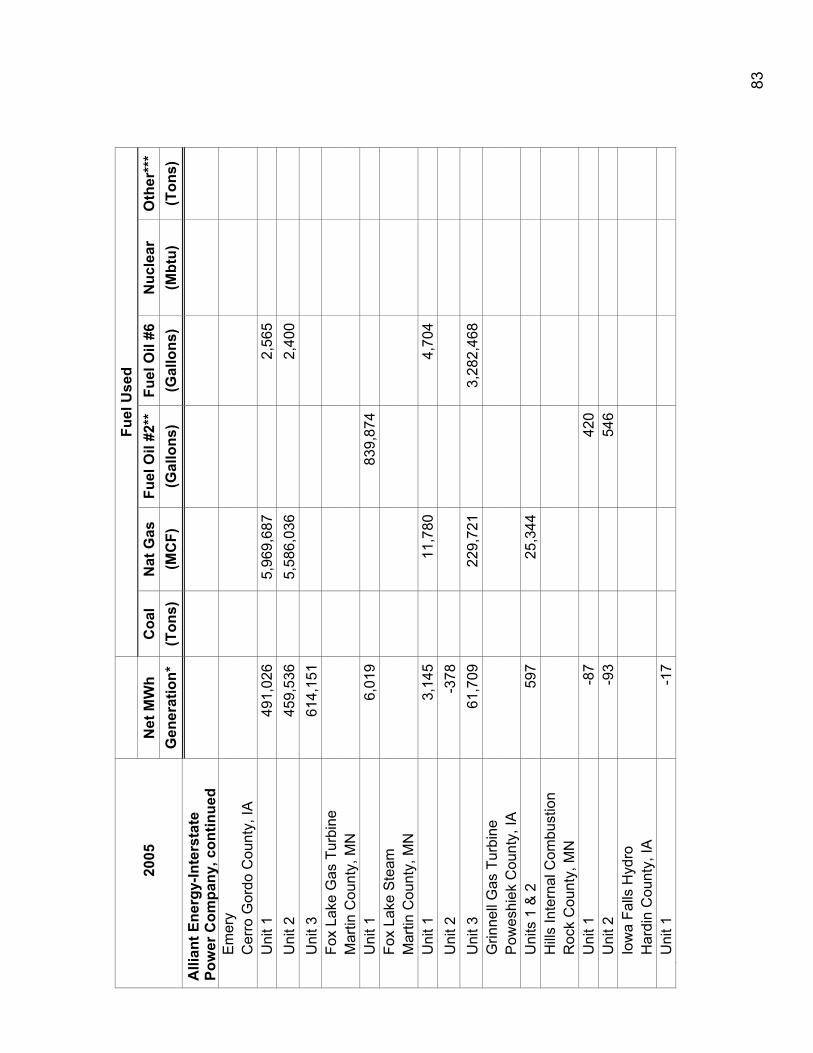
83
Fuel
Use
d
2005
N
et M
Wh
Coa
l N
at G
as
Fuel
Oil
#2**
Fu
el O
il #6
Nuc
lear
O
ther
***
Gen
erat
ion*
(T
ons)
(M
CF)
(G
allo
ns)
(Gal
lons
) (M
btu)
(T
ons)
A
llian
t Ene
rgy-
Inte
rsta
te
Pow
er C
ompa
ny, c
ontin
ued
E
mer
y
C
erro
Gor
do C
ount
y, IA
U
nit 1
49
1,02
65,
969,
687
2,
565
U
nit 2
45
9,53
65,
586,
036
2,
400
U
nit 3
61
4,15
1
Fo
x La
ke G
as T
urbi
ne
Mar
tin C
ount
y, M
N
Uni
t 1
6,01
983
9,87
4
Fox
Lake
Ste
am
Mar
tin C
ount
y, M
N
Uni
t 1
3,14
511
,780
4,
704
U
nit 2
-3
78
Uni
t 3
61,7
0922
9,72
1
3,28
2,46
8
Grin
nell
Gas
Tur
bine
P
owes
hiek
Cou
nty,
IA
Uni
ts 1
& 2
59
725
,344
Hill
s In
tern
al C
ombu
stio
n
R
ock
Cou
nty,
MN
U
nit 1
-8
742
0
Uni
t 2
-93
546
Io
wa
Falls
Hyd
ro
Har
din
Cou
nty,
IA
Uni
t 1
-17
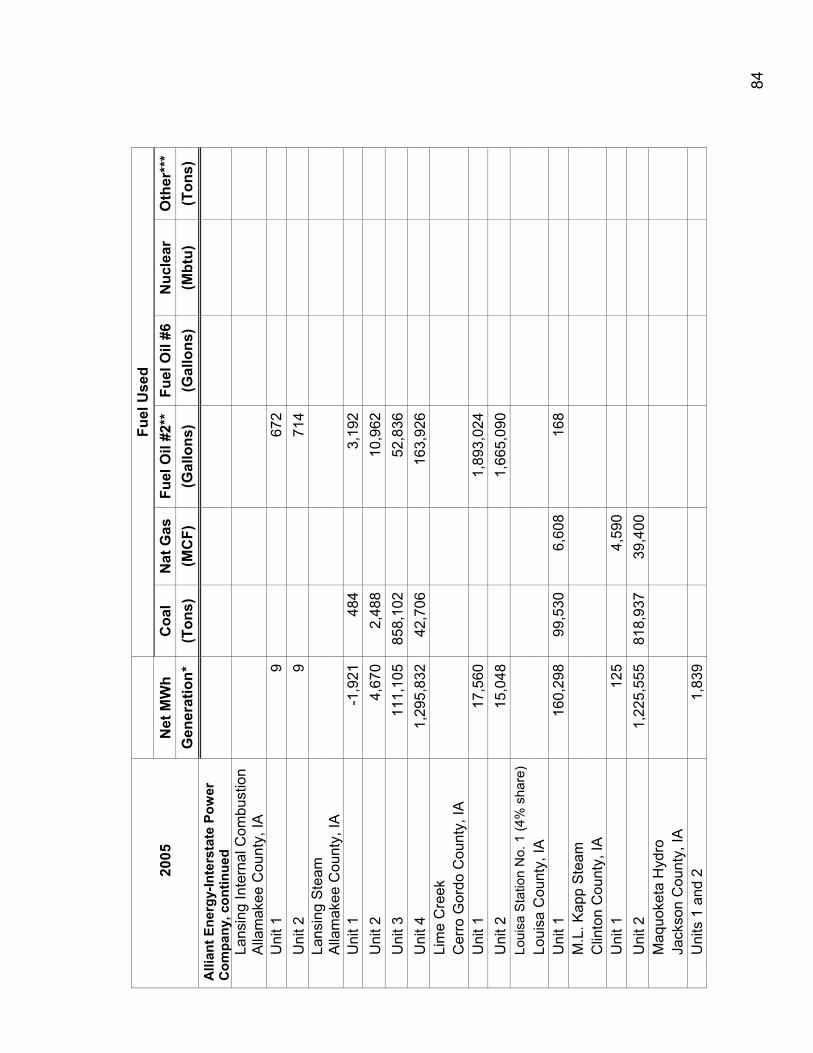
84
Fu
el U
sed
20
05
Net
MW
h C
oal
Nat
Gas
Fu
el O
il #2
**
Fuel
Oil
#6N
ucle
ar
Oth
er**
*
G
ener
atio
n*
(Ton
s)
(MC
F)
(Gal
lons
) (G
allo
ns)
(Mbt
u)
(Ton
s)
Alli
ant E
nerg
y-In
ters
tate
Pow
er
Com
pany
, con
tinue
d
La
nsin
g In
tern
al C
ombu
stio
n
A
llam
akee
Cou
nty,
IA
Uni
t 1
967
2
Uni
t 2
971
4
Lans
ing
Ste
am
Alla
mak
ee C
ount
y, IA
U
nit 1
-1
,921
484
3,19
2
U
nit 2
4,
670
2,48
810
,962
U
nit 3
11
1,10
585
8,10
252
,836
U
nit 4
1,
295,
832
42,7
0616
3,92
6
Li
me
Cre
ek
Cer
ro G
ordo
Cou
nty,
IA
Uni
t 1
17,5
601,
893,
024
U
nit 2
15
,048
1,66
5,09
0
Loui
sa S
tatio
n N
o. 1
(4%
sha
re)
Loui
sa C
ount
y, IA
U
nit 1
16
0,29
899
,530
6,60
816
8
M.L
. Kap
p S
team
C
linto
n C
ount
y, IA
U
nit 1
12
54,
590
Uni
t 2
1,22
5,55
581
8,93
739
,400
Maq
uoke
ta H
ydro
Ja
ckso
n C
ount
y, IA
U
nits
1 a
nd 2
1,
839
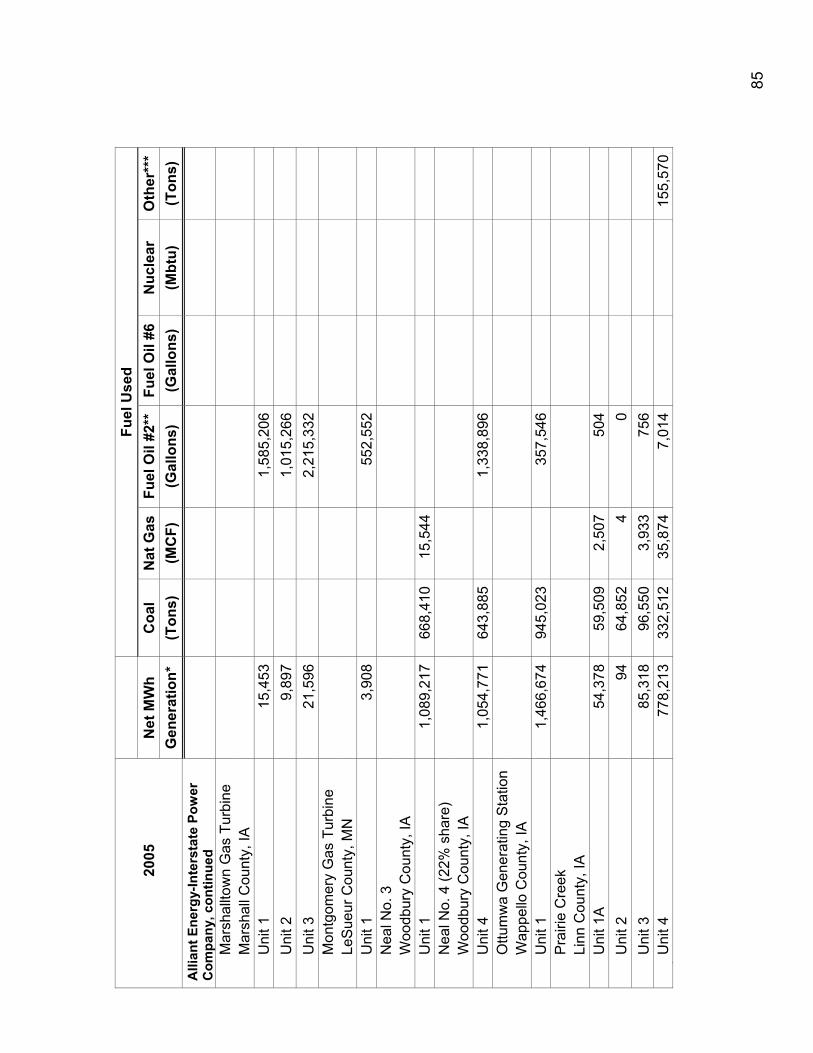
85
Fuel
Use
d
2005
N
et M
Wh
Coa
l N
at G
as
Fuel
Oil
#2**
Fu
el O
il #6
Nuc
lear
O
ther
***
Gen
erat
ion*
(T
ons)
(M
CF)
(G
allo
ns)
(Gal
lons
) (M
btu)
(T
ons)
A
llian
t Ene
rgy-
Inte
rsta
te P
ower
C
ompa
ny, c
ontin
ued
M
arsh
allto
wn
Gas
Tur
bine
M
arsh
all C
ount
y, IA
U
nit 1
15
,453
1,58
5,20
6
Uni
t 2
9,89
71,
015,
266
U
nit 3
21
,596
2,21
5,33
2
Mon
tgom
ery
Gas
Tur
bine
Le
Sue
ur C
ount
y, M
N
Uni
t 1
3,90
855
2,55
2
Nea
l No.
3
Woo
dbur
y C
ount
y, IA
U
nit 1
1,
089,
217
668,
410
15,5
44
N
eal N
o. 4
(22%
sha
re)
Woo
dbur
y C
ount
y, IA
U
nit 4
1,
054,
771
643,
885
1,33
8,89
6
Ottu
mw
a G
ener
atin
g S
tatio
n
W
appe
llo C
ount
y, IA
U
nit 1
1,
466,
674
945,
023
357,
546
Pra
irie
Cre
ek
Linn
Cou
nty,
IA
Uni
t 1A
54
,378
59,5
092,
507
504
U
nit 2
94
64,8
524
0
Uni
t 3
85,3
1896
,550
3,93
375
6
Uni
t 4
778,
213
332,
512
35,8
747,
014
155,
570
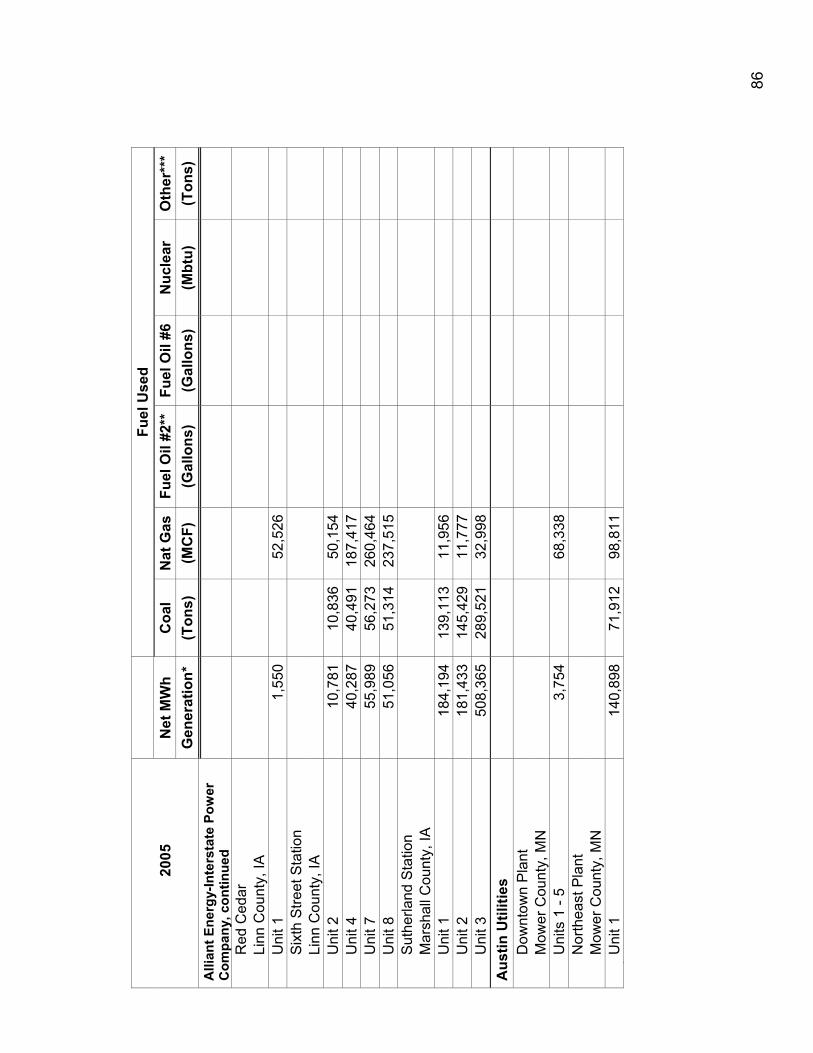
86
Fu
el U
sed
20
05
Net
MW
h C
oal
Nat
Gas
Fu
el O
il #2
**
Fuel
Oil
#6N
ucle
ar
Oth
er**
*
G
ener
atio
n*
(Ton
s)
(MC
F)
(Gal
lons
) (G
allo
ns)
(Mbt
u)
(Ton
s)
Alli
ant E
nerg
y-In
ters
tate
Pow
er
Com
pany
, con
tinue
d
R
ed C
edar
Li
nn C
ount
y, IA
U
nit 1
1,
550
52,5
26
S
ixth
Stre
et S
tatio
n
Li
nn C
ount
y, IA
U
nit 2
10
,781
10,8
3650
,154
U
nit 4
40
,287
40,4
9118
7,41
7
Uni
t 7
55,9
8956
,273
260,
464
U
nit 8
51
,056
51,3
1423
7,51
5
Sut
herla
nd S
tatio
n
M
arsh
all C
ount
y, IA
U
nit 1
18
4,19
413
9,11
311
,956
Uni
t 2
181,
433
145,
429
11,7
77
U
nit 3
50
8,36
528
9,52
132
,998
A
ustin
Util
ities
D
ownt
own
Pla
nt
Mow
er C
ount
y, M
N
Uni
ts 1
- 5
3,75
468
,338
Nor
thea
st P
lant
M
ower
Cou
nty,
MN
U
nit 1
14
0,89
871
,912
98,8
11
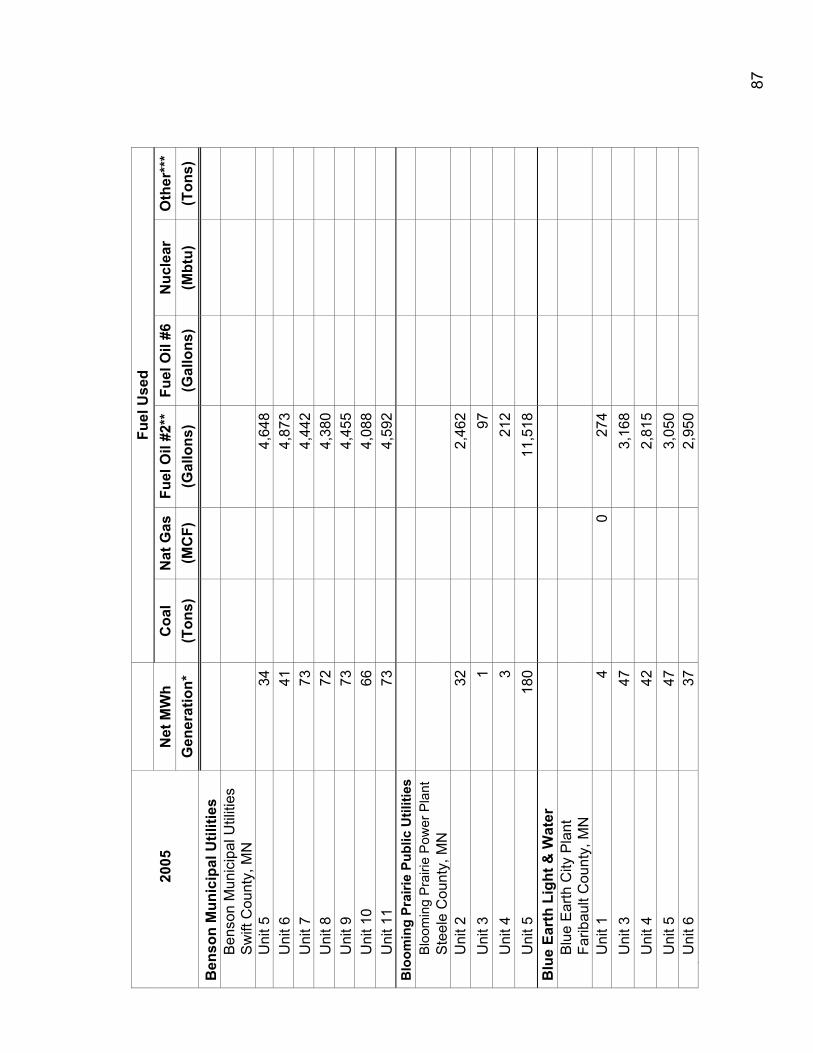
87
Fu
el U
sed
20
05
Net
MW
h C
oal
Nat
Gas
Fu
el O
il #2
**
Fuel
Oil
#6N
ucle
ar
Oth
er**
*
G
ener
atio
n*
(Ton
s)
(MC
F)
(Gal
lons
) (G
allo
ns)
(Mbt
u)
(Ton
s)
Ben
son
Mun
icip
al U
tiliti
es
Ben
son
Mun
icip
al U
tiliti
es
Sw
ift C
ount
y, M
N
Uni
t 5
344,
648
U
nit 6
41
4,87
3
Uni
t 7
734,
442
U
nit 8
72
4,38
0
Uni
t 9
734,
455
U
nit 1
0 66
4,08
8
Uni
t 11
734,
592
Blo
omin
g Pr
airie
Pub
lic U
tiliti
es
Blo
omin
g P
rairi
e P
ower
Pla
nt
Ste
ele
Cou
nty,
MN
U
nit 2
32
2,46
2
Uni
t 3
197
Uni
t 4
321
2
Uni
t 5
180
11,5
18
Blu
e Ea
rth
Ligh
t & W
ater
B
lue
Ear
th C
ity P
lant
Fa
ribau
lt C
ount
y, M
N
Uni
t 1
40
274
U
nit 3
47
3,16
8
Uni
t 4
422,
815
U
nit 5
47
3,05
0
Uni
t 6
372,
950
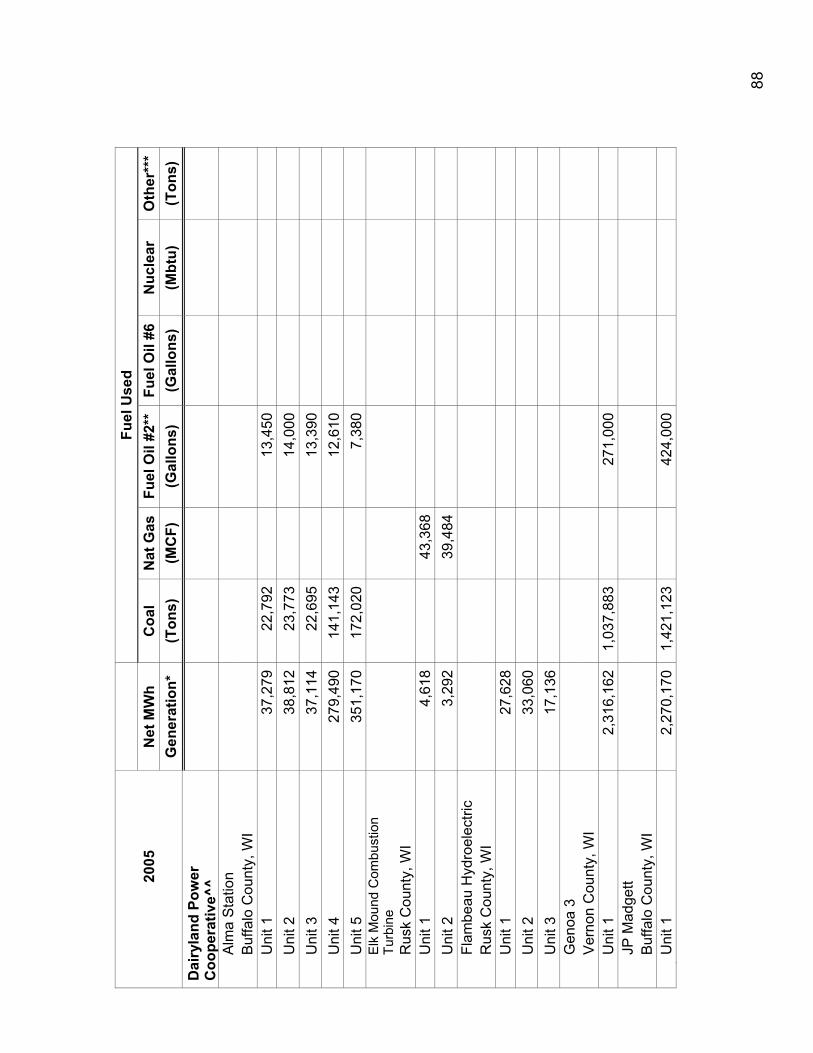
88
Fuel
Use
d
2005
N
et M
Wh
Coa
l N
at G
as
Fuel
Oil
#2**
Fu
el O
il #6
Nuc
lear
O
ther
***
Gen
erat
ion*
(T
ons)
(M
CF)
(G
allo
ns)
(Gal
lons
) (M
btu)
(T
ons)
D
airy
land
Pow
er
Coo
pera
tive^
^
A
lma
Sta
tion
Buf
falo
Cou
nty,
WI
Uni
t 1
37,2
7922
,792
13,4
50
U
nit 2
38
,812
23,7
7314
,000
Uni
t 3
37,1
1422
,695
13,3
90
U
nit 4
27
9,49
014
1,14
312
,610
Uni
t 5
351,
170
172,
020
7,38
0
E
lk M
ound
Com
bust
ion
Turb
ine
R
usk
Cou
nty,
WI
Uni
t 1
4,61
843
,368
Uni
t 2
3,29
239
,484
Flam
beau
Hyd
roel
ectri
c
R
usk
Cou
nty,
WI
Uni
t 1
27,6
28
U
nit 2
33
,060
Uni
t 3
17,1
36
G
enoa
3
Ver
non
Cou
nty,
WI
Uni
t 1
2,31
6,16
21,
037,
883
271,
000
JP
Mad
gett
Buf
falo
Cou
nty,
WI
Uni
t 1
2,27
0,17
01,
421,
123
424,
000
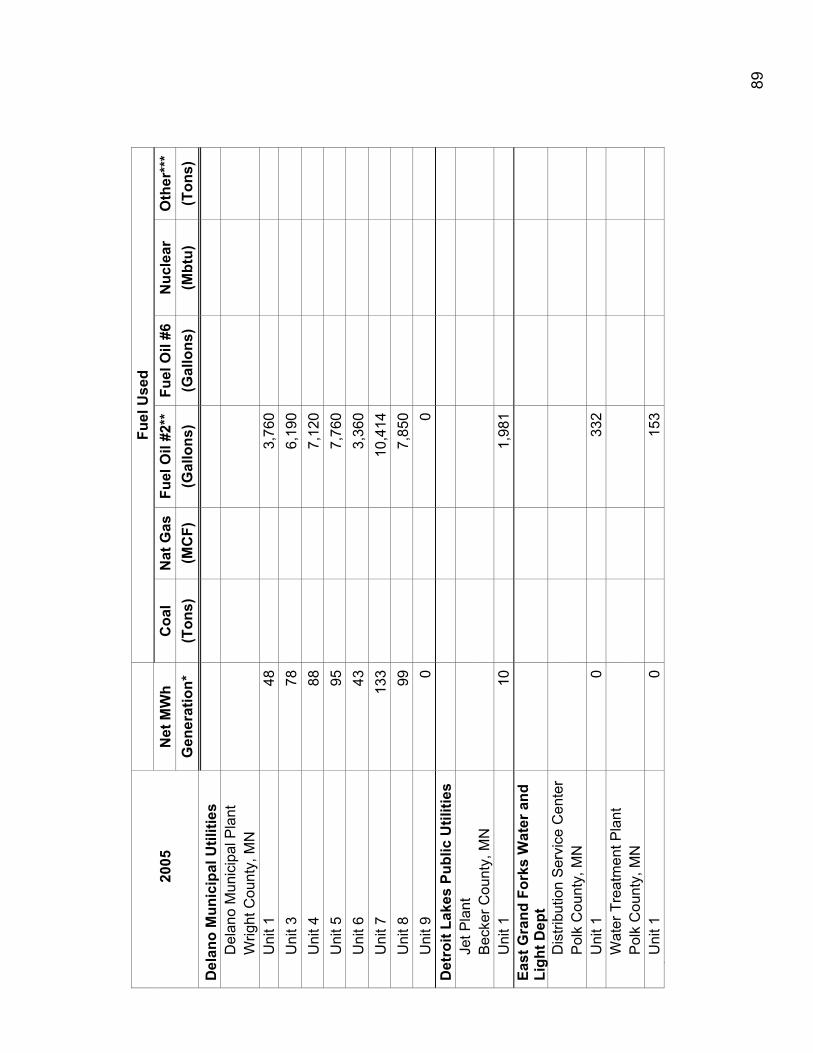
89
Fu
el U
sed
20
05
Net
MW
h C
oal
Nat
Gas
Fu
el O
il #2
**
Fuel
Oil
#6N
ucle
ar
Oth
er**
*
G
ener
atio
n*
(Ton
s)
(MC
F)
(Gal
lons
) (G
allo
ns)
(Mbt
u)
(Ton
s)
Del
ano
Mun
icip
al U
tiliti
es
Del
ano
Mun
icip
al P
lant
W
right
Cou
nty,
MN
U
nit 1
48
3,76
0
Uni
t 3
786,
190
U
nit 4
88
7,12
0
Uni
t 5
957,
760
U
nit 6
43
3,36
0
Uni
t 7
133
10,4
14
U
nit 8
99
7,85
0
Uni
t 9
00
Det
roit
Lake
s Pu
blic
Util
ities
Je
t Pla
nt
Bec
ker C
ount
y, M
N
Uni
t 1
101,
981
East
Gra
nd F
orks
Wat
er a
nd
Ligh
t Dep
t
D
istri
butio
n S
ervi
ce C
ente
r
P
olk
Cou
nty,
MN
U
nit 1
0
332
W
ater
Tre
atm
ent P
lant
P
olk
Cou
nty,
MN
U
nit 1
0
153
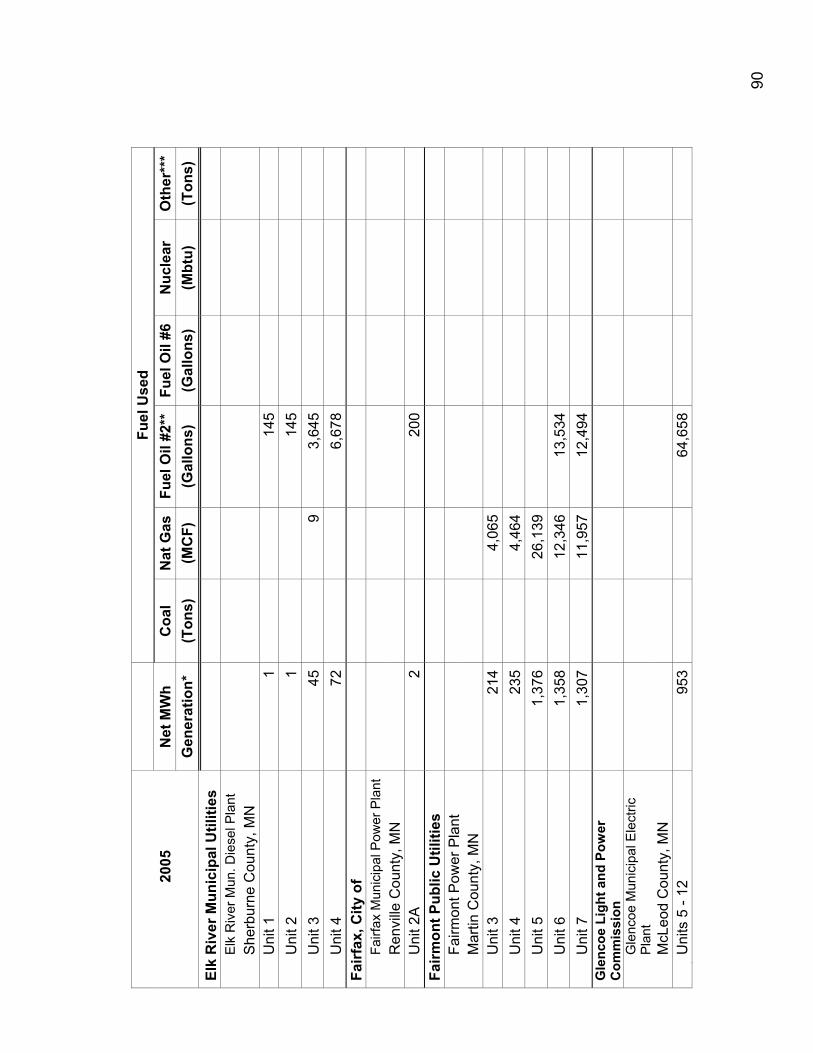
90
Fu
el U
sed
20
05
Net
MW
h C
oal
Nat
Gas
Fu
el O
il #2
**
Fuel
Oil
#6N
ucle
ar
Oth
er**
*
G
ener
atio
n*
(Ton
s)
(MC
F)
(Gal
lons
) (G
allo
ns)
(Mbt
u)
(Ton
s)
Elk
Riv
er M
unic
ipal
Util
ities
E
lk R
iver
Mun
. Die
sel P
lant
S
herb
urne
Cou
nty,
MN
U
nit 1
1
145
U
nit 2
1
145
U
nit 3
45
93,
645
U
nit 4
72
6,67
8 Fa
irfax
, City
of
Fairf
ax M
unic
ipal
Pow
er P
lant
R
envi
lle C
ount
y, M
N
Uni
t 2A
2
200
Fairm
ont P
ublic
Util
ities
Fa
irmon
t Pow
er P
lant
M
artin
Cou
nty,
MN
U
nit 3
21
44,
065
Uni
t 4
235
4,46
4
U
nit 5
1,
376
26,1
39
U
nit 6
1,
358
12,3
4613
,534
Uni
t 7
1,30
711
,957
12,4
94
Gle
ncoe
Lig
ht a
nd P
ower
C
omm
issi
on
G
lenc
oe M
unic
ipal
Ele
ctric
P
lant
M
cLeo
d C
ount
y, M
N
Uni
ts 5
- 12
95
3
64,6
58
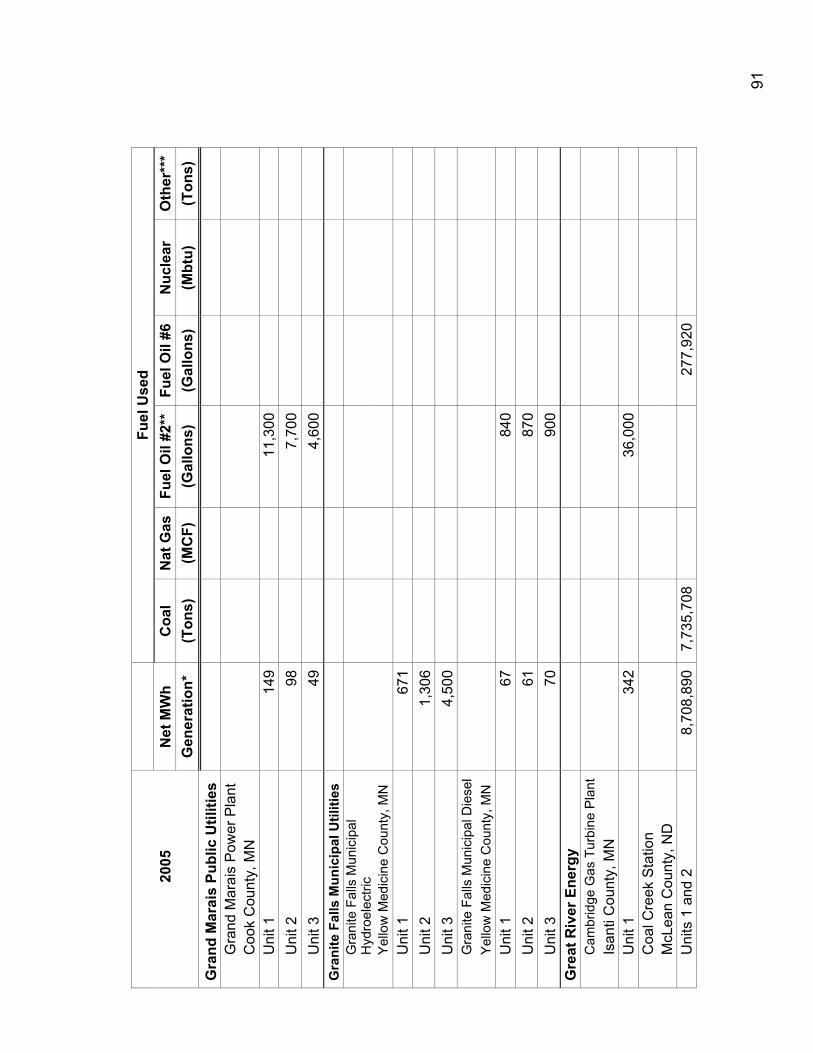
91
Fu
el U
sed
20
05
Net
MW
h C
oal
Nat
Gas
Fu
el O
il #2
**
Fuel
Oil
#6N
ucle
ar
Oth
er**
*
G
ener
atio
n*
(Ton
s)
(MC
F)
(Gal
lons
) (G
allo
ns)
(Mbt
u)
(Ton
s)
Gra
nd M
arai
s Pu
blic
Util
ities
G
rand
Mar
ais
Pow
er P
lant
C
ook
Cou
nty,
MN
U
nit 1
14
911
,300
Uni
t 2
987,
700
U
nit 3
49
4,60
0 G
rani
te F
alls
Mun
icip
al U
tiliti
es
G
rani
te F
alls
Mun
icip
al
Hyd
roel
ectri
c
Y
ello
w M
edic
ine
Cou
nty,
MN
U
nit 1
67
1
U
nit 2
1,
306
Uni
t 3
4,50
0
G
rani
te F
alls
Mun
icip
al D
iese
l
Y
ello
w M
edic
ine
Cou
nty,
MN
U
nit 1
67
840
U
nit 2
61
870
U
nit 3
70
900
Gre
at R
iver
Ene
rgy
Cam
brid
ge G
as T
urbi
ne P
lant
Is
anti
Cou
nty,
MN
U
nit 1
34
236
,000
Coa
l Cre
ek S
tatio
n
M
cLea
n C
ount
y, N
D
Uni
ts 1
and
2
8,70
8,89
07,
735,
708
27
7,92
0
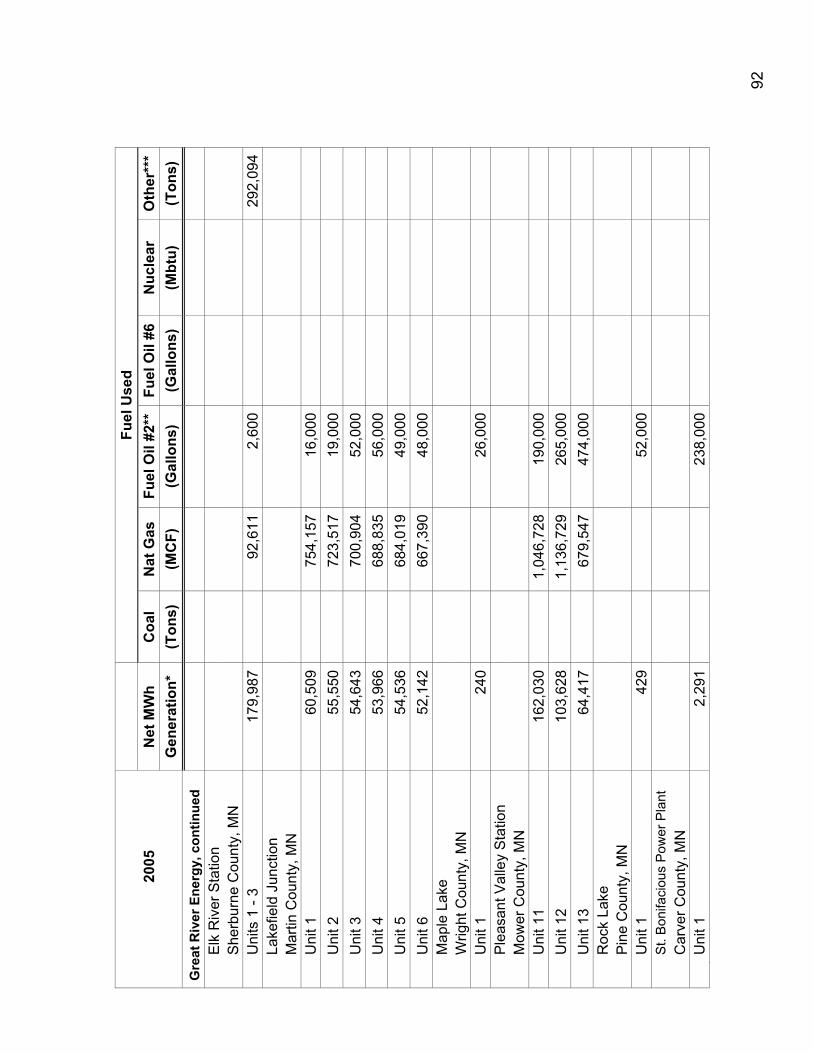
92
Fuel
Use
d
2005
N
et M
Wh
Coa
l N
at G
as
Fuel
Oil
#2**
Fu
el O
il #6
Nuc
lear
O
ther
***
Gen
erat
ion*
(T
ons)
(M
CF)
(G
allo
ns)
(Gal
lons
) (M
btu)
(T
ons)
G
reat
Riv
er E
nerg
y, c
ontin
ued
Elk
Riv
er S
tatio
n
S
herb
urne
Cou
nty,
MN
U
nits
1 -
3 17
9,98
792
,611
2,60
0 29
2,09
4
Lake
field
Jun
ctio
n
M
artin
Cou
nty,
MN
U
nit 1
60
,509
754,
157
16,0
00
U
nit 2
55
,550
723,
517
19,0
00
U
nit 3
54
,643
700,
904
52,0
00
U
nit 4
53
,966
688,
835
56,0
00
U
nit 5
54
,536
684,
019
49,0
00
U
nit 6
52
,142
667,
390
48,0
00
M
aple
Lak
e
W
right
Cou
nty,
MN
U
nit 1
24
026
,000
Ple
asan
t Val
ley
Sta
tion
Mow
er C
ount
y, M
N
Uni
t 11
162,
030
1,04
6,72
819
0,00
0
Uni
t 12
103,
628
1,13
6,72
926
5,00
0
Uni
t 13
64,4
1767
9,54
747
4,00
0
Roc
k La
ke
Pin
e C
ount
y, M
N
Uni
t 1
429
52,0
00
S
t. B
onifa
ciou
s P
ower
Pla
nt
Car
ver C
ount
y, M
N
Uni
t 1
2,29
123
8,00
0
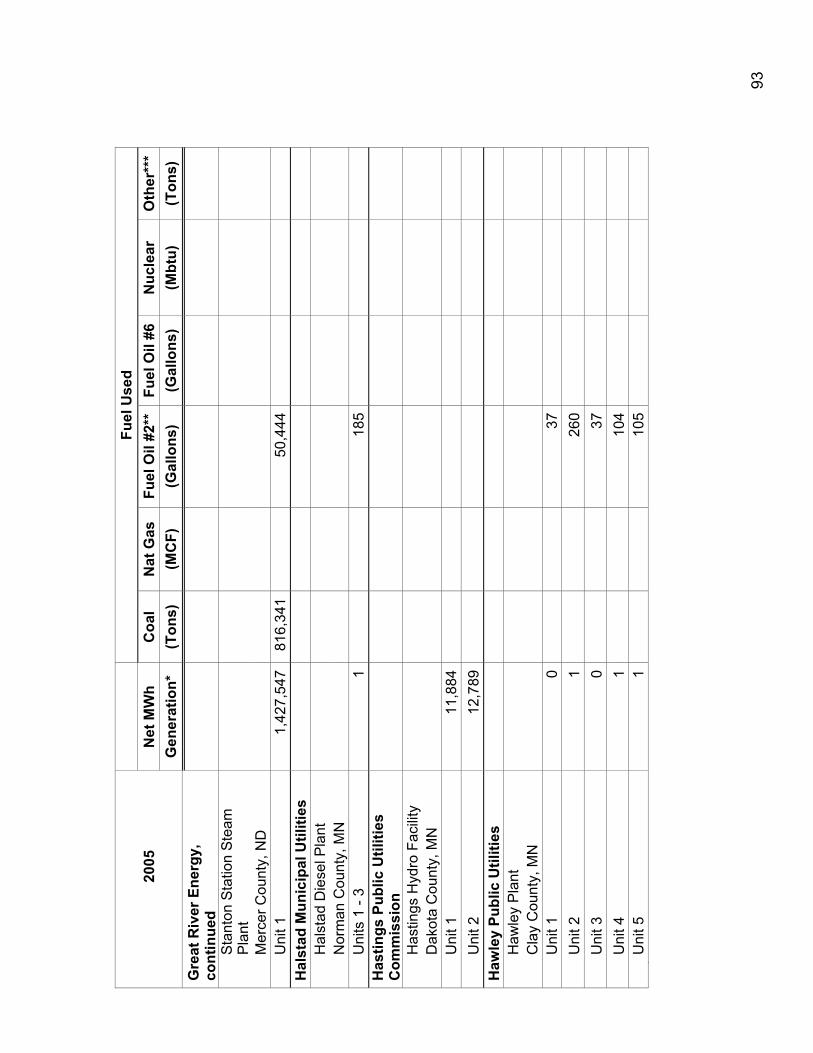
93
Fuel
Use
d
2005
N
et M
Wh
Coa
l N
at G
as
Fuel
Oil
#2**
Fu
el O
il #6
Nuc
lear
O
ther
***
Gen
erat
ion*
(T
ons)
(M
CF)
(G
allo
ns)
(Gal
lons
) (M
btu)
(T
ons)
G
reat
Riv
er E
nerg
y,
cont
inue
d
S
tant
on S
tatio
n S
team
P
lant
M
erce
r Cou
nty,
ND
U
nit 1
1,
427,
547
816,
341
50,4
44
Hal
stad
Mun
icip
al U
tiliti
es
Hal
stad
Die
sel P
lant
N
orm
an C
ount
y, M
N
Uni
ts 1
- 3
118
5 H
astin
gs P
ublic
Util
ities
C
omm
issi
on
H
astin
gs H
ydro
Fac
ility
D
akot
a C
ount
y, M
N
Uni
t 1
11,8
84
U
nit 2
12
,789
H
awle
y Pu
blic
Util
ities
H
awle
y P
lant
C
lay
Cou
nty,
MN
U
nit 1
0
37
U
nit 2
1
260
U
nit 3
0
37
U
nit 4
1
104
U
nit 5
1
105
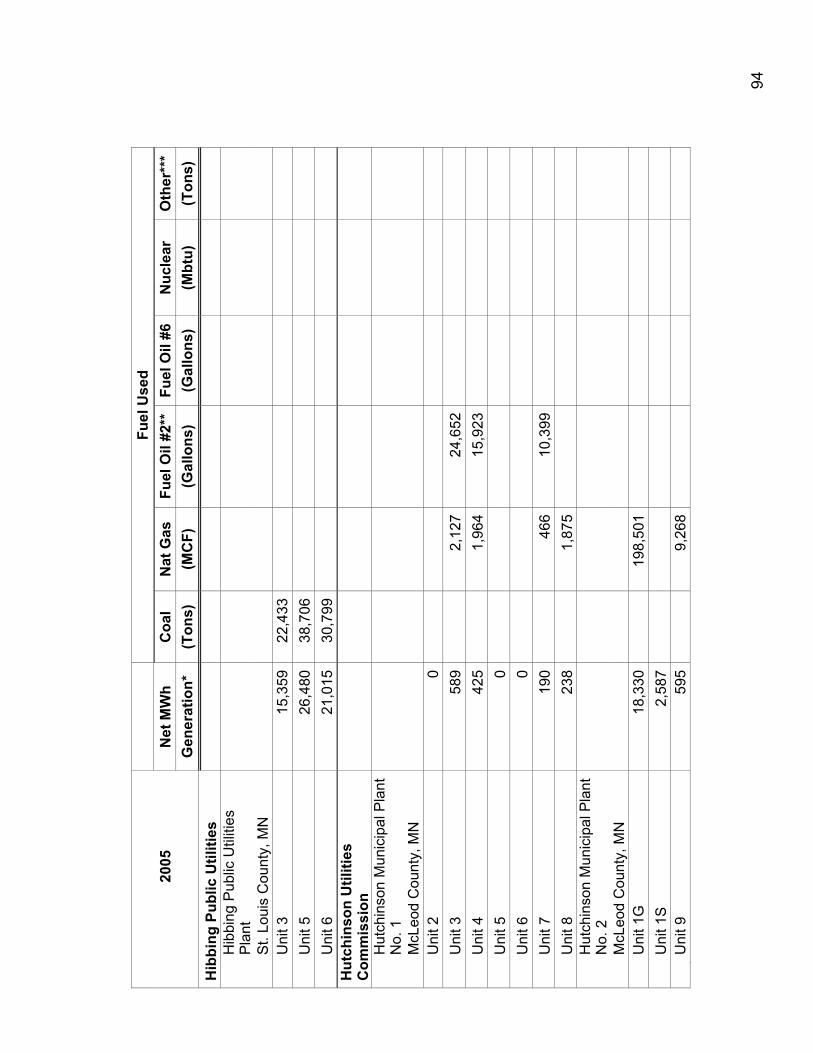
94
Fu
el U
sed
20
05
Net
MW
h C
oal
Nat
Gas
Fu
el O
il #2
**
Fuel
Oil
#6N
ucle
ar
Oth
er**
*
G
ener
atio
n*
(Ton
s)
(MC
F)
(Gal
lons
) (G
allo
ns)
(Mbt
u)
(Ton
s)
Hib
bing
Pub
lic U
tiliti
es
H
ibbi
ng P
ublic
Util
ities
P
lant
S
t. Lo
uis
Cou
nty,
MN
U
nit 3
15
,359
22,4
33
Uni
t 5
26,4
8038
,706
Uni
t 6
21,0
1530
,799
H
utch
inso
n U
tiliti
es
Com
mis
sion
H
utch
inso
n M
unic
ipal
Pla
nt
No.
1
M
cLeo
d C
ount
y, M
N
Uni
t 2
0
Uni
t 3
589
2,12
724
,652
Uni
t 4
425
1,96
415
,923
Uni
t 5
0
U
nit 6
0
Uni
t 7
190
466
10,3
99
U
nit 8
23
81,
875
H
utch
inso
n M
unic
ipal
Pla
nt
No.
2
M
cLeo
d C
ount
y, M
N
Uni
t 1G
18
,330
198,
501
Uni
t 1S
2,
587
U
nit 9
59
59,
268
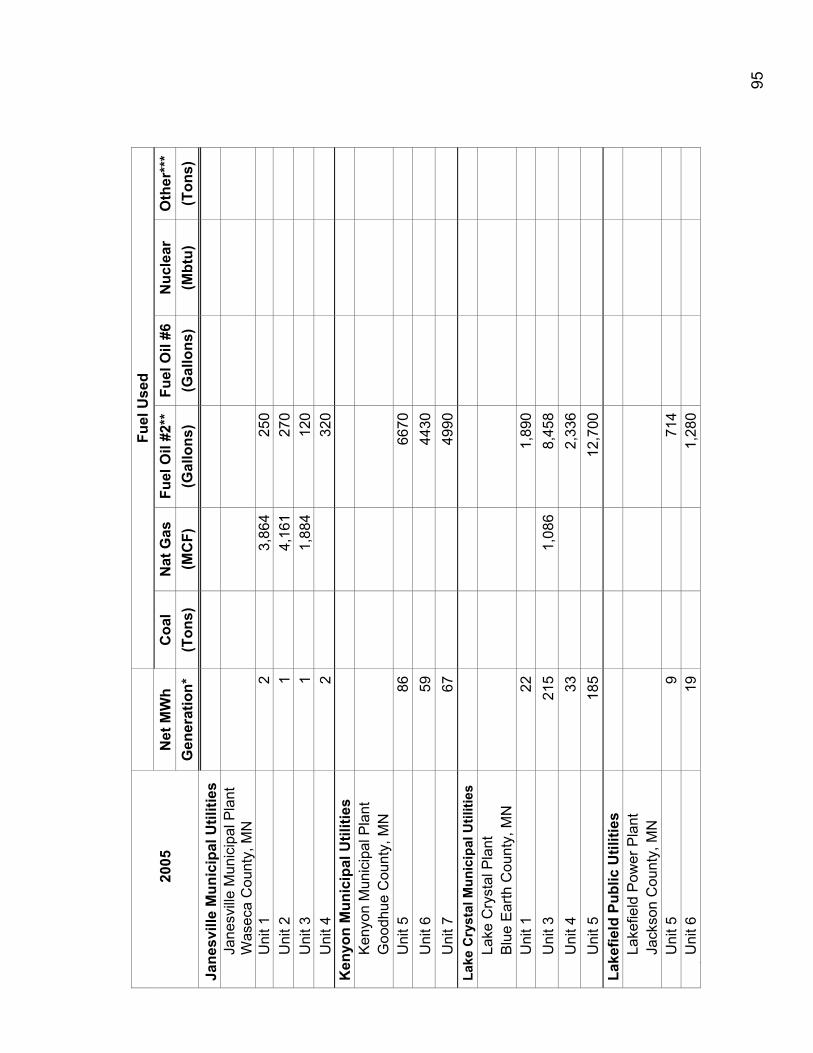
95
Fu
el U
sed
20
05
Net
MW
h C
oal
Nat
Gas
Fu
el O
il #2
**
Fuel
Oil
#6N
ucle
ar
Oth
er**
*
G
ener
atio
n*
(Ton
s)
(MC
F)
(Gal
lons
) (G
allo
ns)
(Mbt
u)
(Ton
s)
Jane
svill
e M
unic
ipal
Util
ities
Ja
nesv
ille
Mun
icip
al P
lant
W
asec
a C
ount
y, M
N
Uni
t 1
23,
864
250
U
nit 2
1
4,16
127
0
Uni
t 3
11,
884
120
U
nit 4
2
320
Ken
yon
Mun
icip
al U
tiliti
es
Ken
yon
Mun
icip
al P
lant
G
oodh
ue C
ount
y, M
N
Uni
t 5
8666
70
U
nit 6
59
4430
Uni
t 7
6749
90
Lake
Cry
stal
Mun
icip
al U
tiliti
es
Lake
Cry
stal
Pla
nt
Blu
e E
arth
Cou
nty,
MN
U
nit 1
22
1,
890
U
nit 3
21
51,
086
8,45
8
Uni
t 4
33
2,33
6
Uni
t 5
185
12
,700
La
kefie
ld P
ublic
Util
ities
La
kefie
ld P
ower
Pla
nt
Jack
son
Cou
nty,
MN
U
nit 5
9
714
U
nit 6
19
1,28
0
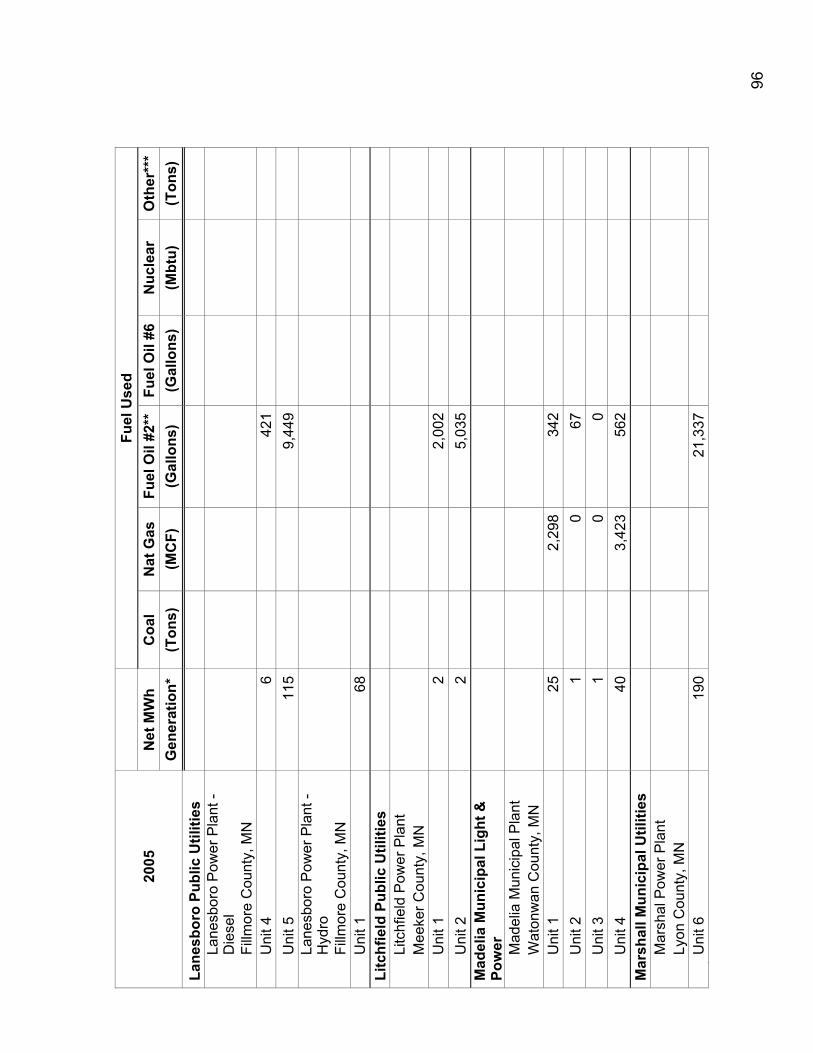
96
Fuel
Use
d
2005
N
et M
Wh
Coa
l N
at G
as
Fuel
Oil
#2**
Fu
el O
il #6
Nuc
lear
O
ther
***
Gen
erat
ion*
(T
ons)
(M
CF)
(G
allo
ns)
(Gal
lons
) (M
btu)
(T
ons)
La
nesb
oro
Publ
ic U
tiliti
es
La
nesb
oro
Pow
er P
lant
- D
iese
l
Fi
llmor
e C
ount
y, M
N
Uni
t 4
642
1
Uni
t 5
115
9,44
9
La
nesb
oro
Pow
er P
lant
- H
ydro
Fi
llmor
e C
ount
y, M
N
Uni
t 1
68
Litc
hfie
ld P
ublic
Util
ities
Li
tchf
ield
Pow
er P
lant
M
eeke
r Cou
nty,
MN
U
nit 1
2
2,
002
U
nit 2
2
5,03
5 M
adel
ia M
unic
ipal
Lig
ht &
Po
wer
M
adel
ia M
unic
ipal
Pla
nt
Wat
onw
an C
ount
y, M
N
Uni
t 1
252,
298
342
U
nit 2
1
067
Uni
t 3
10
0
Uni
t 4
403,
423
562
Mar
shal
l Mun
icip
al U
tiliti
es
Mar
shal
Pow
er P
lant
Ly
on C
ount
y, M
N
Uni
t 6
190
21,3
37
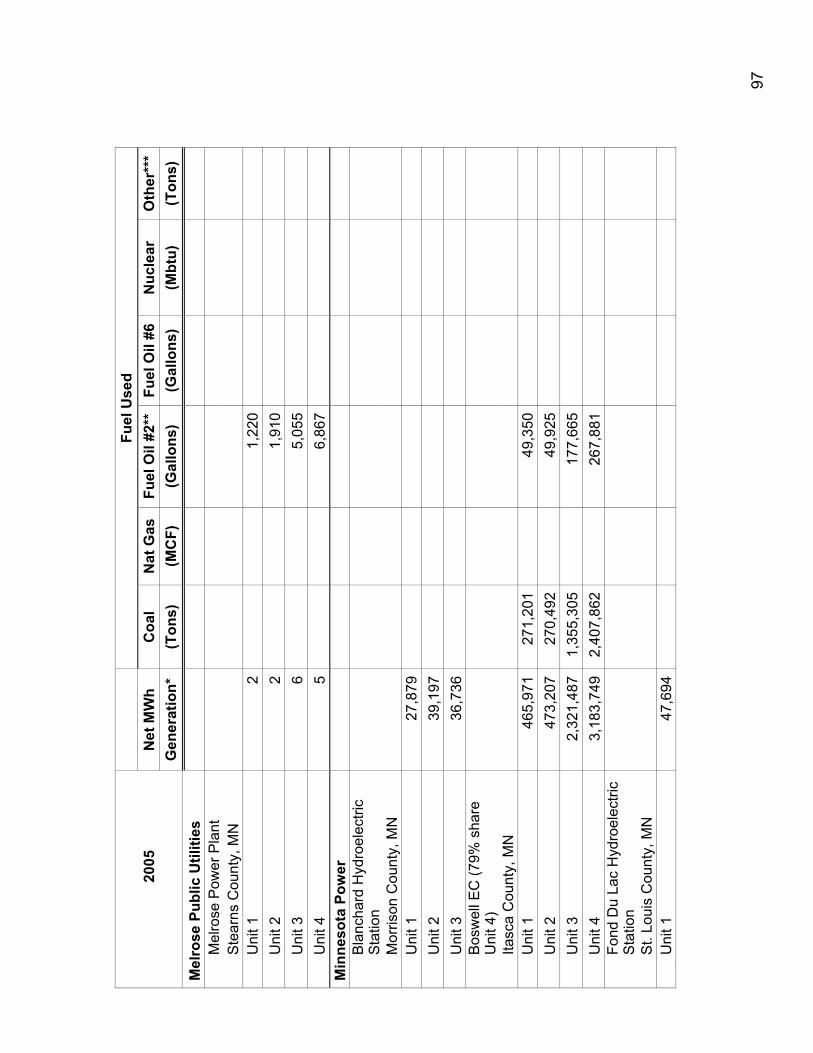
97
Fuel
Use
d
2005
N
et M
Wh
Coa
l N
at G
as
Fuel
Oil
#2**
Fu
el O
il #6
Nuc
lear
O
ther
***
Gen
erat
ion*
(T
ons)
(M
CF)
(G
allo
ns)
(Gal
lons
) (M
btu)
(T
ons)
M
elro
se P
ublic
Util
ities
M
elro
se P
ower
Pla
nt
Ste
arns
Cou
nty,
MN
U
nit 1
2
1,22
0
Uni
t 2
21,
910
U
nit 3
6
5,05
5
Uni
t 4
56,
867
Min
neso
ta P
ower
B
lanc
hard
Hyd
roel
ectri
c S
tatio
n
M
orris
on C
ount
y, M
N
U
nit 1
27
,879
Uni
t 2
39,1
97
U
nit 3
36
,736
B
osw
ell E
C (7
9% s
hare
U
nit 4
)
Ita
sca
Cou
nty,
MN
U
nit 1
46
5,97
127
1,20
149
,350
Uni
t 2
473,
207
270,
492
49,9
25
U
nit 3
2,
321,
487
1,35
5,30
517
7,66
5
Uni
t 4
3,18
3,74
92,
407,
862
267,
881
Fo
nd D
u La
c H
ydro
elec
tric
Sta
tion
S
t. Lo
uis
Cou
nty,
MN
U
nit 1
47
,694
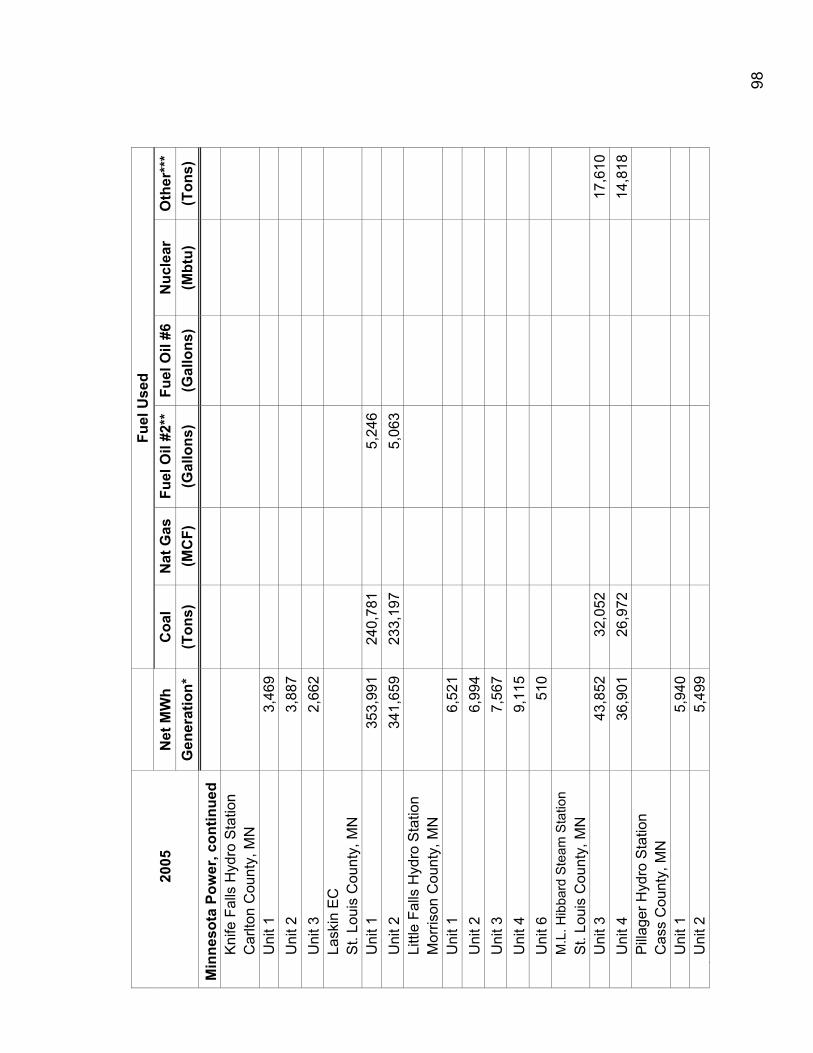
98
Fu
el U
sed
20
05
Net
MW
h C
oal
Nat
Gas
Fu
el O
il #2
**
Fuel
Oil
#6N
ucle
ar
Oth
er**
*
G
ener
atio
n*
(Ton
s)
(MC
F)
(Gal
lons
) (G
allo
ns)
(Mbt
u)
(Ton
s)
Min
neso
ta P
ower
, con
tinue
d
K
nife
Fal
ls H
ydro
Sta
tion
Car
lton
Cou
nty,
MN
U
nit 1
3,
469
Uni
t 2
3,88
7
U
nit 3
2,
662
Lask
in E
C
St.
Loui
s C
ount
y, M
N
Uni
t 1
353,
991
240,
781
5,24
6
Uni
t 2
341,
659
233,
197
5,06
3
Littl
e Fa
lls H
ydro
Sta
tion
Mor
rison
Cou
nty,
MN
U
nit 1
6,
521
Uni
t 2
6,99
4
U
nit 3
7,
567
Uni
t 4
9,11
5
U
nit 6
51
0
M
.L. H
ibba
rd S
team
Sta
tion
St.
Loui
s C
ount
y, M
N
Uni
t 3
43,8
5232
,052
17
,610
U
nit 4
36
,901
26,9
72
14,8
18
Pill
ager
Hyd
ro S
tatio
n
C
ass
Cou
nty,
MN
U
nit 1
5,
940
Uni
t 2
5,49
9
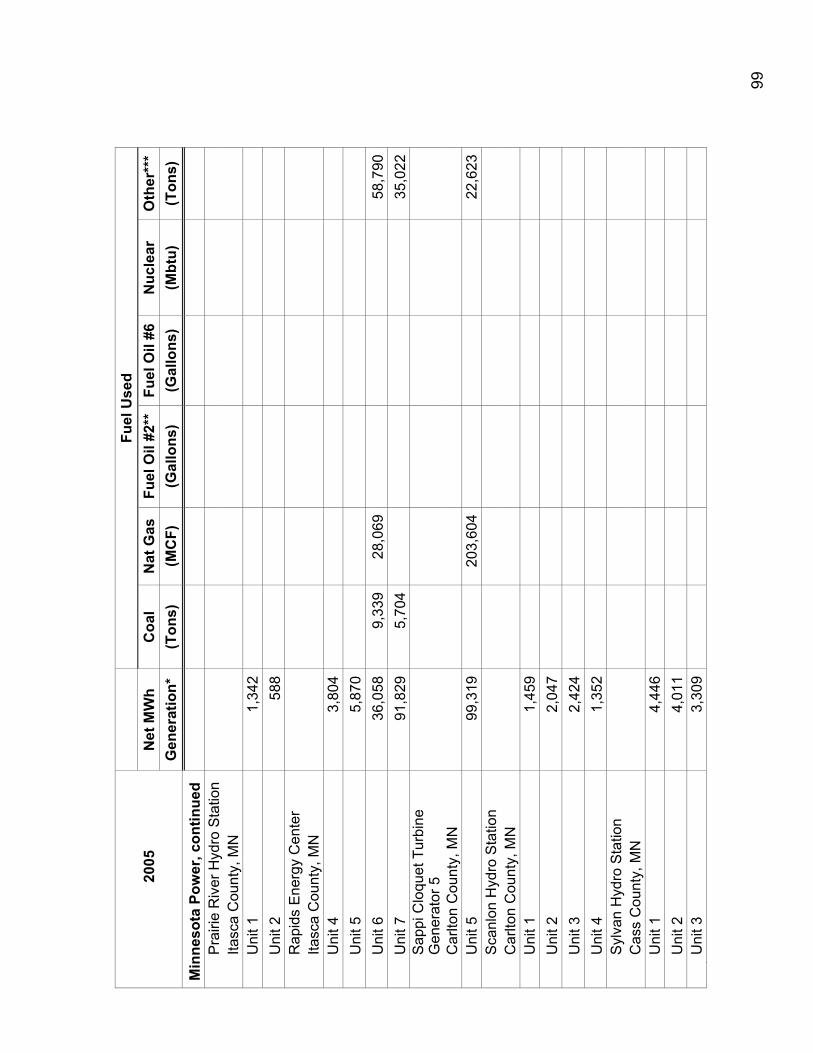
99
Fuel
Use
d
2005
N
et M
Wh
Coa
l N
at G
as
Fuel
Oil
#2**
Fu
el O
il #6
Nuc
lear
O
ther
***
Gen
erat
ion*
(T
ons)
(M
CF)
(G
allo
ns)
(Gal
lons
) (M
btu)
(T
ons)
M
inne
sota
Pow
er, c
ontin
ued
Pra
irie
Riv
er H
ydro
Sta
tion
Itasc
a C
ount
y, M
N
Uni
t 1
1,34
2
U
nit 2
58
8
R
apid
s E
nerg
y C
ente
r
Ita
sca
Cou
nty,
MN
U
nit 4
3,
804
Uni
t 5
5,87
0
U
nit 6
36
,058
9,33
928
,069
58
,790
U
nit 7
91
,829
5,70
4
35,0
22
S
appi
Clo
quet
Tur
bine
G
ener
ator
5
C
arlto
n C
ount
y, M
N
Uni
t 5
99,3
1920
3,60
4
22,6
23
Sca
nlon
Hyd
ro S
tatio
n
C
arlto
n C
ount
y, M
N
Uni
t 1
1,45
9
U
nit 2
2,
047
Uni
t 3
2,42
4
U
nit 4
1,
352
Syl
van
Hyd
ro S
tatio
n
C
ass
Cou
nty,
MN
U
nit 1
4,
446
Uni
t 2
4,01
1
U
nit 3
3,
309
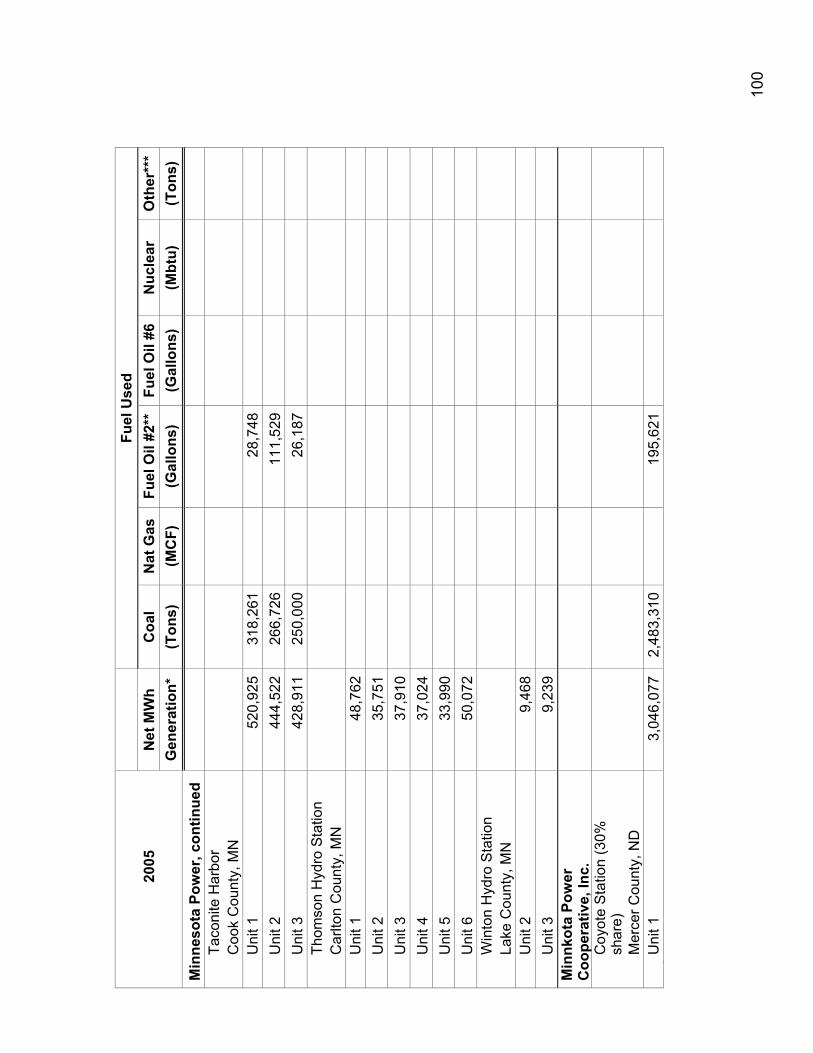
10
0
Fuel
Use
d
2005
N
et M
Wh
Coa
l N
at G
as
Fuel
Oil
#2**
Fu
el O
il #6
Nuc
lear
O
ther
***
Gen
erat
ion*
(T
ons)
(M
CF)
(G
allo
ns)
(Gal
lons
) (M
btu)
(T
ons)
M
inne
sota
Pow
er, c
ontin
ued
Taco
nite
Har
bor
Coo
k C
ount
y, M
N
Uni
t 1
520,
925
318,
261
28,7
48
U
nit 2
44
4,52
226
6,72
611
1,52
9
Uni
t 3
428,
911
250,
000
26,1
87
Th
omso
n H
ydro
Sta
tion
Car
lton
Cou
nty,
MN
U
nit 1
48
,762
Uni
t 2
35,7
51
U
nit 3
37
,910
Uni
t 4
37,0
24
U
nit 5
33
,990
Uni
t 6
50,0
72
W
into
n H
ydro
Sta
tion
Lake
Cou
nty,
MN
Uni
t 2
9,46
8
U
nit 3
9,
239
M
innk
ota
Pow
er
Coo
pera
tive,
Inc.
C
oyot
e S
tatio
n (3
0%
shar
e)
M
erce
r Cou
nty,
ND
U
nit 1
3,
046,
077
2,48
3,31
019
5,62
1
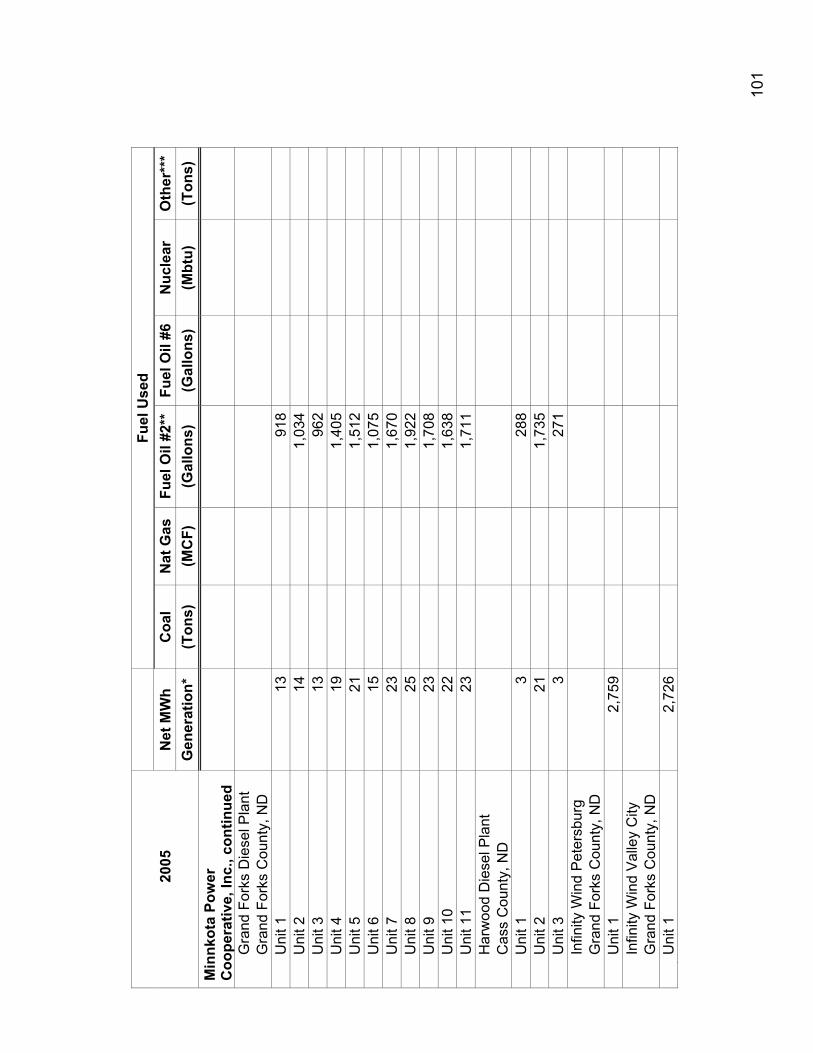
10
1
Fu
el U
sed
20
05
Net
MW
h C
oal
Nat
Gas
Fu
el O
il #2
**
Fuel
Oil
#6N
ucle
ar
Oth
er**
*
G
ener
atio
n*
(Ton
s)
(MC
F)
(Gal
lons
) (G
allo
ns)
(Mbt
u)
(Ton
s)
Min
nkot
a Po
wer
C
oope
rativ
e, In
c., c
ontin
ued
G
rand
For
ks D
iese
l Pla
nt
Gra
nd F
orks
Cou
nty,
ND
U
nit 1
13
918
U
nit 2
14
1,03
4
Uni
t 3
1396
2
Uni
t 4
191,
405
U
nit 5
21
1,51
2
Uni
t 6
151,
075
U
nit 7
23
1,67
0
Uni
t 8
251,
922
U
nit 9
23
1,70
8
Uni
t 10
221,
638
U
nit 1
1 23
1,71
1
Har
woo
d D
iese
l Pla
nt
Cas
s C
ount
y, N
D
Uni
t 1
328
8
Uni
t 2
211,
735
U
nit 3
3
271
In
finity
Win
d P
eter
sbur
g
G
rand
For
ks C
ount
y, N
D
Uni
t 1
2,75
9
In
finity
Win
d V
alle
y C
ity
Gra
nd F
orks
Cou
nty,
ND
U
nit 1
2,
726
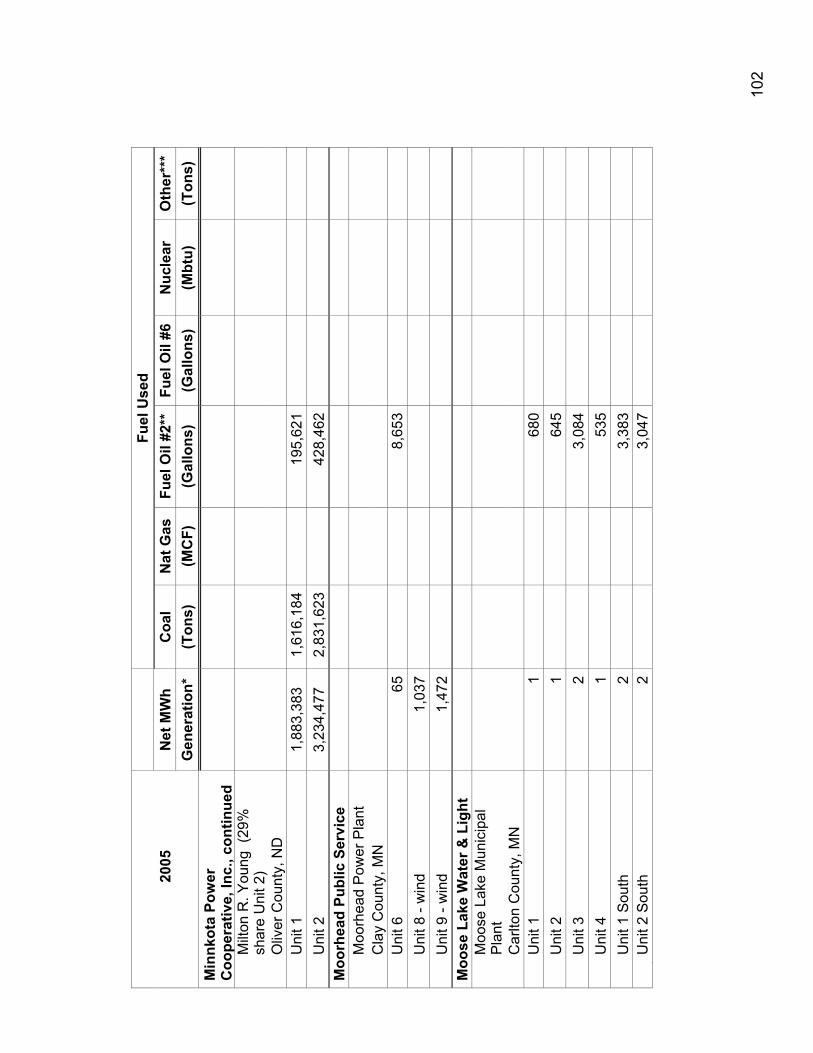
10
2
Fu
el U
sed
20
05
Net
MW
h C
oal
Nat
Gas
Fu
el O
il #2
**
Fuel
Oil
#6N
ucle
ar
Oth
er**
*
G
ener
atio
n*
(Ton
s)
(MC
F)
(Gal
lons
) (G
allo
ns)
(Mbt
u)
(Ton
s)
Min
nkot
a Po
wer
C
oope
rativ
e, In
c., c
ontin
ued
M
ilton
R. Y
oung
(29
%
shar
e U
nit 2
)
O
liver
Cou
nty,
ND
U
nit 1
1,
883,
383
1,61
6,18
419
5,62
1
Uni
t 2
3,23
4,47
7 2,
831,
623
428,
462
Moo
rhea
d Pu
blic
Ser
vice
M
oorh
ead
Pow
er P
lant
C
lay
Cou
nty,
MN
U
nit 6
65
8,65
3
Uni
t 8 -
win
d 1,
037
U
nit 9
- w
ind
1,47
2
Moo
se L
ake
Wat
er &
Lig
ht
M
oose
Lak
e M
unic
ipal
P
lant
C
arlto
n C
ount
y, M
N
Uni
t 1
168
0
Uni
t 2
164
5
Uni
t 3
23,
084
U
nit 4
1
535
U
nit 1
Sou
th
23,
383
U
nit 2
Sou
th
23,
047
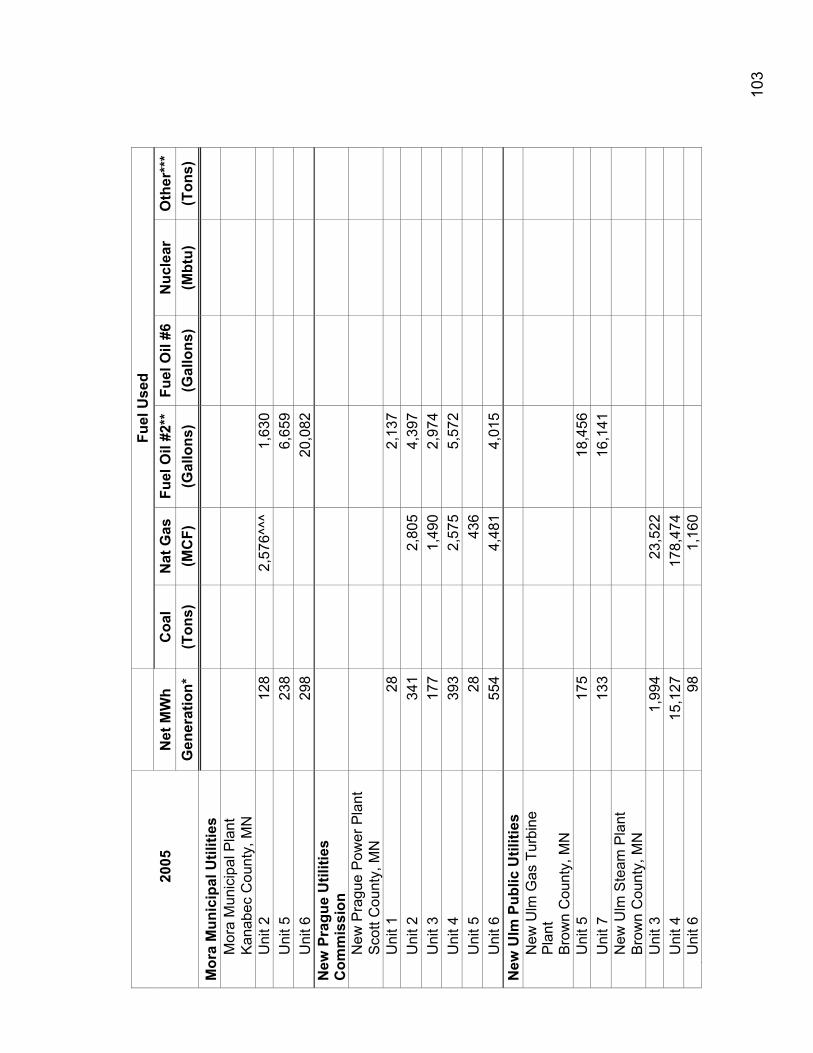
10
3
Fu
el U
sed
20
05
Net
MW
h C
oal
Nat
Gas
Fu
el O
il #2
**
Fuel
Oil
#6N
ucle
ar
Oth
er**
*
G
ener
atio
n*
(Ton
s)
(MC
F)
(Gal
lons
) (G
allo
ns)
(Mbt
u)
(Ton
s)
Mor
a M
unic
ipal
Util
ities
M
ora
Mun
icip
al P
lant
K
anab
ec C
ount
y, M
N
Uni
t 2
128
2,57
6^^^
1,63
0
Uni
t 5
238
6,
659
U
nit 6
29
820
,082
N
ew P
ragu
e U
tiliti
es
Com
mis
sion
N
ew P
ragu
e P
ower
Pla
nt
Sco
tt C
ount
y, M
N
Uni
t 1
282,
137
U
nit 2
34
12,
805
4,39
7
Uni
t 3
177
1,49
02,
974
U
nit 4
39
32,
575
5,57
2
Uni
t 5
2843
6
U
nit 6
55
44,
481
4,01
5 N
ew U
lm P
ublic
Util
ities
N
ew U
lm G
as T
urbi
ne
Pla
nt
B
row
n C
ount
y, M
N
Uni
t 5
175
18
,456
Uni
t 7
133
16,1
41
N
ew U
lm S
team
Pla
nt
Bro
wn
Cou
nty,
MN
U
nit 3
1,
994
23,5
22
U
nit 4
15
,127
178,
474
Uni
t 6
98
1,16
0
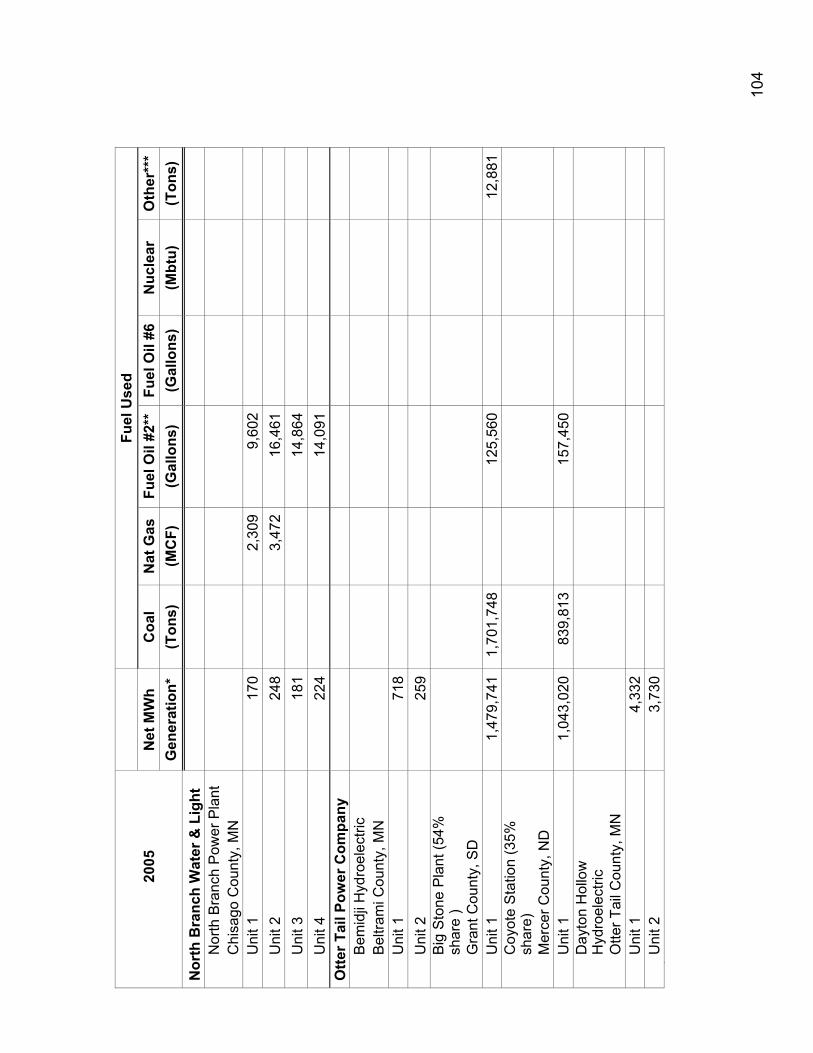
10
4
Fuel
Use
d
2005
N
et M
Wh
Coa
l N
at G
as
Fuel
Oil
#2**
Fu
el O
il #6
Nuc
lear
O
ther
***
Gen
erat
ion*
(T
ons)
(M
CF)
(G
allo
ns)
(Gal
lons
) (M
btu)
(T
ons)
N
orth
Bra
nch
Wat
er &
Lig
ht
Nor
th B
ranc
h P
ower
Pla
nt
Chi
sago
Cou
nty,
MN
U
nit 1
17
02,
309
9,60
2
Uni
t 2
248
3,47
216
,461
Uni
t 3
181
14,8
64
U
nit 4
22
414
,091
O
tter T
ail P
ower
Com
pany
B
emid
ji H
ydro
elec
tric
Bel
tram
i Cou
nty,
MN
U
nit 1
71
8
U
nit 2
25
9
B
ig S
tone
Pla
nt (5
4%
shar
e )
G
rant
Cou
nty,
SD
U
nit 1
1,
479,
741
1,70
1,74
812
5,56
0 12
,881
C
oyot
e S
tatio
n (3
5%
shar
e)
M
erce
r Cou
nty,
ND
U
nit 1
1,
043,
020
839,
813
157,
450
D
ayto
n H
ollo
w
Hyd
roel
ectri
c
O
tter T
ail C
ount
y, M
N
Uni
t 1
4,33
2
U
nit 2
3,
730
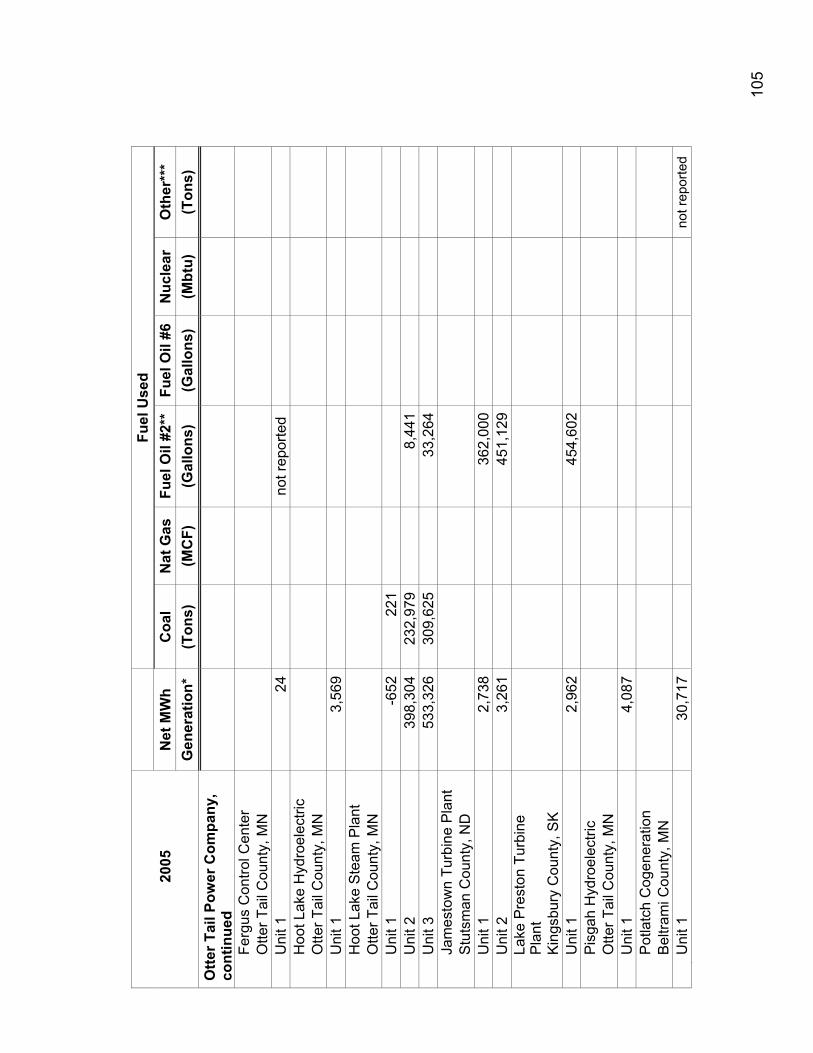
10
5
Fu
el U
sed
20
05
Net
MW
h C
oal
Nat
Gas
Fu
el O
il #2
**
Fuel
Oil
#6N
ucle
ar
Oth
er**
*
G
ener
atio
n*
(Ton
s)
(MC
F)
(Gal
lons
) (G
allo
ns)
(Mbt
u)
(Ton
s)
Otte
r Tai
l Pow
er C
ompa
ny,
cont
inue
d
Fe
rgus
Con
trol C
ente
r
O
tter T
ail C
ount
y, M
N
Uni
t 1
24no
t rep
orte
d
Hoo
t Lak
e H
ydro
elec
tric
Otte
r Tai
l Cou
nty,
MN
U
nit 1
3,
569
Hoo
t Lak
e S
team
Pla
nt
Otte
r Tai
l Cou
nty,
MN
U
nit 1
-6
5222
1
U
nit 2
39
8,30
423
2,97
98,
441
U
nit 3
53
3,32
630
9,62
533
,264
Jam
esto
wn
Turb
ine
Pla
nt
Stu
tsm
an C
ount
y, N
D
Uni
t 1
2,73
836
2,00
0
Uni
t 2
3,26
145
1,12
9
La
ke P
rest
on T
urbi
ne
Pla
nt
K
ings
bury
Cou
nty,
SK
U
nit 1
2,
962
454,
602
P
isga
h H
ydro
elec
tric
Otte
r Tai
l Cou
nty,
MN
U
nit 1
4,
087
Pot
latc
h C
ogen
erat
ion
Bel
tram
i Cou
nty,
MN
U
nit 1
30
,717
no
t rep
orte
d
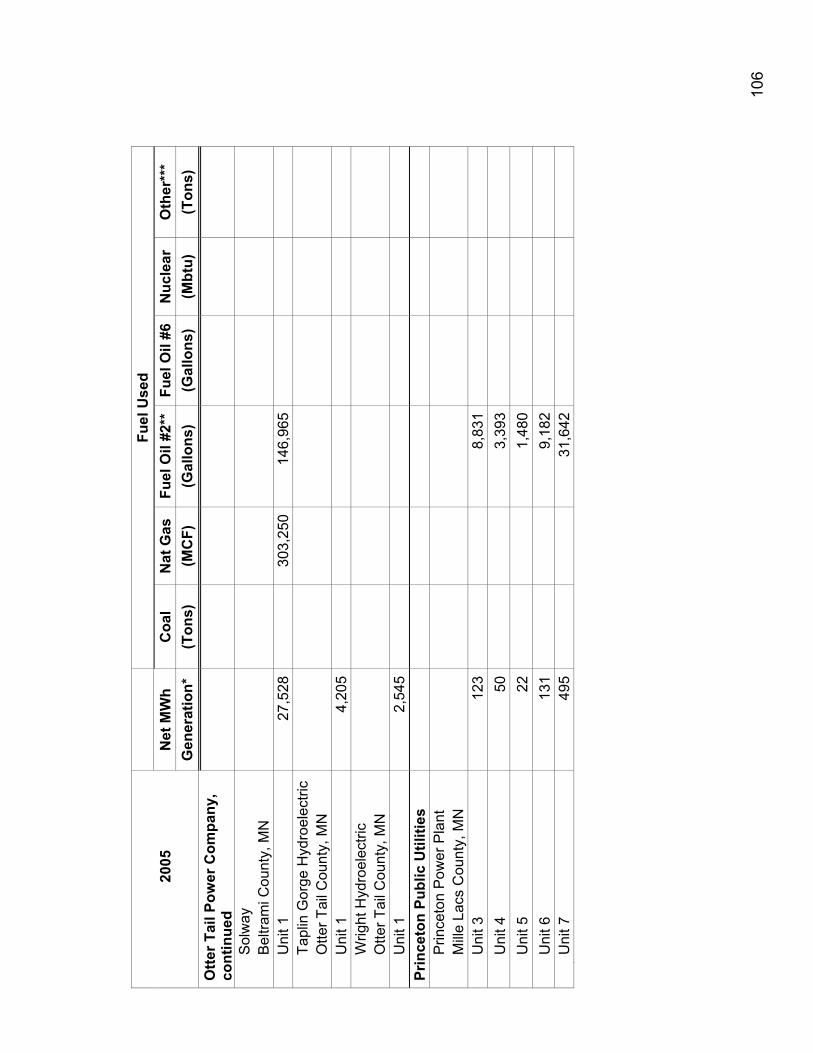
10
6
Fu
el U
sed
20
05
Net
MW
h C
oal
Nat
Gas
Fu
el O
il #2
**
Fuel
Oil
#6N
ucle
ar
Oth
er**
*
G
ener
atio
n*
(Ton
s)
(MC
F)
(Gal
lons
) (G
allo
ns)
(Mbt
u)
(Ton
s)
Otte
r Tai
l Pow
er C
ompa
ny,
cont
inue
d
S
olw
ay
Bel
tram
i Cou
nty,
MN
U
nit 1
27
,528
303,
250
146,
965
Ta
plin
Gor
ge H
ydro
elec
tric
Otte
r Tai
l Cou
nty,
MN
U
nit 1
4,
205
Wrig
ht H
ydro
elec
tric
Otte
r Tai
l Cou
nty,
MN
U
nit 1
2,
545
Pr
ince
ton
Publ
ic U
tiliti
es
Prin
ceto
n P
ower
Pla
nt
Mill
e La
cs C
ount
y, M
N
Uni
t 3
123
8,83
1
Uni
t 4
503,
393
U
nit 5
22
1,48
0
Uni
t 6
131
9,18
2
Uni
t 7
495
31,6
42
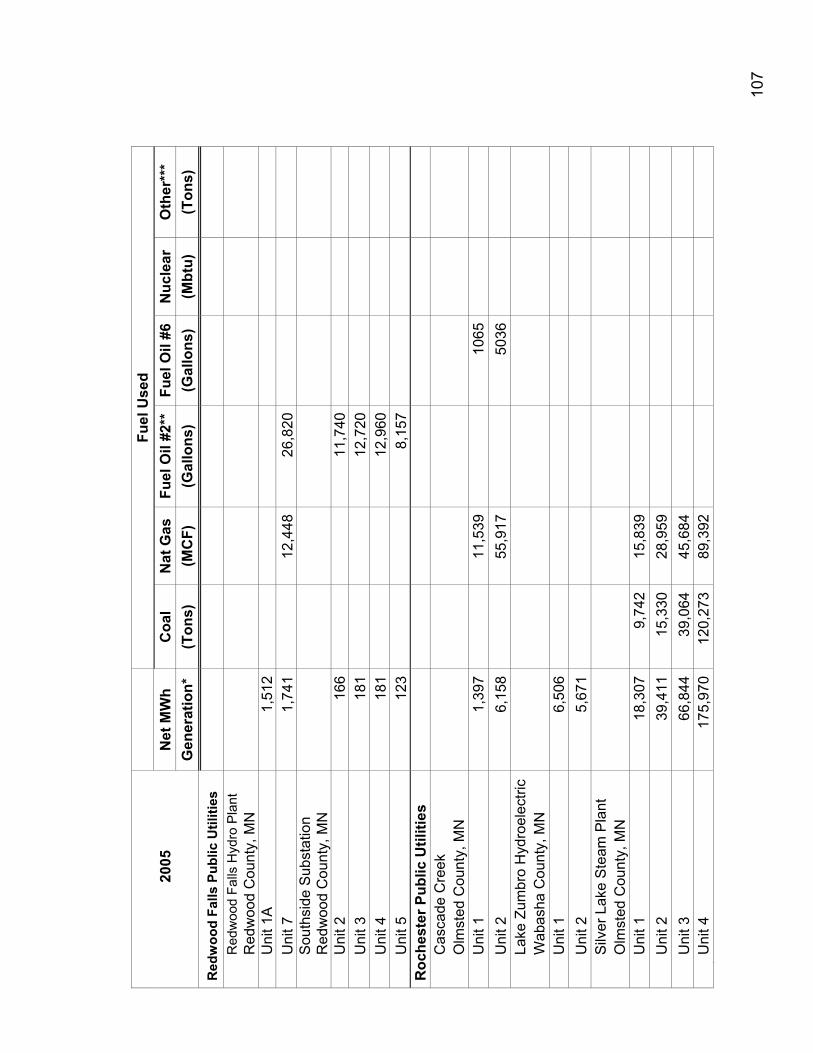
10
7
Fu
el U
sed
20
05
Net
MW
h C
oal
Nat
Gas
Fu
el O
il #2
**
Fuel
Oil
#6N
ucle
ar
Oth
er**
*
G
ener
atio
n*
(Ton
s)
(MC
F)
(Gal
lons
) (G
allo
ns)
(Mbt
u)
(Ton
s)
Red
woo
d Fa
lls P
ublic
Util
ities
Red
woo
d Fa
lls H
ydro
Pla
nt
Red
woo
d C
ount
y, M
N
Uni
t 1A
1,
512
Uni
t 7
1,74
112
,448
26,8
20
S
outh
side
Sub
stat
ion
Red
woo
d C
ount
y, M
N
Uni
t 2
166
11,7
40
U
nit 3
18
112
,720
Uni
t 4
181
12,9
60
U
nit 5
12
38,
157
Roc
hest
er P
ublic
Util
ities
C
asca
de C
reek
O
lmst
ed C
ount
y, M
N
Uni
t 1
1,39
711
,539
10
65
Uni
t 2
6,15
855
,917
50
36
Lake
Zum
bro
Hyd
roel
ectri
c
W
abas
ha C
ount
y, M
N
Uni
t 1
6,50
6
U
nit 2
5,
671
Silv
er L
ake
Ste
am P
lant
O
lmst
ed C
ount
y, M
N
Uni
t 1
18,3
079,
742
15,8
39
U
nit 2
39
,411
15,3
3028
,959
Uni
t 3
66,8
4439
,064
45,6
84
U
nit 4
17
5,97
012
0,27
389
,392
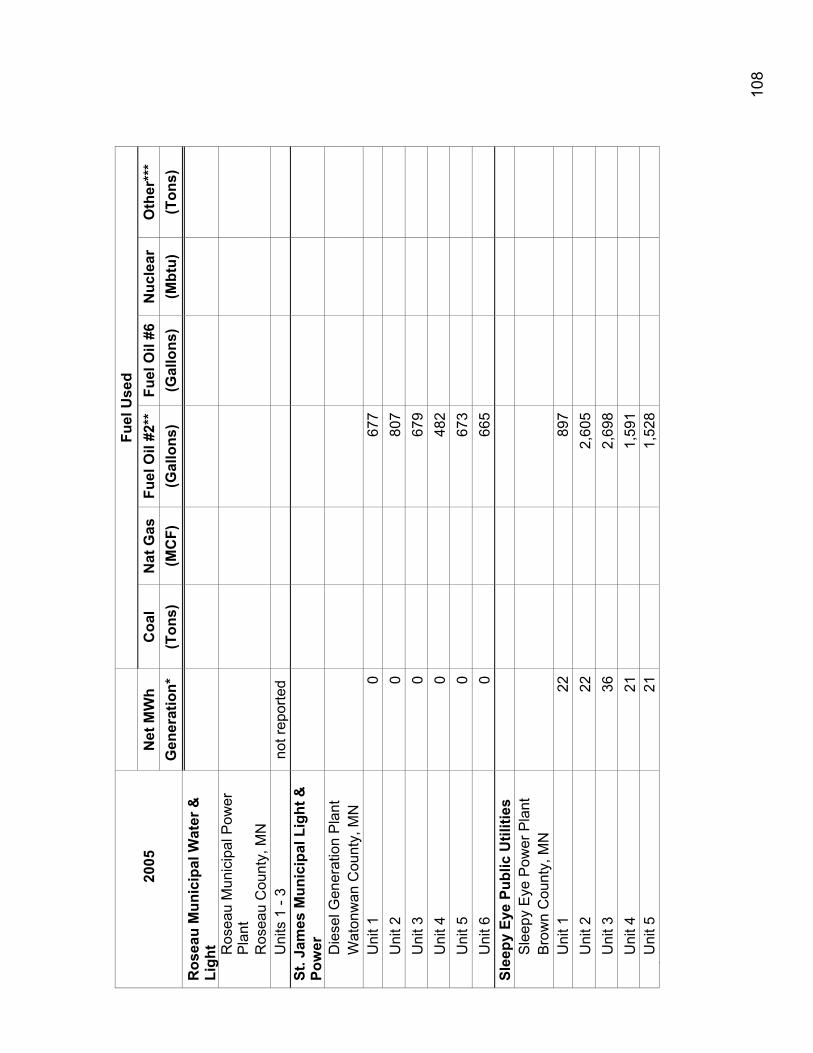
10
8
Fuel
Use
d
2005
N
et M
Wh
Coa
l N
at G
as
Fuel
Oil
#2**
Fu
el O
il #6
Nuc
lear
O
ther
***
Gen
erat
ion*
(T
ons)
(M
CF)
(G
allo
ns)
(Gal
lons
) (M
btu)
(T
ons)
R
osea
u M
unic
ipal
Wat
er &
Li
ght
R
osea
u M
unic
ipal
Pow
er
Pla
nt
R
osea
u C
ount
y, M
N
Uni
ts 1
- 3
not r
epor
ted
St
. Jam
es M
unic
ipal
Lig
ht &
Po
wer
D
iese
l Gen
erat
ion
Pla
nt
W
aton
wan
Cou
nty,
MN
Uni
t 1
067
7
Uni
t 2
080
7
Uni
t 3
067
9
Uni
t 4
048
2
Uni
t 5
067
3
Uni
t 6
066
5 Sl
eepy
Eye
Pub
lic U
tiliti
es
Sle
epy
Eye
Pow
er P
lant
B
row
n C
ount
y, M
N
Uni
t 1
2289
7
Uni
t 2
222,
605
U
nit 3
36
2,69
8
Uni
t 4
211,
591
U
nit 5
21
1,52
8
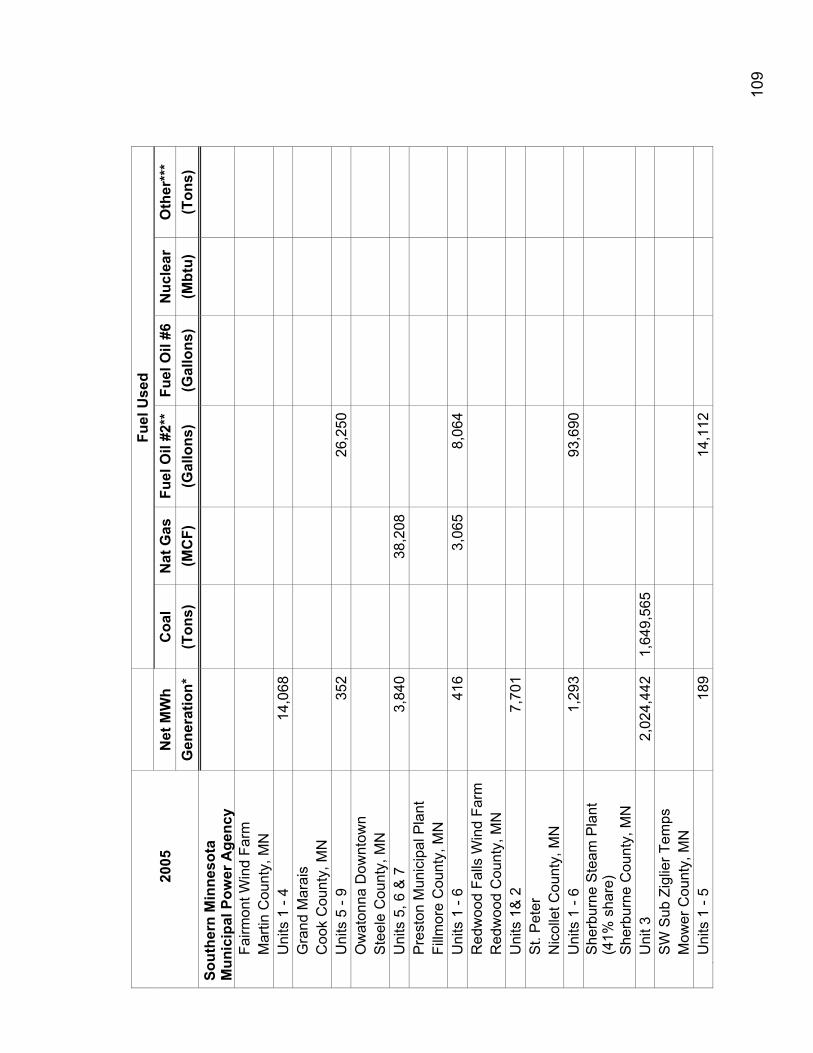
10
9
Fu
el U
sed
20
05
Net
MW
h C
oal
Nat
Gas
Fu
el O
il #2
**
Fuel
Oil
#6N
ucle
ar
Oth
er**
*
G
ener
atio
n*
(Ton
s)
(MC
F)
(Gal
lons
) (G
allo
ns)
(Mbt
u)
(Ton
s)
Sout
hern
Min
neso
ta
Mun
icip
al P
ower
Age
ncy
Fa
irmon
t Win
d Fa
rm
Mar
tin C
ount
y, M
N
Uni
ts 1
- 4
14,0
68
G
rand
Mar
ais
Coo
k C
ount
y, M
N
Uni
ts 5
- 9
352
26,2
50
O
wat
onna
Dow
ntow
n
S
teel
e C
ount
y, M
N
Uni
ts 5
, 6 &
7
3,84
038
,208
Pre
ston
Mun
icip
al P
lant
Fi
llmor
e C
ount
y, M
N
Uni
ts 1
- 6
416
3,06
58,
064
R
edw
ood
Falls
Win
d Fa
rm
Red
woo
d C
ount
y, M
N
Uni
ts 1
& 2
7,
701
St.
Pet
er
Nic
olle
t Cou
nty,
MN
U
nits
1 -
6 1,
293
93
,690
S
herb
urne
Ste
am P
lant
(4
1% s
hare
)
S
herb
urne
Cou
nty,
MN
U
nit 3
2,
024,
442
1,64
9,56
5
S
W S
ub Z
iglie
r Tem
ps
M
ower
Cou
nty,
MN
Uni
ts 1
- 5
189
14
,112
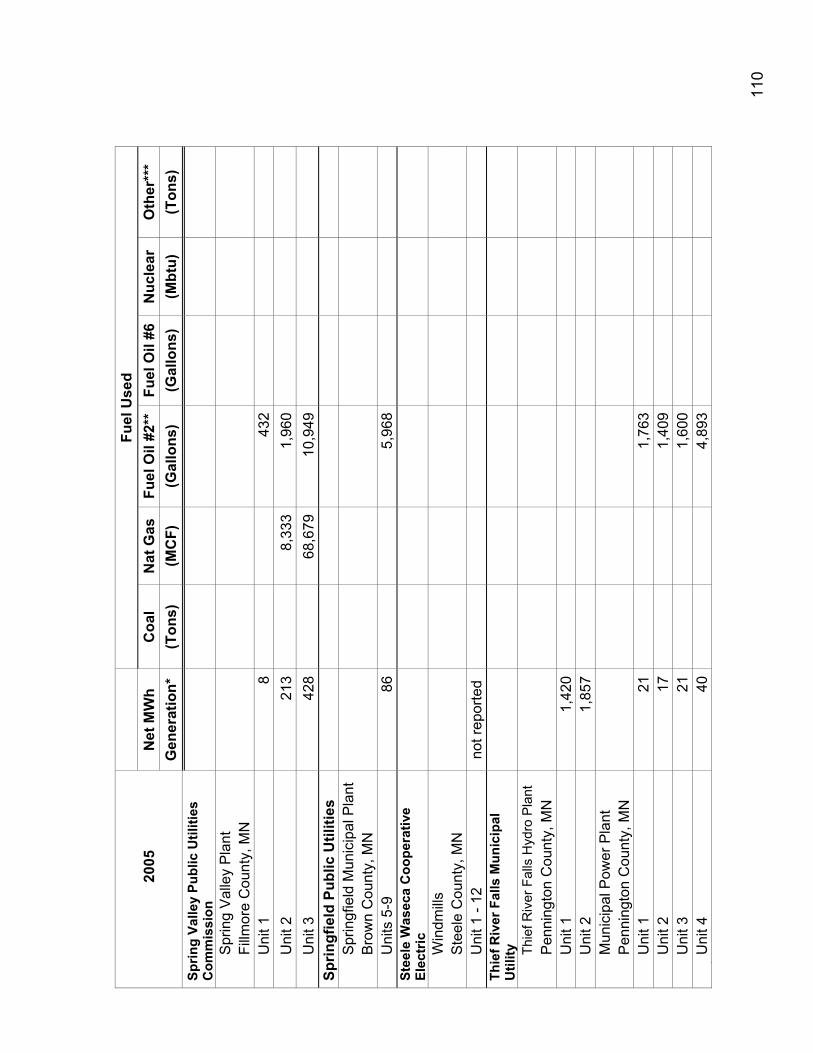
11
0
Fuel
Use
d
2005
N
et M
Wh
Coa
l N
at G
as
Fuel
Oil
#2**
Fu
el O
il #6
Nuc
lear
O
ther
***
Gen
erat
ion*
(T
ons)
(M
CF)
(G
allo
ns)
(Gal
lons
) (M
btu)
(T
ons)
Sp
ring
Valle
y Pu
blic
Util
ities
C
omm
issi
on
S
prin
g V
alle
y P
lant
Fi
llmor
e C
ount
y, M
N
Uni
t 1
843
2
Uni
t 2
213
8,33
31,
960
U
nit 3
42
868
,679
10,9
49
Sprin
gfie
ld P
ublic
Util
ities
S
prin
gfie
ld M
unic
ipal
Pla
nt
Bro
wn
Cou
nty,
MN
U
nits
5-9
86
5,
968
Stee
le W
asec
a C
oope
rativ
e El
ectr
ic
W
indm
ills
Ste
ele
Cou
nty,
MN
U
nit 1
- 12
no
t rep
orte
d
Thie
f Riv
er F
alls
Mun
icip
al
Util
ity
Th
ief R
iver
Fal
ls H
ydro
Pla
nt
Pen
ning
ton
Cou
nty,
MN
U
nit 1
1,
420
Uni
t 2
1,85
7
M
unic
ipal
Pow
er P
lant
P
enni
ngto
n C
ount
y, M
N
Uni
t 1
211,
763
U
nit 2
17
1,40
9
Uni
t 3
211,
600
U
nit 4
40
4,89
3
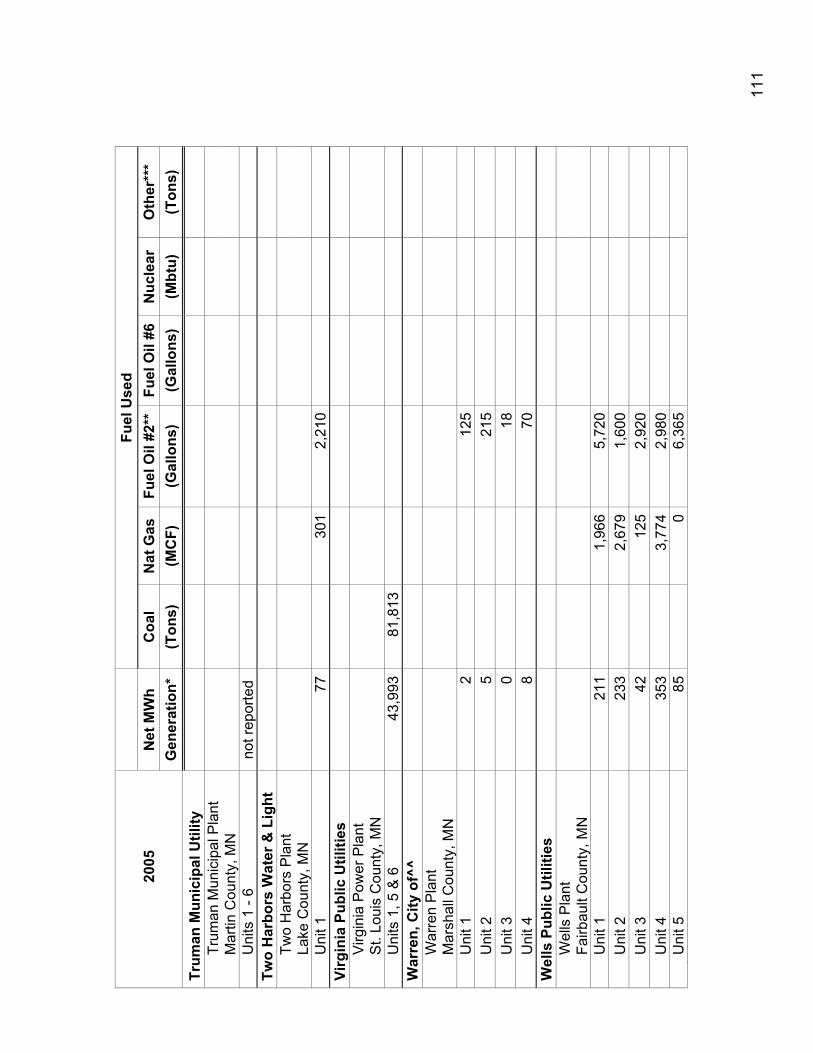
11
1
Fuel
Use
d
2005
N
et M
Wh
Coa
l N
at G
as
Fuel
Oil
#2**
Fu
el O
il #6
Nuc
lear
O
ther
***
Gen
erat
ion*
(T
ons)
(M
CF)
(G
allo
ns)
(Gal
lons
) (M
btu)
(T
ons)
Tr
uman
Mun
icip
al U
tility
Tr
uman
Mun
icip
al P
lant
M
artin
Cou
nty,
MN
U
nits
1 -
6 no
t rep
orte
d
Two
Har
bors
Wat
er &
Lig
ht
Two
Har
bors
Pla
nt
Lake
Cou
nty,
MN
U
nit 1
77
301
2,21
0 Vi
rgin
ia P
ublic
Util
ities
V
irgin
ia P
ower
Pla
nt
St.
Loui
s C
ount
y, M
N
Uni
ts 1
, 5 &
6
43,9
9381
,813
War
ren,
City
of^
^
W
arre
n P
lant
M
arsh
all C
ount
y, M
N
Uni
t 1
212
5
Uni
t 2
521
5
Uni
t 3
018
Uni
t 4
870
W
ells
Pub
lic U
tiliti
es
W
ells
Pla
nt
Fairb
ault
Cou
nty,
MN
U
nit 1
21
11,
966
5,72
0
Uni
t 2
233
2,67
91,
600
U
nit 3
42
125
2,92
0
Uni
t 4
353
3,77
42,
980
U
nit 5
85
06,
365
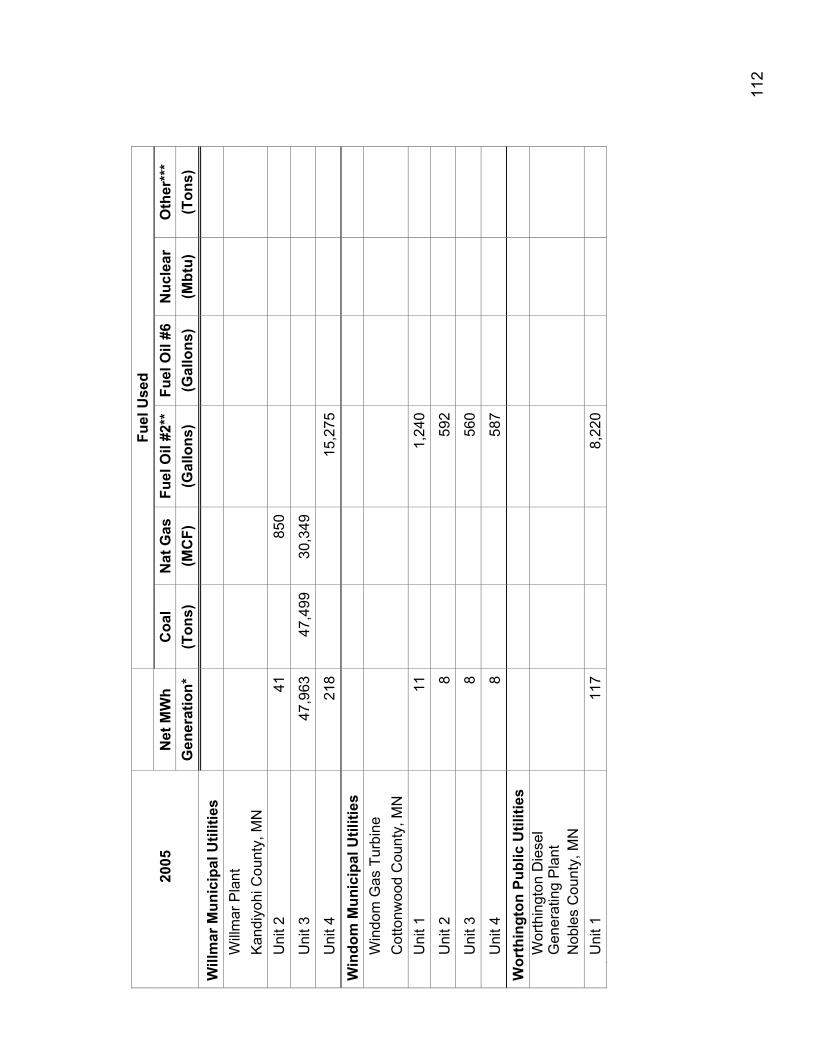
11
2
Fu
el U
sed
20
05
Net
MW
h C
oal
Nat
Gas
Fu
el O
il #2
**
Fuel
Oil
#6N
ucle
ar
Oth
er**
*
G
ener
atio
n*
(Ton
s)
(MC
F)
(Gal
lons
) (G
allo
ns)
(Mbt
u)
(Ton
s)
Will
mar
Mun
icip
al U
tiliti
es
Will
mar
Pla
nt
Kan
diyo
hi C
ount
y, M
N
Uni
t 2
4185
0
U
nit 3
47
,963
47,4
9930
,349
U
nit 4
21
815
,275
W
indo
m M
unic
ipal
Util
ities
W
indo
m G
as T
urbi
ne
Cot
tonw
ood
Cou
nty,
MN
U
nit 1
11
1,24
0
U
nit 2
8
592
U
nit 3
8
560
U
nit 4
8
587
Wor
thin
gton
Pub
lic U
tiliti
es
W
orth
ingt
on D
iese
l G
ener
atin
g P
lant
N
oble
s C
ount
y, M
N
Uni
t 1
117
8,22
0
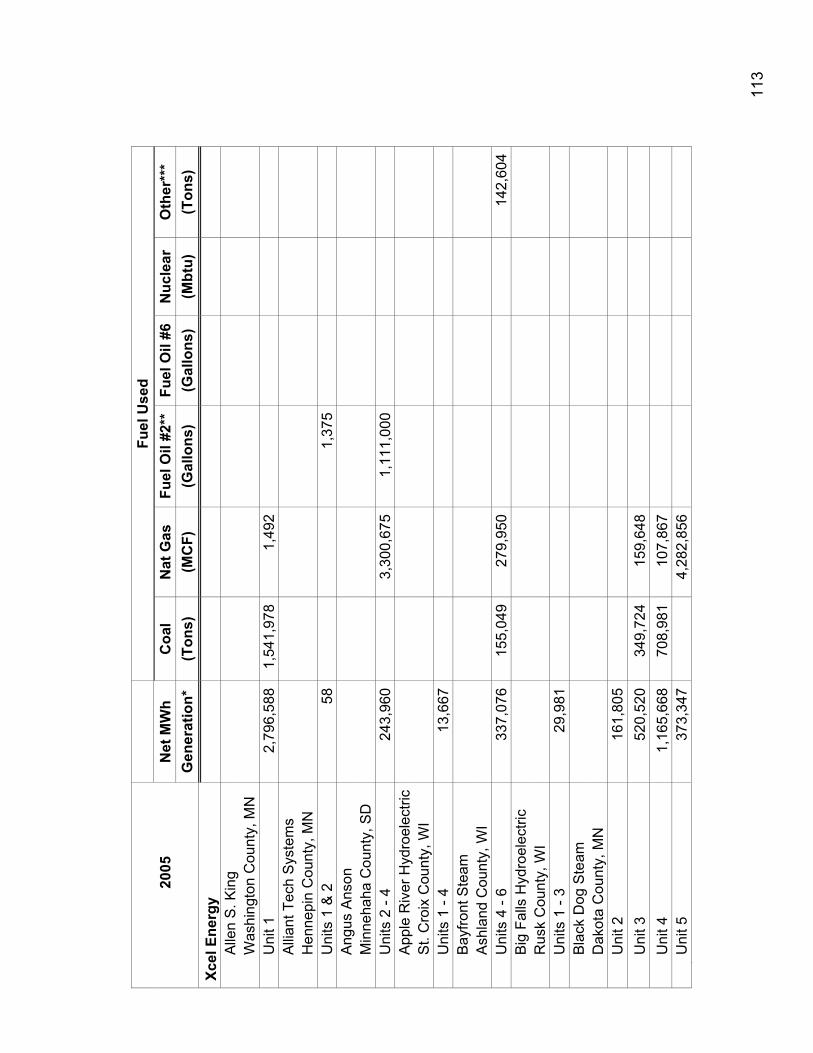
11
3
Fu
el U
sed
20
05
Net
MW
h C
oal
Nat
Gas
Fu
el O
il #2
**
Fuel
Oil
#6N
ucle
ar
Oth
er**
*
G
ener
atio
n*
(Ton
s)
(MC
F)
(Gal
lons
) (G
allo
ns)
(Mbt
u)
(Ton
s)
Xcel
Ene
rgy
Alle
n S
. Kin
g
W
ashi
ngto
n C
ount
y, M
N
Uni
t 1
2,79
6,58
81,
541,
978
1,49
2
Alli
ant T
ech
Sys
tem
s
H
enne
pin
Cou
nty,
MN
U
nits
1 &
2
581,
375
A
ngus
Ans
on
Min
neha
ha C
ount
y, S
D
Uni
ts 2
- 4
243,
960
3,30
0,67
51,
111,
000
A
pple
Riv
er H
ydro
elec
tric
St.
Cro
ix C
ount
y, W
I
U
nits
1 -
4 13
,667
Bay
front
Ste
am
Ash
land
Cou
nty,
WI
Uni
ts 4
- 6
337,
076
155,
049
279,
950
14
2,60
4
Big
Fal
ls H
ydro
elec
tric
Rus
k C
ount
y, W
I
U
nits
1 -
3 29
,981
Bla
ck D
og S
team
D
akot
a C
ount
y, M
N
Uni
t 2
161,
805
Uni
t 3
520,
520
349,
724
159,
648
Uni
t 4
1,16
5,66
870
8,98
110
7,86
7
U
nit 5
37
3,34
74,
282,
856
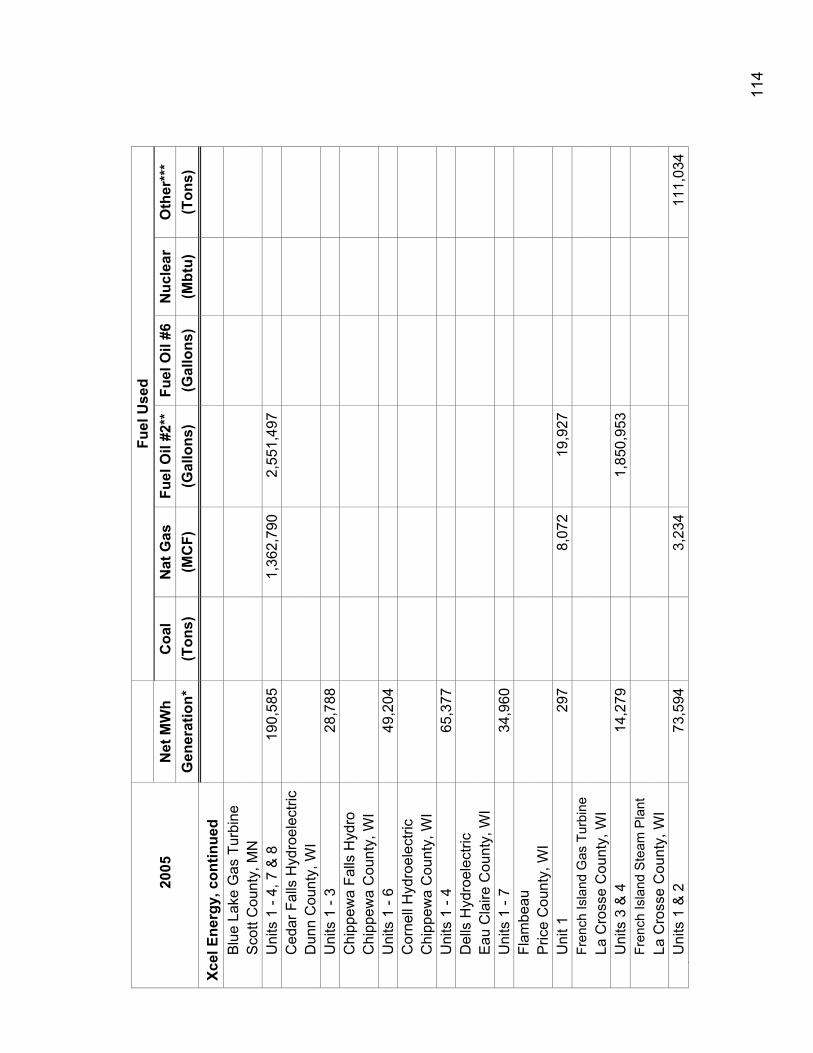
11
4
Fu
el U
sed
20
05
Net
MW
h C
oal
Nat
Gas
Fu
el O
il #2
**
Fuel
Oil
#6N
ucle
ar
Oth
er**
*
G
ener
atio
n*
(Ton
s)
(MC
F)
(Gal
lons
) (G
allo
ns)
(Mbt
u)
(Ton
s)
Xcel
Ene
rgy,
con
tinue
d
B
lue
Lake
Gas
Tur
bine
S
cott
Cou
nty,
MN
U
nits
1 -
4, 7
& 8
19
0,58
51,
362,
790
2,55
1,49
7
Ced
ar F
alls
Hyd
roel
ectri
c
D
unn
Cou
nty,
WI
Uni
ts 1
- 3
28,7
88
C
hipp
ewa
Falls
Hyd
ro
Chi
ppew
a C
ount
y, W
I
U
nits
1 -
6 49
,204
Cor
nell
Hyd
roel
ectri
c
C
hipp
ewa
Cou
nty,
WI
Uni
ts 1
- 4
65,3
77
D
ells
Hyd
roel
ectri
c
E
au C
laire
Cou
nty,
WI
Uni
ts 1
- 7
34,9
60
Fl
ambe
au
Pric
e C
ount
y, W
I
U
nit 1
29
78,
072
19,9
27
Fr
ench
Isla
nd G
as T
urbi
ne
La C
ross
e C
ount
y, W
I
U
nits
3 &
4
14,2
791,
850,
953
Fr
ench
Isla
nd S
team
Pla
nt
La C
ross
e C
ount
y, W
I
U
nits
1 &
2
73,5
943,
234
11
1,03
4
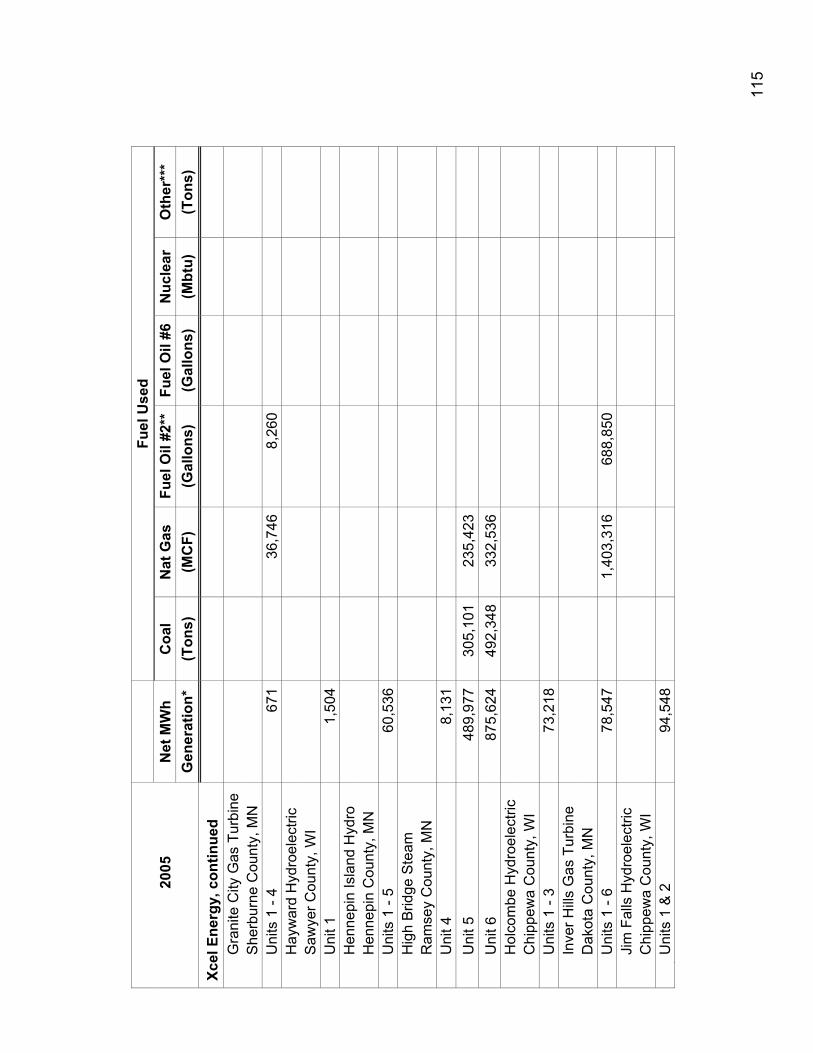
11
5
Fu
el U
sed
20
05
Net
MW
h C
oal
Nat
Gas
Fu
el O
il #2
**
Fuel
Oil
#6N
ucle
ar
Oth
er**
*
G
ener
atio
n*
(Ton
s)
(MC
F)
(Gal
lons
) (G
allo
ns)
(Mbt
u)
(Ton
s)
Xcel
Ene
rgy,
con
tinue
d
G
rani
te C
ity G
as T
urbi
ne
She
rbur
ne C
ount
y, M
N
Uni
ts 1
- 4
671
36,7
468,
260
H
ayw
ard
Hyd
roel
ectri
c
S
awye
r Cou
nty,
WI
Uni
t 1
1,50
4
H
enne
pin
Isla
nd H
ydro
H
enne
pin
Cou
nty,
MN
U
nits
1 -
5 60
,536
Hig
h B
ridge
Ste
am
Ram
sey
Cou
nty,
MN
U
nit 4
8,
131
Uni
t 5
489,
977
305,
101
235,
423
Uni
t 6
875,
624
492,
348
332,
536
Hol
com
be H
ydro
elec
tric
Chi
ppew
a C
ount
y, W
I
U
nits
1 -
3 73
,218
Inve
r Hill
s G
as T
urbi
ne
Dak
ota
Cou
nty,
MN
U
nits
1 -
6 78
,547
1,40
3,31
668
8,85
0
Jim
Fal
ls H
ydro
elec
tric
Chi
ppew
a C
ount
y, W
I
U
nits
1 &
2
94,5
48
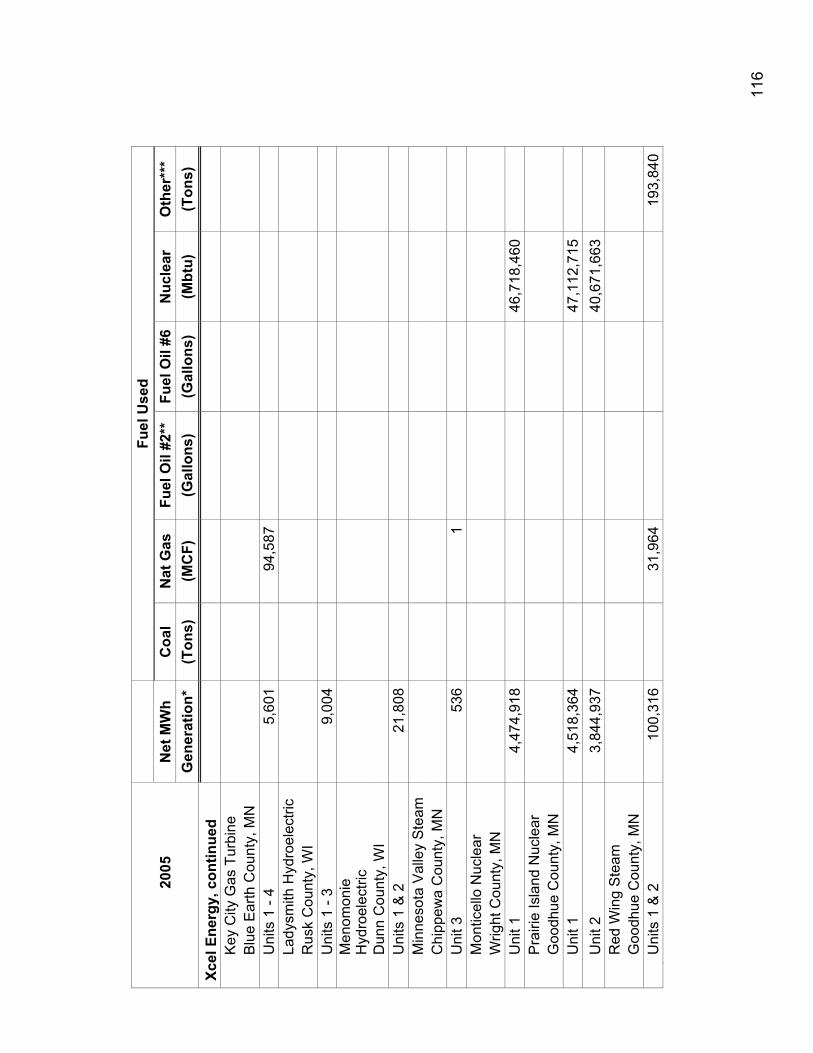
11
6
Fu
el U
sed
20
05
Net
MW
h C
oal
Nat
Gas
Fu
el O
il #2
**
Fuel
Oil
#6N
ucle
ar
Oth
er**
*
G
ener
atio
n*
(Ton
s)
(MC
F)
(Gal
lons
) (G
allo
ns)
(Mbt
u)
(Ton
s)
Xcel
Ene
rgy,
con
tinue
d
K
ey C
ity G
as T
urbi
ne
Blu
e E
arth
Cou
nty,
MN
U
nits
1 -
4 5,
601
94,5
87
La
dysm
ith H
ydro
elec
tric
Rus
k C
ount
y, W
I
U
nits
1 -
3 9,
004
M
enom
onie
H
ydro
elec
tric
D
unn
Cou
nty,
WI
Uni
ts 1
& 2
21
,808
Min
neso
ta V
alle
y S
team
C
hipp
ewa
Cou
nty,
MN
U
nit 3
53
6
1
M
ontic
ello
Nuc
lear
W
right
Cou
nty,
MN
U
nit 1
4,
474,
918
46
,718
,460
P
rairi
e Is
land
Nuc
lear
G
oodh
ue C
ount
y, M
N
Uni
t 1
4,51
8,36
4
47,1
12,7
15
Uni
t 2
3,84
4,93
7
40,6
71,6
63
Red
Win
g S
team
G
oodh
ue C
ount
y, M
N
Uni
ts 1
& 2
10
0,31
631
,964
19
3,84
0
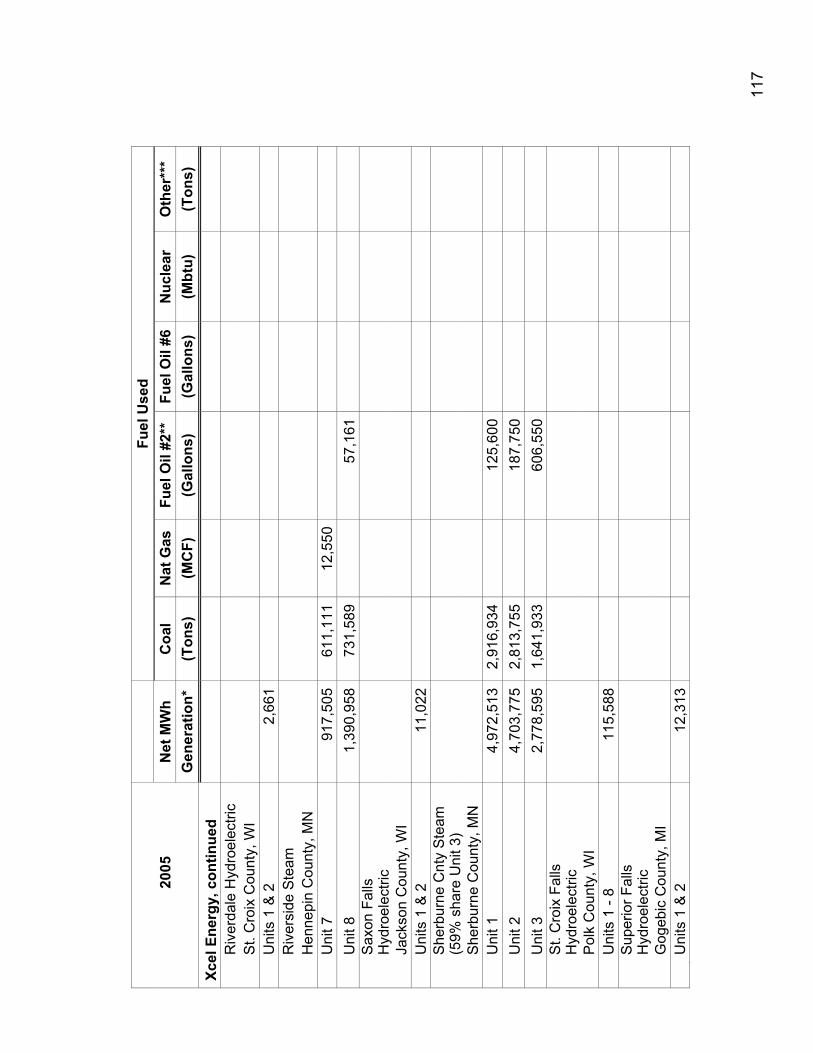
11
7
Fu
el U
sed
20
05
Net
MW
h C
oal
Nat
Gas
Fu
el O
il #2
**
Fuel
Oil
#6N
ucle
ar
Oth
er**
*
G
ener
atio
n*
(Ton
s)
(MC
F)
(Gal
lons
) (G
allo
ns)
(Mbt
u)
(Ton
s)
Xcel
Ene
rgy,
con
tinue
d
R
iver
dale
Hyd
roel
ectri
c
S
t. C
roix
Cou
nty,
WI
Uni
ts 1
& 2
2,
661
Riv
ersi
de S
team
H
enne
pin
Cou
nty,
MN
U
nit 7
91
7,50
561
1,11
112
,550
Uni
t 8
1,39
0,95
873
1,58
957
,161
S
axon
Fal
ls
Hyd
roel
ectri
c
Ja
ckso
n C
ount
y, W
I
U
nits
1 &
2
11,0
22
S
herb
urne
Cnt
y S
team
(5
9% s
hare
Uni
t 3)
S
herb
urne
Cou
nty,
MN
U
nit 1
4,
972,
513
2,91
6,93
412
5,60
0
Uni
t 2
4,70
3,77
52,
813,
755
187,
750
U
nit 3
2,
778,
595
1,64
1,93
360
6,55
0
S
t. C
roix
Fal
ls
Hyd
roel
ectri
c
P
olk
Cou
nty,
WI
Uni
ts 1
- 8
11
5,58
8
S
uper
ior F
alls
H
ydro
elec
tric
G
ogeb
ic C
ount
y, M
I
U
nits
1 &
2
12,3
13
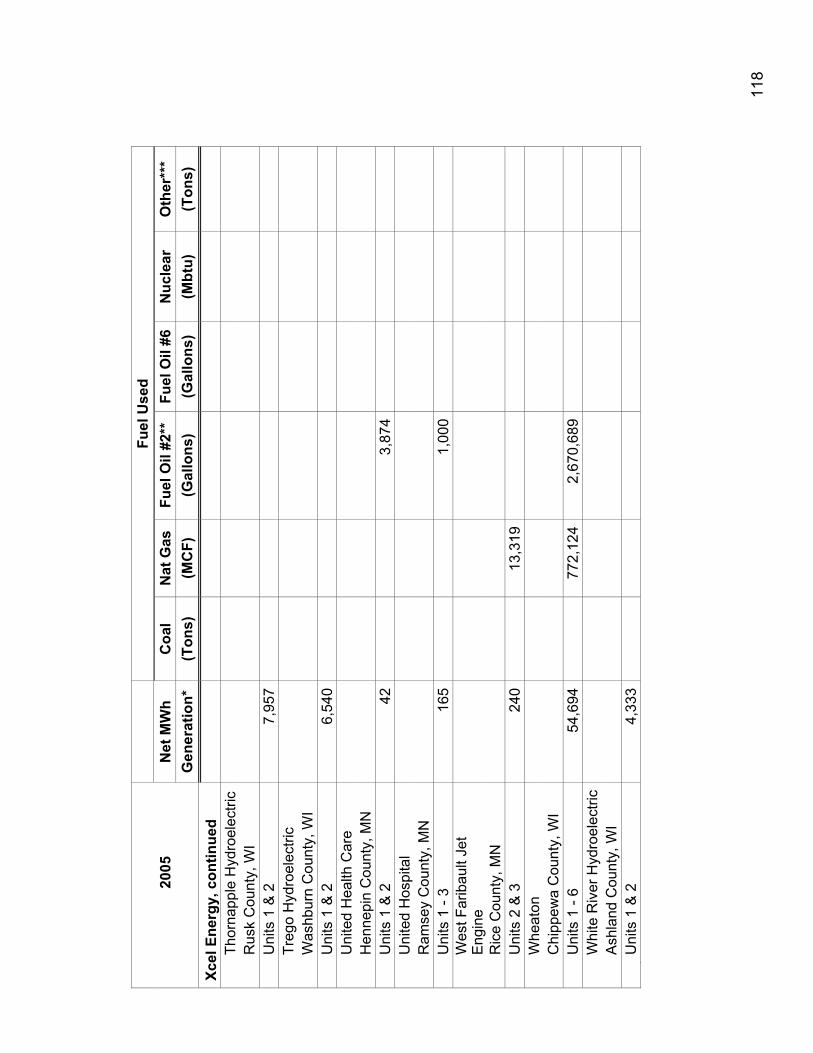
11
8
Fu
el U
sed
20
05
Net
MW
h C
oal
Nat
Gas
Fu
el O
il #2
**
Fuel
Oil
#6N
ucle
ar
Oth
er**
*
G
ener
atio
n*
(Ton
s)
(MC
F)
(Gal
lons
) (G
allo
ns)
(Mbt
u)
(Ton
s)
Xcel
Ene
rgy,
con
tinue
d
Th
orna
pple
Hyd
roel
ectri
c
R
usk
Cou
nty,
WI
Uni
ts 1
& 2
7,
957
Treg
o H
ydro
elec
tric
Was
hbur
n C
ount
y, W
I
U
nits
1 &
2
6,54
0
U
nite
d H
ealth
Car
e
H
enne
pin
Cou
nty,
MN
U
nits
1 &
2
423,
874
U
nite
d H
ospi
tal
Ram
sey
Cou
nty,
MN
U
nits
1 -
3 16
51,
000
W
est F
arib
ault
Jet
Eng
ine
R
ice
Cou
nty,
MN
U
nits
2 &
3
240
13,3
19
W
heat
on
Chi
ppew
a C
ount
y, W
I
U
nits
1 -
6 54
,694
772,
124
2,67
0,68
9
W
hite
Riv
er H
ydro
elec
tric
Ash
land
Cou
nty,
WI
Uni
ts 1
& 2
4,
333
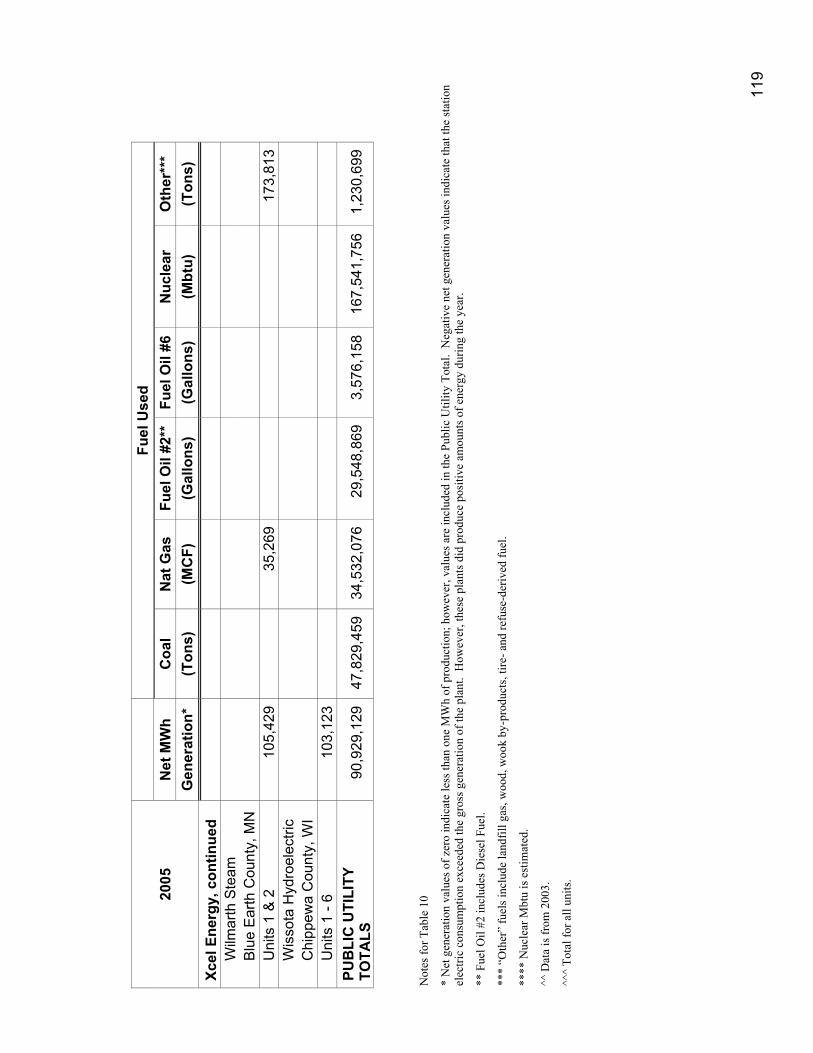
11
9
Fu
el U
sed
20
05
Net
MW
h C
oal
Nat
Gas
Fu
el O
il #2
**
Fuel
Oil
#6N
ucle
ar
Oth
er**
*
G
ener
atio
n*
(Ton
s)
(MC
F)
(Gal
lons
) (G
allo
ns)
(Mbt
u)
(Ton
s)
Xcel
Ene
rgy,
con
tinue
d
W
ilmar
th S
team
B
lue
Ear
th C
ount
y, M
N
Uni
ts 1
& 2
10
5,42
935
,269
17
3,81
3
Wis
sota
Hyd
roel
ectri
c
C
hipp
ewa
Cou
nty,
WI
Uni
ts 1
- 6
103,
123
PU
BLI
C U
TILI
TY
TOTA
LS
90,9
29,1
2947
,829
,459
34,5
32,0
7629
,548
,869
3,
576,
158
167,
541,
756
1,23
0,69
9
Not
es fo
r Tab
le 1
0
* N
et g
ener
atio
n va
lues
of z
ero
indi
cate
less
than
one
MW
h of
pro
duct
ion;
how
ever
, val
ues a
re in
clud
ed in
the
Publ
ic U
tility
Tot
al.
Neg
ativ
e ne
t gen
erat
ion
valu
es in
dica
te th
at th
e st
atio
n el
ectri
c co
nsum
ptio
n ex
ceed
ed th
e gr
oss g
ener
atio
n of
the
plan
t. H
owev
er, t
hese
pla
nts d
id p
rodu
ce p
ositi
ve a
mou
nts o
f ene
rgy
durin
g th
e ye
ar.
** F
uel O
il #2
incl
udes
Die
sel F
uel.
***
“Oth
er”
fuel
s inc
lude
land
fill g
as, w
ood,
woo
k by
-pro
duct
s, tir
e- a
nd re
fuse
-der
ived
fuel
.
****
Nuc
lear
Mbt
u is
est
imat
ed.
^^ D
ata
is fr
om 2
003.
^^^
Tota
l for
all
units
.
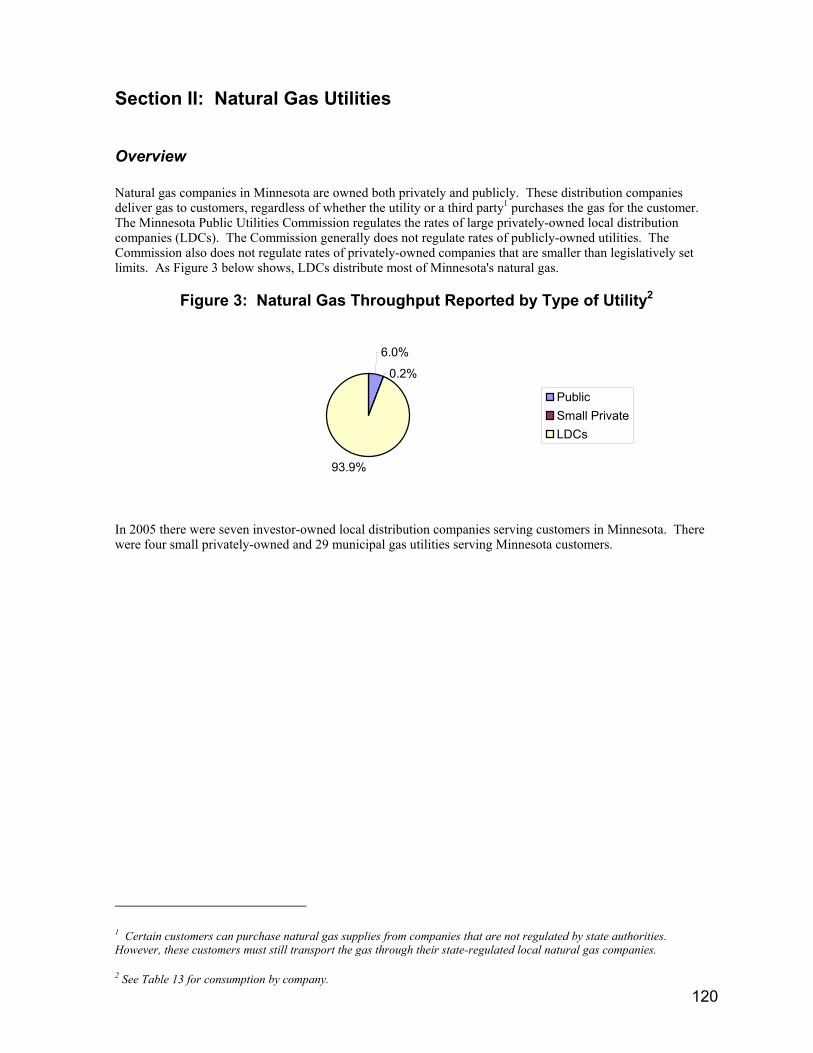
120
Section II: Natural Gas Utilities
Overview
Natural gas companies in Minnesota are owned both privately and publicly. These distribution companies deliver gas to customers, regardless of whether the utility or a third party1 purchases the gas for the customer. The Minnesota Public Utilities Commission regulates the rates of large privately-owned local distribution companies (LDCs). The Commission generally does not regulate rates of publicly-owned utilities. The Commission also does not regulate rates of privately-owned companies that are smaller than legislatively set limits. As Figure 3 below shows, LDCs distribute most of Minnesota's natural gas.
Figure 3: Natural Gas Throughput Reported by Type of Utility2
6.0%
0.2%
93.9%
Public Small PrivateLDCs
In 2005 there were seven investor-owned local distribution companies serving customers in Minnesota. There were four small privately-owned and 29 municipal gas utilities serving Minnesota customers.
1 Certain customers can purchase natural gas supplies from companies that are not regulated by state authorities. However, these customers must still transport the gas through their state-regulated local natural gas companies.
2 See Table 13 for consumption by company.
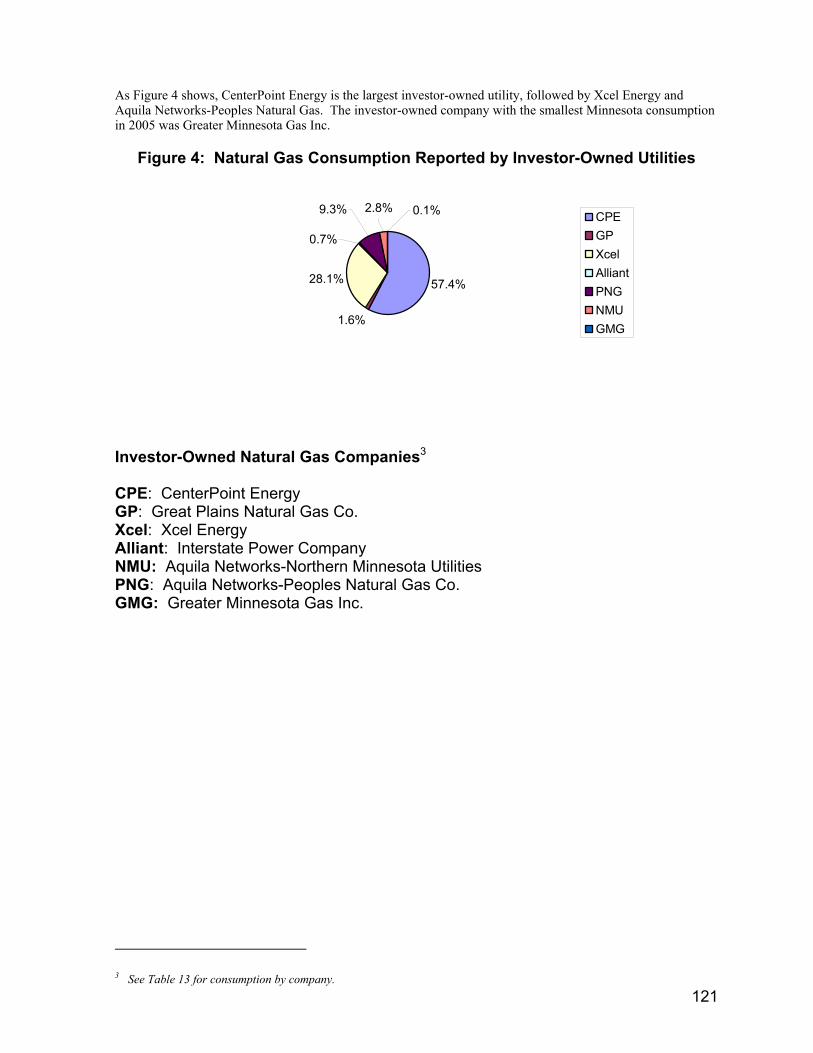
121
As Figure 4 shows, CenterPoint Energy is the largest investor-owned utility, followed by Xcel Energy and Aquila Networks-Peoples Natural Gas. The investor-owned company with the smallest Minnesota consumption in 2005 was Greater Minnesota Gas Inc.
Figure 4: Natural Gas Consumption Reported by Investor-Owned Utilities
57.4%
1.6%
28.1%
0.1%9.3%
0.7%
2.8%CPEGPXcelAlliantPNGNMUGMG
Investor-Owned Natural Gas Companies3 CPE: CenterPoint Energy GP: Great Plains Natural Gas Co. Xcel: Xcel Energy Alliant: Interstate Power Company NMU: Aquila Networks-Northern Minnesota Utilities PNG: Aquila Networks-Peoples Natural Gas Co. GMG: Greater Minnesota Gas Inc.
3 See Table 13 for consumption by company.
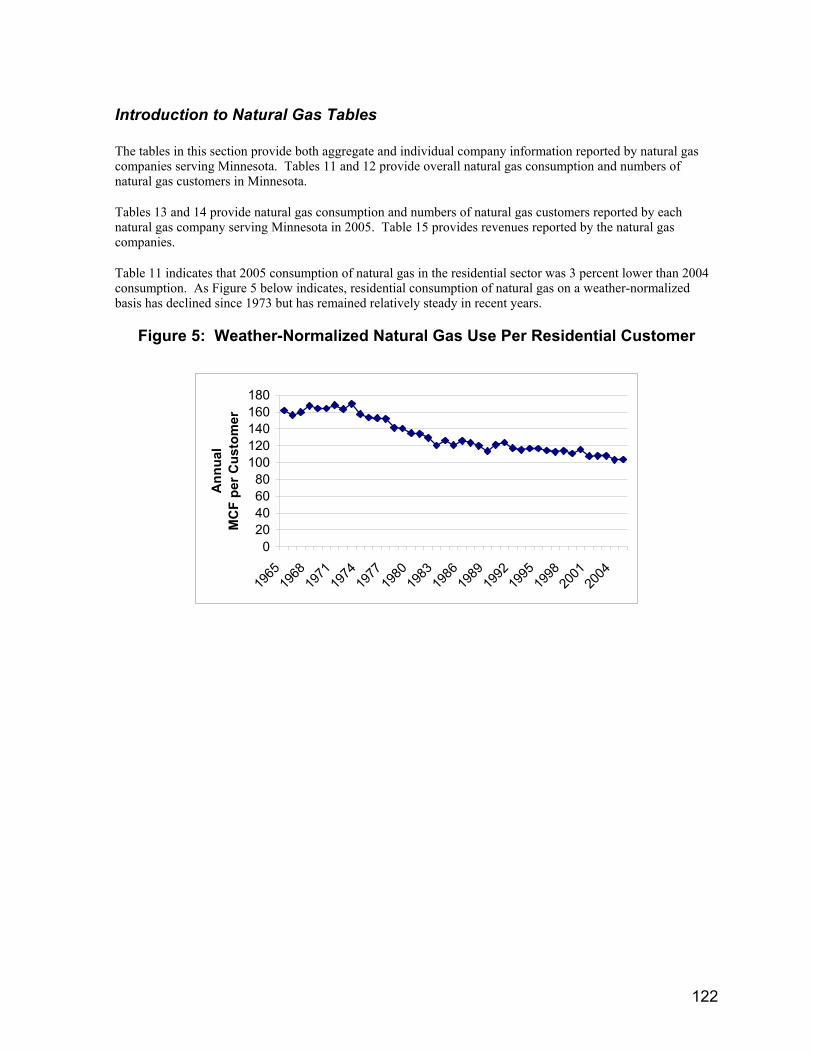
122
Introduction to Natural Gas Tables
The tables in this section provide both aggregate and individual company information reported by natural gas companies serving Minnesota. Tables 11 and 12 provide overall natural gas consumption and numbers of natural gas customers in Minnesota.
Tables 13 and 14 provide natural gas consumption and numbers of natural gas customers reported by each natural gas company serving Minnesota in 2005. Table 15 provides revenues reported by the natural gas companies.
Table 11 indicates that 2005 consumption of natural gas in the residential sector was 3 percent lower than 2004 consumption. As Figure 5 below indicates, residential consumption of natural gas on a weather-normalized basis has declined since 1973 but has remained relatively steady in recent years.
Figure 5: Weather-Normalized Natural Gas Use Per Residential Customer
020406080
100120140160180
1965
1968
1971
1974
1977
1980
1983
1986
1989
1992
1995
1998
2001
2004
Ann
ual
MC
F pe
r Cus
tom
er
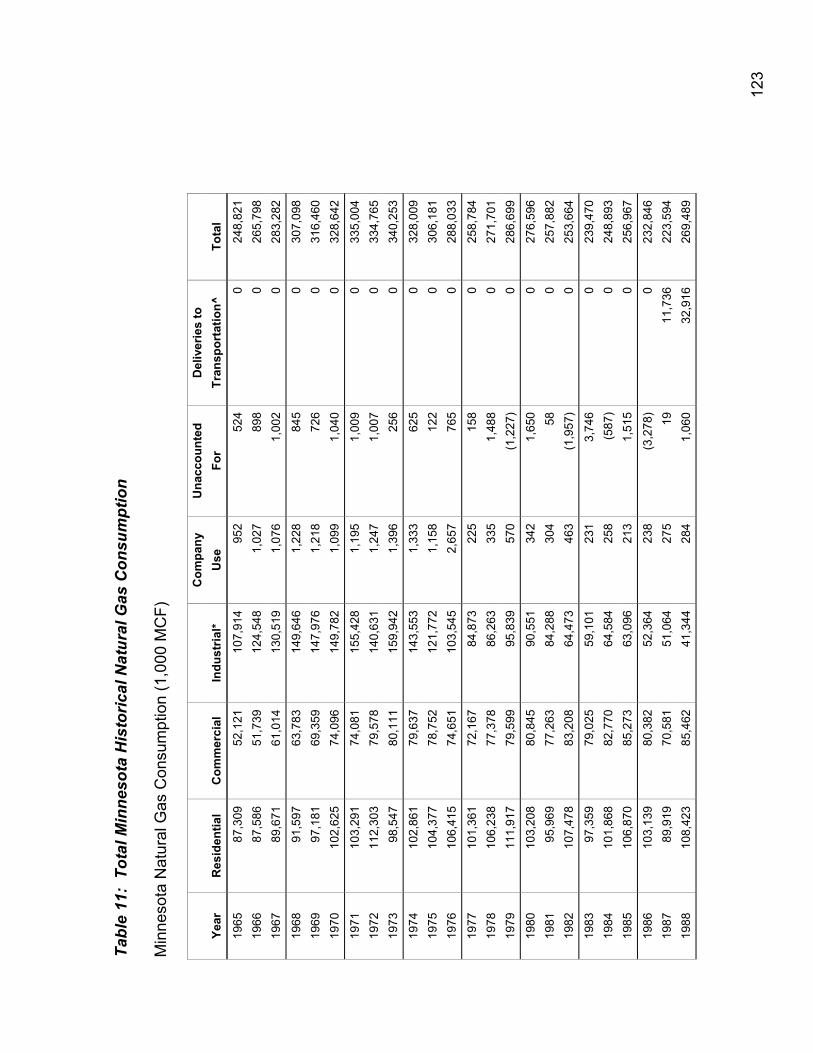
12
3
Tabl
e 11
: To
tal M
inne
sota
His
toric
al N
atur
al G
as C
onsu
mpt
ion
Min
neso
ta N
atur
al G
as C
onsu
mpt
ion
(1,0
00 M
CF)
Com
pany
U
nacc
ount
ed
Del
iver
ies
to
Ye
ar
Res
iden
tial
Com
mer
cial
In
dust
rial*
Use
Fo
r Tr
ansp
orta
tion^
To
tal
1965
87
,309
52
,121
10
7,91
4
952
52
4
0
248,
821
19
66
87,5
86
51,7
39
124,
548
1,
027
89
8
0
265,
798
19
67
89,6
71
61,0
14
130,
519
1,
076
1,
002
0
28
3,28
2
1968
91
,597
63
,783
14
9,64
6
1,22
8
845
0
30
7,09
8
1969
97
,181
69
,359
14
7,97
6
1,21
8
726
0
31
6,46
0
1970
10
2,62
5
74,0
96
149,
782
1,
099
1,
040
0
32
8,64
2
1971
10
3,29
1
74,0
81
155,
428
1,
195
1,
009
0
33
5,00
4
1972
11
2,30
3
79,5
78
140,
631
1,
247
1,
007
0
33
4,76
5
1973
98
,547
80
,111
15
9,94
2
1,39
6
256
0
34
0,25
3
1974
10
2,86
1
79,6
37
143,
553
1,
333
62
5
0
328,
009
19
75
104,
377
78
,752
12
1,77
2
1,15
8
122
0
30
6,18
1
1976
10
6,41
5
74,6
51
103,
545
2,
657
76
5
0
288,
033
1977
10
1,36
1
72,1
67
84,8
73
225
15
8
0
258,
784
19
78
106,
238
77
,378
86
,263
33
5
1,48
8
0
271,
701
19
79
111,
917
79
,599
95
,839
57
0
(1,2
27)
0
28
6,69
9
1980
10
3,20
8
80,8
45
90,5
51
342
1,
650
0
27
6,59
6
1981
95
,969
77
,263
84
,288
30
4
58
0
257,
882
19
82
107,
478
83
,208
64
,473
46
3
(1,9
57)
0
25
3,66
4
1983
97
,359
79
,025
59
,101
23
1
3,74
6
0
239,
470
19
84
101,
868
82
,770
64
,584
25
8
(587
)
0
248,
893
19
85
106,
870
85
,273
63
,096
21
3
1,51
5
0
256,
967
1986
10
3,13
9
80,3
82
52,3
64
238
(3
,278
)
0
232,
846
19
87
89,9
19
70,5
81
51,0
64
275
19
11
,736
22
3,59
4
1988
10
8,42
3
85,4
62
41,3
44
284
1,
060
32
,916
26
9,48
9
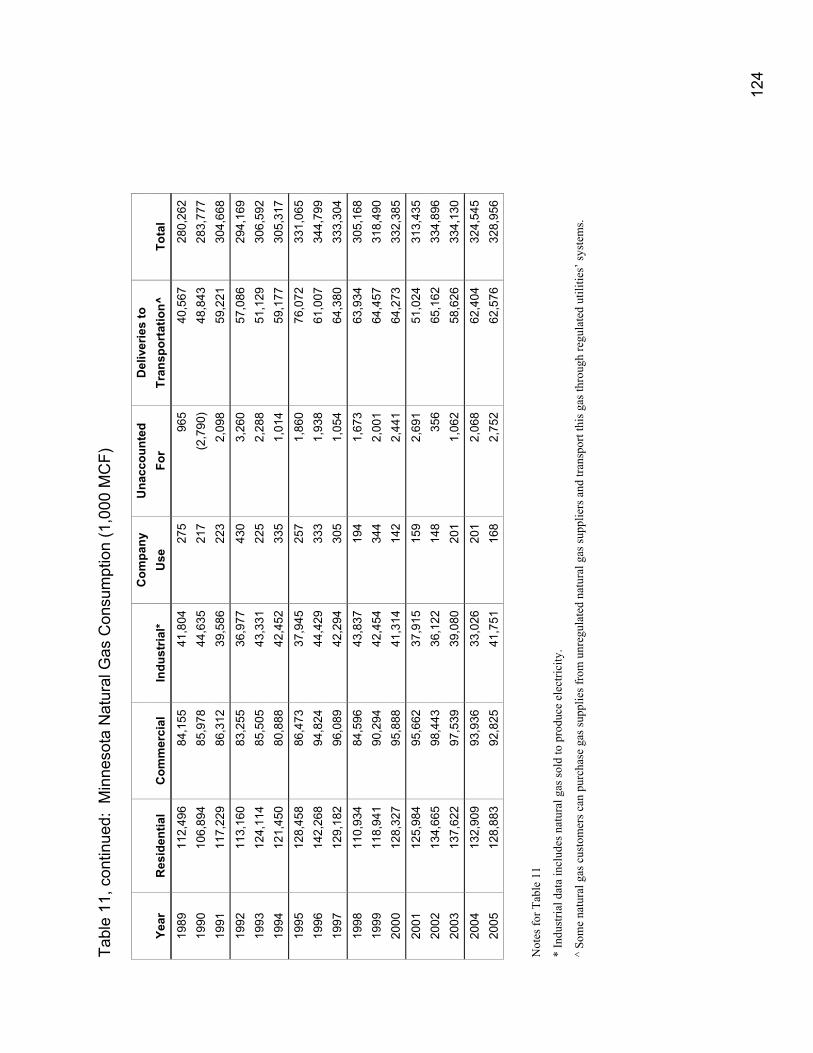
12
4
Tabl
e 11
, con
tinue
d: M
inne
sota
Nat
ural
Gas
Con
sum
ptio
n (1
,000
MC
F)
C
ompa
ny
Una
ccou
nted
D
eliv
erie
s to
Year
R
esid
entia
l C
omm
erci
al
Indu
stria
l* U
se
For
Tran
spor
tatio
n^
Tota
l
1989
11
2,49
6
84,1
55
41,8
04
275
96
5
40,5
67
280,
262
19
90
106,
894
85
,978
44
,635
21
7
(2,7
90)
48
,843
28
3,77
7
1991
11
7,22
9
86,3
12
39,5
86
223
2,
098
59
,221
30
4,66
8
1992
11
3,16
0
83,2
55
36,9
77
430
3,
260
57
,086
29
4,16
9
1993
12
4,11
4
85,5
05
43,3
31
225
2,
288
51
,129
30
6,59
2
1994
12
1,45
0
80,8
88
42,4
52
335
1,
014
59
,177
30
5,31
7
1995
12
8,45
8
86,4
73
37,9
45
257
1,
860
76
,072
33
1,06
5
1996
14
2,26
8
94,8
24
44,4
29
333
1,
938
61
,007
34
4,79
9
1997
12
9,18
2
96,0
89
42,2
94
305
1,
054
64
,380
33
3,30
4
1998
11
0,93
4
84,5
96
43,8
37
194
1,
673
63
,934
30
5,16
8
1999
11
8,94
1
90,2
94
42,4
54
344
2,
001
64
,457
31
8,49
0
2000
12
8,32
7
95,8
88
41,3
14
142
2,
441
64
,273
33
2,38
5
2001
12
5,98
4
95,6
62
37,9
15
159
2,
691
51
,024
31
3,43
5
2002
13
4,66
5
98,4
43
36,1
22
148
35
6
65,1
62
334,
896
20
03
137,
622
97
,539
39
,080
20
1
1,06
2
58,6
26
334,
130
2004
13
2,90
9
93,9
36
33,0
26
201
2,
068
62
,404
32
4,54
5
2005
12
8,88
3
92,8
25
41,7
51
168
2,
752
62
,576
32
8,95
6
Not
es fo
r Tab
le 1
1
* In
dust
rial d
ata
incl
udes
nat
ural
gas
sold
to p
rodu
ce e
lect
ricity
.
^ So
me
natu
ral g
as c
usto
mer
s can
pur
chas
e ga
s sup
plie
s fro
m u
nreg
ulat
ed n
atur
al g
as su
pplie
rs a
nd tr
ansp
ort t
his g
as th
roug
h re
gula
ted
utili
ties’
syst
ems.
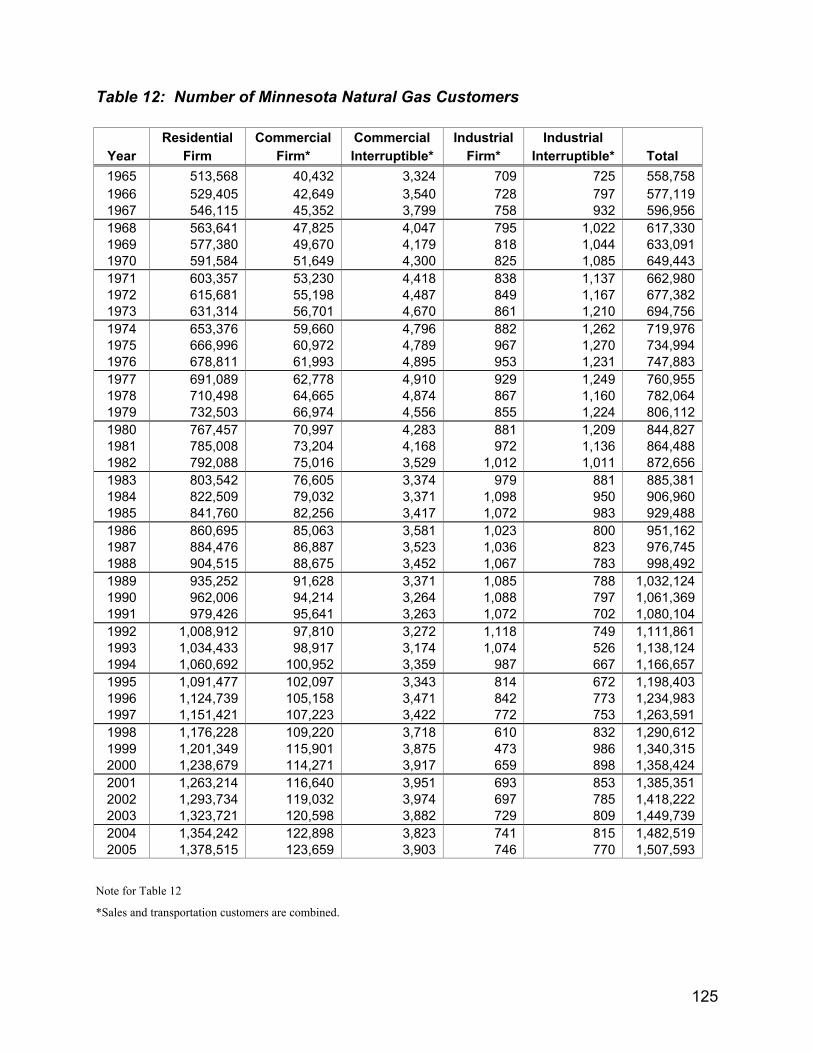
125
Table 12: Number of Minnesota Natural Gas Customers
Residential Commercial Commercial Industrial Industrial Year Firm Firm* Interruptible* Firm* Interruptible* Total 1965 513,568 40,432 3,324 709 725 558,758 1966 529,405 42,649 3,540 728 797 577,119 1967 546,115 45,352 3,799 758 932 596,956 1968 563,641 47,825 4,047 795 1,022 617,330 1969 577,380 49,670 4,179 818 1,044 633,091 1970 591,584 51,649 4,300 825 1,085 649,443 1971 603,357 53,230 4,418 838 1,137 662,980 1972 615,681 55,198 4,487 849 1,167 677,382 1973 631,314 56,701 4,670 861 1,210 694,756 1974 653,376 59,660 4,796 882 1,262 719,976 1975 666,996 60,972 4,789 967 1,270 734,994 1976 678,811 61,993 4,895 953 1,231 747,883 1977 691,089 62,778 4,910 929 1,249 760,955 1978 710,498 64,665 4,874 867 1,160 782,064 1979 732,503 66,974 4,556 855 1,224 806,112 1980 767,457 70,997 4,283 881 1,209 844,827 1981 785,008 73,204 4,168 972 1,136 864,488 1982 792,088 75,016 3,529 1,012 1,011 872,656 1983 803,542 76,605 3,374 979 881 885,381 1984 822,509 79,032 3,371 1,098 950 906,960 1985 841,760 82,256 3,417 1,072 983 929,488 1986 860,695 85,063 3,581 1,023 800 951,162 1987 884,476 86,887 3,523 1,036 823 976,745 1988 904,515 88,675 3,452 1,067 783 998,492 1989 935,252 91,628 3,371 1,085 788 1,032,124 1990 962,006 94,214 3,264 1,088 797 1,061,369 1991 979,426 95,641 3,263 1,072 702 1,080,104 1992 1,008,912 97,810 3,272 1,118 749 1,111,861 1993 1,034,433 98,917 3,174 1,074 526 1,138,124 1994 1,060,692 100,952 3,359 987 667 1,166,657 1995 1,091,477 102,097 3,343 814 672 1,198,403 1996 1,124,739 105,158 3,471 842 773 1,234,983 1997 1,151,421 107,223 3,422 772 753 1,263,591 1998 1,176,228 109,220 3,718 610 832 1,290,612 1999 1,201,349 115,901 3,875 473 986 1,340,315 2000 1,238,679 114,271 3,917 659 898 1,358,424 2001 1,263,214 116,640 3,951 693 853 1,385,351 2002 1,293,734 119,032 3,974 697 785 1,418,222 2003 1,323,721 120,598 3,882 729 809 1,449,739 2004 1,354,242 122,898 3,823 741 815 1,482,519 2005 1,378,515 123,659 3,903 746 770 1,507,593
Note for Table 12
*Sales and transportation customers are combined.
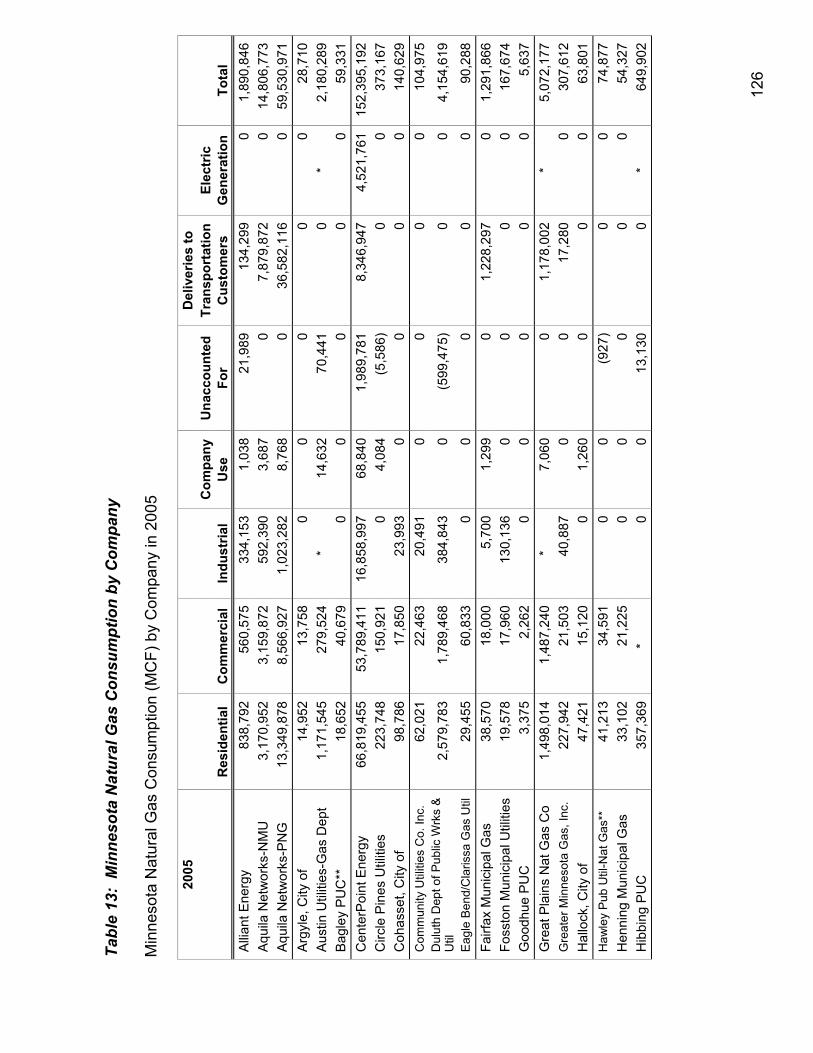
12
6
Tabl
e 13
: M
inne
sota
Nat
ural
Gas
Con
sum
ptio
n by
Com
pany
M
inne
sota
Nat
ural
Gas
Con
sum
ptio
n (M
CF)
by
Com
pany
in 2
005
20
05
D
eliv
erie
s to
Com
pany
U
nacc
ount
ed
Tran
spor
tatio
n El
ectr
ic
Res
iden
tial
Com
mer
cial
In
dust
rial
Use
Fo
r C
usto
mer
s G
ener
atio
n To
tal
Alli
ant E
nerg
y 83
8,79
2 56
0,57
5 33
4,15
3 1,
038
21
,989
13
4,29
9 0
1,89
0,84
6
Aqu
ila N
etw
orks
-NM
U
3,17
0,95
2 3,
159,
872
592,
390
3,68
7
0 7,
879,
872
0 14
,806
,773
A
quila
Net
wor
ks-P
NG
13
,349
,878
8,
566,
927
1,02
3,28
2 8,
768
0
36,5
82,1
16
0 59
,530
,971
A
rgyl
e, C
ity o
f 14
,952
13
,758
0
0
0 0
0 28
,710
A
ustin
Util
ities
-Gas
Dep
t 1,
171,
545
279,
524
* 14
,632
70
,441
0
* 2,
180,
289
B
agle
y P
UC
**
18,6
52
40,6
79
0 0
0
0 0
59,3
31
Cen
terP
oint
Ene
rgy
66,8
19,4
55
53,7
89,4
11
16,8
58,9
97
68,8
40
1,98
9,78
1 8,
346,
947
4,52
1,76
1 15
2,39
5,19
2
Circ
le P
ines
Util
ities
22
3,74
8 15
0,92
1 0
4,08
4
(5,5
86)
0 0
373,
167
C
ohas
set,
City
of
98,7
86
17,8
50
23,9
93
0
0 0
0 14
0,62
9
Com
mun
ity U
tiliti
es C
o. In
c.
62,0
21
22,4
63
20,4
91
0
0 0
0 10
4,97
5
Dul
uth
Dep
t of P
ublic
Wrk
s &
U
til
2,57
9,78
3 1,
789,
468
384,
843
0
(599
,475
)0
0 4,
154,
619
Eag
le B
end/
Cla
rissa
Gas
Util
29
,455
60
,833
0
0
0 0
0 90
,288
Fa
irfax
Mun
icip
al G
as
38,5
70
18,0
00
5,70
0 1,
299
0
1,22
8,29
7 0
1,29
1,86
6
Foss
ton
Mun
icip
al U
tiliti
es
19,5
78
17,9
60
130,
136
0
0 0
0 16
7,67
4
Goo
dhue
PU
C
3,37
5 2,
262
0 0
0
0 0
5,63
7
Gre
at P
lain
s N
at G
as C
o 1,
498,
014
1,48
7,24
0 *
7,06
0
0 1,
178,
002
* 5,
072,
177
G
reat
er M
inne
sota
Gas
, Inc
. 22
7,94
2 21
,503
40
,887
0
0
17,2
80
0 30
7,61
2
Hal
lock
, City
of
47,4
21
15,1
20
0 1,
260
0
0 0
63,8
01
Haw
ley
Pub
Util
-Nat
Gas
**
41,2
13
34,5
91
0 0
(9
27)
0 0
74,8
77
Hen
ning
Mun
icip
al G
as
33,1
02
21,2
25
0 0
0
0 0
54,3
27
Hib
bing
PU
C
357,
369
* 0
0
13,1
30
0 *
649,
902
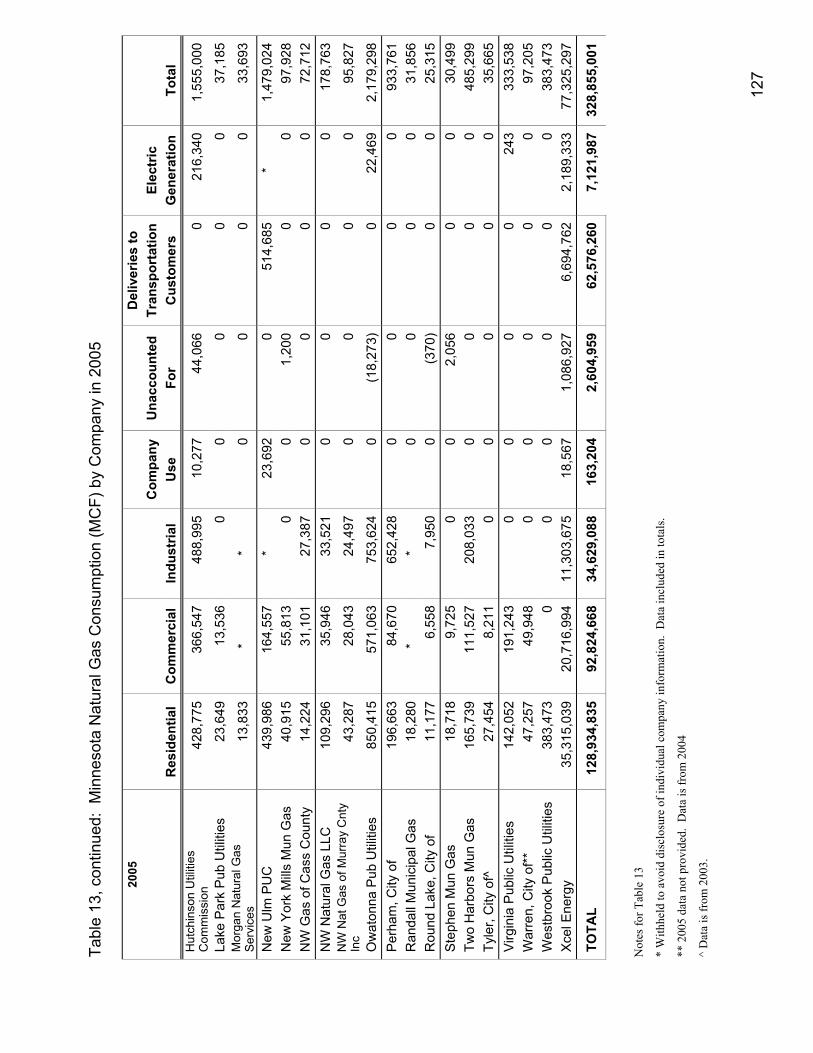
12
7
Tabl
e 13
, con
tinue
d: M
inne
sota
Nat
ural
Gas
Con
sum
ptio
n (M
CF)
by
Com
pany
in 2
005
20
05
D
eliv
erie
s to
C
ompa
ny
Una
ccou
nted
Tr
ansp
orta
tion
Elec
tric
R
esid
entia
l C
omm
erci
al
Indu
stria
l U
se
For
Cus
tom
ers
Gen
erat
ion
Tota
l H
utch
inso
n U
tiliti
es
Com
mis
sion
42
8,77
5 36
6,54
7 48
8,99
5 10
,277
44
,066
0
216,
340
1,55
5,00
0
Lake
Par
k P
ub U
tiliti
es
23,6
49
13,5
36
0 0
0
0 0
37,1
85
Mor
gan
Nat
ural
Gas
S
ervi
ces
13,8
33
* *
0
0 0
0 33
,693
New
Ulm
PU
C
439,
986
164,
557
* 23
,692
0
514,
685
* 1,
479,
024
N
ew Y
ork
Mill
s M
un G
as
40,9
15
55,8
13
0 0
1,
200
0 0
97,9
28
NW
Gas
of C
ass
Cou
nty
14,2
24
31,1
01
27,3
87
0
0 0
0 72
,712
N
W N
atur
al G
as L
LC
109,
296
35,9
46
33,5
21
0
0 0
0 17
8,76
3
NW
Nat
Gas
of M
urra
y C
nty
Inc
43,2
87
28,0
43
24,4
97
0
0 0
0 95
,827
Ow
aton
na P
ub U
tiliti
es
850,
415
571,
063
753,
624
0
(18,
273)
0 22
,469
2,
179,
298
P
erha
m, C
ity o
f 19
6,66
3 84
,670
65
2,42
8 0
0
0 0
933,
761
R
anda
ll M
unic
ipal
Gas
18
,280
*
* 0
0
0 0
31,8
56
Rou
nd L
ake,
City
of
11,1
77
6,55
8 7,
950
0
(370
)0
0 25
,315
S
teph
en M
un G
as
18,7
18
9,72
5 0
0
2,05
6 0
0 30
,499
Tw
o H
arbo
rs M
un G
as
165,
739
111,
527
208,
033
0
0 0
0 48
5,29
9
Tyle
r, C
ity o
f^
27,4
54
8,21
1 0
0
0 0
0 35
,665
V
irgin
ia P
ublic
Util
ities
14
2,05
2 19
1,24
3 0
0
0 0
243
333,
538
W
arre
n, C
ity o
f**
47,2
57
49,9
48
0 0
0
0 0
97,2
05
Wes
tbro
ok P
ublic
Util
ities
38
3,47
3 0
0 0
0
0 0
383,
473
X
cel E
nerg
y 35
,315
,039
20
,716
,994
11
,303
,675
18
,567
1,
086,
927
6,69
4,76
2 2,
189,
333
77,3
25,2
97
TOTA
L 12
8,93
4,83
5 92
,824
,668
34
,629
,088
16
3,20
4
2,60
4,95
9 62
,576
,260
7,
121,
987
328,
855,
001
Not
es fo
r Tab
le 1
3
* W
ithhe
ld to
avo
id d
iscl
osur
e of
indi
vidu
al c
ompa
ny in
form
atio
n. D
ata
incl
uded
in to
tals
.
** 2
005
data
not
pro
vide
d. D
ata
is fr
om 2
004
^ D
ata
is fr
om 2
003.
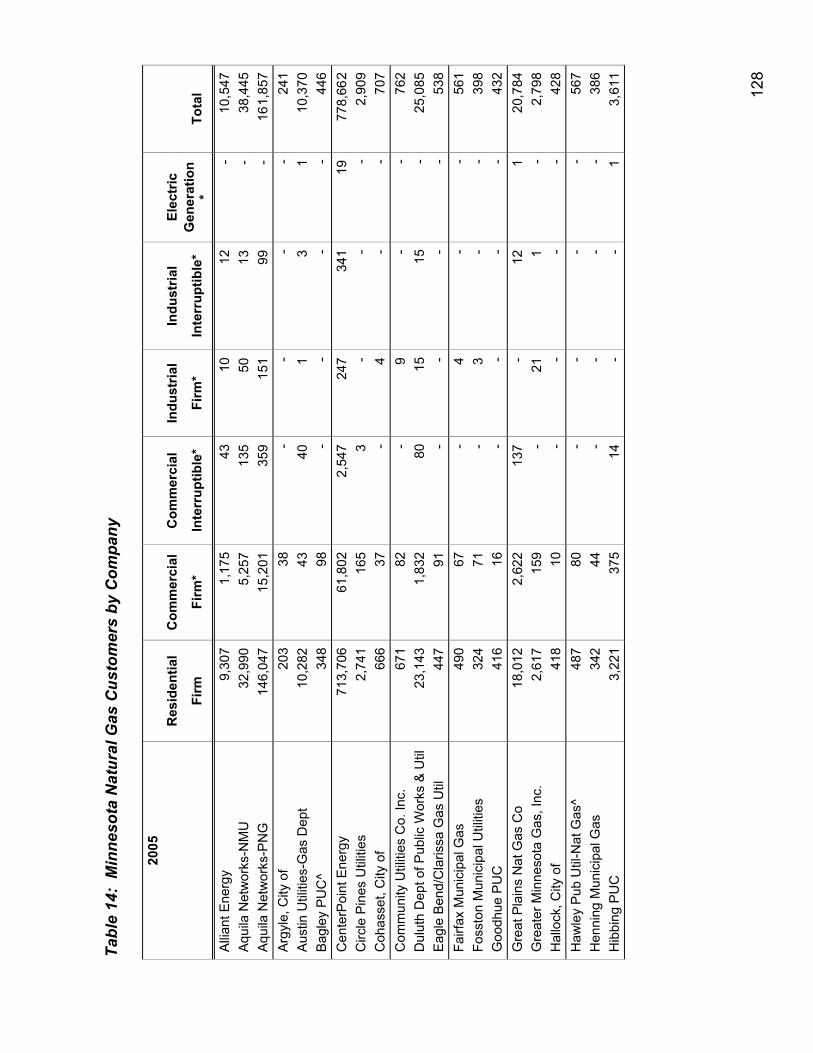
12
8
Tabl
e 14
: M
inne
sota
Nat
ural
Gas
Cus
tom
ers
by C
ompa
ny
20
05
R
esid
entia
l C
omm
erci
al
Com
mer
cial
In
dust
rial
Indu
stria
l El
ectr
ic
Fi
rm
Firm
* In
terr
uptib
le*
Firm
* In
terr
uptib
le*
Gen
erat
ion
* To
tal
Allia
nt E
nerg
y
9,3
07
1
,175
43
10
12
- 10
,547
A
quila
Net
wor
ks-N
MU
32,9
90
5
,257
1
35
50
13
- 38
,445
A
quila
Net
wor
ks-P
NG
1
46,0
47
15
,201
3
59
151
99
- 16
1,85
7
Argy
le, C
ity o
f
2
03
38
-
-
-
- 24
1
Aust
in U
tiliti
es-G
as D
ept
10
,282
43
40
1
3
1
10,3
70
Bagl
ey P
UC
^
3
48
98
-
-
-
- 44
6
Cen
terP
oint
Ene
rgy
713
,706
61,8
02
2
,547
2
47
341
19
778,
662
C
ircle
Pin
es U
tiliti
es
2
,741
1
65
3
-
-
-
2,90
9
Coh
asse
t, C
ity o
f
6
66
37
-
4
-
- 70
7
Com
mun
ity U
tiliti
es C
o. In
c.
671
82
-
9
-
-
762
D
ulut
h D
ept o
f Pub
lic W
orks
& U
til
23
,143
1,8
32
80
15
15
-
25,0
85
Eag
le B
end/
Cla
rissa
Gas
Util
4
47
91
-
-
-
- 53
8
Fairf
ax M
unic
ipal
Gas
4
90
67
-
4
-
- 56
1
Foss
ton
Mun
icip
al U
tiliti
es
324
71
-
3
-
-
398
G
oodh
ue P
UC
4
16
16
-
-
-
- 43
2
Gre
at P
lain
s N
at G
as C
o
18,0
12
2
,622
1
37
-
12
1
20
,784
G
reat
er M
inne
sota
Gas
, Inc
.
2,6
17
159
-
21
1
- 2,
798
H
allo
ck, C
ity o
f
4
18
10
-
-
-
- 42
8
Haw
ley
Pub
Util
-Nat
Gas
^
4
87
80
-
-
-
- 56
7
Hen
ning
Mun
icip
al G
as
342
44
-
-
-
-
386
H
ibbi
ng P
UC
3,2
21
375
14
-
-
1
3,
611
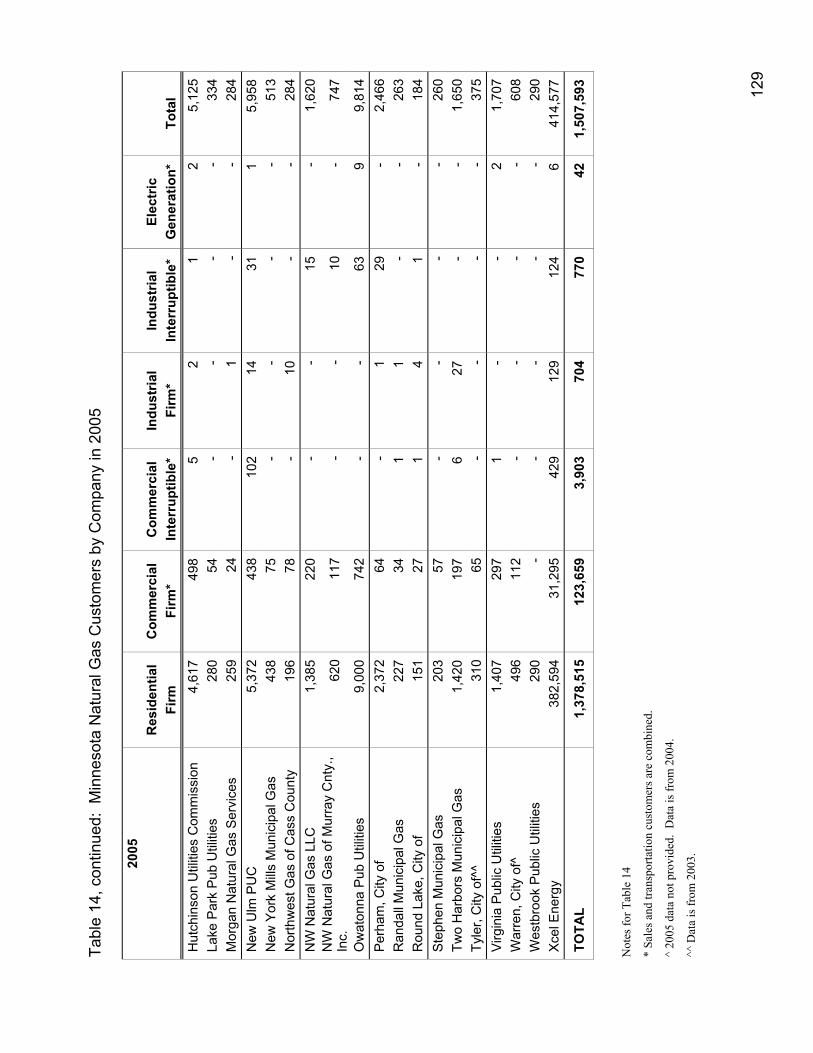
12
9
Tabl
e 14
, con
tinue
d: M
inne
sota
Nat
ural
Gas
Cus
tom
ers
by C
ompa
ny in
200
5
2005
Res
iden
tial
Com
mer
cial
C
omm
erci
al
Indu
stria
l In
dust
rial
Elec
tric
Firm
Fi
rm*
Inte
rrup
tible
* Fi
rm*
Inte
rrup
tible
* G
ener
atio
n*
Tota
l H
utch
inso
n U
tiliti
es C
omm
issi
on
4
,617
4
98
5
2
1
2
5,12
5
Lake
Par
k Pu
b U
tiliti
es
280
54
-
-
-
-
334
M
orga
n N
atur
al G
as S
ervi
ces
259
24
-
1
-
-
284
N
ew U
lm P
UC
5,3
72
438
1
02
14
31
1
5,
958
N
ew Y
ork
Mills
Mun
icip
al G
as
438
75
-
-
-
-
513
N
orth
wes
t Gas
of C
ass
Cou
nty
196
78
-
10
-
-
284
N
W N
atur
al G
as L
LC
1
,385
2
20
-
-
15
-
1,62
0
NW
Nat
ural
Gas
of M
urra
y C
nty.
, In
c.
620
1
17
-
-
10
-
747
Ow
aton
na P
ub U
tiliti
es
9
,000
7
42
-
-
63
9
9,81
4
Perh
am, C
ity o
f
2,3
72
64
-
1
29
- 2,
466
R
anda
ll M
unic
ipal
Gas
2
27
34
1
1
-
- 26
3
Rou
nd L
ake,
City
of
151
27
1
4
1
-
184
St
ephe
n M
unic
ipal
Gas
2
03
57
-
-
-
- 26
0
Two
Har
bors
Mun
icip
al G
as
1
,420
1
97
6
27
-
-
1,65
0
Tyle
r, C
ity o
f^^
310
65
-
-
-
-
375
Vi
rgin
ia P
ublic
Util
ities
1,4
07
297
1
-
-
2
1,
707
W
arre
n, C
ity o
f^
496
1
12
-
-
-
-
608
W
estb
rook
Pub
lic U
tiliti
es
290
-
-
-
-
-
290
X
cel E
nerg
y
3
82,5
94
31
,295
4
29
129
1
24
6
41
4,57
7
TOTA
L
1,3
78,5
15
123
,659
3,9
03
704
7
70
42
1,
507,
593
Not
es fo
r Tab
le 1
4
* Sa
les a
nd tr
ansp
orta
tion
cust
omer
s are
com
bine
d.
^ 20
05 d
ata
not p
rovi
ded.
Dat
a is
from
200
4.
^^ D
ata
is fr
om 2
003.
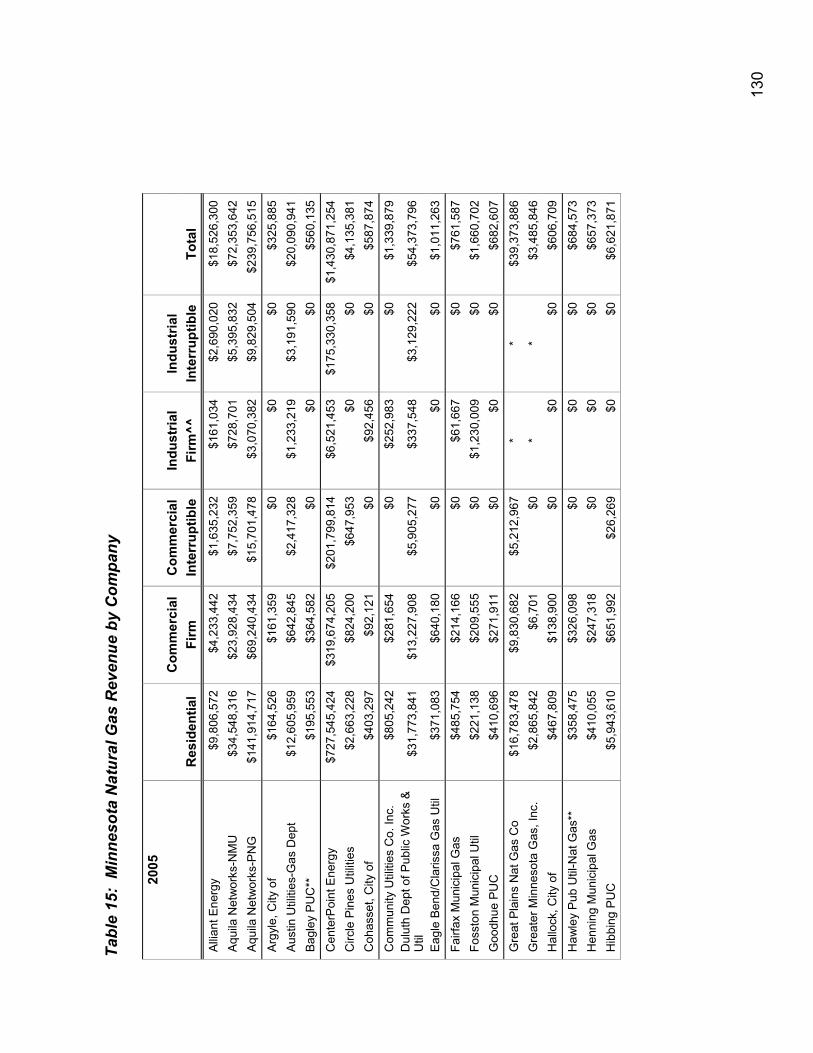
13
0
Tabl
e 15
: M
inne
sota
Nat
ural
Gas
Rev
enue
by
Com
pany
2005
Com
mer
cial
C
omm
erci
al
Indu
stria
l In
dust
rial
R
esid
entia
l Fi
rm
Inte
rrup
tible
Fi
rm^^
In
terr
uptib
le
Tota
l Al
liant
Ene
rgy
$9,8
06,5
72
$4,2
33,4
42
$1,6
35,2
32
$161
,034
$2
,690
,020
$1
8,52
6,30
0 Aq
uila
Net
wor
ks-N
MU
$3
4,54
8,31
6 $2
3,92
8,43
4 $7
,752
,359
$7
28,7
01
$5,3
95,8
32
$72,
353,
642
Aqu
ila N
etw
orks
-PN
G
$141
,914
,717
$6
9,24
0,43
4 $1
5,70
1,47
8 $3
,070
,382
$9
,829
,504
$2
39,7
56,5
15
Arg
yle,
City
of
$164
,526
$1
61,3
59
$0
$0
$0
$325
,885
A
ustin
Util
ities
-Gas
Dep
t $1
2,60
5,95
9 $6
42,8
45
$2,4
17,3
28
$1,2
33,2
19
$3,1
91,5
90
$20,
090,
941
Bagl
ey P
UC
**
$195
,553
$3
64,5
82
$0
$0
$0
$560
,135
Cen
terP
oint
Ene
rgy
$727
,545
,424
$3
19,6
74,2
05
$201
,799
,814
$6
,521
,453
$1
75,3
30,3
58
$1,4
30,8
71,2
54
Circ
le P
ines
Util
ities
$2
,663
,228
$8
24,2
00
$647
,953
$0
$0
$4
,135
,381
C
ohas
set,
City
of
$403
,297
$9
2,12
1 $0
$9
2,45
6 $0
$5
87,8
74
Com
mun
ity U
tiliti
es C
o. In
c.
$805
,242
$2
81,6
54
$0
$252
,983
$0
$1
,339
,879
D
ulut
h D
ept o
f Pub
lic W
orks
&
Util
$3
1,77
3,84
1 $1
3,22
7,90
8 $5
,905
,277
$3
37,5
48
$3,1
29,2
22
$54,
373,
796
Eag
le B
end/
Cla
rissa
Gas
Util
$3
71,0
83
$640
,180
$0
$0
$0
$1
,011
,263
Fairf
ax M
unic
ipal
Gas
$4
85,7
54
$214
,166
$0
$6
1,66
7 $0
$7
61,5
87
Foss
ton
Mun
icip
al U
til
$221
,138
$2
09,5
55
$0
$1,2
30,0
09
$0
$1,6
60,7
02
Goo
dhue
PU
C
$410
,696
$2
71,9
11
$0
$0
$0
$682
,607
Gre
at P
lain
s N
at G
as C
o $1
6,78
3,47
8 $9
,830
,682
$5
,212
,967
*
* $3
9,37
3,88
6 G
reat
er M
inne
sota
Gas
, Inc
. $2
,865
,842
$6
,701
$0
*
* $3
,485
,846
H
allo
ck, C
ity o
f $4
67,8
09
$138
,900
$0
$0
$0
$6
06,7
09
Haw
ley
Pub
Util
-Nat
Gas
**
$358
,475
$3
26,0
98
$0
$0
$0
$684
,573
H
enni
ng M
unic
ipal
Gas
$4
10,0
55
$247
,318
$0
$0
$0
$6
57,3
73
Hib
bing
PU
C
$5,9
43,6
10
$651
,992
$2
6,26
9 $0
$0
$6
,621
,871
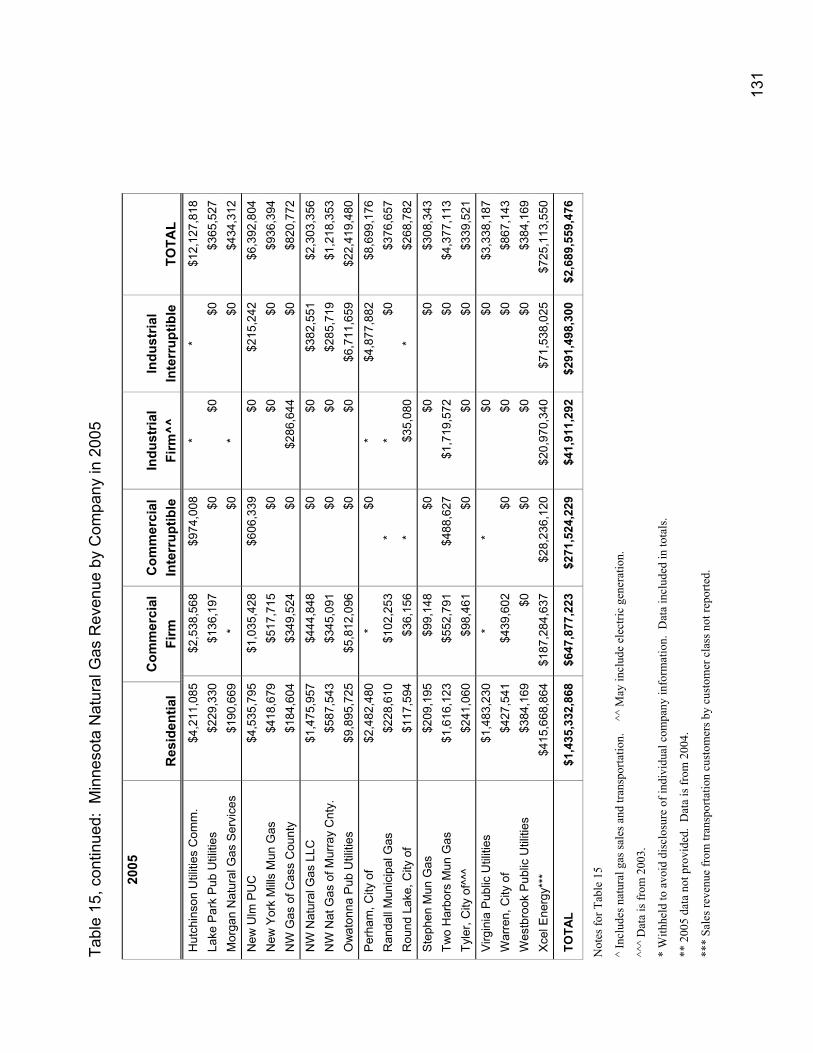
13
1
Tabl
e 15
, con
tinue
d: M
inne
sota
Nat
ural
Gas
Rev
enue
by
Com
pany
in 2
005
20
05
C
omm
erci
al
Com
mer
cial
In
dust
rial
Indu
stria
l
Res
iden
tial
Firm
In
terr
uptib
le
Firm
^^
Inte
rrup
tible
TO
TAL
Hut
chin
son
Util
ities
Com
m.
$4,2
11,0
85
$2,5
38,5
68
$974
,008
*
* $1
2,12
7,81
8 La
ke P
ark
Pub
Util
ities
$2
29,3
30
$136
,197
$0
$0
$0
$3
65,5
27
Mor
gan
Nat
ural
Gas
Ser
vice
s $1
90,6
69
* $0
*
$0
$434
,312
New
Ulm
PU
C
$4,5
35,7
95
$1,0
35,4
28
$606
,339
$0
$2
15,2
42
$6,3
92,8
04
New
Yor
k M
ills M
un G
as
$418
,679
$5
17,7
15
$0
$0
$0
$936
,394
N
W G
as o
f Cas
s C
ount
y $1
84,6
04
$349
,524
$0
$2
86,6
44
$0
$820
,772
NW
Nat
ural
Gas
LLC
$1
,475
,957
$4
44,8
48
$0
$0
$382
,551
$2
,303
,356
N
W N
at G
as o
f Mur
ray
Cnt
y.
$587
,543
$3
45,0
91
$0
$0
$285
,719
$1
,218
,353
O
wat
onna
Pub
Util
ities
$9
,895
,725
$5
,812
,096
$0
$0
$6
,711
,659
$2
2,41
9,48
0
Per
ham
, City
of
$2,4
82,4
80
* $0
*
$4,8
77,8
82
$8,6
99,1
76
Ran
dall
Mun
icip
al G
as
$228
,610
$1
02,2
53
* *
$0
$376
,657
R
ound
Lak
e, C
ity o
f $1
17,5
94
$36,
156
* $3
5,08
0 *
$268
,782
Step
hen
Mun
Gas
$2
09,1
95
$99,
148
$0
$0
$0
$308
,343
Tw
o H
arbo
rs M
un G
as
$1,6
16,1
23
$552
,791
$4
88,6
27
$1,7
19,5
72
$0
$4,3
77,1
13
Tyle
r, C
ity o
f^^^
$2
41,0
60
$98,
461
$0
$0
$0
$339
,521
Virg
inia
Pub
lic U
tiliti
es
$1,4
83,2
30
* *
$0
$0
$3,3
38,1
87
War
ren,
City
of
$427
,541
$4
39,6
02
$0
$0
$0
$867
,143
W
estb
rook
Pub
lic U
tiliti
es
$384
,169
$0
$0
$0
$0
$3
84,1
69
Xcel
Ene
rgy*
**
$415
,668
,864
$1
87,2
84,6
37
$28,
236,
120
$20,
970,
340
$71,
538,
025
$725
,113
,550
TOTA
L $1
,435
,332
,868
$6
47,8
77,2
23
$271
,524
,229
$4
1,91
1,29
2 $2
91,4
98,3
00
$2,6
89,5
59,4
76
Not
es fo
r Tab
le 1
5
^ In
clud
es n
atur
al g
as sa
les a
nd tr
ansp
orta
tion.
^
^ M
ay in
clud
e el
ectri
c ge
nera
tion.
^^^
Dat
a is
from
200
3.
* W
ithhe
ld to
avo
id d
iscl
osur
e of
indi
vidu
al c
ompa
ny in
form
atio
n. D
ata
incl
uded
in to
tals
.
** 2
005
data
not
pro
vide
d. D
ata
is fr
om 2
004.
***
Sale
s rev
enue
from
tran
spor
tatio
n cu
stom
ers b
y cu
stom
er c
lass
not
repo
rted.
132
Section III: Attachments
General Notes on Data
1) Consumption. In general, electric companies report retail electric consumption as follows:
Farm. Electricity supplied to farm households and for agricultural purposes.
Residential. Electricity supplied to non-farm private households.
Commercial. Electricity supplied to small commercial and industrial power accounts. May include use by some apartment dwellers.
Industrial. Electricity supplied to large commercial and industrial power accounts, including mining accounts.
2) Missing Data. Although all utilities are required to report data used in this report annually, some utilities have provided either partial information or no information. In some places, this report notes where these utilities have not reported information. In other places, for the general purpose of comparing 2005 data to previous years’ data, this report shows the most recent comparable data for non-reporting companies.
3) Accuracy of Data. While the Department does not audit the records supporting the data companies provide, we do check the reasonableness of the data. We also correct errors in reported data where feasible. However, some data reported by smaller companies may contain a few errors or inconsistencies. These errors should not significantly affect the totals.
133
Glossary of Terms and Abbreviations
Btu: British thermal unit; the amount of heat required to raise the temperature of one pound of water one degree Fahrenheit under stated conditions of pressure and temperature (equal to 252 calories, 778 foot-pounds, 1,005 joules and 0.293 watt-hours). It is the U.S. customary unit of measuring the quality of heat, such as the heat content of fuel.
cf: cubic foot; the U.S. customary unit of measurement of gas volume. It is the amount of gas required to fill a volume of one cubic foot under stated conditions of temperature, pressure and water vapor. One cubic foot of natural gas equals 1,000 British thermal units under standard conditions of atmosphere (one) and temperature (60 degrees Fahrenheit).
Ccf: one hundred cubic feet.
Cooperative utility: a utility owned and operated by its members.
Department of DOC: the Minnesota Department of Commerce.
Gas turbine: a type of electric generation plant that relies on turbines driven by the combustion of natural gas or diesel fuel to produce electricity.
GWh: gigawat-hour; the unit of energy equal to that expended in one hour at a rate of one billion watts. One GWh equals 1,000 megawatt-hours.
Hydro: a type of electric generation plant that relies on a water wheel to convert falling water into electricity.
Int. comb. (Internal Combustion): a type of electric generation unit that relies on an internal combustion engine to convert burned diesel, fuel oil, gasoline, or natural gas into electricity.
Investor-owned utility (IOU): Common term for an electric privately-owned utility regulated by the Minnesota Public Utilities Commission.
kW: one kilowatt or one thousand watts.
Local Distribution Company (LDC): Common term for a gas privately-owned utility regulated by the MPUC.
Mcf: one thousand cubic feet; a unit of measure of gas volume.
Minnesota Public Utilities Commission (Commission): the state agency with regulatory jurisdiction over certain Minnesota utilities.
MWh: megawatt-hour; the unit of energy equal to that expended in one hour at a rate of one million watts. One MWh equals 3,414,000 Btus.
Natural Gas (gas): a mixture of hydrocarbon compounds and small quantities of various non-hydrocarbons existing in the gaseous phase or in solution with crude oil in natural underground reservoirs. It comes from the ground with or without crude oil and is generally much higher in heat content than manufactured gas.
Net generation: the total amount of electric energy produced by a generating unit less the electricity consumed by the generating station.
Nuclear: a type of electric generation plant that uses energy obtained by fission, fusion or by radioactive decay to drive the turbines.
134
Number 2 fuel oil: a distillate fuel oil used for domestic heating and in moderate capacity commercial or industrial burners as well as for generating electricity.
Number 6 fuel oil: a residual fuel oil that is heavier than distillate fuel oil and is sued to generate electricity as well as in industrial burners.
Plant capacity: the amount of electric load, measured in megawatts or kilowatts, for which a generating unit is rated either by the user or the manufacturer.
Privately-owned utilities: utility corporations owned by shareholders. Large privately-owned utilities are regulated by the Minnesota Public Utilities Commission.
Publicly-owned utilities: utilities owned, operated and regulated by the city or legal entity in which it resides.
REIS: Regional Energy Information System; the Minnesota Department of Commerce’s computerized state energy data collection and information system. It includes energy data the DOC collects directly from energy suppliers as well as data collected by other state departments such as the Minnesota Department of Revenue, Petroleum Tax Division.
RDF: refuse-derived fuel, composed of garbage, that is used in some electric generation plants.
Steam: a type of electric generation plant that relies on steam-driven turbines to generate electricity. Steam is produced in a boiler heated by several combinations of fossil, refuse-derived, or wood-waste fuels.
Transportation (of natural gas): the action taken by a retail customer who purchases natural gas supplies directly from a supplier or marketer and then moves or transports the gas through a utility’s distribution system to the customer’s destination.
Watt: the unit of measure for electric power or rate of doing work. The rate of energy transfer equivalent to one ampere flowing under pressure of one volt.
Weather-normalized information: information adjusted to remove fluctuation due to changes in weather.
Wind: a type of electric generation plant that uses turbines powered by wind to generate electricity.