Embed Size (px)
Citation preview
A Regional Energy Strategy for the West Midlands
March 2018
Final Draft for Consultation

Acknowledgements
Funding and support for this work has been provided at various times by BEIS, the University of Warwick,
the University of Birmingham, the Energy Systems Catapult, Climate-KIC, and the three Local Enterprise
Partnerships of the Black Country, Greater Birmingham and Solihull, and Coventry and Warwickshire.
Key local stakeholders also gave freely of their time and knowledge through the Energy Capital partnership
and in many one-to-one discussions, and the support and contributions of Birmingham, Coventry, Solihull,
Wolverhampton, Dudley, Sandwell and Walsall and Warwickshire Councils; National Grid, Western Power
Distribution, Severn Trent Water, Cadent, Jaguar Land Rover, Webster and Horsfall, Sustainability West
Midlands, Aston University, Ecuity Consulting, and Westley Group are particularly appreciated.
Table of Contents
Executive Summary ........................................................................................................... 1
1. Introduction ................................................................................................................ 4
2. The West Midlands ..................................................................................................... 6
History, geography and political context.............................................................................. 6
Key local stakeholders .......................................................................................................... 7
3. Economic opportunity ................................................................................................. 9
Energy in the West Midlands Economy ................................................................................ 9
Investment flows................................................................................................................ 12
Economic activity ............................................................................................................... 13
Carbon emissions and environment................................................................................... 13
Specific regional opportunities and needs ......................................................................... 14
Global markets ................................................................................................................... 19
4. Challenges and constraints........................................................................................ 21
The speed and nature of technological change and choice in energy systems .................. 21
Customer engagement in energy markets ......................................................................... 22
Narrow definitions of innovation ....................................................................................... 22
Diversity of local ambitions ................................................................................................ 23
Complexity of political institutions and public sector capacity .......................................... 24
Existing industrial strengths ............................................................................................... 25
A mismatch between regulatory system design and market opportunities ....................... 25
5. Our regional energy strategy ..................................................................................... 28
Overview and principles ..................................................................................................... 28
Objectives and vision ......................................................................................................... 29
Anticipated projects and pipeline - who picks the winners (and losers)? .......................... 29
Energy Innovation Zones .................................................................................................... 31
Wider initiatives, including cluster development and business support ............................ 32
Roles and responsibilities ................................................................................................... 33
Funding, governance and resourcing ................................................................................. 35
Relationship to other regions ............................................................................................. 36
6. Global best practice .................................................................................................. 37
UK examples ...................................................................................................................... 37
International examples ...................................................................................................... 38
7. Next steps ................................................................................................................. 39
West Midlands Regional Energy Strategy March 2018
Appendix I – Sub-regional mapping reports ..................................................................... 41
Appendix II – Pilot Energy Innovation Zones and Investment Cases ................................. 45
UK Central Hub ...................................................................................................................... 46
Tyseley and Birmingham ........................................................................................................ 48
Black Country ......................................................................................................................... 50
Coventry and Warwickshire ................................................................................................... 53
Appendix III – Strategy consultation and approval process .............................................. 55
Appendix IV – Attendees at the stakeholder engagement event ...................................... 56
References ....................................................................................................................... 57
Table of Figures
Figure 1 West Midlands Regional Energy Strategy governance ............................................................ 3
Figure 2 Overview of energy strategy workstreams ............................................................................. 5
Figure 3 The West Midlands Combined Authority geography .............................................................. 6
Figure 4 GVA in 2015 and growth 2010-15 for West Midlands LEPs and those of other regions. ......... 7
Figure 5 The West Midlands energy economy ...................................................................................... 9
Figure 6 Commercial energy costs compared internationally ............................................................. 10
Figure 7 Split of electricity costs for a medium-sized West Midlands manufacturer .......................... 10
Figure 8 International comparison of electricity prices....................................................................... 11
Figure 9 West Midlands annual investment flows - energy ................................................................ 12
Figure 10 West Midlands Industrial Strategy Framework ................................................................... 14
Figure 11 Historic growth of distributed generation in the West Midlands ........................................ 17
Figure 12 Projected future distributed generation investment in the West Midlands to 2030 .......... 18
Figure 13 How costs of energy technologies can fall rapidly .............................................................. 19
Figure 14 How the UK energy market is structured ............................................................................ 26
Figure 15 Energy Innovation Zones schematic (courtesy Dr Gavin DJ Harper) ................................... 31
Figure 16 Impacting GVA through regional energy strategy ............................................................... 32
Figure 17 Access to international best practice networks via Climate KIC .......................................... 33
Figure 18 West Midlands Regional Energy Strategy governance ........................................................ 35
Figure 19 High level strategy implementation timeline ...................................................................... 39
Figure 20 GBSLEP energy network opportunities ............................................................................... 42
Figure 21 Sample heat and power demand map ................................................................................ 43
Figure 22 Energy from waste opportunities in the Black Country ....................................................... 43
Figure 23 Private wire opportunities in the Black Country ................................................................. 44
Figure 24 Typical large scale solar opportunity in the Black Country .................................................. 44
Figure 25 UK Central Hub .................................................................................................................... 46
Figure 26 Breakdown of electricity charges for a large regional manufacturing business, 2017. ....... 50
Figure 27 International comparison of electricity prices of energy intensive industries, 2015. .......... 51
Figure 28 Proposed Coventry and Warwickshire EIZ........................................................................... 53
P a g e 1 | 64
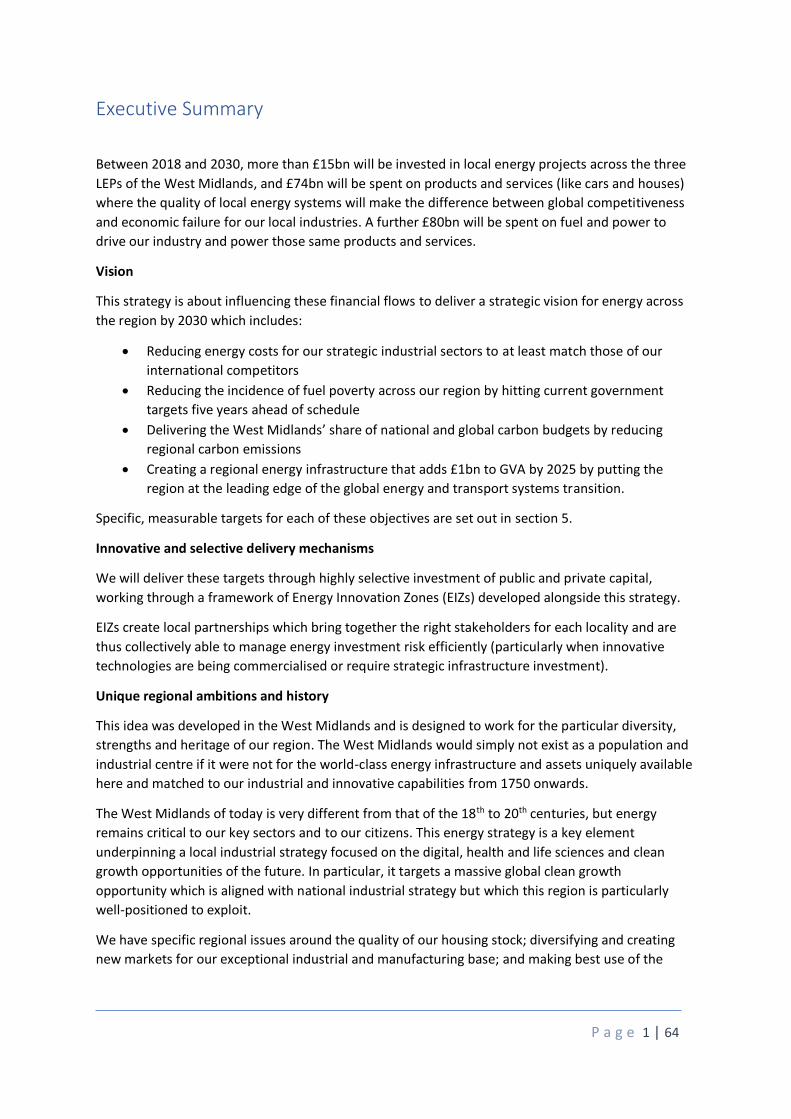
Executive Summary
Between 2018 and 2030, more than £15bn will be invested in local energy projects across the three
LEPs of the West Midlands, and £74bn will be spent on products and services (like cars and houses)
where the quality of local energy systems will make the difference between global competitiveness
and economic failure for our local industries. A further £80bn will be spent on fuel and power to
drive our industry and power those same products and services.
Vision
This strategy is about influencing these financial flows to deliver a strategic vision for energy across
the region by 2030 which includes:
• Reducing energy costs for our strategic industrial sectors to at least match those of our
international competitors
• Reducing the incidence of fuel poverty across our region by hitting current government
targets five years ahead of schedule
• Delivering the West Midlands’ share of national and global carbon budgets by reducing
regional carbon emissions
• Creating a regional energy infrastructure that adds £1bn to GVA by 2025 by putting the
region at the leading edge of the global energy and transport systems transition.
Specific, measurable targets for each of these objectives are set out in section 5.
Innovative and selective delivery mechanisms
We will deliver these targets through highly selective investment of public and private capital,
working through a framework of Energy Innovation Zones (EIZs) developed alongside this strategy.
EIZs create local partnerships which bring together the right stakeholders for each locality and are
thus collectively able to manage energy investment risk efficiently (particularly when innovative
technologies are being commercialised or require strategic infrastructure investment).
Unique regional ambitions and history
This idea was developed in the West Midlands and is designed to work for the particular diversity,
strengths and heritage of our region. The West Midlands would simply not exist as a population and
industrial centre if it were not for the world-class energy infrastructure and assets uniquely available
here and matched to our industrial and innovative capabilities from 1750 onwards.
The West Midlands of today is very different from that of the 18th to 20th centuries, but energy
remains critical to our key sectors and to our citizens. This energy strategy is a key element
underpinning a local industrial strategy focused on the digital, health and life sciences and clean
growth opportunities of the future. In particular, it targets a massive global clean growth
opportunity which is aligned with national industrial strategy but which this region is particularly
well-positioned to exploit.
We have specific regional issues around the quality of our housing stock; diversifying and creating
new markets for our exceptional industrial and manufacturing base; and making best use of the
West Midlands Regional Energy Strategy March 2018
P a g e 2 | 64
imagination and creativity of our innovators and academic institutions. This strategy recognises and
responds to all of these issues.
Contributing to national challenges and needs
However, this strategy has also been developed against the backdrop of a fundamental transition in
global energy systems which is widely recognised and which is also creating challenges and
opportunities at global and national level. Effective regional leadership in energy is key to
responding to these national and global challenges, so this strategy sees the West Midlands
contributing constructively to changing the way energy is regulated and managed nationally,
working with other devolved regions and authorities across the UK.
Financial implications and approach
Four pilot EIZS have been identified and preliminary investment cases developed for this strategy.
These EIZs will act as a focus for between £270M and £490M of energy systems investment over the
next 15 years, delivering the first £200M of the £1bn GVA target. The remaining £800M will be
delivered through a range of initiatives including:
• Additional Energy Innovation Zones
• Strategic infrastructure support for accelerated new market development for locally sourced
products such as electric vehicles and smart connected and low carbon housing
• Seeking to establish a legacy bank to cover sunk costs of stranded and legacy energy
infrastructure assets and using this to reduce energy costs for innovative and competitive
manufacturers
• Energy efficiency programmes for manufacturing and residential sectors
• Simplifying access and improving the transparency of energy markets for business customers
• More rigorous and targeted new build housing energy efficiency standards
• Large scale retrofit programmes for fuel poor households and energy-inefficient housing
• A focused cluster support programme including incubation of clean technology businesses
and specialist support in energy to established businesses, working with regional and
international partners
We propose to establish a £500M specialist regional investment fund to support these initiatives.
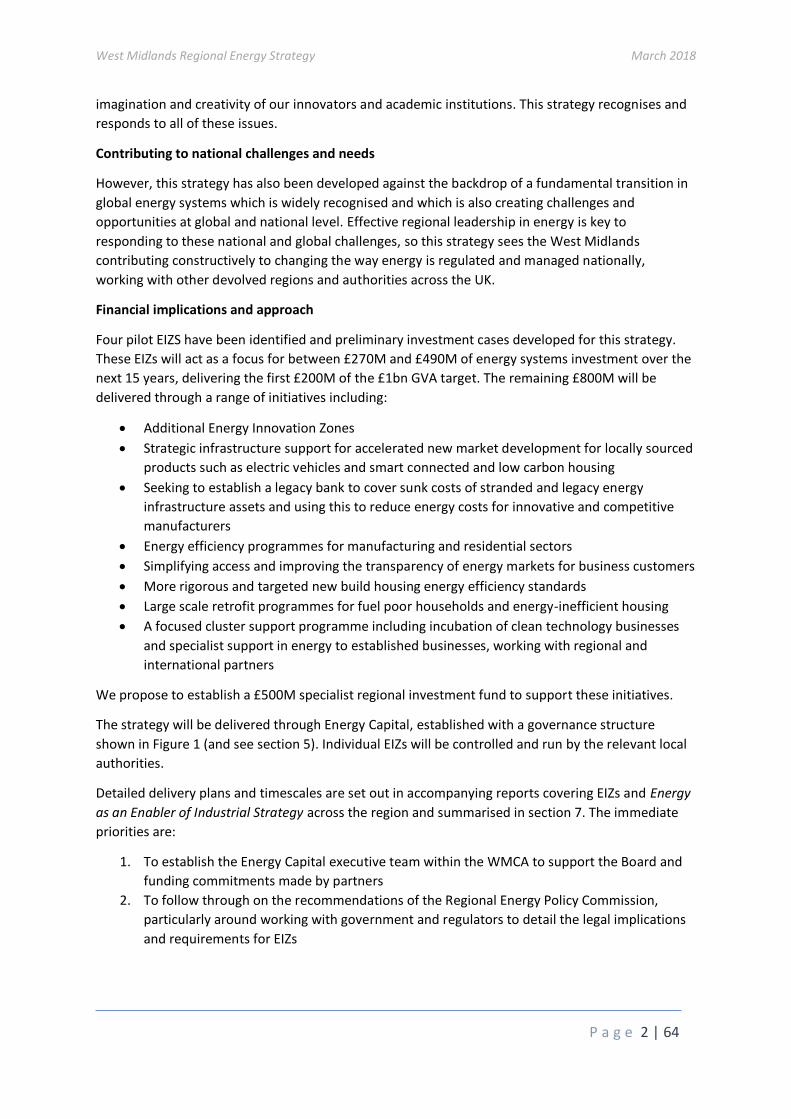
The strategy will be delivered through Energy Capital, established with a governance structure
shown in Figure 1 (and see section 5). Individual EIZs will be controlled and run by the relevant local
authorities.
Detailed delivery plans and timescales are set out in accompanying reports covering EIZs and Energy
as an Enabler of Industrial Strategy across the region and summarised in section 7. The immediate
priorities are:
1. To establish the Energy Capital executive team within the WMCA to support the Board and
funding commitments made by partners
2. To follow through on the recommendations of the Regional Energy Policy Commission,
particularly around working with government and regulators to detail the legal implications
and requirements for EIZs
West Midlands Regional Energy Strategy March 2018
P a g e 3 | 64
3. To work with regional and wider partners to develop a cross-sectoral and place-based
growth deal for the West Midlands new energy economy. This will act as the initial focus for
securing the investment funding required.
Figure 1 West Midlands Regional Energy Strategy governance
This strategy document is being made available in final draft form in March 2018 for consultation
with key stakeholders. The intention is that it will be formally adopted by the various regional
authorities during Spring and Summer 2018.
Please provide any feedback or comments to [email protected] by 5pm on 21 May (see
Appendix III).
West Midlands Regional Energy Strategy March 2018
P a g e 4 | 64
1. Introduction
This report is a consolidation of more than a year’s work across the West Midlands to bring together
existing energy mapping and strategy work, fill in gaps and develop a strategic framework to support
delivery of the region’s ambitions and needs. It is intended as a response to BEIS’s request that the
three LEPs within the West Midlands Combined Authority (WMCA) produce a single high-level
strategy summarising how they will work together through Energy Capital to deliver shared
objectives.
Throughout the work, we have maintained a fundamental principle that the strategy will not lead to
replication or duplication of existing work, initiatives or institutions. The intention is to create a
strategy which builds on and supports these activities where they are already underway and makes
it easier for local leaders and projects to deliver their specific local objectives around energy. This
point is expanded on in some depth in later sections.
In particular, Energy Capital itself inherited a strong partnership from the Birmingham Green
Commission led by Councillor Lisa Trickett and the work of its energy group, chaired by Professor
Martin Freer. The strategy has been made possible by the willingness of this group to combine with
the strong sense of purpose coming from the Black Country LEP, where energy is championed by
Tom Westley, and the vision of Coventry and Warwickshire, who are engaging creatively with the
energy challenge as their traditional core transport and manufacturing businesses see new global
opportunities rapidly opening in front of them.
The report should be read in conjunction with other key documents produced alongside or as part of
the regional energy strategy, specifically:
• Powering Growth: Black Country Energy Strategy Final Report (Aecom, February 2018)
• Business Cases for Energy Innovation Zones in the West Midlands (Arup, March 2018)
• Powering West Midlands Growth: A Regional Approach to Clean Energy Innovation (Regional
Policy Commission on Energy, March 2018)
• Energy as an Enabler: Linkages between regional energy strategy, productivity and growth
(Black Country LEP and Matthew Rhodes, March 2018)
• Distributed generation and demand study. Technology growth scenarios to 2030, regen for
WPD (January 2018)i
Several sections of this report draw heavily on the work done for these reports and the reports
themselves, and the work of all their authors and the conversations and events surrounding their
preparation is much appreciated and recognised. Links to all these documents and others relevant to
the strategy are provided in appendices I and II and in the references at the end.
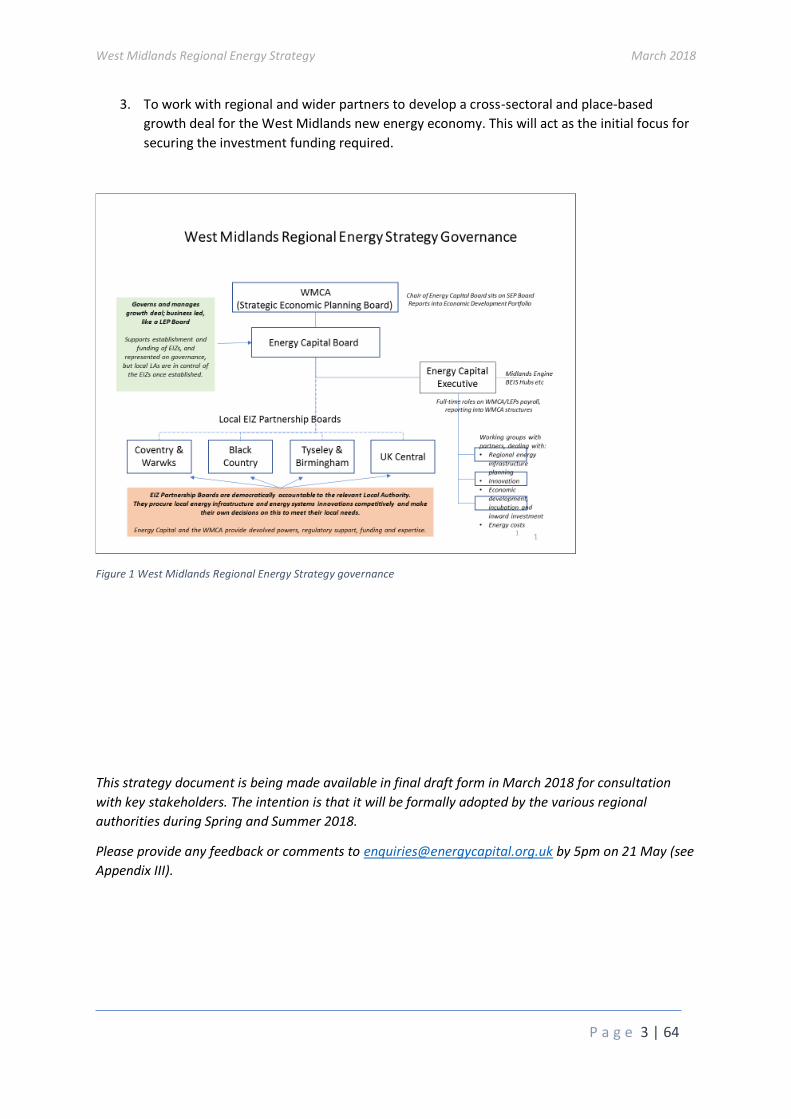
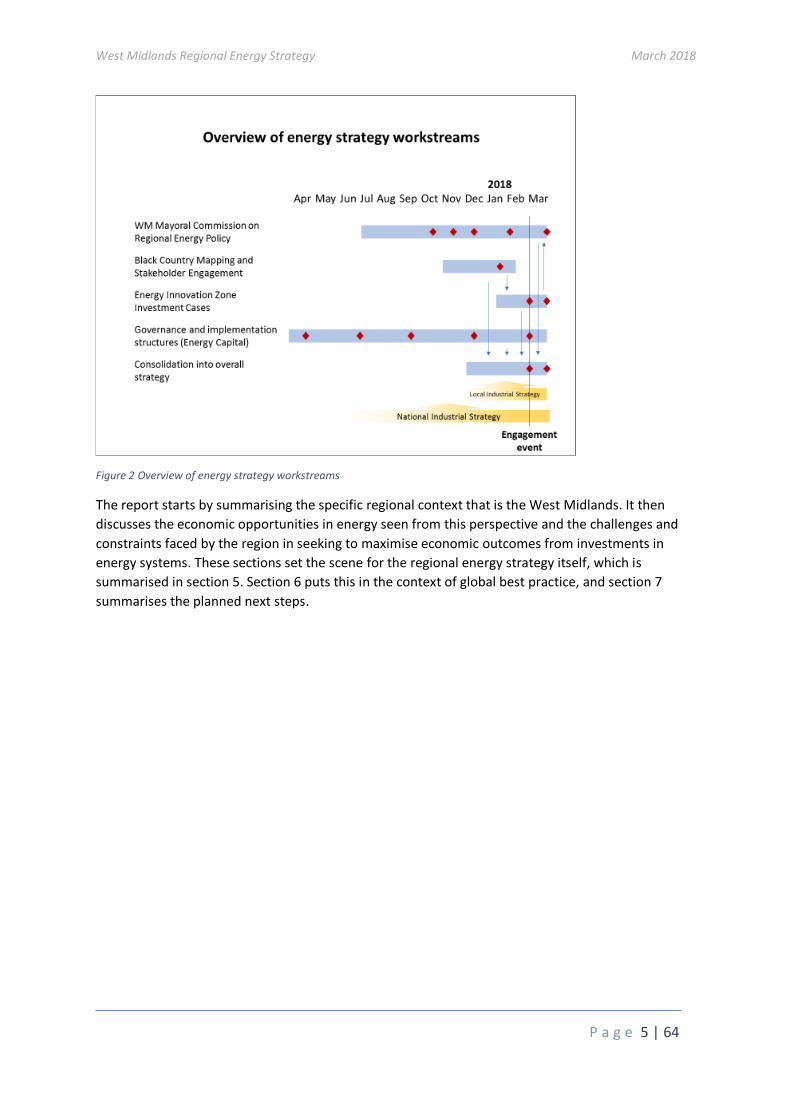
The project has been governed by a steering group consisting of a representative from each of the
three LEPs. Figure 2 below shows how the various workstreams came together. The red diamonds
indicate consultation events with stakeholders. A full list of participants in the main stakeholder
engagement event on 6 March is provided as Appendix IV – Attendees at the stakeholder
engagement event.
West Midlands Regional Energy Strategy March 2018
P a g e 5 | 64
Figure 2 Overview of energy strategy workstreams
The report starts by summarising the specific regional context that is the West Midlands. It then
discusses the economic opportunities in energy seen from this perspective and the challenges and
constraints faced by the region in seeking to maximise economic outcomes from investments in
energy systems. These sections set the scene for the regional energy strategy itself, which is
summarised in section 5. Section 6 puts this in the context of global best practice, and section 7
summarises the planned next steps.
West Midlands Regional Energy Strategy March 2018
P a g e 6 | 64
2. The West Midlands
History, geography and political context
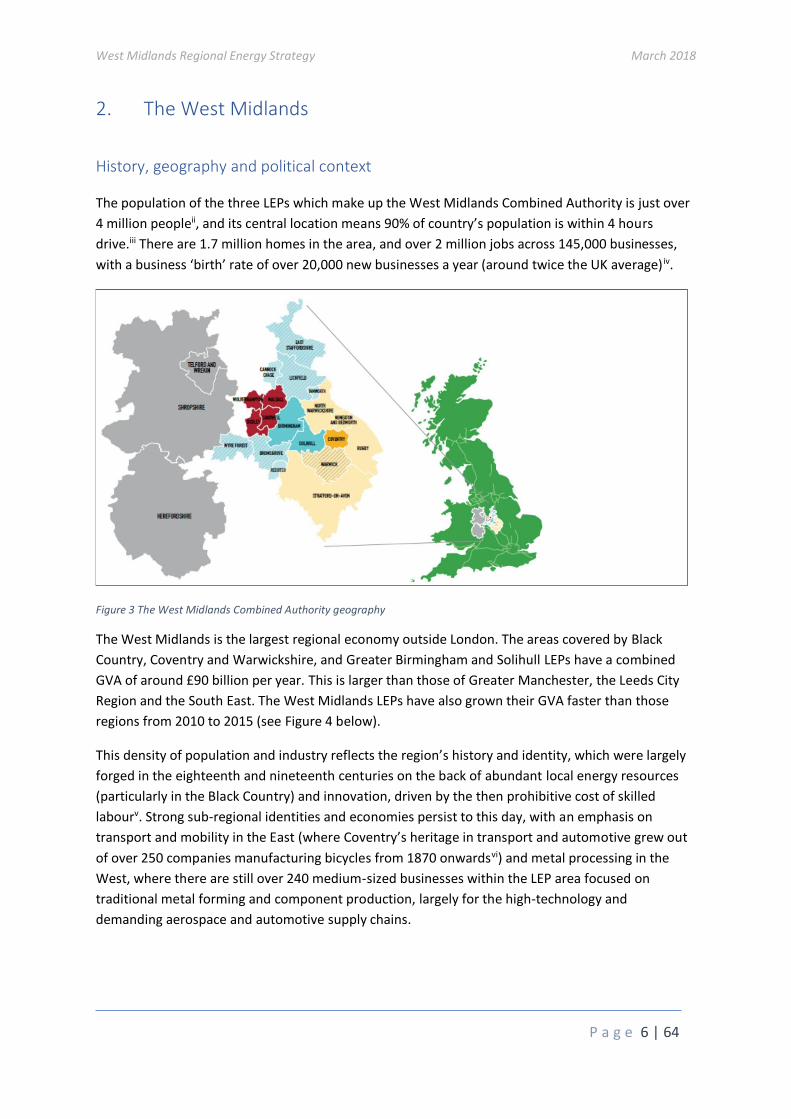
The population of the three LEPs which make up the West Midlands Combined Authority is just over
4 million peopleii, and its central location means 90% of country’s population is within 4 hours
drive.iii There are 1.7 million homes in the area, and over 2 million jobs across 145,000 businesses,
with a business ‘birth’ rate of over 20,000 new businesses a year (around twice the UK average) iv.
Figure 3 The West Midlands Combined Authority geography
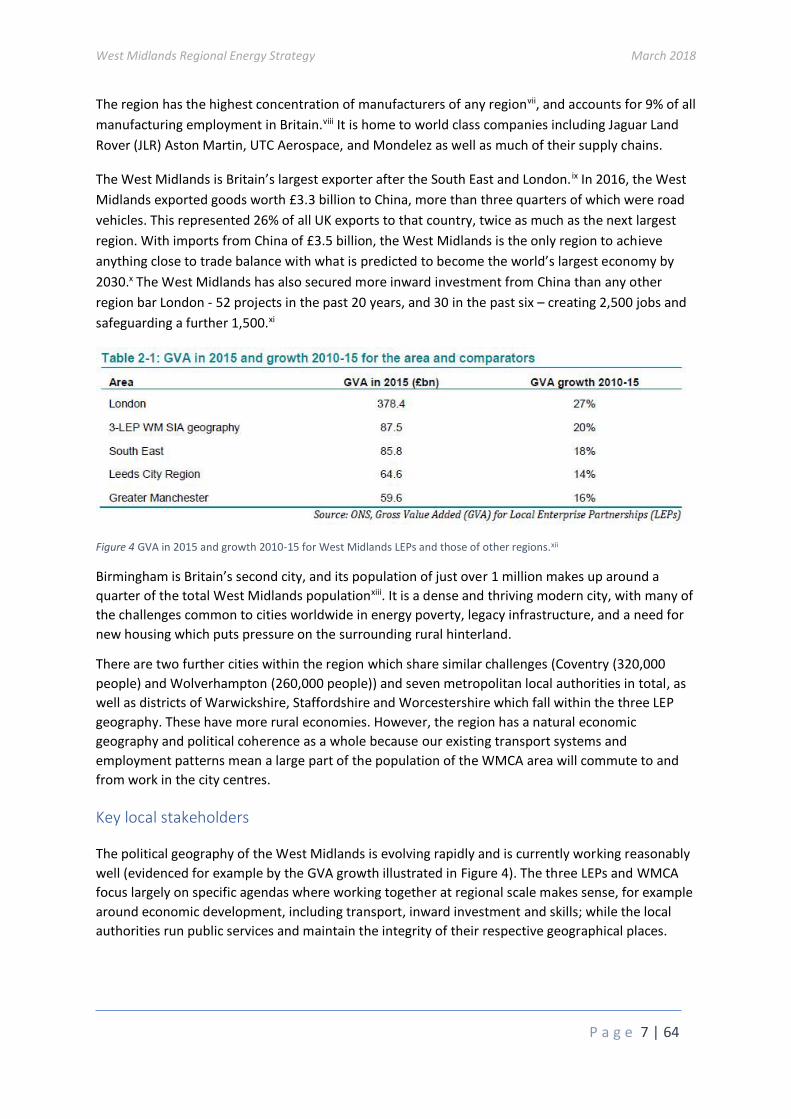
The West Midlands is the largest regional economy outside London. The areas covered by Black
Country, Coventry and Warwickshire, and Greater Birmingham and Solihull LEPs have a combined
GVA of around £90 billion per year. This is larger than those of Greater Manchester, the Leeds City
Region and the South East. The West Midlands LEPs have also grown their GVA faster than those
regions from 2010 to 2015 (see Figure 4 below).
This density of population and industry reflects the region’s history and identity, which were largely
forged in the eighteenth and nineteenth centuries on the back of abundant local energy resources
(particularly in the Black Country) and innovation, driven by the then prohibitive cost of skilled
labourv. Strong sub-regional identities and economies persist to this day, with an emphasis on
transport and mobility in the East (where Coventry’s heritage in transport and automotive grew out
of over 250 companies manufacturing bicycles from 1870 onwardsvi) and metal processing in the
West, where there are still over 240 medium-sized businesses within the LEP area focused on
traditional metal forming and component production, largely for the high-technology and
demanding aerospace and automotive supply chains.
West Midlands Regional Energy Strategy March 2018
P a g e 7 | 64
The region has the highest concentration of manufacturers of any regionvii, and accounts for 9% of all
manufacturing employment in Britain.viii It is home to world class companies including Jaguar Land
Rover (JLR) Aston Martin, UTC Aerospace, and Mondelez as well as much of their supply chains.
The West Midlands is Britain’s largest exporter after the South East and London. ix In 2016, the West
Midlands exported goods worth £3.3 billion to China, more than three quarters of which were road
vehicles. This represented 26% of all UK exports to that country, twice as much as the next largest
region. With imports from China of £3.5 billion, the West Midlands is the only region to achieve
anything close to trade balance with what is predicted to become the world’s largest economy by
2030.x The West Midlands has also secured more inward investment from China than any other
region bar London - 52 projects in the past 20 years, and 30 in the past six – creating 2,500 jobs and
safeguarding a further 1,500.xi
Figure 4 GVA in 2015 and growth 2010-15 for West Midlands LEPs and those of other regions.xii
Birmingham is Britain’s second city, and its population of just over 1 million makes up around a
quarter of the total West Midlands populationxiii. It is a dense and thriving modern city, with many of
the challenges common to cities worldwide in energy poverty, legacy infrastructure, and a need for
new housing which puts pressure on the surrounding rural hinterland.
There are two further cities within the region which share similar challenges (Coventry (320,000
people) and Wolverhampton (260,000 people)) and seven metropolitan local authorities in total, as
well as districts of Warwickshire, Staffordshire and Worcestershire which fall within the three LEP
geography. These have more rural economies. However, the region has a natural economic
geography and political coherence as a whole because our existing transport systems and
employment patterns mean a large part of the population of the WMCA area will commute to and
from work in the city centres.
Key local stakeholders
The political geography of the West Midlands is evolving rapidly and is currently working reasonably
well (evidenced for example by the GVA growth illustrated in Figure 4). The three LEPs and WMCA
focus largely on specific agendas where working together at regional scale makes sense, for example
around economic development, including transport, inward investment and skills; while the local
authorities run public services and maintain the integrity of their respective geographical places.
West Midlands Regional Energy Strategy March 2018
P a g e 8 | 64
All these bodies are properly democratically-accountable, and the LEP Boards (which are supervised
by elected representatives) have effectively engaged committed local business interests and
academic institutions, including all the region’s eight universities.
Major energy-related corporates located in or close to the region include E.ON, National Grid, Calor,
Cadent, JLR, Severn Trent, UTC Aerospace. These represent a significant part of the GVA attributable
to energy across the region (see section 3) but a tiny fraction of the 10,000 businesses active in the
energy sector across the regionxiv. Smaller businesses are represented on LEP Boards and sub-boards
through organisations such as the Engineering Employers Federation (EEF) and Chambers of
Commerce.
The West Midlands also hosts substantial national research and innovation assets in the Energy
Systems Catapult and the universities of Aston, Birmingham and Warwick, which are part of the
Energy Research Accelerator. Aston, Birmingham and Warwick have highly complementary research
expertise in energy and have all contributed to this strategy in distinctive ways1. Wolverhampton,
Coventry and Birmingham City University further enhance regional energy capabilities, particularly
around energy in buildings, smart systems and industry engagement.
1 Aston’s expertise is in bioenergy and infrastructure economics; Birmingham in thermal energy systems; Warwick in battery and storage technologies and automotive/transport/energy cross-over.
West Midlands Regional Energy Strategy March 2018
P a g e 9 | 64
3. Economic opportunity
Energy in the West Midlands Economy
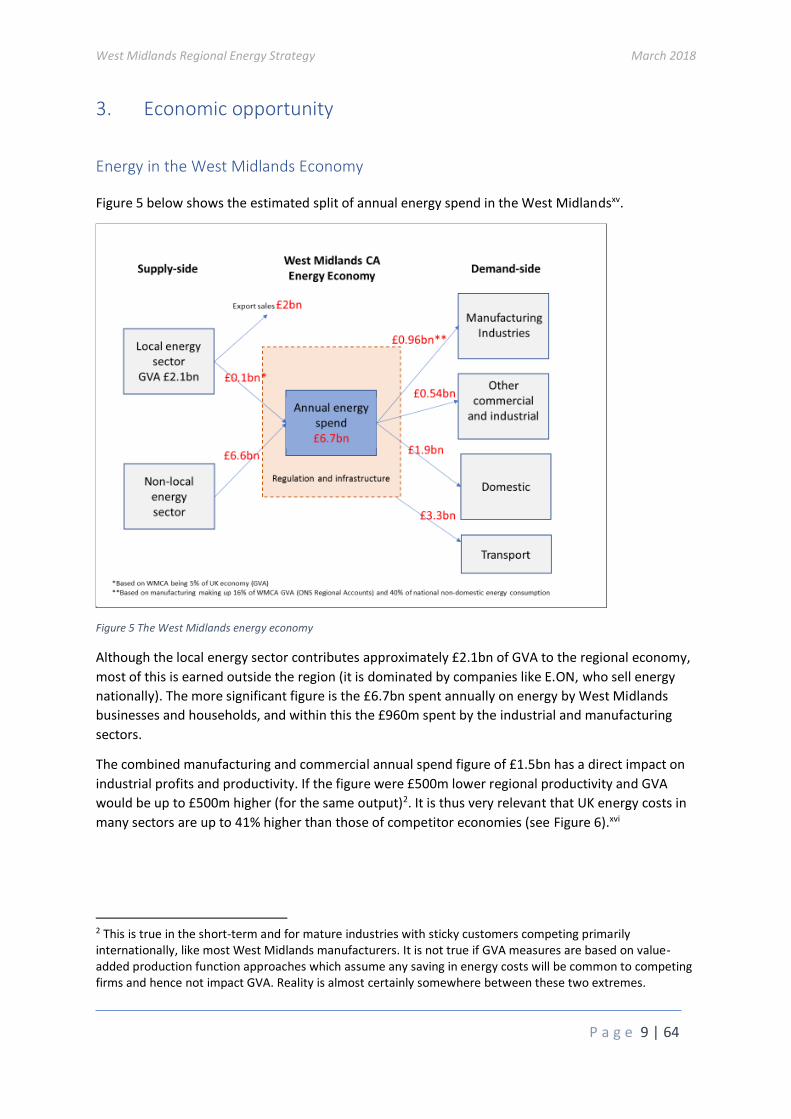
Figure 5 below shows the estimated split of annual energy spend in the West Midlandsxv.
Figure 5 The West Midlands energy economy
Although the local energy sector contributes approximately £2.1bn of GVA to the regional economy,
most of this is earned outside the region (it is dominated by companies like E.ON, who sell energy
nationally). The more significant figure is the £6.7bn spent annually on energy by West Midlands
businesses and households, and within this the £960m spent by the industrial and manufacturing
sectors.
The combined manufacturing and commercial annual spend figure of £1.5bn has a direct impact on
industrial profits and productivity. If the figure were £500m lower regional productivity and GVA
would be up to £500m higher (for the same output)2. It is thus very relevant that UK energy costs in
many sectors are up to 41% higher than those of competitor economies (see Figure 6).xvi
2 This is true in the short-term and for mature industries with sticky customers competing primarily internationally, like most West Midlands manufacturers. It is not true if GVA measures are based on value-added production function approaches which assume any saving in energy costs will be common to competing firms and hence not impact GVA. Reality is almost certainly somewhere between these two extremes.
West Midlands Regional Energy Strategy March 2018
P a g e 10 | 64
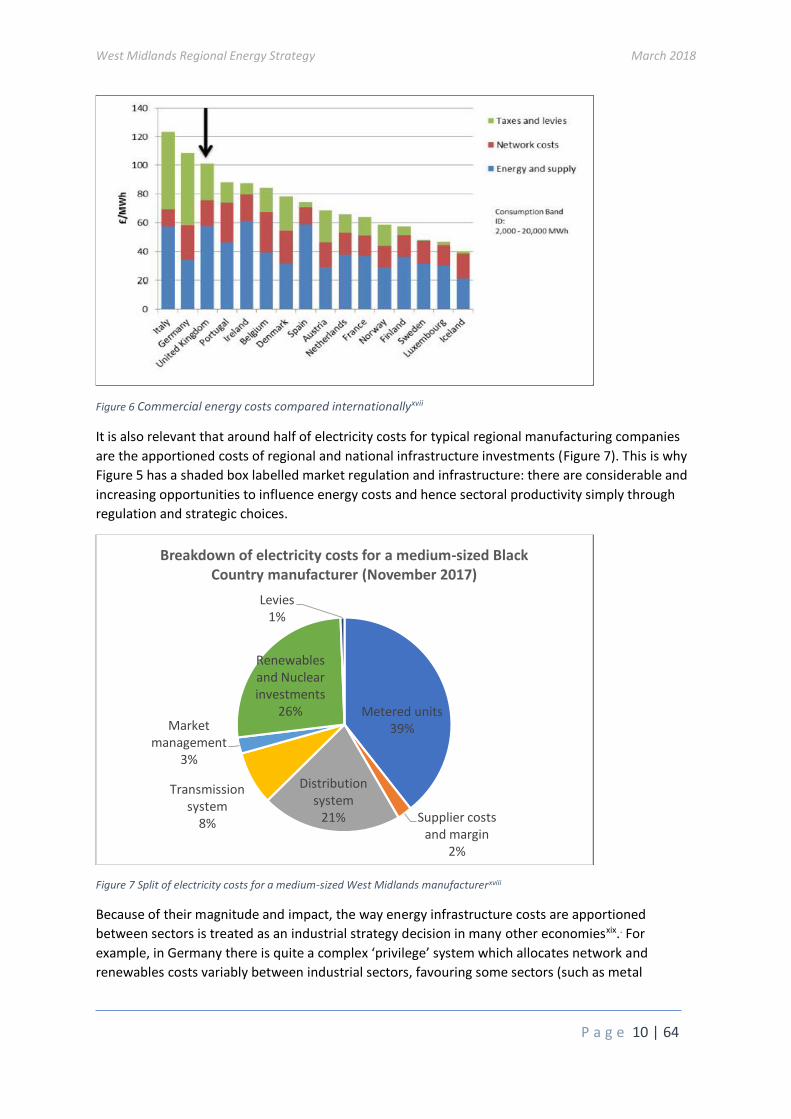
Figure 6 Commercial energy costs compared internationallyxvii
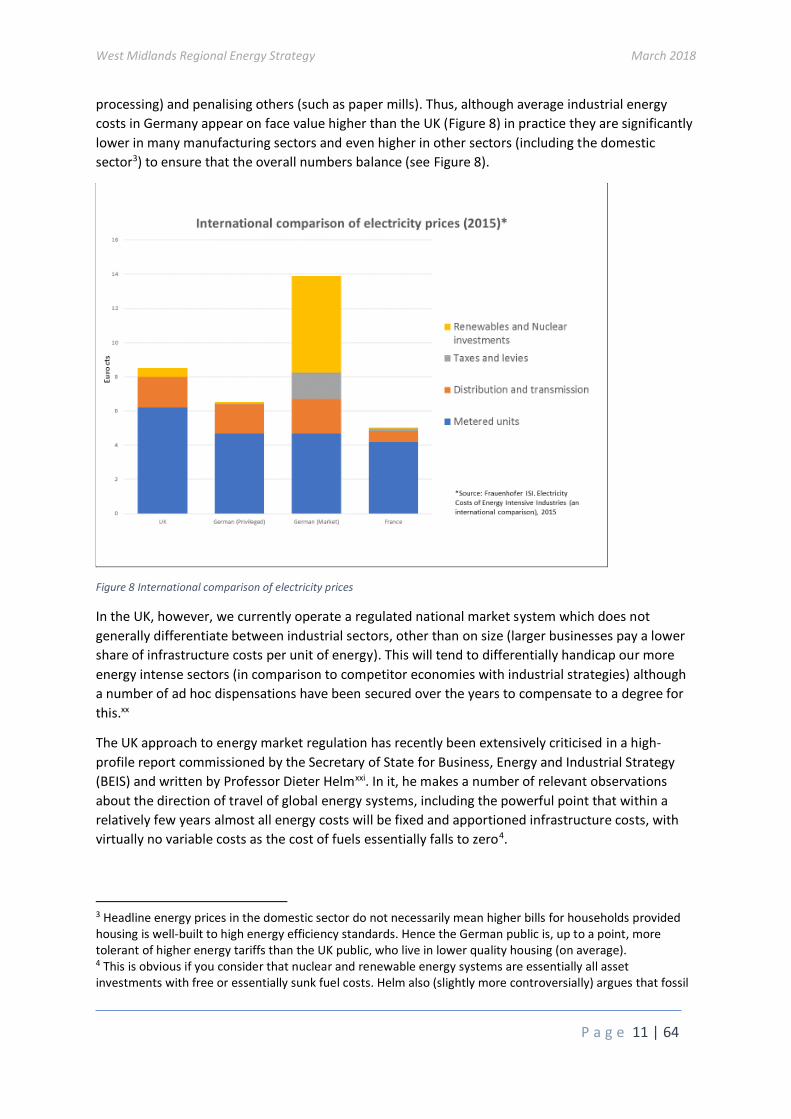
It is also relevant that around half of electricity costs for typical regional manufacturing companies
are the apportioned costs of regional and national infrastructure investments (Figure 7). This is why
Figure 5 has a shaded box labelled market regulation and infrastructure: there are considerable and
increasing opportunities to influence energy costs and hence sectoral productivity simply through
regulation and strategic choices.
Figure 7 Split of electricity costs for a medium-sized West Midlands manufacturerxviii
Because of their magnitude and impact, the way energy infrastructure costs are apportioned
between sectors is treated as an industrial strategy decision in many other economiesxix.. For
example, in Germany there is quite a complex ‘privilege’ system which allocates network and
renewables costs variably between industrial sectors, favouring some sectors (such as metal
Metered units39%
Supplier costs and margin
2%
Distribution system
21%
Transmission system
8%
Market management
3%
Renewables and Nuclear investments
26%
Levies1%
Breakdown of electricity costs for a medium-sized Black Country manufacturer (November 2017)
West Midlands Regional Energy Strategy March 2018
P a g e 11 | 64
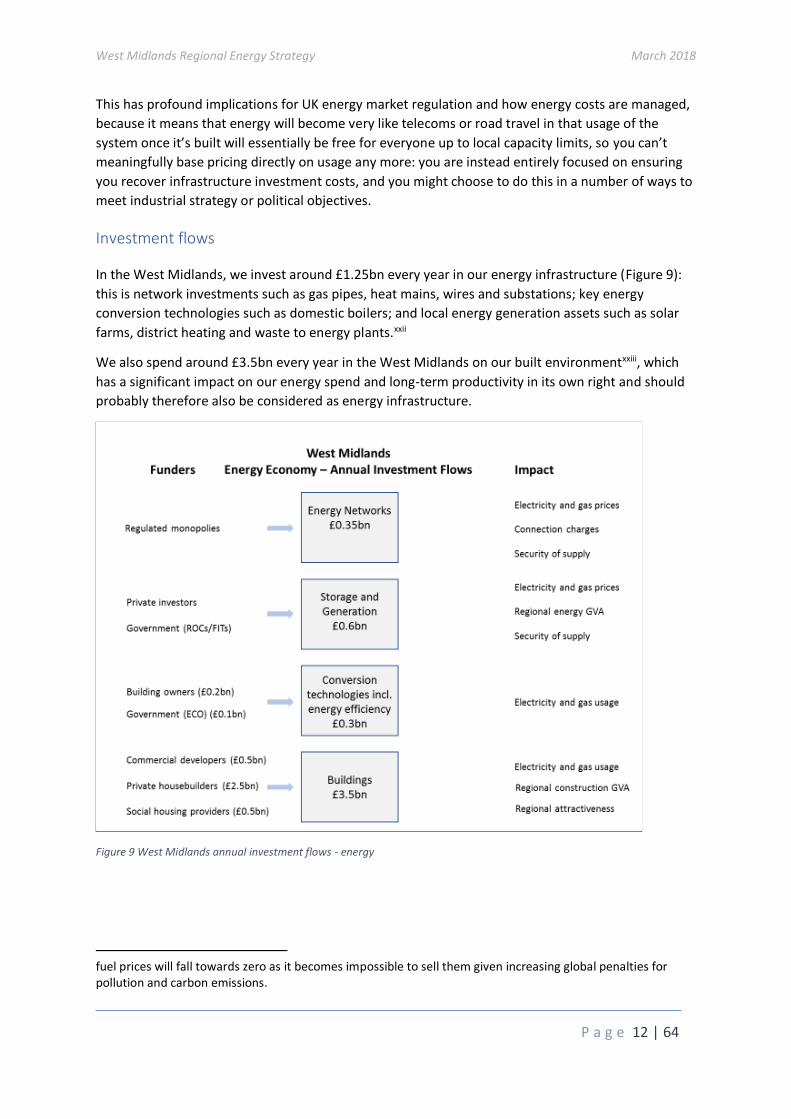
processing) and penalising others (such as paper mills). Thus, although average industrial energy
costs in Germany appear on face value higher than the UK (Figure 8) in practice they are significantly
lower in many manufacturing sectors and even higher in other sectors (including the domestic
sector3) to ensure that the overall numbers balance (see Figure 8).
Figure 8 International comparison of electricity prices
In the UK, however, we currently operate a regulated national market system which does not
generally differentiate between industrial sectors, other than on size (larger businesses pay a lower
share of infrastructure costs per unit of energy). This will tend to differentially handicap our more
energy intense sectors (in comparison to competitor economies with industrial strategies) although
a number of ad hoc dispensations have been secured over the years to compensate to a degree for
this.xx
The UK approach to energy market regulation has recently been extensively criticised in a high-
profile report commissioned by the Secretary of State for Business, Energy and Industrial Strategy
(BEIS) and written by Professor Dieter Helmxxi. In it, he makes a number of relevant observations
about the direction of travel of global energy systems, including the powerful point that within a
relatively few years almost all energy costs will be fixed and apportioned infrastructure costs, with
virtually no variable costs as the cost of fuels essentially falls to zero4.
3 Headline energy prices in the domestic sector do not necessarily mean higher bills for households provided housing is well-built to high energy efficiency standards. Hence the German public is, up to a point, more tolerant of higher energy tariffs than the UK public, who live in lower quality housing (on average). 4 This is obvious if you consider that nuclear and renewable energy systems are essentially all asset investments with free or essentially sunk fuel costs. Helm also (slightly more controversially) argues that fossil
West Midlands Regional Energy Strategy March 2018
P a g e 12 | 64
This has profound implications for UK energy market regulation and how energy costs are managed,
because it means that energy will become very like telecoms or road travel in that usage of the
system once it’s built will essentially be free for everyone up to local capacity limits, so you can’t
meaningfully base pricing directly on usage any more: you are instead entirely focused on ensuring
you recover infrastructure investment costs, and you might choose to do this in a number of ways to
meet industrial strategy or political objectives.
Investment flows
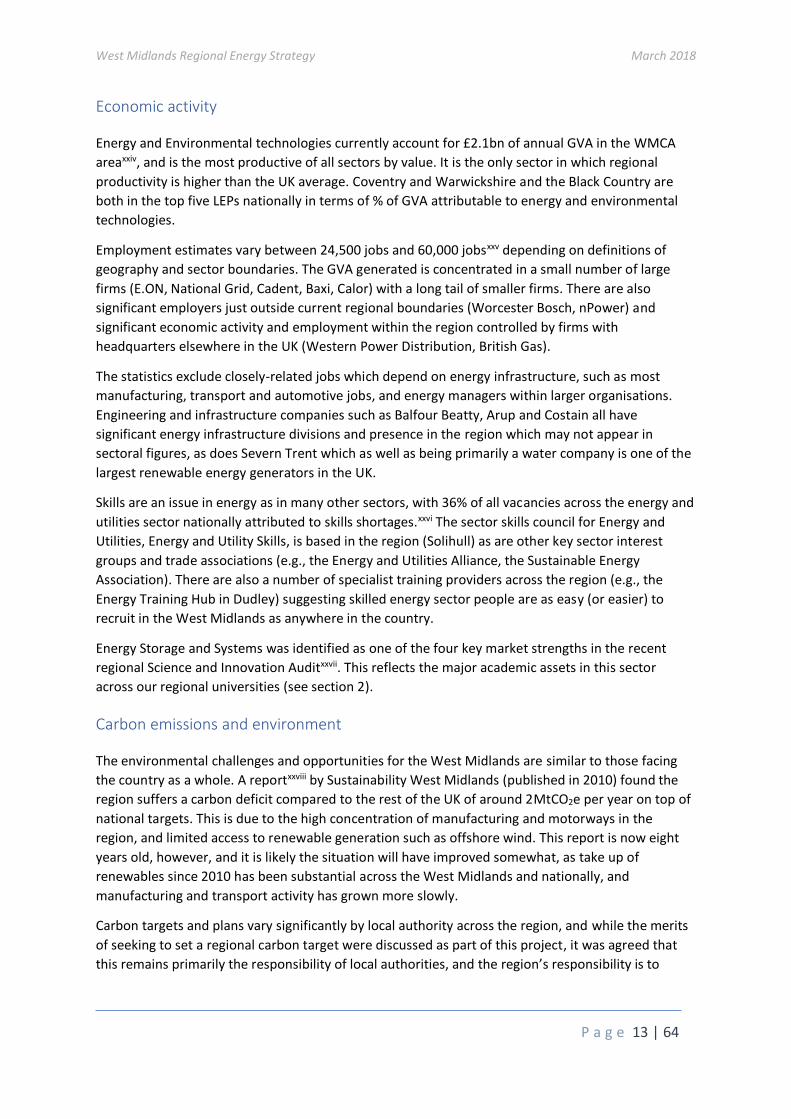
In the West Midlands, we invest around £1.25bn every year in our energy infrastructure (Figure 9):
this is network investments such as gas pipes, heat mains, wires and substations; key energy
conversion technologies such as domestic boilers; and local energy generation assets such as solar
farms, district heating and waste to energy plants.xxii
We also spend around £3.5bn every year in the West Midlands on our built environmentxxiii, which
has a significant impact on our energy spend and long-term productivity in its own right and should
probably therefore also be considered as energy infrastructure.
Figure 9 West Midlands annual investment flows - energy
fuel prices will fall towards zero as it becomes impossible to sell them given increasing global penalties for pollution and carbon emissions.
West Midlands Regional Energy Strategy March 2018
P a g e 13 | 64
Economic activity
Energy and Environmental technologies currently account for £2.1bn of annual GVA in the WMCA
areaxxiv, and is the most productive of all sectors by value. It is the only sector in which regional
productivity is higher than the UK average. Coventry and Warwickshire and the Black Country are
both in the top five LEPs nationally in terms of % of GVA attributable to energy and environmental
technologies.
Employment estimates vary between 24,500 jobs and 60,000 jobsxxv depending on definitions of
geography and sector boundaries. The GVA generated is concentrated in a small number of large
firms (E.ON, National Grid, Cadent, Baxi, Calor) with a long tail of smaller firms. There are also
significant employers just outside current regional boundaries (Worcester Bosch, nPower) and
significant economic activity and employment within the region controlled by firms with
headquarters elsewhere in the UK (Western Power Distribution, British Gas).
The statistics exclude closely-related jobs which depend on energy infrastructure, such as most
manufacturing, transport and automotive jobs, and energy managers within larger organisations.
Engineering and infrastructure companies such as Balfour Beatty, Arup and Costain all have
significant energy infrastructure divisions and presence in the region which may not appear in
sectoral figures, as does Severn Trent which as well as being primarily a water company is one of the
largest renewable energy generators in the UK.
Skills are an issue in energy as in many other sectors, with 36% of all vacancies across the energy and
utilities sector nationally attributed to skills shortages.xxvi The sector skills council for Energy and
Utilities, Energy and Utility Skills, is based in the region (Solihull) as are other key sector interest
groups and trade associations (e.g., the Energy and Utilities Alliance, the Sustainable Energy
Association). There are also a number of specialist training providers across the region (e.g., the
Energy Training Hub in Dudley) suggesting skilled energy sector people are as easy (or easier) to
recruit in the West Midlands as anywhere in the country.
Energy Storage and Systems was identified as one of the four key market strengths in the recent
regional Science and Innovation Auditxxvii. This reflects the major academic assets in this sector
across our regional universities (see section 2).
Carbon emissions and environment
The environmental challenges and opportunities for the West Midlands are similar to those facing
the country as a whole. A reportxxviii by Sustainability West Midlands (published in 2010) found the
region suffers a carbon deficit compared to the rest of the UK of around 2MtCO2e per year on top of
national targets. This is due to the high concentration of manufacturing and motorways in the
region, and limited access to renewable generation such as offshore wind. This report is now eight
years old, however, and it is likely the situation will have improved somewhat, as take up of
renewables since 2010 has been substantial across the West Midlands and nationally, and
manufacturing and transport activity has grown more slowly.
Carbon targets and plans vary significantly by local authority across the region, and while the merits
of seeking to set a regional carbon target were discussed as part of this project, it was agreed that
this remains primarily the responsibility of local authorities, and the region’s responsibility is to
West Midlands Regional Energy Strategy March 2018
P a g e 14 | 64
ensure the energy strategy supports local authorities in delivering their local objectives in this
respect.
Transport is a major element in the regional economy, and also recognised globally as one of the
hardest sectors in which to reduce CO2 emissions. However, vehicles are largely responsible for the
toxic air pollution that afflicts cities worldwide. The nitrogen oxides and particulate matter emitted
by diesel vehicles in particular are key ingredients in the outdoor air pollution that causes 3.7 million
premature deaths each yearxxix. In Britain, the government estimates that each year these emissions
cause between 44,750 and 52,500 premature deaths and cost society between £25.3 billion and
£29.7 billion.xxx The West Midlands share of these figures will be between 5-10%, so 2,500 to 5,000
people dying prematurely in the Combined Authority area, and a cost to society of £1-£3billion.
The government has largely devolved the problem to local authorities under the Localism Act 2011
and revisions to the Environment Act 2008 and has instructed five city authorities including
Birmingham to implement Clean Air Zones by 2020. These will prevent the most polluting vehicles
such as old diesel buses, coaches, taxis and lorries from entering the most polluted areas at
particular times of day, or charge them for doing so, and the Birmingham scheme will also cover
vans.xxxi
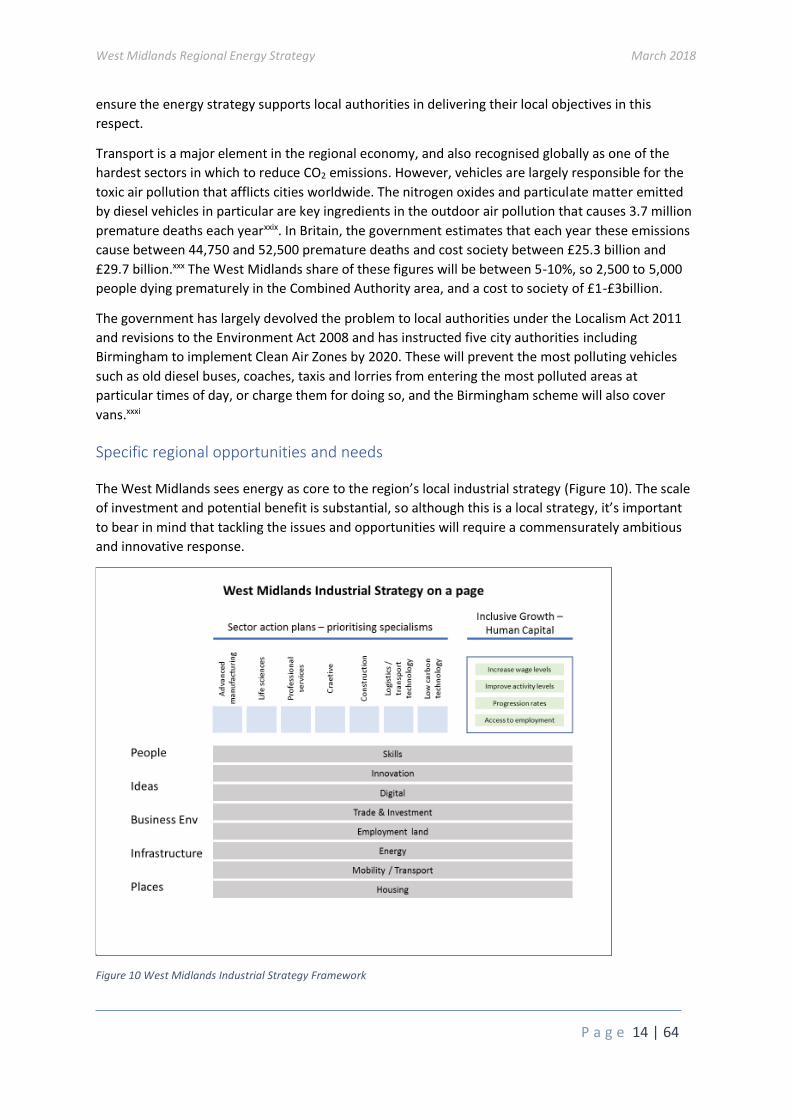
Specific regional opportunities and needs
The West Midlands sees energy as core to the region’s local industrial strategy (Figure 10). The scale
of investment and potential benefit is substantial, so although this is a local strategy, it’s important
to bear in mind that tackling the issues and opportunities will require a commensurately ambitious
and innovative response.
Figure 10 West Midlands Industrial Strategy Framework
West Midlands Regional Energy Strategy March 2018
P a g e 15 | 64
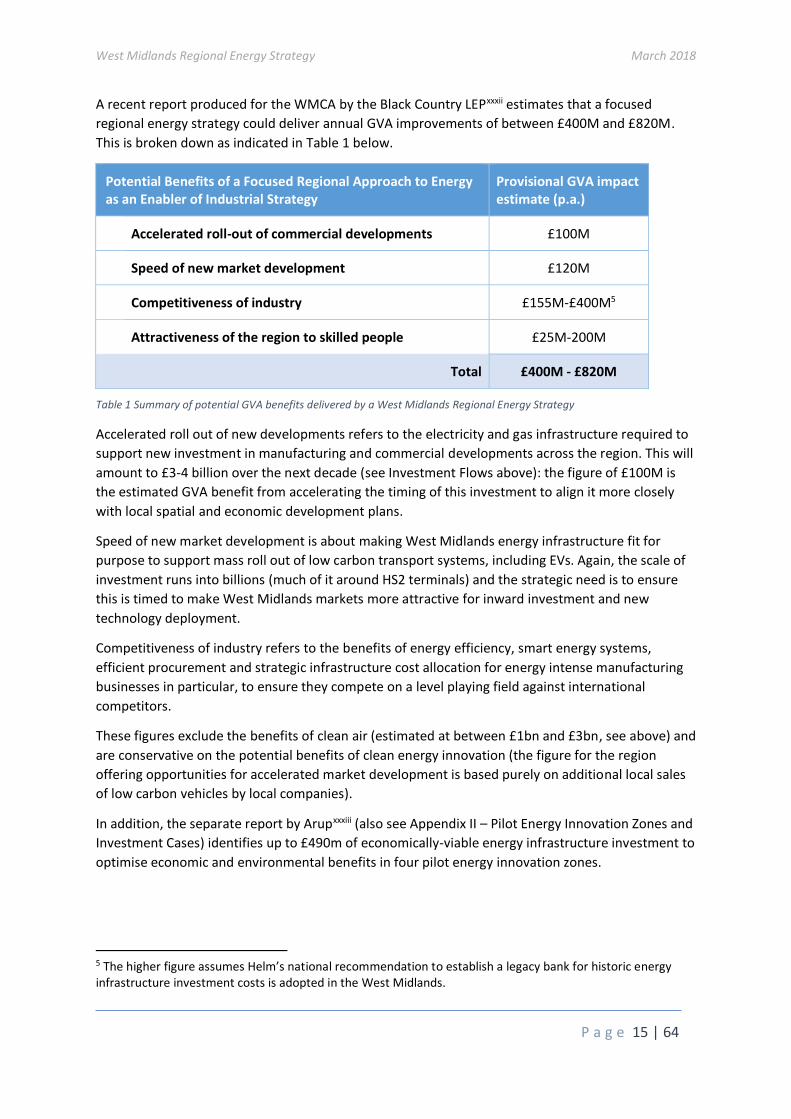
A recent report produced for the WMCA by the Black Country LEPxxxii estimates that a focused
regional energy strategy could deliver annual GVA improvements of between £400M and £820M.
This is broken down as indicated in Table 1 below.
Potential Benefits of a Focused Regional Approach to Energy as an Enabler of Industrial Strategy
Provisional GVA impact estimate (p.a.)
Accelerated roll-out of commercial developments £100M
Speed of new market development £120M
Competitiveness of industry £155M-£400M5
Attractiveness of the region to skilled people £25M-200M
Total £400M - £820M
Table 1 Summary of potential GVA benefits delivered by a West Midlands Regional Energy Strategy
Accelerated roll out of new developments refers to the electricity and gas infrastructure required to
support new investment in manufacturing and commercial developments across the region. This will
amount to £3-4 billion over the next decade (see Investment Flows above): the figure of £100M is
the estimated GVA benefit from accelerating the timing of this investment to align it more closely
with local spatial and economic development plans.
Speed of new market development is about making West Midlands energy infrastructure fit for
purpose to support mass roll out of low carbon transport systems, including EVs. Again, the scale of
investment runs into billions (much of it around HS2 terminals) and the strategic need is to ensure
this is timed to make West Midlands markets more attractive for inward investment and new
technology deployment.
Competitiveness of industry refers to the benefits of energy efficiency, smart energy systems,
efficient procurement and strategic infrastructure cost allocation for energy intense manufacturing
businesses in particular, to ensure they compete on a level playing field against international
competitors.
These figures exclude the benefits of clean air (estimated at between £1bn and £3bn, see above) and
are conservative on the potential benefits of clean energy innovation (the figure for the region
offering opportunities for accelerated market development is based purely on additional local sales
of low carbon vehicles by local companies).
In addition, the separate report by Arupxxxiii (also see Appendix II – Pilot Energy Innovation Zones and
Investment Cases) identifies up to £490m of economically-viable energy infrastructure investment to
optimise economic and environmental benefits in four pilot energy innovation zones.
5 The higher figure assumes Helm’s national recommendation to establish a legacy bank for historic energy infrastructure investment costs is adopted in the West Midlands.
West Midlands Regional Energy Strategy March 2018
P a g e 16 | 64
Headline investment projects
The West Midlands is an ambitious region, and there are major investment and regeneration
projects underway across the region: over £2 billion of investment is planned for UK Central and
Solihull with the arrival of HS2; similar levels of investment are planned for Birmingham (again with
HS2 and the redevelopment of Smithfield) and Coventry (housing and new manufacturing facilities
for JLR) and £1.5 billion is being invested in the Black Country’s Enterprise Zones.
It will be critical to get the local energy infrastructure right for these projects, and that’s challenging
and risky at a time of major change in global energy systems. In particular, there is a danger that the
tendency of commercial investors and developers to focus exclusively on short-term profit
maximisation results in energy infrastructure investment which quickly turns into stranded assets
and limits the long-term economic and environmental sustainability of the surrounding local
community. There is a strong regional interest in getting this right.
It’s also not just the headline schemes that need appropriate energy systems. As appendix I
summarises, there are clean energy opportunities across the region, including at least a dozen
district energy schemes, four major waste to energy projects with contract renewals due in the next
five years, and approaching £200m of solar PV investment opportunities in the Black Country alone.
Housing challenges
In addition, the West Midlands has significant housing issues and opportunities. The current
expectation is that 200,000 new homes will be created in the region (net) over the next 12 yearsxxxiv .
This represents mixed public and private investment of around £20bn, and an additional electricity
requirement which could vary from virtually zero to 8TWh per year xxxv, xxxvi. In electrical capacity
alone, 200,000 houses will need around 80MW of new base power generation and 200MW of
available peak power generation (assuming no innovation in control technologies and load
shifting)xxxvii. This also assumes heat continues to be provided by gas and no electric vehicles, which
are additional to these figures.
Energy poverty is a significant issue for the region, with rates exceeding 13.5% in several areas of
Birmingham, the Black Country and Coventryxxxviii. This is a consequence of poor quality (often
private) housing as well as domestic energy prices and a concerted strategy to address this needs to
focus on the built environment and infrastructure as well as headline domestic energy costs.
The number of households in fuel poverty across the region is around 200,000xxxix which is
potentially a substantive and targeted market for energy efficiency refurbishment (retrofit) using
innovative models such as Energiesprong6 or models being developed by the Energy Systems
Catapult in Birmingham. Energiesprong retrofits eliminate fuel poverty from households where they
are applied and recover the costs over 30 years via (much lower) energy bills. To carry out this scale
of radical low carbon retrofit on 200,000 houses would require investment of around £4 billion.
6 Energiesprong is currently being piloted by a consortium in the UK including Accord Housing, who are based in the Black Country, and have a manufacturing facility (LoCal Homes) in Walsall.
West Midlands Regional Energy Strategy March 2018
P a g e 17 | 64
Electric vehicles
Electric vehicles are seen as a particular area of opportunity for the region because of the region’s
heritage and strategic strengths in advanced manufacturing, low carbon technologies, transport and
logistics and construction. EVs represent a significant market opportunity for all these sectors.
The region’s potential strength in this sector has already been recognised by the government in
locating the £80M National Battery Manufacturing Development Centre in Coventry, and Jaguar
Land Rover will be bringing their first electric vehicle to market in 2018. To maximise the economic
and environmental benefits of this investment, the region – especially around Coventry and Solihull -
plan to invest significantly in connected autonomous vehicle (CAV) development and infrastructure
and various stakeholders are already discussing the creation of EV charging hubs and infrastructure
(including vehicle to grid) at commercial scale.
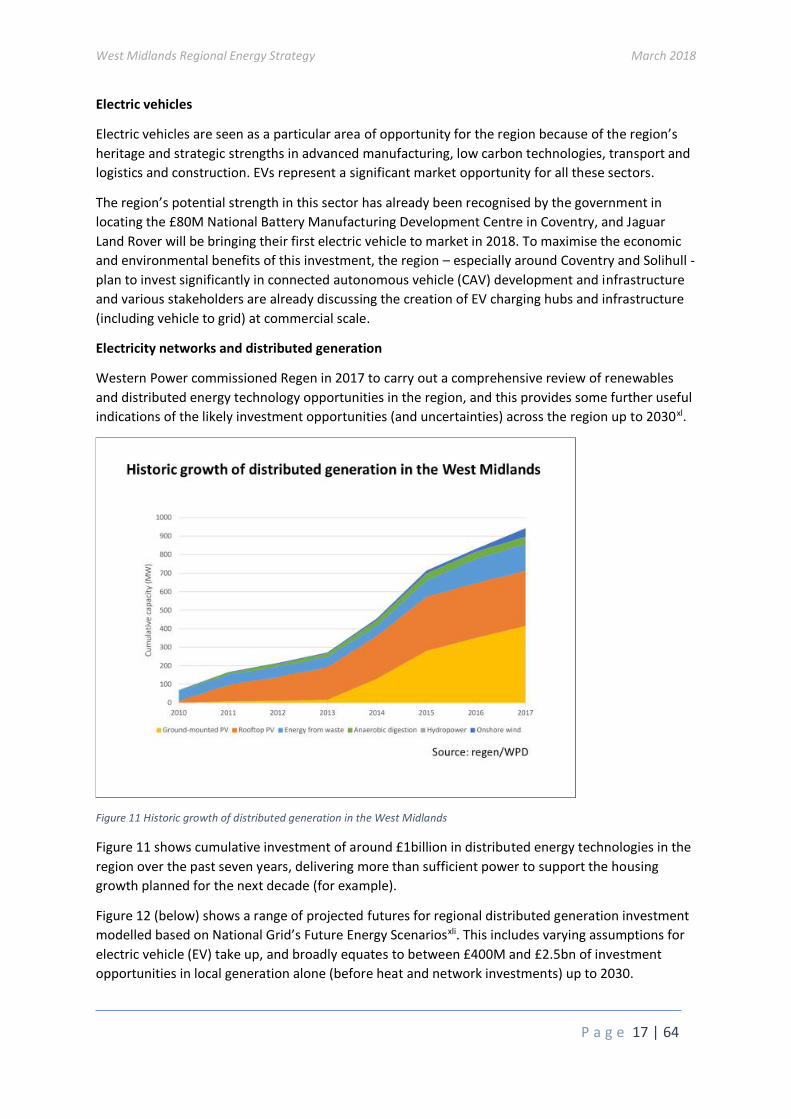
Electricity networks and distributed generation
Western Power commissioned Regen in 2017 to carry out a comprehensive review of renewables
and distributed energy technology opportunities in the region, and this provides some further useful
indications of the likely investment opportunities (and uncertainties) across the region up to 2030xl.
Figure 11 Historic growth of distributed generation in the West Midlands
Figure 11 shows cumulative investment of around £1billion in distributed energy technologies in the
region over the past seven years, delivering more than sufficient power to support the housing
growth planned for the next decade (for example).
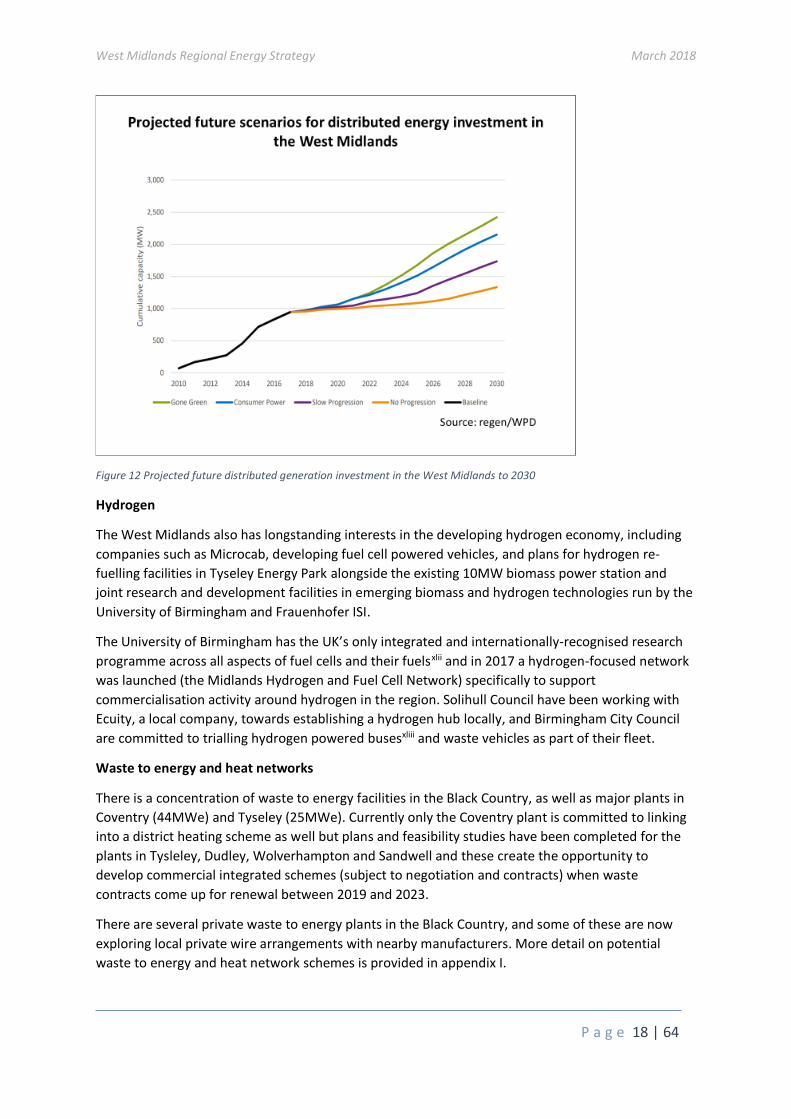
Figure 12 (below) shows a range of projected futures for regional distributed generation investment
modelled based on National Grid’s Future Energy Scenariosxli. This includes varying assumptions for
electric vehicle (EV) take up, and broadly equates to between £400M and £2.5bn of investment
opportunities in local generation alone (before heat and network investments) up to 2030.
West Midlands Regional Energy Strategy March 2018
P a g e 18 | 64
Figure 12 Projected future distributed generation investment in the West Midlands to 2030
Hydrogen
The West Midlands also has longstanding interests in the developing hydrogen economy, including
companies such as Microcab, developing fuel cell powered vehicles, and plans for hydrogen re-
fuelling facilities in Tyseley Energy Park alongside the existing 10MW biomass power station and
joint research and development facilities in emerging biomass and hydrogen technologies run by the
University of Birmingham and Frauenhofer ISI.
The University of Birmingham has the UK’s only integrated and internationally-recognised research
programme across all aspects of fuel cells and their fuelsxlii and in 2017 a hydrogen-focused network
was launched (the Midlands Hydrogen and Fuel Cell Network) specifically to support
commercialisation activity around hydrogen in the region. Solihull Council have been working with
Ecuity, a local company, towards establishing a hydrogen hub locally, and Birmingham City Council
are committed to trialling hydrogen powered busesxliii and waste vehicles as part of their fleet.
Waste to energy and heat networks
There is a concentration of waste to energy facilities in the Black Country, as well as major plants in
Coventry (44MWe) and Tyseley (25MWe). Currently only the Coventry plant is committed to linking
into a district heating scheme as well but plans and feasibility studies have been completed for the
plants in Tysleley, Dudley, Wolverhampton and Sandwell and these create the opportunity to
develop commercial integrated schemes (subject to negotiation and contracts) when waste
contracts come up for renewal between 2019 and 2023.
There are several private waste to energy plants in the Black Country, and some of these are now
exploring local private wire arrangements with nearby manufacturers. More detail on potential
waste to energy and heat network schemes is provided in appendix I.
West Midlands Regional Energy Strategy March 2018
P a g e 19 | 64
Birmingham also has an established district energy company, BDEC, serving much of the city centre
including council buildings, the International Convention Centre, Children’s Hospital and Aston
University. This is in partnership with ENGIE (as is the Coventry scheme). Both Warwick and
Birmingham Universities also have their own on-site gas-fired CHP7 networks as the main source of
heat and power for their campuses.
Global markets
The global energy system is on the cusp of a major transition. For most of the past century technology and economics have only supported a largely one-size-fits all approach to energy infrastructure. Attempts to do anything more than superficially adapt energy systems infrastructure to local needs would either have imposed excessive costs or resulted in inequities in access.
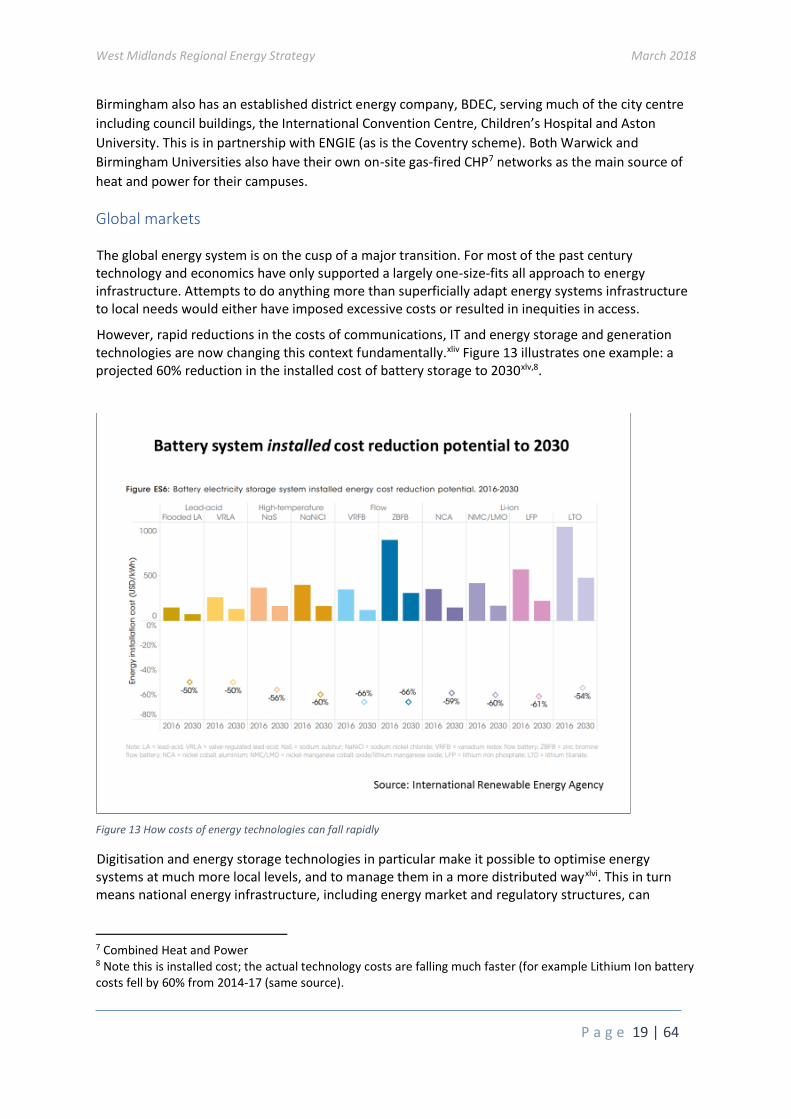
However, rapid reductions in the costs of communications, IT and energy storage and generation technologies are now changing this context fundamentally.xliv Figure 13 illustrates one example: a projected 60% reduction in the installed cost of battery storage to 2030xlv,8.
Figure 13 How costs of energy technologies can fall rapidly
Digitisation and energy storage technologies in particular make it possible to optimise energy systems at much more local levels, and to manage them in a more distributed wayxlvi. This in turn means national energy infrastructure, including energy market and regulatory structures, can
7 Combined Heat and Power 8 Note this is installed cost; the actual technology costs are falling much faster (for example Lithium Ion battery costs fell by 60% from 2014-17 (same source).
West Midlands Regional Energy Strategy March 2018
P a g e 20 | 64
accommodate much more diversity and variety (at least in principle). The benefits of such local diversity in energy systems and responsiveness to local needs now outweigh the costs.
These fundamental technical changes have been accompanied by significant global political shifts, particularly recognition of the need to address the challenges of climate change through reducing carbon emissions. The energy system is the largest emitter of carbon globally, and thus at the forefront of these political changes.
The economic opportunities associated with these shifts are potentially huge. The broad global political consensus around climate change is manifest in changing customer attitudes, varying national targets, regulatory nudges and incentives across the world, all of which create significant markets for clean energy technologies and systems.
The most recent estimates (e.g., from the World Bank, Oxford Economics, Mckinsey and IEA) of the global market opportunity for clean tech products and services suggest a market of well over $3trn a year, with energy infrastructure investment alone accounting for between $2,5trn and $3trn a year between now and 2040xlvii. The challenge in taking advantage of this global market opportunity is that it will clearly require new cross-sectoral collaborations, for example between transport, energy, construction and digital sectors, and the transfer of know-how from sectors like advanced manufacturing and logistics to construction and energy. Unlike the West Midlands, few regions have economies with strengths in all these areas, especially coupled with a diversity of both research and practice-led universities to support effective cross-fertilisation and the emergence of new competencies. Effective commercialisation of cross-sectoral innovations also requires accessible markets of sufficient scale to support rapid scale-up (for example helping new businesses cross the ‘valley of death’)xlviii. The West Midlands is big enough – comparable in population and economy to a small country such as Finland, Denmark or Norway – to offer such a market, particularly in the energy sector where public policy unavoidably plays a major role in determining outcomes (in any political system). Fort these reasons, low carbon technologies and services are justifiably identified as a key strategic sector in the West Midlands industrial strategy, and the region has a unique opportunity to benefit from the $3trn global market opportunity currently developing.
West Midlands Regional Energy Strategy March 2018
P a g e 21 | 64
4. Challenges and constraints
There are, however, significant challenges in any attempt to address energy strategically at regional
level in the UK, despite the clear potential economic and environmental benefits of doing so
summarised in section 3. This section reviews these challenges under seven broad headings, setting
the agenda for the focused strategy set out in section 5.
The speed and nature of technological change and choice in energy systems
There are a wide variety of technical choices to make in any energy system, whether for an
individual house, a region or a country. The economics of energy technologies in a given place are
also not independent of each other9, so for example a district energy system may make a lot of
economic sense if local housing is poorly insulated and no sense at all if the same housing is
retrofitted with the latest insulation (an economic choice which makes complete sense for the
householder but not for the district heat operator).
This context is further complicated when we are seeing technological change and changes in the
economics of individual technologies on the scale and at the rate illustrated in Figure 13. The current
world is one in which proponents of hydrogen, electric vehicles, biomass, solar, nuclear, micro-chp,
district heating, smart controls, energy storage, building energy efficiency and heat pumps can all
credibly claim to be offering game-changing rates of technical progress and cost reduction.
If we’re not very careful, these two realities create a significant risk of very poorly informed and
meaningless public debate and policy-making. This is particularly true at national and international
level, and in political systems where public servants are poorly equippedxlix to resist specialist
lobbying by corporates and academic proponents of specific technologies. The outcome is too often
far too much time wasted debating questions which are meaningless and impossible to answer in
the abstract: like ‘are heat pumps better than gas, or wind better than nuclear?’. Such questions can
only really be answered in a defined context (i.e., for a specific geography and set of infrastructure
and market regulations) and at a given moment in time.
Energy investment decisions will also always entail significant uncertainty and risk, because a high
rate of innovation means the one certainty is that tomorrow’s economics will not be the same as
today’s, so some assets will be ‘stranded’ and we’ll look back at other decisions with the benefit of
hindsight and find that if we’d make a different choice we’d have ended up with a lower cost
outcome.
The challenge then, is not to identify the best technologies to deploy in any kind of general sense,
but to make sure that energy investment choices and decisions are made by those best placed to
manage the unavoidable uncertainty and risks that all such decisions entail.
Two further points are increasingly relevant to many energy choices:
9 This should probably be written more forcefully: the economics of energy technologies are typically highly dependent on other energy technologies already present and the infrastructure around them. To give a stark example, a gas boiler has no economic value at all to a property off the gas grid.
West Midlands Regional Energy Strategy March 2018
P a g e 22 | 64
1. Energy infrastructure choices are becoming more granular and local. This point has already
been made in section 3 and is the outcome of the reducing costs of storage and digital
control technologies. Put another way, the proposition is that varying local energy
infrastructure no longer necessarily means extra cost and risk to the national system.
The challenge this creates is that it’s no longer economically optimal (or sensible) to think
about a single national energy infrastructure: it’s becoming in everyone’s interest –
especially the customers who pay for energy – to think about infrastructure choices more
locally. This makes regional and local energy decision-making more challenging (because it’s
no longer simply about what investments should be made in generation and demand-side
assets given a fixed infrastructure – the infrastructure itself is now fluid and part of the
process) but is more likely to result in better outcomes and match risk to reward.
2. Energy investments (and their economics) are increasingly tied into wider (non-energy)
infrastructure and policy decisions. Carbon pricing, carbon targets and environmental policy
are the obvious examples of this at global, national and local level, but local waste, transport
and industrial strategies will also be critical factors determining the viability and
attractiveness of energy projects, as will housing and spatial plans.
This means that to manage the risks and uncertainty of energy investments effectively,
decision-makers need to be able to take a broad range of interests and issues into account.
This gets very difficult (and can easily lose touch with political realities and voters) once
decisions are taken at regional or national level – which is why much spatial, waste and
transport planning is done at local authority level.
Customer engagement in energy markets
While customers can occasionally get very engaged by energy technologies and energy investment
and infrastructure choices in particular (for example, wind turbines, waste-to-energy plants or
nuclear power) they are largely apathetic and disengaged when it comes to the energy market, with
around 95% of customers of the larger suppliers paying more than necessary for electricity and gas,
despite the best efforts of Ofgem and others to persuade customers actively to shop around and
switch suppliers regularlyl.
This is a significant problem for any effort to ‘do energy differently’, especially if such efforts assume
benefits will be delivered by active competition. Markets simply don’t work if people ignore them
and refuse to visit.
So it’s important than any strategy include some model for customer engagement and
communication, particularly if benefits depend on customers making active and informed choices.
Narrow definitions of innovation
As discussed in section 3, there are major opportunities for innovation and the emergence of new
business models in energy (including potentially whole new industrial sectors, such as autonomous
vehicles and connected homes). Facilitating the development of such models and such innovation is
critical for the region to maximise both economic and environmental benefits. However, we need to
be very careful not to constrain growth by taking too narrow an approach to innovation regionally.
West Midlands Regional Energy Strategy March 2018
P a g e 23 | 64
By a narrow approach to innovation, we mean a tendency to define innovation solely as
commercialising new technologies emerging from university-led research, coupled with an
innovation agenda largely set by existing (and typically larger) industrial interests.
Both of these aspects of innovation are, of course, fundamentally important and need to be
supported, but in regional energy systems and to deliver the scale of ambition of the West Midlands,
it’s also critically important to recognise the value of investment which is innovative in the sense of,
for example:
• new applications of existing technologies at a scale beyond anything previously attempted
• new combinations of existing technologies in a systemic way, creating new business models
and new customer outcomes
• incremental development (including simple cost reductions) of existing technologies
• innovative market regulation and governance, creating incentives for investors and
innovators to take significant commercial risks at scale
• investment in energy infrastructure which may not be that innovative in itself, but which
unlocks whole new markets for low carbon energy technologies and systems and
opportunities for economic development
Innovations such as Tesla are (arguablyli) far more likely to arise from this kind of innovation than
innovation driven by leading edge research or existing automotive or energy interests.
This particular challenge in the energy sector (particularly energy infrastructure) stems from the
combination of:
• the world currently emerging from a relatively long period (several working generations)
when the whole energy sector has been relatively static and slow-moving, with very limited
innovation;
• a one-size-fits-all approach to national energy infrastructure that was driven by the
economics and technologies of the 20th century rather than the 21st;
• a long-standing cultural problem with UK innovation policy which places too much emphasis
on the simplistic ‘linear’ model of innovationlii.
Some progress has been made in the last few years with the creation of the Catapults nationally,
particularly the Energy Systems Catapult in Birminghamliii, although there is still some way to go in
recognising the need for (and value of) local variety and sensitivity in energy systems. Nevertheless,
it will be important to take a broad perspective of innovation in the regional energy strategy.
Diversity of local ambitions
The West Midlands’ scale gives it economic weight and the ability to deliver substantial and
ambitious schemes and policy objectives, to national as well as local benefit. It is, however, a diverse
geography (see section 2) and the workshop-style medium size manufacturing of the Black Country
has very different needs and offers different opportunities and challenges to the concentration of
automotive manufacturing in Coventry and Warwickshire, currently heavily dependent on a single
firm (JLR).
Similarly, the highly diverse and concentrated urban population and environment of Birmingham
contrasts with the rural environment and town centres of Warwickshire, North Worcestershire and
West Midlands Regional Energy Strategy March 2018
P a g e 24 | 64
South Staffordshire, and it isn’t at all clear that the same kind of energy system will benefit all these
areas equally.
The challenge is to see this diversity as a strength and a virtue, in common with the people who live
in the region (often commuting from rural towns to Birmingham, or vice versa for leisure and
shopping) and not to develop an energy strategy which either ignore or undermines the diversity of
ambitions and loyalties this variety creates.
Complexity of political institutions and public sector capacity
The diverse economic geography of the region is reflected in a complex layering of political
institutions which can appear somewhat impenetrable to outsiders, although in practice it generally
works very well and makes sense to those involved.
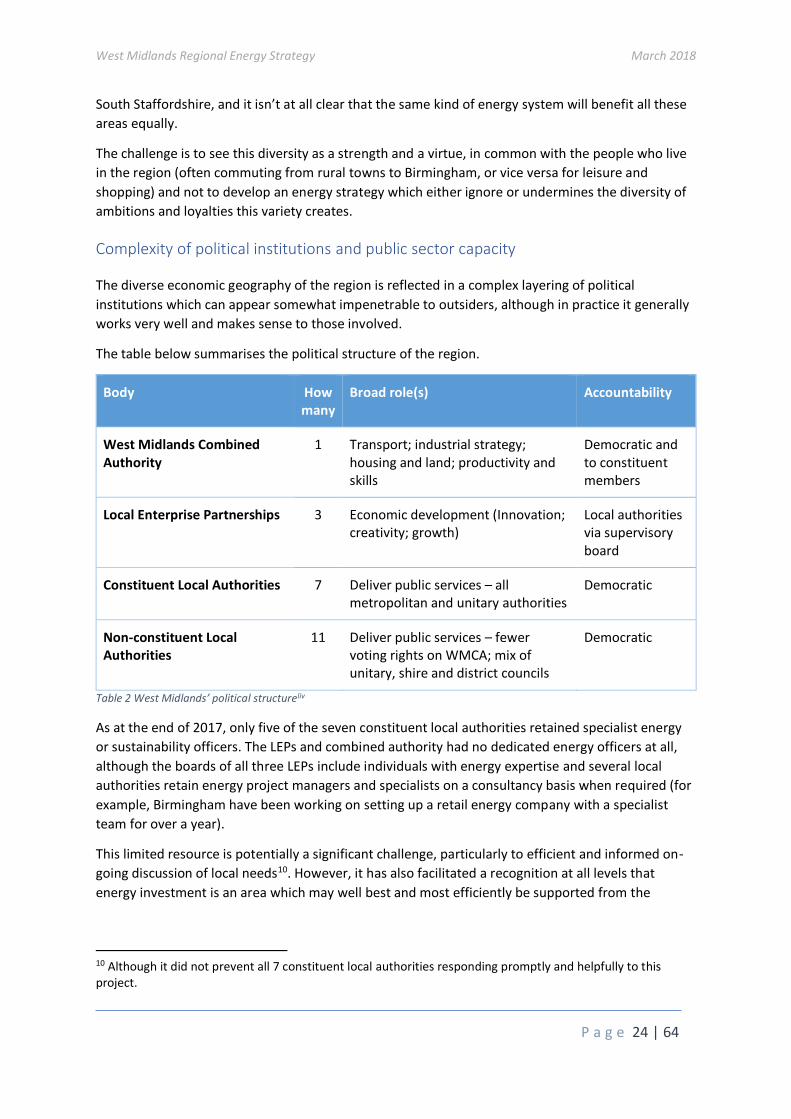
The table below summarises the political structure of the region.
Body How many
Broad role(s) Accountability
West Midlands Combined Authority
1 Transport; industrial strategy; housing and land; productivity and skills
Democratic and to constituent members
Local Enterprise Partnerships 3 Economic development (Innovation; creativity; growth)
Local authorities via supervisory board
Constituent Local Authorities 7 Deliver public services – all metropolitan and unitary authorities
Democratic
Non-constituent Local Authorities
11 Deliver public services – fewer voting rights on WMCA; mix of unitary, shire and district councils
Democratic
Table 2 West Midlands’ political structureliv
As at the end of 2017, only five of the seven constituent local authorities retained specialist energy
or sustainability officers. The LEPs and combined authority had no dedicated energy officers at all,
although the boards of all three LEPs include individuals with energy expertise and several local
authorities retain energy project managers and specialists on a consultancy basis when required (for
example, Birmingham have been working on setting up a retail energy company with a specialist
team for over a year).
This limited resource is potentially a significant challenge, particularly to efficient and informed on-
going discussion of local needs10. However, it has also facilitated a recognition at all levels that
energy investment is an area which may well best and most efficiently be supported from the
10 Although it did not prevent all 7 constituent local authorities responding promptly and helpfully to this project.
West Midlands Regional Energy Strategy March 2018
P a g e 25 | 64
Combined Authority and has driven the formation of the Energy Capital partnership for the region.
Energy Capital has been well-supported by the public and private sector.
BEIS have recognised public sector capacity issues in energy nationally and are funding the
equivalent of one specialist energy post per LEP area for the next two years. This funding will be very
helpful in supporting better dialogue and knowledge transfer, but it will fall some way short of the
resource necessary to deliver any meaningful strategy for the region with the scale and impact
justified by the opportunities outlined in section 3 above.
Existing industrial strengths
The West Midlands has historic strengths in several sectors, but especially automotive and
manufacturing. This is a weakness and risk, of course, as well as a major virtue.
Given the global consensus that new cross-sectoral business models are likely to emerge as the
energy transition unfolds (and companies like Tesla and Amazon already exemplify this) it will be
very important to the long-term economic success of the region that we don’t only reinforce existing
industrial strengths through our energy strategy.
Our approach must also support new firms and start-ups with potential to grow, and the ‘silent
majority’ of mid-sized manufacturing firms across the regionlv who could grow substantially by
redirecting their existing skills and competencies to new markets and opportunities opening up
worldwide.
A mismatch between regulatory system design and market opportunities
There are two separate and equally fundamental issues with energy market regulation from the
perspective of a region seeking to develop a coherent and meaningful energy strategy to deliver
local economic, social and environmental objectives. One is the complexity of the system, and the
other is a structural mismatch between regulation and where the technical and economic
opportunities lie.
Historic complexity
Over the last 40 years the UK has led the world in developing a market-based regulatory model for
energy. This was initially very successful, but the past 15 years have seen a progressive return to
government control and increasing criticism of the complexity and outcomes delivered by the
current model for customers, which are generally higher priceslvi.
The desire of government to get involved in energy market regulation is understandable (and
probably necessary) because energy has such a significant potential impact on economic and
environmental outcomes at all levels – national, regional and individual. However, the consequence
of recent UK history in this sector and the rather confused mix of ‘independent’ regulation of
privatised companies and increasingly robust government intervention (e.g., the introduction of
price capslvii) is a horribly complex and opaque energy sector and slowly stirring soup of regulations
which is virtually impenetrable to many insiderslviii, let alone to local or regional authorities (or small
and medium-sized businesses) wishing to innovate or develop coherent and ambitious strategies in
this sector.
West Midlands Regional Energy Strategy March 2018
P a g e 26 | 64
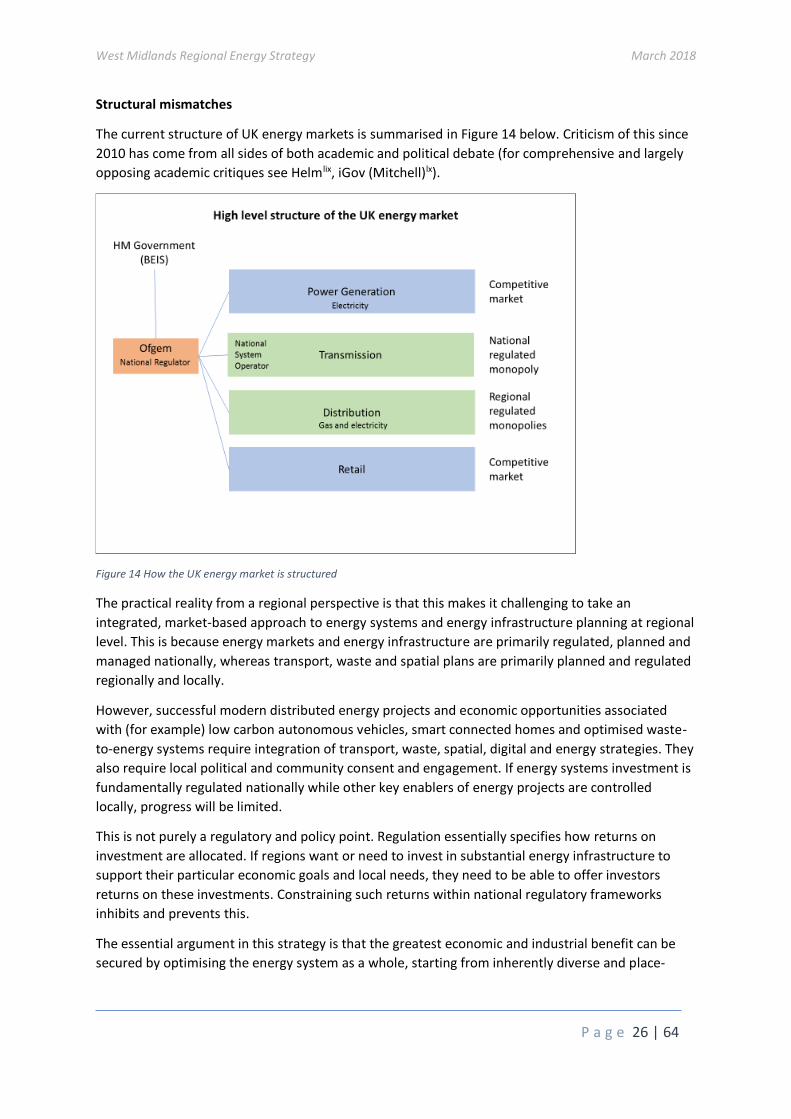
Structural mismatches
The current structure of UK energy markets is summarised in Figure 14 below. Criticism of this since
2010 has come from all sides of both academic and political debate (for comprehensive and largely
opposing academic critiques see Helmlix, iGov (Mitchell)lx).
Figure 14 How the UK energy market is structured
The practical reality from a regional perspective is that this makes it challenging to take an
integrated, market-based approach to energy systems and energy infrastructure planning at regional
level. This is because energy markets and energy infrastructure are primarily regulated, planned and
managed nationally, whereas transport, waste and spatial plans are primarily planned and regulated
regionally and locally.
However, successful modern distributed energy projects and economic opportunities associated
with (for example) low carbon autonomous vehicles, smart connected homes and optimised waste-
to-energy systems require integration of transport, waste, spatial, digital and energy strategies. They
also require local political and community consent and engagement. If energy systems investment is
fundamentally regulated nationally while other key enablers of energy projects are controlled
locally, progress will be limited.
This is not purely a regulatory and policy point. Regulation essentially specifies how returns on
investment are allocated. If regions want or need to invest in substantial energy infrastructure to
support their particular economic goals and local needs, they need to be able to offer investors
returns on these investments. Constraining such returns within national regulatory frameworks
inhibits and prevents this.
The essential argument in this strategy is that the greatest economic and industrial benefit can be
secured by optimising the energy system as a whole, starting from inherently diverse and place-

West Midlands Regional Energy Strategy March 2018
P a g e 27 | 64
based requirements and opportunities. Increasingly this means paying attention to distribution and
generation infrastructure at a regional level (integrated with other regional infrastructure and
industrial needs) in the context of an over-arching national system which supports this.
Unfortunately, the system is currently designed on the assumption that distribution and
transmission infrastructure is essentially fixed, changes only slowly, and has little or no impact on
competitiveness. It also assumes that the only economically-viable generation assets are national in
scale. These assumptions were broadly true in 1970, 1980, and 1990 but from 2000 they became
diminishingly true and they no longer hold.
The present UK system therefore assumes that the only economic benefit and industrial advantage
that the energy system can offer is through competition in retailing energy and in generating energy
to supply a national system. In the 21st century, these assumptions are simply wrong11.
11 In saying this, this strategy agrees with Dieter Helm, who develops all these points at some length in his cost of energy review.
West Midlands Regional Energy Strategy March 2018
P a g e 28 | 64
5. Our regional energy strategy
Overview and principles
The West Midlands Combined Authority is a new organisation with a new Mayor, working to an
ambitious agenda with three highly effective local enterprise partnerships and supportive
constituent local authorities. This creates an opportunity to develop a distinctive and powerful
regional energy strategy building on our unique history and meeting our unique regional needs (see
section 3) while addressing the challenges set out in section 4.
Reflecting this background and context, the strategy is built on five core principles:
1. Respect for diversity and existing strengths across the region
2. Leadership in the clean energy transition nationally and internationally through innovation
3. Partnership across sectors and between our universities, businesses and communities
4. Openness to new thinking and transparency to support this
5. Focus on areas where we can make the biggest difference by working together at regional
level.
In particular, we see local leadership of regional energy activity as fundamental to success12. This
means local authorities and the communities they represent. Our strategy is thus a framework for
local energy leadership at scale and creating impact across the West Midlands.
These core principles are translated into four specific initiatives:
1. Development and use of Energy Innovation Zones to provide a simple, flexible mechanism
to support integrated local energy infrastructure transition, investment and accelerated
deployment of innovation. The West Midlands has led on the development of the concept of
EIZs nationallylxi.
2. Creation of an innovative and democratically-accountable regional energy governance
structure, Energy Capital, in partnership with national stakeholders and energy system
operators. This will manage risks, help secure necessary funding and regulatory powers and
provide assurance to national system operators and regulators that local activities remain
within national market and regulatory frameworks.
3. Investing in specialist resource to help secure long-term funding at scale for targeted and
appropriate local energy investments, innovation and development of an active innovative
energy business cluster at scale. We propose to target raising £500M of investment funding
to support commercially-viable energy investment across the regionlxii.
4. Targeted support for innovators, ambitious existing businesses and citizens in taking
advantage of the economic opportunities created by the global energy transition. This will
build on existing initiatives and institutions.
12 This is a technical point as well as a political and logical one. The more localised an energy project, the more sensitive its economics tend to be to customer engagement: local people impact project development risk and costs significantly (for example for wind and waste to energy schemes) and customer behaviour is typically the key determinant of financial returns on demand side energy projects. Wayleaves for district energy pipework and other such details are all under local authority and community control and critical to efficient and profitable project delivery.
West Midlands Regional Energy Strategy March 2018
P a g e 29 | 64
Objectives and vision
We aim to:
• Reduce energy costs for our strategic industries to enhance their competitiveness and
productivity.
• Reduce the incidence of fuel poverty among households, particularly in Birmingham,
Coventry and the Black Country
• Deliver the region’s share of national and global carbon budgets
• Create a regional energy infrastructure which puts the West Midlands at the leading edge of
the global energy and transport systems transition and make this region the most attractive
market to commercialise new energy and transport system technologies in the UK.
For each of these objectives we will set ourselves measurable targets as set out in Table 3 below.
Objective Proposed target
Energy costs for our strategic industries Equivalent or better than costs paid by German competitors by 2023
This means delivering a typical 20-25% reduction, depending on sector.
Reduced incidence of fuel poverty across our 1.7M households (currently approximately 200,000 homes are in fuel poverty across the region)
Beat national government targets13,lxiii by at least 5 years:
As many fuel poor households as practical in Band C homes by 2025
As many fuel poor households as practical in Band D homes or better by 2020
Deliver our share of national and global carbon budgets
Reduce regional carbon emissions by 26% between 2016 and 2030lxiv
Create a regional energy infrastructure putting the region at the leading edge of the global energy and transport systems transition
£1bn GVA improvement by 2025 through EIZs and associated cluster support and technology commercialisationlxv.
Table 3 Strategic objectives and targets
Anticipated projects and pipeline - who picks the winners (and losers)?
There are over £490M of commercially-sensible innovative energy infrastructure projects in the
proposed pilot EIZs alonelxvi and at least the same scale of opportunity again across the wider region
(Appendix I – Sub-regional mapping reports). In total, our analysis (section 3) indicates that more
13 In 2014, the Government put in place a new statutory fuel poverty target for England: to ensure that as many fuel poor households as reasonably practicable achieve a minimum FPEER rating of Band C by 2030, with interim targets of Band E by 2020, and Band D by 2025. Bands are ways of measuring the energy efficiency of housing: A is good and E is awful.
West Midlands Regional Energy Strategy March 2018
P a g e 30 | 64
than £15bn of investment will be needed as a baseline scenario in energy infrastructure across the
three LEPs between now and 2030, plus a further £74bn in energy-dependent technologies such as
cars (£32bnlxvii) and buildings (£42bn) over the next 12 years.
The task of this strategy is clearly to influence these investment flows to ensure our regional
strategic targets are met, but given the challenges set out in section 4, who is best placed to make
the key investment choices is a moot point.
A fundamental challenge in the energy sector is that who picks the winning and losing technologies
is not a simple question to answer. Individual customers select energy suppliers and choose between
makes of car (creating what looks like competitive markets) but the costs of delivering the energy to
the customer’s home or of driving the car are largely determined by local infrastructure, and the
investment decisions which shaped this have been taken over decades by national and local
stakeholders, including both government and private companies14.
Similarly, experts and innovators may be sure a new energy technology such as a particular type of
hydrogen fuel cell is bound to succeed in the future, but if customers don’t want it and the local
infrastructure asset base doesn’t support it economically, it probably isn’t going to succeed.
So all we really know is that the answer to ‘who picks the winners’ in energy is not the market, not
the government and not experts or innovators, but a complex combination of all of these. An
effective regional strategy (and indeed market design and national system) needs to recognise and
work with this reality.
In the current UK energy system, infrastructure winners and losers are currently chosen by network
operators with regional monopolies regulated nationally, broadly on the assumptions that not a lot
is fundamentally going to change: a one-size fits all system is the only economic option; and thus
who picks winners and losers doesn’t really matter. As previously discussed, almost everyone in the
energy sector recognises these assumptions are now outdated, and the most economically-
competitive future systems will be more sensitive to local opportunities and needs.
A more locally-sensitive process for making energy infrastructure choices and investment decisions
is therefore required.
This strategy responds to this challenge in three ways.
1. It creates a framework through Energy Innovation Zones for localities to act as intelligent
and strategic customers (i.e., procurement and investment bodies) for future energy
infrastructure and asset investments. EIZ Partnership Boards (see below) will be made up of
stakeholders relevant to the local area (often including academic experts and distribution
network operators) and controlled by the local authority, representing the long-term
democratically-determined interests of the area.
2. It provides support for the creation and operation of EIZs through Energy Capital, which
itself provides a gateway to wider support (such as BEIS’s Energy Hubs). Energy Capital will
help fill gaps in expertise where necessary; it will develop large scale investment funds; and
it will provide access to regulatory and specialist legal advice and support where this is
14 This is arguably one reason why customers fail to engage very much in retail energy markets: they know the real cost-determining decisions are not in their hands.
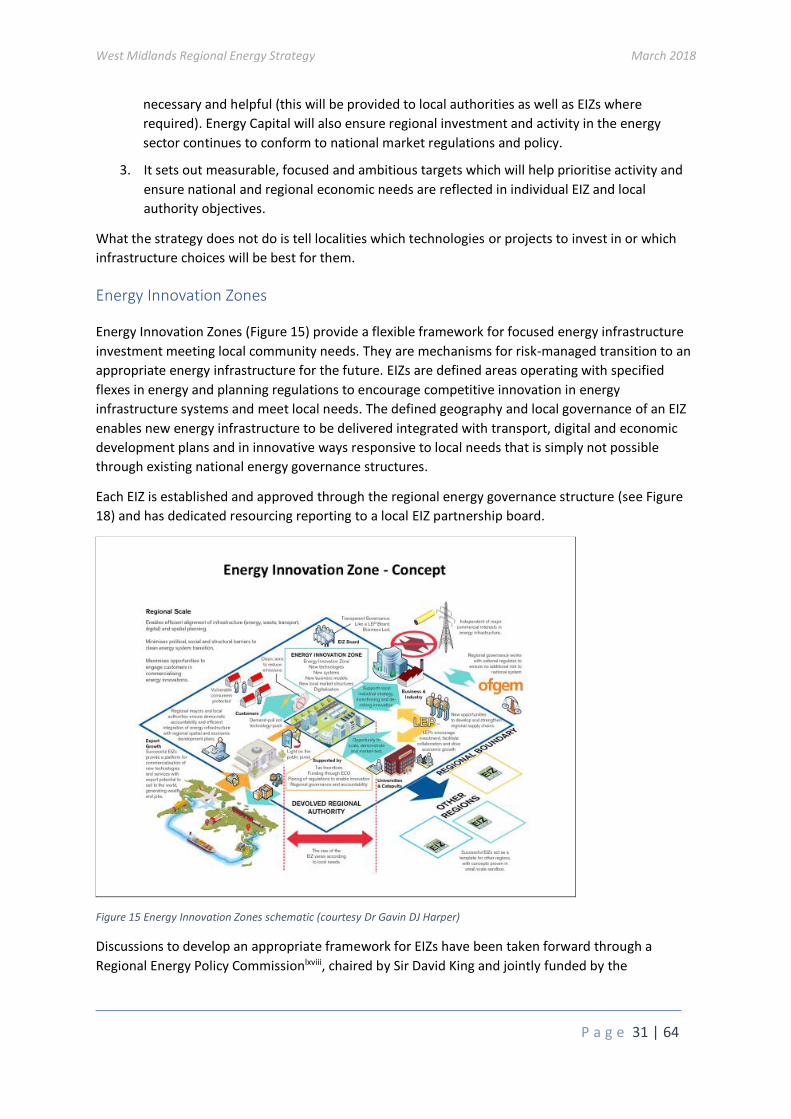
West Midlands Regional Energy Strategy March 2018
P a g e 31 | 64
necessary and helpful (this will be provided to local authorities as well as EIZs where
required). Energy Capital will also ensure regional investment and activity in the energy
sector continues to conform to national market regulations and policy.
3. It sets out measurable, focused and ambitious targets which will help prioritise activity and
ensure national and regional economic needs are reflected in individual EIZ and local
authority objectives.
What the strategy does not do is tell localities which technologies or projects to invest in or which
infrastructure choices will be best for them.
Energy Innovation Zones
Energy Innovation Zones (Figure 15) provide a flexible framework for focused energy infrastructure
investment meeting local community needs. They are mechanisms for risk-managed transition to an
appropriate energy infrastructure for the future. EIZs are defined areas operating with specified
flexes in energy and planning regulations to encourage competitive innovation in energy
infrastructure systems and meet local needs. The defined geography and local governance of an EIZ
enables new energy infrastructure to be delivered integrated with transport, digital and economic
development plans and in innovative ways responsive to local needs that is simply not possible
through existing national energy governance structures.
Each EIZ is established and approved through the regional energy governance structure (see Figure
18) and has dedicated resourcing reporting to a local EIZ partnership board.
Figure 15 Energy Innovation Zones schematic (courtesy Dr Gavin DJ Harper)
Discussions to develop an appropriate framework for EIZs have been taken forward through a
Regional Energy Policy Commissionlxviii, chaired by Sir David King and jointly funded by the
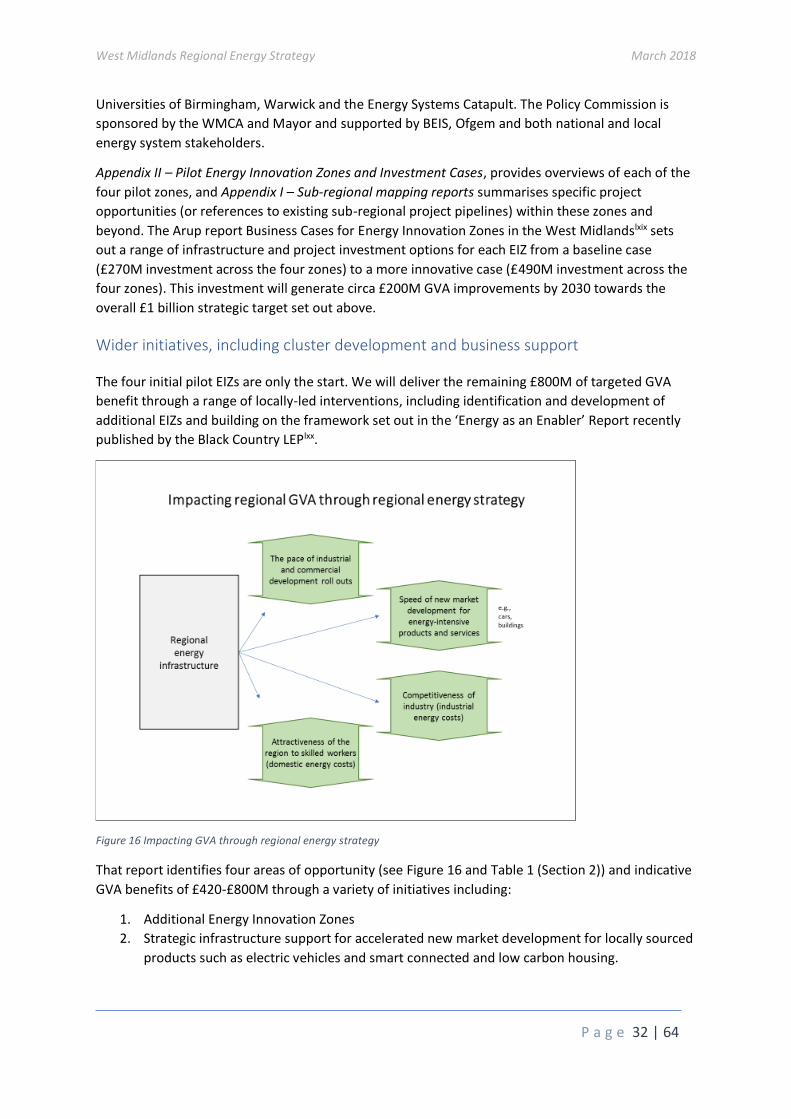
West Midlands Regional Energy Strategy March 2018
P a g e 32 | 64
Universities of Birmingham, Warwick and the Energy Systems Catapult. The Policy Commission is
sponsored by the WMCA and Mayor and supported by BEIS, Ofgem and both national and local
energy system stakeholders.
Appendix II – Pilot Energy Innovation Zones and Investment Cases, provides overviews of each of the
four pilot zones, and Appendix I – Sub-regional mapping reports summarises specific project
opportunities (or references to existing sub-regional project pipelines) within these zones and
beyond. The Arup report Business Cases for Energy Innovation Zones in the West Midlandslxix sets
out a range of infrastructure and project investment options for each EIZ from a baseline case
(£270M investment across the four zones) to a more innovative case (£490M investment across the
four zones). This investment will generate circa £200M GVA improvements by 2030 towards the
overall £1 billion strategic target set out above.
Wider initiatives, including cluster development and business support
The four initial pilot EIZs are only the start. We will deliver the remaining £800M of targeted GVA
benefit through a range of locally-led interventions, including identification and development of
additional EIZs and building on the framework set out in the ‘Energy as an Enabler’ Report recently
published by the Black Country LEPlxx.
Figure 16 Impacting GVA through regional energy strategy
That report identifies four areas of opportunity (see Figure 16 and Table 1 (Section 2)) and indicative
GVA benefits of £420-£800M through a variety of initiatives including:
1. Additional Energy Innovation Zones
2. Strategic infrastructure support for accelerated new market development for locally sourced
products such as electric vehicles and smart connected and low carbon housing.
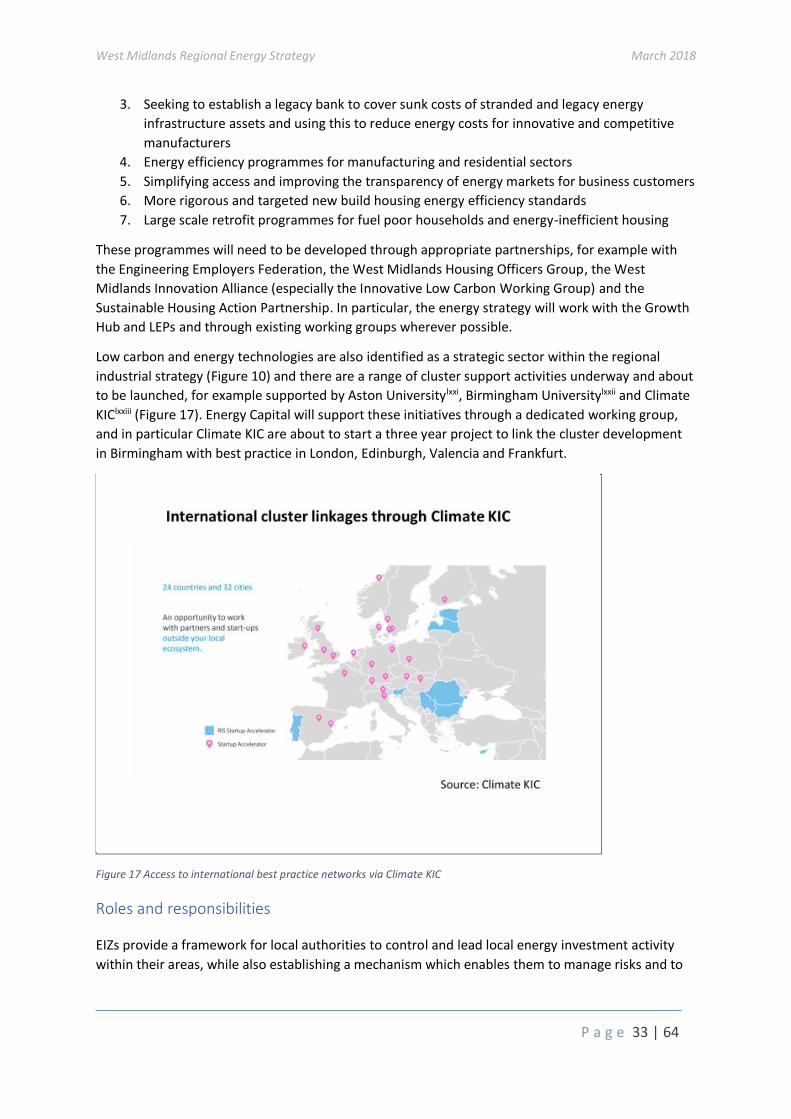
West Midlands Regional Energy Strategy March 2018
P a g e 33 | 64
3. Seeking to establish a legacy bank to cover sunk costs of stranded and legacy energy
infrastructure assets and using this to reduce energy costs for innovative and competitive
manufacturers
4. Energy efficiency programmes for manufacturing and residential sectors
5. Simplifying access and improving the transparency of energy markets for business customers
6. More rigorous and targeted new build housing energy efficiency standards
7. Large scale retrofit programmes for fuel poor households and energy-inefficient housing
These programmes will need to be developed through appropriate partnerships, for example with
the Engineering Employers Federation, the West Midlands Housing Officers Group, the West
Midlands Innovation Alliance (especially the Innovative Low Carbon Working Group) and the
Sustainable Housing Action Partnership. In particular, the energy strategy will work with the Growth
Hub and LEPs and through existing working groups wherever possible.
Low carbon and energy technologies are also identified as a strategic sector within the regional
industrial strategy (Figure 10) and there are a range of cluster support activities underway and about
to be launched, for example supported by Aston Universitylxxi, Birmingham Universitylxxii and Climate
KIClxxiii (Figure 17). Energy Capital will support these initiatives through a dedicated working group,
and in particular Climate KIC are about to start a three year project to link the cluster development
in Birmingham with best practice in London, Edinburgh, Valencia and Frankfurt.
Figure 17 Access to international best practice networks via Climate KIC
Roles and responsibilities
EIZs provide a framework for local authorities to control and lead local energy investment activity
within their areas, while also establishing a mechanism which enables them to manage risks and to
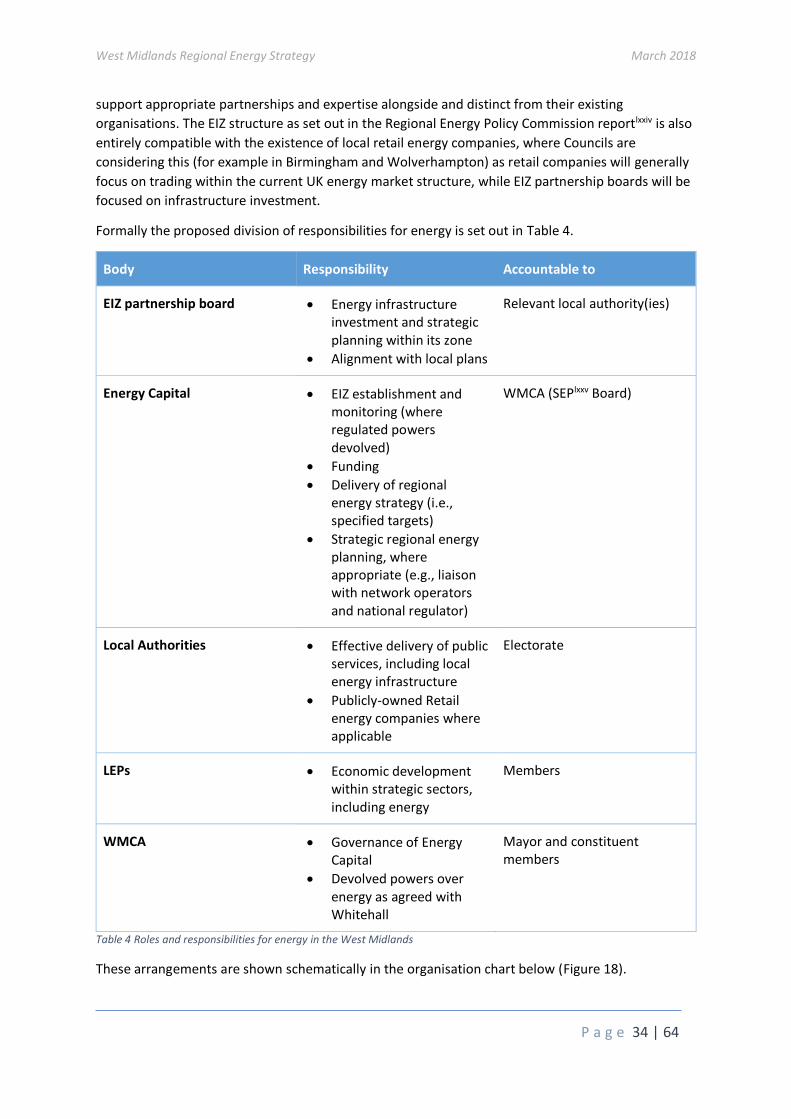
West Midlands Regional Energy Strategy March 2018
P a g e 34 | 64
support appropriate partnerships and expertise alongside and distinct from their existing
organisations. The EIZ structure as set out in the Regional Energy Policy Commission reportlxxiv is also
entirely compatible with the existence of local retail energy companies, where Councils are
considering this (for example in Birmingham and Wolverhampton) as retail companies will generally
focus on trading within the current UK energy market structure, while EIZ partnership boards will be
focused on infrastructure investment.
Formally the proposed division of responsibilities for energy is set out in Table 4.
Body Responsibility Accountable to
EIZ partnership board • Energy infrastructure investment and strategic planning within its zone
• Alignment with local plans
Relevant local authority(ies)
Energy Capital • EIZ establishment and monitoring (where regulated powers devolved)
• Funding
• Delivery of regional energy strategy (i.e., specified targets)
• Strategic regional energy planning, where appropriate (e.g., liaison with network operators and national regulator)
WMCA (SEPlxxv Board)
Local Authorities • Effective delivery of public services, including local energy infrastructure
• Publicly-owned Retail energy companies where applicable
Electorate
LEPs • Economic development within strategic sectors, including energy
Members
WMCA • Governance of Energy Capital
• Devolved powers over energy as agreed with Whitehall
Mayor and constituent members
Table 4 Roles and responsibilities for energy in the West Midlands
These arrangements are shown schematically in the organisation chart below (Figure 18).
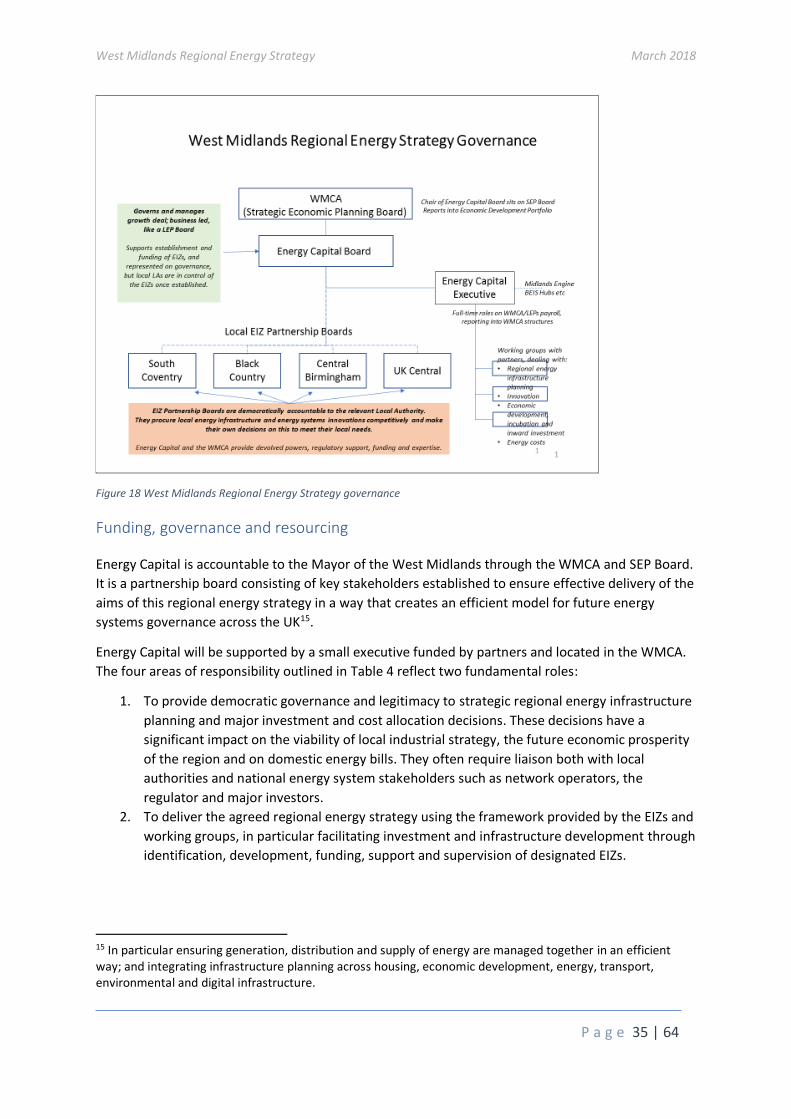
West Midlands Regional Energy Strategy March 2018
P a g e 35 | 64
Figure 18 West Midlands Regional Energy Strategy governance
Funding, governance and resourcing
Energy Capital is accountable to the Mayor of the West Midlands through the WMCA and SEP Board.
It is a partnership board consisting of key stakeholders established to ensure effective delivery of the
aims of this regional energy strategy in a way that creates an efficient model for future energy
systems governance across the UK15.
Energy Capital will be supported by a small executive funded by partners and located in the WMCA.
The four areas of responsibility outlined in Table 4 reflect two fundamental roles:
1. To provide democratic governance and legitimacy to strategic regional energy infrastructure
planning and major investment and cost allocation decisions. These decisions have a
significant impact on the viability of local industrial strategy, the future economic prosperity
of the region and on domestic energy bills. They often require liaison both with local
authorities and national energy system stakeholders such as network operators, the
regulator and major investors.
2. To deliver the agreed regional energy strategy using the framework provided by the EIZs and
working groups, in particular facilitating investment and infrastructure development through
identification, development, funding, support and supervision of designated EIZs.
15 In particular ensuring generation, distribution and supply of energy are managed together in an efficient way; and integrating infrastructure planning across housing, economic development, energy, transport, environmental and digital infrastructure.
West Midlands Regional Energy Strategy March 2018
P a g e 36 | 64
The Energy Capital Board will provisionally be constituted as follows:
• Chair (from membership)
• Infrastructure providers (4)
• National Grid
• Cadent
• Western Power
• Severn Trent
• Customers (4)
• JLR
• EEF/Manufacturers
• Housing
• Environment
• Local authorities and EIZs (7)
• 1 representative nominated by each LEP
• 1 representative nominated by local authorities per LEP area
• 1 representative nominated by non-LEP WMCA local authorities
• Universities/Innovation
• 1 representative nominated by each contributing university
• Energy Systems Catapult
The model is akin to a LEP board but specific to the energy sector.
Relationship to other regions
The West Midlands is already collaborating internationally in energy through Climate KIC –
particularly the new project with Edinburgh, London, Valencia and Frankfurt - and various university
partnerships with overseas institutions. While developing this energy strategy we’ve actively
engaged and exchanged notes with Cornwall and the West of England devolved authorities as well
as the GLA (all of which have similar political structures and ambitions or experiences in local energy)
and we intend to maintain and expand this openness and willingness to share best practices and
take it through into the strategy delivery phase.
We also welcome the new regional energy hubs being established by BEIS and look forward to
supporting the staff allocated to our region. The West Midlands is part of the Midlands Engine and
we envisage this being helpful, for example in contexts like MIPIMlxxvi (where external bodies -
typically with little familiarity with UK regional geography - find it easier to relate to the various
economic regions within the Midlands collectively) provided it doesn’t dilute the focus and efficiency
with which we can deliver.
One of the recommendations of the Regional Energy Policy Commission is that the Energy Systems
Catapult help act as a conduit for transfer of best practices around innovation (which is not just what
this strategy is about) so it’s very helpful the Catapult is based in Birmingham. The strategy proposes
the Catapult is invited to become a continuing partner in Energy Capital and represented on the
Board on this basis.
West Midlands Regional Energy Strategy March 2018
P a g e 37 | 64
6. Global best practice
This strategy has been developed over more than two years and informed by support from global
consultancieslxxvii and individuals from companies with global perspective and presence, as well as
organisations like BEIS, who have a national view; Climate KIC, who have a European view; and the
universities across the region, who have global views. We also commissioned a short piece of work
by Sustainability West Midlands to understand what other LEPs nationally were doing on energy.
This has enabled us to compile a good sense of best practice nationally and internationally.
Much of this work has already been collated and written up for the region as part of the King
Commission Reportlxxviii which provides an excellent overview and commentary, so the following is a
summary only. As mentioned in section 5 above, the intention is to keep a strong sense of global
perspective in everything we do in the region, and continuously to adapt and refine the strategy as
we progress through delivery and take on board new ideas and experiences from elsewhere.
At the same time, we and constantly aspire to do better than our competitor economies worldwide
and are comfortable providing leadership where we have distinctive contributions to make. So we
will seek to develop global best practice and positions of leadership ourselves.
UK examples
Cities in the UK which have made significant progress on energy include Bristol, Nottingham,
Glasgow and London.
Bristol and Nottingham have both set up retail energy companies. Bristol’s now has over 100,000
customers and Nottingham 50,000, and Nottingham has recently expanded its offer to Leeds under a
white label scheme16. Both have also invested in energy project teams (numbering in 10s of staff)
and have a reasonable pipeline of projects supported by funding from the EU and Innovate UK.
Neither have yet managed to achieve the theoretical ideal of linking substantive funding streams
from a successful retail energy company into local energy infrastructure investment. This has limited
the scale of their achievements to modest savings on customer bills (of the order of 10%, or £130-
£190 per household) and modest capital investment projects, of the order of £1-£10M17.
Such achievements are substantial in the context of austerity and the wider challenges facing the
public sector, but nevertheless fall significantly short both of what Bristol and Nottingham
themselves set as targets (Bristol estimates £1 billion of investment is needed in its energy system to
meet its 2050 targets) and what the West Midlands is seeking to achieve through its industrial
strategy.
Nottingham is also hosting an early UK pilot of the Energiespronglxxix approach to large scale housing
retrofit, which is of interest to the West Midlands because of our significant fuel poverty challenges
and interest in off-site manufacturing (modern methods of construction). In practice, Energiesprong
was introduced to the UK through the West Midlands’ Sustainable Housing Action Partnership and
16 Much of the evidence in this section is drawn from the work of David Strahan and the West Midlands Regional Energy Policy Commission, whose report will be published in March 2018. 17 Ibid.
West Midlands Regional Energy Strategy March 2018
P a g e 38 | 64
has been strongly supported from the West Midlands (the board is chaired by Accord Housing from
West Bromwich and the off-site manufacturing is done in Walsall) so this is already a good example
of best practice travelling from Holland to the UK via the West Midlands, as well as on-going
knowledge sharing.
Glasgow has also made similar progress to Bristol and Nottingham with a retail energy companylxxx,
led by the social housing sector (which is helpful in providing access to a semi-captive customer
base, thus reducing risk) and London has made useful progress in constructively challenging OFGEM
around regulations which inhibit local authorities supporting infrastructure investment ahead of
demandlxxxi.
International examples
International examples of progress and innovation in regional energy systems were recently
comprehensively reviewed by the West Midlands Regional Energy Policy Commissionlxxxii.
Copenhagen, Munich, New York and South Australia are all mentioned as regions which have
benefitted substantially from locally-controlled energy investment, but the point is made that in all
these cases the municipalities have far greater statutory powers and responsibilities than their UK
equivalents.
Copenhagen has a history of local investment in integrated energy infrastructure suited to its needs
going back for at least a century. A city region with a population of just under 2 million,
Copenhagen’s local authority recently issued a bond of EUR500 million solely to finance regional
energy projects.
Munich is comparable to the West Midlands in terms of population with an urban core home to 1.5
million people and a wider regional population of 2.65 million people. Interestingly, Munich operates
its transport and energy systems through a single integrated municipal utility, Stadtwerke Munchen,
running a liberalised local energy (and transport) system and market on an entirely commercial basis
and securing revenues of EUR6.5 billion in 2016lxxxiii. Munich has already secured and invested over
EUR3 billion on its local energy system and plans to raise a further EUR3-4 billion shortly.
As the Regional Energy Policy Commission report notes, what all these examples show is the power
of local action to accelerate clean energy deployment and innovation, and to outstrip national
targets. Munich in particular is a good example (with its similar industrial heritage to the West
Midlands) and is currently one of the fastest growing city regions in Germany.
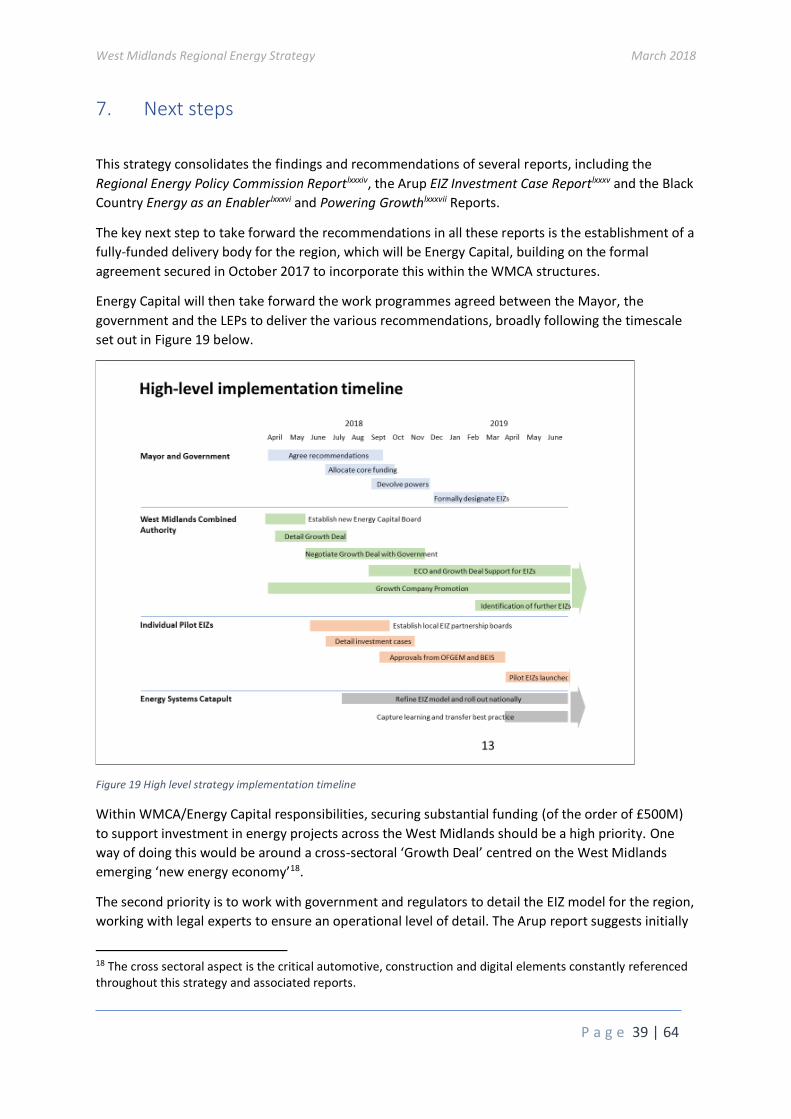
West Midlands Regional Energy Strategy March 2018
P a g e 39 | 64
7. Next steps
This strategy consolidates the findings and recommendations of several reports, including the
Regional Energy Policy Commission Reportlxxxiv, the Arup EIZ Investment Case Reportlxxxv and the Black
Country Energy as an Enablerlxxxvi and Powering Growthlxxxvii Reports.
The key next step to take forward the recommendations in all these reports is the establishment of a
fully-funded delivery body for the region, which will be Energy Capital, building on the formal
agreement secured in October 2017 to incorporate this within the WMCA structures.
Energy Capital will then take forward the work programmes agreed between the Mayor, the
government and the LEPs to deliver the various recommendations, broadly following the timescale
set out in Figure 19 below.
Figure 19 High level strategy implementation timeline
Within WMCA/Energy Capital responsibilities, securing substantial funding (of the order of £500M)
to support investment in energy projects across the West Midlands should be a high priority. One
way of doing this would be around a cross-sectoral ‘Growth Deal’ centred on the West Midlands
emerging ‘new energy economy’18.
The second priority is to work with government and regulators to detail the EIZ model for the region,
working with legal experts to ensure an operational level of detail. The Arup report suggests initially
18 The cross sectoral aspect is the critical automotive, construction and digital elements constantly referenced throughout this strategy and associated reports.
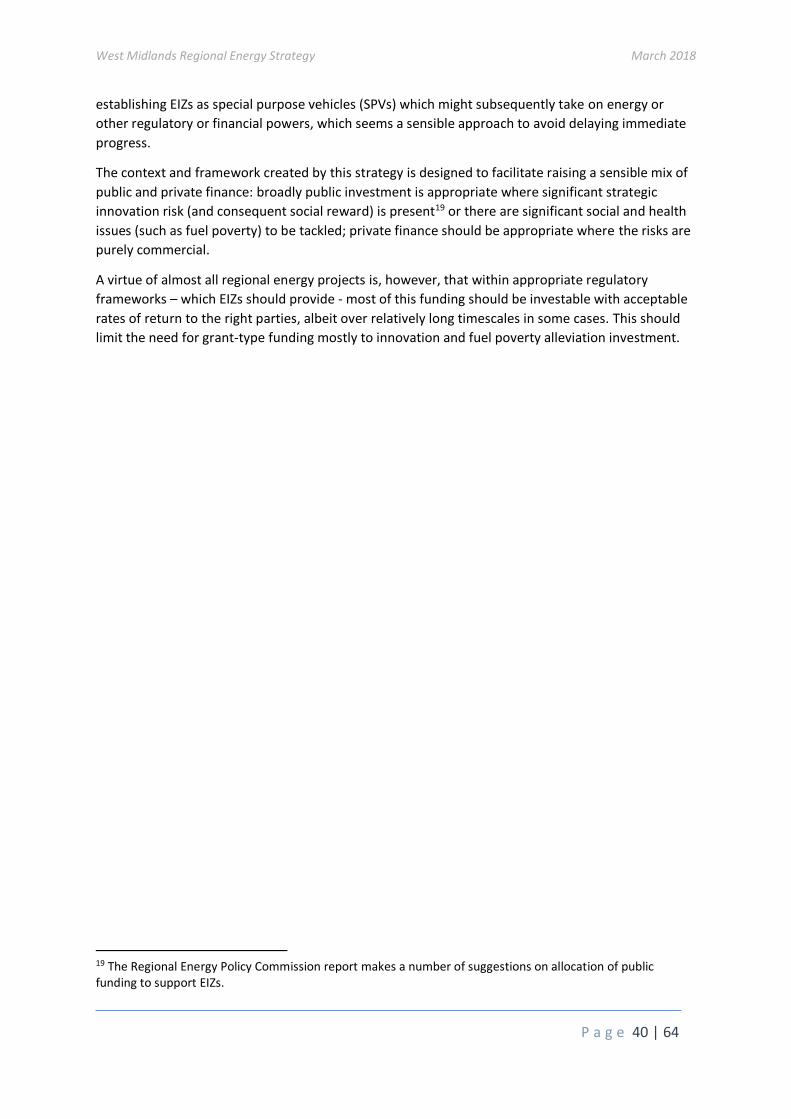
West Midlands Regional Energy Strategy March 2018
P a g e 40 | 64
establishing EIZs as special purpose vehicles (SPVs) which might subsequently take on energy or
other regulatory or financial powers, which seems a sensible approach to avoid delaying immediate
progress.
The context and framework created by this strategy is designed to facilitate raising a sensible mix of
public and private finance: broadly public investment is appropriate where significant strategic
innovation risk (and consequent social reward) is present19 or there are significant social and health
issues (such as fuel poverty) to be tackled; private finance should be appropriate where the risks are
purely commercial.
A virtue of almost all regional energy projects is, however, that within appropriate regulatory
frameworks – which EIZs should provide - most of this funding should be investable with acceptable
rates of return to the right parties, albeit over relatively long timescales in some cases. This should
limit the need for grant-type funding mostly to innovation and fuel poverty alleviation investment.
19 The Regional Energy Policy Commission report makes a number of suggestions on allocation of public funding to support EIZs.
West Midlands Regional Energy Strategy March 2018
P a g e 41 | 64
Appendix I – Sub-regional mapping reports
Most of the local authorities in the West Midlands have renewables and local energy opportunity
maps and studies produced over the past ten years and still hold these: the issue is not knowing
what the project opportunities are, it is securing the local political consensus, stakeholder support
and finance (within appropriate and predictable environments from the perspective of risk and
returns) to make them happen.
This appendix summarises resources known to be available, including the additional Black Country
Mapping report commissioned as part of this project to fill in the one major gap in the region.
In particular, studies of relevance to this strategy are:
Heat network studies part financed by BEIS (HNDU) for:
• Canley
• Dudley
• Sandwell (in progress)
• Solihull
• South Staffordshire
• Warwick (in progress)
• Whitley (in progress)
• Several across Birmingham and Staffordshire (see Figure 20 below)
A comprehensive utilities study for UK Central by Peter Brett Associates (in progress)
A detailed study of Coventry’s energy requirements by Rolton Group (subject to NDA)
GBSLEP Low Carbon Energy Plan 2016 (Gyron LLP) and associated Master planning study
Wolverhampton Renewable Energy and Carbon Reduction Study, Amec Grouplxxxviii
Detailed solar feasibility study for the city of Birmingham
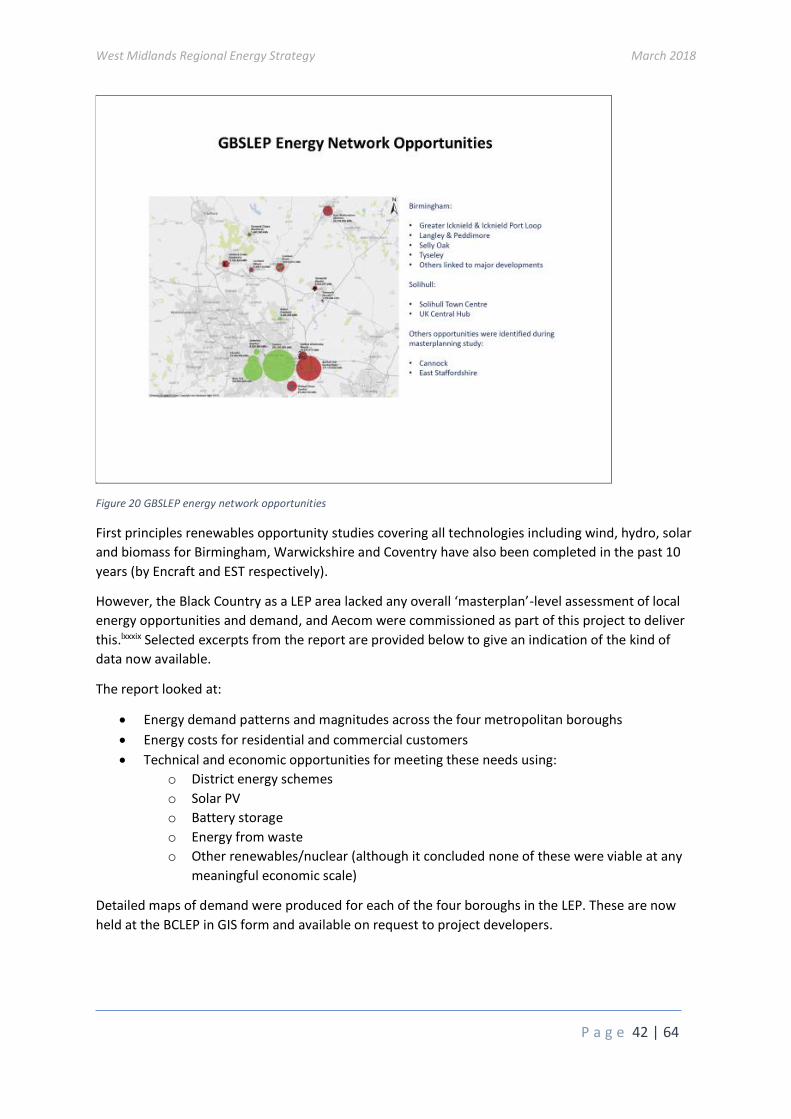
West Midlands Regional Energy Strategy March 2018
P a g e 42 | 64
Figure 20 GBSLEP energy network opportunities
First principles renewables opportunity studies covering all technologies including wind, hydro, solar
and biomass for Birmingham, Warwickshire and Coventry have also been completed in the past 10
years (by Encraft and EST respectively).
However, the Black Country as a LEP area lacked any overall ‘masterplan’-level assessment of local
energy opportunities and demand, and Aecom were commissioned as part of this project to deliver
this.lxxxix Selected excerpts from the report are provided below to give an indication of the kind of
data now available.
The report looked at:
• Energy demand patterns and magnitudes across the four metropolitan boroughs
• Energy costs for residential and commercial customers
• Technical and economic opportunities for meeting these needs using:
o District energy schemes
o Solar PV
o Battery storage
o Energy from waste
o Other renewables/nuclear (although it concluded none of these were viable at any
meaningful economic scale)
Detailed maps of demand were produced for each of the four boroughs in the LEP. These are now
held at the BCLEP in GIS form and available on request to project developers.
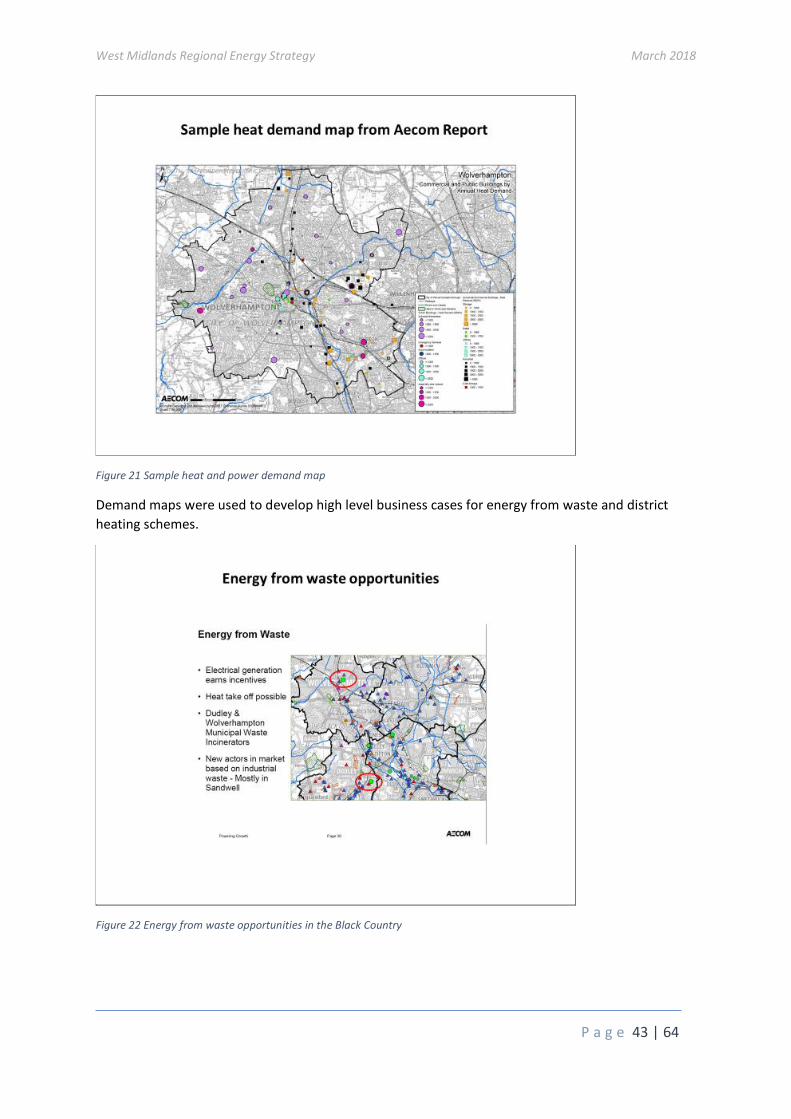
West Midlands Regional Energy Strategy March 2018
P a g e 43 | 64
Figure 21 Sample heat and power demand map
Demand maps were used to develop high level business cases for energy from waste and district
heating schemes.
Figure 22 Energy from waste opportunities in the Black Country
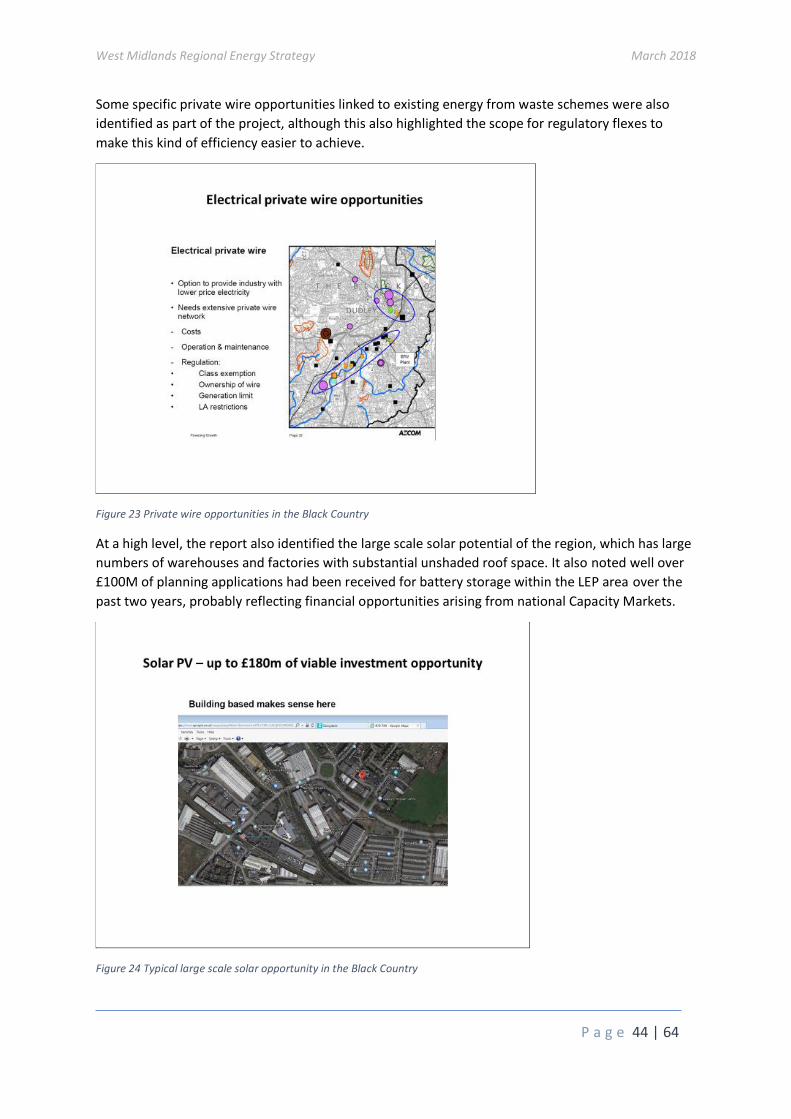
West Midlands Regional Energy Strategy March 2018
P a g e 44 | 64
Some specific private wire opportunities linked to existing energy from waste schemes were also
identified as part of the project, although this also highlighted the scope for regulatory flexes to
make this kind of efficiency easier to achieve.
Figure 23 Private wire opportunities in the Black Country
At a high level, the report also identified the large scale solar potential of the region, which has large
numbers of warehouses and factories with substantial unshaded roof space. It also noted well over
£100M of planning applications had been received for battery storage within the LEP area over the
past two years, probably reflecting financial opportunities arising from national Capacity Markets.
Figure 24 Typical large scale solar opportunity in the Black Country
West Midlands Regional Energy Strategy March 2018
P a g e 45 | 64
Appendix II – Pilot Energy Innovation Zones and Investment Cases
Investment cases for the four proposed pilot energy innovation zones are set out in the separate
Arup report for this project.xc
For reference this appendix provides outline descriptions of the four EIZs (largely) extracted
verbatim from the report of the Regional Energy Policy Commission, March 2018.
The report of the Regional Energy Policy Commissionxci focuses on making the overall case for energy
innovation zones, while the Arup report provides an initial cost-benefit analysis of the specific zones.
The four potential EIZs described below have been proposed by local communities across the West
Midlands and reflect local needs and perceptions of energy system opportunities and challenges.
This is in itself a critically important feature and point of departure for EIZs: that they are driven not
only by climate imperatives and technical opportunities, but also by local market and customer
needs. It immediately makes them distinct to many demonstration and innovation projects in the
energy sector and aligned with the general shift towards more customer-centric approaches.
Each proposed EIZ presents distinctive opportunities for energy-system innovation, and each is at a
different stage of development. This should help the process of generalising from the West Midlands
experience to develop a generic EIZ ‘template’ - meaning an institutional and process model - that
could be rolled out nationally. The philosophy is to be inclusive and offer any community the
opportunity to nominate an area as an EIZ, provided it meets defined criteria such as willingness to
accept innovative low carbon solutions and special regulatory oversight. In this way EIZs should be
seen and designed as a privilege for which areas compete, and a mechanism with potential
significantly to accelerate energy systems transition nationally.
On the other side of the equation, innovators and government will in turn need to accept the
validity, diversity and importance of particular local needs in defining the goals of a given EIZ, even
where these needs may not align exactly with national priorities. In some cases it may be possible to
meet these needs purely through integrating existing technologies in new ways, and require no
fundamental technical or product innovation. Such EIZs may still create new markets and industries
simply by providing scale; in other cases pure process or business model innovation may be
sufficient. All EIZs will accelerate the transition to a low carbon, more competitive energy system in
the UK.
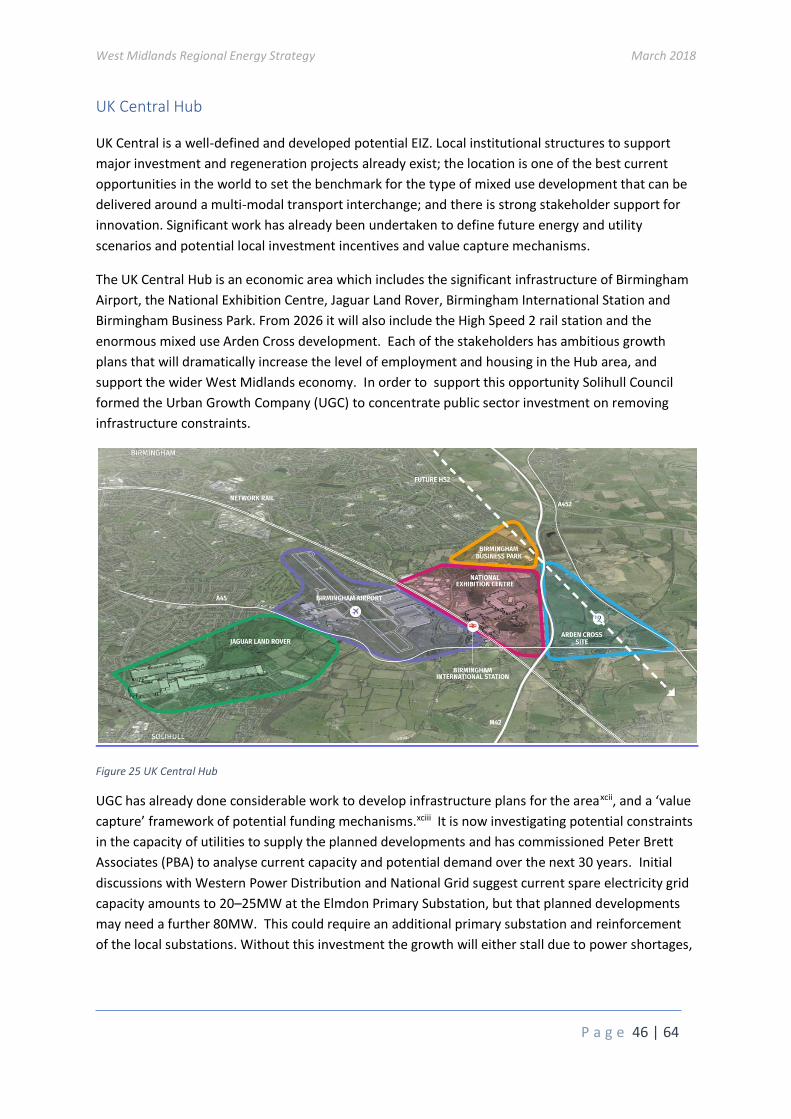
West Midlands Regional Energy Strategy March 2018
P a g e 46 | 64
UK Central Hub
UK Central is a well-defined and developed potential EIZ. Local institutional structures to support
major investment and regeneration projects already exist; the location is one of the best current
opportunities in the world to set the benchmark for the type of mixed use development that can be
delivered around a multi-modal transport interchange; and there is strong stakeholder support for
innovation. Significant work has already been undertaken to define future energy and utility
scenarios and potential local investment incentives and value capture mechanisms.
The UK Central Hub is an economic area which includes the significant infrastructure of Birmingham
Airport, the National Exhibition Centre, Jaguar Land Rover, Birmingham International Station and
Birmingham Business Park. From 2026 it will also include the High Speed 2 rail station and the
enormous mixed use Arden Cross development. Each of the stakeholders has ambitious growth
plans that will dramatically increase the level of employment and housing in the Hub area, and
support the wider West Midlands economy. In order to support this opportunity Solihull Council
formed the Urban Growth Company (UGC) to concentrate public sector investment on removing
infrastructure constraints.
Figure 25 UK Central Hub
UGC has already done considerable work to develop infrastructure plans for the areaxcii, and a ‘value
capture’ framework of potential funding mechanisms.xciii It is now investigating potential constraints
in the capacity of utilities to supply the planned developments and has commissioned Peter Brett
Associates (PBA) to analyse current capacity and potential demand over the next 30 years. Initial
discussions with Western Power Distribution and National Grid suggest current spare electricity grid
capacity amounts to 20–25MW at the Elmdon Primary Substation, but that planned developments
may need a further 80MW. This could require an additional primary substation and reinforcement
of the local substations. Without this investment the growth will either stall due to power shortages,
West Midlands Regional Energy Strategy March 2018
P a g e 47 | 64
or be delivered at a much slower rate, as the developments need to bear the additional costs of
upgrading the electricity network.
Electric vehicles could present an even greater challenge to grid capacity. The Hub currently has
around 40,000 car parking spaces, which could rise to over 60,000 in the next 20 years. High level
estimates procured by UGC suggest that if the Hub installs lots of EV charging points it could require
significant additional grid capacity. This estimate is based on private cars only, and does not include
any allowance for future electric heavy goods vehicles or aircraft.
No one yet knows exactly how much impact the planned development and electric vehicles will have
on electricity demand at the Hub, but it is clear that innovation in supply, control and use must be
encouraged if we are to design a system in the most economic way.
One potential solution might be to find alternative funding mechanisms to build additional
substation capacity ahead of demand and reserve the capacity for Hub members – similar to the
approach of the Ebbsfleet Development Corporation, which is investing £30 million for new
substations to supply the new garden city in Kent.xciv Another would be to create an Energy
Innovation Zone to encourage cheaper and more innovative solutions. The Hub has many energy
intensive users with large peaks and troughs in demand, and it may be possible to avoid or at least
minimise capacity upgrades through innovative approaches.
The Hub also has large heating and cooling loads that could also be integrated with the electricity
grid and wider systems such as waste. The scale and concentration of its electricity and thermal
demand creates a huge opportunity for clean energy innovation and building efficiency that is
probably unmatched in Britain over the next two decades. The Hub has just started a Heat Network
Techno-Economic Feasibility Study, which is due to report later this year.
The Hub is only one of UK Central’s four development zones. The others are North Solihull (Zone 2, a
£1.8bn regeneration programme), Solihull Town Centre (Zone 3, a major retail, office and leisure
destination), and Blythe Valley Park (Zone 4, a business park). Each has its own energy challenges
and priorities. North Solihull, for example, must regenerate large amounts of 1950s/60s housing
stock in Chelmsley Wood, where there are high levels of fuel poverty. Solihull Town Centre has
recently completed a feasibility study that identified a low-carbon heat network opportunity that
would be both technically and economically viable. Blythe Valley has the potential to develop a
hydrogen hub. Each could therefore form its own EIZ, but there may also be a case for creating a
single overarching EIZ to cover all four UK Central development zones.
West Midlands Regional Energy Strategy March 2018
P a g e 48 | 64
Tyseley and Birmingham
Birmingham is also a well-developed potential EIZ, and the context is much more an established and
dense urban environment, so the needs and opportunities are clearly distinct from those at
UKCentral Hub, which is essentially greenfield. There is not yet a dedicated institutional structure
congruent with the potential zone. There is however strong stakeholder and community
engagement; a well-defined and large local market; a portfolio of energy innovation and investment
projects at the Tyseley Energy Park; and 35MW of existing waste-to-energy power plants.
Birmingham city centre will undergo massive redevelopment over the next 15 yearsxcv, particularly
around the HS2 Curzon Street station (£900 million), Smithfield (£600 million), Snow Hill, Typhoo
Wharf and Arena Central. xcvi The area also suffers serious air pollution and the City Council is
developing plans for a Clean Air Zone to start by 2020. This will require the construction of a
substantial clean energy transport refuelling infrastructure including hydrogen and electric vehicle
charging at scale.
There is little space available for vehicle recharging in the city centre. Part of the solution may be to
use the industrial land available at Tyseley, 5km east of the city centre, to produce clean energy for
the city centre and local communities, and power a new clean transport refueling infrastructure.
Tyseley is already the site of the city’s energy-from-waste (EfW) plant, which burns 350,000 tonnes
of waste per year to generate 25MWe. The 16 acre industrial site next door is being developed as
Tyseley Energy Park by its owners, Webster and Horsfall, and partners including the University of
Birmingham, the City Council and the Local Enterprise Partnership.
Tyseley Energy Park already hosts a 10MWe biomass generating plant and private wire electricity
supply, and is also the depot for a growing fleet of rent-by-the-hour electric taxis – most of the city’s
taxi drivers live nearby. A clean energy refueling station is being built to provide EV charging,
hydrogen and CNG for the city’s bus fleet, and for the refuse vehicles that supply the EfW plant.
Future plans include recycling waste heat from the EfW plant through a heat pipe to the Birmingham
District Energy Scheme in the city centre, which is owned and operated by ENGIE. This route would
run through areas of dense housing including many energy poor households. There may also be
synergies with new transport initiatives such as the proposed tram route to the airport, and
refuelling and recharging infrastructure for the city.
Key energy challenges and opportunities for an EIZ based around Tyseley and the City Centre include:
• Integrating energy and transport infrastructure developments at a time of rapid change in both sectors
• Optimising use of the city’s 350,000 tonnes of waste which currently pass through Tyseley annually, ensuring neither waste nor energy market regulation inhibits delivery of sensible outcomes
• Making use of the latest clean technologies already being developed and deployed by the Universities of Birmingham and Aston at Tyseley and elsewhere
• Making best use of the city’s planning powers to optimise the energy performance of new and existing buildings as more than £2 billion of construction investment flows into the city
West Midlands Regional Energy Strategy March 2018
P a g e 49 | 64
• Ensuring the local community is fully engaged in the major changes proposed, and actively contribute to the success of the zone.
The key stakeholder group for this EIZ includes the Birmingham City Council Planning and
Regeneration Team, along with key city centre development stakeholders; ENGIE; the University of
Birmingham; and Webster and Horsfall. The Tyseley Energy Park already falls within the Tyseley Energy
& Environmental Enterprise District, and the Council has decided it will become Birmingham’s Energy
and Waste nexus.
Tyseley Energy Park has the potential to become an innovative demonstrator that integrates energy
vectors including electricity, heat, liquid air, hydrogen. The site will also be home to a University of
Birmingham / Fraunhofer Institute shared research platform and Energy Skills Academy.
Work already completed or ongoing includes:
• Birmingham District Energy Scheme (owned by ENGIE)
• Clean Air Zone / vehicle refueling recharging studies
• Masterplans for the Tyseley site by owners Webster and Horsfall/Energy Capital
• Heat network project at feasibility part 1 stage
• City solar feasibility study completed
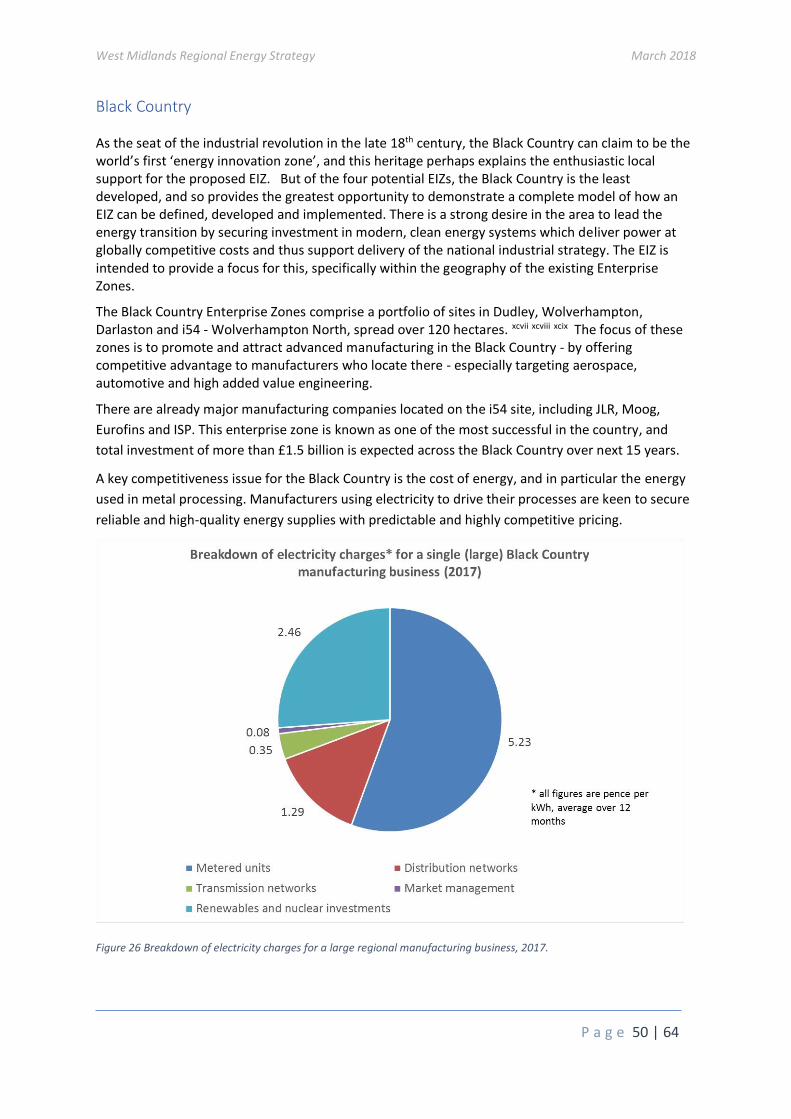
West Midlands Regional Energy Strategy March 2018
P a g e 50 | 64
Black Country
As the seat of the industrial revolution in the late 18th century, the Black Country can claim to be the world’s first ‘energy innovation zone’, and this heritage perhaps explains the enthusiastic local support for the proposed EIZ. But of the four potential EIZs, the Black Country is the least developed, and so provides the greatest opportunity to demonstrate a complete model of how an EIZ can be defined, developed and implemented. There is a strong desire in the area to lead the energy transition by securing investment in modern, clean energy systems which deliver power at globally competitive costs and thus support delivery of the national industrial strategy. The EIZ is intended to provide a focus for this, specifically within the geography of the existing Enterprise Zones.
The Black Country Enterprise Zones comprise a portfolio of sites in Dudley, Wolverhampton, Darlaston and i54 - Wolverhampton North, spread over 120 hectares. xcvii xcviii xcix The focus of these zones is to promote and attract advanced manufacturing in the Black Country - by offering competitive advantage to manufacturers who locate there - especially targeting aerospace, automotive and high added value engineering.
There are already major manufacturing companies located on the i54 site, including JLR, Moog,
Eurofins and ISP. This enterprise zone is known as one of the most successful in the country, and
total investment of more than £1.5 billion is expected across the Black Country over next 15 years.
A key competitiveness issue for the Black Country is the cost of energy, and in particular the energy
used in metal processing. Manufacturers using electricity to drive their processes are keen to secure
reliable and high-quality energy supplies with predictable and highly competitive pricing.
Figure 26 Breakdown of electricity charges for a large regional manufacturing business, 2017.
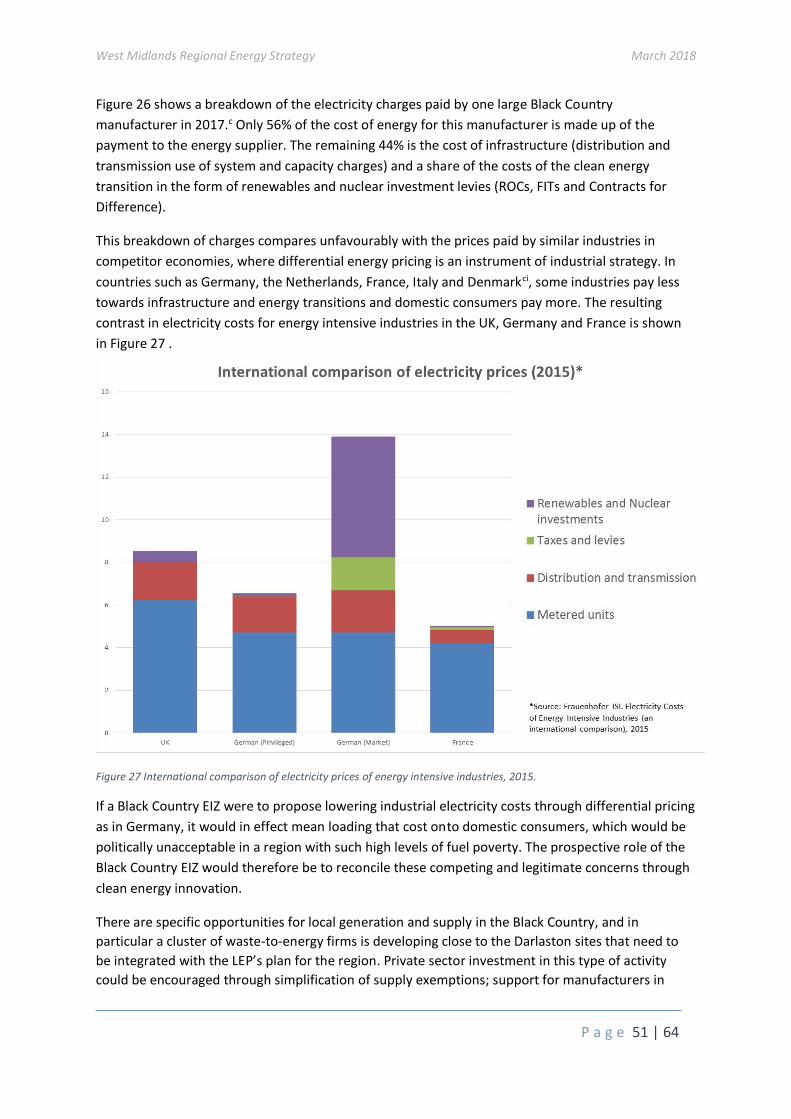
West Midlands Regional Energy Strategy March 2018
P a g e 51 | 64
Figure 26 shows a breakdown of the electricity charges paid by one large Black Country
manufacturer in 2017.c Only 56% of the cost of energy for this manufacturer is made up of the
payment to the energy supplier. The remaining 44% is the cost of infrastructure (distribution and
transmission use of system and capacity charges) and a share of the costs of the clean energy
transition in the form of renewables and nuclear investment levies (ROCs, FITs and Contracts for
Difference).
This breakdown of charges compares unfavourably with the prices paid by similar industries in
competitor economies, where differential energy pricing is an instrument of industrial strategy. In
countries such as Germany, the Netherlands, France, Italy and Denmarkci, some industries pay less
towards infrastructure and energy transitions and domestic consumers pay more. The resulting
contrast in electricity costs for energy intensive industries in the UK, Germany and France is shown
in Figure 27 .
Figure 27 International comparison of electricity prices of energy intensive industries, 2015.
If a Black Country EIZ were to propose lowering industrial electricity costs through differential pricing
as in Germany, it would in effect mean loading that cost onto domestic consumers, which would be
politically unacceptable in a region with such high levels of fuel poverty. The prospective role of the
Black Country EIZ would therefore be to reconcile these competing and legitimate concerns through
clean energy innovation.
There are specific opportunities for local generation and supply in the Black Country, and in
particular a cluster of waste-to-energy firms is developing close to the Darlaston sites that need to
be integrated with the LEP’s plan for the region. Private sector investment in this type of activity
could be encouraged through simplification of supply exemptions; support for manufacturers in

West Midlands Regional Energy Strategy March 2018
P a g e 52 | 64
managing relationships with the DNO; local incentives for energy from waste technologies; and the
public sector taking an active role in matchmaking between potential generators and industrial
energy users. In addition, given the high density of similar small- and medium-sized metal processing
businesses (more than 250 across the region) there is scope for the Black Country to pioneer the
collective use of smart energy data in optimising energy efficiency, for example by subsidising or
mandating installation of smart sub-metering in industry
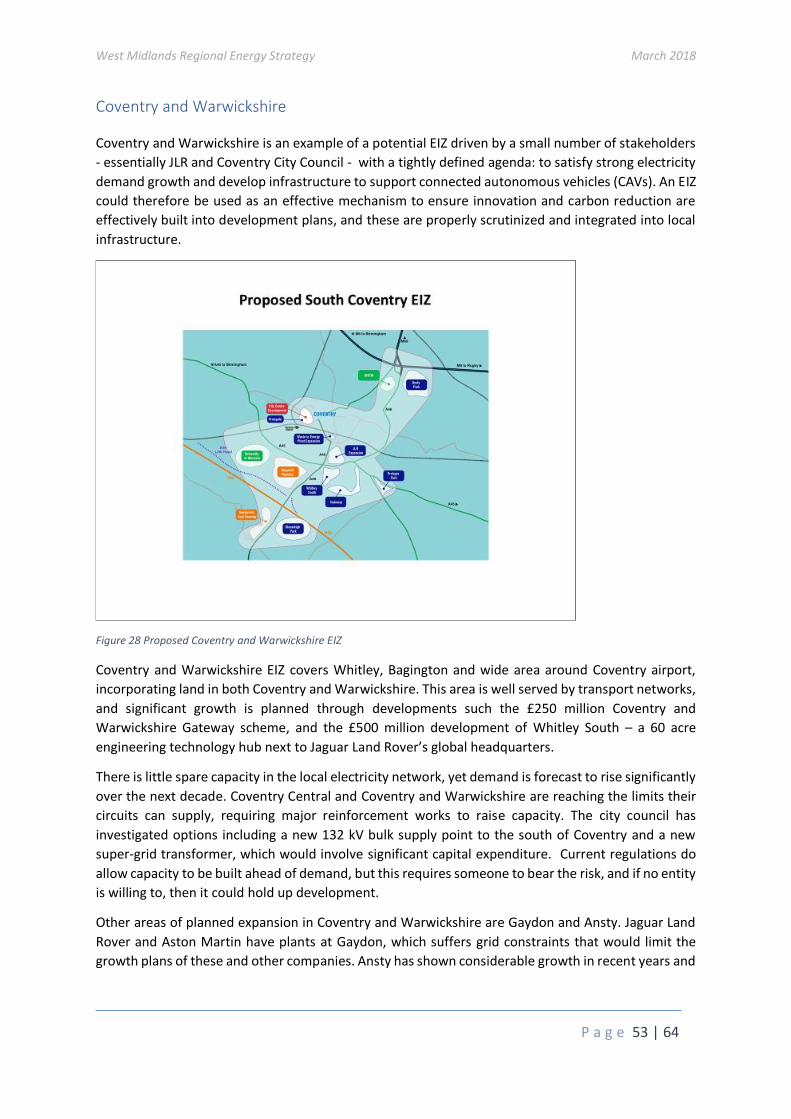
West Midlands Regional Energy Strategy March 2018
P a g e 53 | 64
Coventry and Warwickshire
Coventry and Warwickshire is an example of a potential EIZ driven by a small number of stakeholders
- essentially JLR and Coventry City Council - with a tightly defined agenda: to satisfy strong electricity
demand growth and develop infrastructure to support connected autonomous vehicles (CAVs). An EIZ
could therefore be used as an effective mechanism to ensure innovation and carbon reduction are
effectively built into development plans, and these are properly scrutinized and integrated into local
infrastructure.
Figure 28 Proposed Coventry and Warwickshire EIZ
Coventry and Warwickshire EIZ covers Whitley, Bagington and wide area around Coventry airport,
incorporating land in both Coventry and Warwickshire. This area is well served by transport networks,
and significant growth is planned through developments such the £250 million Coventry and
Warwickshire Gateway scheme, and the £500 million development of Whitley South – a 60 acre
engineering technology hub next to Jaguar Land Rover’s global headquarters.
There is little spare capacity in the local electricity network, yet demand is forecast to rise significantly
over the next decade. Coventry Central and Coventry and Warwickshire are reaching the limits their
circuits can supply, requiring major reinforcement works to raise capacity. The city council has
investigated options including a new 132 kV bulk supply point to the south of Coventry and a new
super-grid transformer, which would involve significant capital expenditure. Current regulations do
allow capacity to be built ahead of demand, but this requires someone to bear the risk, and if no entity
is willing to, then it could hold up development.
Other areas of planned expansion in Coventry and Warwickshire are Gaydon and Ansty. Jaguar Land
Rover and Aston Martin have plants at Gaydon, which suffers grid constraints that would limit the
growth plans of these and other companies. Ansty has shown considerable growth in recent years and

West Midlands Regional Energy Strategy March 2018
P a g e 54 | 64
has potential for large development in the future. Both sites need to ensure adequate power supply
to enable future development.
Like UK Central Hub, these areas of economic growth and grid constraints need to develop timely and
cost effective clean energy solutions, which an EIZ could facilitate.
West Midlands Regional Energy Strategy March 2018
P a g e 55 | 64
Appendix III – Strategy consultation and approval process
This strategy is being published in March 2018.
Feedback and comments are welcome and encouraged and should be sent to:
The deadline for receipt of comments is 5pm on Monday 21 May 2018
Subject to capacity and the level of feedback, the aim will be to publish a response to comments
received in June.
The strategy will be formally submitted to all three LEP Boards and the WMCA at meetings from June
onwards for adoption.
West Midlands Regional Energy Strategy March 2018
P a g e 56 | 64
Appendix IV – Attendees at the stakeholder engagement event
A stakeholder engagement event was held on Tuesday 6 March 2018 at the Energy Systems Catapult
in Birmingham. The event was open and widely publicised and every local authority in the region
was invited directly, along with neighbouring LEPs, all existing Energy Capital partners, regional
universities and members of relevant regional networks.
The following organisations attended and contributed, and their feedback helped shape this report.
Act on Energy
AECOM
Aston University
BEIS
Birmingham City Council
Cadent
City of Wolverhampton Council
Climate KIC
Coventry City Council
Daikin Air Conditioning UK Ltd
Dudley MBC
E.ON UK
Ecuity
EEF Ltd
Energy Systems Catapult
EnergyHarmonics Ltd
Engie UK
Greater Birmingham and Solihull Local Enterprise Partnership
International Synergies Ltd
Lichfield District Council
Manufacturing Technology Centre
MEBC
Midlands Engine
Orsted
Sandwell MBC
Severn Trent
Solihull Council
Solihull MBC
Sustainability West Midlands
Tyseley Energy Park
University of Birmingham
Birmingham Energy Institute
University of Warwick
University of Warwick
WPD
West Midlands Regional Energy Strategy March 2018
P a g e 57 | 64
References
i https://www.westernpower.co.uk/docs/About-us/Our-business/Our-network/Strategic-network-investment/West-Midlands/West-Midlands-scenarios-accompanying-report.aspx ii https://www.wmca.org.uk/media/1713/wmca-economic-review.pdf iii West Midlands Combined Authority Strategic Economic Plan, WMCA, https://www.wmca.org.uk/what-we-do/strategy iv https://www.wmca.org.uk/media/1713/wmca-economic-review.pdf v https://historywm.com/articles/the-west-midlands vi https://oldbike.wordpress.com/7-bicycles-manufactured-in-coventry/ vii http://www.sustainabilitywestmidlands.org.uk/wp-content/uploads/SWM-Energy-Commission-6-10-17.pdf viii A Science & Innovation Audit for the West Midlands, June 2017, WMCA, https://www.wmca.org.uk/media/1682/west-midlands-sia-final-for-publication-21617.pdf ix https://www.google.co.uk/url?sa=t&rct=j&q=&esrc=s&source=web&cd=2&ved=0ahUKEwjihoOu7KzYAhWJLFAKHf9QCBwQFgguMAE&url=https%3A%2F%2Fwww.uktradeinfo.com%2FStatistics%2FRTS%2FRTS%2520Releases%2FRTS_Q2_2017.pdf&usg=AOvVaw25Z1KNSr6vOhlI_4SoCuYL x http://fortune.com/2017/02/09/study-china-will-overtake-the-u-s-as-worlds-largest-economy-before-2030/ xi https://www.ft.com/content/908ba3d0-75da-11e6-b60a-de4532d5ea35 xii A Science & Innovation Audit for the West Midlands, June 2017, WMCA,
https://www.wmca.org.uk/media/1682/west-midlands-sia-final-for-publication-21617.pdf
xiii https://www.birmingham.gov.uk/info/50065/population_and_census/1003/population_in_birmingham/1 xiv A Science & Innovation Audit for the West Midlands, June 2017, WMCA, https://www.wmca.org.uk/media/1682/west-midlands-sia-final-for-publication-21617.pdf xv This data is sourced from BEIS, DECC, the Digest of UK Energy Statistics, The Office of National Statistics and OFGEM. GVA figures are from a SIC code analysis by Charlie Hopkirk for BCLEP. xvi Helm, Cost of Energy Review, BEIS 2017 xvii ibid xviii Source: Actual bills of a metal processing business, November 2017, obtained for this project. xix Frauenhofer ISI and Ecofys, Electricity Costs of Energy Intensive Industries, An international comparison, 2015 xx See, for example, file:///C:/Users/User/Downloads/Reducing-Energy-Policy-Costs_UK-Steel-Guide-to-Compensation-and-Exemptions-for-the-Steel-Sector%20(2).pdf; xxi Helm, Cost of Energy Review, BEIS 2017 xxii This data is mostly from government sources, primarily UK Energy Investment, DECC, 2014. xxiii https://www.citb.co.uk/documents/research/csn_reports_2018-2022/2018csn_wm_summary_050218.pdf xxiv WMCA Productivity and Skills Commission, Sector Outline (Charlie Hopkirk) xxv Warwick Institute for Employment Research, https://warwick.ac.uk/fac/soc/ier/ngrf/lmifuturetrends/sectorscovered/energy/regional/west-midlands/ xxvi Energy and Utility Skills, 2018. http://www.euskills.co.uk/2018/02/09/skills-strategy-impacts-energy-utilities-sector-ahead-first-anniversary/ xxvii West Midlands Science and Innovation Audit, 2017. https://www.wmca.org.uk/media/1682/west-midlands-sia-final-for-publication-21617.pdf xxviii Sustainability Challenges in the West Midlands, Sustainability West Midlands, December 2010, http://www.sustainabilitywestmidlands.org.uk/wp-content/uploads/Sustainability-Challenges-in-the-West-Midlands.pdf xxix http://www.who.int/mediacentre/news/releases/2014/air-pollution/en/ xxx Valuing impacts on air quality: Updates in valuing changes in emissions of Oxides of Nitrogen (NOX) and concentrations of Nitrogen Dioxide (NO2) , Defra, September 2015, https://www.gov.uk/government/uploads/system/uploads/attachment_data/file/460401/air-quality-econanalysis-nitrogen-interim-guidance.pdf
West Midlands Regional Energy Strategy March 2018
P a g e 58 | 64
xxxi https://www.gov.uk/government/news/improving-air-quality-in-cities xxxii Energy as an Enabler, Linkages between Regional Energy Strategy, Productivity and Growth, March 2018. xxxiii Business cases for Energy Innovation Zones in the West Midlands, Arup, March 2018 xxxiv https://www.wmca.org.uk/media/1713/wmca-economic-review.pdf xxxv Based on National Grid Future Energy Scenarios – low estimates are ‘two degrees’ and ‘slow progression’ scenarios; higher estimates are ‘steady state’ and ‘consumer power’ scenarios. xxxvi The 8TWh figure is obtained by taking 7% of the projected national increase in energy demand according to National Grid. The 7% figure is from Western Power and is the 2017 share of national electricity demand from the West Midlands. xxxvii https://www.westernpower.co.uk/docs/About-us/Our-business/Our-network/Strategic-network-investment/West-Midlands/West-Midlands-scenarios-accompanying-report.aspx xxxviii http://www.billhelp.uk/west-midlands-hit-hard-fuel-poverty/; https://www.gov.uk/government/uploads/system/uploads/attachment_data/file/533056/Fuel_poverty_Sub-regional_report_2016.pdf xxxix
https://www.gov.uk/government/uploads/system/uploads/attachment_data/file/533056/Fuel_poverty_Sub-regional_report_2016.pdf xl https://www.westernpower.co.uk/docs/About-us/Our-business/Our-network/Strategic-network-
investment/West-Midlands/West-Midlands-scenarios-accompanying-report.aspx. Note that this report covers the West Midlands as defined by WPD, which excludes Coventry and includes large parts of the Marches and areas to the South West which have never been in any government definition of the West Midlands, such as Gloucestershire. However, having said this the net effect in terms of gross housing investment figures and associated demand (for example) is negligible, as the total planned new housing is around 200,000 homes for either geographical definition. In other words, the net economic activity covered by the report is very similar, and the major economic hubs of Birmingham, the Black Country and UK Central and Solihull are common to both regional definitions. xli https://www.nationalgrid.com/uk/publications/future-energy-scenarios-fes xlii https://www.birmingham.ac.uk/Documents/college-eps/energy/Publications/Fuel-Cell-and-Hydrogen-
brochure.pdf xliii An initial trial of 20 buses was approved in October 2017 by Birmingham City council. xliv Dieter Helm, Cost of Energy Review, BEIS, 2017. xlv International Renewable Energy Agency, 2016 xlvi Digitization and Energy, IEA, 2017. http://www.iea.org/digital/ xlvii Global Infrastructure Outlook, Oxford Economics, 2017. Also
http://www.worldbank.org/en/news/feature/2014/09/24/new-report-identifies-major-clean-tech-market-opportunity-for-small-businesses-in-developing-countries; https://www.mckinsey.com/industries/electric-power-and-natural-gas/our-insights/energy-infrastructure-seizing-the-opportunity-in-growth-markets; https://www.businessgreen.com/bg/news/3021679/bnef-global-energy-storage-market-to-double-six-times-by-2030; xlviii Powering West Midlands Growth: A Regional Approach to Clean Energy Innovation, An Energy Capital
Policy Commission, Chaired by Prof. Sir David King, March 2018 xlix See for example: https://www.nao.org.uk/wp-content/uploads/2017/03/Capability-in-the-civil-service.pdf;
https://www.instituteforgovernment.org.uk/sites/default/files/publications/20130621%20-%20Capabilities%20Discussion%20Paper%20-%20final.pdf l http://www.globalenergyblog.com/failure-of-competition-in-retail-energy-markets-disengaged-customers-
still-the-root-cause li See http://www.scmp.com/business/companies/article/2051139/driving-innovation-lessons-integration-teslas-elon-musk lii https://publications.parliament.uk/pa/cm201213/cmselect/cmsctech/348/34805.htm liii http://www.imperial.ac.uk/media/imperial-college/research-centres-and-groups/icept/Innovation-review---ICEPT-working-paper-version-(16.05.12).pdf liv For more detail, see https://www.wmca.org.uk/who-we-are/structure
West Midlands Regional Energy Strategy March 2018
P a g e 59 | 64
lv https://www.bdo.co.uk/en-gb/news/2017/number-of-manufacturers-in-west-midlands-grows lvi https://www.regulation.org.uk/specifics-energy-history1.html lvii https://uk.reuters.com/article/uk-britain-energy-ofgem/uk-energy-price-cap-could-be-in-place-by-christmas-2018-idUKKBN1EZ159 lviii https://ore.exeter.ac.uk/repository/bitstream/handle/10871/28455/Governance%20of%20industry%20rules%20and%20%20energy%20system%20innovation.pdf?sequence=1 lix Dieter Helm, Cost of Energy Review, BEIS, 2017. lx http://projects.exeter.ac.uk/igov/new-thinking-ofgem-has-to-be-reformed-if-gb-is-to-meet-its-energy-policy-goals/ lxi Powering West Midlands Growth: A Regional Approach to Clean Energy Innovation, An Energy Capital Policy Commission, Chaired by Prof. Sir David King, March 2018 lxii This figure is based on the report by Arup, Business Cases for Energy Innovation Zones in the West Midlands, March 2018. lxiii https://www.gov.uk/government/uploads/system/uploads/attachment_data/file/639118/Fuel_Poverty_Statistics_Report_2017_revised_August.pdf lxiv https://www.theccc.org.uk/publication/2017-report-to-parliament-meeting-carbon-budgets-closing-the-policy-gap/ lxv https://www.blackcountrylep.co.uk/upload/files/NewFolder/Energy%20as%20an%20Enabler.pdf lxvi Business cases for Energy Innovation Zones in the West Midlands, Arup, March 2018 lxvii UK automotive turnover (SMMT, 2015). The figure of £32bn is calculated from UK sales only (£37.3bn p.a
multiplied by 7.3% as the WM share of the national economy, to give £2.72bn new car sales per year in the
region.) lxviii Powering West Midlands Growth: A Regional Approach to Clean Energy Innovation, An Energy Capital Policy Commission, Chaired by Prof. Sir David King, March 2018 lxix Business cases for Energy Innovation Zones in the West Midlands, Arup, March 2018 lxx https://www.blackcountrylep.co.uk/upload/files/NewFolder/Energy%20as%20an%20Enabler.pdf lxxi http://bioenergy-for-business.org/ lxxii https://www.birmingham.ac.uk/Documents/partners/ERDF-marketing-FINAL-for-web.pdf lxxiii http://www.climate-kic.org/news/west-midlands-energy-climate-innovation-cluster/ lxxiv Powering West Midlands Growth: A Regional Approach to Clean Energy Innovation, An Energy Capital Policy Commission, Chaired by Prof. Sir David King, March 2018 lxxv SEP stands for Strategic Economic Plan or Industrial Strategy Board lxxvi MIPIM is a major global property investment conference, where the East and West Midlands have successfully exhibited together for several years. lxxvii Arup, Aecom lxxviii Powering West Midlands Growth: A Regional Approach to Clean Energy Innovation, An Energy Capital Policy Commission, Chaired by Prof. Sir David King, March 2018 lxxix http://www.energiesprong.uk/ lxxx https://our-power.co.uk/ lxxxi Energy as an Enabler, Linkages between Regional Energy Strategy, Productivity and Growth, March 2018. lxxxii Powering West Midlands Growth: A Regional Approach to Clean Energy Innovation, An Energy Capital Policy Commission, Chaired by Prof. Sir David King, March 2018 lxxxiii https://www.swm.de/dam/swm/dokumente/english/swm-annual-report-2016.pdf lxxxiv Powering West Midlands Growth: A Regional Approach to Clean Energy Innovation, An Energy Capital Policy Commission, Chaired by Prof. Sir David King, March 2018 lxxxv Business cases for Energy Innovation Zones in the West Midlands, Arup, March 2018 lxxxvi Energy as an Enabler, Linkages between Regional Energy Strategy, Productivity and Growth, March 2018 lxxxvii Powering Growth – A Black Country Energy Strategy, Aecom, February 2018 lxxxviii http://www.wolverhampton.gov.uk/CHttpHandler.ashx?id=1567&p=0 lxxxix Powering Growth – A Black Country Energy Strategy, Aecom, February 2018 xc Business cases for Energy Innovation Zones in the West Midlands, Arup, March 2018

West Midlands Regional Energy Strategy March 2018
P a g e 60 | 64
xci Powering West Midlands Growth: A Regional Approach to Clean Energy Innovation, An Energy Capital Policy
Commission, Chaired by Prof. Sir David King, March 2018 xcii http://www.ugcsolihull.uk/publications/ xciii http://www.ugcsolihull.uk/wp-content/uploads/2017/09/170919-Value-Capture-Framework.pdf xciv http://ebbsfleetdc.org.uk/2017/07/27/future-of-electricity-supplied-to-ebbsfleet-garden-city-has-been-secured-in-a-ground-breaking-30million-deal/ xcv https://bigcityplan.birmingham.gov.uk/ xcvi https://www.birmingham.gov.uk/downloads/download/155/birmingham_curzon_hs2_masterplan_for_growth xcvii http://www.investblackcountry.com/investment-opportunities/industrial/gasholders/ xcviii http://www.investblackcountry.com/investment-opportunities/industrial/i54/ xcix http://www.investblackcountry.com/investment-opportunities/industrial/phoenix-10/ c Actual figures, calendar year 2017, for a large metalworking business. ci Electricity Costs of Energy Intensive Industries, An international comparison, Ecofys and Frauenhofer ISI, 2015.