Embed Size (px)
Citation preview
A Relaxation-CompensatedCarr -Purcell-Meiboom-Gill Sequence forCharacterizing Chemical Exchange by NMRSpectroscopy
J. Patrick Loria,† Mark Rance,*,‡ and Arthur G. Palmer III*,†
Department of Biochemistry and Molecular BiophysicsColumbia UniVersity, New York, New York 10032
Department of Molecular GeneticsBiochemistry, and Microbiology
UniVersity of Cincinnati, Cincinnati, Ohio 45267
ReceiVed NoVember 17, 1998ReVised Manuscript ReceiVed February 3, 1999
Functions of biological macromolecules, including enzymecatalysis, allostery, and ligand recognition, in some circumstancescan be rate-limited by dynamic processes that couple nonproduc-tive and productive conformations.1,2 Delineating the amplitudes,rates, and mechanisms of these motions is necessary to explicatebiological function.3-5 This paper describes a modified proton-detected15N Carr-Purcell-Meiboom-Gill 6,7 (CPMG) spin-echopulse sequence that overcomes the disadvantages associated withpulsing rates comparable to the one-bondJNH scalar couplingconstant. The new experiment permits measurement of chemicalor conformational exchange time constants from approximately0.5 to 5 ms. This range of time scales fills an important gapbetween microsecond time scales that are accessible by the off-resonance rotating-frame experiment8,9 and millisecond time scalesthat are accessible by thezz-exchange experiment.10-12
Conformational or chemical kinetic processes that transfer anuclear spin between sites with different magnetic environmentscontribute to the adiabatic decay of transverse magnetization. Thephenomenological transverse relaxation rate constant measuredin a CPMG experiment,R2(τcp), is given by:
in which τcp is the delay between pulses in the spin-echo pulsetrain; Rin andRanti are the transverse relaxation rate constants forin-phase and antiphase coherences averaged over the populationsof each chemical or conformational state, respectively; 0e ε e1 reflects the averaging between in-phase and antiphase coher-ences due to evolution under the scalar coupling Hamiltonianduring τcp;13-15 andRex is the rate constant for damping due to
exchange between sites. For two exchanging sites16
in whichΦex ) (ω1 - ω2)2p1p2; andpi andωi are the populationsand Larmor frequencies for the nuclear spin in sitei; andτex isthe reduced lifetime of the exchanging sites.
In principle, exchange kinetics can be determined by fittingeqs 1 and 2 toR2(τcp) data obtained for different values ofτcp;however, bothε andRex depend onτcp, which renders the analysisintractable. This difficulty is circumvented ifτcp is limited to smallvalues (<1/(4JNH)), becauseε ≈ 1.17 In this case, only fastexchange processes can be studied, and the resulting high radiofrequency duty cycle poses a significant drawback compared withthe off-resonance rotating-frame experiment.8,9 Broadband protondecoupling duringτcp prevents evolution of in-phase into antiphasemagnetization and makesε ) 1; however, decoupling interfereswith spin-echo formation and accentuates the decay of transversemagnetization.14,15,18 In the approach adopted herein, the rateconstants for in-phase and antiphase coherences are averagedexplicitly during the CPMG sequence to renderε ) 0.5 for allτcp. Application of the experiment to basic pancreatic trypsininhibitor (BPTI) confirms the effectiveness of the proposedaveraging procedure for values ofτcp as large as 2/JNH.
The modified CPMG pulse sequence is shown in Figure 1. Atpoint a, the density operator is proportional to 2IzSy (I ) 1H andS ) 15N spin operators). Between points a and b, the relaxationof the density operator is described by eq 1 withε ) εab ) 0.5[1 - sinc[πJNHτcp)].14 The periodU converts antiphase 2IzSy
coherence to in-phaseSx coherence at point c, and the1H 90°pulse at the end ofU purges any residual antiphase magnetization.Between points c and d, the relaxation of the density operator isdescribed by eq 1 withε ) εcd ) 0.5 [1 + sinc[πJNHτcp)]. The1H 180° pulses midway between points a and b and between pointsc and d suppress CSA/dipolar relaxation interference.14,15The time
* Address correspondence to: A.G.P. E-mail: [email protected]: (212) 305-8675. Fax: (212) 305-7932. M.R. E-mail: [email protected]. Telephone: (513) 558-0066. Fax: (513) 558-8474.
† Columbia University.‡ University of Cincinnati.(1) Frauenfelder, H.; Sligar, S. G.; Wolynes, P. G.Science1991, 254,
1598-1603.(2) Karplus, M.; McCammon, J. A.Annu. ReV. Biochem.1983, 53, 263-
300.(3) Williams, J. C.; McDermott, A. E.Biochemistry1995, 34, 8309-8319.(4) Kay, L. E.Nat. Struct. Biol.1998, 5, 513-517.(5) Palmer, A. G.Curr. Opin. Struct. Biol.1997, 7, 732-737.(6) Carr, H. Y.; Purcell, E. M.Phys. ReV. 1954, 94, 630-638.(7) Meiboom, S.; Gill, D.ReV. Sci. Instrum.1958, 29, 688-691.(8) Akke, M.; Palmer, A. G.J. Am. Chem. Soc.1996, 118, 911-912.(9) Zinn-Justin, S.; Berthault, P.; Guenneugues, M.; Desvaux, H.J. Biomol.
NMR 1997, 10, 363-372.(10) Montelione, G. T.; Wagner, GJ. Am. Chem. Soc.1989, 111, 3096-
3098.(11) Wider, G.; Neri, D.; Wu¨thrich, K. J. Biomol. NMR1991, 1, 93-98.(12) Farrow, N.; Zhang, O.; Forman-Kay, J. D.; Kay, L. E.J. Biomol. NMR
1994, 4, 727-734.(13) Gutowsky, H. S.; Vold, R. L.; Wells, E. J.J. Chem. Phys.1965, 43,
4107-4125.(14) Palmer, A. G.; Skelton, N. J.; Chazin, W. J.; Wright, P. E.; Rance,
M. Mol. Phys.1992, 75, 699-711.
(15) Kay, L. E.; Nicholson, L. K.; Delaglio, F.; Bax, A.; Torchia, D. A.J.Magn. Reson.1992, 97, 359-375.
(16) Allerhand, A.; Thiele, E.J. Chem. Phys.1966, 45, 902-916.(17) Orekhov, V. Y.; Pervushin, K. V.; Arseniev, A. S.Eur. J. Biochem.
1994, 219, 887-896.(18) Shaka, A. J.; Keeler, J.Prog. Nucl. Magn. Reson. Spectrosc.1987,
19, 47-129.
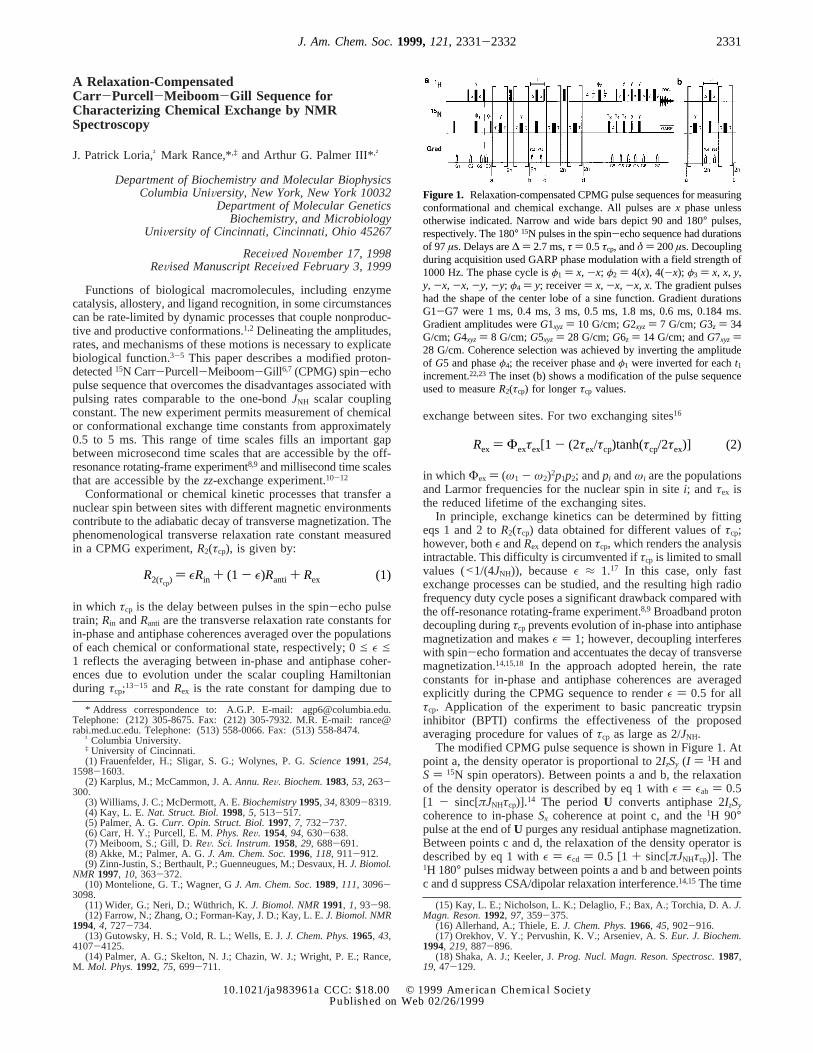
Figure 1. Relaxation-compensated CPMG pulse sequences for measuringconformational and chemical exchange. All pulses arex phase unlessotherwise indicated. Narrow and wide bars depict 90 and 180° pulses,respectively. The 180° 15N pulses in the spin-echo sequence had durationsof 97µs. Delays are∆ ) 2.7 ms,τ ) 0.5τcp, andδ ) 200µs. Decouplingduring acquisition used GARP phase modulation with a field strength of1000 Hz. The phase cycle isφ1 ) x, -x; φ2 ) 4(x), 4(-x); φ3 ) x, x, y,y, -x, -x, -y, -y; φ4 ) y; receiver) x, -x, -x, x. The gradient pulseshad the shape of the center lobe of a sine function. Gradient durationsG1-G7 were 1 ms, 0.4 ms, 3 ms, 0.5 ms, 1.8 ms, 0.6 ms, 0.184 ms.Gradient amplitudes wereG1xyz ) 10 G/cm;G2xyz ) 7 G/cm;G3z ) 34G/cm;G4xyz ) 8 G/cm;G5xyz ) 28 G/cm;G6z ) 14 G/cm; andG7xyz )28 G/cm. Coherence selection was achieved by inverting the amplitudeof G5 and phaseφ4; the receiver phase andφ1 were inverted for eacht1increment.22,23 The inset (b) shows a modification of the pulse sequenceused to measureR2(τcp) for longerτcp values.
Rex ) Φexτex[1 - (2τex/τcp)tanh(τcp/2τex)] (2)
R2(τcp)) εRin + (1 - ε)Ranti + Rex (1)
2331J. Am. Chem. Soc.1999,121,2331-2332
10.1021/ja983961a CCC: $18.00 © 1999 American Chemical SocietyPublished on Web 02/26/1999
decay of the magnitude of the density operator between points aand d is given by
in which ng 0 is an integer,Rh ) 0.5 (Rin + Ranti), and the transferefficiency ofU is incorporated intoI0. Thus, the effectiveR2(τcp)) Rh + Rex. After point d, the magnetization is frequency labeledduring t1 and transferred to theI spins for detection. Themodification of the pulse sequence shown in Figure 1b reducesthe minimum increment between time points from 8τcp to 4τcp,which facilitates measurements using longτcp values. In thissequence,U serves the dual role of interchanging in-phase andantiphase magnetization and suppressing CSA/dipolar interfer-ence; however, the suppression is not as efficient as in Figure1a.
The relaxation-compensated CPMG experiment was performedon a 2.6 mM [U-98%15N] BPTI sample at 300 K;19 otherexperimental conditions are given in the caption to Figure 2. Thedifferences betweenR2(τcp) measured atτcp values of 10.0 and1.0 ms for BPTI are presented in Figure 2. No significantdifferences in relaxation rate constants are observed for themajority of the backbone15N spins, which confirms the robustnessof the averaging procedures incorporated into the pulse sequences.Differences between the two experiments are observed for residuesin the vicinity of C14 and C38. The relaxation dispersion curvesfor residues C14, Q31, C38, R39 are shown in Figure 3. ResidueQ31 is typical of those residues in BPTI that do not exhibitτcp-dependent dispersion and are not subject to conformationalexchange. Q31 has a mean value ofR2(τcp) ) Rh ) 7.4 ( 0.2 s-1
which agrees withRh ≈ 7.2 s-1 estimated for a rotationalcorrelation time of 3 ns. A pronounced dependence ofR2(τcp) onτcp is observed for C38 and C39; smaller amplitude dispersionwas observed for residues A16, G36, G37, and A40. The resultsfor Rh, Φex, andτex obtained from theR2(τcp) data are given inTable 1. C14 has an average value ofR2(τcp) ) 10.6( 0.3 s-1,which is greater than expected forRh, but does not exhibit anydependence onτcp; similar results are obtained for K15. Thus,these residues are subject to conformational exchange on timescales<0.5 ms that are not accessible to the present technique.
Isomerization of the disulfide bond between C14 and C38 atthe active site of BPTI provides at least one mechanism forconformational exchange.20,21The values ofτex reported in Table1 for C38 and R39 are in excellent agreement with exchange ratesdetermined using an on-resonance rotating frame experiment;20
however, the precision of the present results is approximately 10-fold greater. Results for other spins have not been reportedpreviously. The range of exchange time constants observed varyfrom <0.5 ms for C14 and K15 to 4.52 ms for A16. These resultssuggest that the conformational exchange process is not a simpletwo-state disulfide isomerization. Either the time dependence ofthe exchange process is not well-described by a single-exponentialcorrelation function, or multiple dynamic processes give rise toexchange effects.
In conclusion, the modified CPMG experiment compensatesfor evolution between in-phase and antiphase transverse coher-ences during the spin-echo pulse train and thereby allowsquantitative measurement of conformational exchange processeson 0.5 to 5 ms time scales. Together with the off-resonancerotating frame8,9 and zz-exchange experiments,10-12 the newtechnique enables kinetic processes over biologically significanttime scales from 10-5 s to 10-1 s to be investigated inmacromolecules.
Acknowledgment. We thank Christopher D. Kroenke (ColumbiaUniversity) for providing scripts for analyzing relaxation data and W.Clay Bracken (Columbia University) for helpful discussions. This workwas supported by NIH grants GM19247 (J.P.L.), GM40089 (M.R.), andGM59273 (A.G.P.).
Supporting Information Available: Relaxation rate constants forall τcp delays and dispersion curves for residues A16, G36, G37, andA40 are available (PDF). This material is available free of charge viathe Internet at http://pubs.acs.org.
JA983961A
(19) Huang, K.; Andrec, M.; Heald, S.; Blake, P.; Prestegard, J. H.J.Biomol. NMR1997, 10, 45-52.
(20) Szyperski, T.; Luginbu¨hl, P.; Otting, G.; Gu¨ntert, P.; Wu¨thrich, K. J.Biomol. NMR1993, 3, 151-164.
(21) Otting, G.; Liepinsh, E.; Wu¨thrich, K. Biochemistry1993, 32, 3571-3582.
(22) Palmer, A. G.; Cavanagh, J.; Wright, P. E.; Rance, M.J. Magn. Reson.1991, 93, 151-170.
(23) Kay, L. E.; Keifer, P.; Saarinen, T.J. Am. Chem. Soc.1992, 114,10663-10665.
(24) Mosteller, F.; Tukey, J. W.Data Analysis and Regression. A SecondCourse in Statistics; Addison-Wesley: Reading, MA, 1977.
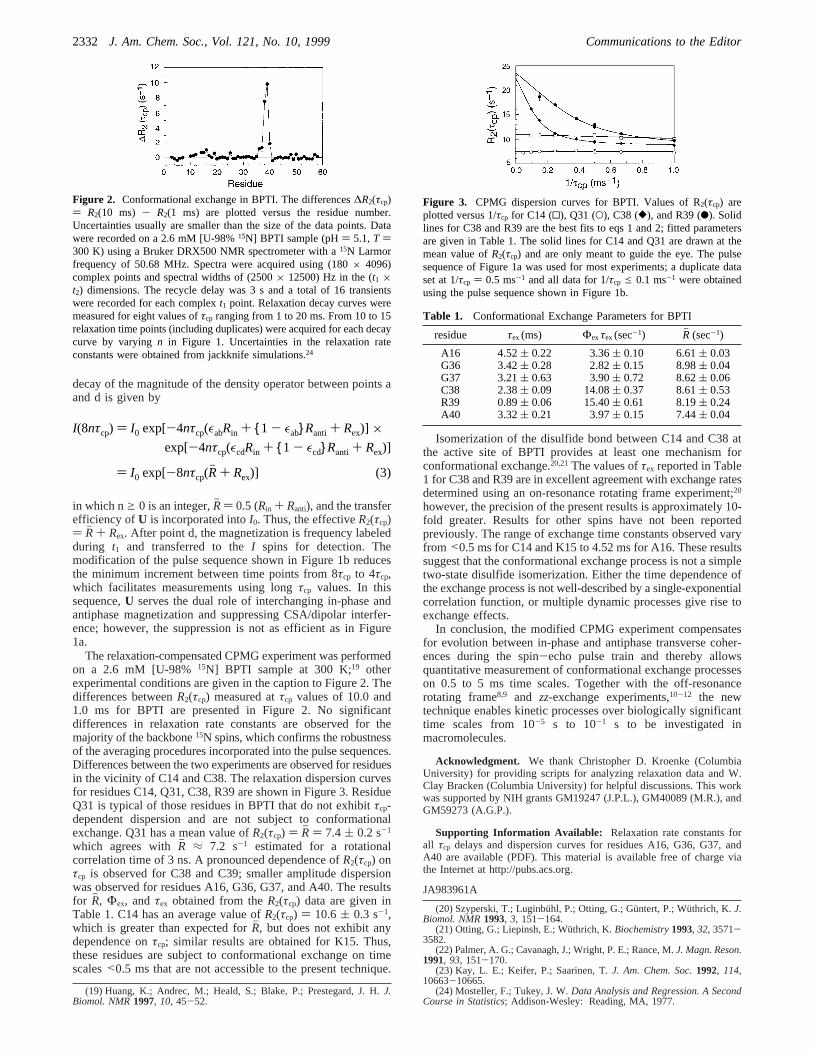
Figure 2. Conformational exchange in BPTI. The differences∆R2(τcp)) R2(10 ms) - R2(1 ms) are plotted versus the residue number.Uncertainties usually are smaller than the size of the data points. Datawere recorded on a 2.6 mM [U-98%15N] BPTI sample (pH) 5.1,T )300 K) using a Bruker DRX500 NMR spectrometer with a15N Larmorfrequency of 50.68 MHz. Spectra were acquired using (180× 4096)complex points and spectral widths of (2500× 12500) Hz in the (t1 ×t2) dimensions. The recycle delay was 3 s and a total of 16 transientswere recorded for each complext1 point. Relaxation decay curves weremeasured for eight values ofτcp ranging from 1 to 20 ms. From 10 to 15relaxation time points (including duplicates) were acquired for each decaycurve by varyingn in Figure 1. Uncertainties in the relaxation rateconstants were obtained from jackknife simulations.24
I(8nτcp) ) I0 exp[-4nτcp(εabRin + {1 - εab}Ranti + Rex)] ×exp[-4nτcp(εcdRin + {1 - εcd}Ranti + Rex)]
) I0 exp[-8nτcp(Rh + Rex)] (3)
Figure 3. CPMG dispersion curves for BPTI. Values of R2(τcp) areplotted versus 1/τcp for C14 (0), Q31 (O), C38 ([), and R39 (b). Solidlines for C38 and R39 are the best fits to eqs 1 and 2; fitted parametersare given in Table 1. The solid lines for C14 and Q31 are drawn at themean value ofR2(τcp) and are only meant to guide the eye. The pulsesequence of Figure 1a was used for most experiments; a duplicate dataset at 1/τcp ) 0.5 ms-1 and all data for 1/τcp e 0.1 ms-1 were obtainedusing the pulse sequence shown in Figure 1b.
Table 1. Conformational Exchange Parameters for BPTI
residue τex(ms) Φexτex(sec-1) Rh (sec-1)
A16 4.52( 0.22 3.36( 0.10 6.61( 0.03G36 3.42( 0.28 2.82( 0.15 8.98( 0.04G37 3.21( 0.63 3.90( 0.72 8.62( 0.06C38 2.38( 0.09 14.08( 0.37 8.61( 0.53R39 0.89( 0.06 15.40( 0.61 8.19( 0.24A40 3.32( 0.21 3.97( 0.15 7.44( 0.04
2332 J. Am. Chem. Soc., Vol. 121, No. 10, 1999 Communications to the Editor