Embed Size (px)
Citation preview
A REMPI and ZEKE spectroscopic study of thetrans-formanilide �Ar van der Waals cluster
Susanne Ullrich, Gy€oorgy Tarczay, Xin Tong, Mark S. Ford, CarolineE.H. Dessent, Klaus M€uuller-Dethlefs *
Department of Chemistry, University of York, Heslington, York, YO10 5DD, UK
Received 17 September 2001; in final form 14 November 2001
Abstract
Resonance enhanced multiphoton ionization (REMPI) and zero electron kinetic energy (ZEKE) spectra have been
obtained for the trans-formanilide �Ar (t-FA �Ar) cluster. The spectra indicate that the argon atom binds above thearomatic ring to form a C1 symmetry, van der Waals (vdW) complex. The bx; by and sz intermolecular vibrationalmodes are observed at 4, 10 and 18 cm�1 in the S1 state, and 8, 26 and 36 cm
�1 in the D0 state. We compare the t-
FA �Ar spectra with those of other aromatic molecule–argon complexes to probe the electronic structure of FA in theS1 and D0 states. � 2002 Published by Elsevier Science B.V.
1. Introduction
There is currently little spectroscopic informa-tion available on the cationic states of amides [1,2],despite the fact that these states are involved inlong-range charge-transfer in polypeptides [3,4].We have recently employed zero electron kineticenergy (ZEKE) photoelectron spectroscopy toformanilide (FA), a model peptide, with the aim ofobtaining basic spectroscopic information to ad-dress geometric structure, ionization energies, andcis- or trans-conformational preference in the FAcation [5,6]. One of the questions that must be ad-dressed when a model system is used to deduce in-
formation on related molecules is how closely themodel represents the related molecules. In thiscontext, it is important to explore the extent towhich the p-electrons of the FA aromatic ring aredelocalized into the amide side chain and vice versa.In this Letter, we present resonance enhanced
multiphoton ionization (REMPI) and ZEKEspectra [7,8] of the trans-formanilide �Ar (t-FA �Ar) complex, where the argon solvent atom isused as a probe of the electronic structure of the FAsolute. By analogy with other aromatic molecule–argon complexes [9–20], t-FA �Ar is expected toadopt a van der Waals (vdW) structure where theargon atom binds above the aromatic ring (Fig. 1).The REMPI and ZEKE spectra of t-FA �Ar shouldtherefore reflect electronic changes occurring in thearomatic ring in the vicinity of the Ar atom uponS1 S0 excitation and ionization. We compare the
4 January 2002
Chemical Physics Letters 351 (2002) 121–127
www.elsevier.com/locate/cplett
* Corresponding author. Fax: +44-1904-434527.
E-mail address: [email protected] (K. M€uuller-Dethlefs).
0009-2614/02/$ - see front matter � 2002 Published by Elsevier Science B.V.
PII: S0009-2614 (01 )01368-9
spectra of t-FA �Ar with those of other aromaticmolecule–argon complexes [9,11–19], to investigateelectron-delocalization between the side chain andthe aromatic chromophore in FA [21].In addition to the primary goals of this study
described above, t-FA �Ar may represent a usefulsystem for further investigating the spectroscopyof the t-FA monomer. Observation of a00 out-of-plane modes (e.g. torsional modes) in unsolvated t-FA, is hampered by the fact that the isomer adoptsplanar, Cs symmetry conformations in the S0, S1and D0 states [6,22,23] so that single-quanta a
00
excitation is formally forbidden [24]. The REMPIand ZEKE spectra of t-FA �Ar may, however,display single-quanta a00 vibrational excitationsince complexation of t-FA with an argon atom isexpected to lead to formation of a C1 symmetryvdW complex (Fig. 1). In addition, the inclusion ofthe Ar atom may produce an ionization-inducedgeometry change out of the aromatic plane, andhence improve the Franck–Condon factors (FCFs)for a00 vibrational excitation.
2. Experimental
The experimental setup has been described indetail elsewhere [23] and will be discussed onlybriefly here. FA �Ar clusters were produced in asupersonic jet expansion of FA vapor seeded in anargon/neon mixture (5% argon) from a heatedreservoir (140 �C). The reservoir was located im-mediately behind the pulsed nozzle (general valve,
0.8 mm). Laser wavelengths were calibrated bysimultaneously recording iodine spectra with allquoted laser photon energies having been con-verted from air to vacuum. The pulse sequences,timings and field strengths used to obtain thespectra are identical to those in [25].
3. Results and discussions
3.1. REMPI spectroscopy of t-FA � Ar
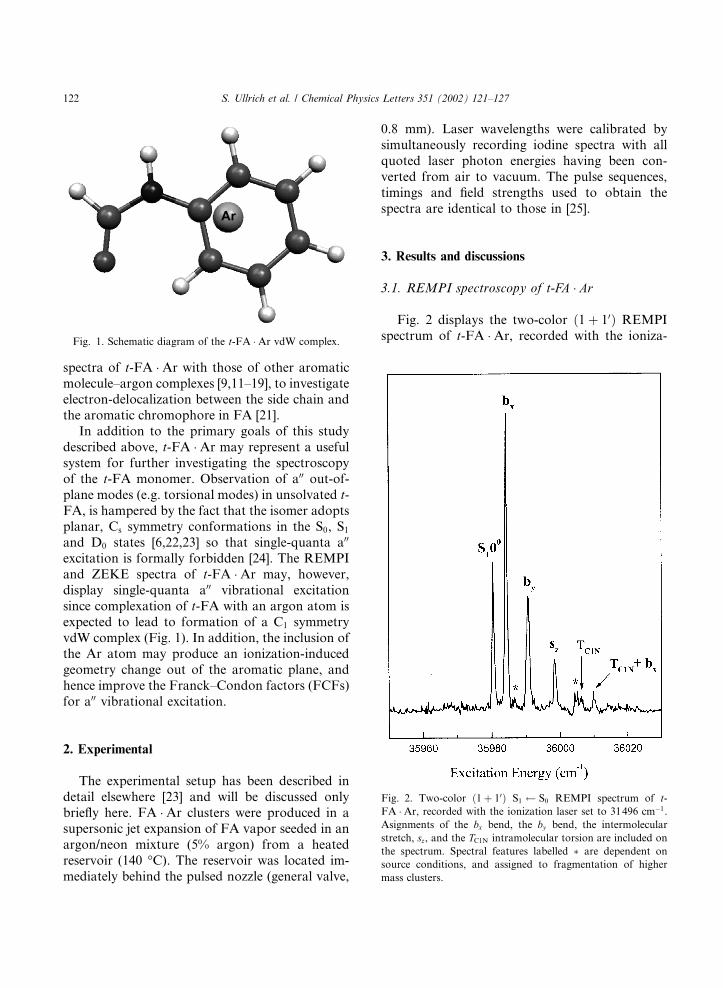
Fig. 2 displays the two-color ð1þ 10Þ REMPIspectrum of t-FA �Ar, recorded with the ioniza-Fig. 1. Schematic diagram of the t-FA �Ar vdW complex.
Fig. 2. Two-color ð1þ 10Þ S1 S0 REMPI spectrum of t-
FA �Ar, recorded with the ionization laser set to 31496 cm�1.Asignments of the bx bend, the by bend, the intermolecularstretch, sz, and the TC1N intramolecular torsion are included onthe spectrum. Spectral features labelled � are dependent onsource conditions, and assigned to fragmentation of higher
mass clusters.
122 S. Ullrich et al. / Chemical Physics Letters 351 (2002) 121–127
tion laser set to 31496 cm�1. The S100 origin of the
complex appears at 35980:0 0:2 cm�1, whichrepresents a 24 cm�1 red-shift compared to the t-FA monomer [5,6]. This red-shift is similar tothose of other aromatic molecule–Ar complexes[9,11–17] which have been shown to adopt vdWstructures, and indicates that a similar structureoccurs in t-FA �Ar. A higher-resolution REMPIspectrum of the S10
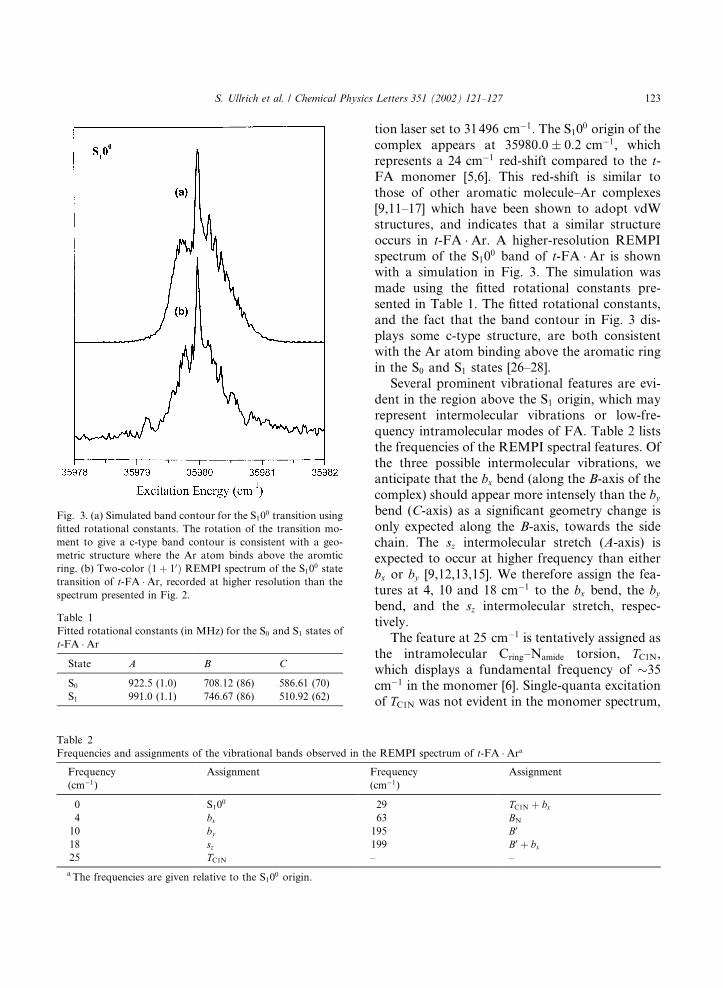
0 band of t-FA �Ar is shownwith a simulation in Fig. 3. The simulation wasmade using the fitted rotational constants pre-sented in Table 1. The fitted rotational constants,and the fact that the band contour in Fig. 3 dis-plays some c-type structure, are both consistentwith the Ar atom binding above the aromatic ringin the S0 and S1 states [26–28].Several prominent vibrational features are evi-
dent in the region above the S1 origin, which mayrepresent intermolecular vibrations or low-fre-quency intramolecular modes of FA. Table 2 liststhe frequencies of the REMPI spectral features. Ofthe three possible intermolecular vibrations, weanticipate that the bx bend (along the B-axis of thecomplex) should appear more intensely than the bybend (C-axis) as a significant geometry change isonly expected along the B-axis, towards the sidechain. The sz intermolecular stretch (A-axis) isexpected to occur at higher frequency than eitherbx or by [9,12,13,15]. We therefore assign the fea-tures at 4, 10 and 18 cm�1 to the bx bend, the bybend, and the sz intermolecular stretch, respec-tively.The feature at 25 cm�1 is tentatively assigned as
the intramolecular Cring–Namide torsion, TC1N,which displays a fundamental frequency of 35cm�1 in the monomer [6]. Single-quanta excitationof TC1N was not evident in the monomer spectrum,
Fig. 3. (a) Simulated band contour for the S100 transition using
fitted rotational constants. The rotation of the transition mo-
ment to give a c-type band contour is consistent with a geo-
metric structure where the Ar atom binds above the aromtic
ring. (b) Two-color ð1þ 10Þ REMPI spectrum of the S100 statetransition of t-FA �Ar, recorded at higher resolution than thespectrum presented in Fig. 2.
Table 1
Fitted rotational constants (in MHz) for the S0 and S1 states of
t-FA �Ar
State A B C
S0 922.5 (1.0) 708.12 (86) 586.61 (70)
S1 991.0 (1.1) 746.67 (86) 510.92 (62)
Table 2
Frequencies and assignments of the vibrational bands observed in the REMPI spectrum of t-FA �Ara
Frequency Assignment Frequency Assignment
(cm�1) (cm�1)
0 S100 29 TC1N þ bx
4 bx 63 BN10 by 195 B0
18 sz 199 B0 þ bx25 TC1N – –
aThe frequencies are given relative to the S100 origin.
S. Ullrich et al. / Chemical Physics Letters 351 (2002) 121–127 123
but appears in the spectrum of the complex due tothe relaxation of symmetry. The intramolecularbending mode centered on the nitrogen atom, BN[6] was observed at 63 cm�1. An additional featureat 195 cm�1 (not displayed in Fig. 2 to enhance thepresentation of the origin region) is assigned to thein-plane side-arm bend, B0, which is found at196 cm�1 in the monomer [6]. No additional fea-tures were observed scanning as far as36400 cm�1, and there appears to be no prominentexcitation of the amide torsion upon S1 S0 ex-citation.The bx bend is the dominant spectral feature in
the t-FA �Ar REMPI spectrum; this contrastswith those of other aromatic molecule–argoncomplexes, such as fluorobenzene �Ar [9] andphenol �Ar [15] where the origin transitions dom-inate the spectra. Thus, the t-FA �Ar REMPIspectrum indicates a relatively large geometrychange for the vdW complex compared with sim-ilar argon complexes; this maximizes the FCFs forthe S1bx S00
0 transition. The geometry changecan be attributed to a considerable shift ofp-electron density towards the Cring–Namide bondwithin the monomer upon excitation, thus signifi-cantly changing the potential experienced by theargon atom. Complimentary information with re-spect to changes in electron density is presented ina study of t-FA �H2O [29]. We note that despitethe strength of the S1bx S00
0 transition, no bxovertones are evident. The prominent excitation ofthe by bend also reflects the substantial change inelectron-delocalization within the side chain uponexcitation.It is notable that the frequencies of the inter-
molecular modes observed in the t-FA �Ar RE-MPI spectrum are considerably lower than incomparable systems [9,12,13,15]. For example, thebx and sz vibrations appear at 4 and 18 cm�1, re-spectively, in the S1 state of t-FA �Ar while thecorresponding frequencies in the S1 state spectrumof the phenol �Ar complex are 20 and 45 cm�1[15]. The low frequency intermolecular vibrationsof t-FA �Ar reflect the comparatively weak inter-molecular bond, which can be attributed to theincreased conjugation of the aromatic p-electronsinto the amide side chain in the S1 excited state.This counterbalances the increase in p-electron
polarizability that generally accompanies S1 S0excitation, so that the strength of the aromatic–argon bond is reduced overall. The bx frequency isparticularly low, an indication that substantialelectron density is located along the Cring–Namidebond, softening the S1 state potential along thiscoordinate.
3.2. ZEKE spectroscopy of t-FA � Ar
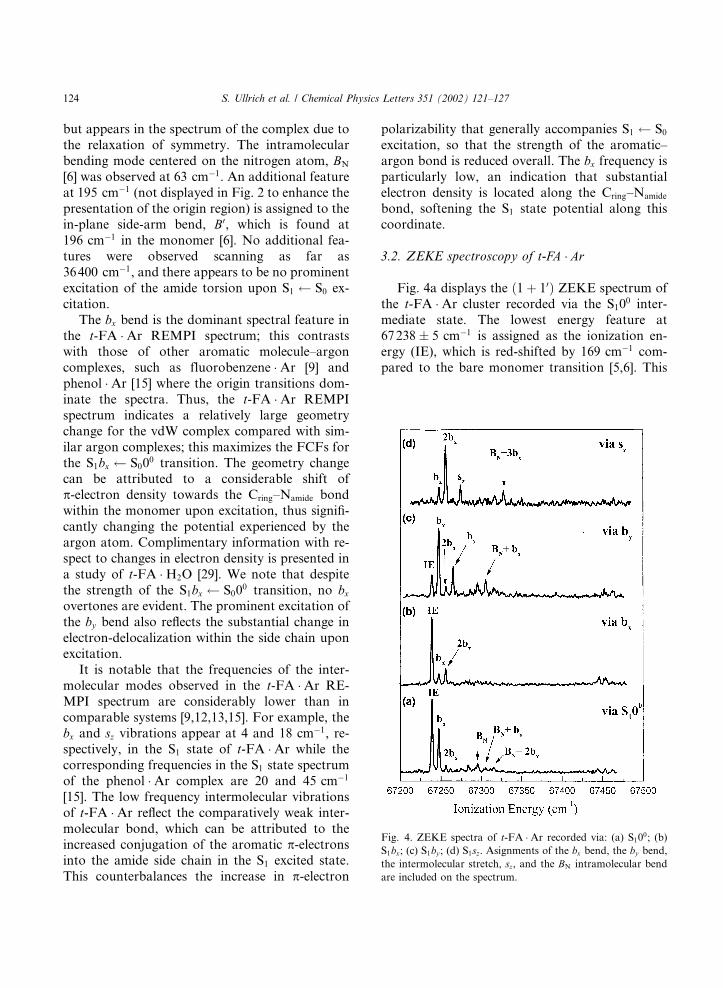
Fig. 4a displays the ð1þ 10Þ ZEKE spectrum ofthe t-FA �Ar cluster recorded via the S100 inter-mediate state. The lowest energy feature at67238 5 cm�1 is assigned as the ionization en-ergy (IE), which is red-shifted by 169 cm�1 com-pared to the bare monomer transition [5,6]. This
Fig. 4. ZEKE spectra of t-FA �Ar recorded via: (a) S100; (b)S1bx; (c) S1by ; (d) S1sz. Asignments of the bx bend, the by bend,the intermolecular stretch, sz, and the BN intramolecular bendare included on the spectrum.
124 S. Ullrich et al. / Chemical Physics Letters 351 (2002) 121–127
IE red-shift is comparable to those of other aro-matic molecule–Ar complexes [9,11,14–18] in linewith a cationic vdW structure. While this geo-metric structure is clearly a local minimum for t-FA �Ar, it may not represent the minimum energyD0 state structure. The ZEKE spectrum ofphenol �Arþ similarly revealed the existence of anabove ring complex [15] although the global min-imum was subsequently shown to correspond to ahydrogen-bonded structure [30].The IE feature is the most intense band in the t-
FA �Ar ZEKE spectrum recorded via the S100
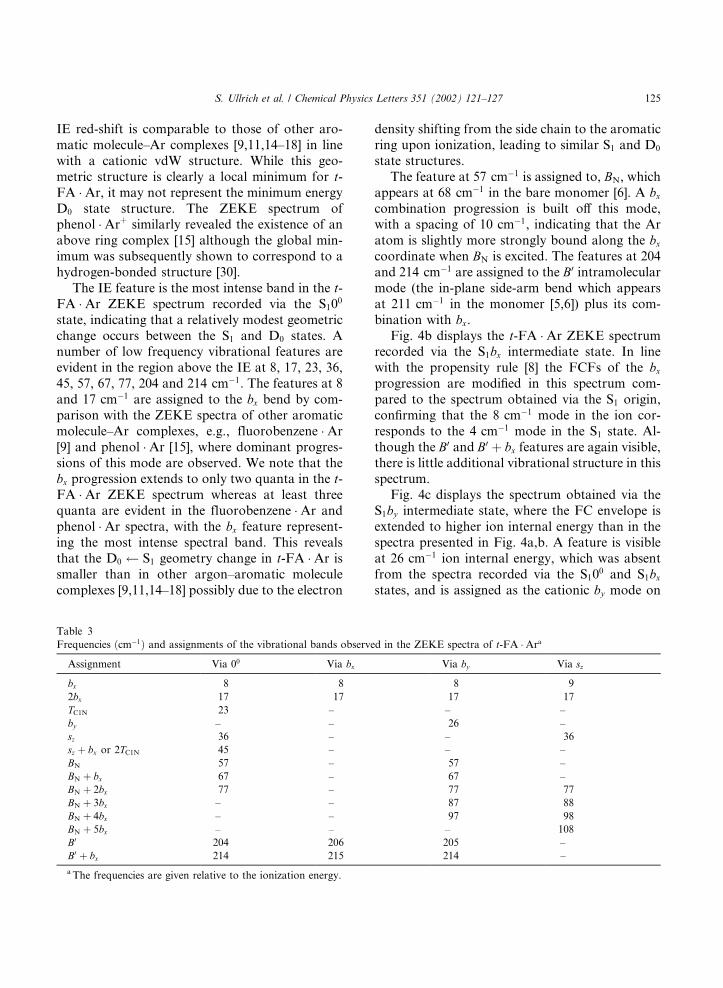
state, indicating that a relatively modest geometricchange occurs between the S1 and D0 states. Anumber of low frequency vibrational features areevident in the region above the IE at 8, 17, 23, 36,45, 57, 67, 77, 204 and 214 cm�1. The features at 8and 17 cm�1 are assigned to the bx bend by com-parison with the ZEKE spectra of other aromaticmolecule–Ar complexes, e.g., fluorobenzene �Ar[9] and phenol �Ar [15], where dominant progres-sions of this mode are observed. We note that thebx progression extends to only two quanta in the t-FA �Ar ZEKE spectrum whereas at least threequanta are evident in the fluorobenzene �Ar andphenol �Ar spectra, with the bx feature represent-ing the most intense spectral band. This revealsthat the D0 S1 geometry change in t-FA �Ar issmaller than in other argon–aromatic moleculecomplexes [9,11,14–18] possibly due to the electron
density shifting from the side chain to the aromaticring upon ionization, leading to similar S1 and D0state structures.The feature at 57 cm�1 is assigned to, BN, which
appears at 68 cm�1 in the bare monomer [6]. A bxcombination progression is built off this mode,with a spacing of 10 cm�1, indicating that the Aratom is slightly more strongly bound along the bxcoordinate when BN is excited. The features at 204and 214 cm�1 are assigned to the B0 intramolecularmode (the in-plane side-arm bend which appearsat 211 cm�1 in the monomer [5,6]) plus its com-bination with bx.Fig. 4b displays the t-FA �Ar ZEKE spectrum
recorded via the S1bx intermediate state. In linewith the propensity rule [8] the FCFs of the bxprogression are modified in this spectrum com-pared to the spectrum obtained via the S1 origin,confirming that the 8 cm�1 mode in the ion cor-responds to the 4 cm�1 mode in the S1 state. Al-though the B0 and B0 þ bx features are again visible,there is little additional vibrational structure in thisspectrum.Fig. 4c displays the spectrum obtained via the
S1by intermediate state, where the FC envelope isextended to higher ion internal energy than in thespectra presented in Fig. 4a,b. A feature is visibleat 26 cm�1 ion internal energy, which was absentfrom the spectra recorded via the S10
0 and S1bxstates, and is assigned as the cationic by mode on
Table 3
Frequencies ðcm�1Þ and assignments of the vibrational bands observed in the ZEKE spectra of t-FA �Ara
Assignment Via 00 Via bx Via by Via sz
bx 8 8 8 9
2bx 17 17 17 17
TC1N 23 – – –
by – – 26 –
sz 36 – – 36
sz þ bx or 2TC1N 45 – – –
BN 57 – 57 –
BN þ bx 67 – 67 –
BN þ 2bx 77 – 77 77
BN þ 3bx – – 87 88
BN þ 4bx – – 97 98
BN þ 5bx – – – 108
B0 204 206 205 –
B0 þ bx 214 215 214 –
aThe frequencies are given relative to the ionization energy.
S. Ullrich et al. / Chemical Physics Letters 351 (2002) 121–127 125
the basis of the propensity rule. The absence of theby vibration in the spectrum recorded via the S100
state indicates that there is little change in theelectronic structure of t-FA along the by coordi-nate upon ionization.Finally, the spectrum recorded via the S1sz in-
termediate state is presented in Fig. 4d. The spec-tral feature at 36 cm�1, is not prominent in theother ZEKE spectra, and is assigned to the sz in-termolecular stretch. This pattern reflects the onefound in the phenol �Ar ZEKE spectra where sz isonly clearly observed in the ZEKE spectrum re-corded via the S1sz state [15]. In the spectrum re-corded via S10
0, the feature at 36 cm�1 ion internalenergy can now also be assigned to sz, suggestingthat the feature at 45 cm�1 represents the sz þ bxcombination. This assignment seems unlikely,however, given that the 45 cm�1 feature is moreintense than the sz band. Alternatively, the45 cm�1 feature could represent two quanta exci-tation of the rather weak feature found at 23 cm�1,which is tentatively assigned to TC1N ð33 cm�1 inthe monomer [6]). The spectral features observedin the ZEKE spectra of t-FA �Ar are listed inTable 3 with suggested assignments.It is of interest to compare the frequencies of
the intermolecular modes observed in the t-FA �Ar ZEKE spectra to those of other aromaticmolecule–Ar complexes. In the D0 states ofphenol �Ar and fluorobenzene �Ar, the bx, vibra-tions appear at 15 and 20 cm�1, respectively, whilethe sz vibrations appear at 66 and 43 cm�1, indi-cating that the argon atom in t-FA �Ar is com-paratively more weakly bound. This is a directreflection of the delocalization of electron densityfrom the amide side chain to the aromatic ring inthe cation [21] in line with the results of ab initiocalculations of FAþ [6].
4. Summary
The REMPI and ZEKE spectra of t-FA �Arreveal that the bx, by and sz intermolecular vibra-tions occur at 4, 10 and 18 cm�1, respectively, inthe S1 state and at 8, 26, 36 cm
�1, in the D0 state.The increased frequencies of these modes in the D0state reflects the strengthening of the intermolec-
ular bond that occurs due to the additional charge-induced dipole interaction in t-FA �Arþ. In gen-eral, the intermolecular modes in both the S1 andD0 states display lower frequencies than in otheraromatic molecule–Ar complexes. This effect isinterpreted in terms of increased conjugation ofthe p-electrons with the amide side chain, and toexcess charge delocalization into the side chain inthe cation reducing the charge-induced dipole in-teraction. In turn, this implies that the side chainpossess some cationic character in the D0 state oft-FA making t-FAþ a useful model system forstudying the properties of cationic amides. The Aratom in the FA �Ar complex studied here pri-marily probes the FA solute in the vicinity of itsbinding site, the aromatic ring. However, the studyof other molecular complexes, such as FA �H2O[29] can provide information on the electronicstructure of the amide side chain of FA.
Acknowledgements
We thank the EPSRC for financial support(Chemistry GR/L27770) of this work. S.U. ac-knowledges support from the Fonds des Verban-des der Chemischen Industrie and a DAADDoktorandenstipendium. G.T. thanks the Hun-garian Ministry of Education for a E€ootv€oos Schol-arship, and the Peregrinatio II Foundation forfurther support. C.E.H.D. thanks the Royal So-ciety for support from a University Research Fel-lowship.
References
[1] V.V. Zverev, Izv. Akad. Nauk SSR, Ser. Kim. 3 (1992) 602.
[2] E.G. Robertson, M.R. Hockridge, P.D. Jeffs, J.P. Simons,
Phys. Chem. Chem. Phys. 3 (2001) 786.
[3] E.W. Schlag, S.Y. Sheu, D.Y. Yang, H.L. Selzle, S.H. Lin,
Proc. Natl. Acad. Sci. 97 (2000) 1068.
[4] S.Y. Sheu, E.W. Schlag, D.Y. Yang, H.L. Selzle, J. Phys.
Chem. A 105 (2001) 6353.
[5] S. Ullrich, G. Tarczay, X. Tong, C.E.H. Dessent, K.
M€uuller-Dethlefs, Ang. Chemie. Int. Ed. (in press).[6] S. Ullrich, G. Tarczay, X. Tong, C.E.H. Dessent, K.
M€uuller-Dethlefs, Phys. Chem. Chem. Phys. (in press).
[7] C.E.H. Dessent, K. M€uuller-Dethlefs, Chem. Rev. 100
(2000) 3999.
126 S. Ullrich et al. / Chemical Physics Letters 351 (2002) 121–127
[8] K. M€uuller-Dethlefs, E.W. Schlag, Ang. Chem. Int. Ed. 37
(1998) 1346.
[9] G. Lembach, B. Brutschy, J. Chem. Phys. 107 (1997) 6156.
[10] H. Krause, H.J. Neusser, Chem. Rev. 94 (1994) 1829.
[11] K. Kimura, J. Electron Spectrosc. 108 (2000) 31, and
references therein.
[12] E.J. Bieske, M.W. Rainbird, I.M. Atkinson, A.E.W.
Knight, J. Chem. Phys. 91 (1989) 752.
[13] M. Mons, J.L. Calve, F. Piuzzi, I. Dimicoli, J. Chem. Phys.
92 (1990) 2155.
[14] X. Zhang, J.L. Knee, Faraday Discuss. 97 (1994) 299.
[15] S.R. Haines, C.E.H. Dessent, K. M€uuller-Dethlefs, J.
Electron Spectrosc. Rel. Phenom. 108 (2000) 1.
[16] C.E.H. Dessent, S.R. Haines, K. M€uuller-Dethlefs, Chem.Phys. Lett. 315 (1999) 103.
[17] L.A. Chewter, K. M€uuller-Dethlefs, E.W. Schlag, Chem.
Phys. Lett. 135 (1987) 219.
[18] M.C.R. Cockett, K. Kimura, J. Chem. Phys. 100 (1994)
3429.
[19] D. Bahatt, A. Heidenreich, N. Benhorin, U. Even, J.
Jortner, J. Chem. Phys. 100 (1994) 6290.
[20] H. Piest, G. Von Helden, G. Maier, J. Chem. Phys. 111
(1999) 10750.
[21] M.D. Patey, C.E.H. Dessent, J. Phys. Chem. A. (submit-
ted).
[22] J.A. Dickinson, M.R. Hockridge, E.G. Robertson, J.P.
Simons, J. Phys. Chem. A 103 (1999) 6938.
[23] E.G. Robertson, Chem. Phys. Lett. 325 (2000) 299.
[24] P.R. Bunker, P. Jensen, Molecular Symmetry and Spec-
troscopy, second ed., NRC, Ottawa, 1998.
[25] S.R. Haines, W.D. Geppert, D.M. Chapman, M. Watkins,
C.E.H. Dessent, M.C.R. Cockett, K. M€uuller-Dethlefs, J.
Chem. Phys. 109 (1998) 9249.
[26] M.S. Ford, S.R. Haines, I. Pugliesi, C.E.H. Dessent, K.
M€uuller-Dethlefs, J. Electron Spectrosc. Rel. Phenom. 112
(2000) 231.
[27] A. Bacon, J.M. Hollas, Faraday Discuss. Chem. Soc. 86
(1988) 129.
[28] B.D. Howells, J. McCombie, T.F. Palmer, J.P. Simons,
A. Walters, J. Chem. Soc. Faraday Trans 88 (1992)
2603.
[29] S. Ullrich, G. Tarczay, X. Tong, C.E.H. Dessent, K.
M€uuller-Dethlefs, Phys. Chem. Chem. Phys. (in prepara-
tion).
[30] N. Scola, O. Dopfer, J. Mol. Struct. 563 (2001)
241.
S. Ullrich et al. / Chemical Physics Letters 351 (2002) 121–127 127