Embed Size (px)
Citation preview
1
A Report on a Survey of New Zealanders’ Use of Smartphones and other Mobile Communication Devices 2015
Level 7, 45 Johnston St, PO Box 10 617, Wellington, New Zealand P 04 499 3088 F 04 499 3414 E [email protected] W www.researchnz.com
2015 Research New Zealand
2
Preface
First introduced in the 1980’s, the mobile phone has evolved rapidly in terms of its physical
appearance and technical specifications. Unlike today’s smartphones, the first-generation mobile
phone (or “brick”) was very cumbersome, very expensive and not very popular.
Today, mobile phones are used to talk, text, play games, take photos, watch television, play music,
shop, exchange emails, do banking, monitor fitness levels, wake you up in the mornings, connect
you to social media, Skype someone on the other side of the world, give you GPS instructions so
you don’t get lost… the uses are virtually endless. Reflecting this, demand for the latest smartphones
is higher than ever.
With predicted global sales of 1.4 billion smartphones in 2015, smartphone penetration is expected
to increase from a base of 1.8 billion in 2014 to 2.2 billion in 2015. Further, Deloitte predicts that of
the 1.4 billion smartphones sold in 2015, 1 billion will be purchased as upgrades, a volume
unparalleled among consumer electronics devices and greater in units (and revenue) than the PC,
television, tablet and games console sectors combined.1
“The smartphone is the most personal of consumer electronics devices: the most constant
companion, the most personal of choices, the most customised and reflective of the
owners, the least likely to be shared with other users and the most frequently looked at.”
Source: Deloitte; Technology, Media and Telecommunications Predictions, 2014.
1 Technology, Media & Telecommunications Predictions 2014, Deloitte.
3
Introduction
Research New Zealand first conducted the Survey of New Zealanders’ Use of Smartphones and other Mobile Communication Devices in 2013, and focused on the ownership and use of laptops, tablets, PC’s smartphones and other mobile phones (feature phones). This survey was repeated in 2014 and in 2015 to keep abreast of the pace of change and to continue monitoring emerging trends. This report focuses on the results of the 2015 survey.
Key findings and trends
There are four key findings and trends:
1. Almost three-quarters (72 percent) of all adult New Zealanders now own or have access to a
laptop or notebook for their private use (up from 66 percent in 2013). Also making a significant
impact on the device market are tablets and iPads (51 percent, up from 29 percent in 2013).
However, at 70 percent penetration (up from 48 percent in 2013), smartphones are fast
becoming the nation’s most popular device. This is a 46 percent increase in three years.
2. Reflecting the lifecycle of the market, approximately two-thirds of all adult New Zealanders now
own or have access to three or more devices (64 percent).
3. With this in mind, a clear preference is emerging in favour of smartphones, with 59 percent of
those with a smartphone and at least one other device, preferring their smartphone. This
appears to be at the expense of laptops and notebooks.
4. In fact, with the exception of smartphones, the daily use of all other devices is trending
downwards.
4
Detailed findings
Almost three of every four New Zealanders have a laptop/notebook and/or a smartphone
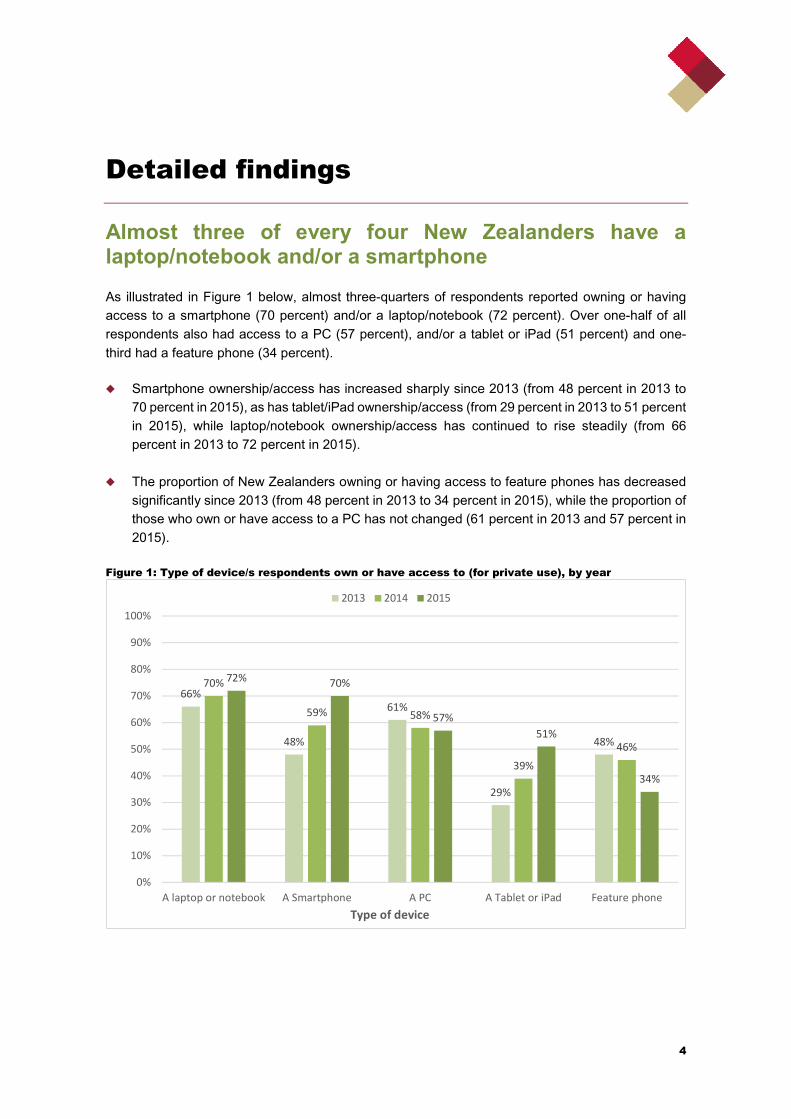
As illustrated in Figure 1 below, almost three-quarters of respondents reported owning or having
access to a smartphone (70 percent) and/or a laptop/notebook (72 percent). Over one-half of all
respondents also had access to a PC (57 percent), and/or a tablet or iPad (51 percent) and one-
third had a feature phone (34 percent).
� Smartphone ownership/access has increased sharply since 2013 (from 48 percent in 2013 to
70 percent in 2015), as has tablet/iPad ownership/access (from 29 percent in 2013 to 51 percent
in 2015), while laptop/notebook ownership/access has continued to rise steadily (from 66
percent in 2013 to 72 percent in 2015).
� The proportion of New Zealanders owning or having access to feature phones has decreased
significantly since 2013 (from 48 percent in 2013 to 34 percent in 2015), while the proportion of
those who own or have access to a PC has not changed (61 percent in 2013 and 57 percent in
2015).
Figure 1: Type of device/s respondents own or have access to (for private use), by year
66%
48%
61%
29%
48%
70%
59% 58%
39%
46%
72% 70%
57%
51%
34%
0%
10%
20%
30%
40%
50%
60%
70%
80%
90%
100%
A laptop or notebook A Smartphone A PC A Tablet or iPad Feature phone
Type of device
2013 2014 2015
5
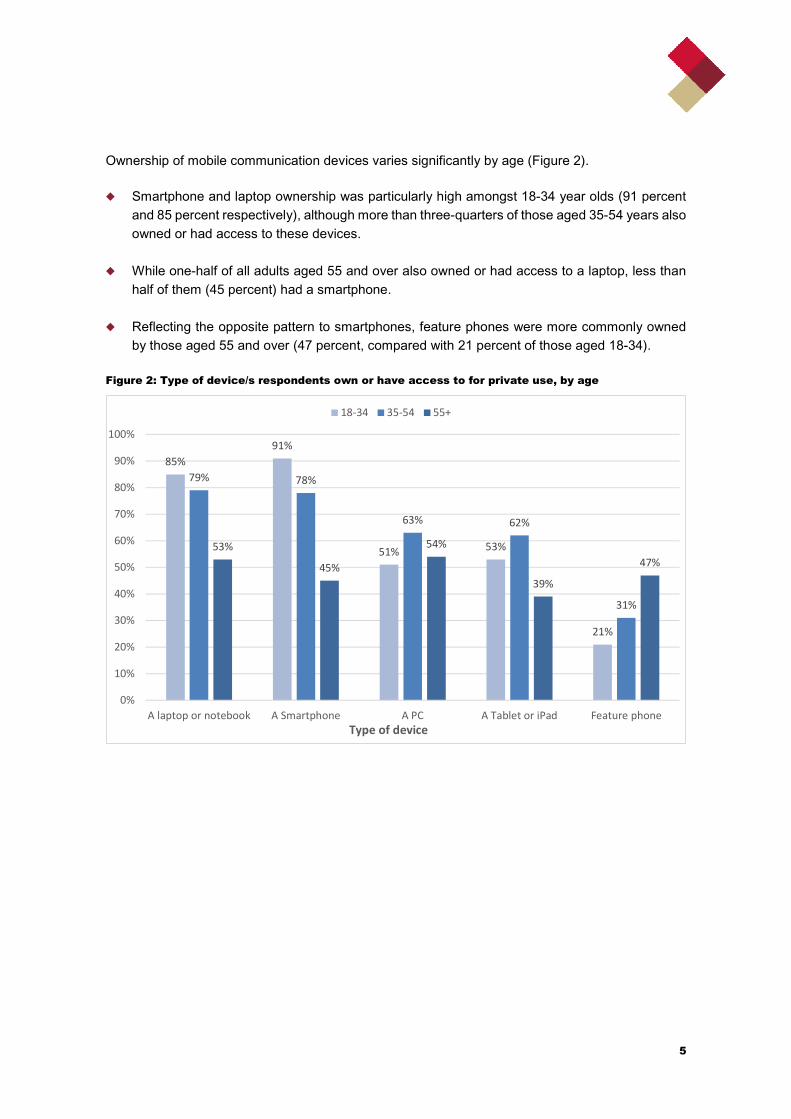
Ownership of mobile communication devices varies significantly by age (Figure 2).
� Smartphone and laptop ownership was particularly high amongst 18-34 year olds (91 percent
and 85 percent respectively), although more than three-quarters of those aged 35-54 years also
owned or had access to these devices.
� While one-half of all adults aged 55 and over also owned or had access to a laptop, less than
half of them (45 percent) had a smartphone.
� Reflecting the opposite pattern to smartphones, feature phones were more commonly owned
by those aged 55 and over (47 percent, compared with 21 percent of those aged 18-34).
Figure 2: Type of device/s respondents own or have access to for private use, by age
85%
91%
51% 53%
21%
79% 78%
63% 62%
31%
53%
45%
54%
39%
47%
0%
10%
20%
30%
40%
50%
60%
70%
80%
90%
100%
A laptop or notebook A Smartphone A PC A Tablet or iPad Feature phone
Type of device
18-34 35-54 55+
6
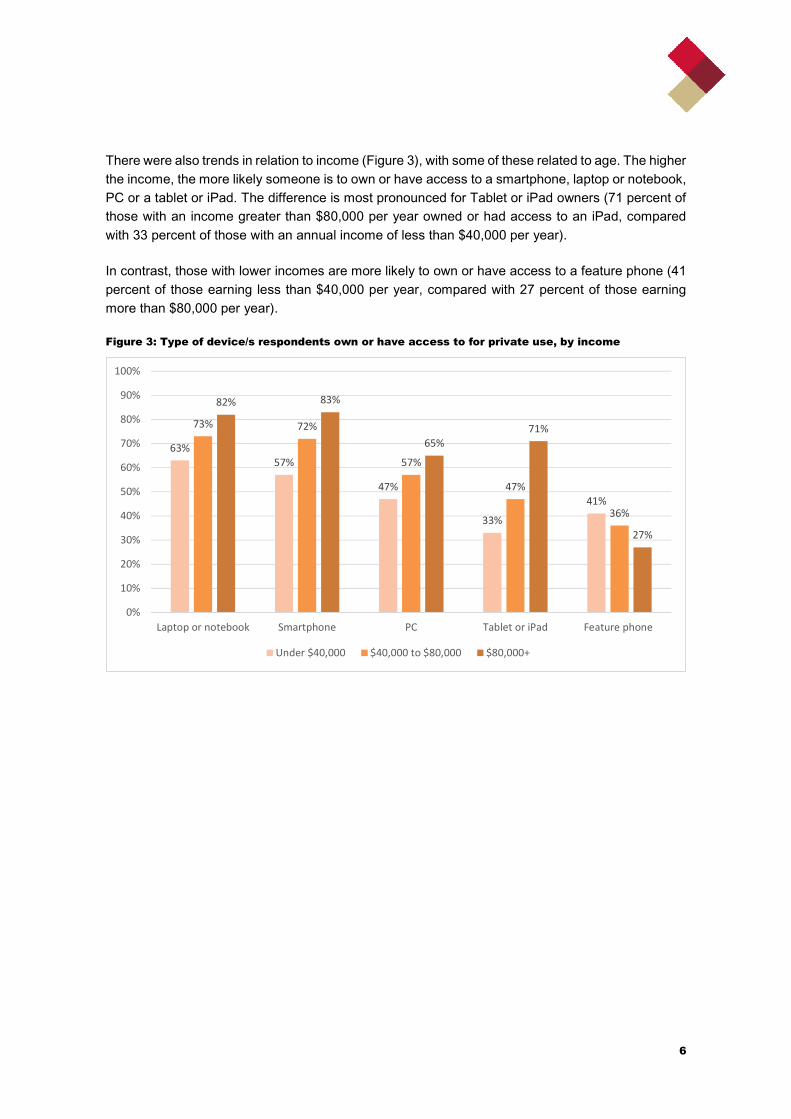
There were also trends in relation to income (Figure 3), with some of these related to age. The higher
the income, the more likely someone is to own or have access to a smartphone, laptop or notebook,
PC or a tablet or iPad. The difference is most pronounced for Tablet or iPad owners (71 percent of
those with an income greater than $80,000 per year owned or had access to an iPad, compared
with 33 percent of those with an annual income of less than $40,000 per year).
In contrast, those with lower incomes are more likely to own or have access to a feature phone (41
percent of those earning less than $40,000 per year, compared with 27 percent of those earning
more than $80,000 per year).
Figure 3: Type of device/s respondents own or have access to for private use, by income
63%
57%
47%
33%
41%
73% 72%
57%
47%
36%
82% 83%
65%
71%
27%
0%
10%
20%
30%
40%
50%
60%
70%
80%
90%
100%
Laptop or notebook Smartphone PC Tablet or iPad Feature phone
Under $40,000 $40,000 to $80,000 $80,000+
7
Two-thirds of New Zealanders own or have access to three or more devices
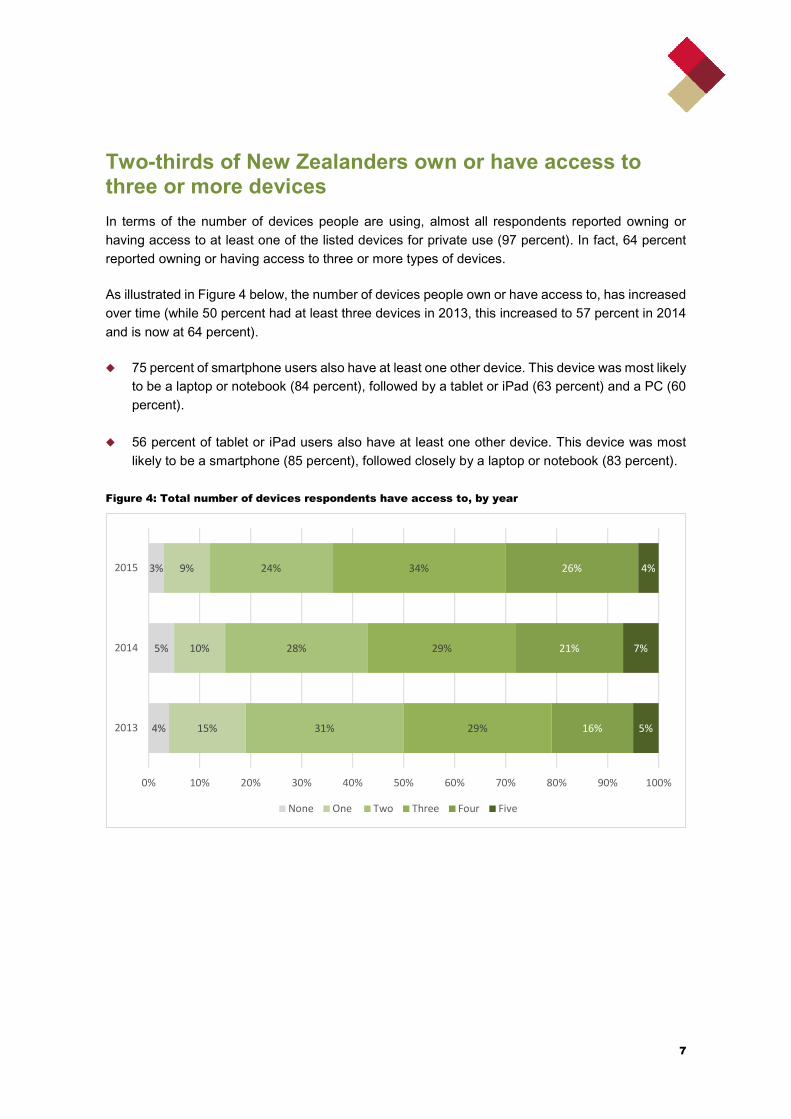
In terms of the number of devices people are using, almost all respondents reported owning or
having access to at least one of the listed devices for private use (97 percent). In fact, 64 percent
reported owning or having access to three or more types of devices.
As illustrated in Figure 4 below, the number of devices people own or have access to, has increased
over time (while 50 percent had at least three devices in 2013, this increased to 57 percent in 2014
and is now at 64 percent).
� 75 percent of smartphone users also have at least one other device. This device was most likely
to be a laptop or notebook (84 percent), followed by a tablet or iPad (63 percent) and a PC (60
percent).
� 56 percent of tablet or iPad users also have at least one other device. This device was most
likely to be a smartphone (85 percent), followed closely by a laptop or notebook (83 percent).
Figure 4: Total number of devices respondents have access to, by year
4%
5%
3%
15%
10%
9%
31%
28%
24%
29%
29%
34%
16%
21%
26%
5%
7%
4%
0% 10% 20% 30% 40% 50% 60% 70% 80% 90% 100%
2013
2014
2015
None One Two Three Four Five
8
One-in-two smartphone users prefer their smartphone over any other device
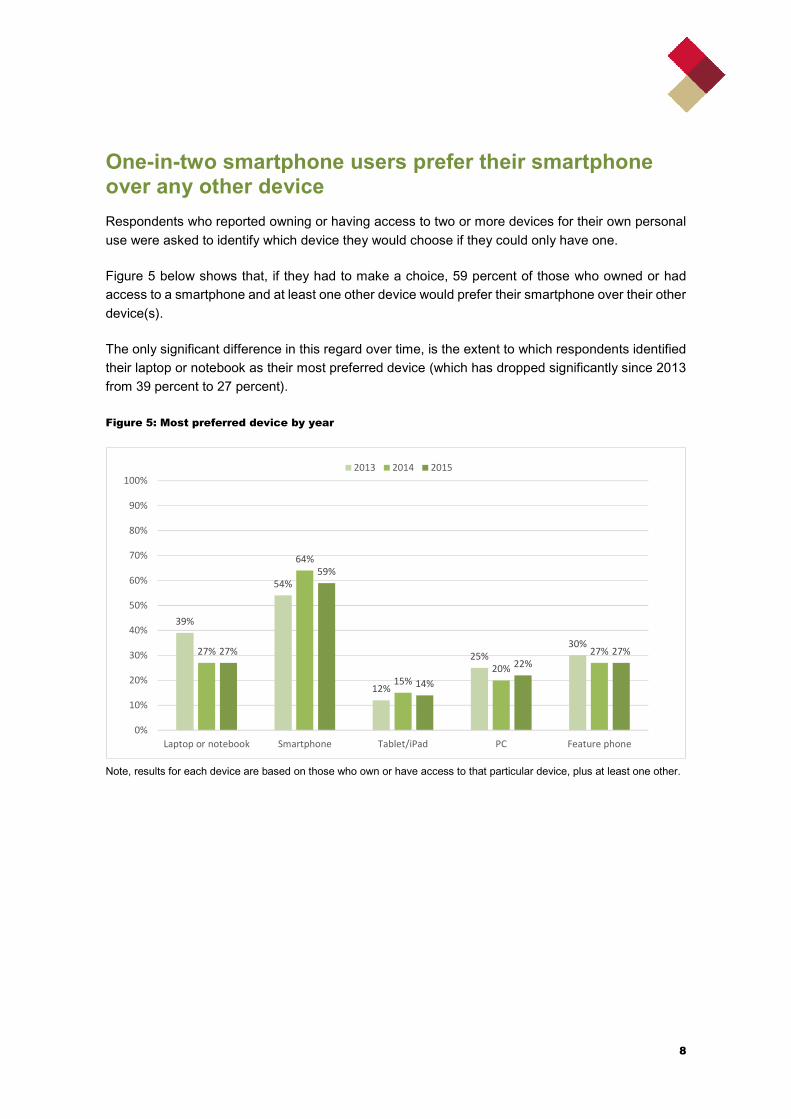
Respondents who reported owning or having access to two or more devices for their own personal
use were asked to identify which device they would choose if they could only have one.
Figure 5 below shows that, if they had to make a choice, 59 percent of those who owned or had
access to a smartphone and at least one other device would prefer their smartphone over their other
device(s).
The only significant difference in this regard over time, is the extent to which respondents identified
their laptop or notebook as their most preferred device (which has dropped significantly since 2013
from 39 percent to 27 percent).
Figure 5: Most preferred device by year
Note, results for each device are based on those who own or have access to that particular device, plus at least one other.
39%
54%
12%
25%
30%27%
64%
15%
20%
27%27%
59%
14%
22%
27%
0%
10%
20%
30%
40%
50%
60%
70%
80%
90%
100%
Laptop or notebook Smartphone Tablet/iPad PC Feature phone
2013 2014 2015
9
Smartphones are now an ‘everyday device’
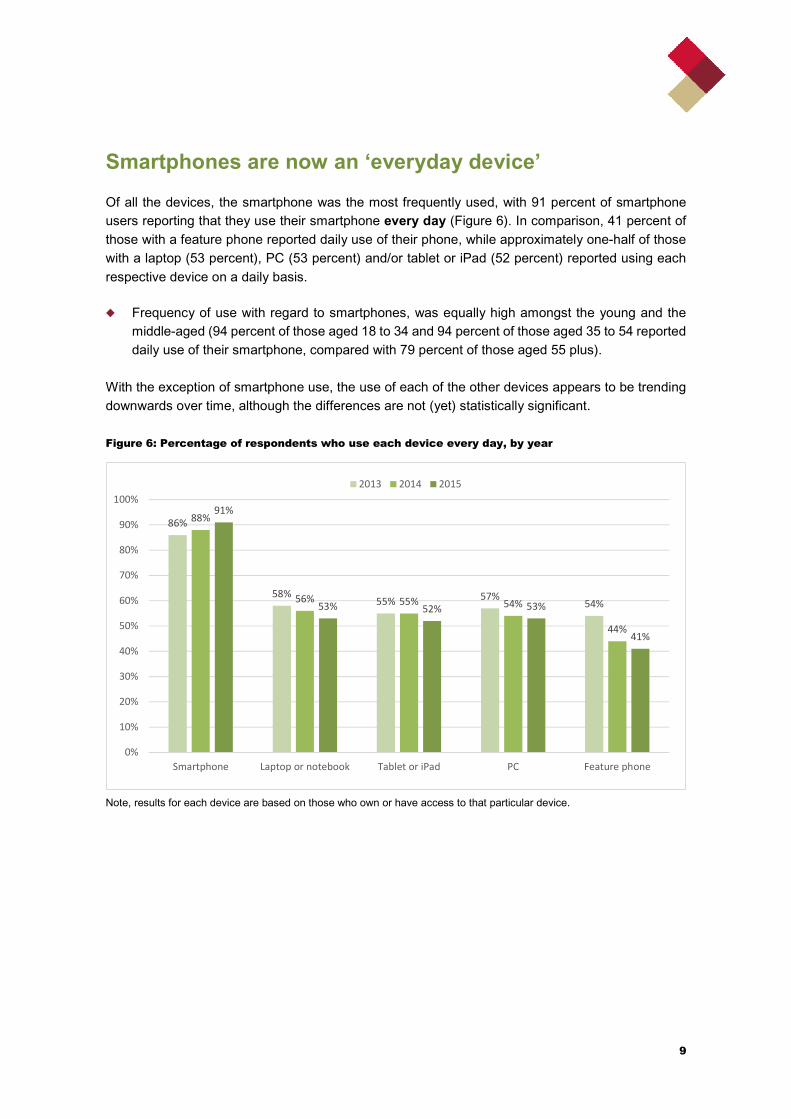
Of all the devices, the smartphone was the most frequently used, with 91 percent of smartphone
users reporting that they use their smartphone every day (Figure 6). In comparison, 41 percent of
those with a feature phone reported daily use of their phone, while approximately one-half of those
with a laptop (53 percent), PC (53 percent) and/or tablet or iPad (52 percent) reported using each
respective device on a daily basis.
� Frequency of use with regard to smartphones, was equally high amongst the young and the
middle-aged (94 percent of those aged 18 to 34 and 94 percent of those aged 35 to 54 reported
daily use of their smartphone, compared with 79 percent of those aged 55 plus).
With the exception of smartphone use, the use of each of the other devices appears to be trending
downwards over time, although the differences are not (yet) statistically significant.
Figure 6: Percentage of respondents who use each device every day, by year
Note, results for each device are based on those who own or have access to that particular device.
86%
58%55% 57%
54%
88%
56% 55% 54%
44%
91%
53% 52% 53%
41%
0%
10%
20%
30%
40%
50%
60%
70%
80%
90%
100%
Smartphone Laptop or notebook Tablet or iPad PC Feature phone
2013 2014 2015
10
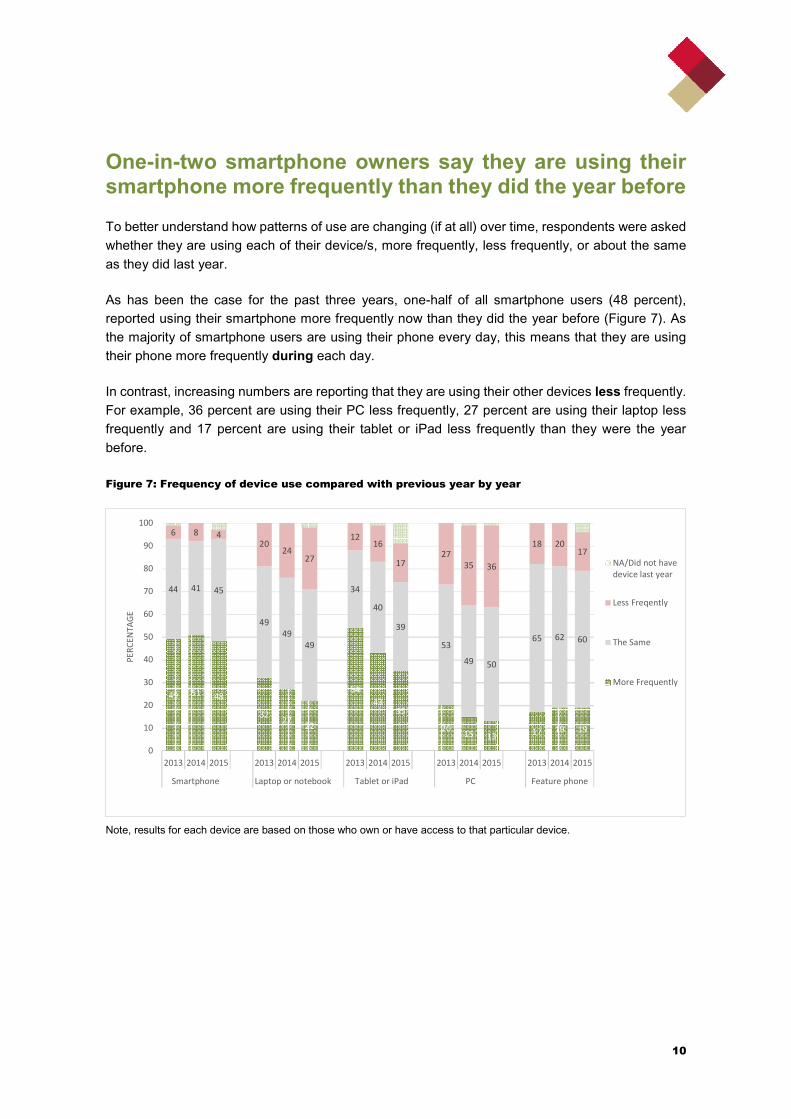
One-in-two smartphone owners say they are using their smartphone more frequently than they did the year before
To better understand how patterns of use are changing (if at all) over time, respondents were asked
whether they are using each of their device/s, more frequently, less frequently, or about the same
as they did last year.
As has been the case for the past three years, one-half of all smartphone users (48 percent),
reported using their smartphone more frequently now than they did the year before (Figure 7). As
the majority of smartphone users are using their phone every day, this means that they are using
their phone more frequently during each day.
In contrast, increasing numbers are reporting that they are using their other devices less frequently.
For example, 36 percent are using their PC less frequently, 27 percent are using their laptop less
frequently and 17 percent are using their tablet or iPad less frequently than they were the year
before.
Figure 7: Frequency of device use compared with previous year by year
Note, results for each device are based on those who own or have access to that particular device.
49 51 48
3227
22
54
4335
2015 13
17 19 19
44 41 45
49
49
49
34
40
39
53
49 50
65 62 60
6 8 420
2427
1216
1727
35 36
18 2017
0
10
20
30
40
50
60
70
80
90
100
2013 2014 2015 2013 2014 2015 2013 2014 2015 2013 2014 2015 2013 2014 2015
Smartphone Laptop or notebook Tablet or iPad PC Feature phone
PE
RC
EN
TA
GE
NA/Did not have
device last year
Less Freqently
The Same
More Frequently
11
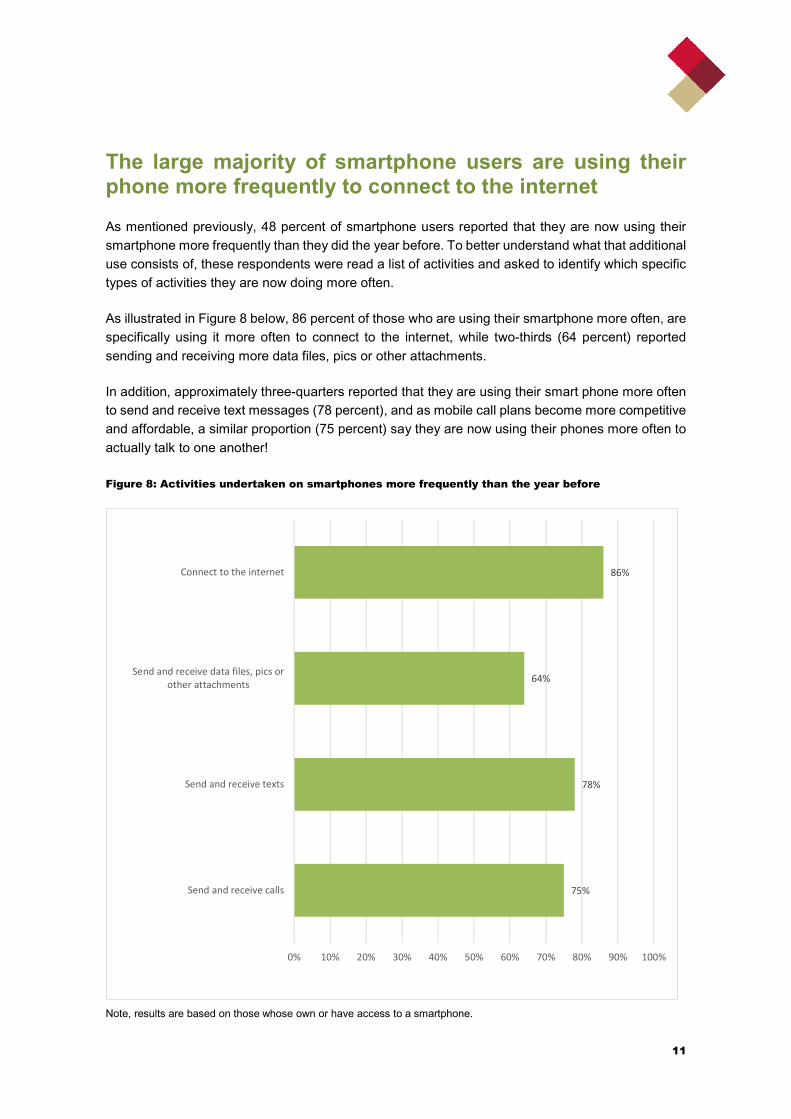
The large majority of smartphone users are using their phone more frequently to connect to the internet
As mentioned previously, 48 percent of smartphone users reported that they are now using their
smartphone more frequently than they did the year before. To better understand what that additional
use consists of, these respondents were read a list of activities and asked to identify which specific
types of activities they are now doing more often.
As illustrated in Figure 8 below, 86 percent of those who are using their smartphone more often, are
specifically using it more often to connect to the internet, while two-thirds (64 percent) reported
sending and receiving more data files, pics or other attachments.
In addition, approximately three-quarters reported that they are using their smart phone more often
to send and receive text messages (78 percent), and as mobile call plans become more competitive
and affordable, a similar proportion (75 percent) say they are now using their phones more often to
actually talk to one another!
Figure 8: Activities undertaken on smartphones more frequently than the year before
Note, results are based on those whose own or have access to a smartphone.
75%
78%
64%
86%
0% 10% 20% 30% 40% 50% 60% 70% 80% 90% 100%
Send and receive calls
Send and receive texts
Send and receive data files, pics or
other attachments
Connect to the internet
12
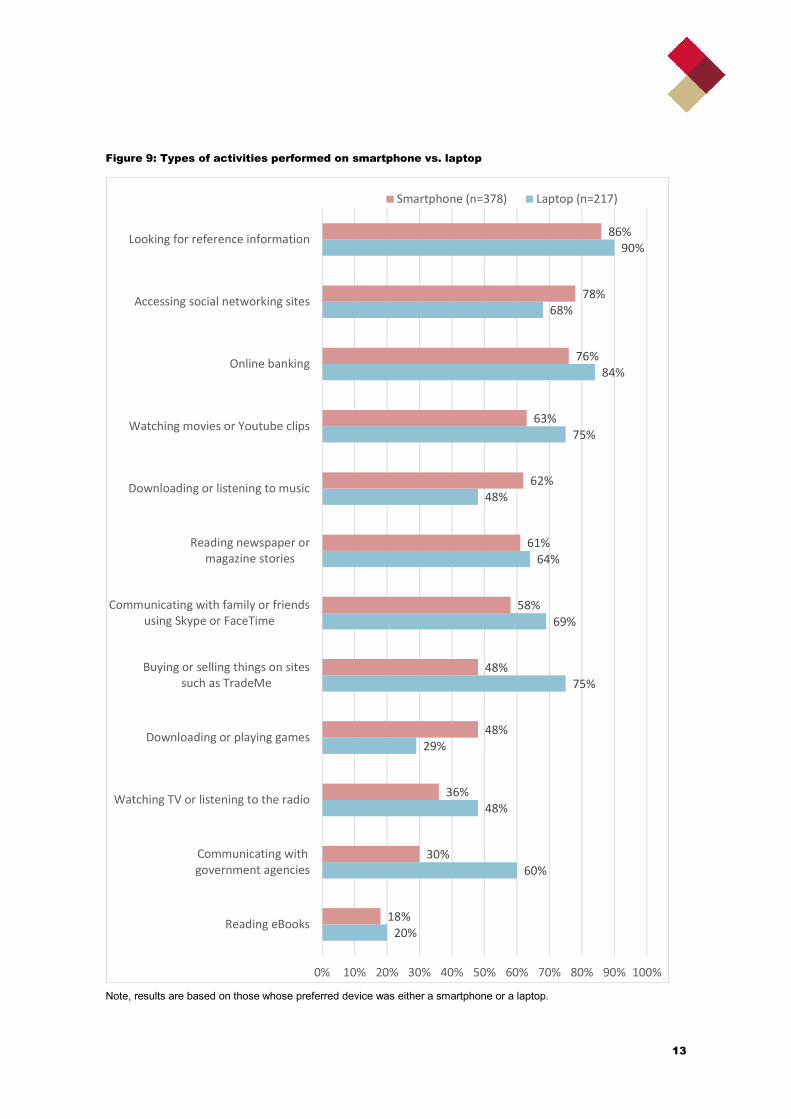
Smartphones are mostly being used to look for reference material, social networking and banking
Respondents were also asked to identify what they use their most preferred device for.2
As illustrated in Figure 9 overleaf, those who identified their smartphone as their preferred device
most commonly reported using their device to look for reference information (86 percent), to access
social media sites (78 percent) and to do their online banking (76 percent).
When compared to the way in which respondents use their laptops (which was the next most
favoured device that had internet capabilities), there are some clear differences. For example,
smartphone users were more likely to use their smartphone to:
� Access social networking sites (78 percent, compared with 68 percent who access social media
through their laptop)
� Download or listen to music (62 percent, compared with 48 percent)
� Download or play games (48 percent, compared with 29 percent).
In contrast, smartphone users were significantly less likely than those who prefer their laptops to
use their device to:
� Buy or sell things on sites such as TradeMe (48 percent, compared with 75 percent of laptop
users)
� Watch TV or listen to the radio (36 percent, compared with 48 percent)
� Communicate with government agencies (30 percent, compared with 60 percent).
2 Note that respondents who reported owning or having access to only one device were also asked this question. This is on
the basis that this device was their most preferred device.
13
Figure 9: Types of activities performed on smartphone vs. laptop
Note, results are based on those whose preferred device was either a smartphone or a laptop.
20%
60%
48%
29%
75%
69%
64%
48%
75%
84%
68%
90%
18%
30%
36%
48%
48%
58%
61%
62%
63%
76%
78%
86%
0% 10% 20% 30% 40% 50% 60% 70% 80% 90% 100%
Reading eBooks
Communicating with
government agencies
Watching TV or listening to the radio
Downloading or playing games
Buying or selling things on sites
such as TradeMe
Communicating with family or friends
using Skype or FaceTime
Reading newspaper or
magazine stories
Downloading or listening to music
Watching movies or Youtube clips
Online banking
Accessing social networking sites
Looking for reference information
Smartphone (n=378) Laptop (n=217)
14
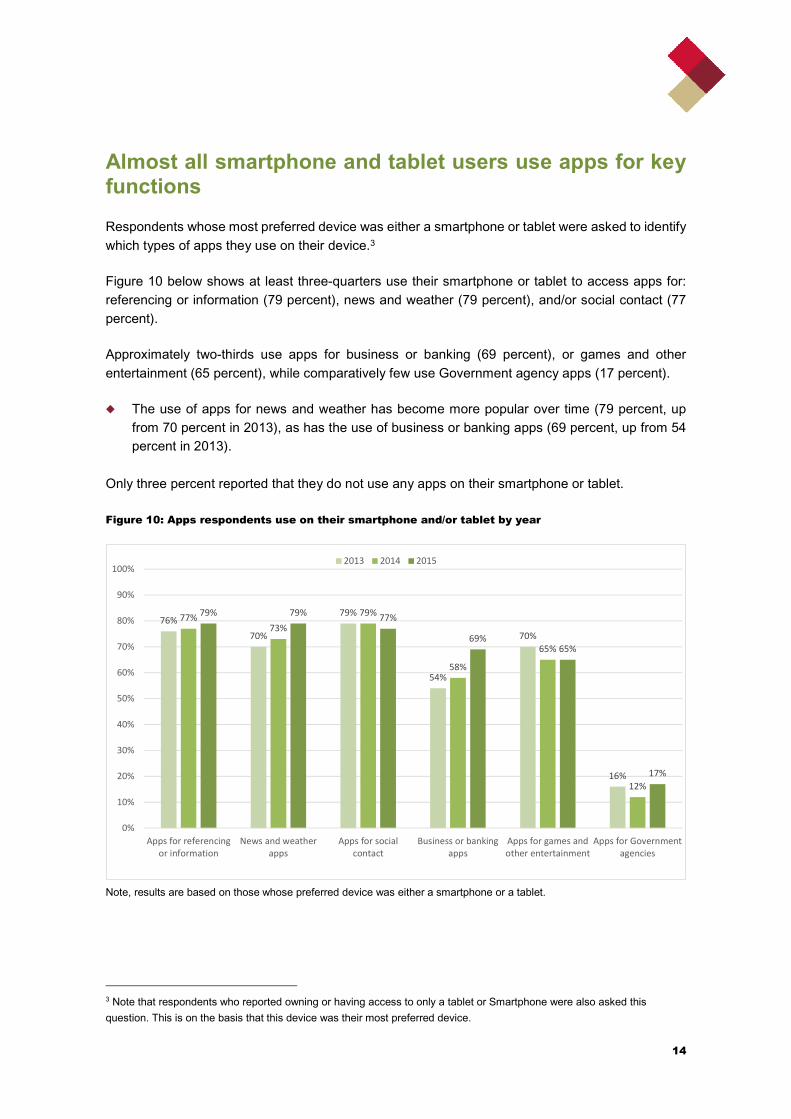
Almost all smartphone and tablet users use apps for key functions
Respondents whose most preferred device was either a smartphone or tablet were asked to identify
which types of apps they use on their device.3
Figure 10 below shows at least three-quarters use their smartphone or tablet to access apps for:
referencing or information (79 percent), news and weather (79 percent), and/or social contact (77
percent).
Approximately two-thirds use apps for business or banking (69 percent), or games and other
entertainment (65 percent), while comparatively few use Government agency apps (17 percent).
� The use of apps for news and weather has become more popular over time (79 percent, up
from 70 percent in 2013), as has the use of business or banking apps (69 percent, up from 54
percent in 2013).
Only three percent reported that they do not use any apps on their smartphone or tablet.
Figure 10: Apps respondents use on their smartphone and/or tablet by year
Note, results are based on those whose preferred device was either a smartphone or a tablet.
3 Note that respondents who reported owning or having access to only a tablet or Smartphone were also asked this
question. This is on the basis that this device was their most preferred device.
76%
70%
79%
54%
70%
16%
77%73%
79%
58%
65%
12%
79% 79%77%
69%65%
17%
0%
10%
20%
30%
40%
50%
60%
70%
80%
90%
100%
Apps for referencing
or information
News and weather
apps
Apps for social
contact
Business or banking
apps
Apps for games and
other entertainment
Apps for Government
agencies
2013 2014 2015
15
The use of apps also differs by age, with those in the younger age group more likely to report using the following types of apps in particular:
� Social media apps (87 percent of those aged 18 to 34 years, compared with 75 percent of those
aged 34 to 54 years and 58 percent of those aged 55 years and over).
� Business and banking apps (81 percent of 18 to 34 year olds, compared with 67 percent of 35
to 54 year olds and 47 percent of those aged 55 years and over).
� News and weather apps (81 percent of 18 to 34 year olds and 81 percent of those aged 35-54
years compared with 70 percent of those aged 55 and over).
� Apps for games and other entertainment (74 percent of 18 to 34 year olds and 66 percent of
those aged 35-54 years compared with 42 percent of those aged 55 and over).
16
Appendix A: Survey methodology
This report presents the results to the third Research New Zealand Mobile Communication Device Use Survey. Completed in February and April 2015, results are compared with the two previous measures conducted in 2014 and 2013.
In January and February 2013, Research New Zealand conducted a survey of the general public to
establish a baseline measure of electronic device ownership and use amongst New Zealanders.
The baseline involved a telephone survey of n=1,003 respondents aged 18 years or older.
Between January and February 2014, the baseline survey was repeated. Again, a nationally
representative sample of n=1,001 New Zealanders, 18 years of age or older, was interviewed by
telephone.
In February and April this year, this survey was repeated. For this survey, a nationally representative
sample of n=1,075 New Zealanders, 18 years of age or older, was interviewed.
As with the two earlier surveys, the data has been weighted to ensure that the results are truly
representative of the New Zealand population. The weighting parameters were sourced from
Statistics New Zealand and are based on the 2013 Census of Population and Dwellings.
Results based on the (weighted) total sample are subject to a maximum margin of error of +/- 3.3
percent (at the 95 percent confidence level)4. This means, for example, that if 50 percent of
respondents owned a smartphone, we could be 95 percent sure of getting the same result, plus or
minus 3.3 percent, had we interviewed everyone in the population. Higher margins of error apply in
the case of sub-samples.
4 The margin of error is slightly higher than the conventional margin of error calculation as it takes into account the fact that
the data has been weighted.