Embed Size (px)
Citation preview

()*+#,-
A Review of NaturalDisasters of the Past
2
A typhoon passing to the
south of Hong Kong in 1927
23456+789:;<
=>&?@

57
A R
evie
w o
f Nat
ural
Disa
ster
s of
the
Pas
t
56
!"#$%&'
!" 1980#$%&'()*+,-.("/%012345(6789
:;;<=>?@AB%C1970#$DEFG%&'(H/I24(JK
L3MN>OPC 1883#2QRSTUG%V+WXYZ[\]^_`abH
cdefg%hFij+klmn 1883#FG(o345pNq,r>stu
o345vwxhyS(z5%{|}&'~��c(��b����(��%
� 1884� 2002#&'H�(o345��%�+�(�����sde_�
�_��_��b����;�>
!"�#(6�10�%&'�xI de¡¢>de%£¤$¥¦(§¨%©ª«¬
SP®¯°±Yb²³(́ �µ¥¶·%ª¸(¹º»¼2�¼½E¾�%¿
À(ÁÂÃÄÅƳ°ÅÇ(¥ÈÁªÉ%ÊË©oÌÍÎÅÂϲÐbD
Ѳ³¿ÀÒ9:%de©ÓP³Å¬S(�e>ÔÕDÑoÖFAn×+س
mÙ(ÁÚÛ+de(��%ÜÝmÙ(ÁÚ»V+de(`Þ%�ßàde(
¬SƳ°ÅÇ(¥È+áâã(�ä>
�µ¥¶¾ªåxæsde%C®¯°±YbDѲ³%;ç×+è¼(
�µ¥¶xH/�deéê> 23 ëì 1949# 6�ÌÍÎÑí¥¦xî(ïå%
�µ¥¶�ëìÔe7(éðñsòó (ôõö÷ 2.1)>
��Aøùúû&'2QR%üdeý%&'% 1992%þ 8>
# 2.1ÿ�µ¥¶ñ�Æ!"#eóvì÷ 24
$%&'"( )*+",
-. //0 1. //0
�µ$¥% 41–62 22–33 6–7ó
�µe� 63–87 34–47 8–9ó
é&�µe� 88–117 48–63 10–11ó
de 118'FÅ 64'FÅ 12ó
Since the 1980s, Hong Kong’s sustained economic development has led tosubstantial improvements in its ability to withstand natural catastrophes.
Natural disasters before the mid-1970s seriously affected the development ofHong Kong. Before the setting up of the Hong Kong Observatory in 1883,there was no specialised department to observe, record and disseminateinformation on typhoons. Therefore it was very difficult to gather informationsystematically on casualties caused by natural disasters before 1884. Based onthe official publications by the Hong Kong government and civilian reports,the natural calamities that occurred between 1884 to 2002 have been generallycategorised into five main types — typhoons, severe rainstorms, very cold,very hot and very dry weather. The following sections are attempts to studyin depth how such natural disasters have wreaked havoc on society.
TyphoonsFrom June to October every year, Hong Kong is subjected to threats oftyphoons. Using the terminology of modern-day meteorology, typhoons are‘tropical cyclones’ that form over the western part of the North Pacific. Theycan last from a few days to several weeks. Their directions of movement arebasically in line with the direction of the large-scale air currents above theocean, tending to move northwards from the seas around the Philippinestowards Southeast Asia and the South China Sea. Thus, typhoons refer tostorms that are formed over the sea. Since ancient times only gazettes fromChina’s coastal regions have provided information about typhoons. No gazettesfrom the inland regions had any description of typhoons, implying that typhoonsare weather systems closely related to the ocean.
Tropical cyclones do not always develop into full-fledged typhoons. Inthe western North Pacific and the South China Sea, only about half of thetropical cyclones develop into typhoon strength.23 At the internationalmeteorology conference held in the Philippines in June 1949, tropical cycloneswere classified into four categories according to wind speeds.
59
A R
evie
w o
f Nat
ural
Disa
ster
s of
the
Pas
t
58
!"#$%&'
23456
DÑÖÚ(n³Å¬S�e(`Þ%F)*+,-./(ü²0Úý25 +�´1
e·(2as34%+#5s´1e·6Ó789:Ue>Ô;Q<a=>?
ì��@Ae%ABÔòÁUe8%ªC1e%DFE%F�G%Ô�
H%IJKL¾M%;BFJ%NBIJ> 26
�O*POQR,`�Ae(S7T%U+V�Ae¬SG>(o3¤¦27?
WXUY%;eb+³ZE[\]e^%Ö8UCAe%_Ô`òÁU
e%ÖaAe%+:eb+cd;�ep%M�fghi%jklmn
o%Ôp=qrUsB%aJAt%u³U8v:%wxaye>
�PAexz{sde%}|}~ü�(�ý28 w5s´ ·©34£F¬
�e�U�>%>z��sA?́ %��ã%³U4e8%\(�pA>·à
���ü���ý29 +Þ?́ "�8{ e% ��%��U6·%�́ e·Æ
��(´de·��%� ���æSde>����Pü"��Úý30 D8+
`Þ e?´A%\�s %�s�>·���ù́ Ap %��>·ü )ý8
+´er=�·(`Þ>�¡¢£ü¤Z2¥ýù́ ¦¦'C��CA%§p %
�\Ce�%�B�U��8>·�+�A_ ¨©(��%ªG[¾«î¬%
5sAe;/p B%@F®(T¬>
¯A°±ÁÚ%@FAea³Åé&(�e�«Fde{>AeP�mx{
p´²e·_´e�·'´e�·%¡¢£Pü¤Z2¥ý31 ³Ý´�]?´²
³µ+²e%AB²U�8>́ ²e·x�rpAe¶·¸<%[PW�¹PX
U�%FXs²>·AePº_R»8�³Å;e¼½´e�·'´e�·> 32
|}�$&'¥¾��(`Þ%¿�P®¯°±YÀDѲ³(�µ¥
¶%@F typhoon ( de ) aU>+]:£¨©øPÖ$ÁÂÃÄTyphon (Å
ÆÇÈ) ª�Ò 8+5sɨh£(typhoonª�øP��́ ;e·'́ Êe·>
ËÌ8Í£ typhoonª�%FÉ8ÎÏÐ (William Dampier) P 1687# 7�
4JÑÒüu³J`ýª(s34>1697#ÓÔp(ü³ÅÕÖ×Øý (A Voyage
Around the World)%UFtyphoon¬�é&(�e>ÙÚ×2DEF>%DÑ_
&'_ÌÍÎ_JÄbÛÑ�¥¦RvH�P²DѳÀ±®¯°(�µ¥
¶%Ül{s typhoon (de)>
&'FT(mÙ%ve7éÝ(�µ¥¶8+¾e({]?1805#ɳÞ
!" (Francis Beaufort) ßå(ü!"eóý (Beaufort scale of wind force) �
೯á 10â(eãsä%ñs 12ó%å 12óeãs�NH 118�æFÅ%
{s hurricane force wind (Ae)Ò¿�P±¡êçè³á_éêC;±°À
Origins of Nomenclature
Of the ancient Chinese texts discussing storms that were formed over the sea,the earliest one can be traced to Nanyue zhi (Gazette of South China),25
compiled by Shen Huaiyuan in the Jin Dynasty. In Shen’s work, the so-called‘big’ storms meant storms feared by people. The original excerpt is translatedbelow:
According to unofficial sources, there are many jufeng (violentstorms). Jufeng means wind coming from four directions, with achange of tone this can also mean ‘fearful wind’. They occur in theseventh month. When they come, dogs and roosters make no soundfor three days. The big ones last for seven days, and the small oneslast for three days.26
In the Yuan Dynasty, Lou Yuanli, recorded the immense force of thestorms and also described the phenomena before and after the formation ofthe jufeng:27
Between summer and autumn, the blowing of high winds and seasand gives rise to fengchao (wind tides); the ancient people knew thisas jufeng. The name jufeng refers to winds coming from all fourdirections. Jufeng are usually accompanied by heavy rain. They evenuproot trees, flatten crops, destroy houses and damage riverembankments. They first appear like a broken rainbow, known asjumu (mother of high winds). Mariners, when they see thisphenomenon, call it fanfeng (sailing winds).
Jufeng is also known as taifeng. According to Tai Tong of the Song Dynasty,who wrote the Liushu gu (Ancient Stories From Six Books),28 the name fengbeiwas the earliest term used to describe a big storm. Later the name waserroneously passed down as ju. ‘The name bei, meaning disastrous winds fromthe sea, was mistaken as ju by popular books.’ In the Ming work, Wuza cu,29
Table 2.1 Tropical Cyclone Classification — Wind Speeds and the Beaufort Wind Scale24
Maximum Sustained Wind Speed Beaufort Scalekm/h knot
Tropical Depression 41–62 22–33 Force 6–7Tropical Storm 63–87 34–47 Force 8–9Severe Tropical Storm 88–117 48–63 Force 10–11Typhoon 118 or above 64 or above Force 12
Source:Royal Observatory, Hong Kong, Typhoons, Hong Kong, 1992, p. 8.

61
A R
evie
w o
f Nat
ural
Disa
ster
s of
the
Pas
t
60
!"#$%&'
#2.2 ±®¯°bDѳë���µ¥¶ñcsälì (1884–1941#%1946–1947#)
78 1 2 3 4 5 6 7 8 9 10 11 12
©�íîï¼ – – – – – 1 15 20 23 8 3 –
Åñð – – – – – 1.4 21.4 28.6 32.9 11.4 4.3 –
®¯°ÏY�e7Î 12óeã(�µ¥¶%ª¸l{shurricane (Ae)>
+] hurricane (Ae) ª�©�æoDñÌò¨ hurrican (óô)ª�%DQõ
pAe%FöP®¯°±YÀ²Dѳ(�µ¥¶>ÔÕ÷¬©Aeø'de
Ü©ÓWXU�%Go³°(Çe>
1947#FG%¡¢&'(deùV+zúªºa>1947#[%sÙöeH
EѤ(¨û'FÅ(de%®¯°±Yb²DѳÙëüýþ£ñÑ�èÿ
!de"#D$ ( Joint Typhoon Warning Center) h%å(ea÷%sC&
Ù¬S(�ª'�µ¥¶ºa>&÷Oò() 23'Ao¾emÙ(*+a©(
S%�(a{ñöFÉQ©t,-./%0ÈzÍ£%�Pa©Ä1Æde(e
ãéêÜV+�ä>eªa©ª¸xC92'a©Í£>234£%§38x+5
67ä88ª9µAá;:j(dea©%xz;RPa<FT%V+z234
Í£%F=>[?@(AB>
1979#[%ea÷(a©%FC*a©YD./%ªE<F*+a©s�
µ¥¶ºa(²F>C:UG%PèG±®¯°¬S(�µ¥¶%ÜF*H(
a{ºa%�²èG±®¯°(�µ¥¶wÍ£CHa©>33 2000#1�1J%
ªIOJKL_DÑ_Û_&'_JÄ_MN_¤Z_OA±Ð_âPQR±
Ð_ÌÍÎ_²Û_SÑ_ñÑb0² 14'mÙ%�Ù<T) 10'U 140'a
{h(S(�µ¥¶a<%V$, 1996� 1999#E�hþ£(�µ¥¶ºa
÷>Wa<¾XYZ,)mÙ(�[5\%eH]^_,�µ¥¶éê(`a%
bé,Ùë�(!p>
9:4;<
|}cd (Gordon E. Dunn) Cü;±°(Aeý(Atlantic Hurricanes) H÷(l
ì%34 ;±°¯Ü�#ç+7.5'AeÒØe±f(®¯°ÏY%¯Ü�#
ç+5.7'AeÒ¡ê°Å¯Ü�#ç+13.5'Ò±®¯°�#H�(dewç
+20�30'%ÔDgSFÅxC6��10�¿�%»±®¯°¡Â&'(�µ
¥¶�#¯Üx+5�6'>�²®¯°ÏYb²;±°wV+�µ¥¶Ñ¤>35
��AøùStarbuck, L., A Statistical Survey of Typhoons and Tropical Depressions in the Western Pacific and China Sea Area From
Observations and Tracks Recorded at the Royal Observatory Hong Kong From 1884 to 1947, Hong Kong, NoronhaCo. Ltd., 1951, p. 4.
the editor Xie Zhaozhe wrote that the Fujian people call windstorms as beifeng,because of their jolting nature. The pronunciation of beifeng in Fujian dialectclosely resembles that of taifeng in Cantonese. Thus, beifeng in the course oftime became taifeng. A Qing man, Yu Jingxi in his Fuzhou fuzhi (Local Gazetteof Fuzhou),30 also mentioned the beifeng wind and said that ju was popularlyknown as bei, and was also called bao. Another Qing man, Yang Shen, saidthat ju was written as bei, and was pronounced as bei. In the Buddhist text, ‘redwinds like bei’ were also mentioned. A Qing author, Yin Guangren in hisbook, Aomeng jilue (A Collection of Records of Macao), mentioned that YangShen equated jufeng with beifeng, and was colloquially called fengbao (thereporting of big winds); bao was a changed tone for bei. The change of tonebetween ju and bei caused a great deal of controversy. Those who thoughtthat jufeng should be named as beifeng, usually used prosody books to supporttheir arguments.
Scholars, who edited local gazettes, usually named severe storms fromthe seas as jufeng and seldom called them taifeng. Jufeng in Guangdong regionwere also known as jiufeng (old winds), fengbao (the reporting of big winds), orfengbao (violent storms). Yin Guangren in his book, Aomeng jilue,31 quotedanother scholar Lu Yinchuan who said that in the southern seas, there wouldbe jiufeng every year, and the name jufeng was just a mistaken term for jiufeng.However, jiufeng could also mean the jufeng season, which started from summerand ended in autumn. By autumn, such winds were so frequent that theyliterally became jiu (old). Jufeng among the people of Fujian and Taiwan werealso known as fengbao (the reporting of big winds) or fengbao (violent storms).32
According to recent Hong Kong meteorological data, a majority of thetropical cyclones formed in the western North Pacific and South China Seaare known as ‘typhoon’ (taifeng). Some say that the word ‘typhoon’ originatedfrom a Greek mythological term ‘Typhon’, which was used to describe a 100-headed monster. Others say that the word ‘typhoon’ comes from the Cantonesepronunciation of dafeng (big winds), or dafeng (blowing of windstorms). InEurope the term ‘typhoon’ first appeared in the 4 July 1687 logbook entry ofa British mariner, William Dampier. In his book, A Voyage Around the World,published in 1697, he also used the term ‘typhoon’ to describe violent storms.From the middle of the nineteenth century onwards, the meteorologicalagencies of China, Hong Kong, the Philippines, Japan and Korea have usedthe term ‘typhoon’ to describe tropical cyclones that are formed in the SouthChina Sea and the western North Pacific.

63
A R
evie
w o
f Nat
ural
Disa
ster
s of
the
Pas
t
62
!"#$%&'
# 2.4 1964#&'hËijÄm"#kl(�µ¥¶��
=>?@ 23 ABC4DEFGHIJK
5� 25� 28J mno (Viola) 1, 3, 7, 8
6� 30� 7� 3J pq (Winnie) 1, 3
8� 7� 8J rs (Ida) 1, 3, 6, 7, 8, 9
9� 4� 6J tð (Ruby) 1, 3, 7, 8, 9, 10
9� 9� 11J uv (Sally) 1, 3, 5, 6, 7
9� 15� 21J wxÎ (Tilda) 1, 3
9� 30� 10� 1J ðx (Billie) 1, 3
10� 5� 7J yx (Clara) 1, 3
10� 11� 13J sz (Dot) 1, 3, 6, 7, 9, 10
10� 22� 23J {|Ð (Georgia) 1
# 2.3ÿ1946� 2002#JK&'(�µ¥¶lì
78 1 2 3 4 5 6 7 8 9 10 11 12
©�íîï¼ – – – 3 11 41 76 71 86 49 9 1
Åñð – – – 0.9 3.2 11.8 21.9 20.5 24.8 14.1 2.6 0.3
��Aø?&'2QRÜY��>
|}2QRn1946#�2002#hp+��µ¥¶(2a%Ä'P57#Ü
ªUI 347'�µ¥¶hJK%¯Ü�#+6.1'>1946�2002#E�%�
µ¥¶�É2QR}ij"#~lU 14,629NH%¯Ü�#s 257NH> 36
1964#©&'���µ¥¶"#`aFÜ (�� 10–30ê%Ï) 105–
125ê) 3@�µ¥¶(ª#?©#C 5� 25J� 10� 23J( 4'@�U�%
C&`aÜU+�µ¥¶26'ÒÔD10'}HÑÄm�µ¥¶"#~l (ôõ
ö÷2.4)Ò©#ªij�µ¥¶"#~lU42ï%¯HU570NH>1974#&
'hËHÑÄm�µ¥¶"#~l(�µ¥¶@Î11'%©¯A3@�µ¥¶J
K&'(ª#>�3��(ªûdewË�© 1986 #(�d ( Typhoon
Wayne)%�(¹º-Î192%ªC8�19J�9�5JE��0²³Iï?å
ªïC 8� 19J � 21J%2QRij, 1_ 3b 8l�µ¥¶"#~lÒå�
ï© 8� 25J� 26J%2QRij, 1l�µ¥¶"#~lÒåIïC 9� 4
J�5J%2QRij,1 b3l�µ¥¶"#~l>37 »deH�(��bi
jH�A�%ÔCW¸vÄmÙ(S�M;>
��AøùWatts, I. E. M., (Director of the Royal Observatory), Hong Kong Annual Departmental Report for the Financial Year
1964–65, Hong Kong, Government Printer, 1965, pp. 8–14.
Outside Hong Kong, severe tropical cyclones are given many differentnames. In 1805 a British naval officer, Francis Beaufort, formulated the Beaufortscale of wind force. According to this scale, winds measured at 10 metresabove ground level are classified into 12 grades of wind force. Force 12 is usedfor wind force exceeding 118 kilometres per hour and such wind is describedas ‘hurricane force wind’ (jufeng). Tropical cyclones with Force 12 winds inthe seas of the West Indies, the Atlantic Ocean and the eastern North Pacific,are known as ‘hurricanes’. It is said that the word ‘hurricane’ came from aCentral American aboriginal term ‘hurrican’ (a demon); this is translated asjufeng in Chinese, to differentiate it from the tropical cyclones taifeng appearingin the western North Pacific and the South China Sea. Regardless whetherthey are called jufeng or taifeng, they are all severe storms that originate fromthe oceans during summers and autumns.
Before 1947, not every typhoon that affected Hong Kong was given aname. From 1947 onwards, to differentiate two or more typhoons that appearedsimultaneously in the western North Pacific and the South China Sea areas,Hong Kong began to adopt the list of names for tropical cyclones drawn upby the Joint Typhoon Warning Center at Guam to name each tropical cyclone.The list was made up of four groups, each with 23 female names drawn fromdifferent places. The names were arranged alphabetically and used in rotation.The tropical cyclone names had no correlation with the intensity of windspeed. The names would be reused once the 92-name list had been exhausted.There were of course some exceptions. The names of some typhoons that hadcaused devastation would be retired from the list to avoid bringing back painfulmemories.
From 1979 onwards, the tropical cyclone name list contained both maleand female names and they were used alternately, a change from the customof using just female names. Before that, female names were used for tropicalcyclones that were formed in western Pacific of the northern hemisphere,while male names were used for tropical cyclones that were formed in westernPacific of the southern hemisphere.33 On 1 January 2000, 14 nations/regionseach nominated 10 names to form a list of 140 names for tropical cyclones.These nations/regions were Cambodia, China, DPR Korea, Hong Kong,Japan, Lao PDR, Macau, Malaysia, Micronesia, the Philippines, Republic ofKorea, Thailand, the United States and Vietnam. The list replaced the oneused between 1996 and 1999. The new list highlights the areas affected bytropical cyclones and their different cultural characteristics, and also strengthensinter-regional co-operation.

65
A R
evie
w o
f Nat
ural
Disa
ster
s of
the
Pas
t
64
!"#$%&'
|}DÑÖ$ÁÚ(`Þ%¡¢DÑ(Ae%)mï¼¾ª%ü�÷a�ý
Þ?´'I_�#ªe%'ª#¨_Ie>·�PAeH�(¸<À��%ü²
0ÚýÞ?´DF�_��H·ÒxE?´DF�_F�G·>àÁF�ü��ý
]?́ �_W_XUñ%vqys%aCAt>·üu³e~³ý̀ �?́ ³DU
A%òH�H%WXs@>·�vÖ(vAe�#H�(ï¼%V+lª(�
�%X;0Å8e6Ô��PWXUí>
$LM4!"
&'2QRo 1884#ST>%�üý2a¡¢Ä'(�µ¥¶(�NH¯Ü3
�eã>1911#2QRUüý�ê�NH3��eeã>1931#[2QRPÄ
me�~lDb�́ Ùl·Ae~l%F<���vde("�H>F ©+�
1884#�2002#3éÝde2a%1884�1911ÊË¡V�NH¯Ü3�eã
Î118�æ (64³æ) FÅ%1911�1930#wF�NH3��e2aÎ220�
æ (120³æ) FÅ% 1930� 2002#( 73#�¡V}ËHÑ 10lAe~l(
�µ¥¶>1884�2002#(éÝdeU+21'38 (ôõö÷2.5)Ò¢£ÄB%
¯Ü� 5.7#%n+ªï�§é;(e�¡¢&'>
Frequency of OccurrencesAccording to Gordon E. Dunn’s publication of statistics in Atlantic Hurricanes,34
an average of seven hurricanes occur each year in the North Atlantic Ocean. Inthe eastern North Pacific Ocean, along the coast of Mexico, an average of 5.7hurricanes are registered each year, while there are 13.5 in the Indian Ocean. Inthe western Pacific, the annual typhoon frequency is 20 to 30 on average ofwhich over 80% are formed between June and October. Generally, five to sixtropical cyclones that form in the western Pacific head towards Hong Kong. Notropical cyclones appear in the eastern South Pacific and the South Atlantic.35
The records of the Hong Kong Observatory indicate that during the57–year period from 1946 to 2002, a total of 347 tropical cyclones occurred,giving an annual average of 6.1 (see Table 2.3).
During the 1946 to 2002 period, warning signals were hoisted by theObservatory for a total of 14,629 hours due to tropical cyclones, or an annualmean of 257 hours.36
Fig. 2.1 Aberdeen was extensively damaged bythe typhoon on 22 September 1874. CourtesyHong Kong Museum of History
¤ 2.1ÿ1874#9�22Jde¥>(&'¦>&'¯§¨©ªª«
Table 2.3 Statistics on Monthly Distribution of Tropical Cyclones Affecting HongKong (1946–2002)
Month Jan Feb Mar Apr May Jun Jul Aug Sep Oct Nov DecTotal count
for the – – – 3 11 41 76 71 86 49 9 1month
% – – – 0.9 3.2 11.8 21.9 20.5 24.8 14.1 2.6 0.3
Source:Internal records of the Hong Kong Observatory.
Table 2.2 Monthly Distribution of Typhoons in the Western Pacific and China Sea Area(1884–1941, 1946–1947)
Month Jan Feb Mar Apr May Jun Jul Aug Sep Oct Nov DecTotal count
for the – – – – – 1 15 20 23 8 3 –month
% – – – – – 1.4 21.4 28.6 32.9 11.4 4.3 –
Source:Starbuck, L., A Statistical Survey of Typhoons and Tropical Depressions in the Western Pacific and China Sea Area From
Observations and Tracks Recorded at the Royal Observatory Hong Kong From 1884 to 1947, Hong Kong, NoronhaCo. Ltd., 1951, p. 4.
67
A R
evie
w o
f Nat
ural
Disa
ster
s of
the
Pas
t
66
!"#$%&'
The year 1964 had the highest number of tropical cyclones entering thewarning zone for shipping in Hong Kong (10–30º North, 105–125º East).During that year, in the period between 25 May and 23 October, there werea total of 26 tropical cyclones occurring in that warning zone. Ten of thesetropical cyclones necessitated the Observatory to hoist local warning signalsfor a total of 42 times, lasting 570 hours (see Table 2.4). In 1974, a total of 11tropical cyclones affected Hong Kong, the highest number on record. Amongall the tropical cyclones affecting Hong Kong, Typhoon Wayne (1986) hadthe longest duration. It lasted over 19 days and traversed the South China Seathree times between 19 August and 5 September. The first passage was between19 and 21 August and the Observatory hoisted Signals No. 1, 3 and 8. Thesecond passage took place on 25 to 26 August and the Observatory hoistedthe No. 1 signal. The third passage occurred on 4 to 5 September and SignalsNo. 1 and 3 were hoisted.37 Judging from the frequency of occurrence oftyphoons and the duration of the tropical cyclone warning signals, it can beseen that typhoons can pose serious threats to Hong Kong in the summer.
Table 2.4 Tropical Cyclones Affecting Hong Kong in 1964
Date Tropical Cyclone Name of Warning SignalPassed Through Hong Kong Tropical Cyclone Hoisted
25–28 May Viola 1, 3, 7, 830 Jun–3 Jul Winnie 1, 3
7–8 Aug Ida 1, 3, 6, 7, 8, 94–6 Sep Ruby 1, 3, 7, 8, 9, 109–11 Sep Sally 1, 3, 5, 6, 715–21 Sep Tilda 1, 3
30 Sep–1 Oct Billie 1, 35–7 Oct Clara 1, 3
11–13 Oct Dot 1, 3, 6, 7, 9, 1022–23 Oct Georgia 1
According to ancient local gazettes, the number of jufeng that struck Chinavaried from one region to another. The book Lingpiao Luyi (Records of AbnormalPhenomena in Lingnan) stated that strong winds can occur once every two tothree years, it can also happen two to three times a year. Nanyue zhi recorded thatstrong winds usually start to occur in the fifth or sixth month and become morefrequent by the sixth and seventh months. In the book, Tongya (Introduction toElegance), Fang Erzhi of the Ming Dynasty writes that between spring, summerand autumn, there are strong winds known as jumu. The book, Hanghai tongxinyin
Source:Watts, I. E. M., (Director of the Royal Observatory), Hong Kong Annual Departmental Report for the Financial Year
1964–65, Hong Kong, Government Printer, 1965, pp. 8–14.
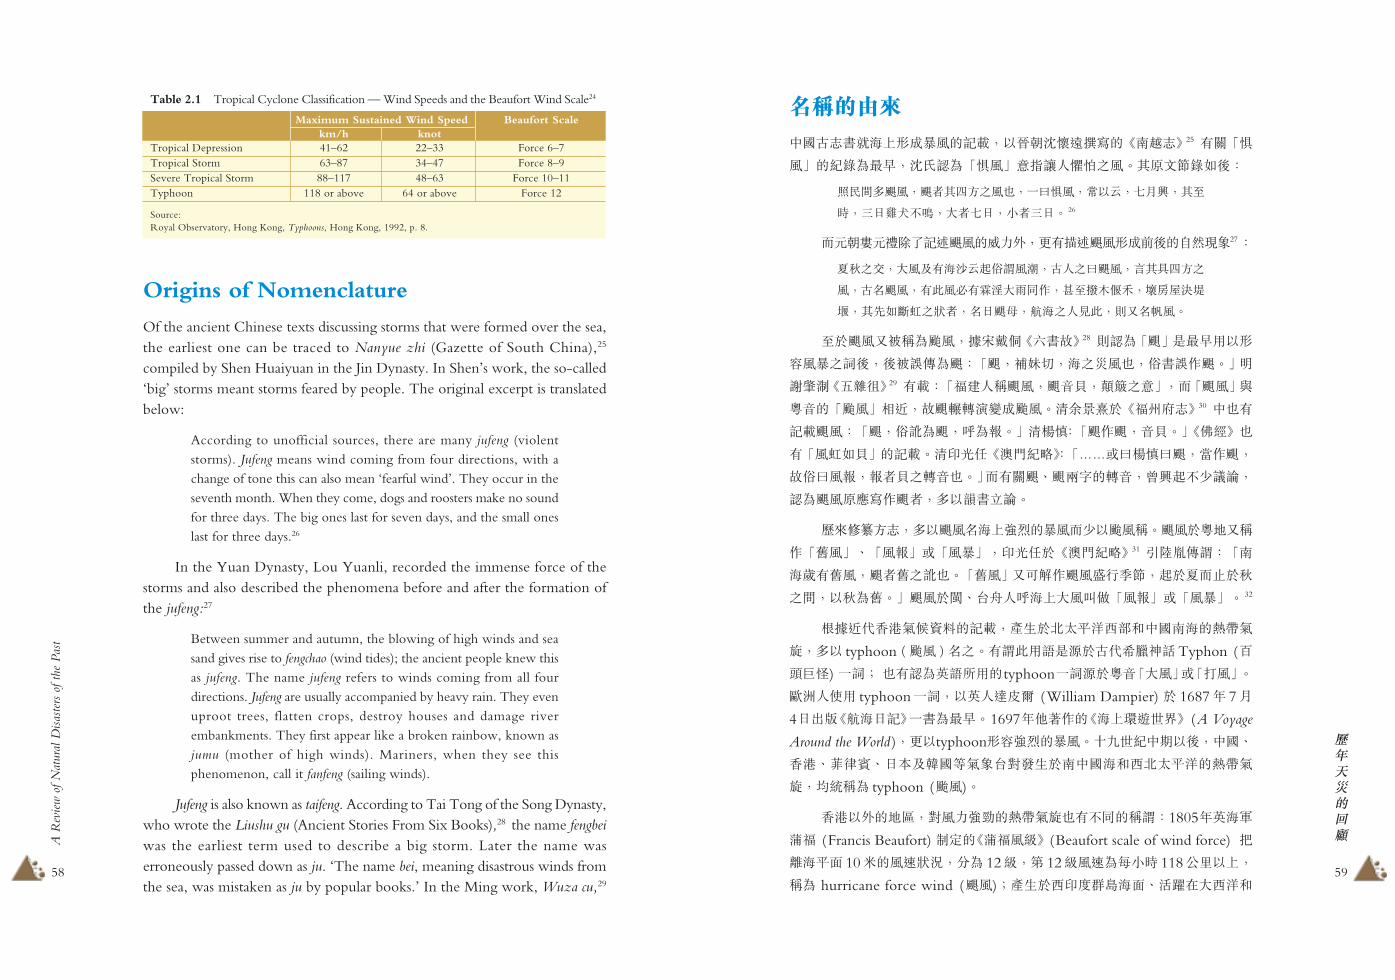
¤ 2.2ÿ1874# 9� 22J¢'(de©Ä'+§FA3éÝ(deUª%¬8¼3«+2,000>à~®¯a,®¯°°0±²³blbª´DÑy�µ¶(Õä> ·¸¹º�»«
Fig. 2.2 One of the strongest typhoons in historystruck Hong Kong on 22 September 1874, causingthe loss of more than 2,000 lives. This postcardshows the vessel Pacific Mail SS Alaska and aChinese junk blown ashore by the ravaging typhoon.Courtesy Dr Tong Cheuk-man
Fig. 2.3 A typhoon struck on 18 September 1906,causing the loss of more than 15,000 lives, wreckingships and inflicting widespread damage to property.The photograph shows Victoria Harbour and thewaterfront. Courtesy Hong Kong Museum of History
¤ 2.3ÿ1906# 9� 18J(de¼S 15,0008¬%0�b½©z¾÷¼>¤®hvm@¿Ð'ÀÁÂÃ> &'¯§¨©ªª«
69
A R
evie
w o
f Nat
ural
Disa
ster
s of
the
Pas
t
68
!"#$%&'
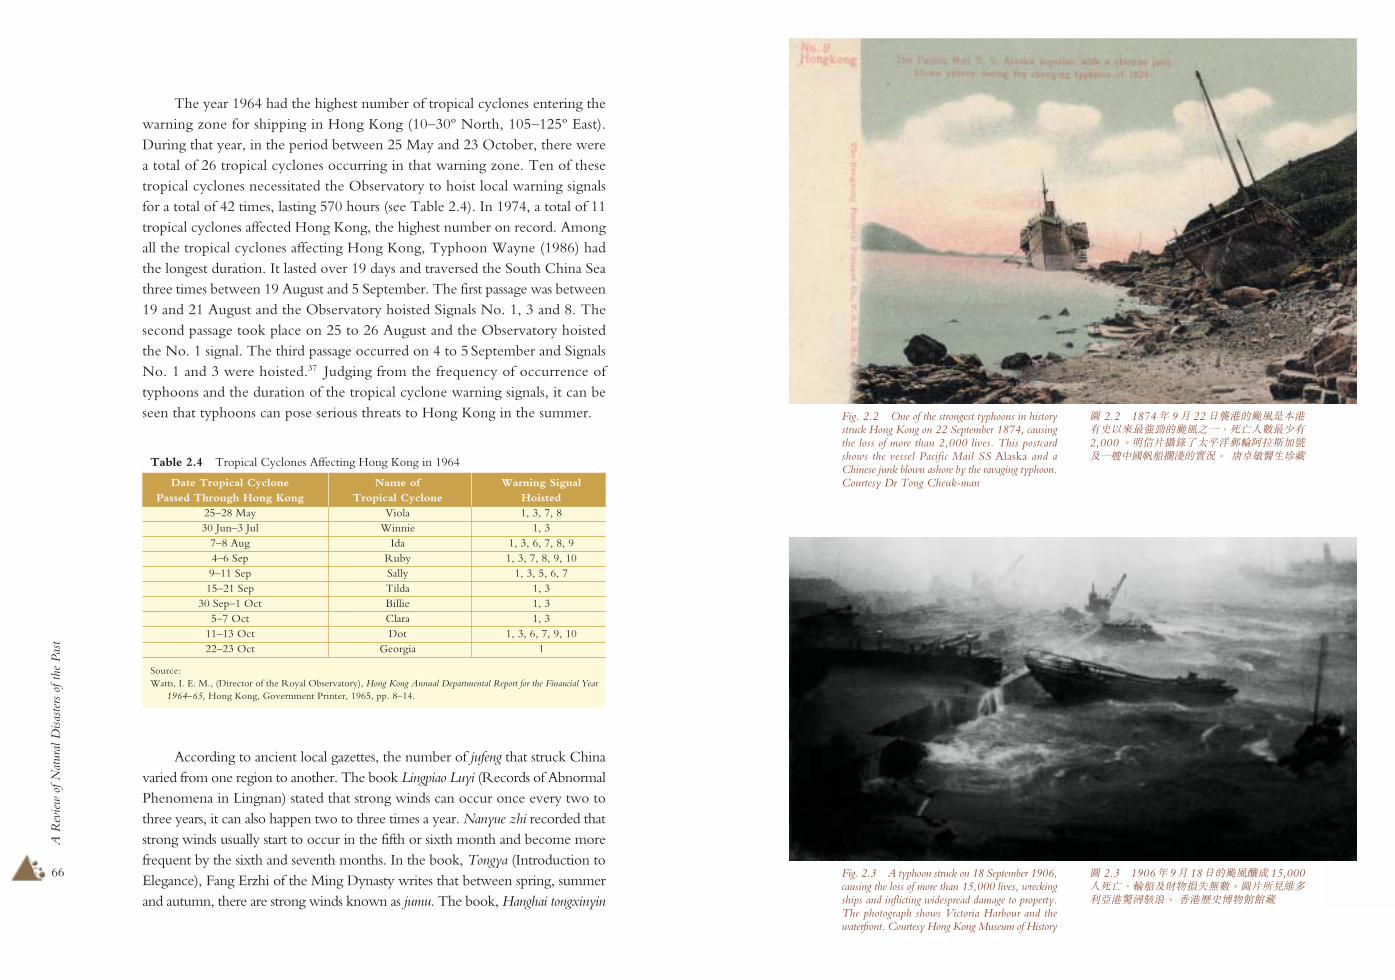
Fig. 2.5 A typhoon struck in September 1937,causing the loss of more than 11,000 lives. TheKowloon – Canton Railway track at Sha Tin wasdamaged during the typhoon. Courtesy Hong KongSAR Public Records Office
¤ 2.5ÿ1937# 9�(de¼S 11,0008¬>¤sÄÚÅÆZǪÈzde¡�ÉÊ7ä>&'5ö·~Ù¯§Ë̪ª«
Fig. 2.6 Hillier Street looking south from near WingLok Street after the typhoon in September 1937.Courtesy Hong Kong SAR Public Records Office
¤ 2.6ÿÍ¿ÎF²�ÏÐΪÈC1937#9�de¢'>(Õä>&'5ö·~Ù¯§Ë̪ª«
(A Directory for Navigation and Windstorms), states that big sea storms couldappear at any time, but mainly in summer and autumn. These indicate that whileancient records do not have a consensus on the annual frequency of storms, theybasically concur that storms are more active in the summer and autumn.
Deadliest TyphoonsSince its establishment in 1884, the Hong Kong Observatory has been recordingthe maximum hourly mean wind speed of the tropical cyclones affecting HongKong. From 1911 onwards, it also recorded the speeds of the hourly maximumgust. The Observatory added the No. 10 signal to the warning signal systemin 1931 to promote public awareness of typhoons. The following is a recordof the deadliest typhoons that struck Hong Kong from 1884 to 2002. In theperiod of 1884 to 1911, tropical cyclones with a maximum hourly mean windspeed exceeding 118 km/h (64 knots) were selected. For the period of 1911to 1930, those with the hourly maximum gust reaching 220 km/h (120 knots)or above were selected. From 1930 to 2002, tropical cyclones requiring thehoisting of No. 10 warning signal were chosen. In total, 21 typhoons38 (seeTable 2.5) were selected from 1884 to 2002. On average, there was one intensetyphoon hitting Hong Kong every 5.7 years.
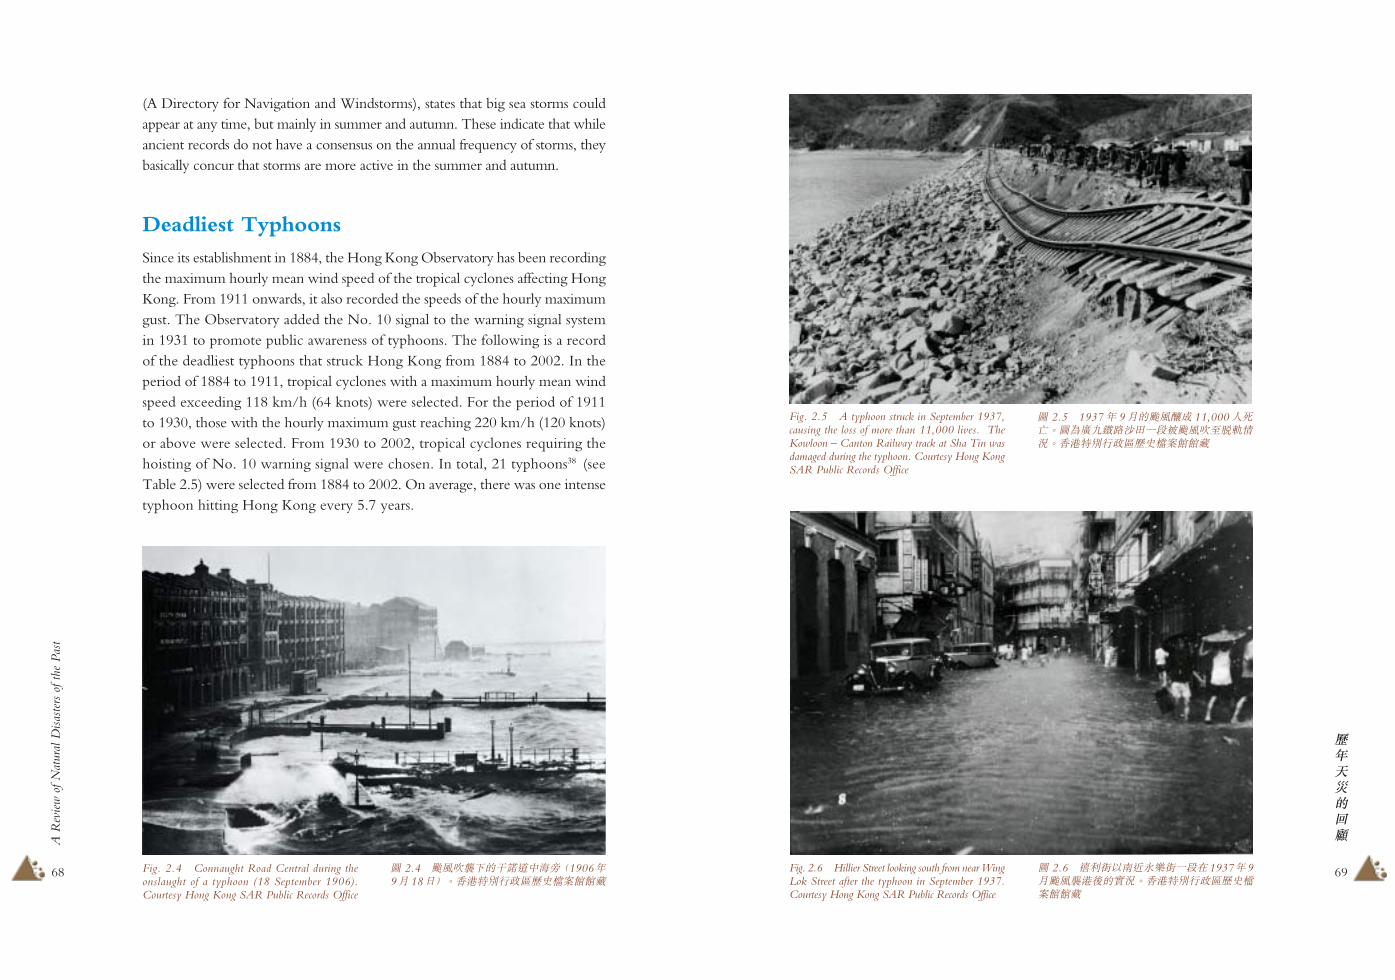
Fig. 2.4 Connaught Road Central during theonslaught of a typhoon (18 September 1906).Courtesy Hong Kong SAR Public Records Office
¤ 2.4ÿde¡¢ (ÑÒÓD³ÔÕ1906#9� 18JÖ>&'5ö·~Ù¯§Ë̪ª«

71
A R
evie
w o
f Nat
ural
Disa
ster
s of
the
Pas
t
70
!"#$%&'
# 2.5ÿ3éÝ(de2a (1884–2002#)?2QR×Y2a(eã
!"23 =>DEFGHINK =>OKP"NK Q/0 $%R"
ST UV
$%"( (1. /
(1./ /0)
?@ W0 ?@ W0 /0)
Ø 1896# 8� 8� 10J Ø Ø Ø 69 Ø
Ø 1906# 9� 18� 29J Ø Ø Ø 50 Ø
Ø 1923# 8� 17� 22J 95NH 56ñ Ø Ø 67 113
Ø 1927# 8� 19� 20J Ø Ø Ø 53 101
Ø 1929# 8� 21� 22J 28NH 15ñ Ø Ø 57 102
Ø 1931# 7� 31� 8� 2J Ø Ø Ø 60 118
Ø 1936# 8� 16� 17J 34NH 38ñ Ø Ø 62 115
Ø 1937# 9� 1� 2J 34NH 9ñ 1937# 9� 2J Ø 59 130
Ø 1946# 7� 16� 19J 53NH 50ñ 1946# 7� 18J 4NH 45ñ Ø 95
ÙQvÐ 1957# 9� 21� 23J 60NH 55ñ 1957# 9� 22J 7NH 55ñ 59 101
Úx 1960# 6� 4� 9J 127NH 25ñ 1960# 6� 9J 9NH 10ñ 50 103
Ûx³ 1961# 5� 18� 20J 34NH 1961# 5� 19J 2NH 30ñ 43 89
Üs 1962# 8� 30� 9� 2J 53NH 1962# 9� 1J 8NH 68 140
tð 1964# 9� 4� 6J 42NH 35ñ 1964# 9� 5J 3NH 55ñ 58 122
sz 1964# 10� 10� 13J 79NH 10ñ 1964# 10� 13J 8NH 15ñ 46 94
Ýx 1968# 8� 20� 22J 54NH 1968# 8� 21J 7NH 35ñ 34 72
tÞ 1971# 8� 13� 17J 67NH 1971# 8� 16� 17J 5NH 50ñ 53 121
Ûß 1975# 10� 12� 15J 51NH 15ñ 1975# 10� 14J 2NH 50ñ 31 76
à� 1979# 8� 1� 3J 38NH 1979# 8� 2J 3NH 45ñ 38 94
Ûá 1983# 9� 7� 10J 64NH 20ñ 1983# 9� 9J 8NH 46 100
çP 1999# 9� 13� 17J 86NH 1999# 9� 16J 11NH 33 74
��Aøù&'2QR%üªÚÚÚ�µ¥¶ý%&'% 2000#%þ 72–73>Chin, P. C., Tropical Cyclone Climatology for the China Seas and Western Pacific from 1884 to 1970, Hong Kong:
Royal Observatory, 1972, pp. 169, 174–175, 178, 182, 186, 190, 200.Heywood, G. S. P., Hong Kong Typhoons, Hong Kong: Noronha & Co. Ltd., 1950, pp. 8–9, 12–13, 19–20.Starbuck, L., A Statistical Survey of Typhoons and Tropical Depression in the Western Pacific and China Sea Area from
Observations and Tracks Recorded at the Royal Observatory Hong Kong from 1884 to 1947, Hong Kong: NoronhaCo. Ltd., 1951, pp. 4–6.
âá¢'( 21'deD%F 1960#(ÚxJK&'(H�3-%Î 127
NH 25ñÒ�ijÙleG3�B%ws 1999#(çP%Uì 11NH>�ã
�ädeCW¸vÄ'(S�H��§->
Sources:Chin, P. C., Tropical Cyclone Climatology for the China Seas and Western Pacific from 1884 to 1970, Hong Kong,
Royal Observatory, 1972, pp. 169, 174–175, 178, 182, 186, 190, 200.Heywood, G. S. P., Hong Kong Typhoons, Hong Kong, Noronha & Co. Ltd, 1950, pp. 8–9, 12–13, 19–20.Hong Kong Observatory, Tropical Cyclones in 1999, Hong Kong, 2000, pp. 72–73.Starbuck, L., A Statistical Survey of Typhoons and Tropical Depressions in the Western Pacific and China Sea Area From
Observations and Tracks Recorded at the Royal Observatory Hong Kong From 1884 to 1947, Hong Kong, Noronha& Co. Ltd, 1951, pp. 4–6.
Of the 21 typhoons listed above, the one that had warning signals hoistedfor the longest period (127 hours 25 minutes) was Typhoon Mary in 1960.The typhoon that resulted in the longest duration of 11 hours for the No. 10signal was Typhoon York in 1999. One can appreciate from these figures thattyphoons pose a threat to Hong Kong for long durations in the summer.
Table 2.5 Deadliest Typhoons (1884–2002): Wind Speeds as Recorded at the HongKong Observatory Headquarters
Name of Hoisting of Tropical Hoisting of Tropical Mean MaximumTyphoon Cyclone Warning Signal Cyclone Signal No. 10 Maximum Gust
Hourly (knot)WindSpeed
Date Duration Date Duration (knot)– 8–10 Aug 1896 – – – 69 –
– 18–29 Sep 1906 – – – 50 –
– 17–22 Aug 1923 95 hr 56 min – – 67 113
– 19–20 Aug 1927 – – – 53 101
– 21–22 Aug 1929 28 hr 15 min – – 57 102
– 31 Jul–2 Aug 1931 – – – 60 118
– 16–17 Aug 1936 34 hr 38 min – – 62 115
– 1–2 Sep 1937 34 hr 9 min 2 Sep 1937 – 59 130
– 16–19 Jul 1946 53 hr 50 min 18 Jul 1946 4 hr 45 min – 95
Gloria 21–23 Sep 1957 60 hr 55 min 22 Sep 1957 7 hr 55 min 59 101
Mary 4–9 Jun 1960 127 hr 25 min 9 Jun 1960 9 hr 10 min 50 103
Alice 18–20 May 1961 34 hr 19 May 1961 2 hr 30 min 43 89
Wanda 30 Aug–2 Sep 1962 53 hr 1 Sep 1962 8 hr 68 140
Ruby 4–6 Sep 1964 42 hr 35 min 5 Sep 1964 3 hr 55 min 58 122
Dot 10–13 Oct 1964 79 hr 10 min 13 Oct 1964 8 hr 15 min 46 94
Shirley 20–22 Aug 1968 54 hr 21 Aug 1968 7 hr 35 min 34 72
Rose 13–17 Aug 1971 67 hr 16–17 Aug 1971 5 hr 50 min 53 121
Elsie 12–15 Oct 1975 51 hr 15 min 14 Oct 1975 2 hr 50 min 31 76
Hope 1–3 Aug 1979 38 hr 2 Aug 1979 3 hr 45 min 38 94
Ellen 7–10 Sep 1983 64 hr 20 min 9 Sep 1983 8 hr 46 100
York 13–17 Sep 1999 86 hr 16 Sep 1999 11 hr 33 74

73
A R
evie
w o
f Nat
ural
Disa
ster
s of
the
Pas
t
72
!"#$%&'
Fig. 2.9 Sha Tin was the most affected area,with 150 people killed, 100 injured and 100missing during the 1962 onslaught of TyphoonWanda. Streets and houses were flooded anddestroyed. Boats were used to ferry families andtheir possessions. Courtesy Hong Kong SARInformation Services Department
¤ 2.9ÿ1962#deÜsvZÇySá;:j%§D+1508¬_1008I?b1008¾å>klÆÓÆæs�e^çè%N�z£péêë�bìÞ½©>&'5ö·~Ù~�WíîËÌ
Fig. 2.7 From 30 August to 2 September 1962,Typhoon Wanda caused 183 deaths, 388 injuriesand 108 were missing. This photograph showsCentral after the devastation. Courtesy Hong KongSAR Information Services Department
¤ 2.7ÿ1962#8�30J�9�2J(Üse4yS1838¬%388I?b1088¾ï%¤sDÙPde¥'>(�¦>&'5ö·~Ù~�WíîËÌ
Fig. 2.8 The passage of the No.10-signal TyphoonYork in 1999 had not posed serious threat, as seenin Tsim Sha Tsui where youngsters were bicyclingin the rain for fun.
¤ 2.8 1999#¢'(deçP%ÙleGùV+vð�yS®;S�>¤D(ñ«#Ce�DFò!óoô(7�%�vªõ>
75
A R
evie
w o
f Nat
ural
Disa
ster
s of
the
Pas
t
74
!"#$%&'
"XYZ[4\]
^_`a
}��hÞ% 1884#FG(e4F 1867#_ 1870#b 1874#3s�2 39
88<© 1874#%ö¥÷ì¬8¼Î 2,000@8%�+� 1867#b 1870#
(7ä(2an�§øùÀúû%|Ä÷�äÓü¨ïe4(`@7ä>C1884
#� 2002#E�%bËHÑÙlAe~l'e�"#~lUdehyS(8º
?7ä;0=ö÷ 2.6>
Toll
Human Casualties
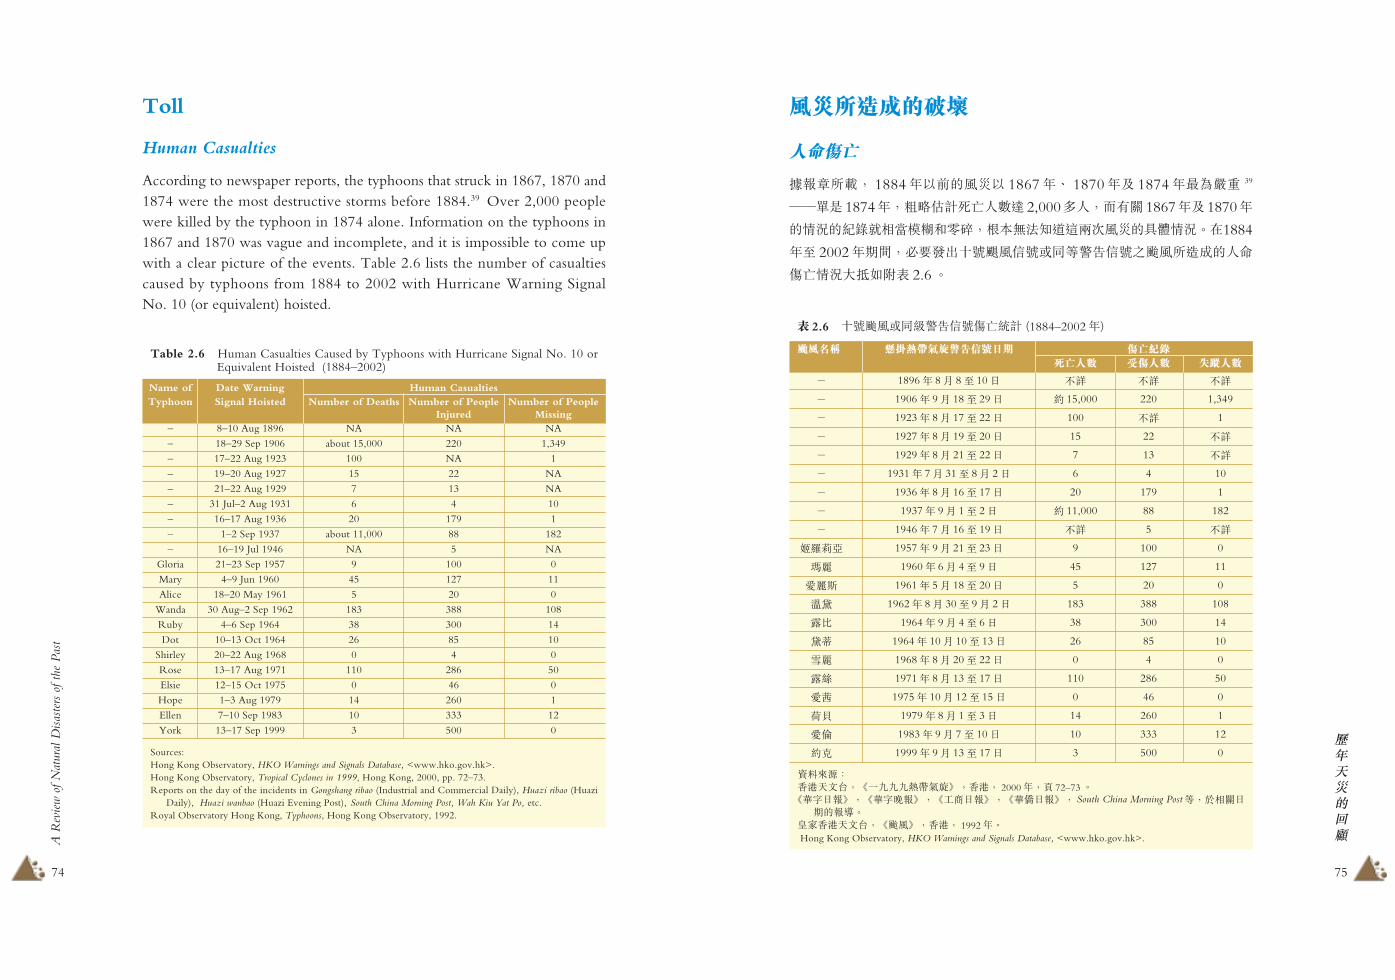
According to newspaper reports, the typhoons that struck in 1867, 1870 and1874 were the most destructive storms before 1884.39 Over 2,000 peoplewere killed by the typhoon in 1874 alone. Information on the typhoons in1867 and 1870 was vague and incomplete, and it is impossible to come upwith a clear picture of the events. Table 2.6 lists the number of casualtiescaused by typhoons from 1884 to 2002 with Hurricane Warning SignalNo. 10 (or equivalent) hoisted.
Table 2.6 Human Casualties Caused by Typhoons with Hurricane Signal No. 10 orEquivalent Hoisted (1884–2002)
Name of Date Warning Human CasualtiesTyphoon Signal Hoisted Number of Deaths Number of People Number of People
Injured Missing– 8–10 Aug 1896 NA NA NA
– 18–29 Sep 1906 about 15,000 220 1,349
– 17–22 Aug 1923 100 NA 1
– 19–20 Aug 1927 15 22 NA
– 21–22 Aug 1929 7 13 NA
– 31 Jul–2 Aug 1931 6 4 10
– 16–17 Aug 1936 20 179 1
– 1–2 Sep 1937 about 11,000 88 182
– 16–19 Jul 1946 NA 5 NA
Gloria 21–23 Sep 1957 9 100 0
Mary 4–9 Jun 1960 45 127 11
Alice 18–20 May 1961 5 20 0
Wanda 30 Aug–2 Sep 1962 183 388 108
Ruby 4–6 Sep 1964 38 300 14
Dot 10–13 Oct 1964 26 85 10
Shirley 20–22 Aug 1968 0 4 0
Rose 13–17 Aug 1971 110 286 50
Elsie 12–15 Oct 1975 0 46 0
Hope 1–3 Aug 1979 14 260 1
Ellen 7–10 Sep 1983 10 333 12
York 13–17 Sep 1999 3 500 0
Sources:Hong Kong Observatory, HKO Warnings and Signals Database, <www.hko.gov.hk>.Hong Kong Observatory, Tropical Cyclones in 1999, Hong Kong, 2000, pp. 72–73.Reports on the day of the incidents in Gongshang ribao (Industrial and Commercial Daily), Huazi ribao (Huazi
Daily), Huazi wanbao (Huazi Evening Post), South China Morning Post, Wah Kiu Yat Po, etc.Royal Observatory Hong Kong, Typhoons, Hong Kong Observatory, 1992.
# 2.6ÿÙlde'eó"#~l?lì (1884–2002#)
!"23 =>DEFGHINK?@ `aUVba^c d`^c ef^c
Ø 1896# 8� 8� 10J ¾ý ¾ý ¾ý
Ø 1906# 9� 18� 29J ç 15,000 220 1,349
Ø 1923# 8� 17� 22J 100 ¾ý 1
Ø 1927# 8� 19� 20J 15 22 ¾ý
Ø 1929# 8� 21� 22J 7 13 ¾ý
Ø 1931# 7� 31� 8� 2J 6 4 10
Ø 1936# 8� 16� 17J 20 179 1
Ø 1937# 9� 1� 2J ç 11,000 88 182
Ø 1946# 7� 16� 19J ¾ý 5 ¾ý
ÙQvÐ 1957# 9� 21� 23J 9 100 0
Úx 1960# 6� 4� 9J 45 127 11
Ûx³ 1961# 5� 18� 20J 5 20 0
Üs 1962# 8� 30� 9� 2J 183 388 108
tð 1964# 9� 4� 6J 38 300 14
sz 1964# 10� 10� 13J 26 85 10
Ýx 1968# 8� 20� 22J 0 4 0
tÞ 1971# 8� 13� 17J 110 286 50
Ûß 1975# 10� 12� 15J 0 46 0
à� 1979# 8� 1� 3J 14 260 1
Ûá 1983# 9� 7� 10J 10 333 12
çP 1999# 9� 13� 17J 3 500 0
��Aø?&'2QR%üªÚÚÚ�µ¥¶ý%&'% 2000#%þ 72–73>üþ©J�ý%üþ©ÿ�ý%ü!"J�ý%üþ#J�ý% South China Morning Post�%P��J
E(��>úû&'2QR%üdeý%&'% 1992#> Hong Kong Observatory, HKO Warnings and Signals Database, <www.hko.gov.hk>.

77
A R
evie
w o
f Nat
ural
Disa
ster
s of
the
Pas
t
76
!"#$%&'
Fig. 2.11 Typhoon victims that were not claimedwere wrapped with straw mats and given sea burials(September 1906). Courtesy Dr Tong Cheuk-man
¤ 2.11 de>÷85$(%&%£'()*>%+F³,Õ1906# 9�Ö>·¸¹º�»«
Fig. 2.12 Rescuers digging through the rubble(1930). Courtesy Dr Tong Cheuk-man
¤ 2.12 ê-.pÑ3>/êÕ1930#Ö>·¸¹º�»«
In terms of casualties, the typhoons in 1906 and 1937 caused the highestdeath toll. Over 10,000 people were killed in each incident. The casualtiesdue to the typhoon in 1906 were tremendous. The number of fatalities reached5% of the 320,000-strong population in Hong Kong at that time. In 1937, atyphoon resulted in 11,000 deaths, which accounted for about 1% of apopulation of 1,000,000. When compared with these two, Typhoon Wanda,which killed 183 people in 1962, can only claim third place. This clearlyshows the destruction being inflicted on Hong Kong by typhoons in the firsthalf of the twentieth century. These three deadliest typhoons have one thingin common, which is the abnormal rise in sea level caused by the typhoon —a phenomenon called storm surge — drowning a lot of people living alongthe coast. In view of the dire consequences of storm surges, the Observatory
Fig. 2.10 Workers collected the typhoon victimsthat lay around after the passage of the typhoon(September 1906). Courtesy Dr Tong Cheuk-man
¤ 2.10 de¥>%%�01Õ1906# 9�Ö>·¸¹º�»«
79
A R
evie
w o
f Nat
ural
Disa
ster
s of
the
Pas
t
78
!"#$%&'
»?¼©A�% 1906#Æ 1937#(de©¯#A8ºz¾3�2(e
4%<©¬8¼�2¥ª3@%ÔDxF 1906#(?3s42%¬8¼
5e#6'323×87(ÅñU�%I?b¾å8¼�@Ò1937#6'×87
ç+ªÅ3%©#(e48+ª3ª8@(¬8¼%ç5e#6'×87(Å
ñUªÒ1962#yS1838¬(Üse4%×69ëåI%�vdeC�Ù×
2ÅèEv&'(:já;>üIï?8¼3@(e4+ªU�:%n©Oe
�h³[(�D�;(^<88={e�^88>Ø?ë�'@�4zç¬>+
AP:%2QRC 1970#$>E³"B]e�^C�!`%<=CDe�^(
67> 1970#$>E&'(ëEÕFEG%ë�(He6I<�%dev&'
wx(S�àZJ«?1975� 2002#( 27#�%ò'b}ijÙlAe~l
(deÛß_à�_ÛáÀçP¼S(¬8¼Uì+278%yS¬(ÊË;
9=KL_z2©MD�%�©ª9�FN=(6T> 1999#(e4¬8¼
©U;;J$� 38>
ghij
=O4"ªPñQyS?(;9%RxH¤C1906b1937#(¨ïdeD(S
jB@s@�> 1906#(e4D%U+ 2,983´@�À 670´-°0�TV> 40
|}§HÏþºUö¥÷ì%�¾(�VçW8.13'O%41 ¬jB+ÚSs<
Å8>42 1937#w+1,855´@�À28´-°0�TV%OPSXB(%@@
CYÆ'³áH¤%�v9�Zz�e¡¢�[\B5M;ð]ÒüÆ4E@�
F�sû_^bÅ?_N`=ÔA(e�+�%@�M�¾^�eab[%L3
ѳcde�%F�,1;³>
1962#Üse4E�%RZÇÙzç¬B2¥1508T%z¡f(@�8
+ 2,053´_-°0�Î 36´>Üse4F>%�Zz¡f(¼�ªgm�C
300@´hi?1964#tðe4¡f,314´@�_-°0�20´Ò1971#t
Þ¡¢-°0� jl% 88a�k6YC³ÅSj%©#z¡f(@�+ 303
´_-°0�Î35´Ò1979#8�(à�¡f,374´@�_-°0�29´Ò
1983# 9�deÛáÍ 360´@�À 44´-°0�zf>�vdev'7(�
ZySá;(z¾Ò7äË 1990#$Û+hEG (lôõö÷ 2.7)>
introduced a computerised objective forecasting tool in the late 1970s toenhance its capability to forecast this terrible phenomenon. From the latterpart of the 1970s onwards, both the living conditions and the public’s awarenessof destructive typhoons have improved in Hong Kong, and the threat posedby typhoons has been reduced significantly. In the 27 years between 1975 and2002, the four typhoons that required the hoisting of Hurricane WarningSignal No. 10 — Elsie, Hope, Ellen and York — caused a combined deathtoll of 27. The deaths were mainly due to avoidable accidents includingelectrocution, or being hit by falling objects. For Typhoon York in 1999, thedeath toll dropped significantly to three.
Destruction and Damage of Vessels
Further investigations of the causes of deaths and injuries revealed that victimsof the 1906 and 1937 typhoons were mostly fishermen. In the 1906 typhoon,2,983 fishing boats and 670 ocean-going vessels were lost.40 According to theestimates made by Tung Wah Hospital, boats and ships with a combinedvalue of HK$81,00041 were reported missing and 90% of the casualties wereboat people.42 In the 1937 typhoon, 1,855 fishing boats and 28 ocean-goingships capsized. Most of the corpses were found around the piers or at sea, andthe majority of the victims were drowned when their boats or ships were hitby the storm. This was related to the fact that most of the fishermen wereliving in their boats at that time. They could not get onshore in time to seekshelters from the unexpected strong winds and heavy rain. Some fishermenwere not aware of the impending storm and set sail, eventually losing theirlives at sea.
In 1962, when Typhoon Wanda struck, apart from drowning 150 peoplein the Sha Tin area, 2,053 fishing boats and 36 ocean-going vessels were alsodestroyed. Typhoons since then have generally taken a toll of about 300 shipsper typhoon. In 1964, Typhoon Ruby destroyed or damaged 314 fishing boatsand 20 ocean-sailing vessels. In 1971, a total of 303 fishing boats and 35 ocean-going vessels were either destroyed or damaged by Typhoon Rose, includingthe capsizing of the Hong Kong–Macau ferry Fat Shan which killed 88 sailors.In August 1979, Typhoon Hope damaged and destroyed 374 fishing boats and29 sea-faring ships. In September 1983, 360 fishing boats and 44 ocean-goingvessels were damaged or destroyed during the passage of Typhoon Ellen. Asshown in Table 2.7, typhoons have long wreaked havoc on ships and boats inthe harbour and the situation only started to improve in the 1990s.

81
A R
evie
w o
f Nat
ural
Disa
ster
s of
the
Pas
t
80
!"#$%&'
# 2.7ÿ�Zzflì (1884–2002#)
!"23 =>DEFGHINK?@ klmg ng op
Ø 1896# 8� 8� 10J 6 7 13
Ø 1906# 9� 18� 29J 670 2983 3653
Ø 1923# 8� 17� 22J 11 10 21
Ø 1927# 8� 19� 20J 2 9 11
Ø 1929# 8� 21� 22J 3 11 14
Ø 1931# 7� 31� 8� 2J 3 1 4
Ø 1936# 8� 16� 17J 22 ç 40´ ç 60m´
Ø 1937# 9� 1� 2J 28 1855 1883
Ø 1946# 7� 16� 19J 2 2 4
ÙQvÐ 1957# 9� 21� 23J 3 3 6
Úx 1960# 6� 4� 9J 6 814 820
Ûx³ 1961# 5� 18� 20J 1 9 10
Üs 1962# 8� 30� 9� 2J 36 2053 2089
tð 1964# 9� 4� 6J 20 314 334
sz 1964# 10� 10� 13J 2 90 92
Ýx 1968# 8� 20� 22J 4 26 30
tÞ 1971# 8� 13� 17J 35 303 338
Ûß 1975# 10� 12� 15J 7 3 10
à� 1979# 8� 1� 3J 29 374 403
Ûá 1983# 9� 7� 10J 44 360 404
çP 1999# 9� 13� 17J 1 @´ @´
��Aø?ü!"J�ý%üà�ý%ü½èJ�ý%üþ©J�ý%üþ#J�ý%China Mail�%P��JE
(��>&'2QR%üªÚÚÚ#�µ¥¶ý%&'% 2000#%þ 72–73>
Sources:Hong Kong Observatory, Tropical Cyclones in 1999, Hong Kong, 2000, pp. 72–73.Reports on the day of the incidents in China Mail, Gongshang ribao, Huazi ribao, Ming Pao, Sing Tao Daily, Wah
Kiu Yat Po, etc.
Table 2.7 Statistics of Destroyed and Damaged Vessels (1884–2002)
Name of Date Tropical Cyclone Ocean-going Fishing Boats TotalTyphoon Warning Signal Hoisted Vessels
– 8–10 Aug 1896 6 7 13– 18–29 Sep 1906 670 2,983 3,653– 17–22 Aug 1923 11 10 21– 19–20 Aug 1927 2 9 11– 21–22 Aug 1929 3 11 14– 31 Jul–2 Aug 1931 3 1 4– 16–17 Aug 1936 22 about 40 about 60– 1–2 Sep 1937 28 1,855 1,883– 16–19 Jul 1946 2 2 4
Gloria 21–23 Sep 1957 3 3 6Mary 4–9 Jun 1960 6 814 820Alice 18–20 May 1961 1 9 10
Wanda 30 Aug–2 Sep 1962 36 2053 2089Ruby 4–6 Sep 1964 20 314 334Dot 10–13 Oct 1964 2 90 92
Shirley 20–22 Aug 1968 4 26 30Rose 13–17 Aug 1971 35 303 338Elsie 12–15 Oct 1975 7 3 10Hope 1–3 Aug 1979 29 374 403Ellen 7–10 Sep 1983 44 360 404York 13–17 Sep 1999 1 many many
83
A R
evie
w o
f Nat
ural
Disa
ster
s of
the
Pas
t
82
!"#$%&'
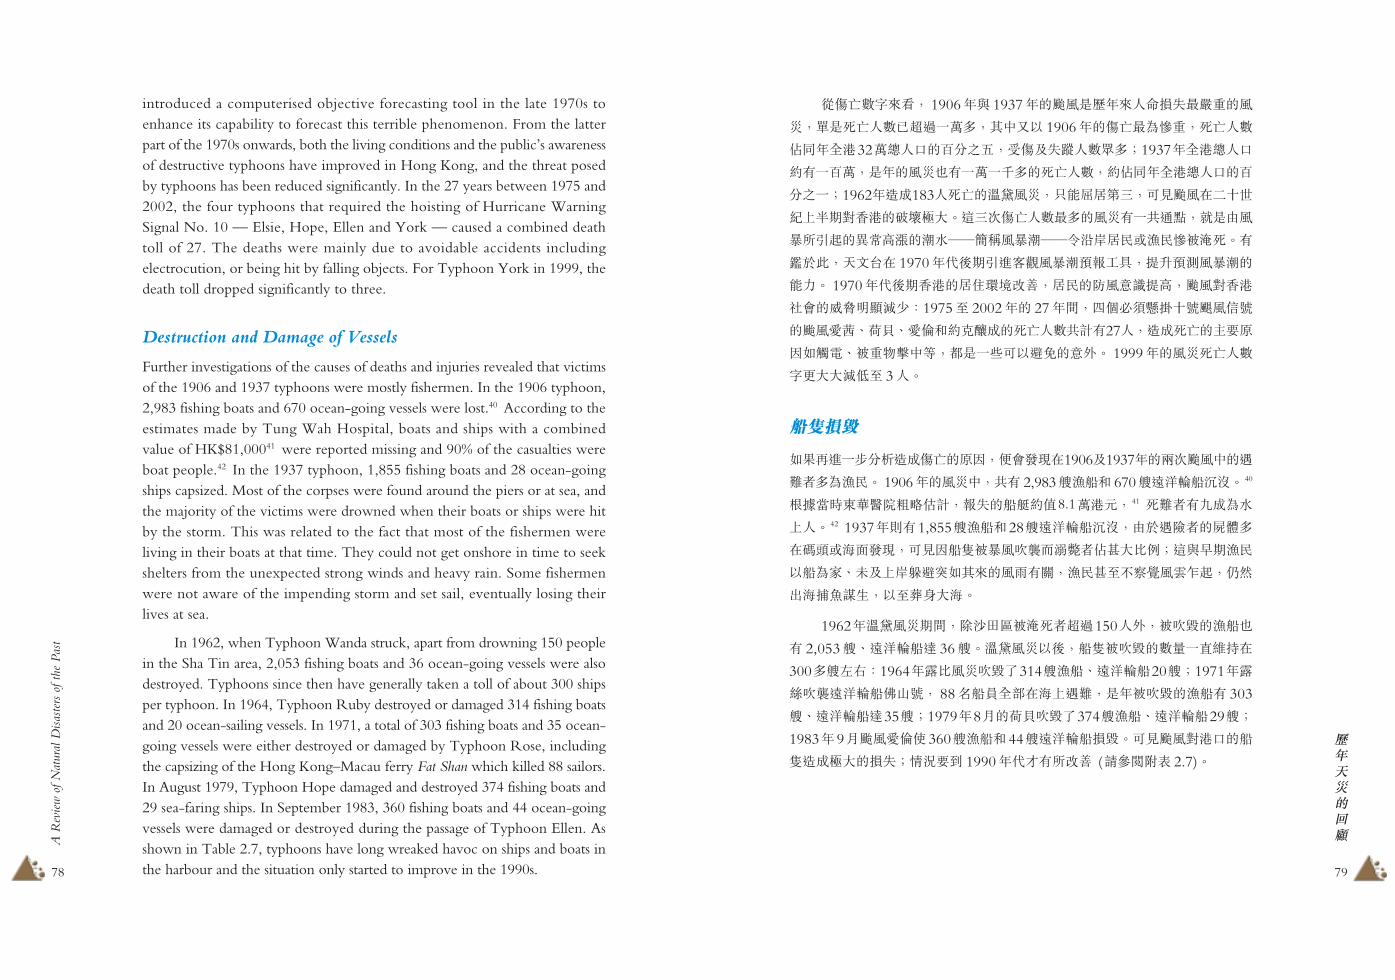
Fig. 2.13 The vessel Tai Kwong No.1 ranaground and damaged the pier (September 1937).Courtesy Hong Kong SAR Public Records Office
¤ 2.13ÿ;Änlµ¶ofYÆÕ1937#9�Ö>&'5ö·~Ù¯§Ë̪ª«
Fig. 2.15 Typhoon Clara caused the collision oftwo vessels (1981). Courtesy Hong Kong Museumof History
¤ 2.15ÿ1981#deyx�ɨ´0�oM>&'¯§¨©ªª«
Fig. 2.14 Between 7 and 10 September 1983,Typhoon Ellen caused the destruction of 360 fishingboats and 44 sea-faring vessels. Courtesy HongKong Museum of History
¤ 2.14ÿ1983# 9� 7� 10J¢'(deÛá¡f,360´@�b44´-°0�>&'¯§¨©ªª«
85
A R
evie
w o
f Nat
ural
Disa
ster
s of
the
Pas
t
84
!"#$%&'
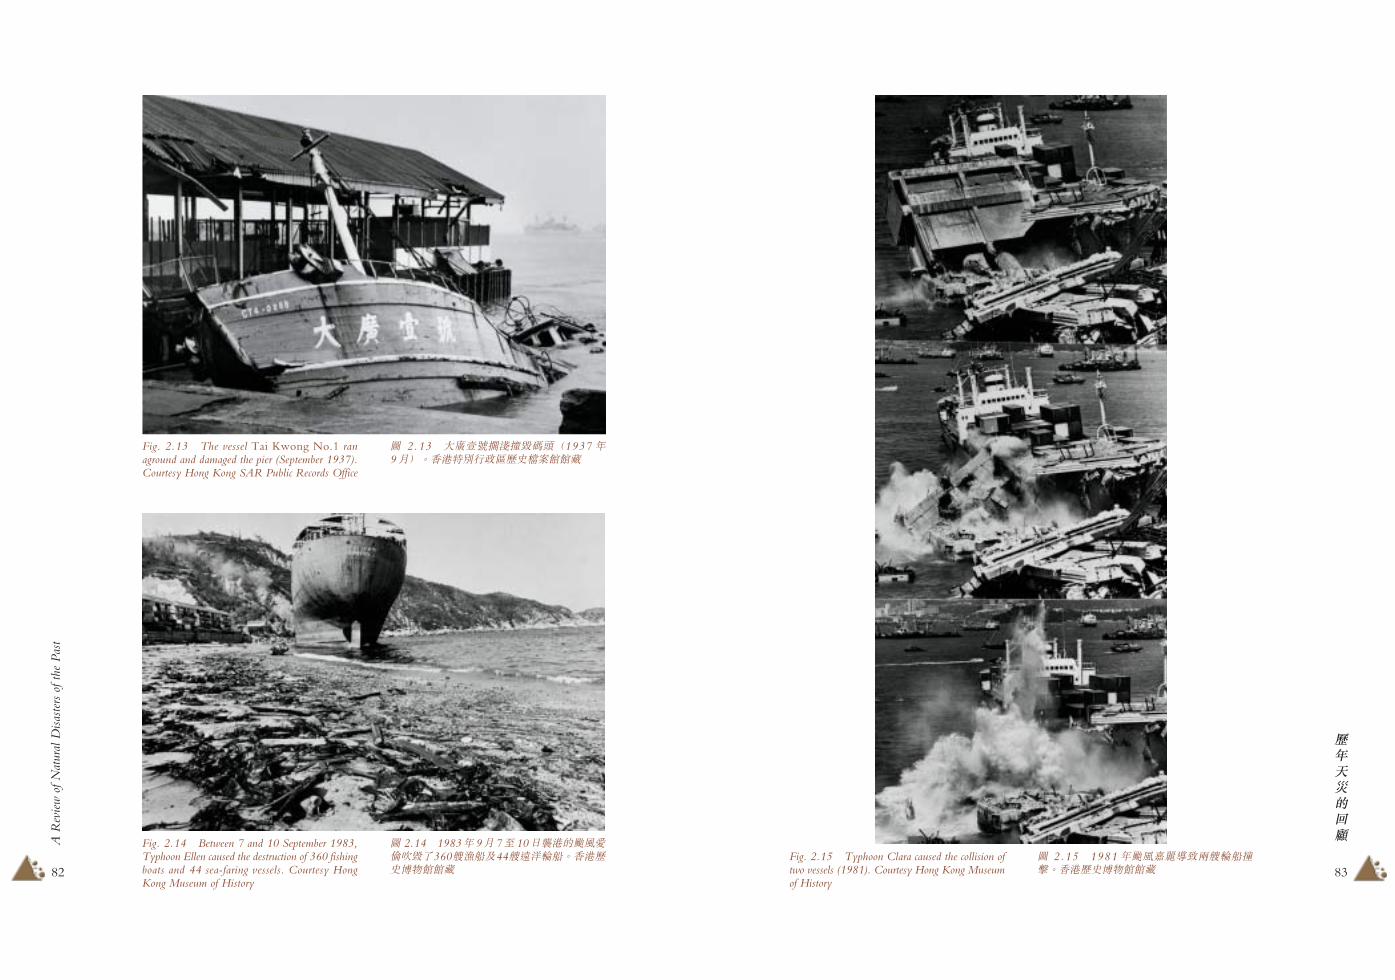
Fig. 2.19 Boat people attempted to salvagevaluables from their wrecked fishing boats(September 1962). Courtesy Hong Kong SARInformation Services Department
¤ 2.19ÿ��pqCæzzf(@�rA½©Õ1962# 9�Ö>&'5ö·~Ù~�WíîËÌ
Fig. 2.18 Soldiers and civilians worked togetherto remove a wooden boat blown ashore at the ShaTin Theatre (September 1937). Courtesy HongKong SAR Information Services Department
¤ 2.18ÿÞ�!7sªz¡ ZÇtU(g�uvÕ1937#9�Ö>&'5ö·~Ù~�WíîËÌ
Fig. 2.17 French destroyer Fronde was wreckedand brought ashore at Yau Ma Tei in Kowloon (18September 1906). Courtesy Dr Tong Cheuk-man
¤ 2.17ÿ�Ñwúxde>zf�2%µ¶PÚyz{mÕ1906# 9� 18JÖ>·¸¹º�»«
Fig. 2.16 Two steamships, Leonor and Albay,owned by Douglas Lapraik & Co. (later registered asDouglas Steamship Co.) and other sunken vessels atthe Hong Kong Central waterfront (September 1874).Courtesy Hong Kong Museum of History
¤ 2.16ÿ|}¿~�T�P��Õ>E{|}¿~0���Ö(¨´0�¿n'l_±ðÐlbÔÓ0�PDÕ³ÔIde¡¢�TVÕ1874# 9�Ö>&'¯§¨©ªª«
87
A R
evie
w o
f Nat
ural
Disa
ster
s of
the
Pas
t
86
!"#$%&'
qrst
�>�Ô�ð87��%�HG�(klJ��@> 1950� 1960#$&'(
)*��L�§�>%W¿q(ë�@Fg�'Å®��Ek%OP&'(m
¬+ 60%(áîOj�(S%;Y��ms��m%�áÅe�û���%�
á(¾�åHzde¡¢>%�ò���À%³[�ã(m÷©�Èb�È%
'����%F���;áî ¡% 43 ü9¤¦F¢£�Ƥj��¥K(
îµ='è(jÙ¦ÔàZ>è�P§�UÅ(�Hkl%¨©Å|Ä0ª¾
Ee�%9de«¢&'�³[kl¬¡(7äo3©@¾¼Òz¾F 1950
#$b 1960#$3s�2>�É;�kl¬¡(de+ 1957#(ÙQvÐÀ
1960#(Úx% , 1970#$®E7äÛ+hEG> 1950#$� 1970#$
de¡f(�Hkl�ïÜ2¥ªÅU¼%ÔDxF 1957# 9� 21J� 9�
23J¡¢(dehyS(:j3;%÷ìç+2¥ 900�glzfÒWØÏY
b¯°Ùzf±ê3;%û²zf(4�8¼2¥ 138%N<³Ù4�@Î
1,8228%´°Ù4�ç+ 1,1098> 44 +�)ÙleG(devklhyS(
:jlôõö÷ 2.8>
Fig. 2.21 Chinese boats and junks were wreckedat East Point (now Causeway Bay) during thetyphoon (September 1906). Courtesy Dr TongCheuk-man
¤ 2.21ÿϵÕ�¤H(¶·°Ö(@�æ¸de¹fÕ1906# 9�Ö>·¸¹º�»«
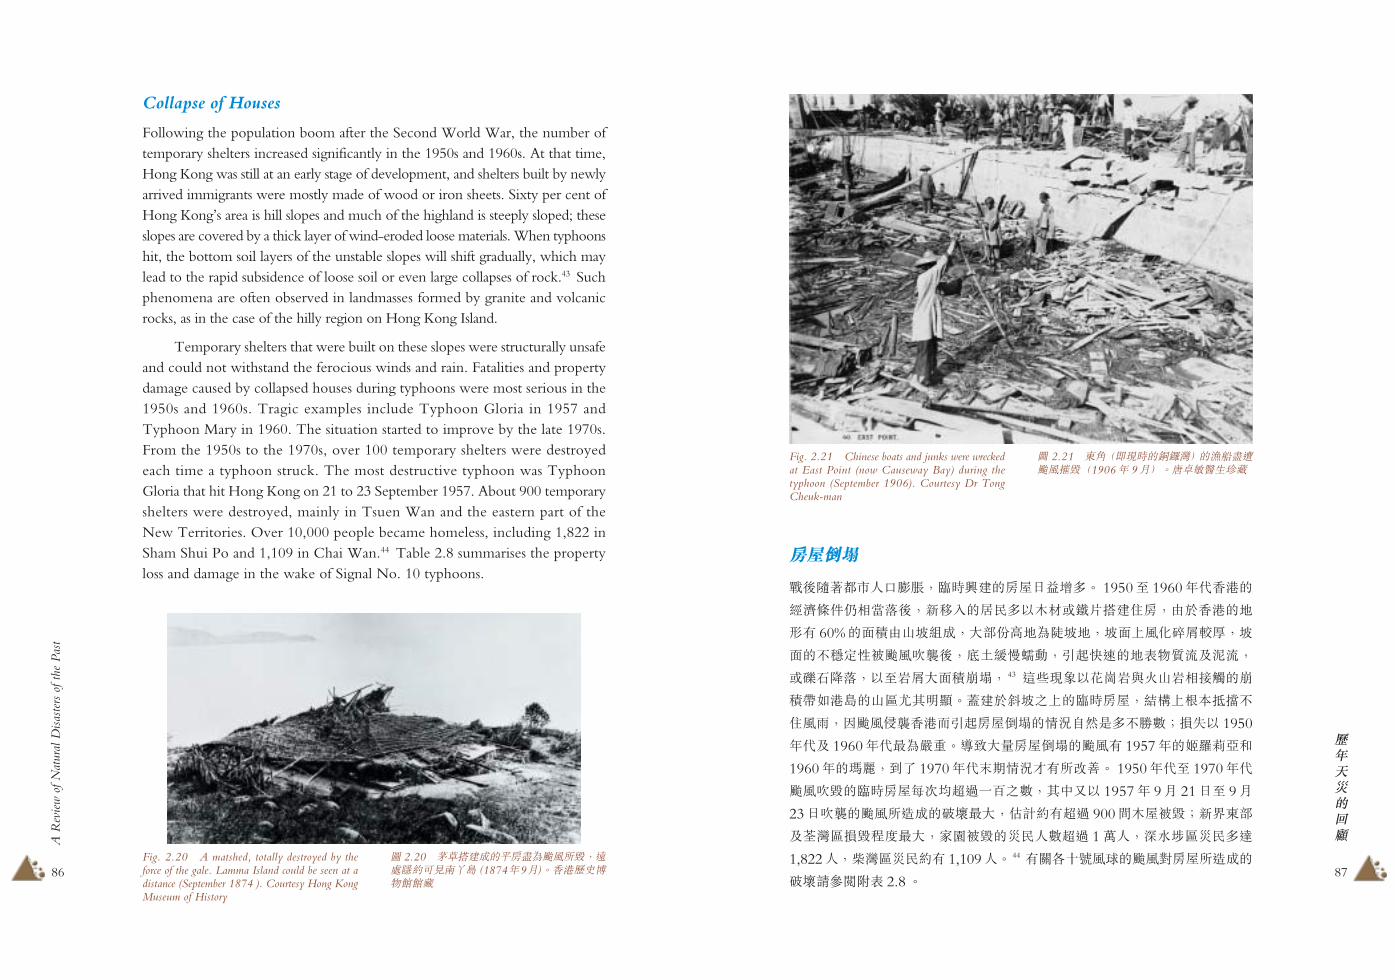
Collapse of Houses
Following the population boom after the Second World War, the number oftemporary shelters increased significantly in the 1950s and 1960s. At that time,Hong Kong was still at an early stage of development, and shelters built by newlyarrived immigrants were mostly made of wood or iron sheets. Sixty per cent ofHong Kong’s area is hill slopes and much of the highland is steeply sloped; theseslopes are covered by a thick layer of wind-eroded loose materials. When typhoonshit, the bottom soil layers of the unstable slopes will shift gradually, which maylead to the rapid subsidence of loose soil or even large collapses of rock.43 Suchphenomena are often observed in landmasses formed by granite and volcanicrocks, as in the case of the hilly region on Hong Kong Island.
Temporary shelters that were built on these slopes were structurally unsafeand could not withstand the ferocious winds and rain. Fatalities and propertydamage caused by collapsed houses during typhoons were most serious in the1950s and 1960s. Tragic examples include Typhoon Gloria in 1957 andTyphoon Mary in 1960. The situation started to improve by the late 1970s.From the 1950s to the 1970s, over 100 temporary shelters were destroyedeach time a typhoon struck. The most destructive typhoon was TyphoonGloria that hit Hong Kong on 21 to 23 September 1957. About 900 temporaryshelters were destroyed, mainly in Tsuen Wan and the eastern part of theNew Territories. Over 10,000 people became homeless, including 1,822 inSham Shui Po and 1,109 in Chai Wan.44 Table 2.8 summarises the propertyloss and damage in the wake of Signal No. 10 typhoons.
Fig. 2.20 A matshed, totally destroyed by theforce of the gale. Lamma Island could be seen at adistance (September 1874 ). Courtesy Hong KongMuseum of History
¤ 2.20ÿº'��S(¯kæsdehf%-î»ç�v²¼è (1874#9�)>&'¯§¨©ªª«

89
A R
evie
w o
f Nat
ural
Disa
ster
s of
the
Pas
t
88
!"#$%&'
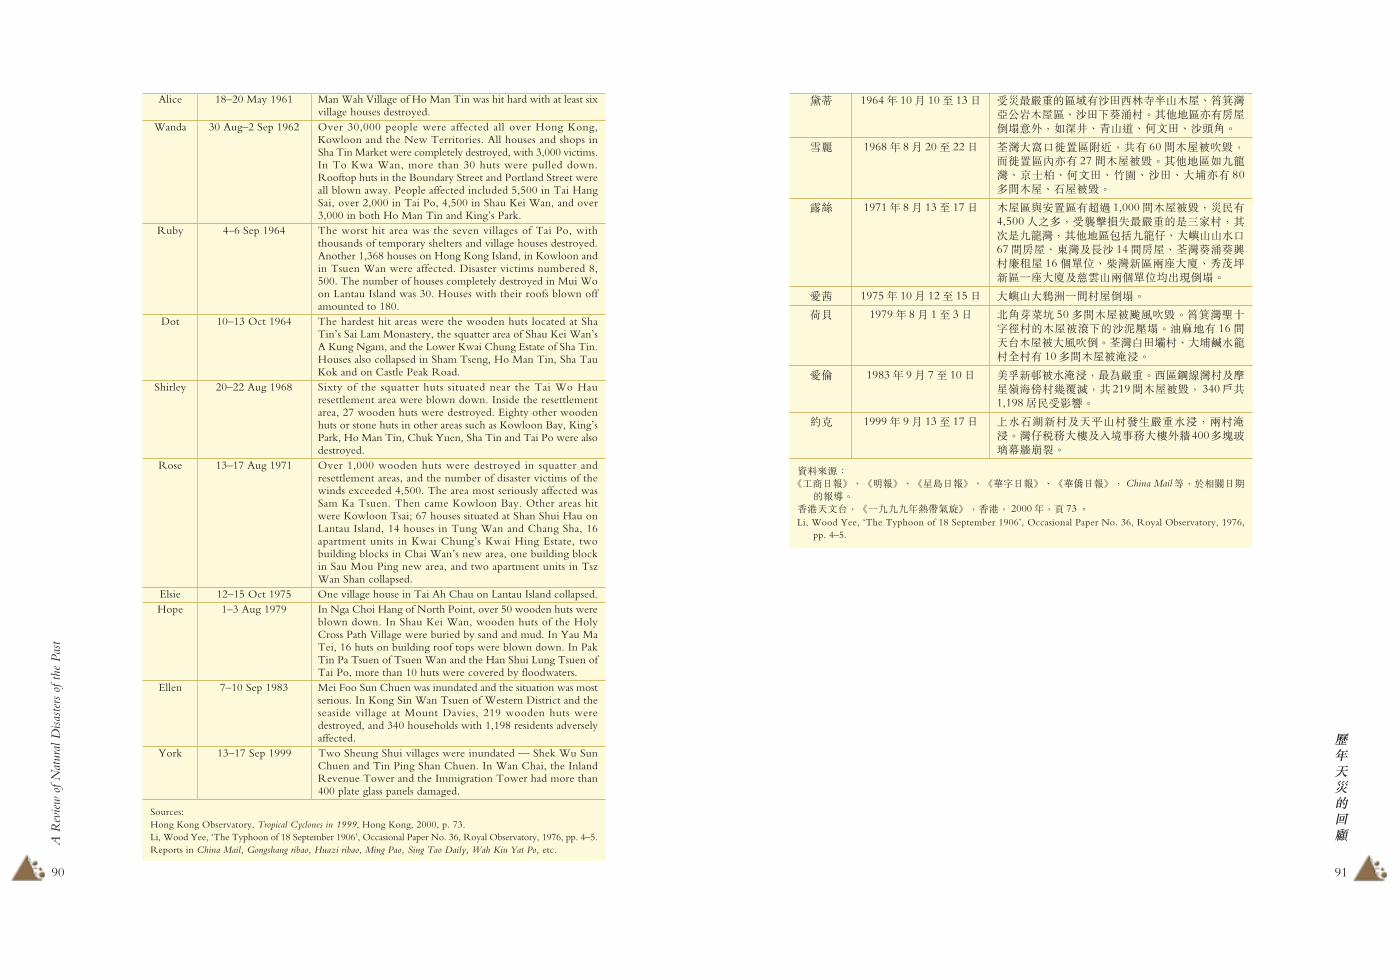
# 2.8ÿÙleG Ä'klzfsä (1884–2002#)
!"23 =>u"HINK?@ vwijxy
Ø 1906# 9� 18� 29J ;KðÜ+38�kl¬¡>±µ½¾_YÆÕ¿�YÆ_úÀYÆ_2½YÆÖ_ÁÊÎ_�U;Â_W°~ÃU;Ä]Izf>3ÅÆ÷ìz¾Î28� 383'O>
Ø 1923# 8� 17� 22J WØbàèmÙ¦s�2%;¤ze¡¡lÇ3«+ 52�>&'bÚymÙ]+@ÈlÇz¡v_¡¡'�2I¹f>
Ø 1927# 8� 19� 20J ÚymÙ¡l¦s�2%-Z°+120mÈkl¬¡%ÚyÉUʦ6Yze¡v>z{m_ËÎ_ÄÏÓ_N<³�+¡lÌ�>
Ø 1929# 8� 21� 22J Úyb&'mÙkl¬¡Ì��2>ÍÎ_Úy_Ïа_N<³_ѵUYÆ�èz¡Ò%ÓÔÕ]¬¡>&'|}¿~Î_ÑÒÓ_�ÖtU_úÀ;ÓD(lÇÜ+¬¡>
Ø 1931# 7� 31� 8� 2J ²þ.Gx_ñ#xxh(YMCA)l×_±°Ø 4�l6ze¡f%ÙÚÌ;Î_&'¦±ÛΪÂÇze6È¡¡>z{mN0YÆ_¿�YÆ_ÜÛÅ�½YÆ@��Ý¡ %l×]zée¡f>
Ø 1936# 8� 16� 17J ¶·°ÞßÎ_ѵ¢²Î_àZºU_áâµãä_¯°"å_i@ 2_ 3_ 4æ�(lÇ�6È¡ %±°Âk]÷ªç=>Äè_ʦ_�lÜIfj>
Ø 1937# 9� 1� 2J �2z¹f(Ùë)é;Kê?�ë�zeìvÒZƵ2¥ªè(ʦbNlz¡fÒÑÒÓ± 7�íîïðÒÚyÉ)EñU¢²aò_"^óôUõók6¼ö¡>ÔÓmÙ=ÍÎ_÷Z_¯°_øÇ_Ð��_±ùú_Ïа_àûéÓ_Úyà_N<³_-Z°_ZÇ_ü�+i@lÇ_Äè_glze¡f'6Ȭ¡>
Ø 1946# 7� 16� 19J 24ÙÊËýDC&'èmÙ%°¦_±ùú_|þÓ±>
ÙQvÐ 1957# 9� 21� 23J WØz¾Î¼Å3O%¯°ªÙfl 400�Òñj_Oÿ_ZÇ_Å<Ùfl500�>)mÙ(gl_!"Ù=N<³gl_´°gl_ÚyàM#�Æ#$ë_ÍÎ_ÏаÙ_´°µë�ze�2¡f%4�8¼Î 10,3678>
Úx 1960# 6� 4� 9J WØ-Ìe43s42%íl¡fB;N 1 0 @�%%&3È>Ïа_M#�_j'Ó%3«+30@�glIf%)mzfgl×¼( 330�>
Ûx³ 1961# 5� 18� 20J )QÇQþëIz�2%&ë3«+ 6 �ël¬¡>
Üs 1962# 8� 30� 9� 2J 'ÚWØ(4�8¼2¥33%ZÇêklbí*æf%4�ç+3,000m8>ò+°]+30@�gl¬¡%Ø,Î_-.Î2Rgl]æ¡f>ÔÓmÙ4�8¼?;/±(5,500)_;K(2,000m)_Ïа(4,500)_)QÇ(3,000m)_0~�(3,000m)>
tð 1964# 9� 4� 6J I43�2(©;KFÙ1ë%zf�Hglb1ë2lǼ8�Ò'Úb¯°Imzde3bglU+1,368�%4�UÎ8,5008Òàè45El6Yf¡B 30�%¡6l×UEl 180�>
Table 2.8 Property Loss and Damage in the Wake of Signal No. 10 Typhoons (1884–2002)
Name of Date TropicalTyphoon Cyclone Warning Details
Signal Hoisted– 18–29 Sep 1906 In Tai Po, 38 buildings collapsed. West Point Godown, Blake
Pier, Queen’s Pier, Star Ferry Pier, Pedder Street, SupremeCourt and the bamboo scaffolding of the new Post Officesuffered damage. A conservative estimate of loss amounted toHK$20 to 30 million.
– 17–22 Aug 1923 Destruction in the New Territories and the outlying islandswas particularly serious. In Tai O, at least 52 buildings weredestroyed. In Hong Kong and Kowloon, many buildings wereeither blown away, destroyed, or seriously damaged.
– 19–20 Aug 1927 The Kowloon area was particularly hard hit. In Cheung ShaWan, 120 or more buildings collapsed. In Kowloon Tong, theentire squatter area was blown away. In Yau Ma Tei, TempleStreet, Canton Road and Sham Shui Po, there were reports ofcollapsed buildings.
– 21–22 Aug 1929 The collapse of buildings in Hong Kong and Kowloon wasserious. Shau Kei Wan, Hung Hom and Sham Shui Po werethe hard-hit areas. The canopy of the Mong Kok Pier was blownoff and the ticketing office collapsed. On Hong Kong Island,some buildings in Douglas Street, and on Connaught Road andQueen’s Road Central (including Ko Shing Theatre) collapsed.
– 31 Jul–2 Aug 1931 The rooftops of the South China Football Club, the YMCAand four houses in Sai Wan Ho were completely destroyed.Buildings in Main Street, Ap Lei Chau, and one building in SaiOn Street, Aberdeen, were blown down. Many crossbeams atYau Ma Tei Ferry Pier, Blake Pier and Chiu On Pier toppledand their roofs were destroyed by the violent windstorms.
– 16–17 Aug 1936 Some buildings in Jardine’s Bazaar in Causeway Bay and FaYuen Street in Mong Kok were destroyed, as were Shing MunHospital, Lai Chi Kok Prison and Tsuen Wan Police Station.Two-, three- or four-storey buildings, western-style houses,scaffolding factories, temporary shelters and stone huts werealso damaged.
– 1–2 Sep 1937 A whole village in Tai Po Market was swept away. In Sha TauKok, half of the squatter huts and small houses were destroyed.On Connaught Road West, seven shops caught fire becauseof the typhoon. The high walls and gardens of houses inKowloon Tong and the garage of the Police Training Schoolcollapsed. Many buildings, scaffolding factories and woodenhuts in Hung Hom, Tuen Mun, Tsuen Wan, Kam Tin, AKung Ngam, Sai Ying Pun, Shau Kei Wan, Kowloon City,Sham Shui Po, Cheung Sha Wan, Sha Tin and Fanling and onHollywood Road were partially or wholly destroyed.
– 16–19 Jul 1946 The disaster-struck areas were concentrated on Hong KongIsland: Wan Chai, Sai Ying Pun and Des Voeux Road West.
Gloria 21–23 Sep 1957 The financial losses in the New Territories reached severalmillion dollars. In Tsuen Wan, 400 houses were destroyedwhile 500 houses in Castle Peak, Yuen Long, Sha Tin andSheung Shui collapsed. Wooden huts in various regions, suchas those in Sham Shui Po, Chai Wan, Lo Fu Ngam and FuMei Village of Kowloon City, Hung Hom, Shau Kei Wan,and Chai Wan Kok Village were seriously damaged. Thenumber of disaster victims reached 10,367.
Mary 4–9 Jun 1960 The areas most severely hit were the New Territories andCheung Chau Island. Ten shops and houses and three memorialarches were destroyed. Over 30 wooden huts in Shau Kei Wan,A Kung Ngam, Valley Road and Lo Fu Ngam were destroyed.Altogether 330 huts collapsed in Hong Kong.
91
A R
evie
w o
f Nat
ural
Disa
ster
s of
the
Pas
t
90
!"#$%&'
sz 1964# 10� 10� 13J I43�2(Ùë+ZDZ78èjgl_ÏаÐ��glÙ_ZÇ 9:ë>ÔÓmÙ]+kl¬¡6T%=N;_ñjÓ_)QÇ_ZƵ>
Ýx 1968# 8� 20� 22J ¯°;57!"Ùö�%U+ 60�glz¡f%�!"ÙÜ]+ 27�glzf>ÔÓmÙ=Úy°_0~�_)QÇ_<²_ZÇ_;K]+ 80@�gl_�lzf>
tÞ 1971# 8� 13� 17J glÙÆÛ"Ù+2¥ 1,000�glzf%4�+4,5008U@%I¢Mz¾3�2(©Iûë%Ôï©Úy°%ÔÓmÙ)éÚy¦_;=jj<767�kl_Ï°b-Z 14�kl_¯°9:9Gë>?l 16'<@_´°WÙ¨È;A_BCDWÙªÈ;AbEaj¨'<@ÜѤ¬¡>
Ûß 1975# 10� 12� 15J ;=j;F̪�ël¬¡>
à� 1979# 8� 1� 3J µGH/ 50@�glzde¡f>ÏаIÙ©Jë(glzK (Z�%¡>z{m+ 16�2Rglz;e¡¬>¯°LÇMë_;KN<yë6ë+ 10@�glzçO>
Ûá 1983# 9� 7� 10J ñPWQz<çO%3s�2>±ÙRS°ëbT½�³UëVWX%U 219�glzf% 340îU1,198ë�IJK>
çP 1999# 9� 13� 17J Å<�YWëb2¯jëH��2<O%¨ëçO>°¦Z[;ÂbqFÌ[;ÂTò400@\]^_ò `>
��Aø?ü!"J�ý_üà�ý_ü½èJ�ý_üþ©J�ý_üþ#J�ý%China Mail�%P��JE
(��>&'2QR%üªÚÚÚ#�µ¥¶ý%&'% 2000#%þ 73>Li, Wood Yee, ‘The Typhoon of 18 September 1906’, Occasional Paper No. 36, Royal Observatory, 1976,
pp. 4–5.
Alice 18–20 May 1961 Man Wah Village of Ho Man Tin was hit hard with at least sixvillage houses destroyed.
Wanda 30 Aug–2 Sep 1962 Over 30,000 people were affected all over Hong Kong,Kowloon and the New Territories. All houses and shops inSha Tin Market were completely destroyed, with 3,000 victims.In To Kwa Wan, more than 30 huts were pulled down.Rooftop huts in the Boundary Street and Portland Street wereall blown away. People affected included 5,500 in Tai HangSai, over 2,000 in Tai Po, 4,500 in Shau Kei Wan, and over3,000 in both Ho Man Tin and King’s Park.
Ruby 4–6 Sep 1964 The worst hit area was the seven villages of Tai Po, withthousands of temporary shelters and village houses destroyed.Another 1,368 houses on Hong Kong Island, in Kowloon andin Tsuen Wan were affected. Disaster victims numbered 8,500. The number of houses completely destroyed in Mui Woon Lantau Island was 30. Houses with their roofs blown offamounted to 180.
Dot 10–13 Oct 1964 The hardest hit areas were the wooden huts located at ShaTin’s Sai Lam Monastery, the squatter area of Shau Kei Wan’sA Kung Ngam, and the Lower Kwai Chung Estate of Sha Tin.Houses also collapsed in Sham Tseng, Ho Man Tin, Sha TauKok and on Castle Peak Road.
Shirley 20–22 Aug 1968 Sixty of the squatter huts situated near the Tai Wo Hauresettlement area were blown down. Inside the resettlementarea, 27 wooden huts were destroyed. Eighty other woodenhuts or stone huts in other areas such as Kowloon Bay, King’sPark, Ho Man Tin, Chuk Yuen, Sha Tin and Tai Po were alsodestroyed.
Rose 13–17 Aug 1971 Over 1,000 wooden huts were destroyed in squatter andresettlement areas, and the number of disaster victims of thewinds exceeded 4,500. The area most seriously affected wasSam Ka Tsuen. Then came Kowloon Bay. Other areas hitwere Kowloon Tsai; 67 houses situated at Shan Shui Hau onLantau Island, 14 houses in Tung Wan and Chang Sha, 16apartment units in Kwai Chung’s Kwai Hing Estate, twobuilding blocks in Chai Wan’s new area, one building blockin Sau Mou Ping new area, and two apartment units in TszWan Shan collapsed.
Elsie 12–15 Oct 1975 One village house in Tai Ah Chau on Lantau Island collapsed.Hope 1–3 Aug 1979 In Nga Choi Hang of North Point, over 50 wooden huts were
blown down. In Shau Kei Wan, wooden huts of the HolyCross Path Village were buried by sand and mud. In Yau MaTei, 16 huts on building roof tops were blown down. In PakTin Pa Tsuen of Tsuen Wan and the Han Shui Lung Tsuen ofTai Po, more than 10 huts were covered by floodwaters.
Ellen 7–10 Sep 1983 Mei Foo Sun Chuen was inundated and the situation was mostserious. In Kong Sin Wan Tsuen of Western District and theseaside village at Mount Davies, 219 wooden huts weredestroyed, and 340 households with 1,198 residents adverselyaffected.
York 13–17 Sep 1999 Two Sheung Shui villages were inundated — Shek Wu SunChuen and Tin Ping Shan Chuen. In Wan Chai, the InlandRevenue Tower and the Immigration Tower had more than400 plate glass panels damaged.
Sources:Hong Kong Observatory, Tropical Cyclones in 1999, Hong Kong, 2000, p. 73.Li, Wood Yee, ‘The Typhoon of 18 September 1906’, Occasional Paper No. 36, Royal Observatory, 1976, pp. 4–5.Reports in China Mail, Gongshang ribao, Huazi ribao, Ming Pao, Sing Tao Daily, Wah Kiu Yat Po, etc.

93
A R
evie
w o
f Nat
ural
Disa
ster
s of
the
Pas
t
92
!"#$%&'
Fig. 2.22 The damaged Blake Pier after thetyphoon (September 1906). Courtesy Dr TongCheuk-man
¤ 2.22ÿde¥>(DÕ¿�YÆÕ1906#9�Ö>·¸¹º�»«
Fig. 2.24 Luckily escaping Typhoon Rose’sonslaught in August 1971, a girl surveys thewrecked remains of her home in despair. Thephotograph was taken at Sam Ka Tsuen near KwunTong. Courtesy Hong Kong SAR InformationServices Department
¤ 2.24ÿdetÞ¢'>%*ab>m�%4vû²æf>1971#8�¯P]Éö�(Iûë>&'5ö·~Ù~�WíîËÌ
Fig. 2.23 Severe damage caused to houses afterthe passage of the typhoon (September 1962).Courtesy Hong Kong SAR Public Records Office
¤ 2.23ÿde¥>�kæf (1962#9�Ö>&'5ö·~Ù¯§Ë̪ª«
95
A R
evie
w o
f Nat
ural
Disa
ster
s of
the
Pas
t
94
!"#$%&'
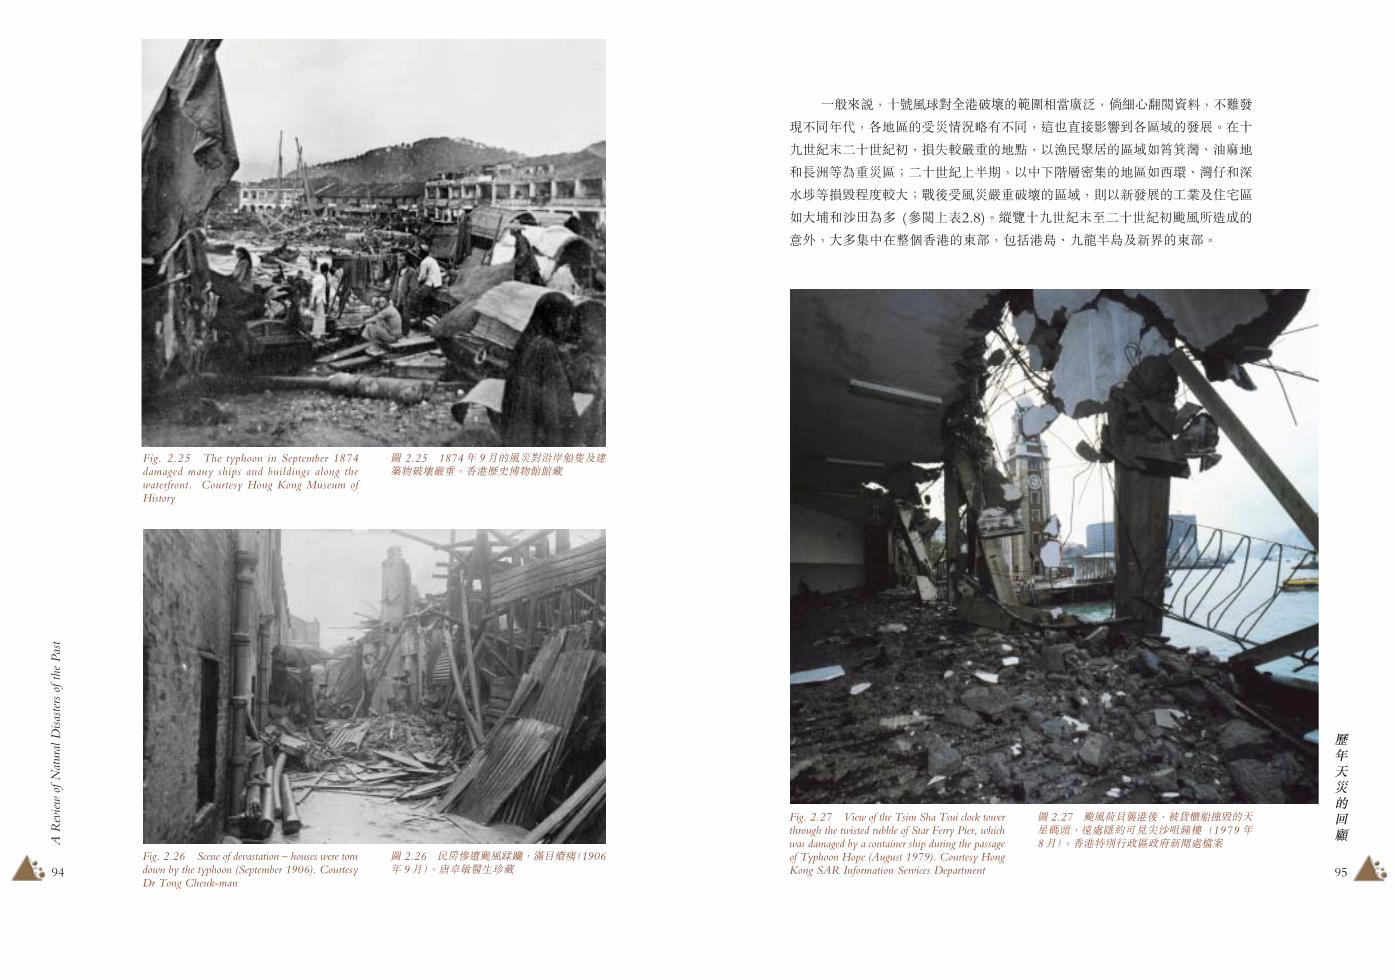
Fig. 2.27 View of the Tsim Sha Tsui clock towerthrough the twisted rubble of Star Ferry Pier, whichwas damaged by a container ship during the passageof Typhoon Hope (August 1979). Courtesy HongKong SAR Information Services Department
¤ 2.27ÿdeà�¢'>%z½c�of(2½YÆ%-î»ç�vdZefÂÕ1979#8�Ö>&'5ö·~Ù~�WíîËÌ
ª¸AB%ÙleGv6':j(`a�§Äg%hi$jõ��%¾jH
¤¾e#$%)mÙ(I47ä¥+¾e%ü8g¥JK )Ùë(H/>CÙ
Ú×2®�Ù×2k%z¾��2(m:%F@�lë(Ùë=Ïа_z{m
À-Ì�s24ÙÒ�Ù×2ÅèE%FD mæâý(mÙ=±Õ_°¦ÀN
<³�zf±ê�;Ò�>Ie4�2:j(Ùë%wFWH/(!XbEñÙ
=;KÀZÇs@ (ôõÅ÷2.8)>ïnÙÚ×2®��Ù×2kdehyS(
6T%;@ýDC?'&'(ÏY%)é'è_ÚyèèbWØ(ÏY>
Fig. 2.26 Scene of devastation – houses were torndown by the typhoon (September 1906). CourtesyDr Tong Cheuk-man
¤ 2.26ÿ�k4¸deop%qrstÕ1906# 9�Ö>·¸¹º�»«
Fig. 2.25 The typhoon in September 1874damaged many ships and buildings along thewaterfront. Courtesy Hong Kong Museum ofHistory
¤ 2.25ÿ1874# 9�(e4vØ?�Zb�u©:j�2>&'¯§¨©ªª«

97
A R
evie
w o
f Nat
ural
Disa
ster
s of
the
Pas
t
96
!"#$%&'
z{ie
�ïde¡¢%&'6àRvqwxsy%h+(JDéÀzz{¹Òg¥JK
��(|=}~(Y�säÀ�=(©�>OPdeySj�ö���ÓÆ(7
ä%F'è(Y_D±ÙbÚyèèÏY3�2%ü9Ùë987�z%.<
klM�%DѤ<O(7ä>de¢'E�%�³N0{u%Dq,'è_Ú
ybàè�(ÿ�%C³��Ó�^G�UG%'èbÚyèèU�(Y��6
���³N0%�àè(Y�H��2LFN0sÊÒ45 }Ë¿£�³N0(ð
�=�¾Å�e0'G($��%+û�¾�(Ä%×��ëC��û%M��
�CYÆ%g�N0�uÛ�Aû>46 deE�%C�UY�^6m�âD�[
(7ä %ð�b}��ð¯J�Ñ@�(ó�% 1973#+��N�(��»
;A( 5µ;� 1O 5µ' 3O¾�> 47 �devuÇ�[hyS(¾R%¾X
g¥JK&'vTÿ�%U��¥�ÉLk��klDq%C2��k� ãê
(#$%deh³[��klY���(¡¢%©�hrm(>
WØ£@¤¿Ù=Oÿ_;K_Å<_ZÇ_ü�_¯°Ààè(;=j�
Ide¥M%�¿Rxzz{¦>�§�mÙ=ÄϨ�]e©Ideª«>48
JD�é(£¬9Y�wx%÷�=Eì ð®%yS½¬T¾¯%��Å
;%3àZ(©°©(��%=H±_d�_²��>49 |}¾e#$(2a%
Fig. 2.28 A fire at Connaught Road Westduring the typhoon (2 September 1937). CourtesyHong Kong SAR Public Records Office
¤ 2.28ÿÑÒÓ±P 1937# 9� 2Jde¢'E�H�¤">&'5ö·~Ù¯§Ë̪ª«
In general, the destruction brought by typhoons that necessitated theWarning Signal No. 10 was widespread. A careful review of data reveals thatdamages inflicted by typhoons on various places changed in different timeperiods and affected the development of the region. In the late nineteenth andearly twentieth centuries, areas where the fishermen lived, such as Shau KeiWan, Yau Ma Tei and Cheung Chau, suffered more serious losses. In theearly part of the twentieth century, the hardest hit areas were the populousdistricts where the middle and lower classes lived, such as Western District,Wan Chai and Sham Shui Po. After the Second World War, the seriouslydevastated areas were the newly developed industrial or residential districtssuch as Tai Po and Sha Tin (see Table 2.8). On the whole, from the latenineteenth to early twentieth centuries, it was the eastern part of Hong Kong(including Hong Kong Island, Kowloon and the New Territories) that wasmost badly hit.
Economic Losses
Every time a typhoon struck, Hong Kong was paralysed and most daily activitiesstopped. The most direct impact on people’s lives were the chaotic trafficconditions and steep increases in commodity prices. The blocking of roads andstreets due to landslides induced by the typhoon was particularly serious in thenorthern parts of Hong Kong Island, Central and Western District, and easternKowloon. Due to high population densities and dilapidated drainage systems,these areas were often affected by flooding. During the passage of a typhoon,the cross-harbour ferry services were suspended and the traffic between HongKong Island, Kowloon and the outlying islands were cut off. Before theconstruction of the cross-harbour tunnels, ferries were the only means of publictransport that linked Hong Kong Island and Kowloon. Even today, the linkbetween Hong Kong Island and the outlying islands still relies heavily on ferryservices.45 For those people who failed to catch the last ferry home, they wouldhave to stay with their relatives or friends or to take shelter at the piers until theferry services resumed.46 During the onslaught of a typhoon, normal publictransport services could not be maintained and people had to pay fares up to afew times higher than normal. In 1973, it was reported that public light busesraised their fares from the original HK$0.50 to HK$1.50 or even HK$3.47
Typhoons also greatly disrupted aviation services. It affected not just thecommunications between Hong Kong and other places, but could also indirectlycause breakdowns in telecommunications networks. In an era when speedycommunication was very much part of one’s life, the congestion oftelecommunications systems caused by typhoons was a prime concern.
99
A R
evie
w o
f Nat
ural
Disa
ster
s of
the
Pas
t
98
!"#$%&'
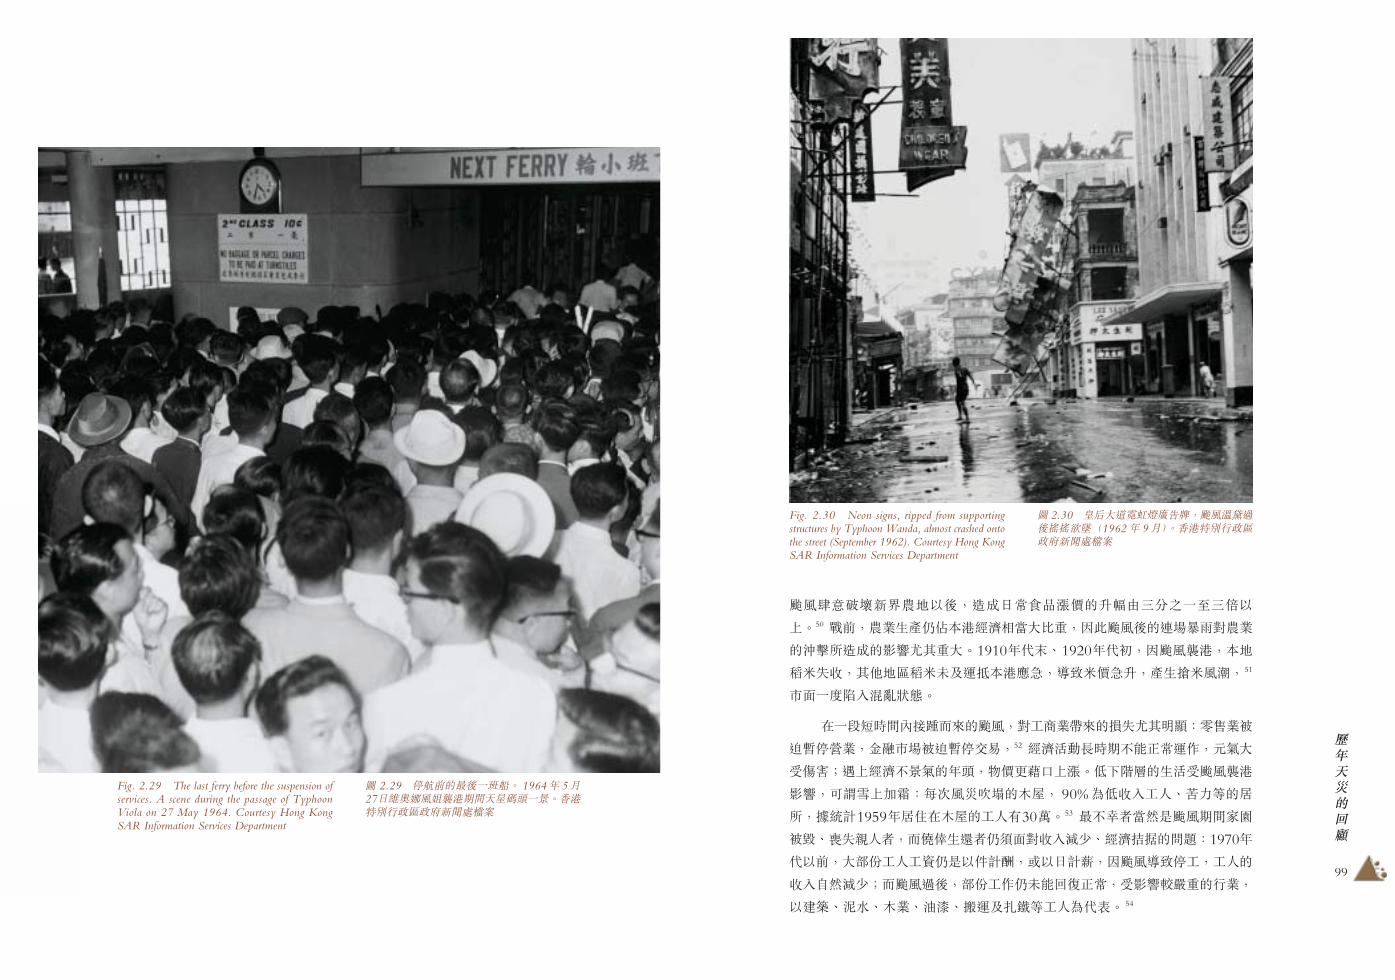
Fig. 2.29 The last ferry before the suspension ofservices. A scene during the passage of TyphoonViola on 27 May 1964. Courtesy Hong KongSAR Information Services Department
¤ 2.29ÿ{uG(3>ª��> 1964# 5�27Jmnoe³¢'E�2½Yƪ�>&'5ö·~Ù~�WíîËÌ
de´6:jWؤmF>%ySJD°¬;�(=µOIñUª�I�F
Å>50 �G%¤X�¿L5Ä')*�§;ð2%9:de>(¶®��v¤X
(¥MhyS(JK¦Ô2;>1910#$®_1920#$k%9de¢'%Äm
·â¾¸%ÔÓmÙ·â^bì0Ä'�%�Éâ��=%¿�/âe^%51
ðáªêvq}~sy>
CªÈ¹H�Ü¥º�A(de%v!"XµA(z¾¦ÔàZ?ú»Xz
z¼{ùX%½¾ð®zz¼{Y¿%52 )*éÀ-HE¾6âDìp%O¥;
I?5ÒSÅ)*¾�¥(#Æ%©�UÀ7Å;>$ mæ(�éIde¢'
JK%�]ÝÅbÁ?�ïe4¡¡(gl% 90%s$¸q!8_Â7�(ë
h%}lì1959#ëECgl(!8+303>53 3¾ÃB§3©deE�û²
zf_ľ�8B%�Åç�ÆBL}áv¸qJ«_)*ÇÈ(¡¢?1970#
$FG%;Y�!8!�L©F�ìÉ%'FJìÊ%9de�É{!%!8(
¸qo3J«Ò�de¥>%Y�!pL^6A�âD%IJK��2(·X%
F�u_�<_gX_zË_uìbÌÅ�!8s$÷> 54
Fig. 2.30 Neon signs, ripped from supportingstructures by Typhoon Wanda, almost crashed ontothe street (September 1962). Courtesy Hong KongSAR Information Services Department
¤ 2.30ÿúÀ;ÓÍrÎÄ#%%deÜs¥>ÏÏÐÑÕ1962# 9�Ö>&'5ö·~Ù~�WíîËÌ

101
A R
evie
w o
f Nat
ural
Disa
ster
s of
the
Pas
t
100
!"#$%&'
Fig. 2.32 A scene at Chatham Road, HungHom after Typhoon Hope’s passage (August1979). Courtesy Hong Kong SAR InformationServices Department
¤ 2.32ÿÍÎËÒÓP 1979# 8�deà�¥'>Õä>&'5ö·~Ù~�WíîËÌ
Fig. 2.31 Advertising signs torn down duringthe passage of Typhoon Rose in August 1971.Courtesy Hong Kong SAR Information ServicesDepartment
¤ 2.31ÿdetÞÓìðÙ%¾«Ä#%z¡¬Õ1971# 8�Ö>&'5ö·~Ù~�WíîËÌ
Agricultural production in the New Territories, such as Yuen Long,Tai Po, Sheung Shui, Sha Tin, Fanling, Tsuen Wan and the outlying islandof Lantau, was hampered when typhoons struck. Neighbouring regions suchas Guangdong were also affected by typhoons.48 Daily necessities could notbe delivered to Hong Kong on time due to paralysed traffic, resulting insupply shortages. Most affected by price rises were food items such asvegetables, fish and meat.49 According to the records in different periods,after the typhoon’s ravaging of the agricultural regions in the New Territories,the prices of daily food items would increase anywhere from one-third tomore than 300%.50 The torrential rain in the aftermath of typhoons also hada very serious impact on local agriculture, especially in the pre-war era when

103
A R
evie
w o
f Nat
ural
Disa
ster
s of
the
Pas
t
102
!"#$%&'
Fig. 2.33 Typhoon York, the most recenttyphoon requiring the hoisting of No. 10 typhoonsignal, hit Hong Kong on 16 September 1999.One-third of the window panels of the InlandRevenue Tower in Wan Chai were destroyed.Courtesy Sing Tao Daily
¤ 2.33ÿ�#3éÝ(10ldeçPP1999#9�16J¢'%°¦8�qFÌ[î;ÂIñU(ªÔîz¡f>½èJ�
local agricultural production still played an important role in Hong Kong.From the end of the 1910s to the early years of the 1920s, as crops in HongKong were seriously damaged by typhoons and imported rice failed to arrivein time, the price of rice rose sharply and resulted in a scramble for rice.51
This caused havoc in Hong Kong.
When typhoons came one after another within a short period of time,the losses sustained by the commerce and industry were even more noticeable.
Fig. 2.34 Typhoon Ellen hit Hong Kong inSeptember 1983, killing 10 people and injuring333. Courtesy Hong Kong Museum of History
¤ 2.34ÿ1983# 9�7� 10J¢'(deÛá�É 10¬ 333?>&'¯§¨©ªª«

105
A R
evie
w o
f Nat
ural
Disa
ster
s of
the
Pas
t
104
!"#$%&'
e�¢'>%ª9[\G>m°(·X%�FB©«¼(��B%¾«Ä
Õ_Ö%_¢×_ZáØÙ_F�Ôî�zfj>�hm°%�Ä!8æ�Ùñ
ÚÛ>}�Þ 1962#Üse4>%�Ä!8(JÊ» 15'O;� 30'O%!
�=µ�Ϊ�>55 �<TY��[(·X%=(~ÀN��%'Ñ»�Ü�½
�·X%OPh¯�b%CdeE�]©�Ý&(>
1938#&'2QRªn 1928� 1937#Ù#�%9deb���É(z
f%pª6á��>&�#s&'ñs'è_Úy_WÚybWØòÙ%ÔDF
'èÙCe4b�4E�zf3�2%)*�Ñ5×�Ñ( 54%%�WØ_Ú
y_WÚywñö)525%_9%b12%>hF�#(�ÑA�%F1937#(
)*z¾3;%¶e 1938½~#ês 1937# 9� 2JfÞ( 223CÜ%©#
Use4b�4�Ñ 585,734O%5Ù#A×�Ñ( 39%Ò1937#)Ù9e�
�É()*z¾8©1928�1937#FA3�2(ª#>+� (1928�1937#)
e4b�4�É+�(½~z¾ýi7ä�ôõ ÷ 2.9:
Retail activities temporarily came to a halt and financial markets were alsoclosed down.52 Economic activities were disrupted for a prolonged period oftime and the economy suffered badly as a result. During economic downturns,commodity prices rose on the pretext of typhoon. The life of the lower classesbecame more difficult. Ninety per cent of the occupants of wooden huts struckdown by typhoons were low-paid workers and coolies, and there were 300,000workers living in wooden huts in 1959.53 The most unfortunate victims werethose who lost both their homes and family members. The survivors still hadto face reduced incomes and economic hardships. Before the 1970s, most ofthe workers were paid by piece or daily rates. Suspension of work caused bytyphoons reduced their wages correspondingly. Even after the passage of thetyphoon, some of the businesses could not return to normal immediately.Workers in the trades of building construction, bricklaying, carpentry, painting,transportation and steel fixing were most affected.54
Workers involved in repairs and maintenance were among the few thatbenefited from typhoons. Many damaged bamboo scaffoldings, advertisementboards, neon lights, doors and broken windows required immediate repairs.Scaffolding workers were in great demand. According to newspapers, afterthe devastation of Typhoon Wanda in 1962, the daily wages of a scaffoldingworker increased from HK$15 to HK$30, a 100% rise.55 Public transport liketaxis and light buses or businesses selling dried food and miscellaneous itemswere in great demand during the typhoon periods.
In 1938, the Hong Kong Observatory compiled a comprehensive reporton the damage caused by typhoons and heavy rain during the 10–year periodof 1928 to 1937. In this report, Hong Kong was divided into four regions.They were Hong Kong Island, Kowloon, New Kowloon and the NewTerritories. Among the four regions, Hong Kong Island suffered most fromthe typhoons and rainstorms. The economic cost of typhoons for Hong KongIsland accounted for 54% of the total cost for Hong Kong. The correspondingpercentages of typhoon cost for the New Territories, Kowloon and NewKowloon were 25%, 9% and 12% respectively. Looking at the expenditurecaused by typhoons of each year, the most severe economic losses occurred in1937. Including the provision of the HK$220,000 made in the 1938 fiscalyear, the amount of money spent in repairing the damage inflicted by thetyphoon and rainstorms of 2 September 1937 amounted to HK$585,734,equivalent to 39% of the total expenditure for the 10-year period from 1928to 1937. Table 2.9 shows the details of the economic losses caused by thetyphoons and associated rainstorms for the 1928 to 1937 period.
# 2.9ÿe4b�4�É()*�Ñ (1928–1937#)
Õ<@?'O)
|8 }~ �� ��� �� �}
1928 35,182 (36%) 3,361 (3%) 25,015 (25%) 35,677 (36%) 99,235
1929 41,344 (39%) 11,246 (10%) 21,566 (20%) 32,623 (31%) 106,779
1930 60,335 (54%) 2,408 (2%) 22,325 (20%) 26,286 (24%) 111,354
1931 56,486 (40%) 19,574 (14%) 11,838 (8%) 52,937 (38%) 140,835
1932 33,384 (74%) 3,896 (9%) 3,245 (7%) 4,689 (10%) 45,214
1933 16,935 (75%) 1,099 (5%) 1,458 (6%) 3,216 (14%) 22,708
1934 102,156 (76%) 14,069 (11%) 9,525 (7%) 7,699 (6%) 133,449
1935 27,163 (69%) 3,306 (8%) 4,449 (11%) 4,684 (12%) 39,602
1936 96,528 (45%) 31,990 (15%) 26,589 (13%) 57,622 (27%) 212,729
1937* 215,994 (59%) 29,268 (8%) 31,035 (9%) 89,437 (24%) 365,734
Uì 685,507 (54%) 120,217 (9%) 157,045 (12%) 314,870 (25%) 1,277,639
* 1937#×�Ñù^)é©#9�2Je4hyS()*z¾CÜ?'èÙ (103O)_ÚyÙ (3.63O)_WÚyÙ (5.73O)bWØÙ (2.73O)%6'Uìz¾ 223O%&ßàsC 1938#½~#ê�V>
��AøùHong Kong Observatory, ‘Letter from Director of Royal Observatory to Mr M. C. Hart’, File No. 32,
Meteorological Messages & Storm Warnings (Typhoon Signals), Hong Kong, 4 April 1938.

107
A R
evie
w o
f Nat
ural
Disa
ster
s of
the
Pas
t
106
!"#$%&'
C�2(&'wx%dehyS(:j%×{�C)*æá%á=vÜbv
TY�(Dq_)*éÀ¼H{¹�>OP~�Æð�vde¢'("�H�§
�%CH(â+ãÞä.%9:o 1980#$F>%8º?(¼©;µ �%
ð�vde(å9àZJ«Òde¢'%^�sææó+bY�Å�ª[¯ç,
ª2èE%ü¤¦ââ^_,wx(éêb"P>
u��µ¥¶R,µAéÝ(e�T%UxµA;�(�<%|}��Zë%¯A�
�yS(4ì%ù¾ðde«>OP&'(���ñcá¾Üí%+Hª2(�
�����P6#¯Ü��� 2,221 îâ(òñUª %vPª9�2(�4%
= 1972#(�4hyS'èèj_]É_Ïа�mÙ(j�ö�%ª�1)
¯B%��Lï+mð>9:�#(W¸%&'ð�b}½�CHe�«¢(ã
Þ>2QRo1884�2002#a�¯#A<J���3@(2añ/=÷2.10>
Fig. 2.35 Central after a rainstorm in May1889. Courtesy Hong Kong Museum of History
¤ 2.35ÿ1889# 5���>(DÕ>&'¯§¨©ªª«
Today, the damage to Hong Kong caused by typhoons is largely restrictedto the economic level, such as temporary suspension of internal and externaltransport services and the economic activities coming to a standstill. As thegovernment and the people have become quite aware of the possible damageof typhoons and have taken adequate preventive measures, casualties sincethe 1980s have been much reduced. People are much less fearful of typhoons.A close approaching typhoon merely means an extra day of holiday to studentsand workers alike, which reflects the prosperity and development of HongKong.
Heavy RainstormsTropical cyclones, apart from causing strong winds, also bring plenty of rain.Statistics indicate that damage brought by heavy rainstorms is comparable tothat caused by typhoons. As the temporal distribution of rainfall in HongKong is very uneven, a day’s rainfall can amount to a quarter of the annualaverage rainfall of 2,221 mm. Some severe rainstorms, such as those whichcaused serious landslides at the Mid-Levels on Hong Kong Island, Kwun Tongand Shau Kei Wan in 1972, still evoke great fear among those who havewitnessed such disasters. Thus, every summer, adequate precautions must betaken against typhoons and rainstorms. Table 2.10 records the highest dailyrainfall during the period of 1884 to 2002.
Table 2.9 Expenditure Caused by Typhoons and Rainstorms (1928–1937)
(Unit: Hong Kong dollar)Year Hong Kong Island Kowloon New Kowloon New Territories Hong Kong1928 35,182 (36%) 3,361 (3%) 25,015 (25%) 35,677 (36%) 99,2351929 41,344 (39%) 11,246 (10%) 21,566 (20%) 32,623 (31%) 106,7791930 60,335 (54%) 2,408 (2%) 22,325 (20%) 26,286 (24%) 111,3541931 56,486 (40%) 19,574 (14%) 11,838 (8%) 52,937 (38%) 140,8351932 33,384 (74%) 3,896 (9%) 3,245 (7%) 4,689 (10%) 45,2141933 16,935 (75%) 1,099 (5%) 1,458 (6%) 3,216 (14%) 22,7081934 102,156 (76%) 14,069 (11%) 9,525 (7%) 7,699 (6%) 133,4491935 27,163 (69%) 3,306 (8%) 4,449 (11%) 4,684 (12%) 39,6021936 96,528 (45%) 31,990 (15%) 26,589 (13%) 57,622 (27%) 212,7291937* 215,994 (59%) 29,268 (8%) 31,035 (9%) 89,437 (24%) 365,734Total 685,507 (54%) 120,217 (9%) 157,045 (12%) 314,870 (25%) 1,277,639
* The 1937 expenditure did not include the economic losses caused by the typhoon on 2 September: HongKong Island (HK$100,000); Kowloon (HK$36,000); New Kowloon (HK$57,000); New Territories(HK$27,000); totalling HK$220,000 for the whole of Hong Kong. This amount was reflected in the 1938financial year.
Source:Hong Kong Observatory, ‘Letter from Director of Royal Observatory to Mr M. C. Hart’, File No. 32,
Meteorological Messages & Storm Warnings (Typhoon Signals), Hong Kong, 4 April 1938.

109
A R
evie
w o
f Nat
ural
Disa
ster
s of
the
Pas
t
108
!"#$%&'
# 2.10ÿÙ;<J���3@2a (1884–2002#)
�� ?@ �?���(��)
1 1926# 7� 19J 534
2 1889# 5� 30J 521
3 1998# 6� 9J 411
4 1966# 6� 12J 383
5 1983# 6� 17J 347
6 1886# 7� 15J 342
7 1982# 8� 16J 334
8 1965# 9� 27J 326
9 1992# 5� 8J 324
10 1989# 5� 20J 323
��Aø?&'2QR¥¦2a>
Table 2.10 Ten Days With the Highest Daily Rainfall (1884–2002)
Order Date Daily Rainfall (mm)1 19 Jul 1926 5342 30 May 1889 5213 9 Jun 1998 4114 12 Jun 1966 3835 17 Jun 1983 3476 15 Jul 1886 3427 16 Aug 1982 3348 27 Sep 1965 3269 8 May 1992 324
10 20 May 1989 323
Source:Hong Kong Observatory meteorological records.
Fig. 2.37 A road surface collapsed under the forceof floodwaters (July 1926). Courtesy Hong KongMuseum of History
¤ 2.37ÿñ<vÓÆyS(�2:jÕ1926# 7�Ö>&'¯§¨©ªª«
▲
Fig. 2.36 The aftermath of a rainstorm in May1889. Courtesy Hong Kong Museum of History
¤ 2.36ÿ1889# 5���>(&'>&'¯§¨©ªª«

111
A R
evie
w o
f Nat
ural
Disa
ster
s of
the
Pas
t
110
!"#$%&'
# 2.11ÿ¯#�4yS�2?2alì (1884–2002#)
?@ ��� (��) ba^c ef^c d`^c X�^c
1 1972# 6� 16� 18J 16J: 206 150 Ø 93 4,84517J: 21418J: 233
2 1966# 6� 11� 13J 11J: 78 64 48 29 6,18312J: 38313J: 34
3 1959# 6� 12� 15J 12J: 97 46 21 60 11,72913J: 17614J: 18215J: 270
4 1889# 5� 28� 30J 28J: 14 27 17 6 Ø29J: 32130J: 521
5 1992# 5� 8� 10J 8J: 324 8 1 11 2,0009J: 16
10J: 9
6 1982# 8� 16� 18J 16J: 334 7 8 16 1,46017J: 8018J: 48
7 1994# 7� 22� 24J 22J: 297 6 2 3 20,00023J: 19524J: 119
8 1965# 9� 27� 28J 27J: 326 5 3 8 3,00028J: 16
9 1885# 6� 12� 13J 12J: 321 2 Ø 1 Ø13J: 13
10 1983# 6� 17� 18J 17J: 347 1 Ø 22 57918J: 4
Ä'<Ja�3@(��2as 1926# 7� 19J( 534îâ%�./å
Ù@1989#5�20J(���8+323îâÒ9de¢'�ySª¶ò��(
+./åÙ@ 1989# 5� 20J(deóáÎ_ 1971# 8� 17J(tÞ (<J
��2as 288îâ)_ 1999# 9� 16J(çP (<J��2as 276îâ)>
|}¯§��hÞ%ü9+§FAha�(<J���3@(J+%ôsð�J
D�éµAá@¾R%Xù¾ªåxyS�2(8º?%^�ª9`=ÔA(
��'¶õ¾q(2�%Û©�4(Ê9>s¡ßÅ�B�%{s&'¯#�4
?3�2(J+/P÷ 2.11>
��Aø?���2aO&'2QR<T%?2a�ôö?Chen, T. Y., The Severe Rainstorms in Hong Kong During
June 1966, Supplement to Meteorological Results 1966, Hong Kong: Government Printer, 1969, p. 45(1966#)*z¾)é~�h�Ñ3,1003'Om°÷%¤��ø½40.93'O%ùkl¬¡_T�4073'O)Òúûü%ü&'(§�Û6ý%&'ò7!±î% 2001#%þ 3>
The day with the highest rainfall was 19 July 1926 with 534 mm of rain.The tenth highest rainfall for a single day was 20 May 1989, when 323 mm ofrainfall was recorded due to heavy downpours brought by the onslaught ofTyphoon Brenda. On 17 August 1971, Typhoon Rose dumped 288 mm ofrain, and Typhoon York brought 276 mm of rain on 16 September 1999.Although these rainstorms with record-high rainfall caused considerableinconvenience to people’s daily lives, they did not necessarily result in heavyhuman casualties. Rather, some sudden downpours or continuous rainy dayswere the main culprits of disasters. To support these statements, Table 2.11lists those rainy days with the highest casualty figures.
Sources:Rainfall records are provided by the Hong Kong Observatory. For human casualty figures, see Chen T. Y., The
Severe Rainstorms in Hong Kong During June 1966: Supplement to Meteorological Results, 1966, Hong KongGovernment Printer, 1969, p. 45 (The economic losses in 1966 included $31,000,000 maintenance expenses,$409,000 compensation sums paid to farmers, collapsed houses and sunken vessels valued at $4,070,000);Chan Kin Shek, The Safety of Hong Kong Slopes, Geotechnical Engineering Office, 2001, p. 3.
Table 2.11 Casualties Caused by Heavy Rainstorms (1884–2002)
Order Date Amount of Number of Number of Number of Number ofRainfall Deaths People People Disaster(mm) Missing Injured Victims
1 16–18 Jun 1972 16th : 206 150 – 93 4,84517th : 21418th : 233
2 11–13 Jun 1966 11th : 78 64 48 29 6,18312th : 38313th : 34
3 12–15 Jun 1959 12th : 97 46 21 60 11,72913th : 17614th : 18215th : 270
4 28–30 May 1889 28th : 14 27 17 6 –29th : 32130th : 521
5 8–10 May 1992 8th : 324 8 1 11 2,0009th : 16
10th : 9
6 16–18 Aug 1982 16th : 334 7 8 16 1,46017th : 8018th : 48
7 22–24 Jul 1994 22nd : 297 6 2 3 20,00023rd : 19524th : 119
8 27–28 Sep 1965 27th : 326 5 3 8 3,00028th : 16
9 12–13 Jul 1885 12th : 321 2 – 1 –13th : 13
10 17–18 Jun 1983 17th : 347 1 – 22 57918th : 4

113
A R
evie
w o
f Nat
ural
Disa
ster
s of
the
Pas
t
112
!"#$%&'
»Å÷(l켩�v%¯A¶®��yS(8º?%F1972#6�16
J�6�18J(�43s�2%¬8¼�Î1508%I?B938%56 4�8
¼Î4,845>??ª'½E(¶®���Éjñ�H_j�ö�%éý,87â
ý_El�u��<þ(glÙ=]É(BCDbKÊÛ"Ù_Ïа(glÙ
U76�Hº>�mîèj(ÿ!Ó_"#Ó%e©])¾[e�%?$ÙIæ(
�Â;A¬¡%718%&>�4¥>%'[~�bð�v§�(�(%W\×)
*X§�Û6(ò7!±î]9�ST> 57
Fig. 2.40 Burst nullah on Hill Road, Shek TongTsui (18 July 1926). Courtesy Hong Kong SARPublic Records Office
¤ 2.40ÿ�ÉeÙjÓà+zfÕäÕ1926# 7� 18JÖ>&'5ö·~Ù¯§Ë̪ª«
From the above statistics, it can be seen that the rainstorms, occurringbetween 16 June and 18 June 1972 exacted the highest death toll, with 150people killed and 93 injured.56 The number of people affected came to 4,845.The week of continuous heavy rain led to flash floods and landslides thatburied the densely populated but flimsily built squatter areas in Sau Mau Ping,Gai Liu Resettlement Area and Shau Kei Wan, claiming a total of 76 lives. A13-storey building on Kotewall Road and Po Shan Road also toppled over inthe heavy rain, killing 71 people. This heightened the awareness of thegovernment and the public towards the safety of hill slopes and led to theestablishment of the Geotechnical Engineering Office, which is responsiblefor the management of unstable slopes.57
Fig. 2.38 Debris of a collapsed street after alandslide in Tai Ping Shan (now western Mid-Levels) in July 1926. Courtesy Dr Tong Cheuk-man
¤ 2.38ÿ®¯jÕ�¤HèjÙ±ÖPjñ�H>(�¦Õ1926# 7�Ö>·¸¹º�»«
Fig. 2.39 Workers clearing the debris of collapsedbuildings (July 1926). Courtesy Dr Tong Cheuk-man
¤ 2 .39ÿ!8ÚP�)jñ�H>(4ÙÕ1926# 7�Ö>·¸¹º�»«
Fig. 2.41 Extensive flooding caused by arainstorm (18 July 1926). Courtesy Hong KongSAR Public Records Office
¤ 2.41ÿ1926#7�18J(��yS�2<O>&'5ö·~Ù¯§Ë̪ª«

115
A R
evie
w o
f Nat
ural
Disa
ster
s of
the
Pas
t
114
!"#$%&'
Fig. 2.44 Flooding in Happy Valley (19 July1926). Courtesy Hong Kong SAR Public RecordsOffice
¤ 2.44ÿ,OmP1926#7�19J��>¦S-Ñ>&'5ö·~Ù¯§Ë̪ª«
Fig. 2.42 Workers making emergency repairswhile women used the water to wash clothing (July1926). Courtesy Hong Kong SAR Public RecordsOffice
¤ 2.42ÿ!8.ÚP2°à+%/*.0ÚP¿£�<123 (1926#7�)>&'5ö·~Ù¯§Ë̪ª«
Fig. 2.43 St Francis Street in Wan Chai after arainstorm (19 July 1926). Courtesy Hong KongSAR Public Records Office
¤ 2.43ÿ°¦I .~ÎP1926#7�19J��>7�>&'5ö·~Ù¯§Ë̪ª«
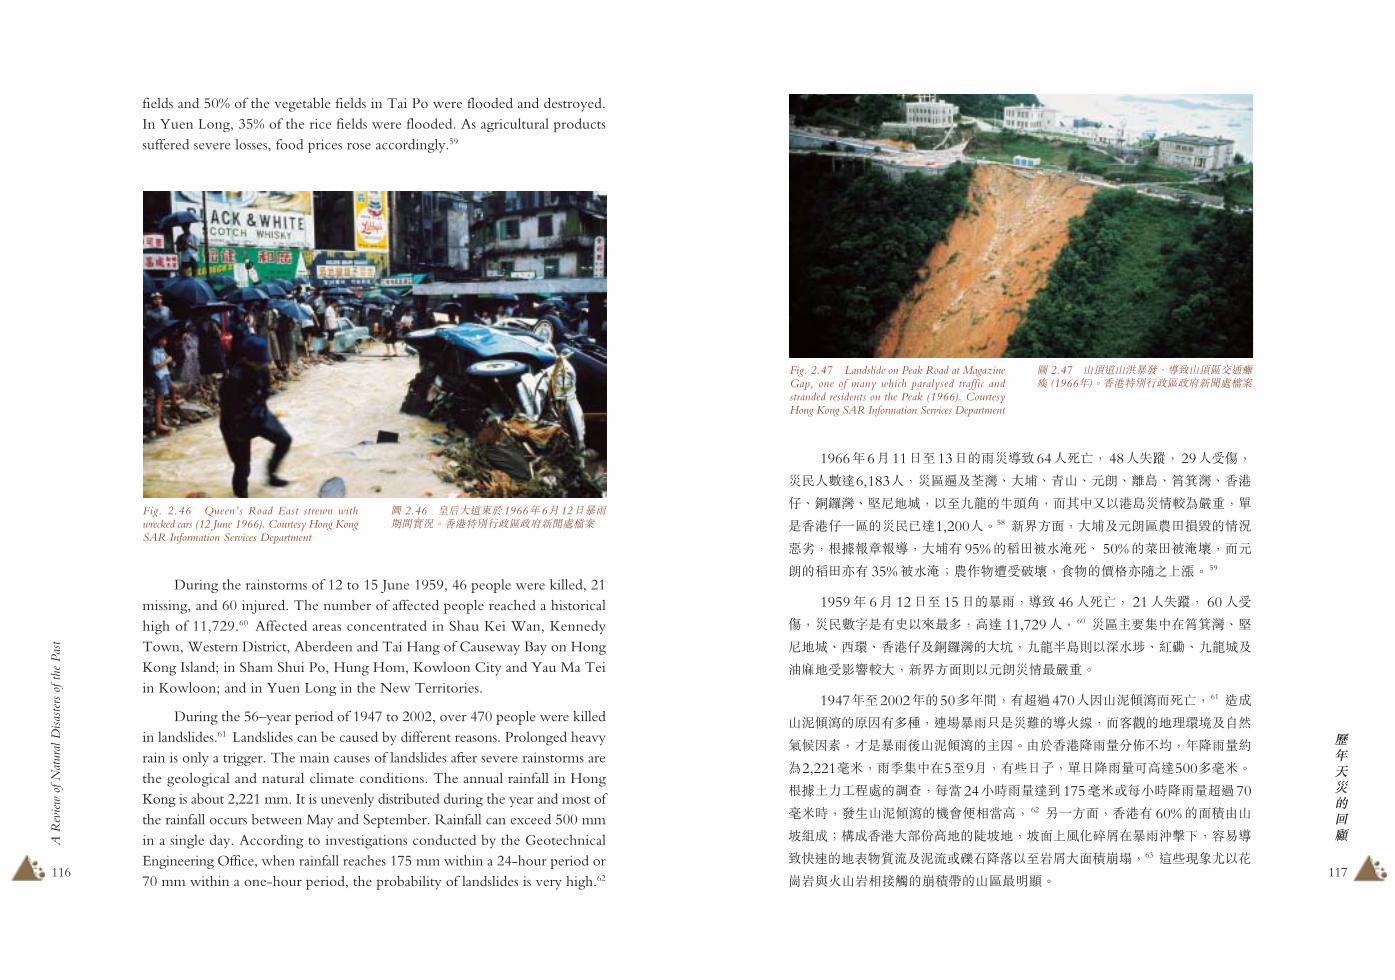
Between 11 and 13 June 1966, heavy rainstorms resulted in 64 deaths,48 persons missing, and 29 injured. The number of affected people amountedto 6,183 and the affected areas included Tsuen Wan, Tai Po, Castle Peak,Yuen Long, the outlying islands, Shau Kei Wan, Aberdeen, Causeway Bay,Kennedy Town and Ngau Tau Kok in Kowloon. The situation was moreserious on Hong Kong Island. In the Aberdeen area alone, 1,200 people wereaffected.58 In the New Territories, particularly in Tai Po and Yuen Long,farmland was seriously damaged. According to newspapers, 95% of the paddy
Fig. 2.45 Landslide on Hong Kong Island on20 June 1972. Courtesy Hong Kong SARInformation Services Department
¤ 2.45ÿ1972# 6� 20J'èÙ§�zf7ä>&'5ö·~Ù~�WíîËÌ
117
A R
evie
w o
f Nat
ural
Disa
ster
s of
the
Pas
t
116
!"#$%&'
1966#6�11J�13J(�4�É648¬%488¾å%298I?%
4�8¼Î6,1838%4Ù0b¯°_;K_ñj_Oÿ_àè_Ïа_&'
¦_¶·°_4Rmà%F�Úy(5Ƶ%�ÔDxF'è47�s�2%<
©&'¦ªÙ(4��Î1,2008>58 WØÁá%;KbOÿÙ¤Çzf(7ä
67%|}����%;K+ 95%(·Çz<ç¬_ 50%(HÇzçj%�O
ÿ(·Ç]+ 35%z<çÒ¤p©¸I:j%°©(��]�UÅ;> 59
1959# 6� 12J� 15J(��%�É 468¬% 218¾å% 608I
?%4�¼©©+§FA3@%�Î 11,7298% 60 4ÙÊËýDCÏа_4
Rmà_±Õ_&'¦b¶·°(;/%ÚyèèwFN<³_ÍÎ_Úyàb
z{mIJK�;%WØÁáwFOÿ473�2>
1947#�2002#(50@#�%+2¥47089j�ö��¬%61 yS
j�ö�(;9+@«%¶®��ש4j(�¤S%�B](m)ÕFbo3
¥¾98%Û©��>j�ö�(Ê9>OP&'���ñc¾Ü%#���ç
s2,221îâ%�¸ýDC5�9�%+9J+%<J�����Î500@îâ>
|}ò7!±î(9:%�§24NH��Î 175îâ'�NH���2¥70
îâH%H�j�ö�(;xR�§�% 62 ùªÁá%&'+ 60%(áîOj
�(SÒ©S&';Y��m(��m%�áÅe�û�C��¥M %�¿�
É�ã(m÷©�Èb�È'����F���;áî ¡%63 ü9¤¦¦F¢
£�Ƥj��¥K( îµ(jÙ3àZ>
Fig. 2.47 Landslide on Peak Road at MagazineGap, one of many which paralysed traffic andstranded residents on the Peak (1966). CourtesyHong Kong SAR Information Services Department
¤ 2.47ÿj×Ójñ�H%�Éj×ÙY�wx (1966#)>&'5ö·~Ù~�WíîËÌ
fields and 50% of the vegetable fields in Tai Po were flooded and destroyed.In Yuen Long, 35% of the rice fields were flooded. As agricultural productssuffered severe losses, food prices rose accordingly.59
Fig. 2.46 Queen’s Road East strewn withwrecked cars (12 June 1966). Courtesy Hong KongSAR Information Services Department
¤ 2.46ÿúÀ;ÓÏP1966#6�12J��E�Õä>&'5ö·~Ù~�WíîËÌ
During the rainstorms of 12 to 15 June 1959, 46 people were killed, 21missing, and 60 injured. The number of affected people reached a historicalhigh of 11,729.60 Affected areas concentrated in Shau Kei Wan, KennedyTown, Western District, Aberdeen and Tai Hang of Causeway Bay on HongKong Island; in Sham Shui Po, Hung Hom, Kowloon City and Yau Ma Teiin Kowloon; and in Yuen Long in the New Territories.
During the 56–year period of 1947 to 2002, over 470 people were killedin landslides.61 Landslides can be caused by different reasons. Prolonged heavyrain is only a trigger. The main causes of landslides after severe rainstorms arethe geological and natural climate conditions. The annual rainfall in HongKong is about 2,221 mm. It is unevenly distributed during the year and most ofthe rainfall occurs between May and September. Rainfall can exceed 500 mmin a single day. According to investigations conducted by the GeotechnicalEngineering Office, when rainfall reaches 175 mm within a 24-hour period or70 mm within a one-hour period, the probability of landslides is very high.62

119
A R
evie
w o
f Nat
ural
Disa
ster
s of
the
Pas
t
118
!"#$%&'
Fig. 2.48 Landslide in Kwun Tong. A total of150 people were killed and 93 injured territory-wide in the rainstorms occurring on 16 to 18 June1972. Courtesy Hong Kong SAR InformationServices Department
¤ 2.48ÿ1972# 6� 16� 18J(�46'yS 1508¬_ 938I?%¤s�4>(]É>&'5ö·~Ù~�WíîËÌ
Fig. 2.49 An aerial view of the Kwun Tong–Sau Mau Ping landslide area (18 June 1972).Courtesy Hong Kong SAR Information ServicesDepartment
¤ 2.49ÿ]ÉBCD1972#6�18J�4>(<=¤>&'5ö·~Ù~�WíîËÌ
Fig. 2.50 A rare sight of motor vehicles sweptdown the slope in Ming Yuen Street, North Point(12 June 1966). Courtesy Hong Kong SARInformation Services Department
¤ 2.50ÿµà²Î1966#6�12J�4�É;�õój>%?îC§�D@(A�>&'5ö·~Ù~�WíîËÌ

121
A R
evie
w o
f Nat
ural
Disa
ster
s of
the
Pas
t
120
!"#$%&'
Fig. 2.53 Rescue workers excavating franticallyat a landslide site (25 August 1976).CourtesyHong Kong SAR Information Services Department
¤ 2.53ÿéê-.Cjñ�H>rB�ÆBÕä (1976# 8� 25J)>&'5ö·~Ù~�WíîËÌ
Fig. 2.51 A 13-storey building on KotewallRoad was swept away by the landslide, killing 71people (18 June 1972). Courtesy Hong Kong SARInformation Services Department
¤ 2.51ÿÿ!Ó(ª$13æ�(;AC1972# 6� 18J(�4D¬¡%¼S 718¬>&'5ö·~Ù~�WíîËÌ
Fig. 2.52 Only half of another building onKotewall Road remained intact after being struckby the toppled building higher up the slope (18June 1972). Courtesy Hong Kong SARInformation Services Department
¤ 2.52ÿÿ!Óùª$;Az§�Ŭ¡ A(;ACoU>(zfÕä (1972#6�)>&'5ö·~Ù~�WíîËÌ
R23(98T%+9�¸D(6T©8syS(%]=s��D�-(
87%;�Eò_Fò(!±%:j,§�(�GH%�G�C¾�GH�UÅ(
kl%�©IHSj�ö�(ùª;9>1972#6�"#Ó(j�ö�%FbB
CD(�á45Hò %�©Æ¥�J�üHòm+�>64 C2002#Ä'áî�
;(8y§�L+ 54,000µ>
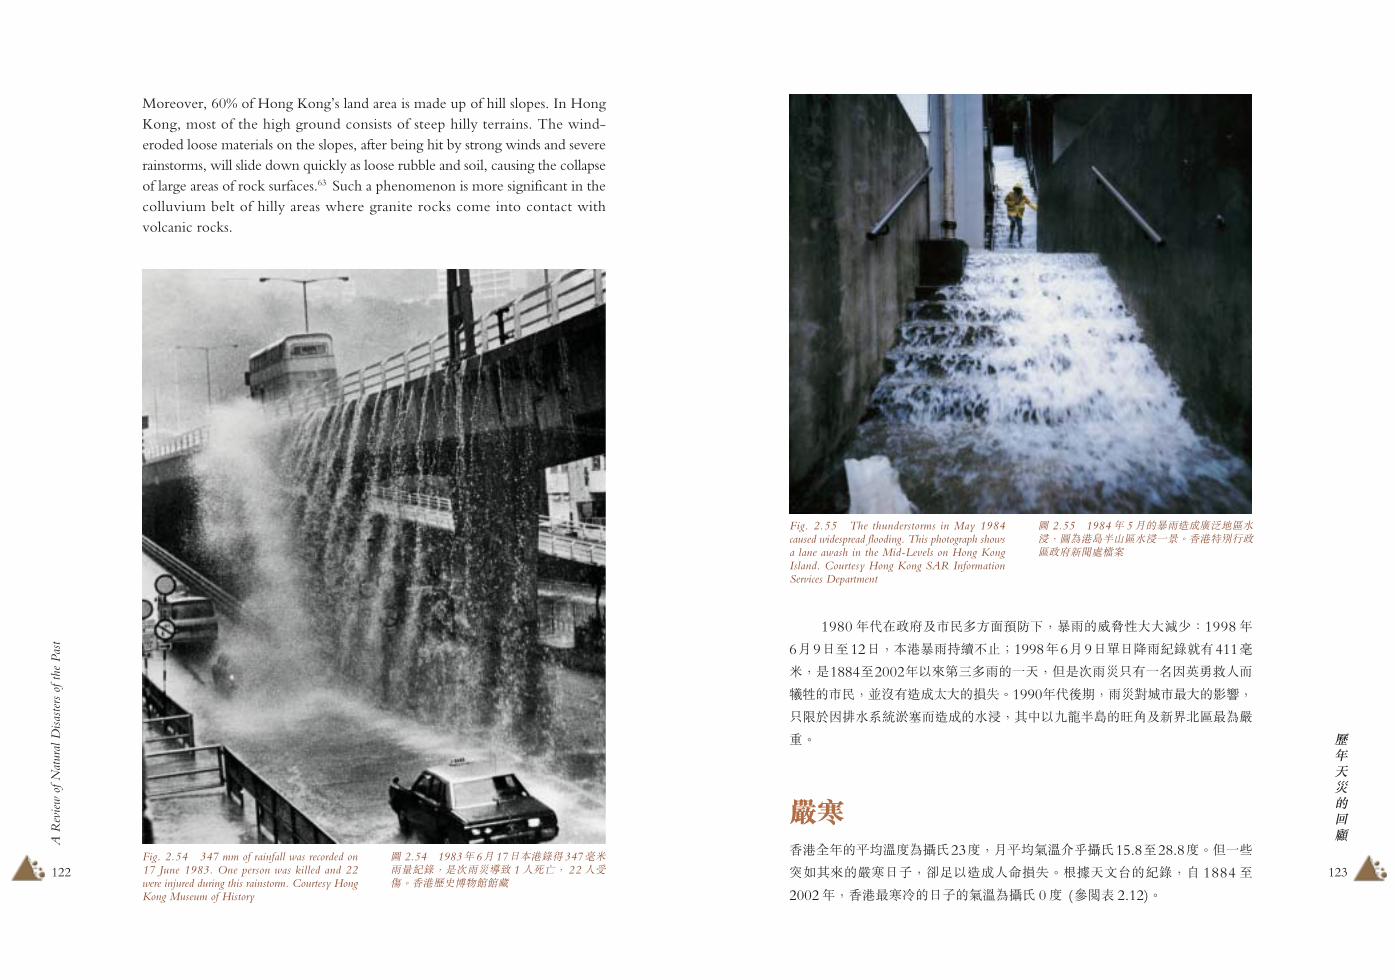
123
A R
evie
w o
f Nat
ural
Disa
ster
s of
the
Pas
t
122
!"#$%&'
1980#$C~�bð�@ÁáCH %��(S�H;;J«?1998#
6�9J�12J%Ä'���õ¾¹Ò1998#6�9J<J��2an+411î
â%©1884�2002#FAåI@�(ª2%X©ï�4×+ªa9ÉKê8�
%&(ð�%ùV+yS®;(z¾>1990#$>E%�4vàð3;(JK%
×,P9.<klL��yS(<O%ÔDFÚyèè(ѵbWØÙ3s�
2>
��&'6#(¯ÜÜês¯#23ê%�¯Ü¥ÜMN¯#15.8�28.8ê>Xª9
`=ÔA(��J+%0.FyS8ºz¾>|}2QR(2a%o 1884�
2002#%&'3�O(J+(¥Üs¯# 0ê (ôõ÷ 2.12)>
Fig. 2.55 The thunderstorms in May 1984caused widespread flooding. This photograph showsa lane awash in the Mid-Levels on Hong KongIsland. Courtesy Hong Kong SAR InformationServices Department
¤ 2.55ÿ1984# 5�(��ySÄgmÙ<O%¤s'èèjÙ<Oª�>&'5ö·~Ù~�WíîËÌ
Moreover, 60% of Hong Kong’s land area is made up of hill slopes. In HongKong, most of the high ground consists of steep hilly terrains. The wind-eroded loose materials on the slopes, after being hit by strong winds and severerainstorms, will slide down quickly as loose rubble and soil, causing the collapseof large areas of rock surfaces.63 Such a phenomenon is more significant in thecolluvium belt of hilly areas where granite rocks come into contact withvolcanic rocks.
Fig. 2.54 347 mm of rainfall was recorded on17 June 1983. One person was killed and 22were injured during this rainstorm. Courtesy HongKong Museum of History
¤ 2.54ÿ1983#6�17JÄ'a�347îâ��2a%©ï�4�É 18¬% 228I?>&'¯§¨©ªª«
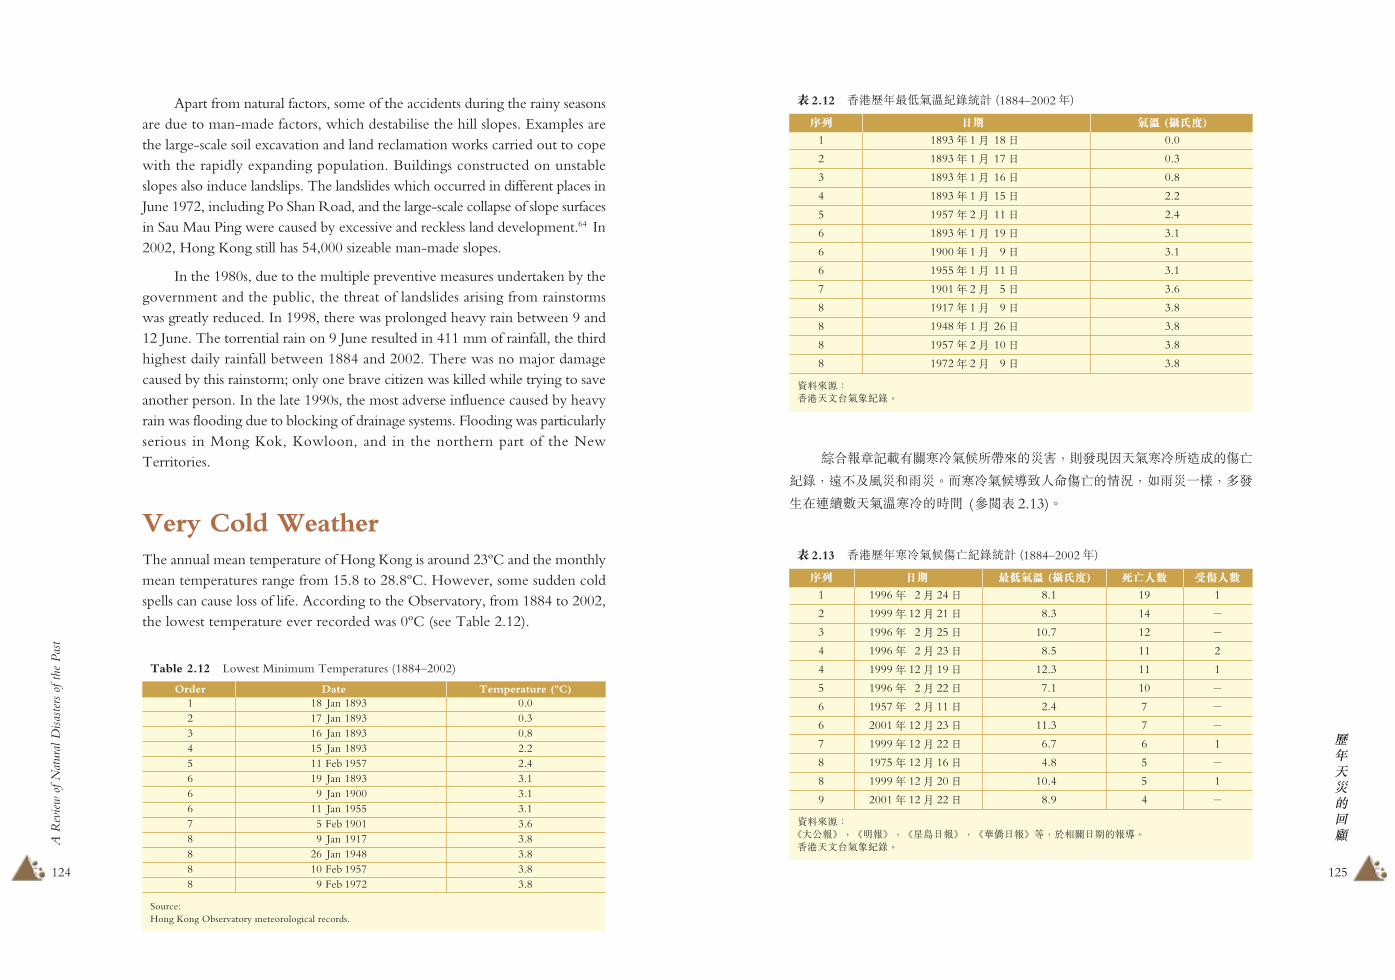
125
A R
evie
w o
f Nat
ural
Disa
ster
s of
the
Pas
t
124
!"#$%&'
# 2.12ÿ&'¯#3$¥Ü2alì (1884–2002#)
�� ?@ F� (�+�)
1 1893# 1� 18J 0.0
2 1893# 1� 17J 0.3
3 1893# 1� 16J 0.8
4 1893# 1� 15J 2.2
5 1957# 2� 11J 2.4
6 1893# 1� 19J 3.1
6 1900# 1� 9J 3.1
6 1955# 1� 11J 3.1
7 1901# 2� 5J 3.6
8 1917# 1� 9J 3.8
8 1948# 1� 26J 3.8
8 1957# 2� 10J 3.8
8 1972# 2� 9J 3.8
��Aø?&'2QR¥¦2a>
�!��`Þ+��O¥¾hµA(45%wH¤92¥�OhyS(?
2a%-¾be4À�4>��O¥¾�É8º?(7ä%=�4ª©%@H
�C¶õ¼2¥Ü�O(H� (ôõ÷ 2.13)>
Apart from natural factors, some of the accidents during the rainy seasonsare due to man-made factors, which destabilise the hill slopes. Examples arethe large-scale soil excavation and land reclamation works carried out to copewith the rapidly expanding population. Buildings constructed on unstableslopes also induce landslips. The landslides which occurred in different places inJune 1972, including Po Shan Road, and the large-scale collapse of slope surfacesin Sau Mau Ping were caused by excessive and reckless land development.64 In2002, Hong Kong still has 54,000 sizeable man-made slopes.
In the 1980s, due to the multiple preventive measures undertaken by thegovernment and the public, the threat of landslides arising from rainstormswas greatly reduced. In 1998, there was prolonged heavy rain between 9 and12 June. The torrential rain on 9 June resulted in 411 mm of rainfall, the thirdhighest daily rainfall between 1884 and 2002. There was no major damagecaused by this rainstorm; only one brave citizen was killed while trying to saveanother person. In the late 1990s, the most adverse influence caused by heavyrain was flooding due to blocking of drainage systems. Flooding was particularlyserious in Mong Kok, Kowloon, and in the northern part of the NewTerritories.
Very Cold WeatherThe annual mean temperature of Hong Kong is around 23ºC and the monthlymean temperatures range from 15.8 to 28.8ºC. However, some sudden coldspells can cause loss of life. According to the Observatory, from 1884 to 2002,the lowest temperature ever recorded was 0ºC (see Table 2.12).
Table 2.12 Lowest Minimum Temperatures (1884–2002)
Order Date Temperature (ºC)1 18 Jan 1893 0.02 17 Jan 1893 0.33 16 Jan 1893 0.84 15 Jan 1893 2.25 11 Feb 1957 2.46 19 Jan 1893 3.16 9 Jan 1900 3.16 11 Jan 1955 3.17 5 Feb 1901 3.68 9 Jan 1917 3.88 26 Jan 1948 3.88 10 Feb 1957 3.88 9 Feb 1972 3.8
Source:Hong Kong Observatory meteorological records.
# 2.13ÿ&'¯#�O¥¾?2alì (1884–2002#)
�� ?@ $�F� (�+�) ba^c d`^c
1 1996# 2� 24J 8.1 19 1
2 1999# 12� 21J 8.3 14 Ø
3 1996# 2� 25J 10.7 12 Ø
4 1996# 2� 23J 8.5 11 2
4 1999# 12� 19J 12.3 11 1
5 1996# 2� 22J 7.1 10 Ø
6 1957# 2� 11J 2.4 7 Ø
6 2001# 12� 23J 11.3 7 Ø
7 1999# 12� 22J 6.7 6 1
8 1975# 12� 16J 4.8 5 Ø
8 1999# 12� 20J 10.4 5 1
9 2001# 12� 22J 8.9 4 Ø
��Aø?ü;��ý%üà�ý%ü½èJ�ý%üþ#J�ý�%P��JE(��>&'2QR¥¦2a>

127
A R
evie
w o
f Nat
ural
Disa
ster
s of
the
Pas
t
126
!"#$%&'
1996# 2� 22J� 2� 25JªÈUò2(¹¼�P%UyS 528¬
% 38I?%ÔÕ&ÈJ+(¥Ü8+¯# 8ê%Æ 1884#FA3OJ+
¯# 0ê%�Q�->ùªÈ9�O¥Ü�O\8¼�@(J+s 1999#(
12� 19J� 22J%U+ 368R¬% 38I?>� 2001# 12� 22J� 23J
(�O¥Ü%]yS118O\(7ä>78S ÀA(©�O¥Ü�É6T¬
(J+%0�H�C�Ù×2®E%=1996#(12�%1999#(12�b2001
#(12�%|}��`Þ%üIÈJ+9¥¾�O�O\(I5B%;�sM#
8bTU>MVB0W7ð%�9¥¾�O%IH1@Ü�Xkl(YZ�\
º>ü¤¦^_,87M�%[ëM8�b%#MB\]ì^(7äJ��2?
1996#Ä'+I3a[ëM8ëPªÅ@'lë%�wxUJ_sì^M8(\
£`¿�~�1ÅÒFabUHM(]c%C'8Êd<=be$ûf5Ê�(
7ä %ú_zgh>
Fig. 2.56 The lowest temperature on 23 February1996 was 8.5ºC and it caused 11 deaths and twoinjuries. Courtesy Ta Kung Pao
¤ 2.56ÿ1996#2�23J(3$¥Ü×+¯#8.5ê%©J+118R¬%28I?>;��
According to figures from newspapers, the casualties caused by coldweather are far less than those caused by typhoons and heavy rainstorms.Deaths due to very cold weather, as in the case of rainstorms, usually occurwhen a cold spell lasts for a few days (see Table 2.13).
Fifty-two people died and three were injured during the four cold daysbetween 22 and 25 February 1996. In fact, the temperatures during this coldspell were around 8ºC which were much higher than the coldest record of 0ºC.Another period of very cold weather that caused considerable deaths occurredon 19 to 22 December 1999, with a death toll of 36 and three injured persons.On 22 to 23 December 2001, 11 people were killed by a cold spell. It is quitesurprising that deaths caused by cold weather were still happening even in thelate twentieth century. According to newspapers, most of the victims of thecold spells in 1996, 1999 and 2001 (all in the month of December) wereelderly people and babies. The elderly have weaker immune systems and thecold weather often induces fatal respiratory problems. This phenomenon reflectsthe ageing Hong Kong population, with increasing numbers of old peopleliving alone, or receiving insufficient care. In 1996, Hong Kong had 30,000old people living alone in about 100 housing estates. The responsibility ofcaring the elderly is gradually shifting from society to the government. Thetraditional idea of raising children as insurance for a comfortable retirementhas gradually faded out due to the ascendance of individualism and the emphasisplaced on the nuclear family.
Sources:Hong Kong Observatory meteorological records.Reports on the day of the incidents in Ming Pao, Sing Tao Daily, Ta Kung Pao, Wah Kiu Yat Po, etc.
Table 2.13 Human Casualties Caused by Very Cold Weather (1884–2002)
Order Date Temperature (ºC) Number of Deaths Number of Injuries1 24 Feb 1996 8.1 19 12 21 Dec1999 8.3 14 –3 25 Feb 1996 10.7 12 –4 23 Feb 1996 8.5 11 24 19 Dec1999 12.3 11 15 22 Feb 1996 7.1 10 –6 11 Feb 1957 2.4 7 –6 23 Dec2001 11.3 7 –7 22 Dec1999 6.7 6 18 16 Dec1975 4.8 5 –8 20 Dec1999 10.4 5 19 22 Dec2001 8.9 4 –
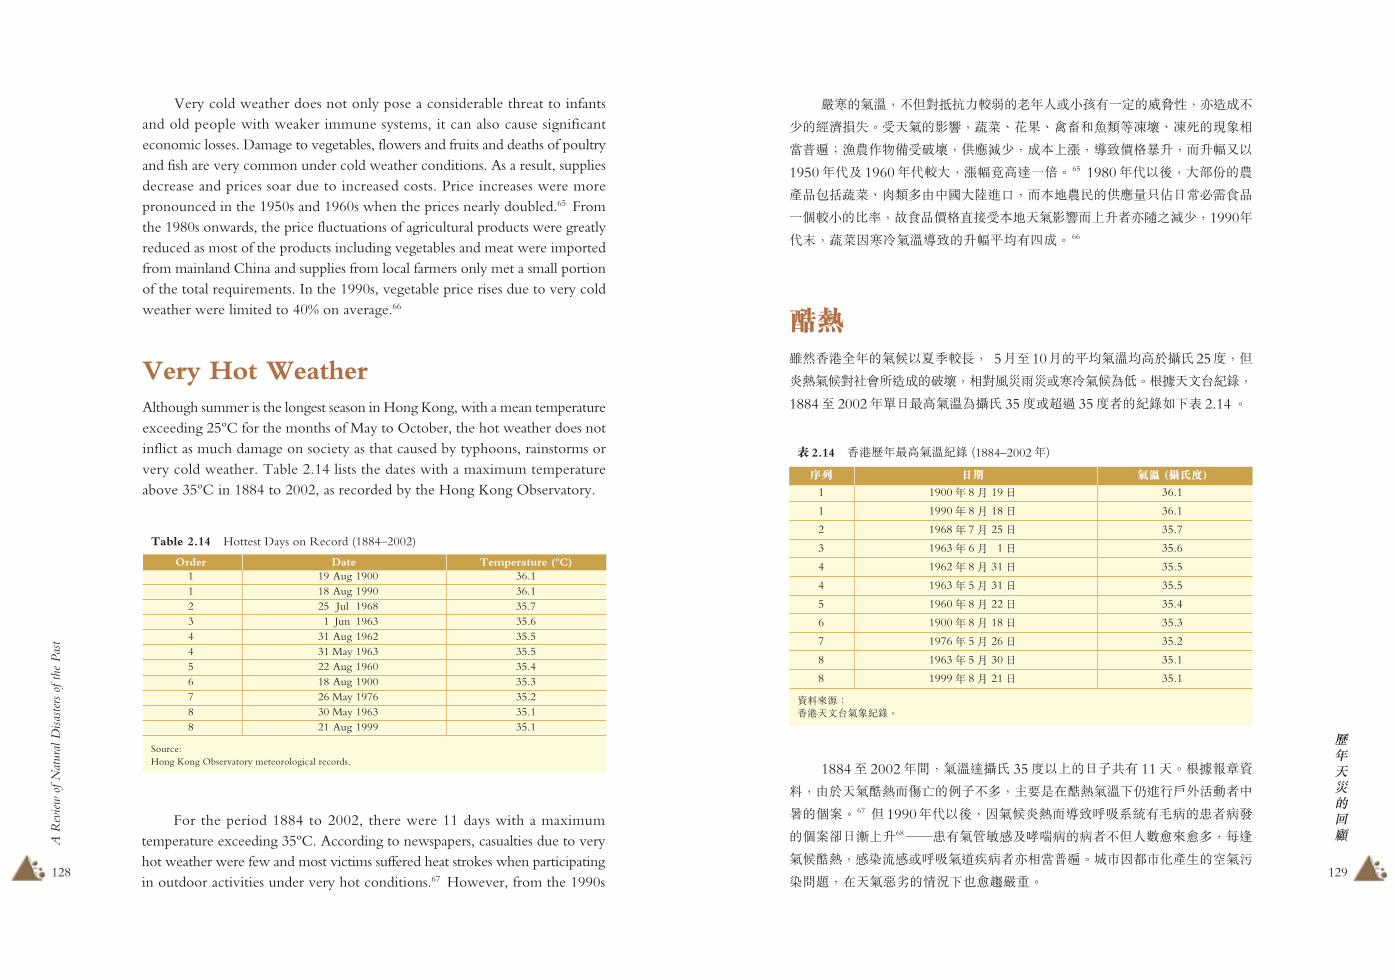
129
A R
evie
w o
f Nat
ural
Disa
ster
s of
the
Pas
t
128
!"#$%&'
��(¥Ü%¾Xv0W7�ð(M#8'Na+ªå(S�H%]yS¾
«()*z¾>I2¥(JK%±H_¢O_ijÀd��Rj_R¬(¤¦�
§k0Ò@¤p©ÞI:j%TJ«%SÄÅ;%�É���=%�=µxF
1950#$b 1960#$�;%;µl�Ϊ�> 65 1980#$F>%;Y�(¤
¿¬)é±H_²�@ODÑ;Ý"7%�Äm¤�(T�×5JDbh°¬
ª'�N(ð�%�°¬��g¥IÄm2¥JK�Å=B]�UJ«%1990#
$®%±H9�O¥Ü�É(=µ¯Ü+òS> 66
�Dô3&'6#(¥¾FW¸�-% 5��10�(¯Ü¥ÜÜ�P¯#25ê%X
m�¥¾vwxhyS(:j%�ve4�4'�O¥¾s$>|}2QR2a%
1884� 2002#<J3�¥Üs¯# 35ê'2¥ 35êB(2a= ÷ 2.14>
1884� 2002#�%¥Üί# 35êFÅ(J+U+ 112>|}���
�%OP2¥���?(]+¾@%ÊË©C��¥Ü L"·îTéÀBD
n('Ì>67 X1990#$F>%9¥¾m���É�Xkl+YZ(oBZH
('Ì0J_Å=6888o+¥×¹SbpqZ(ZB¾X8¼rAr@%�s
¥¾��%StÈS'�X¥ÓuZB]�§k0>àð9�ð�¿�(Ç¥v
t¡¢%C2¥67(7ä 8rw�2>
Very cold weather does not only pose a considerable threat to infantsand old people with weaker immune systems, it can also cause significanteconomic losses. Damage to vegetables, flowers and fruits and deaths of poultryand fish are very common under cold weather conditions. As a result, suppliesdecrease and prices soar due to increased costs. Price increases were morepronounced in the 1950s and 1960s when the prices nearly doubled.65 Fromthe 1980s onwards, the price fluctuations of agricultural products were greatlyreduced as most of the products including vegetables and meat were importedfrom mainland China and supplies from local farmers only met a small portionof the total requirements. In the 1990s, vegetable price rises due to very coldweather were limited to 40% on average.66
Very Hot WeatherAlthough summer is the longest season in Hong Kong, with a mean temperatureexceeding 25ºC for the months of May to October, the hot weather does notinflict as much damage on society as that caused by typhoons, rainstorms orvery cold weather. Table 2.14 lists the dates with a maximum temperatureabove 35ºC in 1884 to 2002, as recorded by the Hong Kong Observatory.
Table 2.14 Hottest Days on Record (1884–2002)
Order Date Temperature (ºC)1 19 Aug 1900 36.11 18 Aug 1990 36.12 25 Jul 1968 35.73 1 Jun 1963 35.64 31 Aug 1962 35.54 31 May 1963 35.55 22 Aug 1960 35.46 18 Aug 1900 35.37 26 May 1976 35.28 30 May 1963 35.18 21 Aug 1999 35.1
Source:Hong Kong Observatory meteorological records.
For the period 1884 to 2002, there were 11 days with a maximumtemperature exceeding 35ºC. According to newspapers, casualties due to veryhot weather were few and most victims suffered heat strokes when participatingin outdoor activities under very hot conditions.67 However, from the 1990s
# 2.14ÿ&'¯#3�¥Ü2a (1884–2002#)
�� ?@ F� (�+�)
1 1900# 8� 19J 36.1
1 1990# 8� 18J 36.1
2 1968# 7� 25J 35.7
3 1963# 6� 1J 35.6
4 1962# 8� 31J 35.5
4 1963# 5� 31J 35.5
5 1960# 8� 22J 35.4
6 1900# 8� 18J 35.3
7 1976# 5� 26J 35.2
8 1963# 5� 30J 35.1
8 1999# 8� 21J 35.1
��Aø?&'2QR¥¦2a>
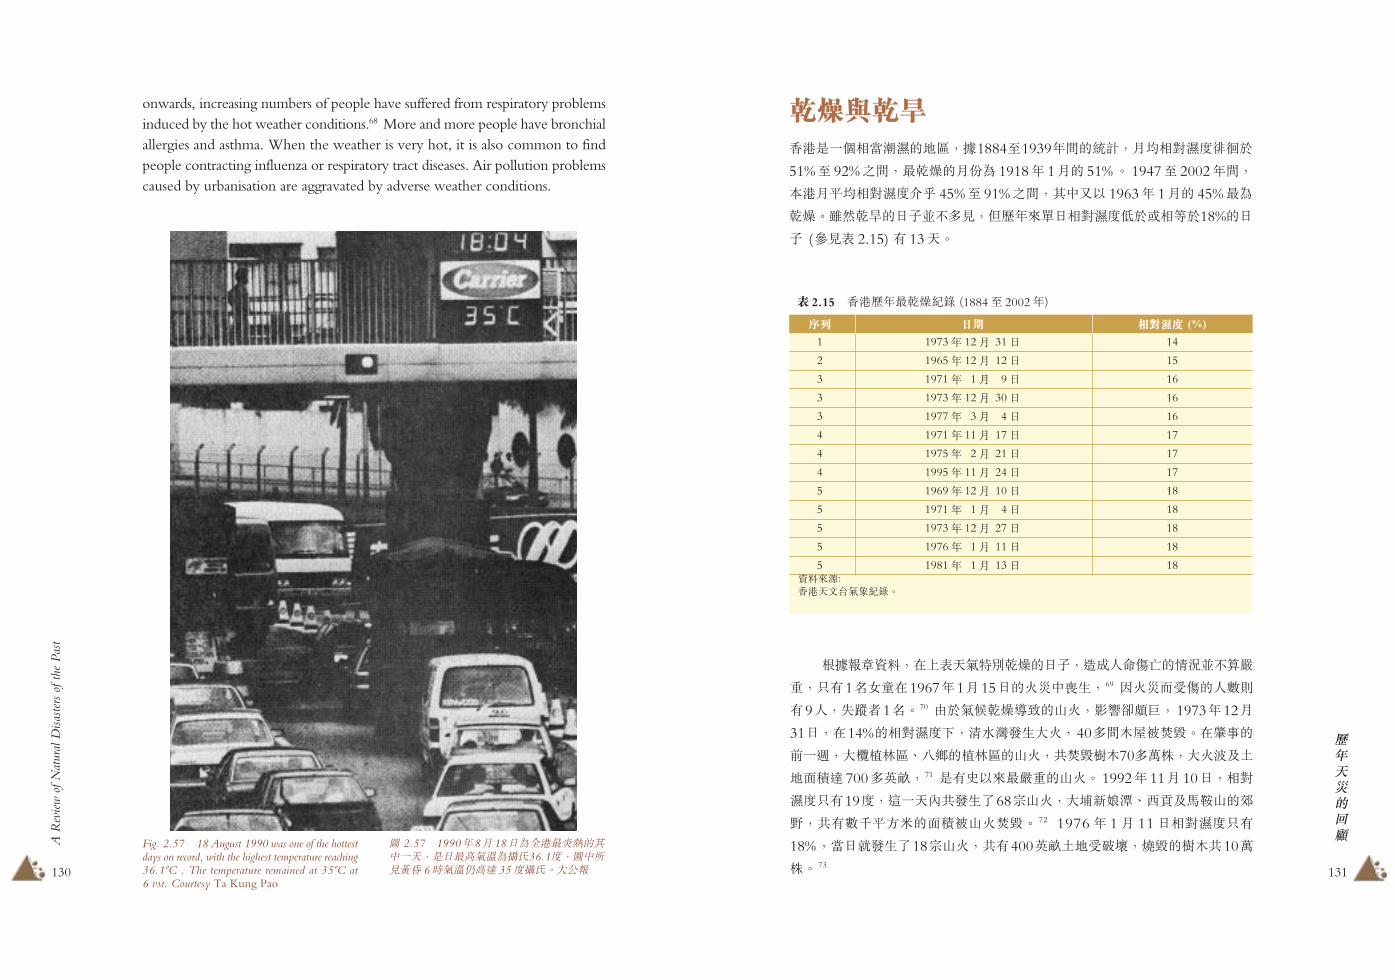
131
A R
evie
w o
f Nat
ural
Disa
ster
s of
the
Pas
t
130
!"#$%&'
�����&'©ª'�§^x(mÙ%}1884�1939#�(lì%�Ü�vxêyzP
51%� 92%U�%3�{(��s 1918# 1�( 51%> 1947� 2002#�%
Ä'�¯Ü�vxêMN 45%� 91%U�%ÔDxF 1963# 1�( 45%3s
�{>ô3��(J+ù¾@v%X¯#A<J�vxê$P'��P18%(J
+ (ôv÷ 2.15) + 132>
# 2.15ÿ&'¯#3�{2a (1884� 2002#)
�� ?@ ���� (%)
1 1973# 12� 31J 14
2 1965# 12� 12J 15
3 1971# 1� 9J 16
3 1973# 12� 30J 16
3 1977# 3� 4J 16
4 1971# 11� 17J 17
4 1975# 2� 21J 17
4 1995# 11� 24J 17
5 1969# 12� 10J 18
5 1971# 1� 4J 18
5 1973# 12� 27J 18
5 1976# 1� 11J 18
5 1981# 1� 13J 18��Aø:&'2QR¥¦2a>
|}����%CÅ÷2¥5ö�{(J+%yS8º?(7äù¾��
2%×+1a*|C1967#1�15J(¤4DÄ�%69 9¤4�I?(8¼w
+98%¾åB1a>70 OP¥¾�{�É(j¤%JK0}Ç%1973#12�
31J%C14%(�vxê %�<°H�;¤%40@�glzïf>C�Ì(
Gª~%;��7Ù_g1(�7Ù(j¤%Uïf�g70@3�%;¤3bò
máîÎ 700@É�% 71 ©+§FA3�2(j¤> 1992# 11� 10J%�v
xê×+19ê%üª2ÜUH�,68�j¤%;KW��_±�bO�j(�
1%U+¼8¯Áâ(áîzj¤ïf> 72 1976# 1� 11J�vxê×+
18%%§JnH�,18�j¤%U+400É�òmI:j%ðf(�gU103
�> 73
onwards, increasing numbers of people have suffered from respiratory problemsinduced by the hot weather conditions.68 More and more people have bronchialallergies and asthma. When the weather is very hot, it is also common to findpeople contracting influenza or respiratory tract diseases. Air pollution problemscaused by urbanisation are aggravated by adverse weather conditions.
Fig. 2.57 18 August 1990 was one of the hottestdays on record, with the highest temperature reaching36.1ºC . The temperature remained at 35ºC at6 PM. Courtesy Ta Kung Pao
¤ 2.57ÿ1990#8�18Js6'3m�(ÔDª2%©J3�¥Üs¯#36.1ê%¤Dhv�� 6H¥ÜL�Î 35ê¯#>;��
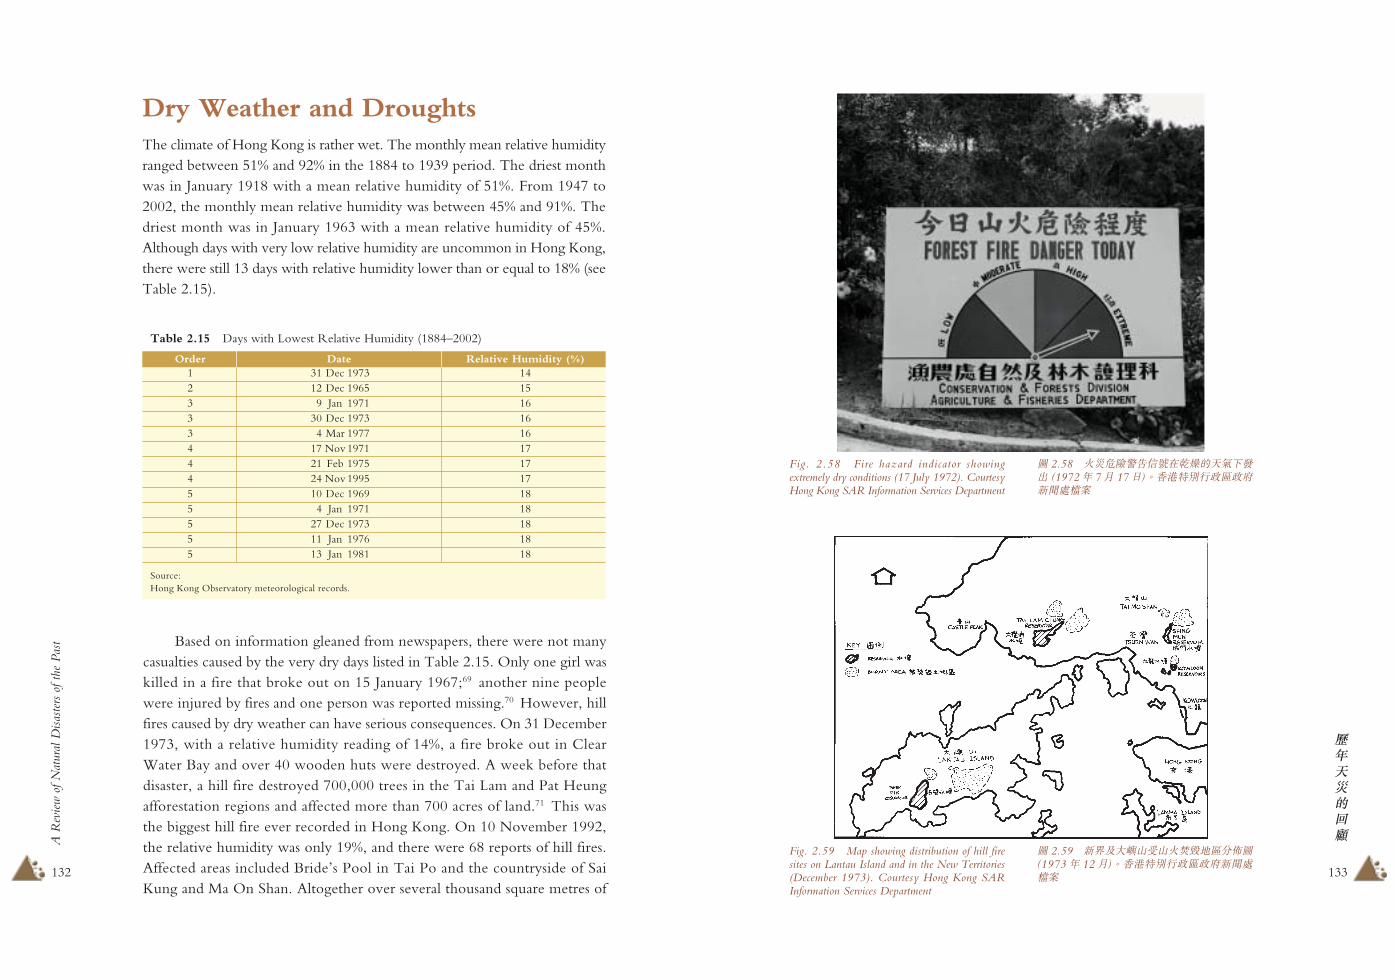
133
A R
evie
w o
f Nat
ural
Disa
ster
s of
the
Pas
t
132
!"#$%&'
Fig. 2.58 Fire hazard indicator showingextremely dry conditions (17 July 1972). CourtesyHong Kong SAR Information Services Department
¤ 2.58ÿ¤4*X"#~lC�{(2¥ HÑ (1972# 7� 17J)>&'5ö·~Ù~�WíîËÌ
Fig. 2.59 Map showing distribution of hill firesites on Lantau Island and in the New Territories(December 1973). Courtesy Hong Kong SARInformation Services Department
¤ 2.59ÿWØb;=jIj¤ïfmÙñc¤(1973# 12�)>&'5ö·~Ù~�WíîËÌ
Dry Weather and DroughtsThe climate of Hong Kong is rather wet. The monthly mean relative humidityranged between 51% and 92% in the 1884 to 1939 period. The driest monthwas in January 1918 with a mean relative humidity of 51%. From 1947 to2002, the monthly mean relative humidity was between 45% and 91%. Thedriest month was in January 1963 with a mean relative humidity of 45%.Although days with very low relative humidity are uncommon in Hong Kong,there were still 13 days with relative humidity lower than or equal to 18% (seeTable 2.15).
Table 2.15 Days with Lowest Relative Humidity (1884–2002)
Order Date Relative Humidity (%)1 31 Dec 1973 142 12 Dec 1965 153 9 Jan 1971 163 30 Dec 1973 163 4 Mar 1977 164 17 Nov 1971 174 21 Feb 1975 174 24 Nov 1995 175 10 Dec 1969 185 4 Jan 1971 185 27 Dec 1973 185 11 Jan 1976 185 13 Jan 1981 18
Source:Hong Kong Observatory meteorological records.
Based on information gleaned from newspapers, there were not manycasualties caused by the very dry days listed in Table 2.15. Only one girl waskilled in a fire that broke out on 15 January 1967;69 another nine peoplewere injured by fires and one person was reported missing.70 However, hillfires caused by dry weather can have serious consequences. On 31 December1973, with a relative humidity reading of 14%, a fire broke out in ClearWater Bay and over 40 wooden huts were destroyed. A week before thatdisaster, a hill fire destroyed 700,000 trees in the Tai Lam and Pat Heungafforestation regions and affected more than 700 acres of land.71 This wasthe biggest hill fire ever recorded in Hong Kong. On 10 November 1992,the relative humidity was only 19%, and there were 68 reports of hill fires.Affected areas included Bride’s Pool in Tai Po and the countryside of SaiKung and Ma On Shan. Altogether over several thousand square metres of

135
A R
evie
w o
f Nat
ural
Disa
ster
s of
the
Pas
t
134
!"#$%&'
Rj¤T%C¥¾�{(¸<%�é3IS�(©$ mæ(MÅ�>
1950#$�1970#$%§87��b!X��[�%ëECglÙ(ë�b�
+¿�©¬(!è;A��*ª[%9¤4�÷û��(4�¼rjFlì>
��{¥¾Æ¤4©�+g¥(�ä�F +�&'+§FA8º?3�2(
¤4b§J2¥7ä(2a (ôõ÷ 2.16) (��'�<Tª9S�>
»Å÷�v%9¤4�H��28º?(6T%�Æ�{(¥¾+g¥�
ä%�¯§Å6Æ�{¥¾�Å�¶(�2¤4%n×+1961#1�16JPÍ
Îj'Ó(¤4>©ï¤4+68zð¬%118I?%1,200@�glzïf%
4�8¼@Î11,000@8%�§J(¥Üs¯#17ê%�vxê×+28%>74
�!�_%ª9yS�2zf(¤4%@�8s��(6TÌ�>
¤4(H��3I8s98JK�;%9:87�âý_ëEÕF��(g
lÙb!èÙ%C 1950#$� 1970#$�%H�¤4(ð���> 1980#$
F>%e�(6Tú_J«% 1990#H�(V��2¤4%¡¢ÊËѤC²
2;A(H¤�+ú²%v¤�Ó�ì^6!�fH�]%ªSÌ�RyS�2
(8º?>
land was scorched.72 On 11 January 1976, the Observatory recorded a relativehumidity of 18%, and on that day 18 hill fires broke out, damaging 400acres of land and burning down 100,000 trees.73
Fig. 2.60 A Royal Air Force Wessex helicopterdropping some 1,400 litres of water on a fire in theKowloon Hill area (October 1979). Courtesy HongKong SAR Information Services Department
¤ 2.60ÿúûÇÞ¿£g=;�êÚyjj¤Õä>¤D(<��ïç�Þ< 1400 �=(1979# 10�)>&'5ö·~Ù~�WíîËÌ
Apart from hill fires during the dry season, the lives of the lower classescan also be endangered. From the 1950s to 1970s, when Hong Kong’spopulation was expanding rapidly and when industries started to take off,people living in wooden huts and factories storing inflammable materials wereexposed to high fire risks. It is difficult to estimate the number of people wholost their homes because of fires. To determine whether there is a directcorrelation between the outbreak of fires and very dry weather, Table 2.16lists the fires with the largest number of casualties and the weather conditionsat the time of the outbreaks.
# 2.16ÿ&'¯A3�2¤4H�m:ƧJ¥¾2a (1851� 2002#)
?@ �XB:�� ���� $%F� ba^c d`^c(%) (�+�)
1918# 2� 26J �O® 89 22 600 Ø
1947# 2� 4J ±Ûl0� 72 18 200 Ø
1948# 9� 22J ±ÕÏÛ��¾ 95 27 139 Ø
1996# 11� 20J ¡¢y¿;A 57 23 40 80
1971# 10� 30J »"³�£ 62 25 34 10
1992# 2� 3J �£��D$ 90 21 22 Ø
1929# 3� 11J Éú¤í 66 22 ¬? 30m8
1851# 12� 28J &'è 89 Ø ¬? 20m8
1997# 1� 25J dZe"¥¦Wª$ 71 13 15 ا²OKí
1972# 5� 11J ±Ù�Ée¨$²Â 94 29 12 Ø
1981# 1� 20J µF¨�Ó 70 18 11 ت$!X;A
��Aø?ü;��ý%üà�ý%ü½èJ�ý%üþ#J�ý�%P��JE(��>û©%ü&';Ì`ý%0%8�J�ÑÒw% 1988#>&'2QR¥¦2a>úª_«Ú¬%ü&'62aý%&'%Dþ(Ã% 1997#>

137
A R
evie
w o
f Nat
ural
Disa
ster
s of
the
Pas
t
136
!"#$%&'
ô3&'(2¥;Y�H�^x@�%Xª9��(#Æ%vwx]xy
S2;(:j>OPÄ'FÜ\]23<�øTð�®£%srm<(�ø¾
.%~�P1863#üý�y8!< %�¯23�<%F�ð�JDUh>
oÙÚ×2DEFA%&'(87¾q�-%~�G�< (°;!±%C#�
��Î ¯Ü<¯� 2,221îâ'FÅ(#�%±²T©#hh>XCª9
2�¾yñ(�#%³;(< %8æ�;�÷§>1884�2002#�%$P
1,600îâ���(ð�ô×5 7%¸$%�<�B©�§ä´%XF 1960#
2¥ 3003(87%µ�¯<�×+ 7,0063TÁâ(< ÒT¶6'ð�®
£<hh�_%2�næS,Å2vð�3;(·¸>F +�3��#�(�
��b�8JÜ£<��^_§D(Âä (ôõ÷ 2.17)>
From Table 2.16, it can be seen that fires that cause severe human casualtiesbear very little relation to dry weather conditions. Throughout Hong Kong’shistory, the only fire that was linked to dry weather conditions was the onethat broke out on 16 January 1961 on Valley Road, Hung Hom. Six peoplewere burnt to death, 11 were injured and 1,200 wooden huts were razed tothe ground. Up to 11,000 people were affected. The temperature on that daywas 17ºC with a relative humidity of 28%.74 Most of the devastating fireswere largely due to human negligence.
Since fire outbreaks were usually due to man-made factors, thus denselypopulated areas with unfavourable living conditions, such as the squatter andthe factory areas, had high incidence of fires in the 1950s and 1960s. Fromthe 1980s onwards, the incidence of similar accidents was gradually reduced.Of the few serious fires in the 1990s, the problem was largely due to ageingfire prevention facilities in the old-style buildings and fire exit design that did
Table 2.16 Most Serious Fires in Hong Kong and the Prevailing Weather Conditions(1851–2002)
Date Place Relative Highest Number NumberHumidity (%) Temperature (ºC) of Deaths of Injuries
26 Feb 1918 Racecourse 89 22 600 –
4 Feb 1947 Vessel Siam 72 18 200 –
22 Sep 1948 The godown of 95 27 139 –Wing On Companyin Western District
20 Nov1996 Garley Building in Jordan 57 23 40 80
30 Oct 1971 Jumbo Seafood 62 25 34 10Restaurant
3 Feb 1992 Shek Kong 90 21 22 –Detention Centre
11 Mar 1929 King’s Hotel 66 22 about 30
28 Dec 1851 Hong Kong Island 89 – about 20
25 Jan 1997 Top One Karaoke on 71 13 15 –Prat Avenue,Tsim Sha Tsui
11 May1972 Two old buildings in 94 29 12 –Shek Tong Tsui,Western District
20 Jan 1981 An industrial building 70 18 11 –on Tsat Tsz Mui Road,North Point
Sources:Chen, Xin and Guo, Zhikuan, Xianggang quan jilu (The Full Records of Hong Kong), Hong Kong, Zhonghua
shuju, 1997.Hong Kong Observatory meteorological records.Li, Hong, Xianggang dashiji (Records of Major Events of Hong Kong), Beijing, Remin ribao (People’s Daily), 1988.Reports on the day of the incidents in Ming Pao, Sing Tao Daily, Ta Kung Pao, Wah Kiu Yat Po, etc.
|}~�2a (÷ 2.17)% 1884� 2002#&'3��(#�s 1963#%
6#×���×+901îâ%��#¯Ü���«59%%�©#6'ÊË<É(
ׯ�s 2,5473TÁâ%F§H 3553(87ì�%�8�J¯Ü×¹ 0.020
TÁâ(°<T% ð1990#$('8�8�J¯Ü£<�(0.409TÁâ«
19.5�>OP��÷�%~�Õ+ò2T<òNH(â+%6'(!_"XH/
vqáêªj(Fä%i@º<��;(·X=®°_»tb�u�zz{X%
ªãâD(wYéÀ%9\]®°<�¼{>ð��2s°<¼3%£@89½
°<H�¾`�I?_s½°<�6T¬(]+%]¿v¾�> 75
# 2.17ÿ&'���3$Ù# (1884–2002#)
|8 �|��� �}�^� ¡�¢� Q^?T£ �(��) (¤¥) (¤¥¦§�) (¦§�)
1963 901 3.55 25.47 0.020
1895 1,164 0.24 4.31 0.049
1954 1,367 2.40 54.02 0.062
1938 1,406 1.03 31.73 0.084
1901 1,419 0.28 5.85 0.057
1870 1,424 0.12 Ø Ø
1865 1,431 0.13 Ø Ø
1898 1,448 0.25 5.42 0.059
1967 1,571 3.80 100.54 0.072
1933 1,585 0.92 22.54 0.067
��Aøù)À3%ü&'T<ªÅ�Ù#¯§ÁÂ�#ý%&'%~�¡[Ã% 2001#%ö÷ IØ 3% IØ 5%
IIØ 1% IIØ 4% IIIØ 1% IIIØ 5>Census and Statistics Department, Hong Kong Statistics 1947–1967, Hong Kong, 1961, p. 14.Hong Kong Observatory, Monthly Total Rainfall (mm) at the Hong Kong Observatory, Hong Kong Government,
1884–2001.Water Supplies Department, Hong Kong’s Water, Hong Kong, Government Printer, 1996, p. 93.
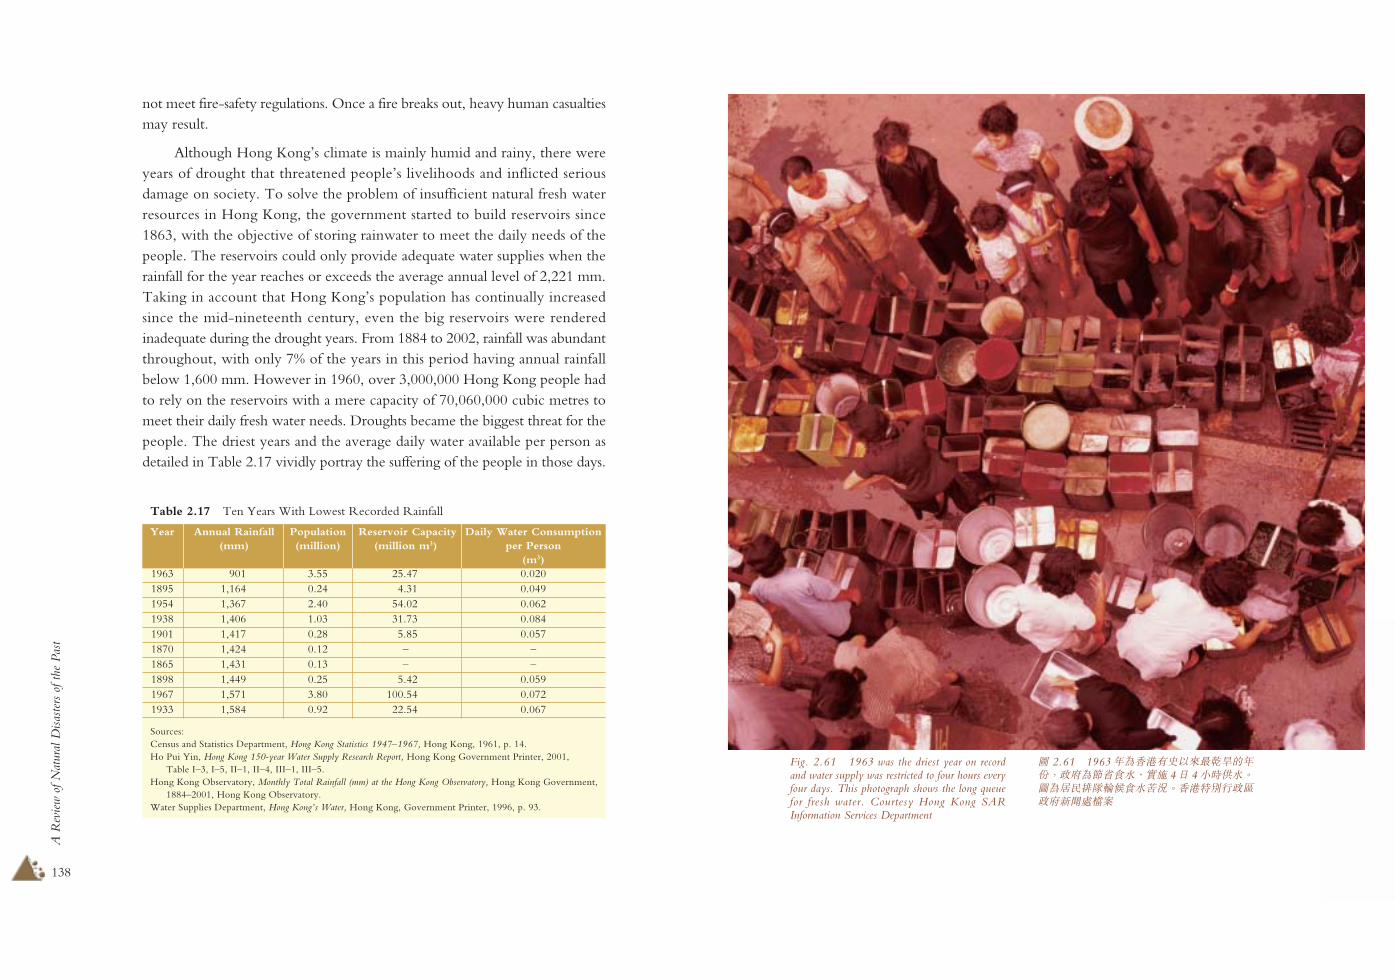
139
A R
evie
w o
f Nat
ural
Disa
ster
s of
the
Pas
t
138
!"#$%&'
Fig. 2.61 1963 was the driest year on recordand water supply was restricted to four hours everyfour days. This photograph shows the long queuefor fresh water. Courtesy Hong Kong SARInformation Services Department
¤ 2.61 1963#s&'+§FA3��(#�%~�s<¨°<_Õ+ 4J 4NHT<>¤së�.-0¾°<Âä>&'5ö·~Ù~�WíîËÌ
not meet fire-safety regulations. Once a fire breaks out, heavy human casualtiesmay result.
Although Hong Kong’s climate is mainly humid and rainy, there wereyears of drought that threatened people’s livelihoods and inflicted seriousdamage on society. To solve the problem of insufficient natural fresh waterresources in Hong Kong, the government started to build reservoirs since1863, with the objective of storing rainwater to meet the daily needs of thepeople. The reservoirs could only provide adequate water supplies when therainfall for the year reaches or exceeds the average annual level of 2,221 mm.Taking in account that Hong Kong’s population has continually increasedsince the mid-nineteenth century, even the big reservoirs were renderedinadequate during the drought years. From 1884 to 2002, rainfall was abundantthroughout, with only 7% of the years in this period having annual rainfallbelow 1,600 mm. However in 1960, over 3,000,000 Hong Kong people hadto rely on the reservoirs with a mere capacity of 70,060,000 cubic metres tomeet their daily fresh water needs. Droughts became the biggest threat for thepeople. The driest years and the average daily water available per person asdetailed in Table 2.17 vividly portray the suffering of the people in those days.
Table 2.17 Ten Years With Lowest Recorded Rainfall
Year Annual Rainfall Population Reservoir Capacity Daily Water Consumption(mm) (million) (million m3) per Person
(m3)1963 901 3.55 25.47 0.0201895 1,164 0.24 4.31 0.0491954 1,367 2.40 54.02 0.0621938 1,406 1.03 31.73 0.0841901 1,417 0.28 5.85 0.0571870 1,424 0.12 – –1865 1,431 0.13 – –1898 1,449 0.25 5.42 0.0591967 1,571 3.80 100.54 0.0721933 1,584 0.92 22.54 0.067
Sources:Census and Statistics Department, Hong Kong Statistics 1947–1967, Hong Kong, 1961, p. 14.Ho Pui Yin, Hong Kong 150-year Water Supply Research Report, Hong Kong Government Printer, 2001,
Table I–3, I–5, II–1, II–4, III–1, III–5.Hong Kong Observatory, Monthly Total Rainfall (mm) at the Hong Kong Observatory, Hong Kong Government,
1884–2001, Hong Kong Observatory.Water Supplies Department, Hong Kong’s Water, Hong Kong, Government Printer, 1996, p. 93.

141
A R
evie
w o
f Nat
ural
Disa
ster
s of
the
Pas
t
140
!"#$%&'
/¨oÖFA%&'wx(H/n�éáv¾qq«(o345(A>¯A:j
73é(24Fe4_�4_�4sÊ?1874_ 1906_ 1937_ 1962#(e
4% 1972#(�4% 1895_ 1963#(�4%¾XÄÒ÷¼ë�("ÅHº%
vwxhyS()*z¾U©÷�÷ì>
¶#24%v$ mæ(ÊM¦N>CÙÚ×2 èE_�Ù×2kE%2
4(%&B@së÷åh(@�>1950#$�1970#$%IÊM3;Bwsë
ECglÙ(ÆÂ;�> , 1970#$DEF>%§&')*(��+�;E
G%~�CH24(67<=%8�(�éÛwÂ�å>áv24(Ç�%&'
wx»÷Èm¥IÅ2(·¸% ÉÊ;o3(5HÆËÍ�îáH1%üÓÆ
©�§Ì-(%eH8¦ÍÔ¤$wxÎóϧ("P>§D2QRЧ,�§
Ý2(µ\%F +�2QR(ÑTÆÒ6%8£6¶ÓÔ.ª9Õë>
According to government records (Table 2.17), 1963 was the driest yearin Hong Kong for the period of 1884 to 2002. In that year, the total rainfallwas only 901 mm, 59% less than the normal annual precipitation. The reservoirsonly had a capacity of 25,470,000 cubic metres of water. With a population of3,550,000, each person only received a daily supply of 0.020 cubic metres onaverage. This compared to the average daily water consumption per personfigure of 0.409 cubic metres in the 1990s — a difference of 20.5 times. Owingto the persistent drought, the government had to restrict water supply to fourhours every four days. The development of industry and commerce in HongKong was mired in an extremely difficult situation. Many businesses thatrequired substantial water consumption, such as restaurants and catering, dyeingand construction, were forced to close down. All normal social activities weretemporarily suspended due to drinking water shortages. Every day, peoplehad to desperately look for drinking water and many people suffered injuriesas a result of fights over it. Accidental deaths in brawls over fresh water werealso rather common.75
ConclusionThroughout history, the development of Hong Kong society has resembled aseries of responses to the never-ending list of natural disasters, with typhoons,rainstorms and droughts being the most destructive. The disasters brought onby the ferocious typhoons of 1874, 1906, 1937 and 1962, by the rainstorms of1972, and by the droughts of 1895 and 1963, not only took many lives butalso brought incalculable economic losses.
Successive years of natural disasters have affected the lower classes thehardest. In the late nineteenth and early twentieth centuries, many of thevictims were itinerant fishermen. Between the 1950s and 1970s, people livingin cottage areas were the main sufferers. After the mid-1970s, when HongKong’s economic conditions improved and the Hong Kong government’scapacity to prevent disasters increased, people’s lives became more stable. Inresponse to such natural catastrophes, Hong Kong society has evolved frompassively accepting them as punishments from Heaven to positivelyunderstanding the characteristics and patterns of nature and taking preventivemeasures. This symbolises the scientific and technological advances made in amodern society, of which the Hong Kong Observatory has played anindispensable role. The next chapter will discuss the establishment of theObservatory and its functions.