Embed Size (px)
Citation preview
A Review of Organizational Structure of the
North Orange County Community College District
Conducted by
The Collaborative Brain Trust Consultants
Brice W. Harris Jean Malone
Nga Pham Jon Sharpe
April 9, 2018
1130 K Street, Suite 150 Sacramento, California 95814 | 916.446.5058 | collaborativebraintrust.com
The Collaborative Brain Trust 1
Table of Contents
EXECUTIVE SUMMARY ............................................................................................................................ 4
PROJECT OVERVIEW AND METHODOLOGY ............................................................................................. 6
Background ......................................................................................................................................... 6
Scope of the Project ............................................................................................................................ 6
Phase 1 – Facilitate Initial Discovery, Project Planning and Initial Interviews ................................. 6
Phase 2 – Finalize Document Review, Conduct Second Round Interviews and Administer Employee Survey ............................................................................................................................. 6
Phase 3 – Research Analysis and Report Development ................................................................... 6
Process for the NOCCCD Organizational Structure Review .................................................................. 7
A Review by Exception ........................................................................................................................ 7
THE CASE FOR ORGANIZATIONAL STRUCTURE ........................................................................................ 8
The Importance of Organizational Structure ....................................................................................... 8
Key Elements of an Effective Organizational Structure and Principals of Review ................................ 8
Centralization and Decentralization in a Multi-College District ........................................................... 9
The Relationship between Staffing the Organization and the Organizational Structure ................... 10
The Relationship between Staffing and Finances .............................................................................. 11
OBSERVATIONS AND ANALYSIS ............................................................................................................ 12
Observations and Findings from the Review of Background Documents, Individual/Group Interviews and Employee Survey Results ........................................................................................................... 12
Level of Decentralization ............................................................................................................... 12
Position Control ............................................................................................................................ 12
Efficiencies and the Financial Health of the District ...................................................................... 13
Supplemental Early Retirement Plan ............................................................................................. 15
Organizational Structure of NOCE ................................................................................................. 15
Organizational Structure of Cypress College.................................................................................. 15
Organizational Structure of Information Technology .................................................................... 16
Organizational Structure of Human Resources .............................................................................. 16
Budget Allocation .......................................................................................................................... 16
Management Retention Levels...................................................................................................... 17
Districtwide Communication ......................................................................................................... 18
Enrollment Management, Marketing and Outreach...................................................................... 18
RECOMMENDATIONS............................................................................................................................ 19
The Collaborative Brain Trust 2
1. Rebalance the Centralization and Decentralization of Activities within the District, and Providea Clear Explanation of the Responsibilities of the Colleges, NOCE and District Services ................... 19
2. Establish the Coordinating Role of the District .......................................................................... 19
3. Establish Standards for Staffing Within the District ................................................................... 21
4. Develop and Implement a Position Control System .................................................................. 21
5. Affect Any Reorganization of the District, Colleges and NOCE; Few or No Added Positions ...... 22
6. Reorganize the North Orange Continuing Education Unit ......................................................... 23
7. Reorganize Cypress College Instructional and Student Services ................................................ 23
8. Realign Human Resource Personnel Specialists ......................................................................... 23
9. Implement the Position of Associate Dean ................................................................................ 24
10. Restructure Information Services .......................................................................................... 24
11. Better Coordinate Enrollment Management, Marketing, and Outreach................................ 24
12. Implement an Expanded Program of Professional Development .......................................... 25
13. Establish Consistent Safety Processes and Procedures .......................................................... 25
SUMMARY AND PLAN OF ACTION ........................................................................................................ 27
APPENDIX ............................................................................................................................................. 28
A. Documents Reviewed and Current District and College Organizational Charts ......................... 29
B. Groups and Individuals Interviewed During the Project ............................................................ 34
C. Sample Survey Instrument ......................................................................................................... 42
D. Total Survey Results for North Orange County Community College District ............................... 48
E. Survey Results for Cypress College ............................................................................................. 72
F. Survey Results for District Services ............................................................................................ 92
G. Survey Results for Fullerton College ......................................................................................... 109
H. Survey Results for North Orange Continuing Education ........................................................... 130
I. FTE Employee Analysis of Comparative District and Colleges by FTES ..................................... 150
J. State Recommendation on Position Control ............................................................................ 155
K. NOCCCD Average Class Size ..................................................................................................... 158
L. WSCH/FTES Comparison by College/Unit ................................................................................. 160
M. Draft Revised Organizational Chart for North Orange Continuing Education ..........................164
The Collaborative Brain Trust 3
North Orange County Community College District Organizational Structure Review
EXECUTIVE SUMMARY
The North Orange County Community College District requested outside assistance during 2017 to review the District’s organizational structure. The Collaborative Brain Trust (CBT) was selected and undertook a five-month review in three phases. Four consultants conducted numerous interviews, administered a survey of employees and reviewed historical documents of the colleges, District and the North Orange Continuing Education unit. This report includes a case for an effective organizational structure, the review and analysis of the CBT research of the District, and a series of recommendations which are designed to help the District and its units improve service to their students and the community.
NOCCCD, Cypress College, Fullerton College and the North Orange Continuing Education unit are effectively serving their students and community. This is a generally healthy multi-college district with many exemplary programs and services. The CBT review, however, is designed to identify challenges and problems and to make recommendations for improvement. Therefore, this report, by its very design, focuses on the opportunities for improvement rather than all the many day-to-day exceptional and successful programs and processes currently being done within the district. Although some of the issues CBT discusses in this report are significant and worthy of expedited attention, excellent teaching and learning and service to students is underway daily throughout the District and its colleges and units.
In reviewing the operation of the District and its colleges/NOCE, the CBT team found a highly decentralized multi-college district. The District is currently financially healthy, but a declining enrollment combined with staffing increases over the past few years have created a troubling structural deficit. The District lacks an adequate position control system, and their overall staffing level per Full Time Equivalent Student (FTES) is higher than comparable districts. This lower level of productivity adds strain on the District’s budget and is unsustainable over a long period of time.
Organizationally at Cypress College, the CBT team found a less than optimal structure with too much responsibility on some managers and lighter loads with others. At NOCE the structure is too flat making it difficult for the Provost to manage a large number of reports. In Information Technology and Human Resources, the consultants found opportunities for better districtwide coordination and reduction in duplication.
The District has adequate one-time-only resources to manage their current low productivity and less than optimal organizational structures but sustaining these inefficiencies
The Collaborative Brain Trust 4
will be difficult. The current budget allocation model is mostly based on historical patterns, and although this model can work, over time with changing enrollment and programmatic adjustments it can result in disparities in funding levels between colleges, NOCE and District Services.
The team also found significant opportunities for the District to enhance communication, enrollment management, outreach and marketing to improve operations and grow enrollment. And, there are opportunities for better coordination of grants and the Foundations within the District.
As a result of this data collection, interviews, review and analysis, the CBT team has made thirteen recommendations for the District, colleges and units including:
1. Rebalance the Centralization and Decentralization of Activities within the District, and Provide a Clear Explanation of the Responsibilities of the Colleges, NOCE and District Services
2. Establish the Coordination Role of the District 3. Establish Standards for Staffing Within the District 4. Develop and Implement a Position Control System 5. Affect Any Reorganization of the District, Colleges and NOCE with Few or No Added
Positions 6. Reorganize the North Orange Continuing Education Unit 7. Reorganize Cypress College Instructional and Student Services 8. Realign Human Resource Personnel Specialists 9. Implement the Position of Associate Dean 10. Restructure Information Services 11. Better Coordinate Enrollment Management, Marketing and Outreach 12. Implement an Expanded Program of Professional Development 13. Establish Consistent Safety Processes and Procedures
The North Orange County Community College District is effectively providing education for its students and community. However, the District has significant structural issues that should be addressed in the coming months and years. New leadership throughout the organization, and the anticipation of employees leaving under the projected SERP offering, makes this an opportune time for a new action plan in many of the above-referenced areas. Some of the changes will need to be made over months and even years but developing a plan for these changes, and an accountability system to track them, should be a top priority for District leaders.
The Collaborative Brain Trust 5
PROJECT OVERVIEW AND METHODOLOGY
Background
In mid-2017, the North Orange County Community College District (NOCCCD and the “District”) sought professional assistance to review the district’s organizational structure. The Collaborative Brain Trust (CBT) was ultimately selected to conduct the project to begin in November of the same year and to be completed in early April of 2018. Four CBT consultants have spent numerous hours in data gathering via the Chancellor’s Office DataMart, interviews, survey, and document review, conducting research and analysis of the District and its colleges. What follows is the case for an effective organizational structure, the review and analysis of the CBT research of the District, and a series of recommendations to consider which are designed to help the District and its units improve the ability to serve its students and community.
Scope of the Project
The project was conducted in three phases:
Phase 1 – Facilitate Initial Discovery, Project Planning and Initial Interviews This phase was conducted between November 1, 2017 and February 1, 2018 and included the review of numerous documents provided by the District and colleges, the finalization of the project plan and conducting the first round of interviews of stakeholder leadership.
Phase 2 – Finalize Document Review, Conduct Second Round Interviews and Administer Employee Survey This phase was conducted during February of 2018 and provided a more detailed review of college and District planning documents, the District budget and a number of consultant-requested reports from the District and colleges. It also included the development and administration of a survey instrument completed by more than 500 District faculty, staff and administrators.
Phase 3 – Research Analysis and Report Development This phase was conducted during March and early April 2018 and included extensive work by the consultants in the analysis of the interview information, survey data and background material supplied by the District, as well as drafting the final project report.
The Collaborative Brain Trust 6
Process for the NOCCCD Organizational Structure Review
Before assessing the effectiveness of NOCCCD’s organizational structure, it was critical to have a good understanding of the current organization and how it operates. In order to facilitate this understanding, CBT undertook an in-depth review of the colleges, NOCE and District services. Many documents were reviewed including current organizational charts, accreditation documents, budget and finance related reports, and other miscellaneous information (See Appendix A).
In November 2017, CBT consultants interviewed the Chancellor’s leadership team and other constituent leaders (See Appendix B). Over the remainder of the project, CBT conducted more than fifty hours of individual and group interviews involving nearly 150 members of the District staff, faculty and administration (See Appendix B), surveyed more than 500 District employees (See Appendices C, D, E, F, G and H), conducted numerous follow-up conversations with District experts regarding specific issues, and analyzed the results of the input which contributed to the development of this report. Additionally, a project report was presented to the Board of Trustees at their regularly scheduled February Board meeting which provided a brief overview of the project and the process of review.
A list of comparable colleges, continuing educational programs, and districts was recommended by CBT and agreed to by the NOCCCD administration. Once developed, key staffing comparisons were made using statewide reports from DataMart, the annual California Community College 320 (enrollment) report, and the annual 311 (financial) report (See Appendix I).
Draft reports were prepared and reviewed by District officials, prior to the preparation of the final report, to ensure accuracy of the information.
A Review by Exception
NOCCCD, Cypress College, Fullerton College and the North Orange Continuing Education unit are effectively serving their students and community. This is a generally healthy multi-college district with many exemplary programs and services. The CBT review, however, is designed to identify challenges and problems and to make recommendations for improvement. Therefore, this report, by its very design, focuses on the opportunities for improvement rather than all the many day-to-day exceptional and successful programs and processes currently being undertaken within the district. Although some of the issues CBT discusses in this report are significant and worthy of expedited attention, excellent teaching and learning and service to students is underway daily throughout the District and its colleges and units.
The Collaborative Brain Trust 7
THE CASE FOR ORGANIZATIONAL STRUCTURE
The Importance of Organizational Structure
The organizational structure of a multi-college community college district is critical to how it functions and operates, both internally and externally. The structure provides for the reporting relationships between the colleges and the District and for the employees within the organization. In addition to providing the relationship of the various entities making up the District, the organizational structure essentially outlines the association and internal relationship of positions designed to fulfill the mission of the organization. Without an effective organizational structure, employees lack a clear understanding necessary to define their role in the fulfillment of the goals of their unit, the college and, ultimately, the District. To maximize the effectiveness and efficiencies of an organization, everyone must fully understand their role in the organization and their relationship to others in the college and District.
Although there are a number of ways to organize any college and/or district, most community colleges and community college districts have some structural elements which have become common over time because of their proven effectiveness. The organizational structure of the North Orange County Community College District and its colleges/units (See Appendix A) mirror, in many ways, the structure of most community colleges and districts throughout California. However, our analysis of the District and its colleges/units suggest a number of opportunities for improving the organizational structure for better fulfillment of the district’s mission. Those opportunities are detailed in the analysis and recommendations of this report.
Key Elements of an Effective Organizational Structure and Principals of Review
While there are many characteristics and key elements of an effective organizational structure, the CBT Review of NOCCCD focused on the following:
• The structure, represented by an organizational chart, should be clear and understandable to allow both internal (students and employees), and external constituents to effectively navigate the complex organization that is NOCCCD.
• The structure must reflect a reasonable “span of control” -- meaning managerial and supervisory oversight should encompass just the right number of direct reports; not too many nor too few.
• There must be functional relationships within the line of authority. This is to ensure interrelationships of functions within the specific “chain of command”. Organizational structures and charts may be relatively flat (meaning fewer levels of management direct reports), or relatively vertical (meaning typically more middle managers with less individual employee autonomy). The goal is to have a structure that is effective and efficient, as well as one that empowers employees while still maintaining an appropriate level of supervisory oversight.
The Collaborative Brain Trust 8
• The organizational structure must meet the needs of the overall organization and allow the District to fulfill its mission.
If these elements are achieved, the effectiveness and efficiency of the organization will be enhanced for both internal and external constituents.
Centralization and Decentralization in a Multi-College District
One of the more challenging and sometimes contentious issues in a multi-college district is the balance between the level of centralization and decentralization among and between the various units of the organization. In the case of NOCCCD, this relates to the two colleges, the North Orange Continuing Education unit, and the District office (District Services). While there is no universal structure for multi-college districts, the goal should be a balance between the effectiveness of services to the various constituents and the efficiency of the delivery system.
Centralization can often lead to the use of consistent/best practices, economies of scale, and the maximization of limited resources (both financial and human resources). Conversely, over centralization can result in a lack of meeting individual community and student needs, a loss of campus identity and entrepreneurship, and a stifling of educational innovation. There is no “one size fits all” way of meeting all the educational needs of a diverse student population and community.
Decentralization of services (especially related to teaching and learning) can result in positive outcomes. However, taken to the extreme, it essentially defeats the very purpose of a multi-college district. If each college within a district is given total autonomy, then many of the benefits of being a district are lost. Multi-college districts in the California community college system were initially created to effectively meet higher education needs of a very large and diverse student population spread over a significant urban, suburban and rural geography. To help avoid unnecessary duplications, districts were created that largely followed K-12 geographic boundaries with consideration for overall size and population. With statewide population and demographic changes, the make-up of the system has been slowly but constantly evolving. To meet these changes, a fairly rigid process of adding, consolidating or changing the makeup of college districts is followed and monitored by the California Community College Chancellor’s Office and ultimately the Board of Governors (BOG) of the California Community Colleges. The BOG, staffed by the California Community College Chancellor’s Office, is responsible for the approval of new community colleges and new community college centers. That process is a protracted and deliberate one requiring significant review and justification over a long period of time in order to ensure that services are delivered where needed and that excessive duplication does not occur.
Regardless of the composition of a district (single or multi-college), the way in which a district organizes its services is largely left up to the individual district overseen by a locally-elected Board of Trustees. Once colleges are approved as part of a district, however, state requirements specify many responsibilities of the “District” including meeting various
The Collaborative Brain Trust 9
regulations (both programmatic and financial). As an example, community college districts in California are required to conduct an annual financial audit which reviews the entire district’s finances--not just that of an individual college within the district. Similarly, while only individual colleges are accredited, the role of the “District” is a critical component of the accreditation process. If fact, this issue of what entity (the college or the district) has responsibility for specific functions in a multi-college district is so significant that accreditation requires that a Functional Map be developed by each college in a multi-college district which identifies where various responsibilities are housed. Once multi-college districts are formed, it is impossible to meet all regulatory, legal and statutory requirements without a leadership and coordination role of the district office. Therefore, the very organization of a multi-college district requires an appropriate level of centralization.
The Relationship between Staffing the Organization and the Organizational Structure
California’s community colleges are primarily funded based on enrollment. This enrollment is measured by the number of full time equivalent students (FTES). While there are exceptions to this method (including numerous categorical programs), most college and district funding is based upon the number of students it serves. And, while the Legislature is currently considering a change in the funding model for community colleges to a more demographic and outcome-based model, the current proposal will still allocate a majority of funds based upon enrollment. Due to current statewide budget restraints, the system is allocated a certain amount of money which results in each district having a maximum number of students for which it is eligible to be paid. This effectively results in a maximum number of students who the state will fund which is commonly referred to as the “enrollment cap” for the district.
Because there is a maximum level of funding per district, it is critical that districts use these funds in the most effective and efficient manner possible when providing educational and support services to its students and the communities they serve. The goal is to serve as many students as possible to the greatest level of student success, as is possible, within the available funding. Because the vast majority of these resources are expended on personnel who deliver the educational and support services, the way a college/district is staffed is crucial to maximize student access and success.
Therefore, while there are many measurements of staffing, CBT analyzed staffing ratios to identify trends using “industry” norms, comparable districts, and the districts own staffing levels over the past five years. A common industry measurement used in higher education and California’s Community Colleges is the number of weekly student contact hours (WSCH) per full-time equivalent faculty (FTEF). Instructional staffing levels are a significant component of an effective Enrollment Management system which should balance the delivery of educational services with the number of students enrolled. In addition to the number of students a college/district enrolls and serves, other major staffing issues relate to organizational structure. Some of these include: span of control (supervising not too many nor too few employees for a given area), functional relationships, uniqueness or required expertise of a given area, facility
The Collaborative Brain Trust 10
square footage and complexity, and the required timeliness of a given service. All of these have a significant impact on the optimal organizational structure for an organization.
The Relationship between Staffing and Finances
Many statutes and regulations influence staffing levels, including the 50% law which requires that at least 50% of the operational budget of a district be spent on instructional services. In addition, the full-time/part-time faculty ratio (75/25% goal) and categorical regulations often limit or require a certain level of staffing for a program. And, since several specific positions are required (ex. Chancellor/President, categorical program managers, etc.) further restrictions influence the level of funding to staff an organization. Once these requirements, statutes, and regulations are implemented, along with basic operational requirements, it is not unusual for a California community college district to expend 85% of its unrestricted budget to staff the organization. If efficient and appropriate staffing strategies are not used, fewer funds become available for non-compensation-related costs. And, if an appropriate level of funds is not expended on competitive salaries and benefits, the number of qualified staff can be adversely affected. Therefore, it is essential that the staffing levels be efficient and that staff are paid competitively. However, those expenditures must remain well within the financial constraints of the district to protect the financial health of the organization and assure its long-term viability.
The Collaborative Brain Trust 11
OBSERVATIONS AND ANALYSIS
Observations and Findings from the Review of Background Documents, Individual/Group Interviews and Employee Survey Results
Level of Decentralization
Information from our review and from feedback received from many constituents indicate that the District has evolved into a very decentralized organization. As identified earlier, there are advantages for the decentralization of certain services. While it is not optimal to become over centralized, we found the balance in NOCCCD has shifted to a significantly decentralized model. Again, this finding was not only identified through district documents and current practices, but it is the perception of many of the participants interviewed. In fact, on many levels the District is not operating as a district, but rather four separate, and in many cases somewhat unrelated, institutions – those being Cypress, Fullerton, NOCE and District Services (DS). The survey of employees, when asked about the organizational structure of DS, revealed that more than a third of respondents disagreed or strongly disagreed that the current balance of centralization and decentralization between DS and the colleges/NOCE works well, and a similar percentage disagreed or strongly disagreed that the current division of labor between DS and the colleges/NOCE is clear and understandable (See Appendix D). The current highly decentralized approach has resulted in inconsistencies and confusion among staff. There is a loss of opportunity on multiple levels including: services to students, economies of scale, sharing of best practices, and lost efficiencies. One way to summarize the perception of the DS role in the organization was expressed by an employee when asked what the role of DS should be: “District does what the campus doesn’t want to do.” Unfortunately, if this is the general attitude, which it appears to be, it is greatly underutilizing the potential and synergy of DS and diminishes valuable resources, both human and financial, away from other district priorities. Highly decentralized multi-college districts such as NOCCCD can also have significant exposure if they conduct their business – especially service to students – differently within the same district. If for example, different application or acceptance practices are used at different colleges within the same district, students may justifiably challenge those inequities.
Position Control
While the district professes to have a Position Control system, a close investigation reveals it is more accurately a position inventory system. A true Position Control system, which is highly recommended by the State (Appendix J-item 10) and most educational
The Collaborative Brain Trust 12
experts, is one that allocates the number of full-time equivalent (FTE) positions to fulfill a given responsibility (the number of classroom instructors or support services personnel). Positions are then controlled by Human Resources and Finance and not added unless there is an authorized change by a standardized method of review and approval. A system of this kind is especially critical in an organization such as NOCCCD which is already expending an extremely high percentage of their total budget on human resources and human resource-related costs (as detailed in the next section of the report). Currently in NOCCCD, the colleges and NOCE can create and add positions, essentially at their discretion, if they meet the sole criteria of having the funds. A centralized and standardized method of review and authorization of filling vacancies and adding new positions is critical to maintain control of the budget with regard to staffing. The lack of adequate controls in the area of staffing is evidenced by unmonitored hiring of adjunct faculty combined with the significant reduction in WSCH/FTEF over the past five years (See Appendix K).
Efficiencies and the Financial Health of the District
Currently, measured by several methodologies, the District is expending approximately 90% of operational funds on employee staffing, salaries and benefits. This results in a great deal of financial uncertainty for the future, especially when enrollment has been on the decline and is not projected to grow substantially in the near future. Over-encumbering the budget with ongoing salary and benefit costs can also result in restricting new program opportunities for students. The District must address this issue to ensure future stability for programs and services. Indications are that district funded benefit costs are relatively low compared to other districts (per NOCCCD HR Department and School Services 2015 Review of Managements Positions) which could compromise the employee recruitment and retention process.
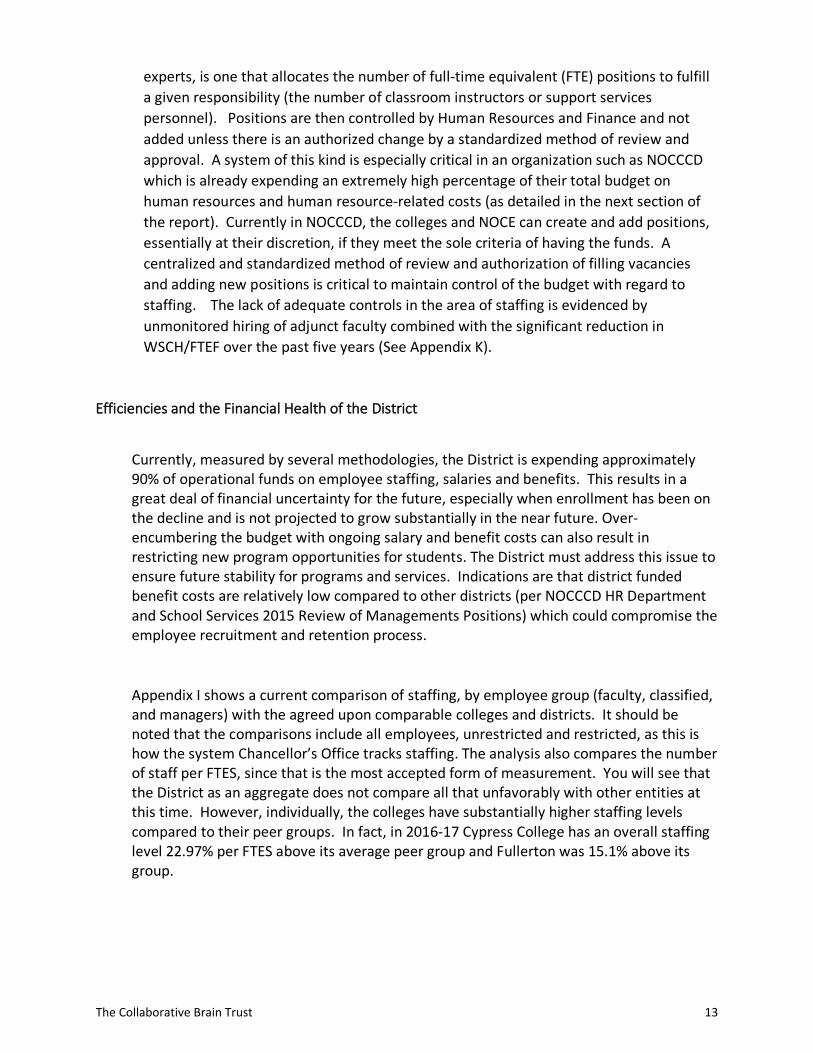
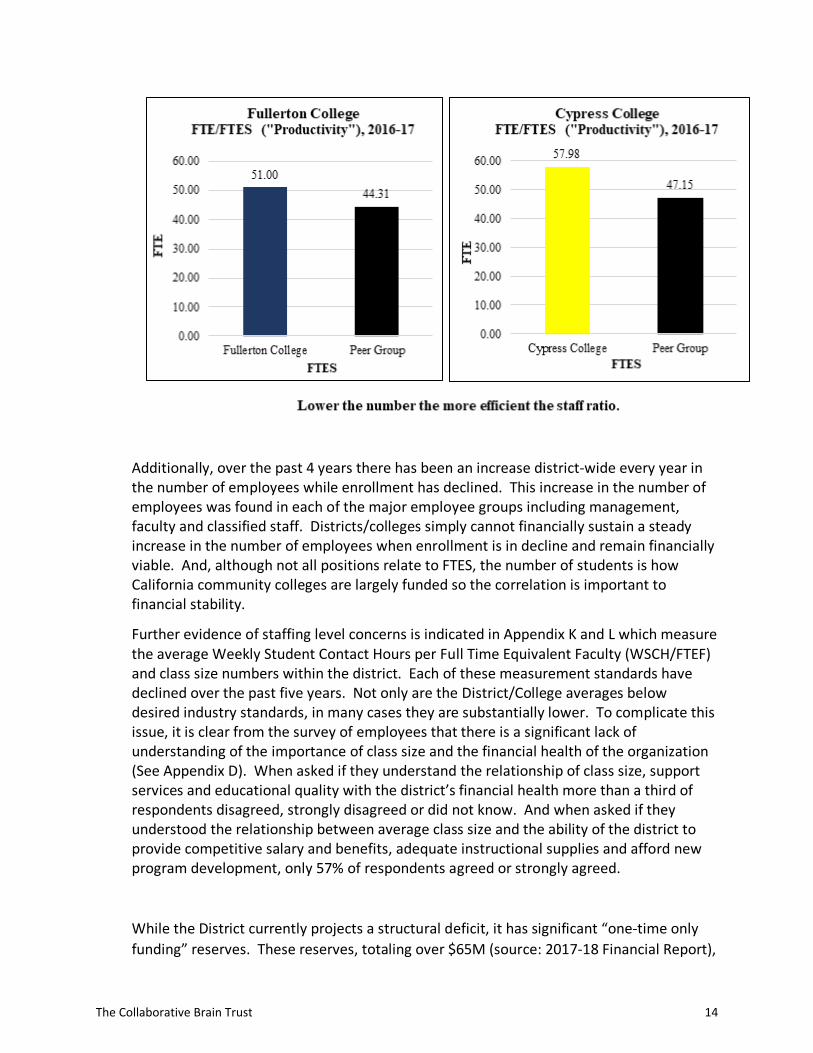
Appendix I shows a current comparison of staffing, by employee group (faculty, classified, and managers) with the agreed upon comparable colleges and districts. It should be noted that the comparisons include all employees, unrestricted and restricted, as this is how the system Chancellor’s Office tracks staffing. The analysis also compares the number of staff per FTES, since that is the most accepted form of measurement. You will see that the District as an aggregate does not compare all that unfavorably with other entities at this time. However, individually, the colleges have substantially higher staffing levels compared to their peer groups. In fact, in 2016-17 Cypress College has an overall staffing level 22.97% per FTES above its average peer group and Fullerton was 15.1% above its group.
The Collaborative Brain Trust 13
Additionally, over the past 4 years there has been an increase district-wide every year in the number of employees while enrollment has declined. This increase in the number of employees was found in each of the major employee groups including management, faculty and classified staff. Districts/colleges simply cannot financially sustain a steady increase in the number of employees when enrollment is in decline and remain financially viable. And, although not all positions relate to FTES, the number of students is how California community colleges are largely funded so the correlation is important to financial stability.
Further evidence of staffing level concerns is indicated in Appendix K and L which measure the average Weekly Student Contact Hours per Full Time Equivalent Faculty (WSCH/FTEF) and class size numbers within the district. Each of these measurement standards have declined over the past five years. Not only are the District/College averages below desired industry standards, in many cases they are substantially lower. To complicate this issue, it is clear from the survey of employees that there is a significant lack of understanding of the importance of class size and the financial health of the organization (See Appendix D). When asked if they understand the relationship of class size, support services and educational quality with the district’s financial health more than a third of respondents disagreed, strongly disagreed or did not know. And when asked if they understood the relationship between average class size and the ability of the district to provide competitive salary and benefits, adequate instructional supplies and afford new program development, only 57% of respondents agreed or strongly agreed.
While the District currently projects a structural deficit, it has significant “one-time only funding” reserves. These reserves, totaling over $65M (source: 2017-18 Financial Report),
The Collaborative Brain Trust 14
are substantial and provide the District with some financial security. However, one-time funds cannot be relied upon for on-going costs such as salary and benefits as they will run out in time resulting in an even greater structural deficit. It is imperative that the District continue to identify and treat on-going and one-time monies differently and spend them accordingly. Further, every effort should be made to help all governance and constituent group leaders understand the critical nature and relationship between ongoing and one-time-only dollars in the budget.
Supplemental Early Retirement Plan
In spring 2018, the NOCCCD Board of Trustees approved a Supplemental Early Retirement Plan (SERP) incentive for employees. This program is projected to result in significant salary savings, however, it should be noted that these savings are in large part predicated upon not filling all the vacated positions. Therefore, what the SERP program really provides is the opportunity for the district to realign its staffing to its current enrollment. If the District resorts to filling all vacated positions in the short term without any substantial increase in enrollment, the SERP could actually end up costing the District.
Organizational Structure of NOCE
Our review has determined that the NOCE organization is too flat. This means that the Provost, who has 9 direct reports of varying responsibilities, is responsible for too many direct reports and, therefore, the entity cannot operate as effectively as possible. Organizations that are too flat rely predominantly on very few decision makers and it is often difficult to make timely and fully informed decisions. It also results in a loss of ownership by employees who are often equipped to make appropriate decisions.
Organizational Structure of Cypress College
Our review has determined that the organizational structure of Cypress College is not working effectively. The current structure, which includes an Executive Vice President over both student and instructional services, interim deans, and deans with double assignments, is cumbersome and is resulting in a declining level of morale. The current structure also does not allow adequate oversight of two major divisions of the college and enrollment management issues. College leaders express concern over a lack of documentation of responsibilities and the potential of a loss of institutional memory as a result of the upcoming wave of retirements from the SERP. When interviewed as a group,
The Collaborative Brain Trust 15
the college managers express significant frustration over these issues and it is clearly impacting their ability to manage the college.
Organizational Structure of Information Technology
Our review has determined that Information Technology (IT) is overly decentralized which is leading to confusion and duplication. There is a high number of staff and managers dedicated to IT throughout the district. Employee roles are not well-defined, and there is increasing frustration with the system at both the college and district levels. There has been recent progress made with the system refresh activity that now provides a common set of data available for all colleges to utilize, however, individual colleges continue to customize data reporting so that comparisons between colleges are difficult.
Organizational Structure of Human Resources
Our review has found that many improvements have been made in HR over the last few years. As examples, the online applicant tracking system, increased diversity efforts, new professional development opportunities which include the Leadership Academy, and others. Areas we have identified that would benefit from additional focus are the communication between the colleges/NOCE and District Services, as well as collaboration on relevant matters with HR. Improvements in these two areas will be reflected on the relationship between the campuses and HR. In addition, finding a better reporting structure for the two staff-level positions dedicated to personnel functions at the campuses will promote collaboration and process efficiencies.
Budget Allocation
By many standards, NOCCCD should be commended for maintaining budget stability during the “great recession” and during a period of enrollment decline. Interviews indicate that there is a great deal of respect and confidence of the fiscal management of the district, but it was also found that there is considerable confusion of how funds are allocated. Currently, most funds are allocated on a historic basis providing funding based upon the previous year’s levels and adjusting for new initiatives. This model certainly can work, but over time with changing enrollment and programmatic adjustments it can result in disparities in funding levels between the colleges, NOCE and District Services. The colleges and NOCE currently express frustration over the budget allocation process which often results in a long wait to see if activities and initiatives will be funded. Though
The Collaborative Brain Trust 16
formula driven budgets are judged by some as eliminating the uniqueness of a given entity, if properly implemented, they can help ensure a more equitable allocation of resources, greater transparency, standardization and the improved ability to manage regulations such as the 50% law. Formulas are often misunderstood with the belief that they dictate how a college will staff itself or operate. This is not the case as formulas simply determine how much a college will be allocated. Use of those resources should then largely be left up to the colleges, with consideration for areas identified for the common good.
Management Retention Levels
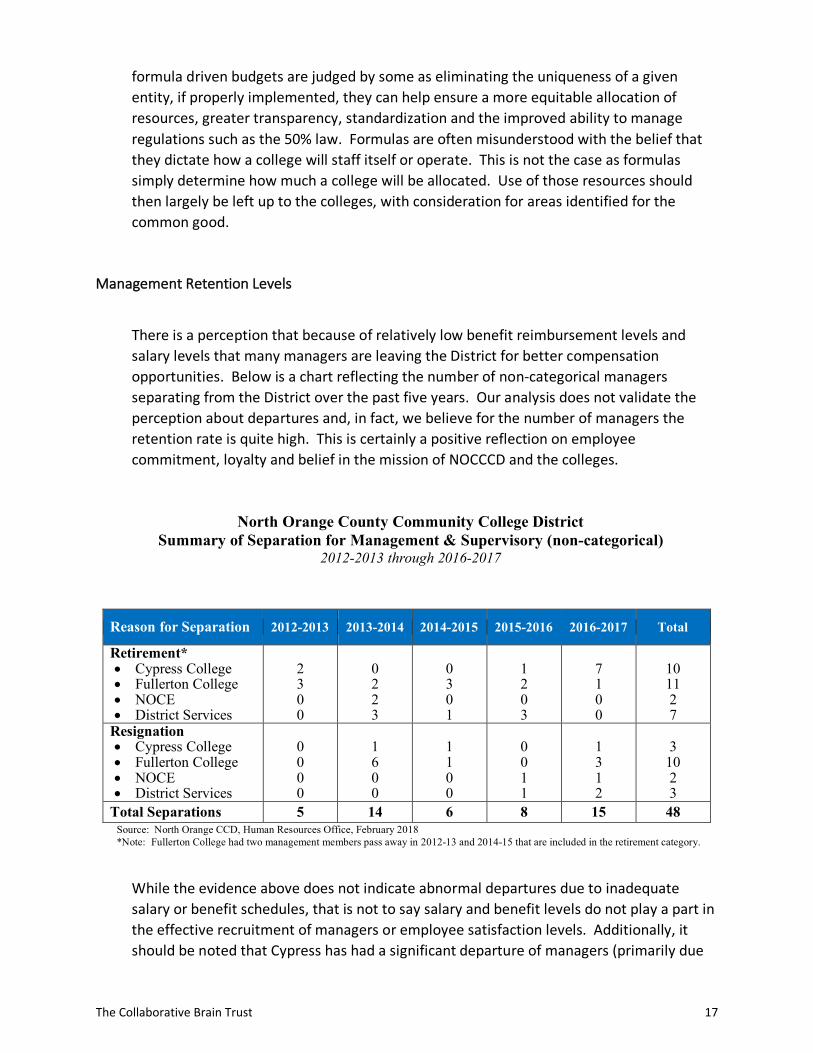
There is a perception that because of relatively low benefit reimbursement levels and salary levels that many managers are leaving the District for better compensation opportunities. Below is a chart reflecting the number of non-categorical managers separating from the District over the past five years. Our analysis does not validate the perception about departures and, in fact, we believe for the number of managers the retention rate is quite high. This is certainly a positive reflection on employee commitment, loyalty and belief in the mission of NOCCCD and the colleges.
North Orange County Community College District Summary of Separation for Management & Supervisory (non-categorical)
2012-2013 through 2016-2017
Reason for Separation 2012-2013 2013-2014 2014-2015 2015-2016 2016-2017 Total
Retirement* • Cypress College • Fullerton College • NOCE • District Services
2 3 0 0
0 2 2 3
0 3 0 1
1 2 0 3
7 1 0 0
10 11 2 7
Resignation • Cypress College • Fullerton College • NOCE • District Services
0 0 0 0
1 6 0 0
1 1 0 0
0 0 1 1
1 3 1 2
3
10 2 3
Total Separations 5 14 6 8 15 48 Source: North Orange CCD, Human Resources Office, February 2018 *Note: Fullerton College had two management members pass away in 2012-13 and 2014-15 that are included in the retirement category.
While the evidence above does not indicate abnormal departures due to inadequate salary or benefit schedules, that is not to say salary and benefit levels do not play a part in the effective recruitment of managers or employee satisfaction levels. Additionally, it should be noted that Cypress has had a significant departure of managers (primarily due
The Collaborative Brain Trust 17
to retirement) over the past 5 years which could have an adverse impact upon institutional memory.
Lastly, while the chart reflects non-categorical managers, CBT did not find the inclusion of categorical manager departures substantially affected the outcome. Categorical managers were not included because the very nature of the position, with uncertain funding and limited project timelines, can often be reasons for separation.
Districtwide Communication
Communication in any complex organization is a challenge and no assessment of a college or community college system is ever done without complaints and concerns expressed over communication. However, the results of our interviews and the survey of employees suggest some significant communication challenges for and among the colleges, NOCE and the District Office. There is clearly a disconnect between the colleges/NOCE and the District on several issues. Some examples of this can be found in communication related to the SERP, Human Resources, reports from Chancellors Executive Staff meetings, and Information Technology. Although many report that these issues have improved since Chancellor Marshall arrived, there is clearly a building relationship problem among the units in the District that must be addressed. The employee survey clearly documents these concerns in several places. When asked if information is disseminated in a timely manner and if individuals are kept informed, 36% of respondents disagree, strongly disagree or do not know how to answer that question (See Appendix D). In responding to the question, “I am kept informed of the changes within the district” nearly half of the respondents respond similarly.
Enrollment Management, Marketing and Outreach
The District has activated an enrollment management committee (Districtwide Enrollment Advisory Committee-DEMAC) which is considering FTES targets, enrollment reporting, marketing and academic scheduling related to enrollment. This group is still finding its place in the organization and there is inadequate attention being paid to these issues at this point. There is little outreach and marketing, there are multiple enrollment reports coming from various sources, and although there are excellent examples of good relations with area high schools including the Anaheim Pledge, there is still opportunity to enhancement of those relationships. there is an apparent lack of effective relationships with feeder high schools. The District is in enrollment decline and more attention should be paid to these important issues. Further, the college and District foundations are less effective than they could be and poorly coordinated. In all of these areas, there is a lack of accountability, goal setting and tracking.
The Collaborative Brain Trust 18
RECOMMENDATIONS
1. Rebalance the Centralization and Decentralization of Activities within the District, and Provide a Clear Explanation of the Responsibilities of the Colleges, NOCE and District Services
Multi-college districts provide an elegant method of delivery of higher education to a large geographic area and/or population through multiple delivery sites (colleges and centers). In turn they can provide certain efficiencies in support of the local units. Under the ultimate direction of the locally elected Board of Trustees, the District Services unit provides both overall direction for the organization and support for the colleges and centers. Keeping in mind that students enroll in colleges not Districts, the individual identity of colleges and centers should be maintained, while the District provides direction and support.
In order to function as a district and not totally separated autonomous institutions, NOCCCD needs to rebalance the way it operates. It is recommended that the various District Vice Chancellors provide a more hands-on role in developing common practices and procedures in given areas. As an example, the Vice Chancellor of Education and Technology should work with the colleges to help determine the best assessment process for incoming students. It makes little sense to have differing approaches by colleges which can lead to students having to go through two separate processes to take classes at the different institutions within the same district.
Once the most effective process is identified, colleges should be required to migrate to the agreed-upon process. Again, nearly all of these decisions should not be made by a single position, but through input and participation of affected constituents.
Although the colleges include the Functional Map required by the accreditation process in their self-study documents, those maps are very superficial and do not clearly delineate the responsibilities between the units of the District. The Chancellor and Executive Staff should document a clear explanation of exactly where the responsibility each activity within the district is housed. In cases where those responsibilities are shared between the colleges/NOCE and DS, a description should be included of how that shared responsibility will be undertaken.
2. Establish the Coordinating Role of the District
The District should acknowledge that some standardization is a good thing for students and other constituents. The colleges/NOCE and DS should identify all standard differences in processes affecting students and agree on a common/best practice for meeting these needs. In those areas, after thorough vetting, it should be agreed what the common practice will be, and a process developed to implement the decided practice. This will help eliminate confusion for
The Collaborative Brain Trust 19
both students, employees and the community. When agreement cannot be reached, it should be up to the given Vice Chancellor of the area in question to facilitate a resolution. As an example, since Campus Safety is primarily determined to be an administrative support function, the Vice Chancellor of Finance and Facilities should ultimately be responsible for coordinating the common safety practices.
This recommendation is not meant to suggest that all issues need to be exactly the same, but issues such as assessment, discipline, campus safety, etc. should be relatively uniform. Organizationally, it should not be necessary to create a “dotted” line of reporting to the given Vice Chancellor as it should be understood that the District role is to facilitate a beneficial approach for all involved. The District must better document these common practices and procedures and communicate the outcomes to the entire district community. It was clear in the interviews conducted that many leaders of the District are concerned about a lack of documentation of processes.
Two examples of coordination opportunities exist in the areas of Grants and Foundations. Currently, there is no coordination of the grants process; i.e., pursuing of a specific grant, monitoring of the grant, and close-out of the grant. This means that the two colleges within the NOCCCD may be competing for a given grant which in most cases does not maximize the limited resources available for pursuing grants. As an example, better coordination of grants might be accomplished under the direction of the Vice Chancellor of Education and Technology. This area could possibly coordinate which grants are the highest priority and determine who should apply for the grant. A coordinated process will also help the colleges and NOCE identify additional grants and maximize those resources. Additionally, the District’s Fiscal department and Internal Auditor should have a significant role in monitoring the various compliance issues of a grant.
A second example is that of the campus foundations. Currently, without adequate coordination, prospective donors can be solicited by both college foundations. This is counterproductive and negatively impacts the image of the colleges and the District. The District may want to consider creating auxiliary foundations to the colleges which would allow for greater coordination and alignment of foundation goals with the colleges and the District.
A related coordination issue, though not necessarily related to the structure of the organization, lies with the area of contracted services. As an example, currently the facilities functions are fairly decentralized. Because of the challenges in creating a central service in a high traffic congested environment, the approach seems to work reasonably well. However, again there are lost opportunities by each campus using different contracted services and management systems. The colleges and District would be better served to have common systems in the areas such as Computerized Maintenance Management Software (CMMS), Energy Management Systems (EMS), Work Order Systems, and Fire Suppression contracts. This is but one other example of the need to coordinate best practices for improved delivery and efficiency.
The Collaborative Brain Trust 20
3. Establish Standards for Staffing Within the District
The District should develop staffing standards. In order to provide more equity for students in the overall instructional program, an agreed upon WSCH/FTES goal should be adopted. Typically, a goal of over 500 is desired, but given the relatively low current status (See Appendix L) this goal should be achieved over several years. And, while it is not for this report to recommend the exact goal, it is noted that the compounding effect of a relatively modest 5% increase per year would achieve a number over 500 in less than 5 years. Increasing the WSCH/FTEF would also increase the relatively low average class size of the colleges (See Appendix K). It should also be noted that an increase of 1 pupil per class will save approximately $1.5M per year in class section costs. Funds generated by increased class size savings could be used to help resolve the current structural deficit, help cover the costs of reorganization, help fund salary and benefit improvements (which has been a stated District goal), and in some instances even provide the opportunity to offer some lower-enrollment more advanced courses if the average class size is at a higher level.
Standards, though more difficult to quantify, should be considered for adding non-required (unrestricted) managers and for classified employees as well.
4. Develop and Implement a Position Control System
The District should implement a true Position Control system. Below is a discussion and example of the way a college faculty position control system can effectively work. It should be noted that a Position Control system must control all positions, not just full-time positions, as all positions have a cost. Certainly, NOCCCD has a relatively high Full-time Faculty Obligation, but all full-time equivalent faculty (including part-time faculty) must be included for true control of personnel costs.
A Position Control system allocates a specific number of FTE positions based upon specific criteria. In the case of faculty, it is most often based upon desired or projected enrollment. As an example, if the college sets a goal of 530 classroom productivity (WSCH/FTEF), and wanted to achieve 35,000 annual FTES, it would allocate 990.56 annual FTEF (this includes full-time and part-time faculty). Every position would then be charged against the allocation much like a buy-out requisition. The schedule would be designed around the number of classes generated by the allocation of 990.56 FTEF. The instructional unit would not be able to overspend its FTEF allocation unless there was enrollment greater than expected and a process for review and approval. Of course, NOCCCD would have to adjust for its compressed calendar and its mix of lecture/lab hours.
One of the problems with a dollar-controlled system is that it is harder to manage as far as the number of positions, cost for each position, and the scheduling. In addition, it conceivably could foster inequality in hiring decisions. For example, if there are multiple
The Collaborative Brain Trust 21
applicants for a faculty position, it could be tempting (on strictly a financial basis) to select a candidate with less experience and therefore a lower entrance salary. The “less expensive” the cost per FTEF the more FTEF you receive. This could have an adverse effect on the quality of selected candidates, not to mention the legal exposure if a more qualified candidate is denied the position.
Position Control is essential, and must include adjunct faculty, which is historically the most overspent component of the college’s budgets. In the end, if productivity goals are met (whatever is agreed upon) and stay within your FTEF allocation, the vast majority of the budget is balanced.
We would strongly recommend this system be used for all positions (classified, administration, etc.), not just faculty positions. It is just as important that the number of classified and administrative positions also be tied to some criteria and that all units stay within the agreed upon formula.
Some may view Position Control as a loss in overall control or flexibility. In fact, it is not. The choice of what classes, courses, positions, etc. still remains with the experts (faculty chairs, deans, vice presidents, presidents, etc.), but the ability to overspend is controlled as is any other expenditure. The same can be said for non-faculty positions. The allocation of the overall positions remains a college decision determined by its own unique prioritization process.
The monitoring of Position Control should be housed in the fiscal side of the “house”. These are the individuals designated and trained in the District for the accounting function of determining the status of the allocation spending (in this case positions).
It should also be noted that Position Control systems based upon a given formula (WSCH/FTEF for faculty or square footage for facility classified positions) helps ensure more equitable services for students. A student attending one college or the other should not be advantaged or disadvantaged because the college has significant differing staffing levels. It is a simple issue of equity for students that, if ignored, can not only provide disparate services but can potentially be a costly legal liability.
5. Affect Any Reorganization of the District, Colleges and NOCE with Few or No Added Positions
Even though NOCCCD has substantial one-time dollars, their ongoing budget has a significant structural deficit. With approximately 90% of the budget dedicated to human resources and human resources-related expenses, the District could experience significant financial issues should their enrollment continue to remain flat or decline while they spend more on adding new faculty, management and staff. We highly recommend that the reorganization called for in several recommendations in this report be done whenever possible by redirecting existing staffing rather than adding new positions to the budget. The SERP provides an excellent opportunity to better align the district’s staffing with existing enrollment
The Collaborative Brain Trust 22
and that opportunity should not be lost by all replacing retiring faculty, management or staff. Rather, every effort should be made to repurpose existing FTE unless that is found to be impossible.
6. Reorganize the North Orange Continuing Education Unit
NOCE should create the position of Vice President and reduce one of the campus Deans. The Vice President position should be housed at the Anaheim campus which houses the majority of students, and the two remaining Deans located at Cypress College and the Wilshire Center. The position should initially oversee all instruction and support services of continuing education. As the program grows and is warranted, there may be a need to add an additional Vice President and separate the instruction and student services functions. Ultimately, if there is significant growth, the position of Director of Administrative Services could be elevated to a Vice President, though this appears to be a much longer-term possibility. A draft organizational chart showing the recommended changes can be found in Appendix M.
The position of the NOCE Provost should be retitled President. This current position has all the responsibility of a President and NOCE is one of the few community college continuing education programs separately accredited in California. Re-titling the leadership post to President will clearly signal the intention to treat NOCE as a third college within the District.
7. Reorganize Cypress College Instructional and Student Services
The use of a sole Executive Vice President position at Cypress should be reconsidered. Having a single individual overseeing both student and academic services is not working effectively and splitting those responsibilities should be considered. The college is simply too large for one position to adequately oversee these two large areas. Further, a careful realignment of duties to better balance the responsibilities of the existing Deans should be undertaken. Currently, there are interim Deans and more than one existing Dean is carrying an excessive load. The interim Deans provide a good opportunity to change the existing job descriptions to better balance the workload prior to permanent Deans being employed.
8. Realign Human Resource Personnel Specialists
With approximately 90% of the District budget dedicated to personnel costs, it is important that the entire HR process be coordinated and efficient. Currently, the position of Personnel Specialist reports to the Campus Vice President of Administration which essentially creates two different HR reporting structures. It is recommended that this position be realigned to report to the Human Resources Department. HR needs a direct presence at the
The Collaborative Brain Trust 23
colleges and realignment of this position will help ensure district-wide consistencies in the hiring, retention, and separation processes of campus employees.
9. Implement the Position of Associate Dean
As a large multi-campus district, NOCCCD has a wide disparity in the size of the various instructional divisions and departments. In order to more effectively provide assistance and oversight, some very large divisions should incorporate the position of Associate Dean. The Associate Dean can assist the Dean with assigned responsibilities to ensure division/departmental support and oversight. The Associate Dean job description should be developed by Human Resources and salary placement made appropriately. The position should only be implemented for divisions with the number of faculty meeting a certain threshold. For example, divisions with more than 50 instructors. Again, this is a position that should only be created for very large divisions. Care should be taken not to make exceptions as another oversight layer, and expense, is not warranted for most divisions.
10. Restructure Information Services
When constituents were asked if any areas could benefit from greater centralization, the single function most often cited was Information Services. It is apparent that due to the autonomy of the colleges and NOCE in staffing that there are many different systems operating for the same purpose. Consequently, users are confused, support of multiple programs is difficult, and data is inconsistent. CBT found routine information data requests were not always readily available and the information was not as reliable as it should be.
In total, over 50 FTE positions are dedicated to Information Services. With so many duplicate programs being supported, it is very difficult to provide quality services. Users are confused about which Help Desk to contact and there is little accountability for the tremendous investment in technology.
A division of responsibilities between academic computing and enterprise computing makes sense. It is recommended that all enterprise computing and support ultimately report through the District Information Services department. College-level IT support functions should remain with Academic Computing at each campus. Improvements should be made in communication and collaboration between Academic Computing and District Information Services.
11. Better Coordinate Enrollment Management, Marketing, and Outreach The NOCCCD has significant opportunities in the areas of enrollment management and
marketing and outreach. These areas have the potential to positively impact revenue and,
The Collaborative Brain Trust 24
more importantly, the opportunity to better serve students and the community. Although there is a committee dedicated to many of these activities, the committees seem to lack clear direction or a mandate to take action. The groups’ portfolios should be clarified to include these areas and should be tasked to develop specific plans as soon as possible. Those plans should include clear targets in each area, a timeline for implementation and an accountability system. Enrollment must become a greater priority within the District and the Executive Staff and Chancellor should be closely monitoring these areas on a very frequent basis. The current practice of relying on enrollment reports from various sources causes significant confusion and a lack of trust in the data. Enrollment reporting should only come from a single source and all colleges and NOCE should rely only on those data.
12. Implement an Expanded Program of Professional Development
A District Professional Development officer position should be created. The District is too large not to invest in developing personnel for the future. Overall training is lacking in many areas. Positions can pay for themselves in many ways by better training and the development of potential future leaders for the organization. Further, there is a need for cross training in many areas of the classified staff in order to ensure balanced delivery of services to students and the community.
13. Establish Consistent Safety Processes and Procedures
Because of the significant issue of campus safety on today’s college campuses, CBT is identifying this issue as a specific recommendation. Currently, there is little coordination and common practices utilized by the colleges and District regarding campus safety. As an example, there are no Districtwide standard uniforms for security personnel, and there are no written procedures for how to handle specific student discipline issues. Although there are some written articulation agreements with surrounding police agencies, those agreements appear dated and in need of review, and there is inadequate communication (i.e. dispatch services and notifications) if and when safety issues arise. These deficiencies, and several other related issues, creates an environment that is inadequately prepared for emergencies which are occurring more frequently on today’s college campuses nationwide.
It is recommended that a set of common processes and procedures, similar to a sworn police agency’s General Orders, be developed and adopted. These “orders” will help ensure a more consistent handling of safety and security situations. It is also important to have a system of improved communications for both pre and post incident situations
Organizationally, an argument can be made to place the safety and security responsibility under either Administrative Services or Student Services. CBT believes, in this case, it is best placed under Administrative Services with strong coordination with both Student
The Collaborative Brain Trust 25
Services and Instruction. Ultimately, the most critical issue with the reporting structure is that those positions deemed responsible, as well as all employees dedicated to the actual safety and security function, must be thoroughly and frequently trained. District authority for ensuring the development of a comprehensive program should reside with the Vice Chancellor of Administrative Services.
Lastly, CBT cannot stress enough the priority and importance of developing a uniform and comprehensive Safety and Security program. This issue is of the utmost importance.
The Collaborative Brain Trust 26
SUMMARY AND PLAN OF ACTION
Many of the recommendations included in this review of the North Orange County Community College Community College District relate to revising the organizational structures at the colleges, NOCE and District Services. The team has refrained from providing specific organizational charts deferring to the college and district leadership to make those alterations. However, in the case of the North Orange Continuing Education Center we did provide a draft of our recommended organizational changes in Appendix M.
NOCCCD remains an effective organization serving students and the community. However, the District has significant structural issues that should be addressed in the coming months and years. New leadership throughout the organization makes this an opportune time for a new action plan in many of the above-referenced areas. Some of the changes will, by necessity, need to be made over months and even years but developing a plan for these changes, and an accountability system to track them, should be a top priority for District leaders.
Not all of the necessary changes will be popular and frequent communication and transparency will be extremely important. Seeking and carefully considering input from all constituent groups will help build support for the agreed-upon changes. The next steps in the process will necessitate the college and District leadership developing a plan of action for the recommendations selected including a timeline for implementation.
The Collaborative Brain Trust 27
APPENDIX A A. Documents Reviewed and Current District and
College Organizational Charts
The Collaborative Brain Trust 28
List of Documents Reviewed by CBT Consultants for the
Organizational Structure Review of North Orange County Community College District
• Institutional Self Evaluation Report (Self Study) for Colleges and NOCE
• 2017-18 Proposed Budget and Financial Report
• Budget Allocation Handbook
• Evaluation of Legal Services Report
• Organizational Charts for the District and all units
• SERP Data
• Human Resources and Finance and Facilities Administrative Reviews
• Selective Job Descriptions
• District Management Retreat and Satisfaction Surveys
• Management Association Requests
• Employee Benefit Comparison Data
• 2017 Security Assessment Report
• 2015 School Services Total Compensation Study (Management Positions)
• "Position Control" Data
• Enrollment Management Retreat Information
The Collaborative Brain Trust 29
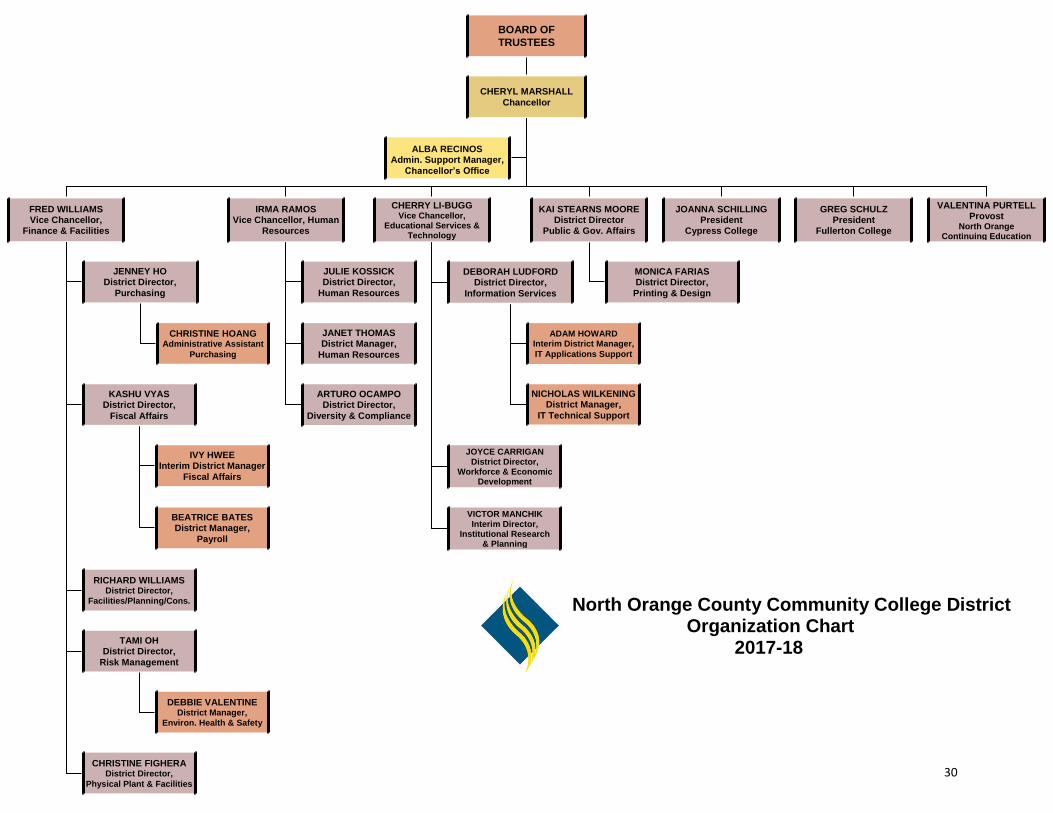
BOARD OF
TRUSTEES
CHERYL MARSHALL
Chancellor
FRED WILLIAMS Vice Chancellor,
Finance & Facilities
VALENTINA PURTELL Provost
North Orange Continuing Education
GREG SCHULZ President
Fullerton College
JOANNA SCHILLING President
Cypress College
KAI STEARNS MOORE District Director
Public & Gov. Affairs
CHERRY LI-BUGG Vice Chancellor,
Educational Services & Technology
IRMA RAMOS Vice Chancellor, Human
Resources
ALBA RECINOS Admin. Support Manager,
Chancellor’s Office
MONICA FARIAS District Director,
Printing & Design
JULIE KOSSICK District Director,
Human Resources
JANET THOMAS District Manager,
Human Resources
JENNEY HO District Director,
Purchasing
KASHU VYAS District Director,
Fiscal Affairs
RICHARD WILLIAMS District Director,
Facilities/Planning/Cons.
TAMI OH District Director,
Risk Management
CHRISTINE HOANG Administrative Assistant
Purchasing
IVY HWEE Interim District Manager
Fiscal Affairs
BEATRICE BATES District Manager,
Payroll
DEBBIE VALENTINE District Manager,
Environ. Health & Safety
ARTURO OCAMPO District Director,
Diversity & Compliance
CHRISTINE FIGHERADistrict Director,
Physical Plant & Facilities
DEBORAH LUDFORD District Director,
Information Services
JOYCE CARRIGAN District Director,
Workforce & Economic Development
VICTOR MANCHIK Interim Director,
Institutional Research & Planning
ADAM HOWARD Interim District Manager,
IT Applications Support
NICHOLAS WILKENING District Manager,
IT Technical Support
North Orange County Community College District Organization Chart
2017-18
30
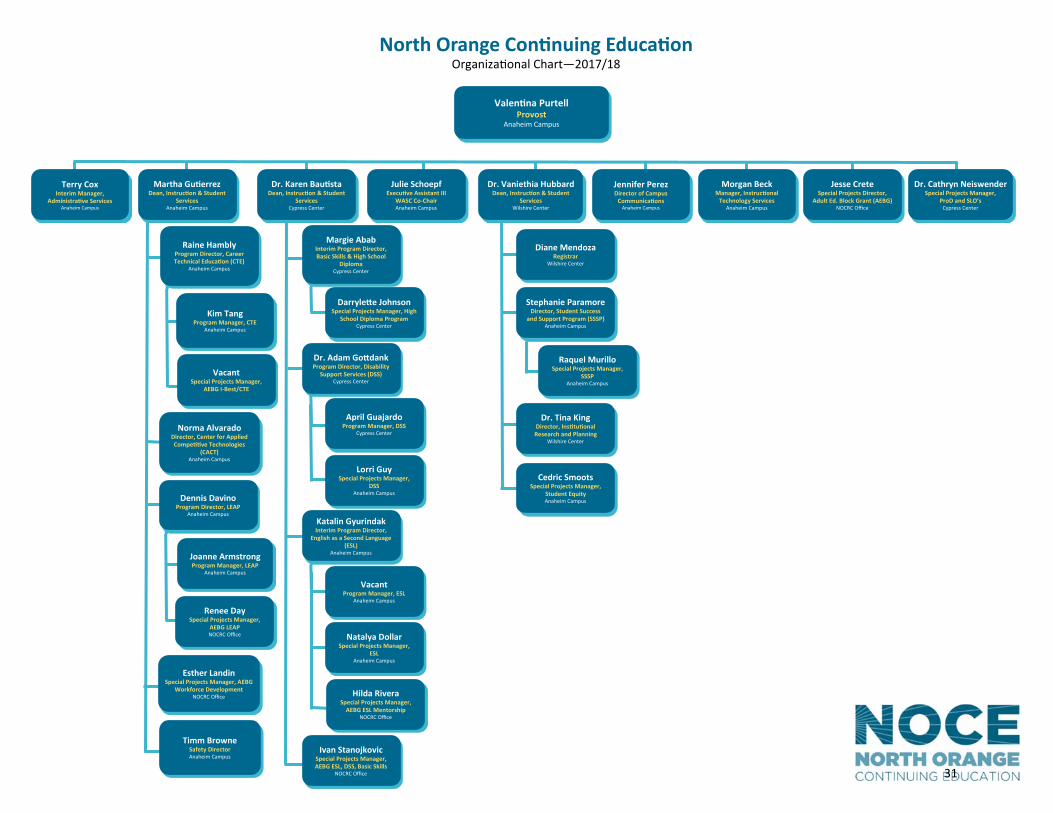
Valen na Purtell Provost
Anaheim Campus
Terry Cox Interim Manager,
Administra ve Services Anaheim Campus
Martha Gu errez Dean, Instruc on & Student
Services Anaheim Campus
Dr. Karen Bau sta Dean, Instruc on & Student
Services Cypress Center
Julie Schoepf Execu ve Assistant III
WASC Co‐Chair Anaheim Campus
Dr. Vaniethia Hubbard Dean, Instruc on & Student
Services Wilshire Center
Morgan Beck Manager, Instruc onal
Technology Services Anaheim Campus
Jennifer Perez Director of Campus
Communica ons Anaheim Campus
Jesse Crete Special Projects Director,
Adult Ed. Block Grant (AEBG) NOCRC Office
Dr. Cathryn Neiswender Special Projects Manager,
ProD and SLO’s Cypress Center
Raine Hambly Program Director, Career Technical Educa on (CTE)
Anaheim Campus
Kim Tang Program Manager, CTE
Anaheim Campus
Norma Alvarado Director, Center for Applied Compe ve Technologies
(CACT) Anaheim Campus
Dennis Davino Program Director, LEAP
Anaheim Campus
Joanne Armstrong Program Manager, LEAP
Anaheim Campus
Margie Abab Interim Program Director, Basic Skills & High School
Diploma Cypress Center
Darryle e Johnson Special Projects Manager, High
School Diploma Program Cypress Center
Dr. Adam Go dank Program Director, Disability
Support Services (DSS) Cypress Center
April Guajardo Program Manager, DSS
Cypress Center
Lorri Guy Special Projects Manager,
DSS Anaheim Campus
Katalin Gyurindak Interim Program Director,
English as a Second Language (ESL)
Anaheim Campus
Vacant Program Manager, ESL
Anaheim Campus
Natalya Dollar Special Projects Manager,
ESL Anaheim Campus
Diane Mendoza Registrar
Wilshire Center
Dr. Tina King Director, Ins tu onal Research and Planning
Wilshire Center
Cedric Smoots Special Projects Manager,
Student Equity Anaheim Campus
North Orange Con nuing Educa on Organiza onal Chart—2017/18
Ivan Stanojkovic Special Projects Manager, AEBG ESL, DSS, Basic Skills
NOCRC Office
Renee Day Special Projects Manager,
AEBG LEAP NOCRC Office
Vacant Special Projects Manager,
AEBG I‐Best/CTE
Hilda Rivera Special Projects Manager,
AEBG ESL Mentorship NOCRC Office
Stephanie Paramore Director, Student Success
and Support Program (SSSP) Anaheim Campus
Raquel Murillo Special Projects Manager,
SSSP Anaheim Campus
Esther Landin Special Projects Manager, AEBG
Workforce Development NOCRC Office
Timm Browne Safety Director Anaheim Campus
31
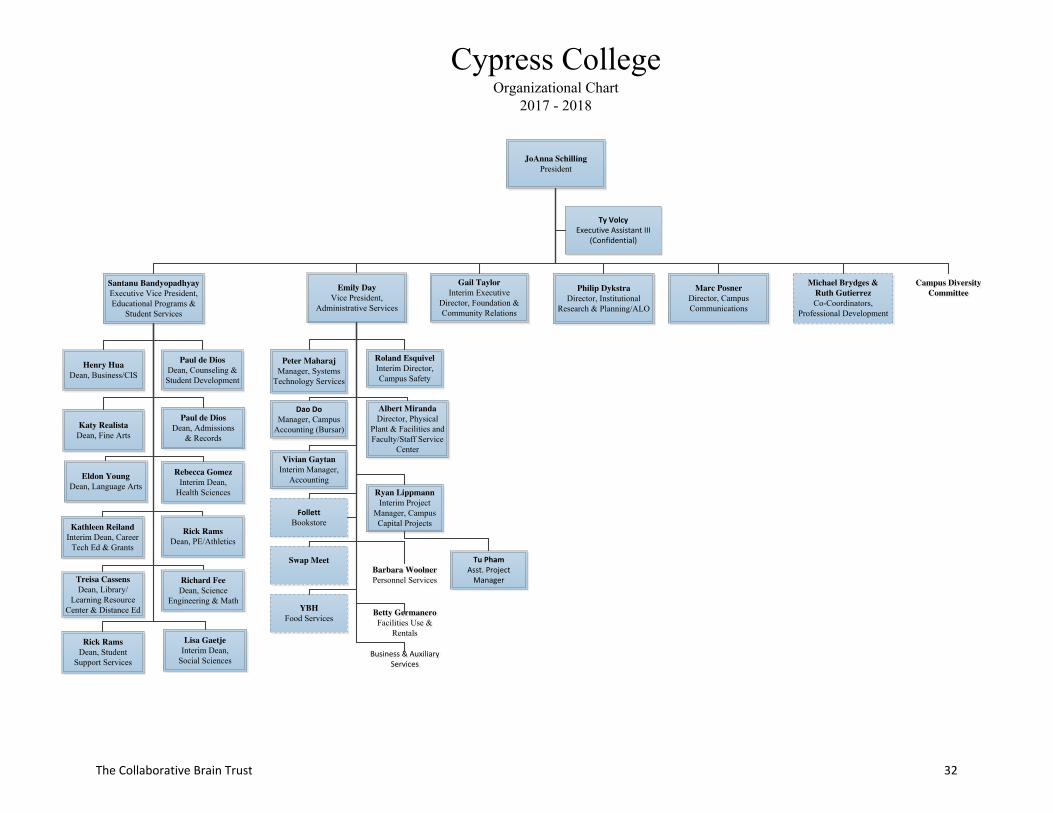
JoAnna SchillingPresident
Philip DykstraDirector, Institutional
Research & Planning/ALO
Marc PosnerDirector, Campus Communications
Gail TaylorInterim Executive
Director, Foundation & Community Relations
Michael Brydges & Ruth GutierrezCo-Coordinators,
Professional Development
Emily DayVice President,
Administrative Services
Santanu BandyopadhyayExecutive Vice President, Educational Programs &
Student Services
Cypress CollegeOrganizational Chart
2017 - 2018
Campus DiversityCommittee
Campus DiversityCommittee
Roland EsquivelInterim Director, Campus Safety
Peter MaharajManager, Systems
Technology Services
Dao DoManager, Campus
Accounting (Bursar)
Albert MirandaDirector, Physical
Plant & Facilities and Faculty/Staff Service
Center
FollettBookstore
Vivian GaytanInterim Manager,
Accounting
Barbara WoolnerPersonnel ServicesBarbara WoolnerPersonnel Services
Business & Auxiliary Services
Business & Auxiliary Services
YBH Food Services Betty Germanero
Facilities Use & Rentals
Betty GermaneroFacilities Use &
Rentals
Paul de DiosDean, Counseling &
Student Development
Henry HuaDean, Business/CIS
Paul de DiosDean, Admissions
& RecordsKaty Realista
Dean, Fine Arts
Rebecca GomezInterim Dean,
Health Sciences
Eldon YoungDean, Language Arts
Rick RamsDean, PE/Athletics
Kathleen ReilandInterim Dean, Career
Tech Ed & Grants
Richard FeeDean, Science
Engineering & Math
Treisa CassensDean, Library/
Learning Resource Center & Distance Ed
Lisa GaetjeInterim Dean,
Social Sciences
Rick RamsDean, Student
Support Services
Ryan LippmannInterim Project
Manager, Campus Capital Projects
Swap Meet
Ty VolcyExecutive Assistant III
(Confidential)
Tu PhamAsst. Project
Manager
The Collaborative Brain Trust 32
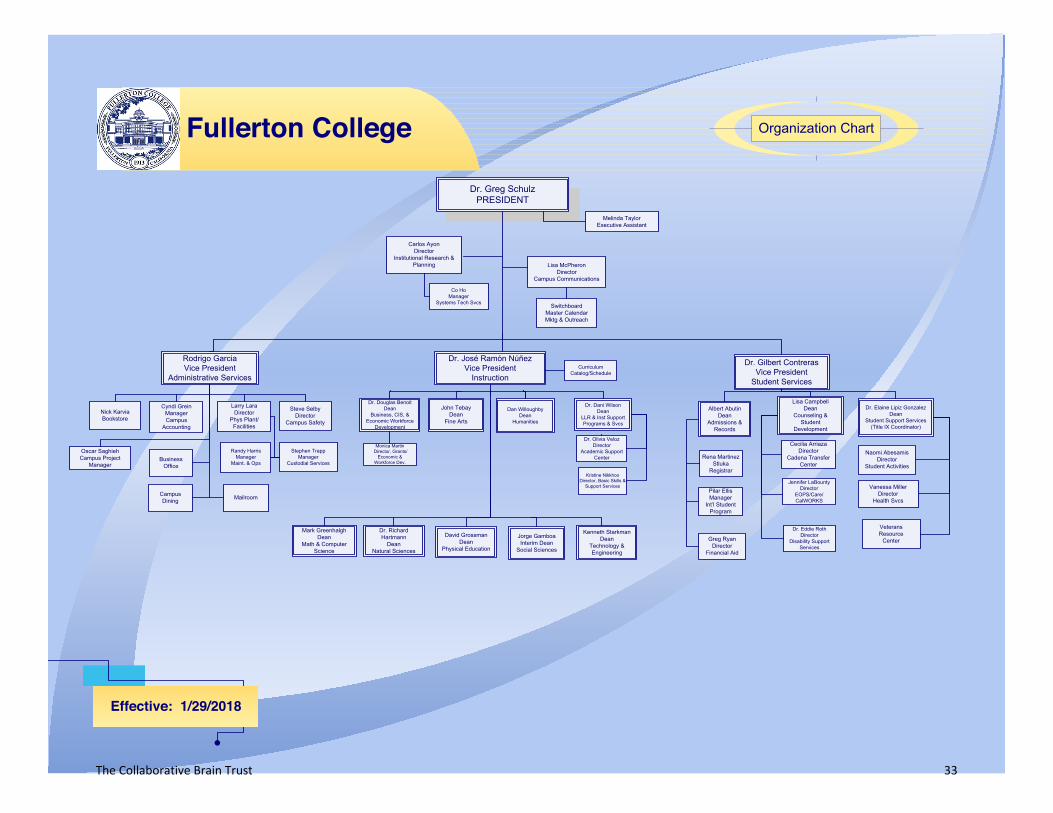
Fullerton College
Effective: 1/29/2018
Organization Chart
Dr. Greg SchulzPRESIDENT
Dr. Gilbert ContrerasVice President
Student Services
Rodrigo GarciaVice President
Administrative Services
Dr. José Ramón NúñezVice President
Instruction
John TebayDean
Fine Arts
Jorge GamboaInterim Dean
Social Sciences
David GrossmanDean
Physical Education
Mark GreenhalghDean
Math & Computer Science
Dr. Richard Hartmann
DeanNatural Sciences
Kenneth StarkmanDean
Technology & Engineering
Dr. Douglas BenoitDean
Business, CIS, & Economic Workforce
Development
Albert AbutinDean
Admissions & Records
Lisa CampbellDean
Counseling & Student
Development
Co HoManager
Systems Tech Svcs
Randy HarrisManager
Maint. & Ops
Greg RyanDirector
Financial Aid
Cecilia ArriazaDirector
Cadena Transfer Center
Larry LaraDirector
Phys Plant/Facilities
Steve SelbyDirector
Campus Safety
SwitchboardMaster CalendarMktg & Outreach
Melinda TaylorExecutive Assistant
Dan WilloughbyDean
Humanities
Cyndi GreinManagerCampus
Accounting
MailroomCampus Dining
Rena Martinez Stluka
Registrar
Pilar EllisManager
Int’l Student Program
Dr. Eddie RothDirector
Disability Support Services
Dr. Olivia VelozDirector
Academic Support Center
Kristine NikkhooDirector, Basic Skills &
Support Services
Carlos AyonDirector
Institutional Research & Planning Lisa McPheron
DirectorCampus Communications
Dr. Dani WilsonDean
LLR & Inst SupportPrograms & Svcs
Nick KarviaBookstore
Business Office
Stephen TrappManager
Custodial Services
CurriculumCatalog/Schedule
Monica Martin Director, Grants/
Economic & Workforce Dev.
Dr. Elaine Lipiz GonzalezDean
Student Support Services(Title IX Coordinator)
Vanessa MillerDirector
Health Svcs
Naomi AbesamisDirector
Student Activities
Veterans Resource
Center
Jennifer LaBountyDirector
EOPS/Care/CalWORKS
Oscar SaghiehCampus Project
Manager
The Collaborative Brain Trust 33
APPENDIX B B. Groups and Individuals Interviewed
During the Project
The Collaborative Brain Trust 34
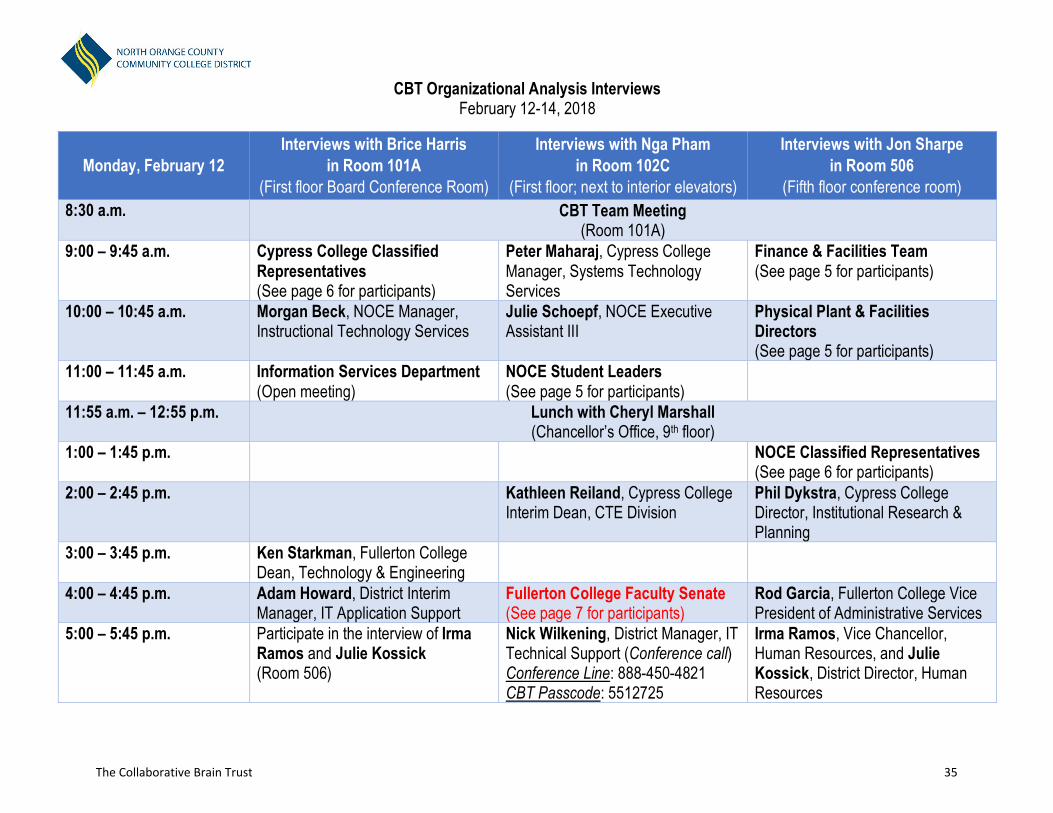
CBT Organizational Analysis Interviews February 12-14, 2018
Monday, February 12 Interviews with Brice Harris
in Room 101A (First floor Board Conference Room)
Interviews with Nga Pham in Room 102C
(First floor; next to interior elevators)
Interviews with Jon Sharpe in Room 506
(Fifth floor conference room) 8:30 a.m. CBT Team Meeting
(Room 101A) 9:00 – 9:45 a.m. Cypress College Classified
Representatives (See page 6 for participants)
Peter Maharaj, Cypress College Manager, Systems Technology Services
Finance & Facilities Team (See page 5 for participants)
10:00 – 10:45 a.m. Morgan Beck, NOCE Manager, Instructional Technology Services
Julie Schoepf, NOCE Executive Assistant III
Physical Plant & Facilities Directors (See page 5 for participants)
11:00 – 11:45 a.m. Information Services Department (Open meeting)
NOCE Student Leaders (See page 5 for participants)
11:55 a.m. – 12:55 p.m. Lunch with Cheryl Marshall (Chancellor’s Office, 9th floor)
1:00 – 1:45 p.m. NOCE Classified Representatives (See page 6 for participants)
2:00 – 2:45 p.m. Kathleen Reiland, Cypress College Interim Dean, CTE Division
Phil Dykstra, Cypress College Director, Institutional Research & Planning
3:00 – 3:45 p.m. Ken Starkman, Fullerton College Dean, Technology & Engineering
4:00 – 4:45 p.m. Adam Howard, District Interim Manager, IT Application Support
Fullerton College Faculty Senate (See page 7 for participants)
Rod Garcia, Fullerton College Vice President of Administrative Services
5:00 – 5:45 p.m. Participate in the interview of Irma Ramos and Julie Kossick (Room 506)
Nick Wilkening, District Manager, IT Technical Support (Conference call) Conference Line: 888-450-4821 CBT Passcode: 5512725
Irma Ramos, Vice Chancellor, Human Resources, and Julie Kossick, District Director, Human Resources
The Collaborative Brain Trust 35
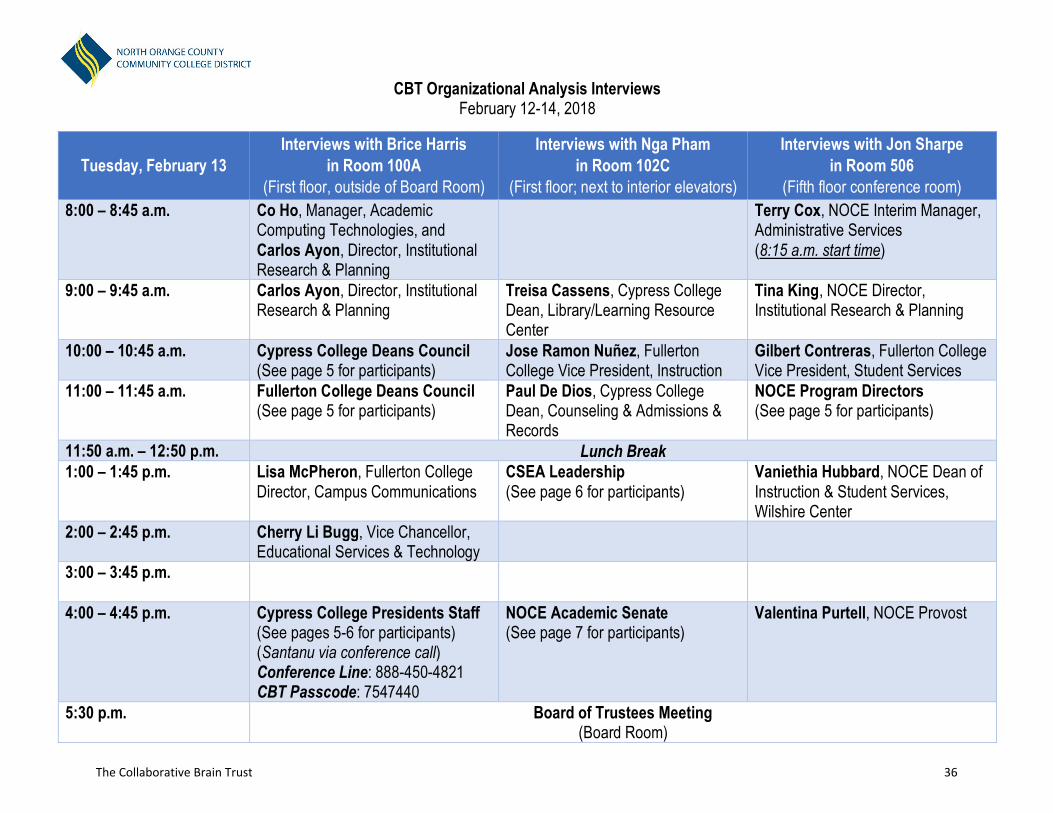
CBT Organizational Analysis Interviews February 12-14, 2018
Tuesday, February 13 Interviews with Brice Harris
in Room 100A (First floor, outside of Board Room)
Interviews with Nga Pham in Room 102C
(First floor; next to interior elevators)
Interviews with Jon Sharpe in Room 506
(Fifth floor conference room) 8:00 – 8:45 a.m. Co Ho, Manager, Academic
Computing Technologies, and Carlos Ayon, Director, Institutional Research & Planning
Terry Cox, NOCE Interim Manager, Administrative Services (8:15 a.m. start time)
9:00 – 9:45 a.m. Carlos Ayon, Director, Institutional Research & Planning
Treisa Cassens, Cypress College Dean, Library/Learning Resource Center
Tina King, NOCE Director, Institutional Research & Planning
10:00 – 10:45 a.m. Cypress College Deans Council (See page 5 for participants)
Jose Ramon Nuñez, Fullerton College Vice President, Instruction
Gilbert Contreras, Fullerton College Vice President, Student Services
11:00 – 11:45 a.m. Fullerton College Deans Council (See page 5 for participants)
Paul De Dios, Cypress College Dean, Counseling & Admissions & Records
NOCE Program Directors (See page 5 for participants)
11:50 a.m. – 12:50 p.m. Lunch Break 1:00 – 1:45 p.m. Lisa McPheron, Fullerton College
Director, Campus Communications CSEA Leadership (See page 6 for participants)
Vaniethia Hubbard, NOCE Dean of Instruction & Student Services, Wilshire Center
2:00 – 2:45 p.m. Cherry Li Bugg, Vice Chancellor, Educational Services & Technology
3:00 – 3:45 p.m.
4:00 – 4:45 p.m. Cypress College Presidents Staff (See pages 5-6 for participants) (Santanu via conference call) Conference Line: 888-450-4821 CBT Passcode: 7547440
NOCE Academic Senate (See page 7 for participants)
Valentina Purtell, NOCE Provost
5:30 p.m. Board of Trustees Meeting (Board Room)
The Collaborative Brain Trust 36
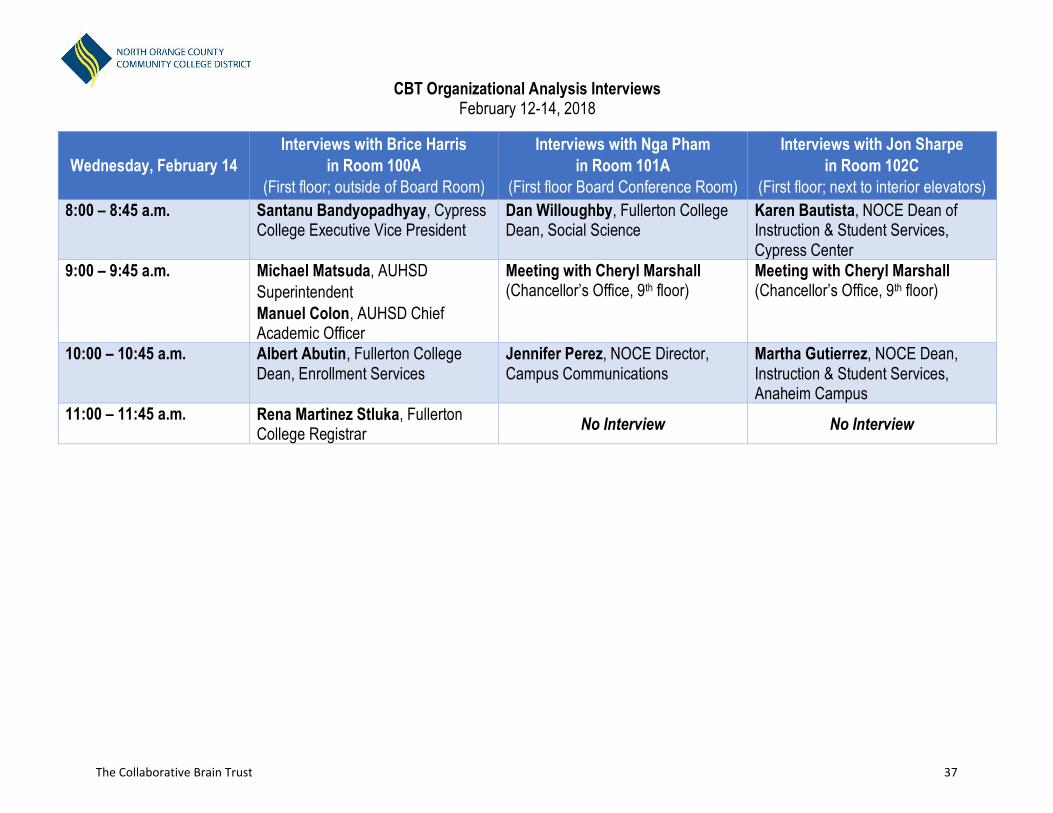
CBT Organizational Analysis Interviews February 12-14, 2018
Wednesday, February 14 Interviews with Brice Harris
in Room 100A (First floor; outside of Board Room)
Interviews with Nga Pham in Room 101A
(First floor Board Conference Room)
Interviews with Jon Sharpe in Room 102C
(First floor; next to interior elevators) 8:00 – 8:45 a.m. Santanu Bandyopadhyay, Cypress
College Executive Vice President Dan Willoughby, Fullerton College Dean, Social Science
Karen Bautista, NOCE Dean of Instruction & Student Services, Cypress Center
9:00 – 9:45 a.m. Michael Matsuda, AUHSD Superintendent Manuel Colon, AUHSD Chief Academic Officer
Meeting with Cheryl Marshall (Chancellor’s Office, 9th floor)
Meeting with Cheryl Marshall (Chancellor’s Office, 9th floor)
10:00 – 10:45 a.m. Albert Abutin, Fullerton College Dean, Enrollment Services
Jennifer Perez, NOCE Director, Campus Communications
Martha Gutierrez, NOCE Dean, Instruction & Student Services, Anaheim Campus
11:00 – 11:45 a.m. Rena Martinez Stluka, Fullerton College Registrar No Interview No Interview
The Collaborative Brain Trust 37
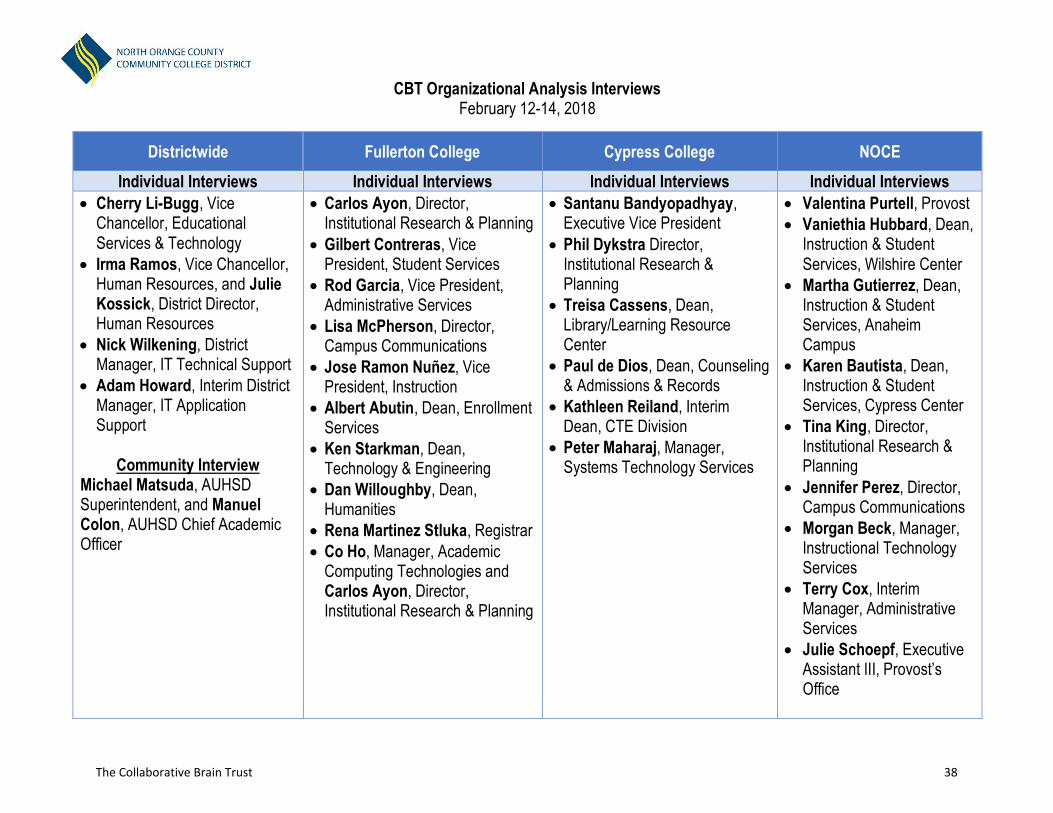
CBT Organizational Analysis Interviews February 12-14, 2018
Districtwide Fullerton College Cypress College NOCE Individual Interviews Individual Interviews Individual Interviews Individual Interviews
• Cherry Li-Bugg, ViceChancellor, EducationalServices & Technology
• Irma Ramos, Vice Chancellor,Human Resources, and JulieKossick, District Director,Human Resources
• Nick Wilkening, DistrictManager, IT Technical Support
• Adam Howard, Interim DistrictManager, IT ApplicationSupport
Community Interview Michael Matsuda, AUHSD Superintendent, and Manuel Colon, AUHSD Chief Academic Officer
• Carlos Ayon, Director,Institutional Research & Planning
• Gilbert Contreras, VicePresident, Student Services
• Rod Garcia, Vice President,Administrative Services
• Lisa McPherson, Director,Campus Communications
• Jose Ramon Nuñez, VicePresident, Instruction
• Albert Abutin, Dean, EnrollmentServices
• Ken Starkman, Dean,Technology & Engineering
• Dan Willoughby, Dean,Humanities
• Rena Martinez Stluka, Registrar• Co Ho, Manager, Academic
Computing Technologies andCarlos Ayon, Director,Institutional Research & Planning
• Santanu Bandyopadhyay,Executive Vice President
• Phil Dykstra Director,Institutional Research &Planning
• Treisa Cassens, Dean,Library/Learning ResourceCenter
• Paul de Dios, Dean, Counseling& Admissions & Records
• Kathleen Reiland, InterimDean, CTE Division
• Peter Maharaj, Manager,Systems Technology Services
• Valentina Purtell, Provost• Vaniethia Hubbard, Dean,
Instruction & StudentServices, Wilshire Center
• Martha Gutierrez, Dean,Instruction & StudentServices, AnaheimCampus
• Karen Bautista, Dean,Instruction & StudentServices, Cypress Center
• Tina King, Director,Institutional Research &Planning
• Jennifer Perez, Director,Campus Communications
• Morgan Beck, Manager,Instructional TechnologyServices
• Terry Cox, InterimManager, AdministrativeServices
• Julie Schoepf, ExecutiveAssistant III, Provost’sOffice
The Collaborative Brain Trust 38
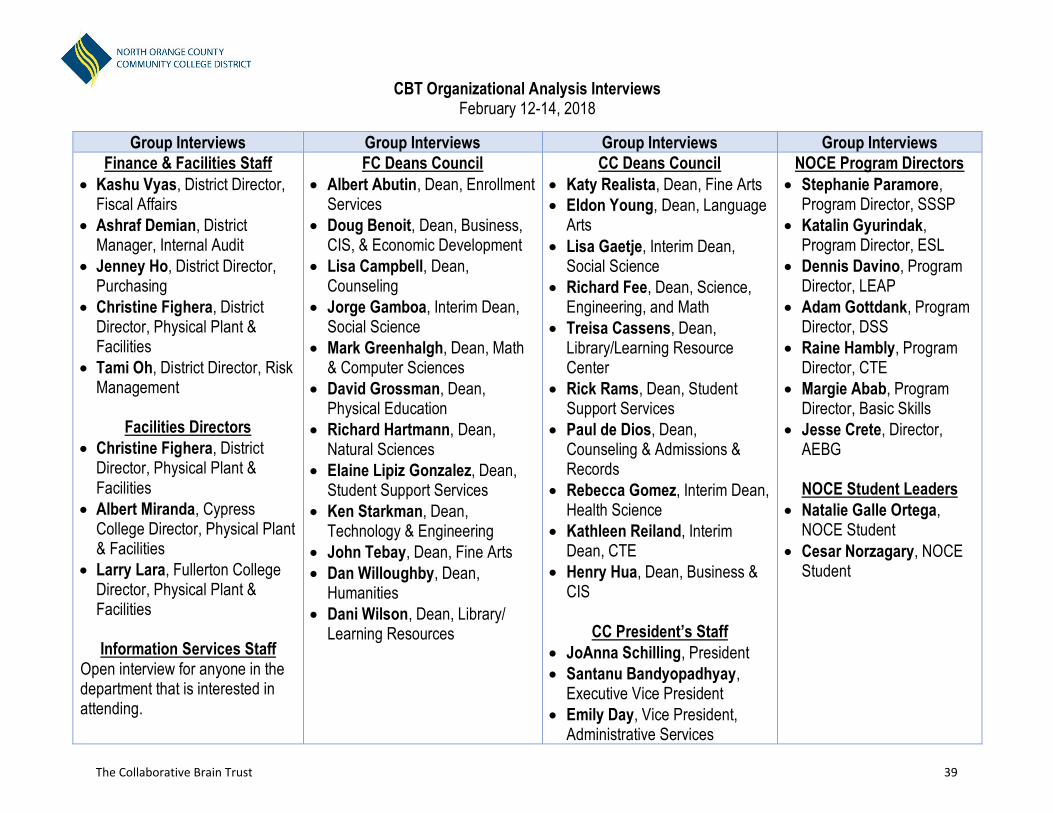
CBT Organizational Analysis Interviews February 12-14, 2018
Group Interviews Group Interviews Group Interviews Group Interviews Finance & Facilities Staff
• Kashu Vyas, District Director,Fiscal Affairs
• Ashraf Demian, DistrictManager, Internal Audit
• Jenney Ho, District Director,Purchasing
• Christine Fighera, DistrictDirector, Physical Plant &Facilities
• Tami Oh, District Director, RiskManagement
Facilities Directors • Christine Fighera, District
Director, Physical Plant &Facilities
• Albert Miranda, CypressCollege Director, Physical Plant& Facilities
• Larry Lara, Fullerton CollegeDirector, Physical Plant &Facilities
Information Services StaffOpen interview for anyone in the department that is interested in attending.
FC Deans Council • Albert Abutin, Dean, Enrollment
Services• Doug Benoit, Dean, Business,
CIS, & Economic Development• Lisa Campbell, Dean,
Counseling• Jorge Gamboa, Interim Dean,
Social Science• Mark Greenhalgh, Dean, Math
& Computer Sciences• David Grossman, Dean,
Physical Education• Richard Hartmann, Dean,
Natural Sciences• Elaine Lipiz Gonzalez, Dean,
Student Support Services• Ken Starkman, Dean,
Technology & Engineering• John Tebay, Dean, Fine Arts• Dan Willoughby, Dean,
Humanities• Dani Wilson, Dean, Library/
Learning Resources
CC Deans Council • Katy Realista, Dean, Fine Arts• Eldon Young, Dean, Language
Arts• Lisa Gaetje, Interim Dean,
Social Science• Richard Fee, Dean, Science,
Engineering, and Math• Treisa Cassens, Dean,
Library/Learning ResourceCenter
• Rick Rams, Dean, StudentSupport Services
• Paul de Dios, Dean,Counseling & Admissions &Records
• Rebecca Gomez, Interim Dean,Health Science
• Kathleen Reiland, InterimDean, CTE
• Henry Hua, Dean, Business &CIS
CC President’s Staff • JoAnna Schilling, President• Santanu Bandyopadhyay,
Executive Vice President• Emily Day, Vice President,
Administrative Services
NOCE Program Directors • Stephanie Paramore,
Program Director, SSSP• Katalin Gyurindak,
Program Director, ESL• Dennis Davino, Program
Director, LEAP• Adam Gottdank, Program
Director, DSS• Raine Hambly, Program
Director, CTE• Margie Abab, Program
Director, Basic Skills• Jesse Crete, Director,
AEBG
NOCE Student Leaders• Natalie Galle Ortega,
NOCE Student• Cesar Norzagary, NOCE
Student
The Collaborative Brain Trust 39
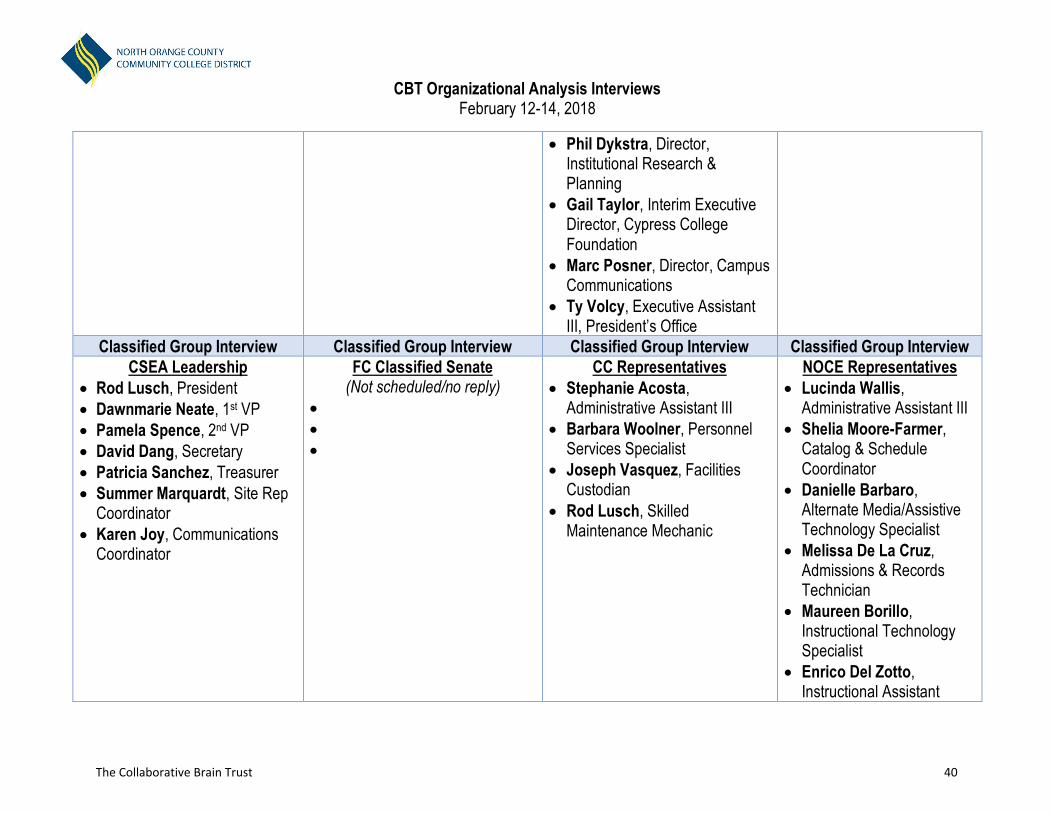
CBT Organizational Analysis Interviews February 12-14, 2018
• Phil Dykstra, Director,Institutional Research &Planning
• Gail Taylor, Interim ExecutiveDirector, Cypress CollegeFoundation
• Marc Posner, Director, CampusCommunications
• Ty Volcy, Executive AssistantIII, President’s Office
Classified Group Interview Classified Group Interview Classified Group Interview Classified Group Interview CSEA Leadership
• Rod Lusch, President• Dawnmarie Neate, 1st VP• Pamela Spence, 2nd VP• David Dang, Secretary• Patricia Sanchez, Treasurer• Summer Marquardt, Site Rep
Coordinator• Karen Joy, Communications
Coordinator
FC Classified Senate (Not scheduled/no reply)
• • •
CC Representatives • Stephanie Acosta,
Administrative Assistant III• Barbara Woolner, Personnel
Services Specialist • Joseph Vasquez, Facilities
Custodian• Rod Lusch, Skilled
Maintenance Mechanic
NOCE Representatives • Lucinda Wallis,
Administrative Assistant III• Shelia Moore-Farmer,
Catalog & ScheduleCoordinator
• Danielle Barbaro,Alternate Media/AssistiveTechnology Specialist
• Melissa De La Cruz,Admissions & RecordsTechnician
• Maureen Borillo,Instructional TechnologySpecialist
• Enrico Del Zotto,Instructional Assistant
The Collaborative Brain Trust 40
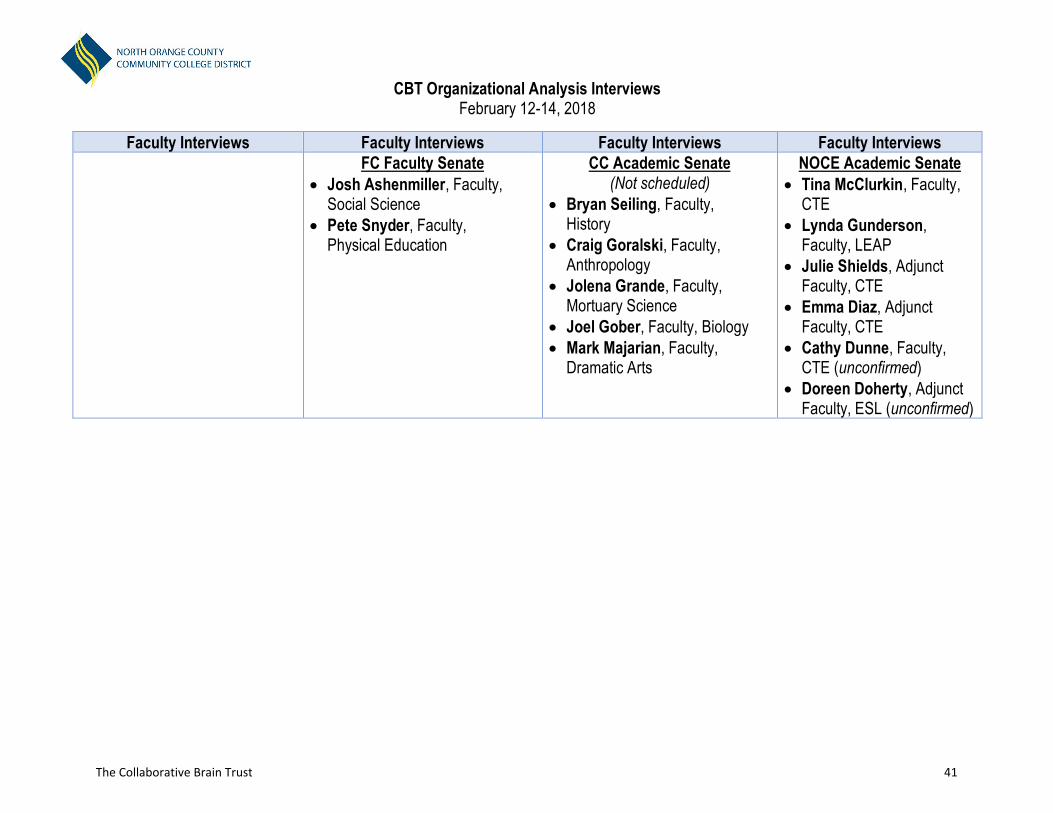
CBT Organizational Analysis Interviews February 12-14, 2018
Faculty Interviews Faculty Interviews Faculty Interviews Faculty Interviews FC Faculty Senate
• Josh Ashenmiller, Faculty,Social Science
• Pete Snyder, Faculty,Physical Education
CC Academic Senate (Not scheduled)
• Bryan Seiling, Faculty,History
• Craig Goralski, Faculty,Anthropology
• Jolena Grande, Faculty,Mortuary Science
• Joel Gober, Faculty, Biology• Mark Majarian, Faculty,
Dramatic Arts
NOCE Academic Senate • Tina McClurkin, Faculty,
CTE• Lynda Gunderson,
Faculty, LEAP• Julie Shields, Adjunct
Faculty, CTE• Emma Diaz, Adjunct
Faculty, CTE• Cathy Dunne, Faculty,
CTE (unconfirmed)• Doreen Doherty, Adjunct
Faculty, ESL (unconfirmed)
The Collaborative Brain Trust 41
APPENDIX C C. Sample Survey Instrument
The Collaborative Brain Trust 42
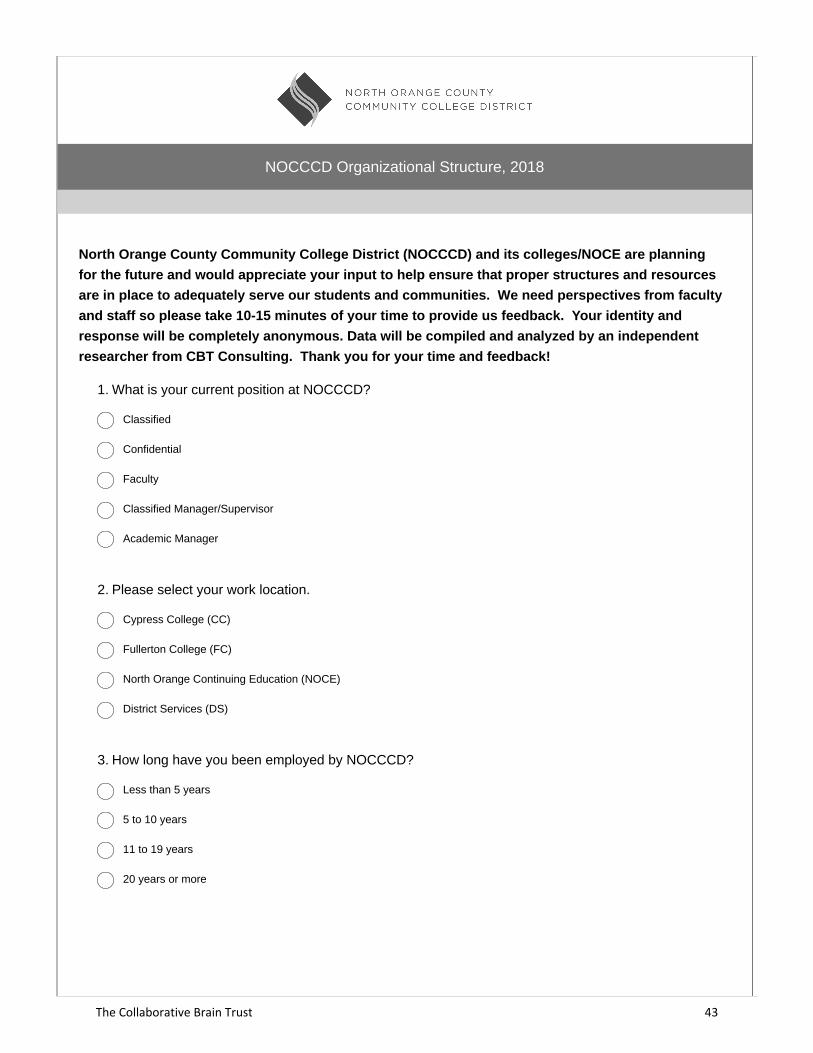
North Orange County Community College District (NOCCCD) and its colleges/NOCE are planningfor the future and would appreciate your input to help ensure that proper structures and resourcesare in place to adequately serve our students and communities. We need perspectives from facultyand staff so please take 10-15 minutes of your time to provide us feedback. Your identity andresponse will be completely anonymous. Data will be compiled and analyzed by an independentresearcher from CBT Consulting. Thank you for your time and feedback!
NOCCCD Organizational Structure, 2018
1. What is your current position at NOCCCD?
Classified
Confidential
Faculty
Classified Manager/Supervisor
Academic Manager
2. Please select your work location.
Cypress College (CC)
Fullerton College (FC)
North Orange Continuing Education (NOCE)
District Services (DS)
3. How long have you been employed by NOCCCD?
Less than 5 years
5 to 10 years
11 to 19 years
20 years or more
The Collaborative Brain Trust 43
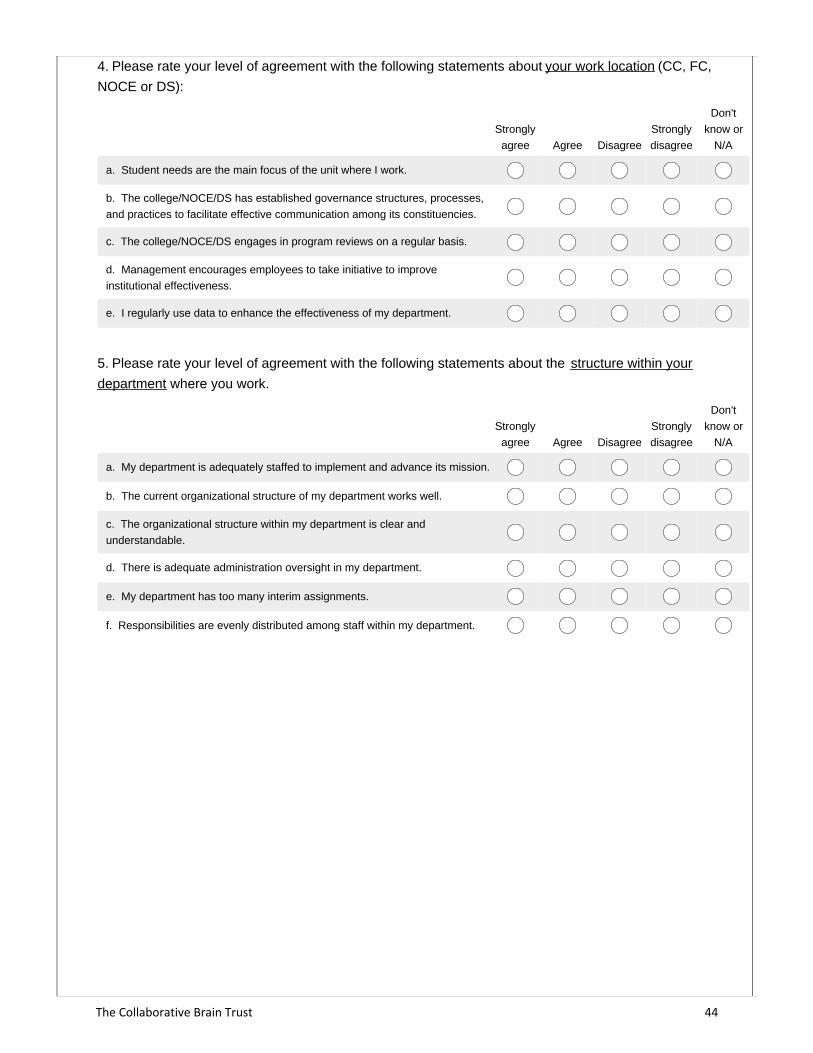
Stronglyagree Agree Disagree
Stronglydisagree
Don'tknow or
N/A
a. Student needs are the main focus of the unit where I work.
b. The college/NOCE/DS has established governance structures, processes,and practices to facilitate effective communication among its constituencies.
c. The college/NOCE/DS engages in program reviews on a regular basis.
d. Management encourages employees to take initiative to improveinstitutional effectiveness.
e. I regularly use data to enhance the effectiveness of my department.
4. Please rate your level of agreement with the following statements about your work location (CC, FC,NOCE or DS):
Stronglyagree Agree Disagree
Stronglydisagree
Don'tknow or
N/A
a. My department is adequately staffed to implement and advance its mission.
b. The current organizational structure of my department works well.
c. The organizational structure within my department is clear andunderstandable.
d. There is adequate administration oversight in my department.
e. My department has too many interim assignments.
f. Responsibilities are evenly distributed among staff within my department.
5. Please rate your level of agreement with the following statements about the structure within yourdepartment where you work.
The Collaborative Brain Trust 44
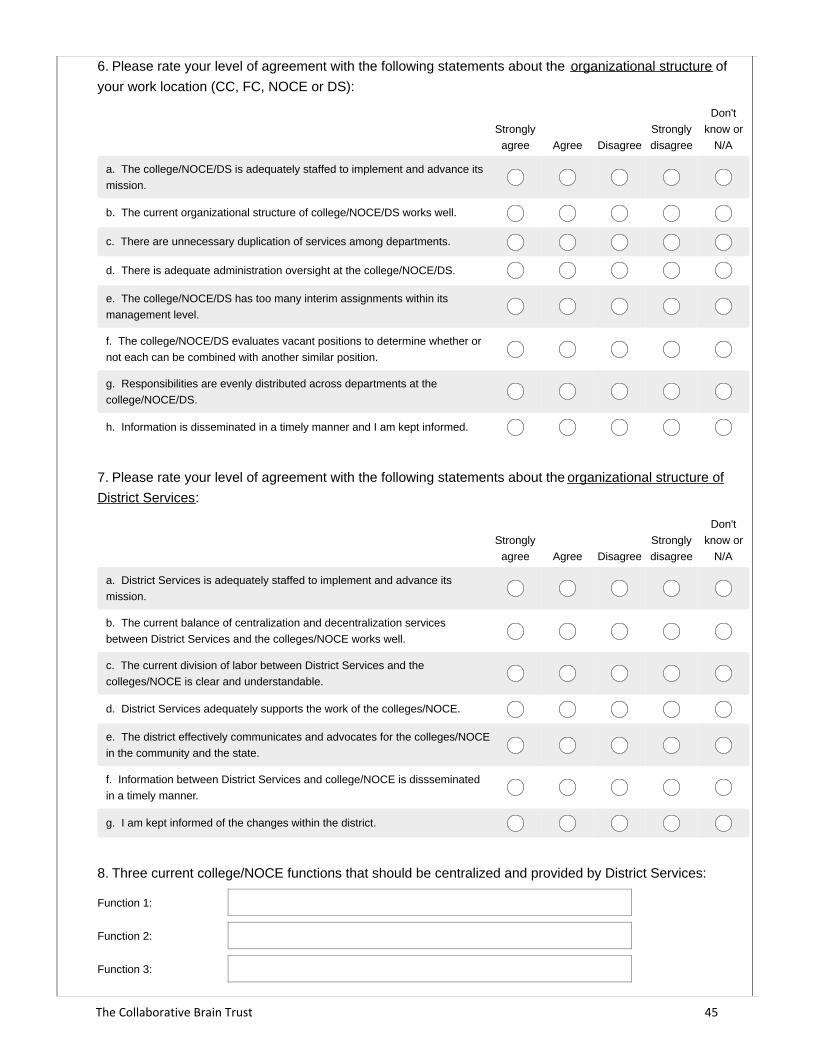
Stronglyagree Agree Disagree
Stronglydisagree
Don'tknow or
N/A
a. The college/NOCE/DS is adequately staffed to implement and advance itsmission.
b. The current organizational structure of college/NOCE/DS works well.
c. There are unnecessary duplication of services among departments.
d. There is adequate administration oversight at the college/NOCE/DS.
e. The college/NOCE/DS has too many interim assignments within itsmanagement level.
f. The college/NOCE/DS evaluates vacant positions to determine whether ornot each can be combined with another similar position.
g. Responsibilities are evenly distributed across departments at thecollege/NOCE/DS.
h. Information is disseminated in a timely manner and I am kept informed.
6. Please rate your level of agreement with the following statements about the organizational structure ofyour work location (CC, FC, NOCE or DS):
Stronglyagree Agree Disagree
Stronglydisagree
Don'tknow or
N/A
a. District Services is adequately staffed to implement and advance itsmission.
b. The current balance of centralization and decentralization servicesbetween District Services and the colleges/NOCE works well.
c. The current division of labor between District Services and thecolleges/NOCE is clear and understandable.
d. District Services adequately supports the work of the colleges/NOCE.
e. The district effectively communicates and advocates for the colleges/NOCEin the community and the state.
f. Information between District Services and college/NOCE is dissseminatedin a timely manner.
g. I am kept informed of the changes within the district.
7. Please rate your level of agreement with the following statements about the organizational structure ofDistrict Services:
Function 1:
Function 2:
Function 3:
8. Three current college/NOCE functions that should be centralized and provided by District Services:
The Collaborative Brain Trust 45
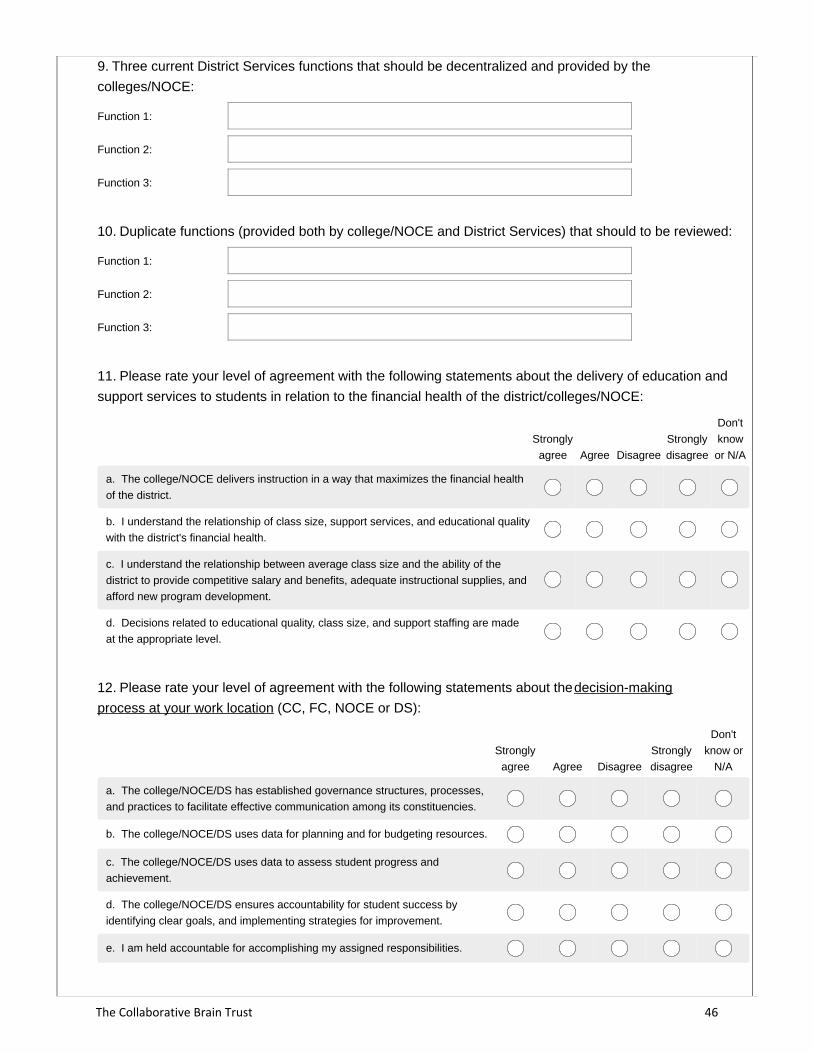
Function 1:
Function 2:
Function 3:
9. Three current District Services functions that should be decentralized and provided by thecolleges/NOCE:
Function 1:
Function 2:
Function 3:
10. Duplicate functions (provided both by college/NOCE and District Services) that should to be reviewed:
Stronglyagree Agree Disagree
Stronglydisagree
Don'tknowor N/A
a. The college/NOCE delivers instruction in a way that maximizes the financial healthof the district.
b. I understand the relationship of class size, support services, and educational qualitywith the district's financial health.
c. I understand the relationship between average class size and the ability of thedistrict to provide competitive salary and benefits, adequate instructional supplies, andafford new program development.
d. Decisions related to educational quality, class size, and support staffing are madeat the appropriate level.
11. Please rate your level of agreement with the following statements about the delivery of education andsupport services to students in relation to the financial health of the district/colleges/NOCE:
Stronglyagree Agree Disagree
Stronglydisagree
Don'tknow or
N/A
a. The college/NOCE/DS has established governance structures, processes,and practices to facilitate effective communication among its constituencies.
b. The college/NOCE/DS uses data for planning and for budgeting resources.
c. The college/NOCE/DS uses data to assess student progress andachievement.
d. The college/NOCE/DS ensures accountability for student success byidentifying clear goals, and implementing strategies for improvement.
e. I am held accountable for accomplishing my assigned responsibilities.
12. Please rate your level of agreement with the following statements about the decision-makingprocess at your work location (CC, FC, NOCE or DS):
The Collaborative Brain Trust 46
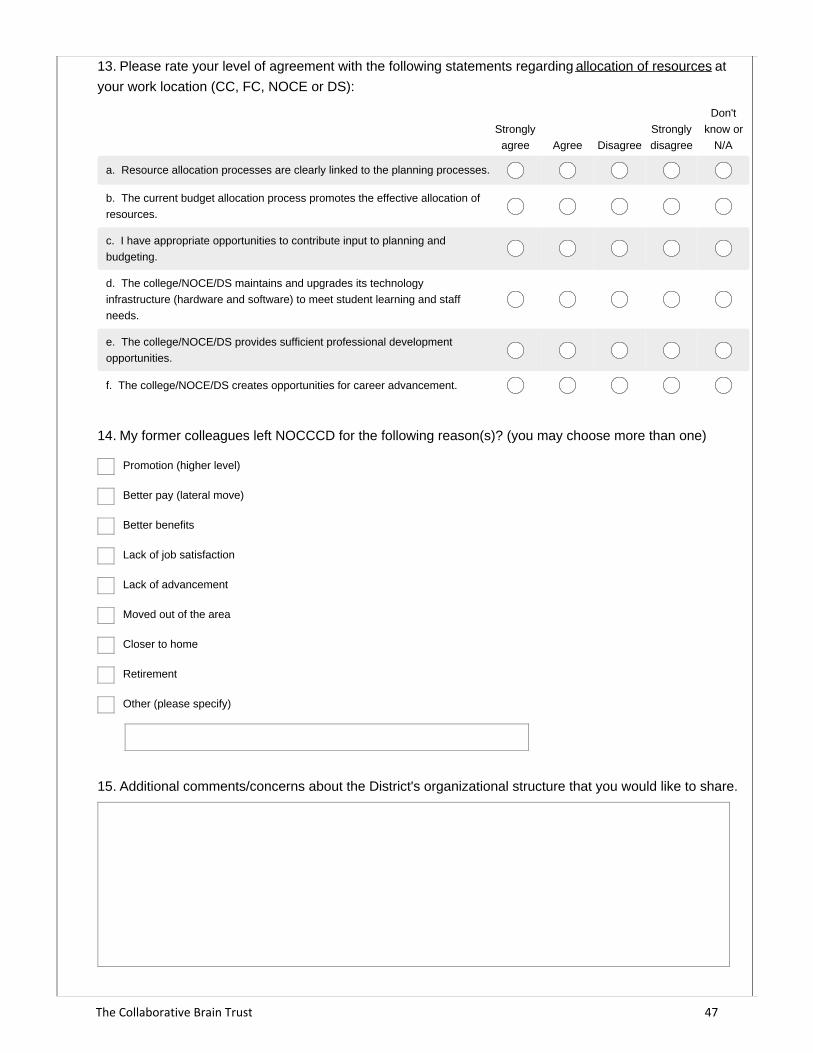
Stronglyagree Agree Disagree
Stronglydisagree
Don'tknow or
N/A
a. Resource allocation processes are clearly linked to the planning processes.
b. The current budget allocation process promotes the effective allocation ofresources.
c. I have appropriate opportunities to contribute input to planning andbudgeting.
d. The college/NOCE/DS maintains and upgrades its technologyinfrastructure (hardware and software) to meet student learning and staffneeds.
e. The college/NOCE/DS provides sufficient professional developmentopportunities.
f. The college/NOCE/DS creates opportunities for career advancement.
13. Please rate your level of agreement with the following statements regarding allocation of resources atyour work location (CC, FC, NOCE or DS):
14. My former colleagues left NOCCCD for the following reason(s)? (you may choose more than one)
Promotion (higher level)
Better pay (lateral move)
Better benefits
Lack of job satisfaction
Lack of advancement
Moved out of the area
Closer to home
Retirement
Other (please specify)
15. Additional comments/concerns about the District's organizational structure that you would like to share.
The Collaborative Brain Trust 47
APPENDIX D D. Total Survey Results for
North Orange County Community College District
The Collaborative Brain Trust 48
North Orange County Community College District
Results of the Organizational Structure Survey
Spring 2018
In times of political and economic uncertainty, an organization, even a public college district,
needs to look inwardly to understand itself to ensure it can serve its students and community
effectively and efficiently. A comprehensive review of organizational structure requires multiple
perspectives, including the perspective of those who work within the organization. In early
February 2018, all full-time faculty and staff were invited to share their opinions of the District
and its Colleges via an online survey.
During a three-week period, 516 individuals shared their understanding, compliments, and
concerns about the existing structure of their department, the Colleges, as well as the District. A
diverse pool of participants from across the district responded, including from employees of
different employment classifications, and from employees grouped by years of employment at
the district:
Half of the respondents were faculty, 33% classified/confidential, and 17% were
management/supervisory;
There was proportionate representation from the different college locations: 33% from
Cypress College, 48% from Fullerton College, 16% from North Orange Continuing
Education (NOCE), and 3% from District Services; and
Nearly one-third have been employed at the District less than five years, 18% from 5 to
10 years, 30% 11 to 19 years and 22% have been with the District for more than 20 years.
Overall, respondents somewhat agreed that the District’s, the Colleges’, and their department’s
organizational structures work, but that there is room for improvement. Respondents were
generous in sharing their comments, compliments and concerns. The comments may prove
helpful as the District considers refining its structures for efficiency and effectiveness.
About Respondents’ Work Location:
Many respondents stated that student needs are the main focus of their workplace (mean
of 3.43, on a scale of 1 to 4, 1 being “strongly disagree” and 4 being “strongly agree”),
that they engage in program reviews regularly (3.19) and that they use data to enhance
the effectiveness of the department (3.08).
Respondents somewhat agreed that management encourages employees to take initiative
to improve institutional effectiveness (2.91) or that their workplace has established
governance structures, processes and practices to facilitate effective communication
(2.82).
District Services stated less agreement that the Colleges’ focus is students’ needs (2.82
vs. 3.24 to 3.52 averages for other three locations) and more agreement that the Colleges
have an established governance structure, processes, and practices to facilitate effective
communication (3.13 vs 2.70 to 2.88 for the three other locations).
The Collaborative Brain Trust 49
NOCE noted less agreement that they conduct program reviews on a more regular basis
than the other locations (2.73 vs. 3.15+ for the others).
There were minor differences in ratings among the different employment groups
and the respondents grouped by years of service in the district.
Organizational Structure at the Department Level:
Respondents stated that there is adequate administrative oversight (2.97) and that the
organizational structure within their department is clear and understandable (2.91).
However, respondents indicated less agreement that their department is adequately
staffed to implement and advance its mission (2.40) or that responsibilities are evenly
distributed among staff within the department.
Cypress College (2.46) and NOCE (2.41) indicated slightly more agreement that they do
have too many interim assignments in their departments (2.29 overall).
There were minor differences in levels of agreement from the different locations,
employment groups and respondents grouped by years of service with regard to
departmental structure.
Organizational Structure at the College Level:
Respondents are in agreement that there is adequate administrative oversight (2.89), that
there are too many management interim assignments (2.81), and that the current
organizational structure of the college level works well (2.64).
Cypress College noted higher agreement that they have too many management
interims (3.04) than the other three locations (2.62 to 2.87).
Fullerton College expressed slightly higher agreement that their organizational
structure works well for them (2.76 vs. 2.38 to 2.65 for the other three locations).
Some respondents noted that information across the departments is not disseminated in a
timely manner, thus not being kept informed (2.69), that there is some duplication of
services among departments (2.56), and that the colleges do not evaluate vacant positions
to determine whether or not each can be combined with another similar position (2.54).
There were minor differences among the colleges, the employees grouped by
employment classifications, and employees grouped by length of service in each
of these categories.
There is also an indication that responsibilities are not evenly distributed across
departments (2.22), especially at Cypress College (1.99).
Organizational Structure at the District Services:
Respondents noted that the district effectively communicates and advocates for the
colleges in the community and at the state level (2.71) and that District Services is
adequately staffed to implement and advance its mission (2.69).
District Services respondents did not rate their agreement as high that they are
adequately staffed (2.11 vs. 2.69 to 2.77 from the other locations).
Respondents did not find information between District Services and the Colleges to be
disseminated in a timely manner and that they are not kept informed of the changes
within the district (both at 2.53).
Respondents noted a somewhat lower level of agreement that District Services
adequately supports the work of the colleges (2.49), that the current balance of
The Collaborative Brain Trust 50
centralization and decentralization between District Services and the Colleges works well
(2.39) and that the division of labor between the two units is clear and understandable
(2.34).
Cypress College rated District Services slightly lower than the other Colleges in
their support of the Colleges (2.17 vs. 2.59 to 2.81).
Management/supervisory consistently rated each question/category within the
organizational structure of District Services section lower than other sub-groups.
Delivery of Education and Support Services to Students in Relation to Financial Health:
Respondents understood the relationship of class size, support services, and educational
quality with the district’s financial health (2.91), but slightly less in their understanding
of the relationship between average class size and the ability of the district to provide
competitive salary and benefits, adequate instructional supplies, and afford new program
development (2.75).
Management/supervisory has a slightly higher understanding of these two areas
than other groups (3.24 and 3.18 respectively).
Respondents somewhat agreed that the Colleges deliver instruction in a way that
maximizes the financial health of the district (2.66) and less agreement that decisions
related to educational quality, class size, and supporting staffing are made at the
appropriate level (2.36).
District Services staff rated that decision making at the appropriate level at a
lower rate (1.90).
Decision-Making Process at Work Location:
Many respondents agreed that they are held accountable for accomplishing their assigned
responsibilities (3.36); however, they did not think that the Colleges ensure
accountability for student success by identifying clear goals and implementing strategies
for improvement (2.85).
Classified staff and those who have been employed at the district for less than five
years were slightly more agreeable than others in these two categories.
The Colleges and District Services use data to assess student progress and achievement
(2.99), as well as to plan and to budget resources (2.92).
Respondents also agreed that each location has established governance structures,
processes and practices to facilitate effective communication among its constituencies
(2.79).
Allocation of Resources at Work Location:
Respondents agreed that the Colleges and District provide sufficient professional
development opportunities (2.82).
Respondents are somewhat in agreement that the current allocation model processes are
clearly linked to the planning processes (2.56) and that it promotes the effective
allocation of resources (2.35).
Cypress College respondents rated these two categories slightly lower than the
other locations.
Many respondents do not have appropriate opportunities to contribute input to planning
and budgeting (2.44) at the college location.
The Collaborative Brain Trust 51
Management/supervisory stated that they do have more opportunities to give input
(2.73) vs. the faculty and classified staff (both at 2.37).
Many respondents also do not agree that the Colleges/District create opportunities for
career advancement or that they maintain and upgrade technology infrastructure to meet
student learning and staff needs (both 2.44).
However, faculty rated the opportunities for career advancement slightly higher
(2.57) than management/supervisory (2.40) and classified (2.29).
Alignment of District Services and College Functions:
Information technologies/academic computing services, communications, budget
allocation and funding of needed programs, human resources and various hiring related
issues, grant writing to procure additional funding, and safety are among the many
functions which respondents would like to see centralized and offered by district
services. A comprehensive list of other functions can be found on page 22.
Budget development and allocation, hiring/staffing decisions, information technologies
services, public information/marketing, curriculum development and grants oversight are
among the services respondents would like to see decentralized and offered at the
colleges. A comprehensive list of other functions can be found on page 22.
Budgeting/accounting, information technologies, instructional technology & support,
marketing/outreach to the community, review of management positions, and
compliance/Title IX are duplicate functions that should be reviewed for effectiveness. A
comprehensive list of other functions can be found on page 23.
Other than the 20% of responses noting retirement, respondents identified the major
reasons that former colleagues left NOCCD were due to better pay for lateral moves
(20%), better benefits (17%), promotion to higher levels (14%), and lack of advancement
(10%).
There was an additional 10% of respondents that identified lack of job
satisfaction, hostile work environment and lack of leadership as the causes of
former employees leaving.
Respondent comments (mainly from the Colleges): Below are some observations from reviewing the comments made by respondents. A complete
list of comments, by employee group and by college location can be found on pages 24 to 49.
The colleges have their own independent processes and procedures which negatively
impact students who wish to attend both colleges; therefore, District Services needs to
mediate to ensure more efficient pathways for students.
Staff expressed frustration when dealing with some of the District Services, such as
human resources and IT issues. They do not get the response to their requests in a timely
manner, nor do they feel the district staff plans meetings or trainings with consideration
to the activities, schedules, and needs of the Colleges.
Decisions made at the District are perceived to have been made without input from the
Colleges, such as scheduling of training and or upgrades during their busiest time of the
semester.
Communication between Colleges and District are limited and respondents do not feel
informed.
The Collaborative Brain Trust 52
Respondents do not understand many of the programs and services at District
Services and therefore question the need for the offices and personnel.
Many decisions are made based on the person and not the process(es); therefore, the
District decisions are not documented and/or not unified.
The District has not been able to hire the most qualified candidates due to low pay and
benefits.
Safety and compliance were among issues in which respondents would like more
oversight and support from the district.
The Collaborative Brain Trust 53
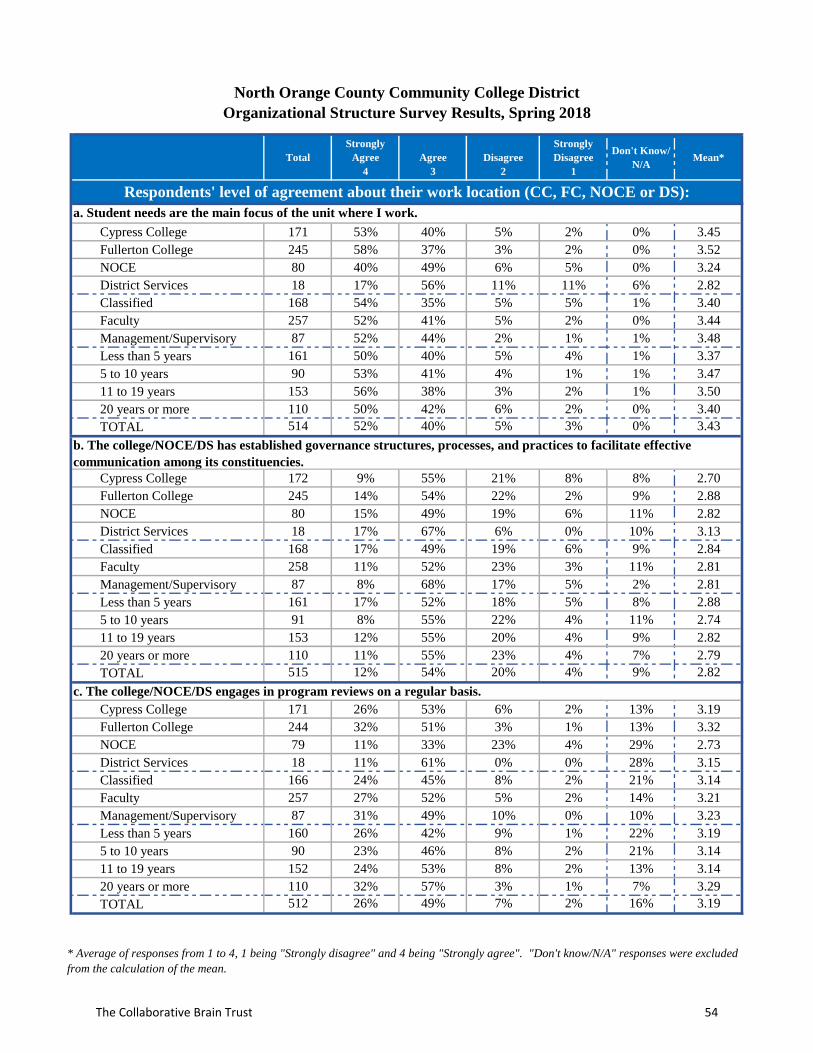
Total
Strongly
Agree
4
Agree
3
Disagree
2
Strongly
Disagree
1
Don't Know/
N/AMean*
Cypress College 171 53% 40% 5% 2% 0% 3.45
Fullerton College 245 58% 37% 3% 2% 0% 3.52
NOCE 80 40% 49% 6% 5% 0% 3.24
District Services 18 17% 56% 11% 11% 6% 2.82
Classified 168 54% 35% 5% 5% 1% 3.40
Faculty 257 52% 41% 5% 2% 0% 3.44
Management/Supervisory 87 52% 44% 2% 1% 1% 3.48
Less than 5 years 161 50% 40% 5% 4% 1% 3.37
5 to 10 years 90 53% 41% 4% 1% 1% 3.47
11 to 19 years 153 56% 38% 3% 2% 1% 3.50
20 years or more 110 50% 42% 6% 2% 0% 3.40
TOTAL 514 52% 40% 5% 3% 0% 3.43
Cypress College 172 9% 55% 21% 8% 8% 2.70
Fullerton College 245 14% 54% 22% 2% 9% 2.88
NOCE 80 15% 49% 19% 6% 11% 2.82
District Services 18 17% 67% 6% 0% 10% 3.13
Classified 168 17% 49% 19% 6% 9% 2.84
Faculty 258 11% 52% 23% 3% 11% 2.81
Management/Supervisory 87 8% 68% 17% 5% 2% 2.81
Less than 5 years 161 17% 52% 18% 5% 8% 2.88
5 to 10 years 91 8% 55% 22% 4% 11% 2.74
11 to 19 years 153 12% 55% 20% 4% 9% 2.82
20 years or more 110 11% 55% 23% 4% 7% 2.79
TOTAL 515 12% 54% 20% 4% 9% 2.82
Cypress College 171 26% 53% 6% 2% 13% 3.19
Fullerton College 244 32% 51% 3% 1% 13% 3.32
NOCE 79 11% 33% 23% 4% 29% 2.73
District Services 18 11% 61% 0% 0% 28% 3.15
Classified 166 24% 45% 8% 2% 21% 3.14
Faculty 257 27% 52% 5% 2% 14% 3.21
Management/Supervisory 87 31% 49% 10% 0% 10% 3.23
Less than 5 years 160 26% 42% 9% 1% 22% 3.19
5 to 10 years 90 23% 46% 8% 2% 21% 3.14
11 to 19 years 152 24% 53% 8% 2% 13% 3.14
20 years or more 110 32% 57% 3% 1% 7% 3.29
TOTAL 512 26% 49% 7% 2% 16% 3.19
c. The college/NOCE/DS engages in program reviews on a regular basis.
a. Student needs are the main focus of the unit where I work.
North Orange County Community College District
Organizational Structure Survey Results, Spring 2018
Respondents' level of agreement about their work location (CC, FC, NOCE or DS):
b. The college/NOCE/DS has established governance structures, processes, and practices to facilitate effective
communication among its constituencies.
* Average of responses from 1 to 4, 1 being "Strongly disagree" and 4 being "Strongly agree". "Don't know/N/A" responses were excluded
from the calculation of the mean.
The Collaborative Brain Trust 54
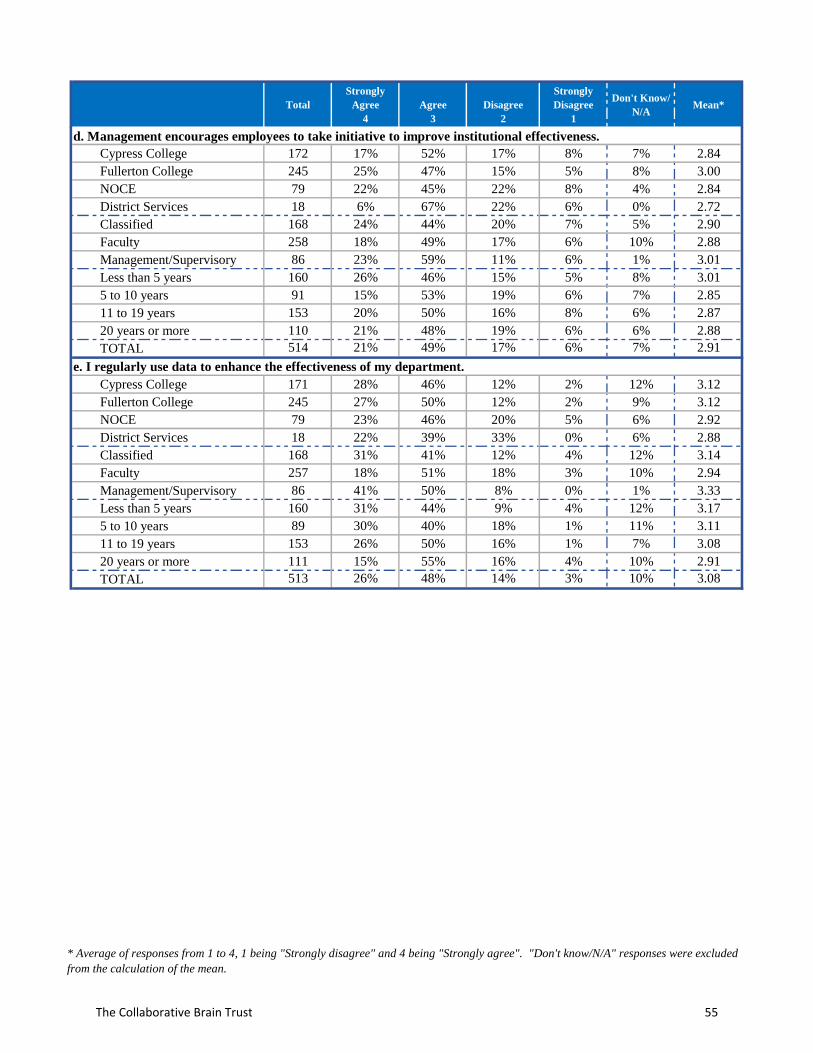
Total
Strongly
Agree
4
Agree
3
Disagree
2
Strongly
Disagree
1
Don't Know/
N/AMean*
Cypress College 172 17% 52% 17% 8% 7% 2.84
Fullerton College 245 25% 47% 15% 5% 8% 3.00
NOCE 79 22% 45% 22% 8% 4% 2.84
District Services 18 6% 67% 22% 6% 0% 2.72
Classified 168 24% 44% 20% 7% 5% 2.90
Faculty 258 18% 49% 17% 6% 10% 2.88
Management/Supervisory 86 23% 59% 11% 6% 1% 3.01
Less than 5 years 160 26% 46% 15% 5% 8% 3.01
5 to 10 years 91 15% 53% 19% 6% 7% 2.85
11 to 19 years 153 20% 50% 16% 8% 6% 2.87
20 years or more 110 21% 48% 19% 6% 6% 2.88
TOTAL 514 21% 49% 17% 6% 7% 2.91
Cypress College 171 28% 46% 12% 2% 12% 3.12
Fullerton College 245 27% 50% 12% 2% 9% 3.12
NOCE 79 23% 46% 20% 5% 6% 2.92
District Services 18 22% 39% 33% 0% 6% 2.88
Classified 168 31% 41% 12% 4% 12% 3.14
Faculty 257 18% 51% 18% 3% 10% 2.94
Management/Supervisory 86 41% 50% 8% 0% 1% 3.33
Less than 5 years 160 31% 44% 9% 4% 12% 3.17
5 to 10 years 89 30% 40% 18% 1% 11% 3.11
11 to 19 years 153 26% 50% 16% 1% 7% 3.08
20 years or more 111 15% 55% 16% 4% 10% 2.91
TOTAL 513 26% 48% 14% 3% 10% 3.08
d. Management encourages employees to take initiative to improve institutional effectiveness.
e. I regularly use data to enhance the effectiveness of my department.
* Average of responses from 1 to 4, 1 being "Strongly disagree" and 4 being "Strongly agree". "Don't know/N/A" responses were excluded
from the calculation of the mean.
The Collaborative Brain Trust 55
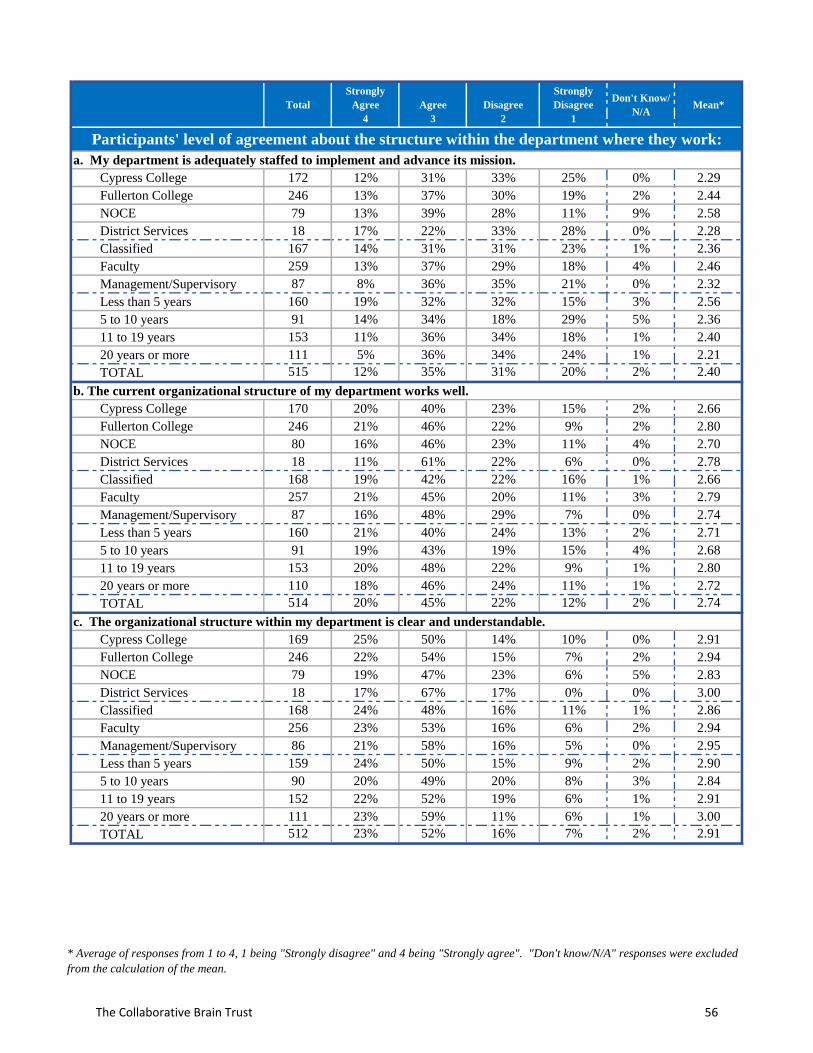
Total
Strongly
Agree
4
Agree
3
Disagree
2
Strongly
Disagree
1
Don't Know/
N/AMean*
Cypress College 172 12% 31% 33% 25% 0% 2.29
Fullerton College 246 13% 37% 30% 19% 2% 2.44
NOCE 79 13% 39% 28% 11% 9% 2.58
District Services 18 17% 22% 33% 28% 0% 2.28
Classified 167 14% 31% 31% 23% 1% 2.36
Faculty 259 13% 37% 29% 18% 4% 2.46
Management/Supervisory 87 8% 36% 35% 21% 0% 2.32
Less than 5 years 160 19% 32% 32% 15% 3% 2.56
5 to 10 years 91 14% 34% 18% 29% 5% 2.36
11 to 19 years 153 11% 36% 34% 18% 1% 2.40
20 years or more 111 5% 36% 34% 24% 1% 2.21
TOTAL 515 12% 35% 31% 20% 2% 2.40
Cypress College 170 20% 40% 23% 15% 2% 2.66
Fullerton College 246 21% 46% 22% 9% 2% 2.80
NOCE 80 16% 46% 23% 11% 4% 2.70
District Services 18 11% 61% 22% 6% 0% 2.78
Classified 168 19% 42% 22% 16% 1% 2.66
Faculty 257 21% 45% 20% 11% 3% 2.79
Management/Supervisory 87 16% 48% 29% 7% 0% 2.74
Less than 5 years 160 21% 40% 24% 13% 2% 2.71
5 to 10 years 91 19% 43% 19% 15% 4% 2.68
11 to 19 years 153 20% 48% 22% 9% 1% 2.80
20 years or more 110 18% 46% 24% 11% 1% 2.72
TOTAL 514 20% 45% 22% 12% 2% 2.74
Cypress College 169 25% 50% 14% 10% 0% 2.91
Fullerton College 246 22% 54% 15% 7% 2% 2.94
NOCE 79 19% 47% 23% 6% 5% 2.83
District Services 18 17% 67% 17% 0% 0% 3.00
Classified 168 24% 48% 16% 11% 1% 2.86
Faculty 256 23% 53% 16% 6% 2% 2.94
Management/Supervisory 86 21% 58% 16% 5% 0% 2.95
Less than 5 years 159 24% 50% 15% 9% 2% 2.90
5 to 10 years 90 20% 49% 20% 8% 3% 2.84
11 to 19 years 152 22% 52% 19% 6% 1% 2.91
20 years or more 111 23% 59% 11% 6% 1% 3.00
TOTAL 512 23% 52% 16% 7% 2% 2.91
b. The current organizational structure of my department works well.
c. The organizational structure within my department is clear and understandable.
a. My department is adequately staffed to implement and advance its mission.
Participants' level of agreement about the structure within the department where they work:
* Average of responses from 1 to 4, 1 being "Strongly disagree" and 4 being "Strongly agree". "Don't know/N/A" responses were excluded
from the calculation of the mean.
The Collaborative Brain Trust 56
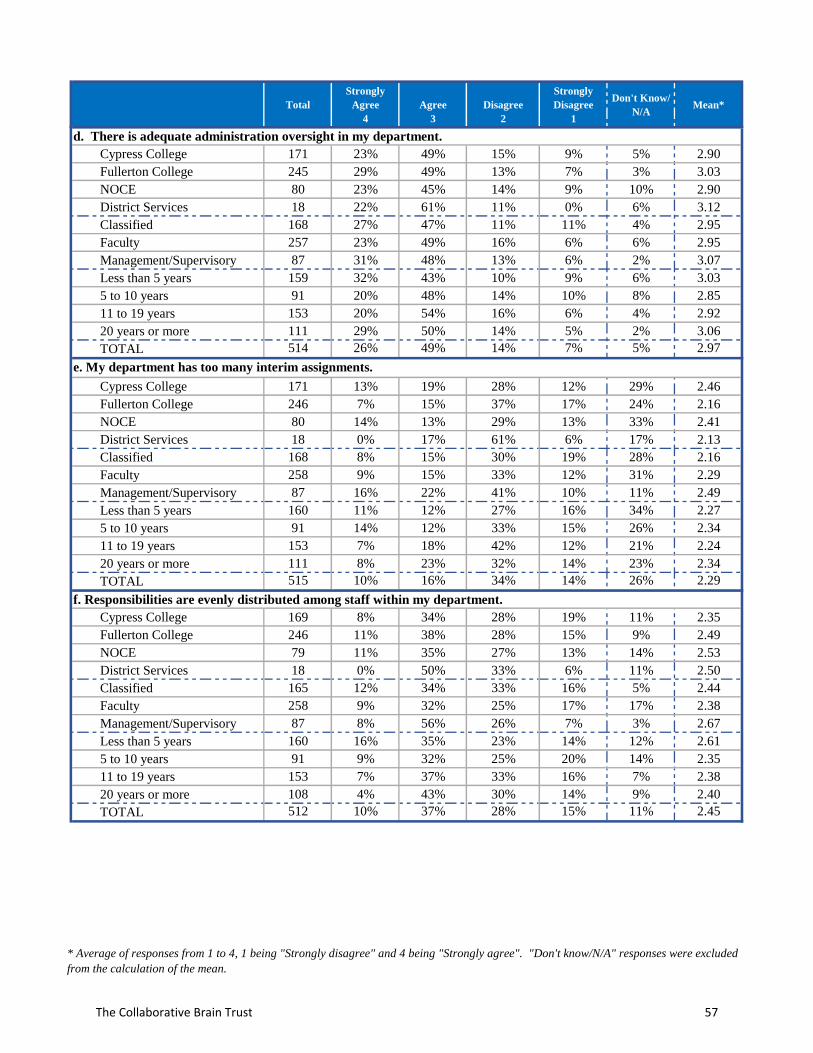
Total
Strongly
Agree
4
Agree
3
Disagree
2
Strongly
Disagree
1
Don't Know/
N/AMean*
Cypress College 171 23% 49% 15% 9% 5% 2.90
Fullerton College 245 29% 49% 13% 7% 3% 3.03
NOCE 80 23% 45% 14% 9% 10% 2.90
District Services 18 22% 61% 11% 0% 6% 3.12
Classified 168 27% 47% 11% 11% 4% 2.95
Faculty 257 23% 49% 16% 6% 6% 2.95
Management/Supervisory 87 31% 48% 13% 6% 2% 3.07
Less than 5 years 159 32% 43% 10% 9% 6% 3.03
5 to 10 years 91 20% 48% 14% 10% 8% 2.85
11 to 19 years 153 20% 54% 16% 6% 4% 2.92
20 years or more 111 29% 50% 14% 5% 2% 3.06
TOTAL 514 26% 49% 14% 7% 5% 2.97
Cypress College 171 13% 19% 28% 12% 29% 2.46
Fullerton College 246 7% 15% 37% 17% 24% 2.16
NOCE 80 14% 13% 29% 13% 33% 2.41
District Services 18 0% 17% 61% 6% 17% 2.13
Classified 168 8% 15% 30% 19% 28% 2.16
Faculty 258 9% 15% 33% 12% 31% 2.29
Management/Supervisory 87 16% 22% 41% 10% 11% 2.49
Less than 5 years 160 11% 12% 27% 16% 34% 2.27
5 to 10 years 91 14% 12% 33% 15% 26% 2.34
11 to 19 years 153 7% 18% 42% 12% 21% 2.24
20 years or more 111 8% 23% 32% 14% 23% 2.34
TOTAL 515 10% 16% 34% 14% 26% 2.29
Cypress College 169 8% 34% 28% 19% 11% 2.35
Fullerton College 246 11% 38% 28% 15% 9% 2.49
NOCE 79 11% 35% 27% 13% 14% 2.53
District Services 18 0% 50% 33% 6% 11% 2.50
Classified 165 12% 34% 33% 16% 5% 2.44
Faculty 258 9% 32% 25% 17% 17% 2.38
Management/Supervisory 87 8% 56% 26% 7% 3% 2.67
Less than 5 years 160 16% 35% 23% 14% 12% 2.61
5 to 10 years 91 9% 32% 25% 20% 14% 2.35
11 to 19 years 153 7% 37% 33% 16% 7% 2.38
20 years or more 108 4% 43% 30% 14% 9% 2.40
TOTAL 512 10% 37% 28% 15% 11% 2.45
d. There is adequate administration oversight in my department.
e. My department has too many interim assignments.
f. Responsibilities are evenly distributed among staff within my department.
* Average of responses from 1 to 4, 1 being "Strongly disagree" and 4 being "Strongly agree". "Don't know/N/A" responses were excluded
from the calculation of the mean.
The Collaborative Brain Trust 57
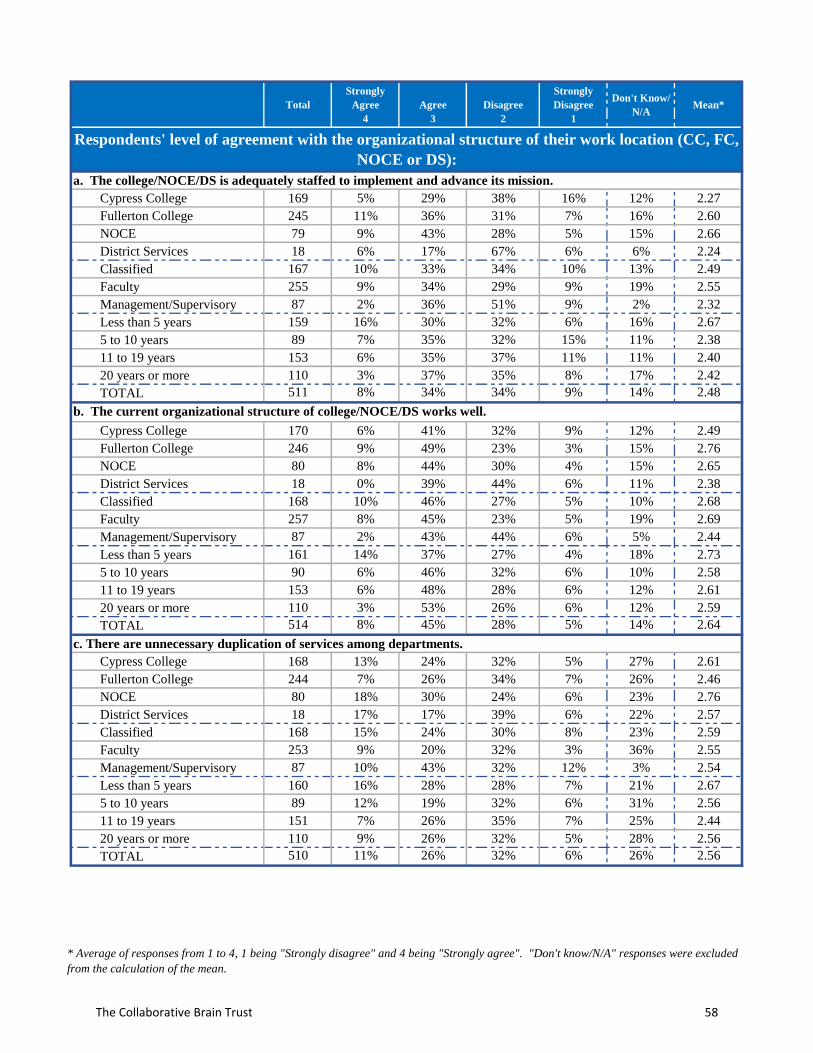
Total
Strongly
Agree
4
Agree
3
Disagree
2
Strongly
Disagree
1
Don't Know/
N/AMean*
Cypress College 169 5% 29% 38% 16% 12% 2.27
Fullerton College 245 11% 36% 31% 7% 16% 2.60
NOCE 79 9% 43% 28% 5% 15% 2.66
District Services 18 6% 17% 67% 6% 6% 2.24
Classified 167 10% 33% 34% 10% 13% 2.49
Faculty 255 9% 34% 29% 9% 19% 2.55
Management/Supervisory 87 2% 36% 51% 9% 2% 2.32
Less than 5 years 159 16% 30% 32% 6% 16% 2.67
5 to 10 years 89 7% 35% 32% 15% 11% 2.38
11 to 19 years 153 6% 35% 37% 11% 11% 2.40
20 years or more 110 3% 37% 35% 8% 17% 2.42
TOTAL 511 8% 34% 34% 9% 14% 2.48
Cypress College 170 6% 41% 32% 9% 12% 2.49
Fullerton College 246 9% 49% 23% 3% 15% 2.76
NOCE 80 8% 44% 30% 4% 15% 2.65
District Services 18 0% 39% 44% 6% 11% 2.38
Classified 168 10% 46% 27% 5% 10% 2.68
Faculty 257 8% 45% 23% 5% 19% 2.69
Management/Supervisory 87 2% 43% 44% 6% 5% 2.44
Less than 5 years 161 14% 37% 27% 4% 18% 2.73
5 to 10 years 90 6% 46% 32% 6% 10% 2.58
11 to 19 years 153 6% 48% 28% 6% 12% 2.61
20 years or more 110 3% 53% 26% 6% 12% 2.59
TOTAL 514 8% 45% 28% 5% 14% 2.64
Cypress College 168 13% 24% 32% 5% 27% 2.61
Fullerton College 244 7% 26% 34% 7% 26% 2.46
NOCE 80 18% 30% 24% 6% 23% 2.76
District Services 18 17% 17% 39% 6% 22% 2.57
Classified 168 15% 24% 30% 8% 23% 2.59
Faculty 253 9% 20% 32% 3% 36% 2.55
Management/Supervisory 87 10% 43% 32% 12% 3% 2.54
Less than 5 years 160 16% 28% 28% 7% 21% 2.67
5 to 10 years 89 12% 19% 32% 6% 31% 2.56
11 to 19 years 151 7% 26% 35% 7% 25% 2.44
20 years or more 110 9% 26% 32% 5% 28% 2.56
TOTAL 510 11% 26% 32% 6% 26% 2.56
a. The college/NOCE/DS is adequately staffed to implement and advance its mission.
Respondents' level of agreement with the organizational structure of their work location (CC, FC,
NOCE or DS):
b. The current organizational structure of college/NOCE/DS works well.
c. There are unnecessary duplication of services among departments.
* Average of responses from 1 to 4, 1 being "Strongly disagree" and 4 being "Strongly agree". "Don't know/N/A" responses were excluded
from the calculation of the mean.
The Collaborative Brain Trust 58
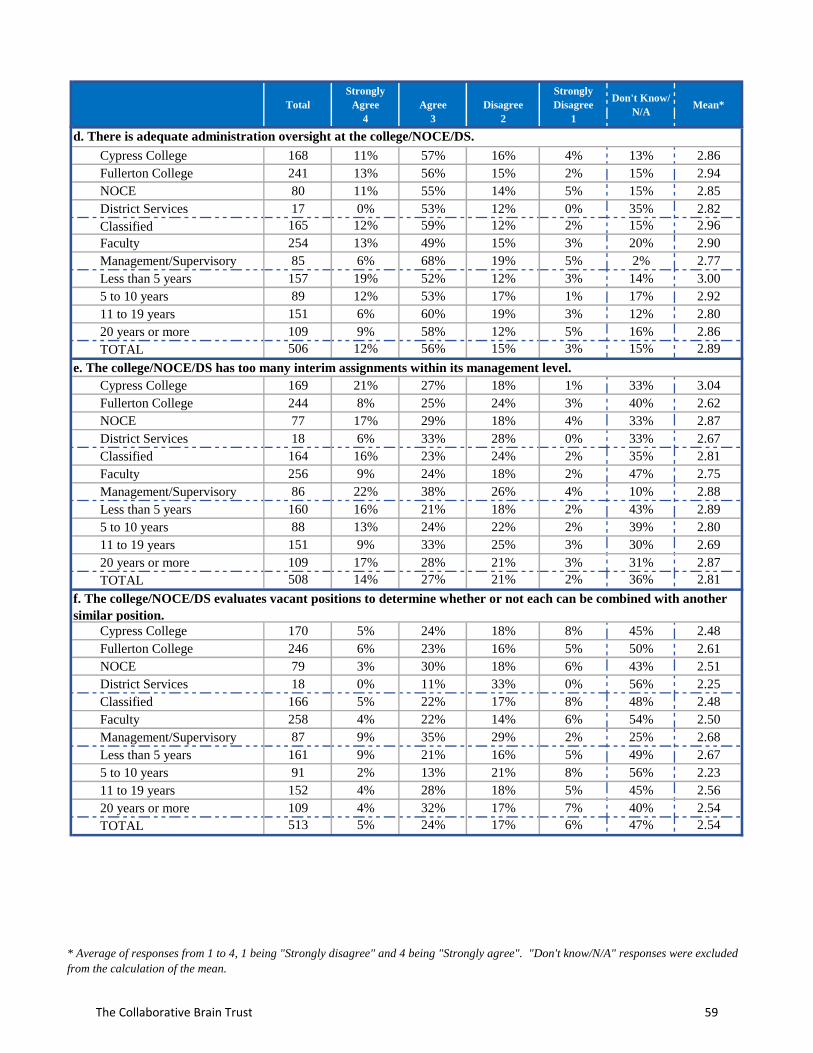
Total
Strongly
Agree
4
Agree
3
Disagree
2
Strongly
Disagree
1
Don't Know/
N/AMean*
Cypress College 168 11% 57% 16% 4% 13% 2.86
Fullerton College 241 13% 56% 15% 2% 15% 2.94
NOCE 80 11% 55% 14% 5% 15% 2.85
District Services 17 0% 53% 12% 0% 35% 2.82
Classified 165 12% 59% 12% 2% 15% 2.96
Faculty 254 13% 49% 15% 3% 20% 2.90
Management/Supervisory 85 6% 68% 19% 5% 2% 2.77
Less than 5 years 157 19% 52% 12% 3% 14% 3.00
5 to 10 years 89 12% 53% 17% 1% 17% 2.92
11 to 19 years 151 6% 60% 19% 3% 12% 2.80
20 years or more 109 9% 58% 12% 5% 16% 2.86
TOTAL 506 12% 56% 15% 3% 15% 2.89
Cypress College 169 21% 27% 18% 1% 33% 3.04
Fullerton College 244 8% 25% 24% 3% 40% 2.62
NOCE 77 17% 29% 18% 4% 33% 2.87
District Services 18 6% 33% 28% 0% 33% 2.67
Classified 164 16% 23% 24% 2% 35% 2.81
Faculty 256 9% 24% 18% 2% 47% 2.75
Management/Supervisory 86 22% 38% 26% 4% 10% 2.88
Less than 5 years 160 16% 21% 18% 2% 43% 2.89
5 to 10 years 88 13% 24% 22% 2% 39% 2.80
11 to 19 years 151 9% 33% 25% 3% 30% 2.69
20 years or more 109 17% 28% 21% 3% 31% 2.87
TOTAL 508 14% 27% 21% 2% 36% 2.81
Cypress College 170 5% 24% 18% 8% 45% 2.48
Fullerton College 246 6% 23% 16% 5% 50% 2.61
NOCE 79 3% 30% 18% 6% 43% 2.51
District Services 18 0% 11% 33% 0% 56% 2.25
Classified 166 5% 22% 17% 8% 48% 2.48
Faculty 258 4% 22% 14% 6% 54% 2.50
Management/Supervisory 87 9% 35% 29% 2% 25% 2.68
Less than 5 years 161 9% 21% 16% 5% 49% 2.67
5 to 10 years 91 2% 13% 21% 8% 56% 2.23
11 to 19 years 152 4% 28% 18% 5% 45% 2.56
20 years or more 109 4% 32% 17% 7% 40% 2.54
TOTAL 513 5% 24% 17% 6% 47% 2.54
f. The college/NOCE/DS evaluates vacant positions to determine whether or not each can be combined with another
similar position.
d. There is adequate administration oversight at the college/NOCE/DS.
e. The college/NOCE/DS has too many interim assignments within its management level.
* Average of responses from 1 to 4, 1 being "Strongly disagree" and 4 being "Strongly agree". "Don't know/N/A" responses were excluded
from the calculation of the mean.
The Collaborative Brain Trust 59
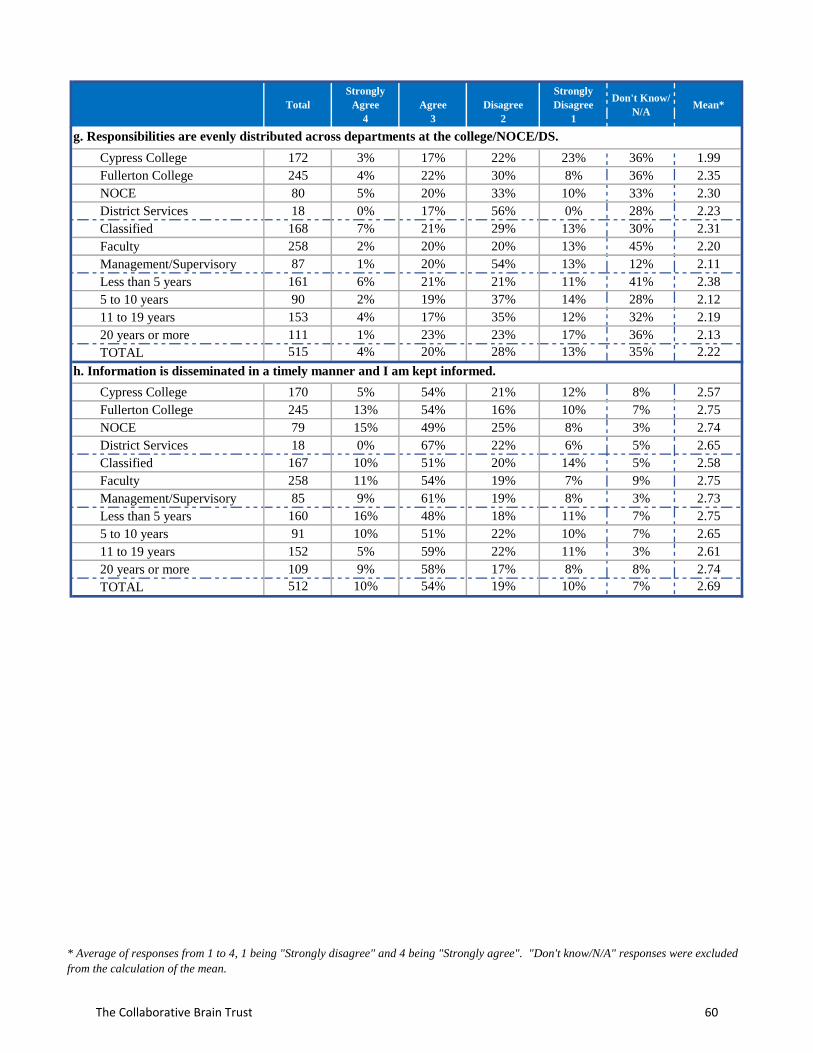
Total
Strongly
Agree
4
Agree
3
Disagree
2
Strongly
Disagree
1
Don't Know/
N/AMean*
Cypress College 172 3% 17% 22% 23% 36% 1.99
Fullerton College 245 4% 22% 30% 8% 36% 2.35
NOCE 80 5% 20% 33% 10% 33% 2.30
District Services 18 0% 17% 56% 0% 28% 2.23
Classified 168 7% 21% 29% 13% 30% 2.31
Faculty 258 2% 20% 20% 13% 45% 2.20
Management/Supervisory 87 1% 20% 54% 13% 12% 2.11
Less than 5 years 161 6% 21% 21% 11% 41% 2.38
5 to 10 years 90 2% 19% 37% 14% 28% 2.12
11 to 19 years 153 4% 17% 35% 12% 32% 2.19
20 years or more 111 1% 23% 23% 17% 36% 2.13
TOTAL 515 4% 20% 28% 13% 35% 2.22
Cypress College 170 5% 54% 21% 12% 8% 2.57
Fullerton College 245 13% 54% 16% 10% 7% 2.75
NOCE 79 15% 49% 25% 8% 3% 2.74
District Services 18 0% 67% 22% 6% 5% 2.65
Classified 167 10% 51% 20% 14% 5% 2.58
Faculty 258 11% 54% 19% 7% 9% 2.75
Management/Supervisory 85 9% 61% 19% 8% 3% 2.73
Less than 5 years 160 16% 48% 18% 11% 7% 2.75
5 to 10 years 91 10% 51% 22% 10% 7% 2.65
11 to 19 years 152 5% 59% 22% 11% 3% 2.61
20 years or more 109 9% 58% 17% 8% 8% 2.74
TOTAL 512 10% 54% 19% 10% 7% 2.69
g. Responsibilities are evenly distributed across departments at the college/NOCE/DS.
h. Information is disseminated in a timely manner and I am kept informed.
* Average of responses from 1 to 4, 1 being "Strongly disagree" and 4 being "Strongly agree". "Don't know/N/A" responses were excluded
from the calculation of the mean.
The Collaborative Brain Trust 60
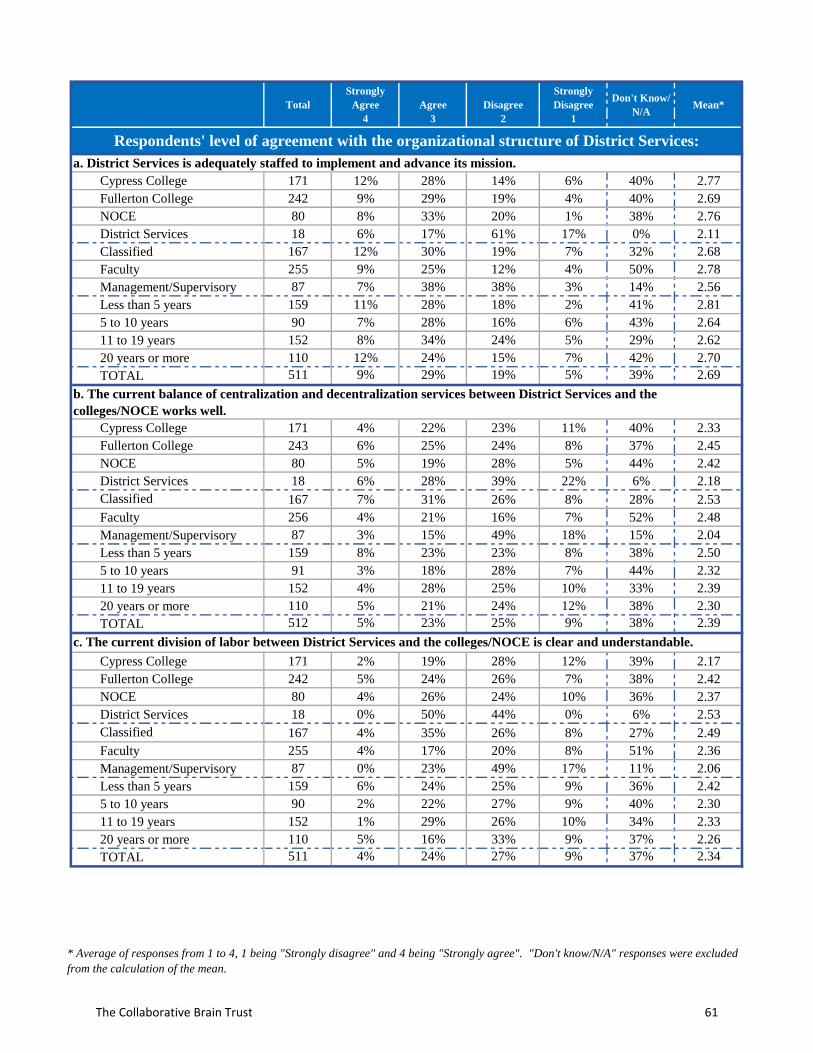
Total
Strongly
Agree
4
Agree
3
Disagree
2
Strongly
Disagree
1
Don't Know/
N/AMean*
Cypress College 171 12% 28% 14% 6% 40% 2.77
Fullerton College 242 9% 29% 19% 4% 40% 2.69
NOCE 80 8% 33% 20% 1% 38% 2.76
District Services 18 6% 17% 61% 17% 0% 2.11
Classified 167 12% 30% 19% 7% 32% 2.68
Faculty 255 9% 25% 12% 4% 50% 2.78
Management/Supervisory 87 7% 38% 38% 3% 14% 2.56
Less than 5 years 159 11% 28% 18% 2% 41% 2.81
5 to 10 years 90 7% 28% 16% 6% 43% 2.64
11 to 19 years 152 8% 34% 24% 5% 29% 2.62
20 years or more 110 12% 24% 15% 7% 42% 2.70
TOTAL 511 9% 29% 19% 5% 39% 2.69
Cypress College 171 4% 22% 23% 11% 40% 2.33
Fullerton College 243 6% 25% 24% 8% 37% 2.45
NOCE 80 5% 19% 28% 5% 44% 2.42
District Services 18 6% 28% 39% 22% 6% 2.18
Classified 167 7% 31% 26% 8% 28% 2.53
Faculty 256 4% 21% 16% 7% 52% 2.48
Management/Supervisory 87 3% 15% 49% 18% 15% 2.04
Less than 5 years 159 8% 23% 23% 8% 38% 2.50
5 to 10 years 91 3% 18% 28% 7% 44% 2.32
11 to 19 years 152 4% 28% 25% 10% 33% 2.39
20 years or more 110 5% 21% 24% 12% 38% 2.30
TOTAL 512 5% 23% 25% 9% 38% 2.39
Cypress College 171 2% 19% 28% 12% 39% 2.17
Fullerton College 242 5% 24% 26% 7% 38% 2.42
NOCE 80 4% 26% 24% 10% 36% 2.37
District Services 18 0% 50% 44% 0% 6% 2.53
Classified 167 4% 35% 26% 8% 27% 2.49
Faculty 255 4% 17% 20% 8% 51% 2.36
Management/Supervisory 87 0% 23% 49% 17% 11% 2.06
Less than 5 years 159 6% 24% 25% 9% 36% 2.42
5 to 10 years 90 2% 22% 27% 9% 40% 2.30
11 to 19 years 152 1% 29% 26% 10% 34% 2.33
20 years or more 110 5% 16% 33% 9% 37% 2.26
TOTAL 511 4% 24% 27% 9% 37% 2.34
c. The current division of labor between District Services and the colleges/NOCE is clear and understandable.
Respondents' level of agreement with the organizational structure of District Services:
a. District Services is adequately staffed to implement and advance its mission.
b. The current balance of centralization and decentralization services between District Services and the
colleges/NOCE works well.
* Average of responses from 1 to 4, 1 being "Strongly disagree" and 4 being "Strongly agree". "Don't know/N/A" responses were excluded
from the calculation of the mean.
The Collaborative Brain Trust 61
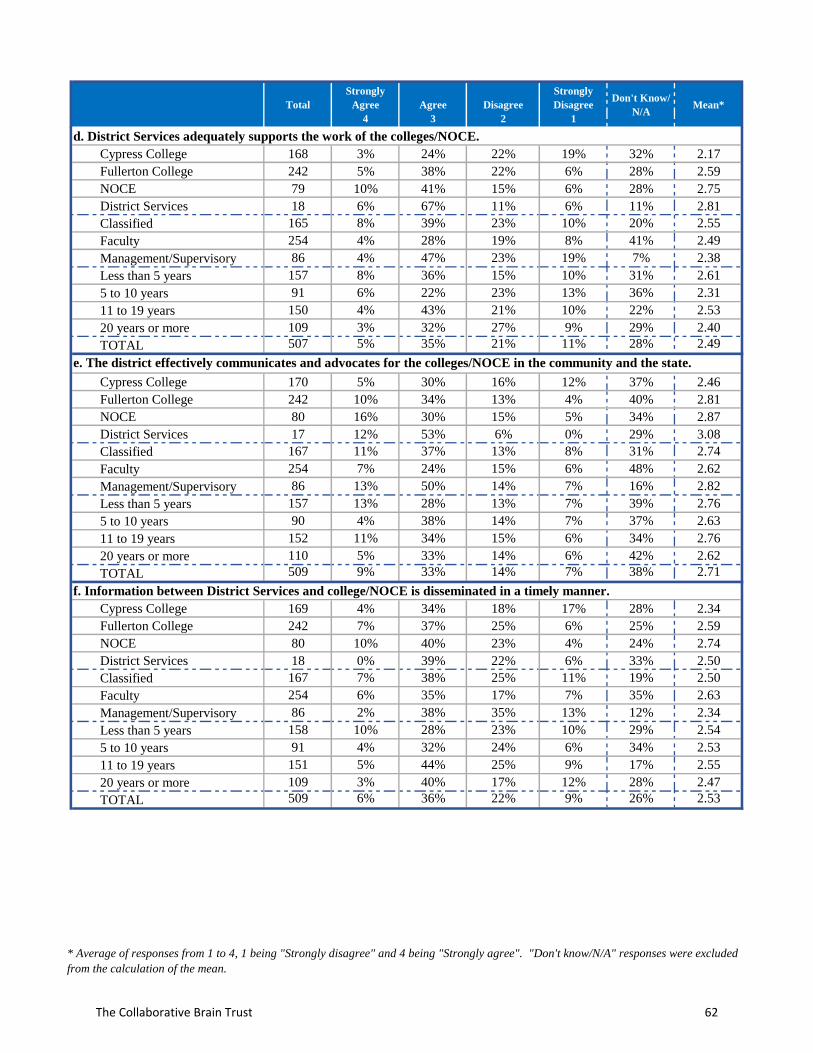
Total
Strongly
Agree
4
Agree
3
Disagree
2
Strongly
Disagree
1
Don't Know/
N/AMean*
Cypress College 168 3% 24% 22% 19% 32% 2.17
Fullerton College 242 5% 38% 22% 6% 28% 2.59
NOCE 79 10% 41% 15% 6% 28% 2.75
District Services 18 6% 67% 11% 6% 11% 2.81
Classified 165 8% 39% 23% 10% 20% 2.55
Faculty 254 4% 28% 19% 8% 41% 2.49
Management/Supervisory 86 4% 47% 23% 19% 7% 2.38
Less than 5 years 157 8% 36% 15% 10% 31% 2.61
5 to 10 years 91 6% 22% 23% 13% 36% 2.31
11 to 19 years 150 4% 43% 21% 10% 22% 2.53
20 years or more 109 3% 32% 27% 9% 29% 2.40
TOTAL 507 5% 35% 21% 11% 28% 2.49
Cypress College 170 5% 30% 16% 12% 37% 2.46
Fullerton College 242 10% 34% 13% 4% 40% 2.81
NOCE 80 16% 30% 15% 5% 34% 2.87
District Services 17 12% 53% 6% 0% 29% 3.08
Classified 167 11% 37% 13% 8% 31% 2.74
Faculty 254 7% 24% 15% 6% 48% 2.62
Management/Supervisory 86 13% 50% 14% 7% 16% 2.82
Less than 5 years 157 13% 28% 13% 7% 39% 2.76
5 to 10 years 90 4% 38% 14% 7% 37% 2.63
11 to 19 years 152 11% 34% 15% 6% 34% 2.76
20 years or more 110 5% 33% 14% 6% 42% 2.62
TOTAL 509 9% 33% 14% 7% 38% 2.71
Cypress College 169 4% 34% 18% 17% 28% 2.34
Fullerton College 242 7% 37% 25% 6% 25% 2.59
NOCE 80 10% 40% 23% 4% 24% 2.74
District Services 18 0% 39% 22% 6% 33% 2.50
Classified 167 7% 38% 25% 11% 19% 2.50
Faculty 254 6% 35% 17% 7% 35% 2.63
Management/Supervisory 86 2% 38% 35% 13% 12% 2.34
Less than 5 years 158 10% 28% 23% 10% 29% 2.54
5 to 10 years 91 4% 32% 24% 6% 34% 2.53
11 to 19 years 151 5% 44% 25% 9% 17% 2.55
20 years or more 109 3% 40% 17% 12% 28% 2.47
TOTAL 509 6% 36% 22% 9% 26% 2.53
f. Information between District Services and college/NOCE is disseminated in a timely manner.
d. District Services adequately supports the work of the colleges/NOCE.
e. The district effectively communicates and advocates for the colleges/NOCE in the community and the state.
* Average of responses from 1 to 4, 1 being "Strongly disagree" and 4 being "Strongly agree". "Don't know/N/A" responses were excluded
from the calculation of the mean.
The Collaborative Brain Trust 62
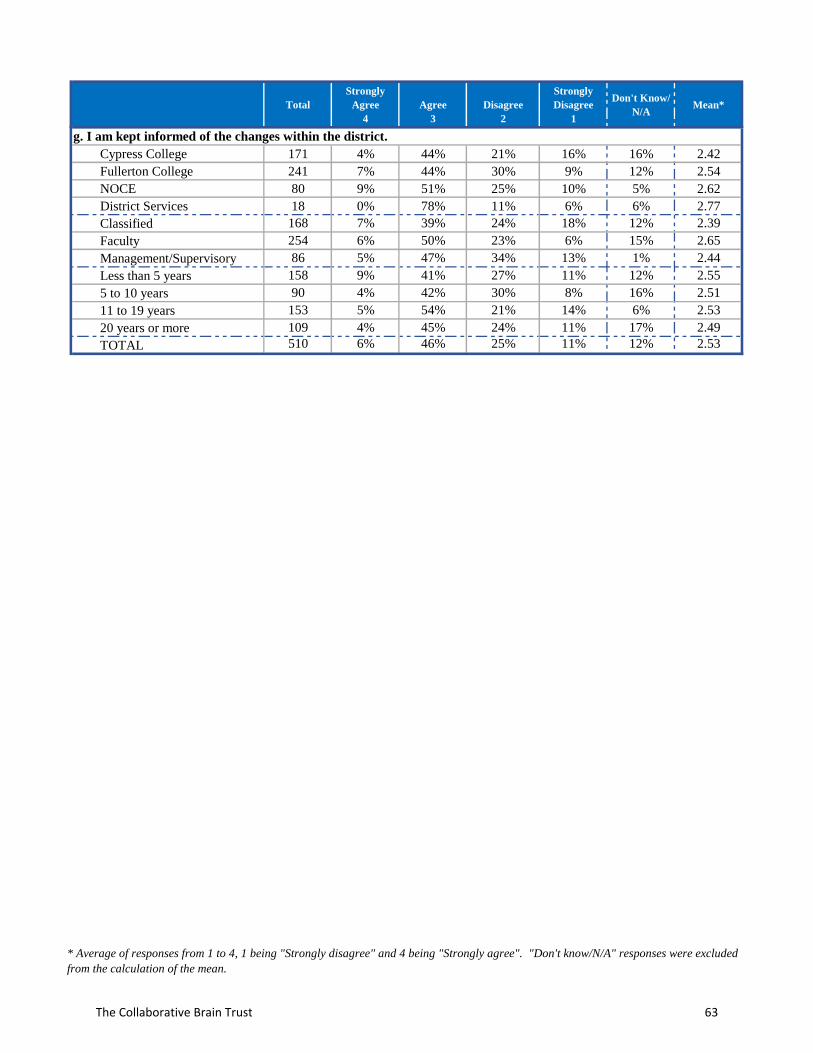
Total
Strongly
Agree
4
Agree
3
Disagree
2
Strongly
Disagree
1
Don't Know/
N/AMean*
Cypress College 171 4% 44% 21% 16% 16% 2.42
Fullerton College 241 7% 44% 30% 9% 12% 2.54
NOCE 80 9% 51% 25% 10% 5% 2.62
District Services 18 0% 78% 11% 6% 6% 2.77
Classified 168 7% 39% 24% 18% 12% 2.39
Faculty 254 6% 50% 23% 6% 15% 2.65
Management/Supervisory 86 5% 47% 34% 13% 1% 2.44
Less than 5 years 158 9% 41% 27% 11% 12% 2.55
5 to 10 years 90 4% 42% 30% 8% 16% 2.51
11 to 19 years 153 5% 54% 21% 14% 6% 2.53
20 years or more 109 4% 45% 24% 11% 17% 2.49
TOTAL 510 6% 46% 25% 11% 12% 2.53
g. I am kept informed of the changes within the district.
* Average of responses from 1 to 4, 1 being "Strongly disagree" and 4 being "Strongly agree". "Don't know/N/A" responses were excluded
from the calculation of the mean.
The Collaborative Brain Trust 63
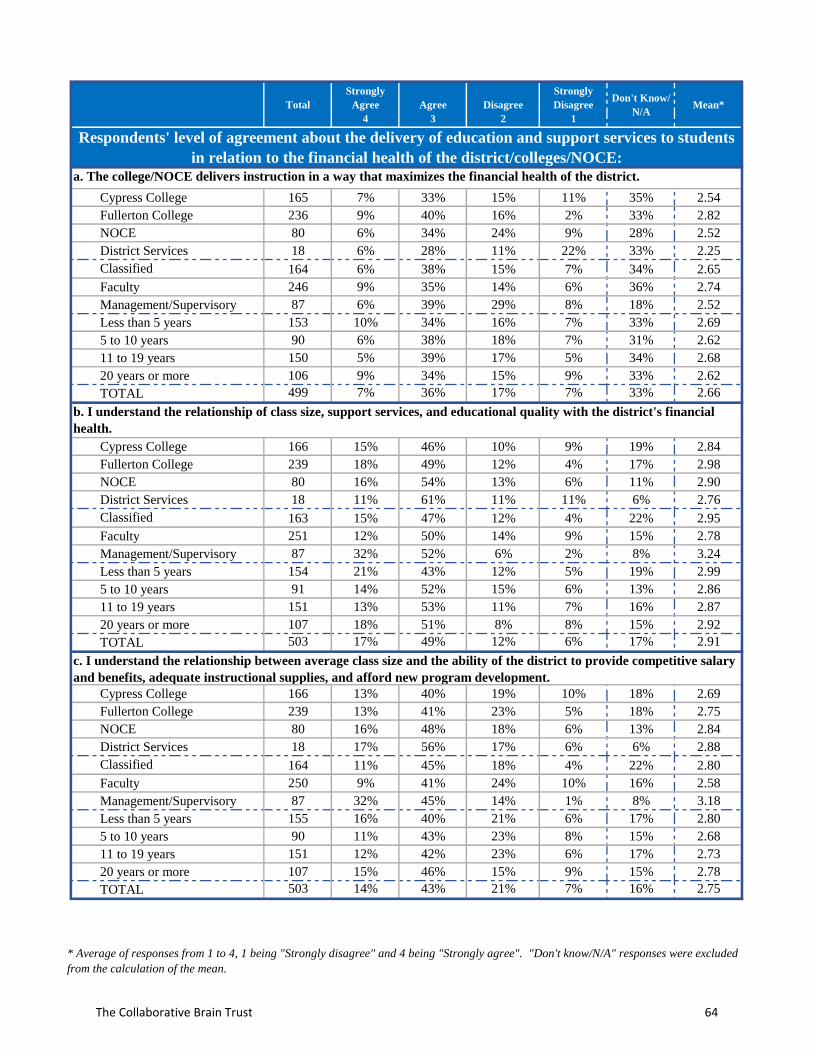
Total
Strongly
Agree
4
Agree
3
Disagree
2
Strongly
Disagree
1
Don't Know/
N/AMean*
Cypress College 165 7% 33% 15% 11% 35% 2.54
Fullerton College 236 9% 40% 16% 2% 33% 2.82
NOCE 80 6% 34% 24% 9% 28% 2.52
District Services 18 6% 28% 11% 22% 33% 2.25
Classified 164 6% 38% 15% 7% 34% 2.65
Faculty 246 9% 35% 14% 6% 36% 2.74
Management/Supervisory 87 6% 39% 29% 8% 18% 2.52
Less than 5 years 153 10% 34% 16% 7% 33% 2.69
5 to 10 years 90 6% 38% 18% 7% 31% 2.62
11 to 19 years 150 5% 39% 17% 5% 34% 2.68
20 years or more 106 9% 34% 15% 9% 33% 2.62
TOTAL 499 7% 36% 17% 7% 33% 2.66
Cypress College 166 15% 46% 10% 9% 19% 2.84
Fullerton College 239 18% 49% 12% 4% 17% 2.98
NOCE 80 16% 54% 13% 6% 11% 2.90
District Services 18 11% 61% 11% 11% 6% 2.76
Classified 163 15% 47% 12% 4% 22% 2.95
Faculty 251 12% 50% 14% 9% 15% 2.78
Management/Supervisory 87 32% 52% 6% 2% 8% 3.24
Less than 5 years 154 21% 43% 12% 5% 19% 2.99
5 to 10 years 91 14% 52% 15% 6% 13% 2.86
11 to 19 years 151 13% 53% 11% 7% 16% 2.87
20 years or more 107 18% 51% 8% 8% 15% 2.92
TOTAL 503 17% 49% 12% 6% 17% 2.91
Cypress College 166 13% 40% 19% 10% 18% 2.69
Fullerton College 239 13% 41% 23% 5% 18% 2.75
NOCE 80 16% 48% 18% 6% 13% 2.84
District Services 18 17% 56% 17% 6% 6% 2.88
Classified 164 11% 45% 18% 4% 22% 2.80
Faculty 250 9% 41% 24% 10% 16% 2.58
Management/Supervisory 87 32% 45% 14% 1% 8% 3.18
Less than 5 years 155 16% 40% 21% 6% 17% 2.80
5 to 10 years 90 11% 43% 23% 8% 15% 2.68
11 to 19 years 151 12% 42% 23% 6% 17% 2.73
20 years or more 107 15% 46% 15% 9% 15% 2.78
TOTAL 503 14% 43% 21% 7% 16% 2.75
c. I understand the relationship between average class size and the ability of the district to provide competitive salary
and benefits, adequate instructional supplies, and afford new program development.
b. I understand the relationship of class size, support services, and educational quality with the district's financial
health.
a. The college/NOCE delivers instruction in a way that maximizes the financial health of the district.
Respondents' level of agreement about the delivery of education and support services to students
in relation to the financial health of the district/colleges/NOCE:
* Average of responses from 1 to 4, 1 being "Strongly disagree" and 4 being "Strongly agree". "Don't know/N/A" responses were excluded
from the calculation of the mean.
The Collaborative Brain Trust 64
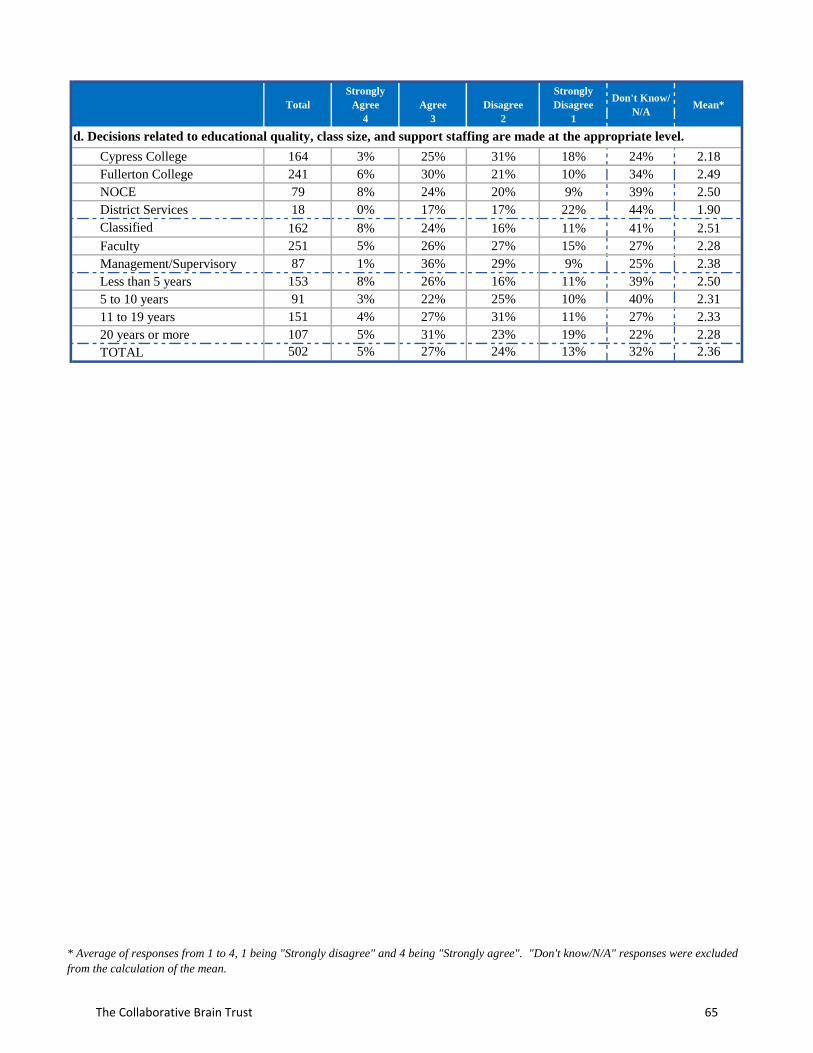
Total
Strongly
Agree
4
Agree
3
Disagree
2
Strongly
Disagree
1
Don't Know/
N/AMean*
Cypress College 164 3% 25% 31% 18% 24% 2.18
Fullerton College 241 6% 30% 21% 10% 34% 2.49
NOCE 79 8% 24% 20% 9% 39% 2.50
District Services 18 0% 17% 17% 22% 44% 1.90
Classified 162 8% 24% 16% 11% 41% 2.51
Faculty 251 5% 26% 27% 15% 27% 2.28
Management/Supervisory 87 1% 36% 29% 9% 25% 2.38
Less than 5 years 153 8% 26% 16% 11% 39% 2.50
5 to 10 years 91 3% 22% 25% 10% 40% 2.31
11 to 19 years 151 4% 27% 31% 11% 27% 2.33
20 years or more 107 5% 31% 23% 19% 22% 2.28
TOTAL 502 5% 27% 24% 13% 32% 2.36
d. Decisions related to educational quality, class size, and support staffing are made at the appropriate level.
* Average of responses from 1 to 4, 1 being "Strongly disagree" and 4 being "Strongly agree". "Don't know/N/A" responses were excluded
from the calculation of the mean.
The Collaborative Brain Trust 65
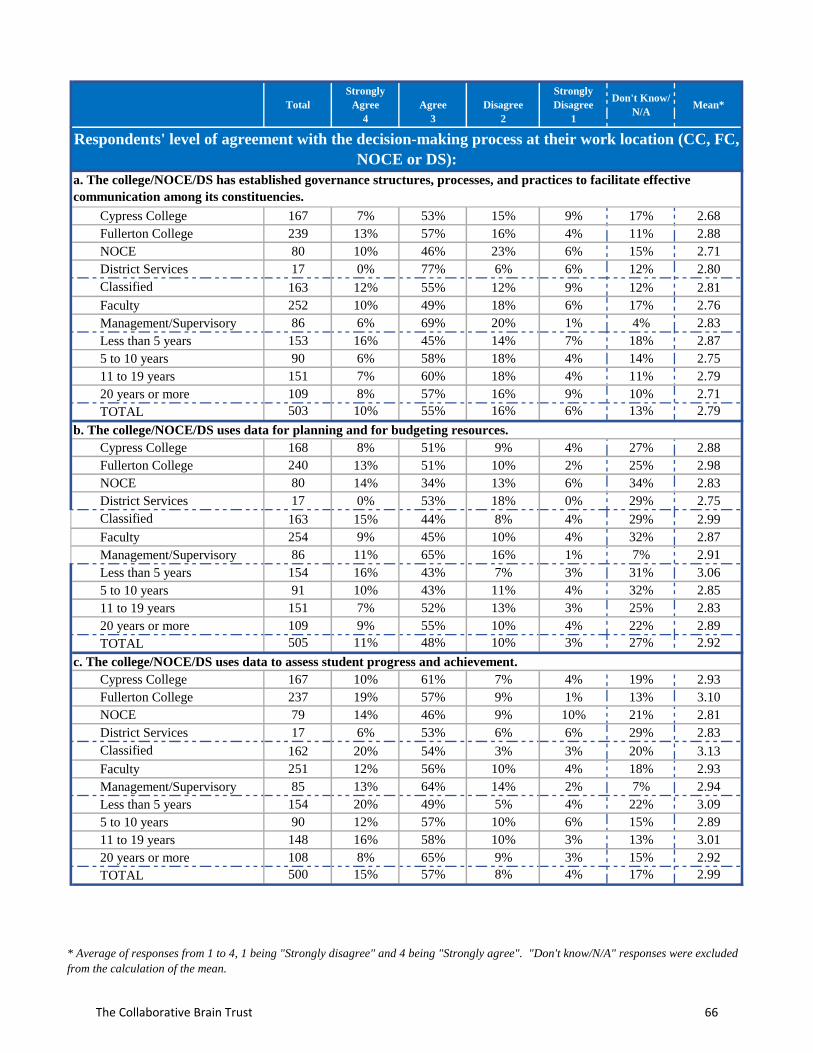
Total
Strongly
Agree
4
Agree
3
Disagree
2
Strongly
Disagree
1
Don't Know/
N/AMean*
Cypress College 167 7% 53% 15% 9% 17% 2.68
Fullerton College 239 13% 57% 16% 4% 11% 2.88
NOCE 80 10% 46% 23% 6% 15% 2.71
District Services 17 0% 77% 6% 6% 12% 2.80
Classified 163 12% 55% 12% 9% 12% 2.81
Faculty 252 10% 49% 18% 6% 17% 2.76
Management/Supervisory 86 6% 69% 20% 1% 4% 2.83
Less than 5 years 153 16% 45% 14% 7% 18% 2.87
5 to 10 years 90 6% 58% 18% 4% 14% 2.75
11 to 19 years 151 7% 60% 18% 4% 11% 2.79
20 years or more 109 8% 57% 16% 9% 10% 2.71
TOTAL 503 10% 55% 16% 6% 13% 2.79
Cypress College 168 8% 51% 9% 4% 27% 2.88
Fullerton College 240 13% 51% 10% 2% 25% 2.98
NOCE 80 14% 34% 13% 6% 34% 2.83
District Services 17 0% 53% 18% 0% 29% 2.75
Classified 163 15% 44% 8% 4% 29% 2.99
Faculty 254 9% 45% 10% 4% 32% 2.87
Management/Supervisory 86 11% 65% 16% 1% 7% 2.91
Less than 5 years 154 16% 43% 7% 3% 31% 3.06
5 to 10 years 91 10% 43% 11% 4% 32% 2.85
11 to 19 years 151 7% 52% 13% 3% 25% 2.83
20 years or more 109 9% 55% 10% 4% 22% 2.89
TOTAL 505 11% 48% 10% 3% 27% 2.92
Cypress College 167 10% 61% 7% 4% 19% 2.93
Fullerton College 237 19% 57% 9% 1% 13% 3.10
NOCE 79 14% 46% 9% 10% 21% 2.81
District Services 17 6% 53% 6% 6% 29% 2.83
Classified 162 20% 54% 3% 3% 20% 3.13
Faculty 251 12% 56% 10% 4% 18% 2.93
Management/Supervisory 85 13% 64% 14% 2% 7% 2.94
Less than 5 years 154 20% 49% 5% 4% 22% 3.09
5 to 10 years 90 12% 57% 10% 6% 15% 2.89
11 to 19 years 148 16% 58% 10% 3% 13% 3.01
20 years or more 108 8% 65% 9% 3% 15% 2.92
TOTAL 500 15% 57% 8% 4% 17% 2.99
Respondents' level of agreement with the decision-making process at their work location (CC, FC,
NOCE or DS):
a. The college/NOCE/DS has established governance structures, processes, and practices to facilitate effective
communication among its constituencies.
b. The college/NOCE/DS uses data for planning and for budgeting resources.
c. The college/NOCE/DS uses data to assess student progress and achievement.
* Average of responses from 1 to 4, 1 being "Strongly disagree" and 4 being "Strongly agree". "Don't know/N/A" responses were excluded
from the calculation of the mean.
The Collaborative Brain Trust 66
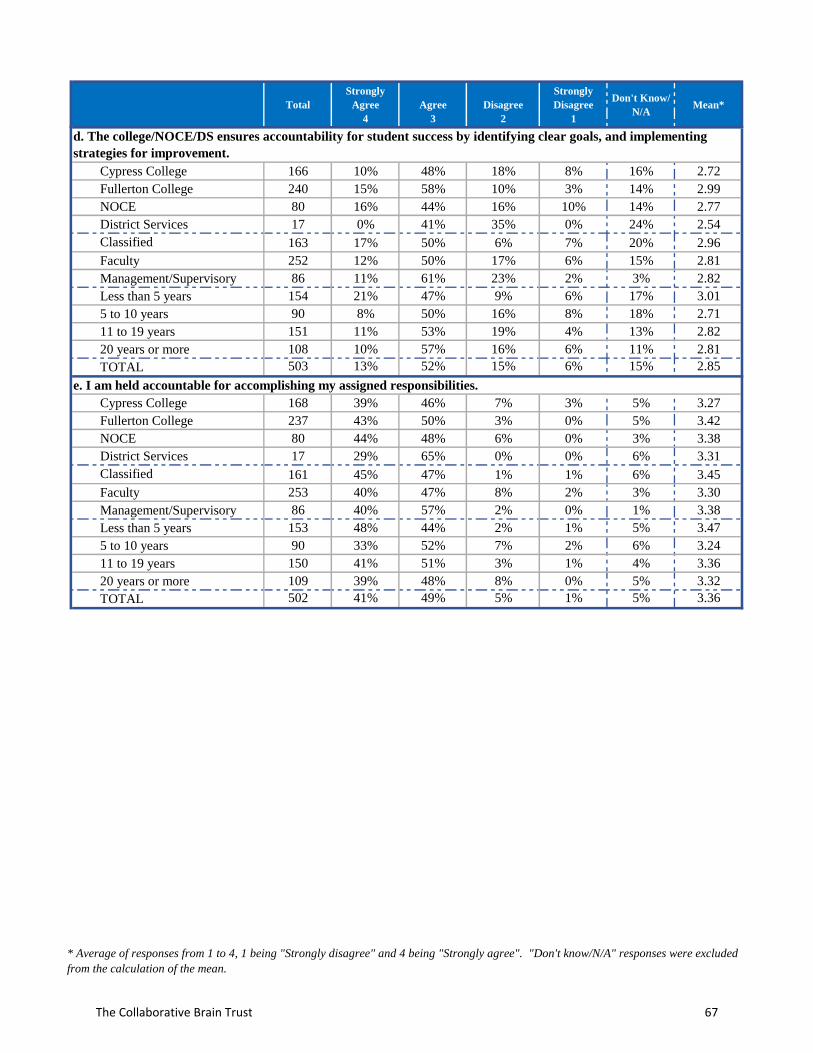
Total
Strongly
Agree
4
Agree
3
Disagree
2
Strongly
Disagree
1
Don't Know/
N/AMean*
Cypress College 166 10% 48% 18% 8% 16% 2.72
Fullerton College 240 15% 58% 10% 3% 14% 2.99
NOCE 80 16% 44% 16% 10% 14% 2.77
District Services 17 0% 41% 35% 0% 24% 2.54
Classified 163 17% 50% 6% 7% 20% 2.96
Faculty 252 12% 50% 17% 6% 15% 2.81
Management/Supervisory 86 11% 61% 23% 2% 3% 2.82
Less than 5 years 154 21% 47% 9% 6% 17% 3.01
5 to 10 years 90 8% 50% 16% 8% 18% 2.71
11 to 19 years 151 11% 53% 19% 4% 13% 2.82
20 years or more 108 10% 57% 16% 6% 11% 2.81
TOTAL 503 13% 52% 15% 6% 15% 2.85
Cypress College 168 39% 46% 7% 3% 5% 3.27
Fullerton College 237 43% 50% 3% 0% 5% 3.42
NOCE 80 44% 48% 6% 0% 3% 3.38
District Services 17 29% 65% 0% 0% 6% 3.31
Classified 161 45% 47% 1% 1% 6% 3.45
Faculty 253 40% 47% 8% 2% 3% 3.30
Management/Supervisory 86 40% 57% 2% 0% 1% 3.38
Less than 5 years 153 48% 44% 2% 1% 5% 3.47
5 to 10 years 90 33% 52% 7% 2% 6% 3.24
11 to 19 years 150 41% 51% 3% 1% 4% 3.36
20 years or more 109 39% 48% 8% 0% 5% 3.32
TOTAL 502 41% 49% 5% 1% 5% 3.36
d. The college/NOCE/DS ensures accountability for student success by identifying clear goals, and implementing
strategies for improvement.
e. I am held accountable for accomplishing my assigned responsibilities.
* Average of responses from 1 to 4, 1 being "Strongly disagree" and 4 being "Strongly agree". "Don't know/N/A" responses were excluded
from the calculation of the mean.
The Collaborative Brain Trust 67
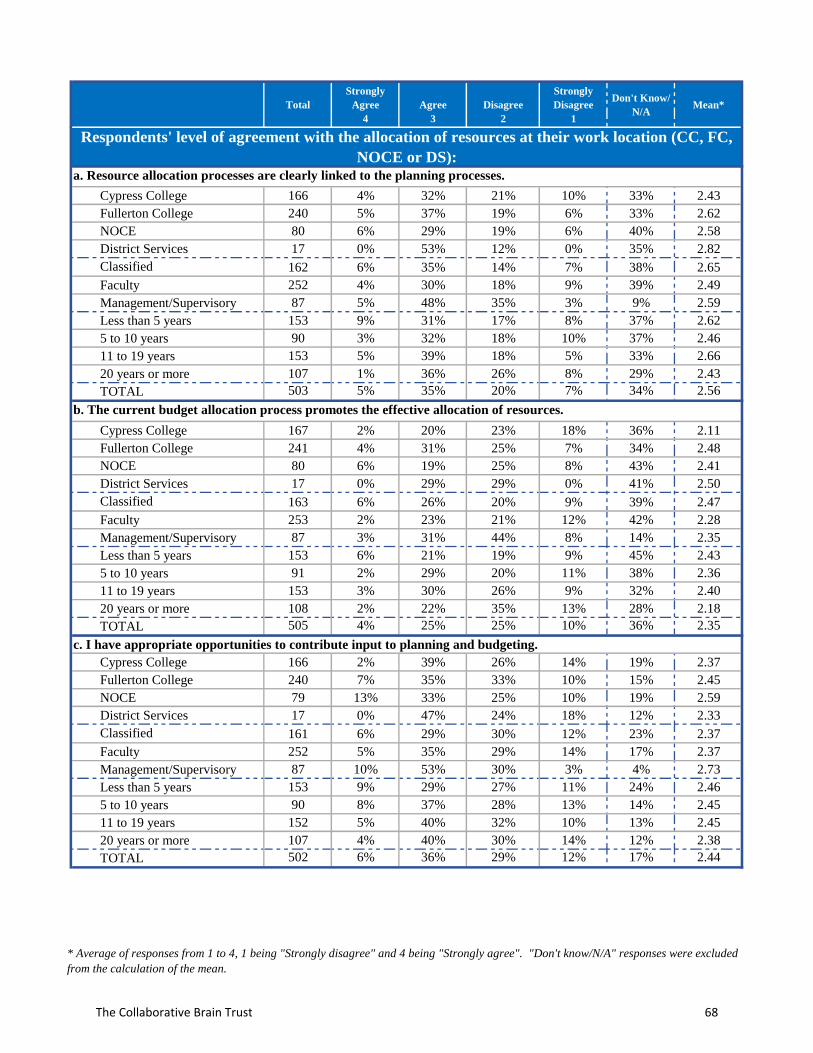
Total
Strongly
Agree
4
Agree
3
Disagree
2
Strongly
Disagree
1
Don't Know/
N/AMean*
Cypress College 166 4% 32% 21% 10% 33% 2.43
Fullerton College 240 5% 37% 19% 6% 33% 2.62
NOCE 80 6% 29% 19% 6% 40% 2.58
District Services 17 0% 53% 12% 0% 35% 2.82
Classified 162 6% 35% 14% 7% 38% 2.65
Faculty 252 4% 30% 18% 9% 39% 2.49
Management/Supervisory 87 5% 48% 35% 3% 9% 2.59
Less than 5 years 153 9% 31% 17% 8% 37% 2.62
5 to 10 years 90 3% 32% 18% 10% 37% 2.46
11 to 19 years 153 5% 39% 18% 5% 33% 2.66
20 years or more 107 1% 36% 26% 8% 29% 2.43
TOTAL 503 5% 35% 20% 7% 34% 2.56
Cypress College 167 2% 20% 23% 18% 36% 2.11
Fullerton College 241 4% 31% 25% 7% 34% 2.48
NOCE 80 6% 19% 25% 8% 43% 2.41
District Services 17 0% 29% 29% 0% 41% 2.50
Classified 163 6% 26% 20% 9% 39% 2.47
Faculty 253 2% 23% 21% 12% 42% 2.28
Management/Supervisory 87 3% 31% 44% 8% 14% 2.35
Less than 5 years 153 6% 21% 19% 9% 45% 2.43
5 to 10 years 91 2% 29% 20% 11% 38% 2.36
11 to 19 years 153 3% 30% 26% 9% 32% 2.40
20 years or more 108 2% 22% 35% 13% 28% 2.18
TOTAL 505 4% 25% 25% 10% 36% 2.35
Cypress College 166 2% 39% 26% 14% 19% 2.37
Fullerton College 240 7% 35% 33% 10% 15% 2.45
NOCE 79 13% 33% 25% 10% 19% 2.59
District Services 17 0% 47% 24% 18% 12% 2.33
Classified 161 6% 29% 30% 12% 23% 2.37
Faculty 252 5% 35% 29% 14% 17% 2.37
Management/Supervisory 87 10% 53% 30% 3% 4% 2.73
Less than 5 years 153 9% 29% 27% 11% 24% 2.46
5 to 10 years 90 8% 37% 28% 13% 14% 2.45
11 to 19 years 152 5% 40% 32% 10% 13% 2.45
20 years or more 107 4% 40% 30% 14% 12% 2.38
TOTAL 502 6% 36% 29% 12% 17% 2.44
a. Resource allocation processes are clearly linked to the planning processes.
Respondents' level of agreement with the allocation of resources at their work location (CC, FC,
NOCE or DS):
b. The current budget allocation process promotes the effective allocation of resources.
c. I have appropriate opportunities to contribute input to planning and budgeting.
* Average of responses from 1 to 4, 1 being "Strongly disagree" and 4 being "Strongly agree". "Don't know/N/A" responses were excluded
from the calculation of the mean.
The Collaborative Brain Trust 68
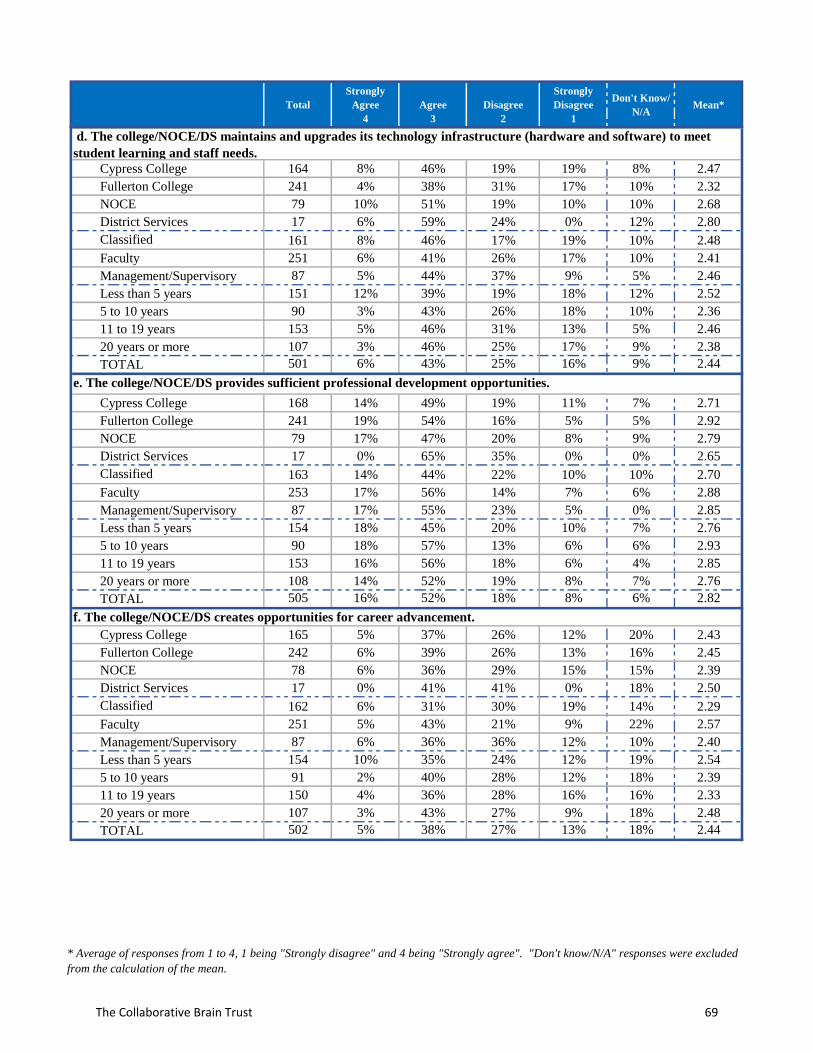
Total
Strongly
Agree
4
Agree
3
Disagree
2
Strongly
Disagree
1
Don't Know/
N/AMean*
Cypress College 164 8% 46% 19% 19% 8% 2.47
Fullerton College 241 4% 38% 31% 17% 10% 2.32
NOCE 79 10% 51% 19% 10% 10% 2.68
District Services 17 6% 59% 24% 0% 12% 2.80
Classified 161 8% 46% 17% 19% 10% 2.48
Faculty 251 6% 41% 26% 17% 10% 2.41
Management/Supervisory 87 5% 44% 37% 9% 5% 2.46
Less than 5 years 151 12% 39% 19% 18% 12% 2.52
5 to 10 years 90 3% 43% 26% 18% 10% 2.36
11 to 19 years 153 5% 46% 31% 13% 5% 2.46
20 years or more 107 3% 46% 25% 17% 9% 2.38
TOTAL 501 6% 43% 25% 16% 9% 2.44
Cypress College 168 14% 49% 19% 11% 7% 2.71
Fullerton College 241 19% 54% 16% 5% 5% 2.92
NOCE 79 17% 47% 20% 8% 9% 2.79
District Services 17 0% 65% 35% 0% 0% 2.65
Classified 163 14% 44% 22% 10% 10% 2.70
Faculty 253 17% 56% 14% 7% 6% 2.88
Management/Supervisory 87 17% 55% 23% 5% 0% 2.85
Less than 5 years 154 18% 45% 20% 10% 7% 2.76
5 to 10 years 90 18% 57% 13% 6% 6% 2.93
11 to 19 years 153 16% 56% 18% 6% 4% 2.85
20 years or more 108 14% 52% 19% 8% 7% 2.76
TOTAL 505 16% 52% 18% 8% 6% 2.82
Cypress College 165 5% 37% 26% 12% 20% 2.43
Fullerton College 242 6% 39% 26% 13% 16% 2.45
NOCE 78 6% 36% 29% 15% 15% 2.39
District Services 17 0% 41% 41% 0% 18% 2.50
Classified 162 6% 31% 30% 19% 14% 2.29
Faculty 251 5% 43% 21% 9% 22% 2.57
Management/Supervisory 87 6% 36% 36% 12% 10% 2.40
Less than 5 years 154 10% 35% 24% 12% 19% 2.54
5 to 10 years 91 2% 40% 28% 12% 18% 2.39
11 to 19 years 150 4% 36% 28% 16% 16% 2.33
20 years or more 107 3% 43% 27% 9% 18% 2.48
TOTAL 502 5% 38% 27% 13% 18% 2.44
f. The college/NOCE/DS creates opportunities for career advancement.
d. The college/NOCE/DS maintains and upgrades its technology infrastructure (hardware and software) to meet
student learning and staff needs.
e. The college/NOCE/DS provides sufficient professional development opportunities.
* Average of responses from 1 to 4, 1 being "Strongly disagree" and 4 being "Strongly agree". "Don't know/N/A" responses were excluded
from the calculation of the mean.
The Collaborative Brain Trust 69
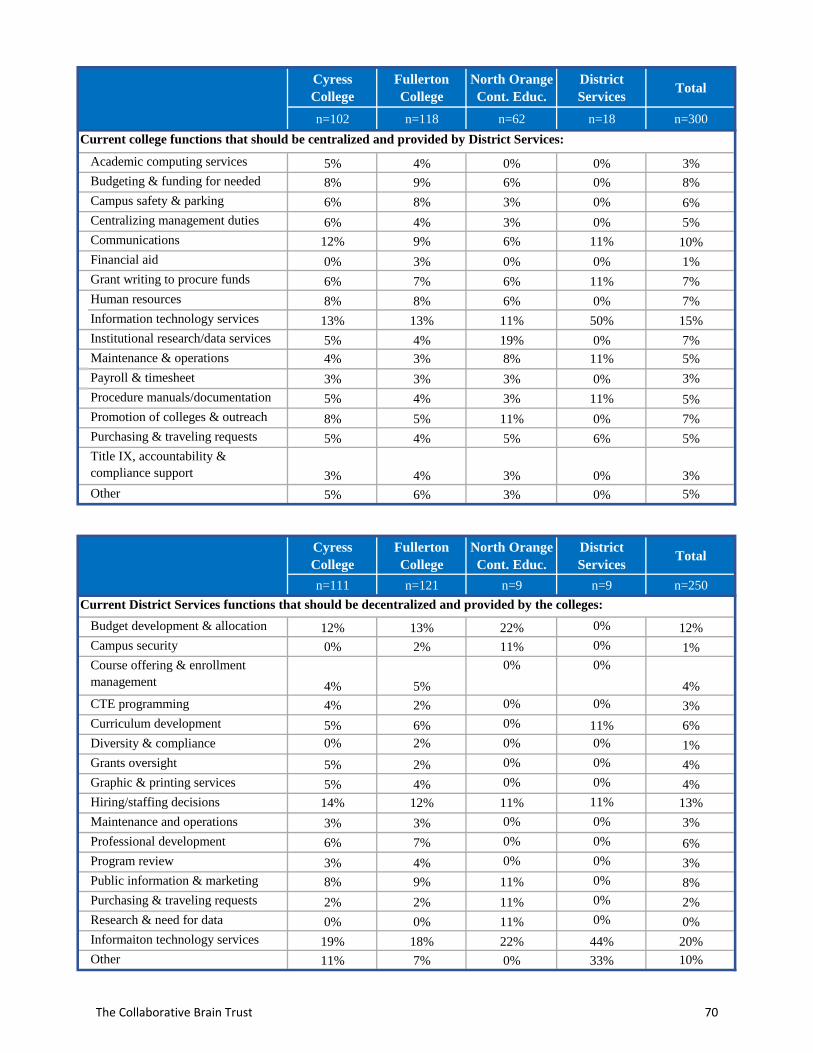
Cyress
College
Fullerton
College
North Orange
Cont. Educ.
District
ServicesTotal
n=102 n=118 n=62 n=18 n=300
5% 4% 0% 0% 3%
8% 9% 6% 0% 8%
6% 8% 3% 0% 6%
6% 4% 3% 0% 5%
12% 9% 6% 11% 10%
0% 3% 0% 0% 1%
6% 7% 6% 11% 7%
8% 8% 6% 0% 7%
13% 13% 11% 50% 15%
5% 4% 19% 0% 7%
4% 3% 8% 11% 5%
3% 3% 3% 0% 3%
5% 4% 3% 11% 5%
8% 5% 11% 0% 7%
5% 4% 5% 6% 5%
3% 4% 3% 0% 3%
Other 5% 6% 3% 0% 5%
Cyress
College
Fullerton
College
North Orange
Cont. Educ.
District
ServicesTotal
n=111 n=121 n=9 n=9 n=250
12% 13% 22% 0% 12%
0% 2% 11% 0% 1%
4% 5%
0% 0%
4%
4% 2% 0% 0% 3%
5% 6% 0% 11% 6%
0% 2% 0% 0% 1%
5% 2% 0% 0% 4%
5% 4% 0% 0% 4%
14% 12% 11% 11% 13%
3% 3% 0% 0% 3%
6% 7% 0% 0% 6%
3% 4% 0% 0% 3%
8% 9% 11% 0% 8%
2% 2% 11% 0% 2%
0% 0% 11% 0% 0%
19% 18% 22% 44% 20%
11% 7% 0% 33% 10%
Academic computing services
Budgeting & funding for needed
programsCampus safety & parking
Centralizing management duties
Communications
Title IX, accountability &
compliance support
Current college functions that should be centralized and provided by District Services:
Budget development & allocation
Campus security
Current District Services functions that should be decentralized and provided by the colleges:
Maintenance & operations
Payroll & timesheet
Procedure manuals/documentation
Promotion of colleges & outreach
Purchasing & traveling requests
Financial aid
Grant writing to procure funds
Human resources
Information technology services
Institutional research/data services
Course offering & enrollment
management
CTE programming
Curriculum development
Diversity & compliance
Grants oversight
Graphic & printing services
Hiring/staffing decisions
Maintenance and operations
Professional development
Program review
Other
Public information & marketing
Purchasing & traveling requests
Research & need for data
Informaiton technology services
The Collaborative Brain Trust 70
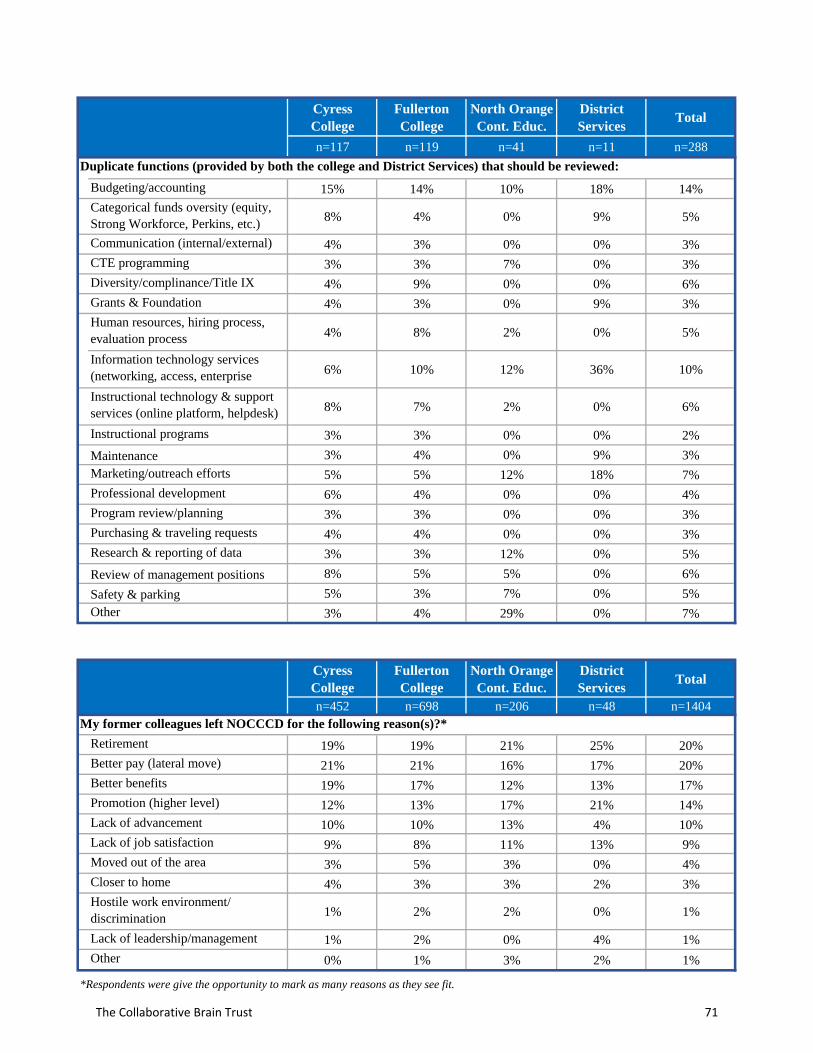
Cyress
College
Fullerton
College
North Orange
Cont. Educ.
District
ServicesTotal
n=117 n=119 n=41 n=11 n=288
15% 14% 10% 18% 14%
8% 4% 0% 9% 5%
4% 3% 0% 0% 3%
3% 3% 7% 0% 3%
4% 9% 0% 0% 6%
4% 3% 0% 9% 3%
4% 8% 2% 0% 5%
6% 10% 12% 36% 10%
8% 7% 2% 0% 6%
3% 3% 0% 0% 2%
3% 4% 0% 9% 3%
5% 5% 12% 18% 7%
6% 4% 0% 0% 4%
3% 3% 0% 0% 3%
4% 4% 0% 0% 3%
3% 3% 12% 0% 5%
8% 5% 5% 0% 6%
5% 3% 7% 0% 5%
3% 4% 29% 0% 7%
Cyress
College
Fullerton
College
North Orange
Cont. Educ.
District
ServicesTotal
n=452 n=698 n=206 n=48 n=1404
My former colleagues left NOCCCD for the following reason(s)?*
Retirement 19% 19% 21% 25% 20%
Better pay (lateral move) 21% 21% 16% 17% 20%
Better benefits 19% 17% 12% 13% 17%
Promotion (higher level) 12% 13% 17% 21% 14%
Lack of advancement 10% 10% 13% 4% 10%
Lack of job satisfaction 9% 8% 11% 13% 9%
Moved out of the area 3% 5% 3% 0% 4%
Closer to home 4% 3% 3% 2% 3%
1% 2% 2% 0% 1%
1% 2% 0% 4% 1%
0% 1% 3% 2% 1%
*Respondents were give the opportunity to mark as many reasons as they see fit.
Hostile work environment/
discrimination
Lack of leadership/management
Other
Instructional programs
Human resources, hiring process,
evaluation process
Diversity/complinance/Title IX
Maintenance
Review of management positions
Budgeting/accounting
Duplicate functions (provided by both the college and District Services) that should be reviewed:
Other
Communication (internal/external)
Research & reporting of data
Marketing/outreach efforts
Purchasing & traveling requests
Categorical funds oversity (equity,
Strong Workforce, Perkins, etc.)
CTE programming
Information technology services
(networking, access, enterprise
system)
Safety & parking
Instructional technology & support
services (online platform, helpdesk)
Grants & Foundation
Program review/planning
Professional development
The Collaborative Brain Trust 71
APPENDIX E E. Survey Results for Cypress College
The Collaborative Brain Trust 72
North Orange County Community College District
Results of the Organizational Structure Survey
for Cypress College
Spring 2018
North Orange County Community College District is conducting a comprehensive organizational
structure review to ensure it is serving its students and community effectively and efficiently. A
component of such a review requires multiple perspectives, including the perspective of those
who work within the organization. In early February 2018, all district full-time faculty and staff
were invited to share their opinions of the District and its Colleges via an online survey.
During a three-week period, 516 staff and faculty shared their understanding, compliments, and
concerns about the existing structure of their department, the College, as well as the District
Services. Of those, 172 Cypress College employees responded to the survey, including 60%
faculty, 26% classified/confidential, and 14% management/supervisory; and 29% have been
employed at the College less than five years, 18% 5 to 10 years, 28% 11 to 19 years and 25%
have been with the District for more than 20 years.
This report summarizes the findings of the 172 respondents’ feedback on organizational structure
issues relating specifically to Cypress College. Overall, respondents somewhat agreed that the
District’s, the College’s, their department’s organizational structure works, but that there is room
for improvement. Respondents were generous in sharing their comments, compliments and
concerns. The comments may prove helpful as the College considers refining its structures for
efficiency and effectiveness.
About Respondents’ Work Location of Cypress College:
Many respondents stated that student needs are the main focus of their workplace (mean
of 3.45, on a scale of 1 to 4, 1 being “strongly disagree” and 4 being “strongly agree”),
that they engage in program reviews regularly (3.19) and that they use data to enhance
the effectiveness of the department (3.12).
Management/supervisory noted a higher level of agreement for these two
categories (3.54 and 3.35 respectively) than other sub-groups.
Respondents somewhat agreed that management encourages employees to take initiative
to improve institutional effectiveness (2.84) or that their workplace has established
governance structures, processes and practices to facilitate effective communication
(2.70).
Management/supervisory indicated a higher level of agreement that they do
encourage employees to take initiative to improve institutional effectiveness than
classified and faculty (3.25 vs. 2.80 and 2.76 respectively).
Organizational Structure at the Department Level:
Respondents stated that there is adequate administrative oversight (2.90), that their
organizational structure within their department is clear and understandable (2.91), and
that the current organizational structure of their department works well (2.66).
The Collaborative Brain Trust 73
Management/supervisory noted a higher level of agreement for the organizational
structure within their department and that there is adequate oversight in their area
(3.04 and 3.29 respectively).
However, respondents indicated low agreement that their department is adequately
staffed to implement and advance its mission (2.29), that responsibilities are evenly
distributed among staff within the department (2.35), or that the department has too many
interim assignments (2.46).
Organizational Structure at the College Level: There is agreement that the College has too many interim assignments within its
management level (3.04), and that the College sometimes evaluates vacant positions to
determine whether or not each can be combined with another similar position (2.48).
Respondents somewhat agreed that there is adequate administration oversight at the
college level (2.86).
Many respondents do not feel the current organizational structure of the college level
works well (2.49) and that information across the departments is not disseminated in a
timely manner, thus being uninformed (2.57).
Respondents stated that the College is not adequately staffed to implement and advance
its mission (2.27).
There is an indication that responsibilities are not evenly distributed across departments
(1.99), and somewhat agreement that there is unnecessary duplication of services among
departments (2.61).
The classified employee group indicated more agreement about unnecessary
duplication of services among departments, but management/supervisory noted
less agreement (2.85 vs. 2.21 respectively).
Organizational Structure at the District Services: Respondents somewhat agreed that the District effectively communicates and advocates
for the Colleges in the community and at the state level (2.46), but that District Services
is adequately staffed to implement and advance its mission (2.77).
Respondents noted some agreement that information between District Services and the
College is disseminated in a timely manner and that they are kept informed of the
changes within the district (2.34 and 2.42 respectively).
Respondents noted some agreement that District Services adequately supports the work
of the Colleges, and that the division of labor between the two units is clear and
understandable (both 2.17).
Respondents employed 5 to 10 years at Cypress College and the
management/supervisory employee groups were in less agreement that the
District supports the work of the college (1.95 and 1.86 respectively).
Delivery of Education and Support Services to Students in Relation to Financial Health:
Respondents somewhat understand the relationship of class size, support services, and
educational quality with the district’s financial health (2.84), but slightly less in their
understanding of the relationship between average class size and the ability of the district
to provide competitive salary and benefits, adequate instructional supplies, and afford
new program development (2.69).
The Collaborative Brain Trust 74
Management/supervisory indicated a slightly higher level of understanding of
these two areas than other groups (3.05 and 3.14 respectively).
Respondents slightly agreed that the College delivers instruction in a way that maximizes
the financial health of the district (2.54) and less agreement in that decisions related to
educational quality, class size, and supporting staffing are made at the appropriate level
(2.18).
Faculty rated that decision making is made at the appropriate level lower than
other sub-groups (2.04).
Decision-Making Process at Cypress College:
Many respondents agreed that they are held accountable for accomplishing their assigned
responsibilities (3.27), but less agreement that the College ensures accountability for
student success by identifying clear goals and implementing strategies for improvement
(2.72).
The management/supervisory employee group noted being held accountable to
their assigned responsibilities more than classified and faculty (3.42 vs. 3.36 and
3.19 respectively).
The College uses data to assess student progress and achievement (2.93), as well as to
plan and to budget resources (2.88).
Respondents slightly agreed that the College has established governance structures,
processes and practices to facilitate effective communication among its constituencies
(2.68).
Allocation of Resources at Cypress College:
Respondents agreed that the College provides sufficient professional development
opportunities (2.71), but less agreed that the College creates opportunities for career
advancement (2.43).
However, classified staff noted a lower level of agreement for these two areas
than other sub-groups (2.41 and 2.12 respectively).
Many respondents indicated that the current allocation process promotes the effective
allocation of resources (2.11), that these processes are not clearly linked to the planning
processes (2.43) and that there is little opportunity to contribute input to planning and
budgeting (2.37).
Respondents employed at the College for less than 5 years noted a higher level of
agreement that the current budget allocation process promotes effective allocation
of resources (1.86 vs. 2.11 overall).
Respondents also do not agree that the College maintains and upgrades its technology
infrastructure to meet student learning and staff needs (2.47).
Alignment of District Services and College Functions:
Information technology services, budgeting and funding for needed programs, human
resources, communications, promotion of the College and outreach efforts were among
the functions that Cypress College respondents would like to see centralized and offered
by District Services. A comprehensive list of other functions can be found on page 16.
Instructional technologies services, budget development and allocation of funds,
hiring/staffing decisions, public information/marketing and professional development
(new instructional strategies, conferences, training in the use of technology) were among
The Collaborative Brain Trust 75
the services respondents would like to see decentralized and offered at the Colleges. A
comprehensive list of other functions can be found on page 16.
• Budget development and allocation, information technology and instructional support
services, oversights of categorical programs, review of management positions were
among the duplicate functions that should be reviewed for effectiveness. A
comprehensive list of other functions can be found on page 17.
• Other than the nearly one-fifth of responses (19%) noting retirement, respondents
identified major reasons that former colleagues left Cypress College were due to better
pay for lateral move (21%), better benefits (19%), promotion to higher level (12%), and
lack of advancement (10%).
• There was an additional 11% of respondents that identified lack of job
satisfaction, hostile work environment and lack of leadership as the causes of
former employees leaving.
Respondent comments:
Below are some comments made by Cypress College respondents. A complete list of
comments, by employee group and by college location, can be found on pages 18 to 27.
Staff expressed frustration when dealing with some of the district services, such as human
resources and IT. Respondents report that they do not get a response to their requests in a
timely manner, nor do they feel the District staff plans meetings or trainings while
considering the already planned activities, schedules, and needs of the College.
Staff are concerned that the hiring procedures do not ensure the hiring of the most
qualified candidates and that the procedures do not ensure diversity as a priority.
Respondents indicated a need to examine the budget allocation process at the District and
at the College level to ensure transparency and the funding for needed programs.
There were suggestions that the College needs to review a number of positions to
evaluate the need for fair wages for like positions.
Respondents noted there are too many management/supervisory positions and that
there are too many interim management/supervisory positions.
There is a need to reevaluate allocation of release time among the faculty ranks.
There is perception that decisions made at the District do not include input from College
staff and faculty.
There are concerns that the District/College do not put students first and that
budgeting is driving decisions.
Communication between College and District, and communication between departments
at the college level is limited and respondents are uninformed.
Respondents do not understand many of the programs and services at District Services
and, therefore, question the needs for certain District departments and personnel within
those departments.
The District does not have clear career paths and/or opportunities for
advancement. There are no incentives for staff/faculty to stay.
Respondents have indicated that employees have left due to lack of benefits for
employee’s dependents and low wages for the amount of work assigned.
Safety/security and compliance were among issues in which respondents would like more
oversight.
Some respondents stated the need for more oversight of various grants (equity, SSSP,
workforce development, etc.).
The Collaborative Brain Trust 76
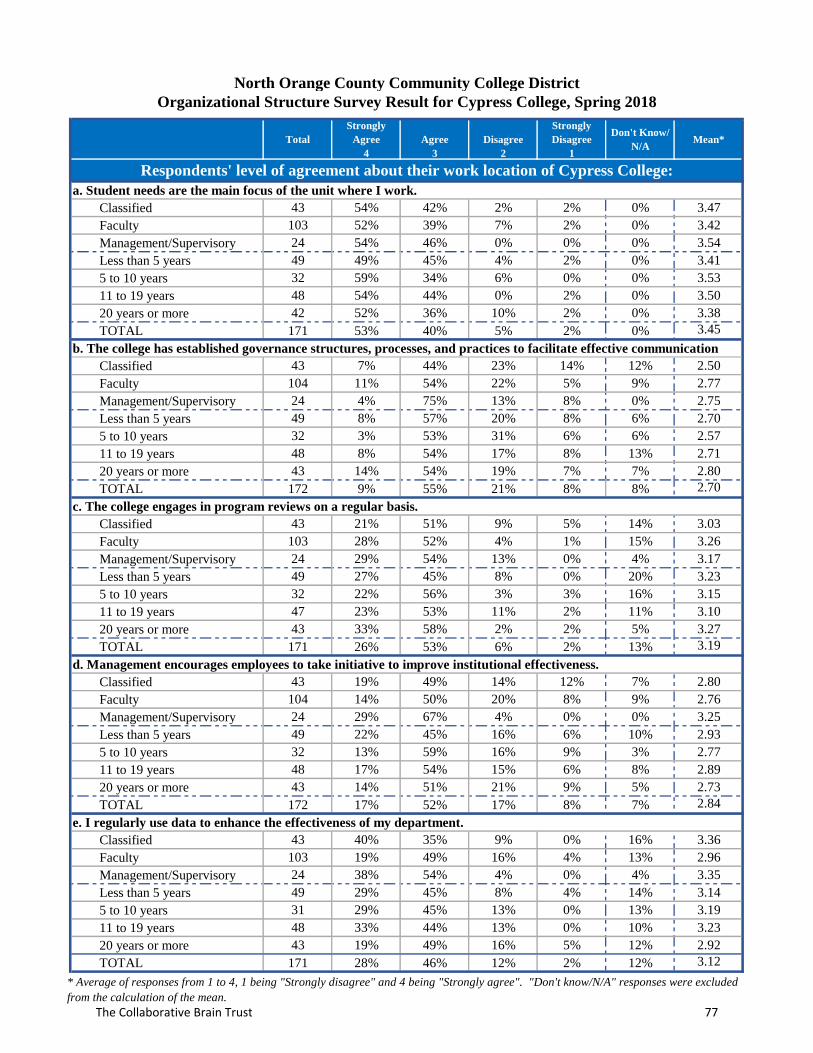
Total
Strongly
Agree
4
Agree
3
Disagree
2
Strongly
Disagree
1
Don't Know/
N/AMean*
Classified 43 54% 42% 2% 2% 0% 3.47
Faculty 103 52% 39% 7% 2% 0% 3.42
Management/Supervisory 24 54% 46% 0% 0% 0% 3.54
Less than 5 years 49 49% 45% 4% 2% 0% 3.41
5 to 10 years 32 59% 34% 6% 0% 0% 3.53
11 to 19 years 48 54% 44% 0% 2% 0% 3.50
20 years or more 42 52% 36% 10% 2% 0% 3.38
TOTAL 171 53% 40% 5% 2% 0% 3.45
Classified 43 7% 44% 23% 14% 12% 2.50
Faculty 104 11% 54% 22% 5% 9% 2.77
Management/Supervisory 24 4% 75% 13% 8% 0% 2.75
Less than 5 years 49 8% 57% 20% 8% 6% 2.70
5 to 10 years 32 3% 53% 31% 6% 6% 2.57
11 to 19 years 48 8% 54% 17% 8% 13% 2.71
20 years or more 43 14% 54% 19% 7% 7% 2.80
TOTAL 172 9% 55% 21% 8% 8% 2.70
Classified 43 21% 51% 9% 5% 14% 3.03
Faculty 103 28% 52% 4% 1% 15% 3.26
Management/Supervisory 24 29% 54% 13% 0% 4% 3.17
Less than 5 years 49 27% 45% 8% 0% 20% 3.23
5 to 10 years 32 22% 56% 3% 3% 16% 3.15
11 to 19 years 47 23% 53% 11% 2% 11% 3.10
20 years or more 43 33% 58% 2% 2% 5% 3.27
TOTAL 171 26% 53% 6% 2% 13% 3.19
Classified 43 19% 49% 14% 12% 7% 2.80
Faculty 104 14% 50% 20% 8% 9% 2.76
Management/Supervisory 24 29% 67% 4% 0% 0% 3.25
Less than 5 years 49 22% 45% 16% 6% 10% 2.93
5 to 10 years 32 13% 59% 16% 9% 3% 2.77
11 to 19 years 48 17% 54% 15% 6% 8% 2.89
20 years or more 43 14% 51% 21% 9% 5% 2.73
TOTAL 172 17% 52% 17% 8% 7% 2.84
Classified 43 40% 35% 9% 0% 16% 3.36
Faculty 103 19% 49% 16% 4% 13% 2.96
Management/Supervisory 24 38% 54% 4% 0% 4% 3.35
Less than 5 years 49 29% 45% 8% 4% 14% 3.14
5 to 10 years 31 29% 45% 13% 0% 13% 3.19
11 to 19 years 48 33% 44% 13% 0% 10% 3.23
20 years or more 43 19% 49% 16% 5% 12% 2.92
TOTAL 171 28% 46% 12% 2% 12% 3.12
Respondents' level of agreement about their work location of Cypress College:
b. The college has established governance structures, processes, and practices to facilitate effective communication
c. The college engages in program reviews on a regular basis.
d. Management encourages employees to take initiative to improve institutional effectiveness.
e. I regularly use data to enhance the effectiveness of my department.
North Orange County Community College District
Organizational Structure Survey Result for Cypress College, Spring 2018
a. Student needs are the main focus of the unit where I work.
* Average of responses from 1 to 4, 1 being "Strongly disagree" and 4 being "Strongly agree". "Don't know/N/A" responses were excluded
from the calculation of the mean.
The Collaborative Brain Trust 77

Total
Strongly
Agree
4
Agree
3
Disagree
2
Strongly
Disagree
1
Don't Know/
N/AMean*
a. My department is adequately staffed to implement and advance its mission.
Classified 43 12% 23% 37% 28% 0% 2.19
Faculty 104 13% 35% 32% 21% 0% 2.38
Management/Supervisory 24 8% 29% 29% 33% 0% 2.13
Less than 5 years 49 20% 22% 39% 18% 0% 2.45
5 to 10 years 32 9% 34% 16% 41% 0% 2.13
11 to 19 years 48 13% 27% 35% 25% 0% 2.27
20 years or more 43 2% 42% 35% 21% 0% 2.26
TOTAL 172 12% 31% 33% 25% 0% 2.29
Classified 43 16% 37% 21% 26% 0% 2.44
Faculty 102 23% 39% 22% 14% 3% 2.73
Management/Supervisory 24 17% 50% 29% 4% 0% 2.79
Less than 5 years 48 19% 38% 23% 15% 6% 2.64
5 to 10 years 32 13% 41% 22% 25% 0% 2.41
11 to 19 years 48 27% 40% 21% 13% 0% 2.81
20 years or more 42 19% 43% 26% 12% 0% 2.69
TOTAL 170 20% 40% 23% 15% 2% 2.66
Classified 43 23% 47% 12% 19% 0% 2.74
Faculty 101 27% 51% 14% 9% 0% 2.95
Management/Supervisory 24 25% 54% 21% 0% 0% 3.04
Less than 5 years 48 23% 56% 10% 10% 0% 2.92
5 to 10 years 31 23% 45% 16% 16% 0% 2.74
11 to 19 years 47 32% 40% 21% 6% 0% 2.98
20 years or more 43 23% 58% 9% 9% 0% 2.95
TOTAL 169 25% 50% 14% 10% 0% 2.91
d. There is adequate administration oversight in my department.
Classified 43 26% 47% 5% 16% 7% 2.88
Faculty 103 18% 47% 20% 8% 6% 2.81
Management/Supervisory 24 38% 54% 8% 0% 0% 3.29
Less than 5 years 48 29% 46% 6% 10% 8% 3.02
5 to 10 years 32 6% 56% 19% 16% 3% 2.55
11 to 19 years 48 19% 48% 21% 6% 6% 2.84
20 years or more 43 33% 47% 14% 5% 2% 3.10
TOTAL 171 23% 49% 15% 9% 5% 2.90
e. My department has too many interim assignments.
Classified 43 7% 19% 23% 23% 28% 2.13
Faculty 103 15% 17% 30% 8% 31% 2.55
Management/Supervisory 24 17% 25% 29% 8% 21% 2.63
Less than 5 years 48 4% 21% 13% 17% 46% 2.23
5 to 10 years 32 22% 3% 47% 3% 25% 2.58
11 to 19 years 48 19% 21% 31% 6% 23% 2.68
20 years or more 43 9% 26% 28% 19% 19% 2.31
TOTAL 171 13% 19% 28% 12% 29% 2.46
b. The current organizational structure of my department works well.
c. The organizational structure within my department is clear and understandable.
Participants' level of agreement about the structure within the department where they work:
* Average of responses from 1 to 4, 1 being "Strongly disagree" and 4 being "Strongly agree". "Don't know/N/A" responses were excluded
from the calculation of the mean.
The Collaborative Brain Trust 78
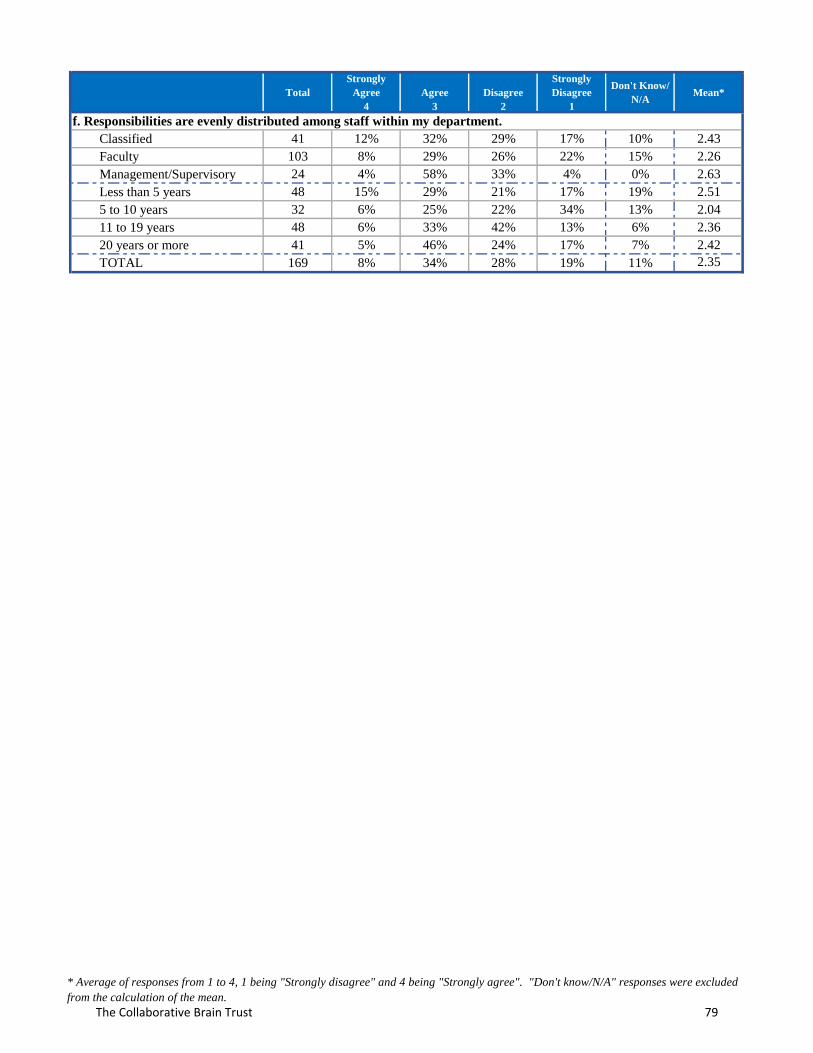
Total
Strongly
Agree
4
Agree
3
Disagree
2
Strongly
Disagree
1
Don't Know/
N/AMean*
f. Responsibilities are evenly distributed among staff within my department.
Classified 41 12% 32% 29% 17% 10% 2.43
Faculty 103 8% 29% 26% 22% 15% 2.26
Management/Supervisory 24 4% 58% 33% 4% 0% 2.63
Less than 5 years 48 15% 29% 21% 17% 19% 2.51
5 to 10 years 32 6% 25% 22% 34% 13% 2.04
11 to 19 years 48 6% 33% 42% 13% 6% 2.36
20 years or more 41 5% 46% 24% 17% 7% 2.42
TOTAL 169 8% 34% 28% 19% 11% 2.35
* Average of responses from 1 to 4, 1 being "Strongly disagree" and 4 being "Strongly agree". "Don't know/N/A" responses were excluded
from the calculation of the mean.
The Collaborative Brain Trust 79
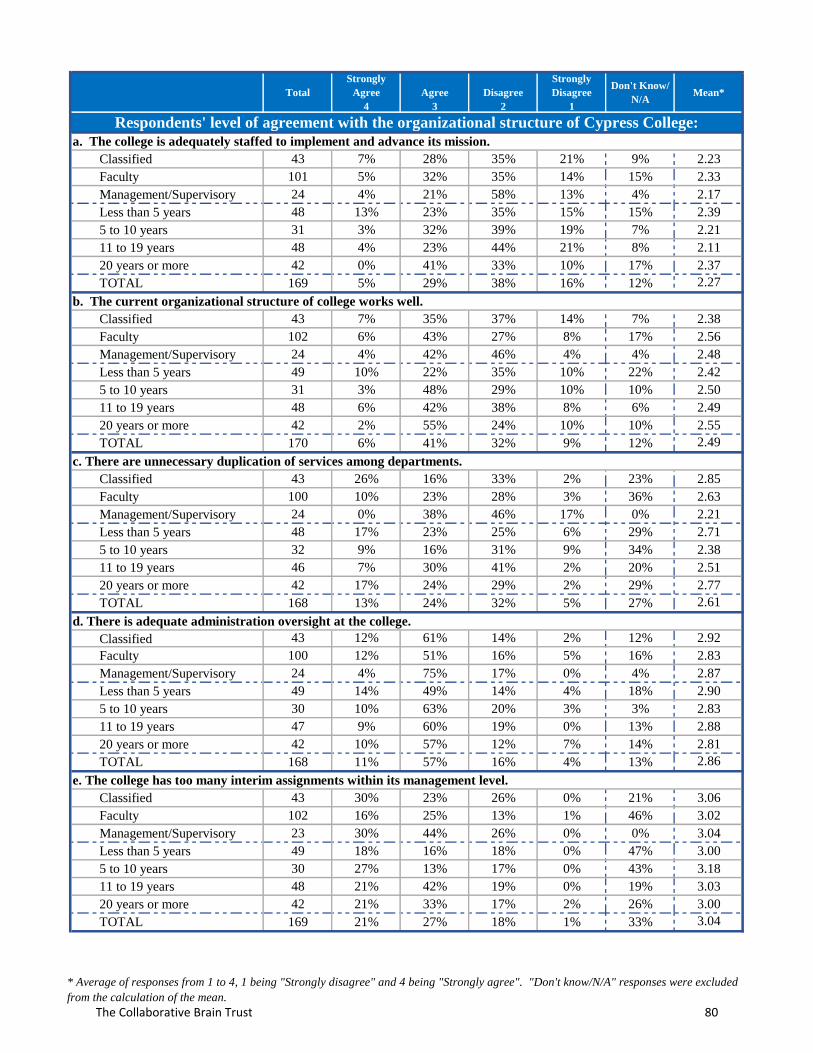
Total
Strongly
Agree
4
Agree
3
Disagree
2
Strongly
Disagree
1
Don't Know/
N/AMean*
a. The college is adequately staffed to implement and advance its mission.
Classified 43 7% 28% 35% 21% 9% 2.23
Faculty 101 5% 32% 35% 14% 15% 2.33
Management/Supervisory 24 4% 21% 58% 13% 4% 2.17
Less than 5 years 48 13% 23% 35% 15% 15% 2.39
5 to 10 years 31 3% 32% 39% 19% 7% 2.21
11 to 19 years 48 4% 23% 44% 21% 8% 2.11
20 years or more 42 0% 41% 33% 10% 17% 2.37
TOTAL 169 5% 29% 38% 16% 12% 2.27
b. The current organizational structure of college works well.
Classified 43 7% 35% 37% 14% 7% 2.38
Faculty 102 6% 43% 27% 8% 17% 2.56
Management/Supervisory 24 4% 42% 46% 4% 4% 2.48
Less than 5 years 49 10% 22% 35% 10% 22% 2.42
5 to 10 years 31 3% 48% 29% 10% 10% 2.50
11 to 19 years 48 6% 42% 38% 8% 6% 2.49
20 years or more 42 2% 55% 24% 10% 10% 2.55
TOTAL 170 6% 41% 32% 9% 12% 2.49
c. There are unnecessary duplication of services among departments.
Classified 43 26% 16% 33% 2% 23% 2.85
Faculty 100 10% 23% 28% 3% 36% 2.63
Management/Supervisory 24 0% 38% 46% 17% 0% 2.21
Less than 5 years 48 17% 23% 25% 6% 29% 2.71
5 to 10 years 32 9% 16% 31% 9% 34% 2.38
11 to 19 years 46 7% 30% 41% 2% 20% 2.51
20 years or more 42 17% 24% 29% 2% 29% 2.77
TOTAL 168 13% 24% 32% 5% 27% 2.61
d. There is adequate administration oversight at the college.
Classified 43 12% 61% 14% 2% 12% 2.92
Faculty 100 12% 51% 16% 5% 16% 2.83
Management/Supervisory 24 4% 75% 17% 0% 4% 2.87
Less than 5 years 49 14% 49% 14% 4% 18% 2.90
5 to 10 years 30 10% 63% 20% 3% 3% 2.83
11 to 19 years 47 9% 60% 19% 0% 13% 2.88
20 years or more 42 10% 57% 12% 7% 14% 2.81
TOTAL 168 11% 57% 16% 4% 13% 2.86
e. The college has too many interim assignments within its management level.
Classified 43 30% 23% 26% 0% 21% 3.06
Faculty 102 16% 25% 13% 1% 46% 3.02
Management/Supervisory 23 30% 44% 26% 0% 0% 3.04
Less than 5 years 49 18% 16% 18% 0% 47% 3.00
5 to 10 years 30 27% 13% 17% 0% 43% 3.18
11 to 19 years 48 21% 42% 19% 0% 19% 3.03
20 years or more 42 21% 33% 17% 2% 26% 3.00
TOTAL 169 21% 27% 18% 1% 33% 3.04
Respondents' level of agreement with the organizational structure of Cypress College:
* Average of responses from 1 to 4, 1 being "Strongly disagree" and 4 being "Strongly agree". "Don't know/N/A" responses were excluded
from the calculation of the mean.
The Collaborative Brain Trust 80
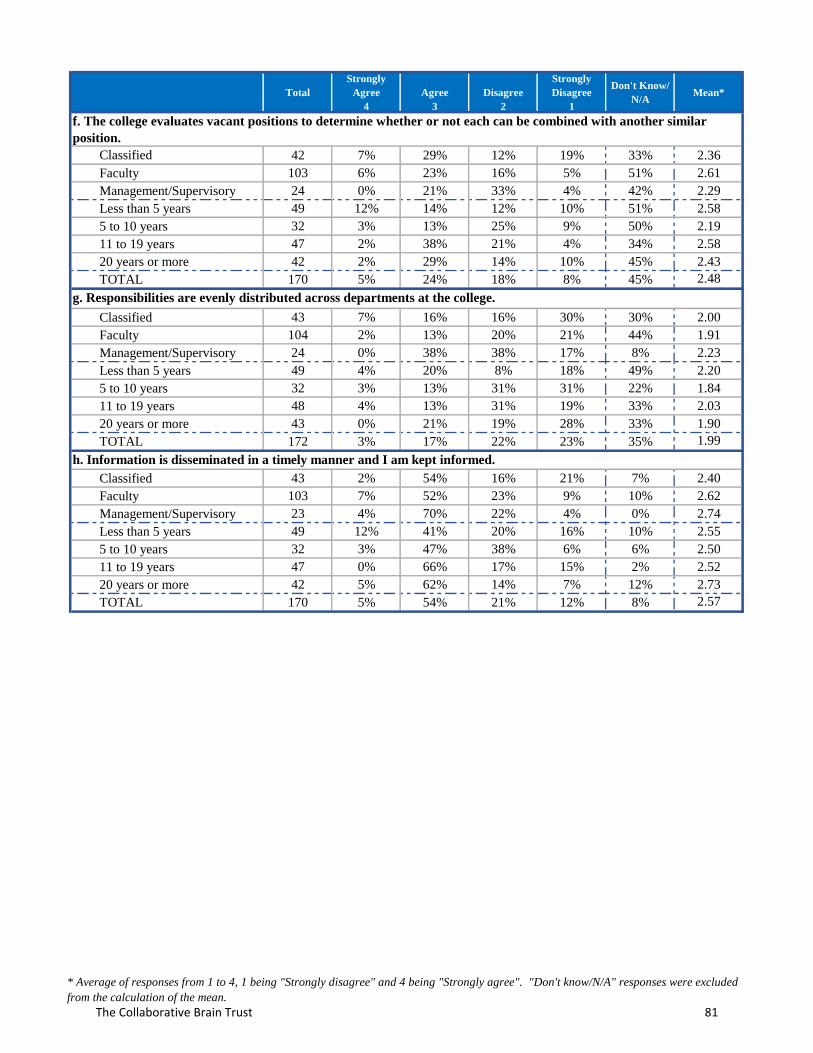
Total
Strongly
Agree
4
Agree
3
Disagree
2
Strongly
Disagree
1
Don't Know/
N/AMean*
Classified 42 7% 29% 12% 19% 33% 2.36
Faculty 103 6% 23% 16% 5% 51% 2.61
Management/Supervisory 24 0% 21% 33% 4% 42% 2.29
Less than 5 years 49 12% 14% 12% 10% 51% 2.58
5 to 10 years 32 3% 13% 25% 9% 50% 2.19
11 to 19 years 47 2% 38% 21% 4% 34% 2.58
20 years or more 42 2% 29% 14% 10% 45% 2.43
TOTAL 170 5% 24% 18% 8% 45% 2.48
Classified 43 7% 16% 16% 30% 30% 2.00
Faculty 104 2% 13% 20% 21% 44% 1.91
Management/Supervisory 24 0% 38% 38% 17% 8% 2.23
Less than 5 years 49 4% 20% 8% 18% 49% 2.20
5 to 10 years 32 3% 13% 31% 31% 22% 1.84
11 to 19 years 48 4% 13% 31% 19% 33% 2.03
20 years or more 43 0% 21% 19% 28% 33% 1.90
TOTAL 172 3% 17% 22% 23% 35% 1.99
Classified 43 2% 54% 16% 21% 7% 2.40
Faculty 103 7% 52% 23% 9% 10% 2.62
Management/Supervisory 23 4% 70% 22% 4% 0% 2.74
Less than 5 years 49 12% 41% 20% 16% 10% 2.55
5 to 10 years 32 3% 47% 38% 6% 6% 2.50
11 to 19 years 47 0% 66% 17% 15% 2% 2.52
20 years or more 42 5% 62% 14% 7% 12% 2.73
TOTAL 170 5% 54% 21% 12% 8% 2.57
f. The college evaluates vacant positions to determine whether or not each can be combined with another similar
position.
g. Responsibilities are evenly distributed across departments at the college.
h. Information is disseminated in a timely manner and I am kept informed.
* Average of responses from 1 to 4, 1 being "Strongly disagree" and 4 being "Strongly agree". "Don't know/N/A" responses were excluded
from the calculation of the mean.
The Collaborative Brain Trust 81
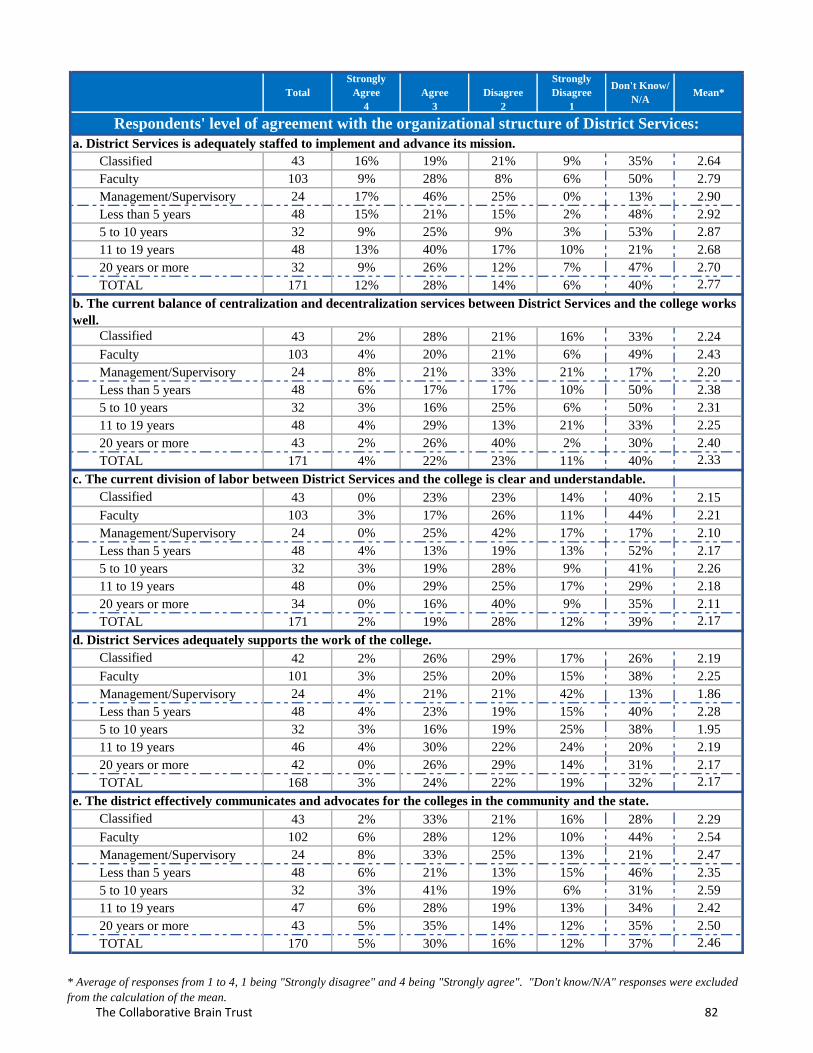
Total
Strongly
Agree
4
Agree
3
Disagree
2
Strongly
Disagree
1
Don't Know/
N/AMean*
Classified 43 16% 19% 21% 9% 35% 2.64
Faculty 103 9% 28% 8% 6% 50% 2.79
Management/Supervisory 24 17% 46% 25% 0% 13% 2.90
Less than 5 years 48 15% 21% 15% 2% 48% 2.92
5 to 10 years 32 9% 25% 9% 3% 53% 2.87
11 to 19 years 48 13% 40% 17% 10% 21% 2.68
20 years or more 32 9% 26% 12% 7% 47% 2.70
TOTAL 171 12% 28% 14% 6% 40% 2.77
Classified 43 2% 28% 21% 16% 33% 2.24
Faculty 103 4% 20% 21% 6% 49% 2.43
Management/Supervisory 24 8% 21% 33% 21% 17% 2.20
Less than 5 years 48 6% 17% 17% 10% 50% 2.38
5 to 10 years 32 3% 16% 25% 6% 50% 2.31
11 to 19 years 48 4% 29% 13% 21% 33% 2.25
20 years or more 43 2% 26% 40% 2% 30% 2.40
TOTAL 171 4% 22% 23% 11% 40% 2.33
c. The current division of labor between District Services and the college is clear and understandable.
Classified 43 0% 23% 23% 14% 40% 2.15
Faculty 103 3% 17% 26% 11% 44% 2.21
Management/Supervisory 24 0% 25% 42% 17% 17% 2.10
Less than 5 years 48 4% 13% 19% 13% 52% 2.17
5 to 10 years 32 3% 19% 28% 9% 41% 2.26
11 to 19 years 48 0% 29% 25% 17% 29% 2.18
20 years or more 34 0% 16% 40% 9% 35% 2.11
TOTAL 171 2% 19% 28% 12% 39% 2.17
Classified 42 2% 26% 29% 17% 26% 2.19
Faculty 101 3% 25% 20% 15% 38% 2.25
Management/Supervisory 24 4% 21% 21% 42% 13% 1.86
Less than 5 years 48 4% 23% 19% 15% 40% 2.28
5 to 10 years 32 3% 16% 19% 25% 38% 1.95
11 to 19 years 46 4% 30% 22% 24% 20% 2.19
20 years or more 42 0% 26% 29% 14% 31% 2.17
TOTAL 168 3% 24% 22% 19% 32% 2.17
e. The district effectively communicates and advocates for the colleges in the community and the state.
Classified 43 2% 33% 21% 16% 28% 2.29
Faculty 102 6% 28% 12% 10% 44% 2.54
Management/Supervisory 24 8% 33% 25% 13% 21% 2.47
Less than 5 years 48 6% 21% 13% 15% 46% 2.35
5 to 10 years 32 3% 41% 19% 6% 31% 2.59
11 to 19 years 47 6% 28% 19% 13% 34% 2.42
20 years or more 43 5% 35% 14% 12% 35% 2.50
TOTAL 170 5% 30% 16% 12% 37% 2.46
d. District Services adequately supports the work of the college.
Respondents' level of agreement with the organizational structure of District Services:
a. District Services is adequately staffed to implement and advance its mission.
b. The current balance of centralization and decentralization services between District Services and the college works
well.
* Average of responses from 1 to 4, 1 being "Strongly disagree" and 4 being "Strongly agree". "Don't know/N/A" responses were excluded
from the calculation of the mean.
The Collaborative Brain Trust 82

Total
Strongly
Agree
4
Agree
3
Disagree
2
Strongly
Disagree
1
Don't Know/
N/AMean*
Classified 43 2% 30% 23% 26% 19% 2.11
Faculty 101 4% 38% 14% 11% 34% 2.52
Management/Supervisory 24 4% 25% 29% 25% 17% 2.10
Less than 5 years 48 6% 15% 23% 17% 40% 2.17
5 to 10 years 32 3% 38% 16% 13% 31% 2.45
11 to 19 years 47 4% 43% 17% 23% 13% 2.32
20 years or more 42 0% 43% 17% 12% 29% 2.43
TOTAL 169 4% 34% 18% 17% 28% 2.34
Classified 43 2% 28% 21% 26% 23% 2.09
Faculty 102 4% 52% 18% 11% 15% 2.58
Management/Supervisory 24 4% 38% 29% 21% 8% 2.27
Less than 5 years 48 6% 31% 23% 15% 25% 2.39
5 to 10 years 32 3% 41% 28% 9% 19% 2.46
11 to 19 years 47 2% 56% 15% 23% 4% 2.39
20 years or more 43 2% 47% 19% 14% 19% 2.46
TOTAL 171 4% 44% 21% 16% 16% 2.42
g. I am kept informed of the changes within the district.
f. Information between District Services and college is disseminated in a timely manner.
* Average of responses from 1 to 4, 1 being "Strongly disagree" and 4 being "Strongly agree". "Don't know/N/A" responses were excluded
from the calculation of the mean.
The Collaborative Brain Trust 83

Total
Strongly
Agree
4
Agree
3
Disagree
2
Strongly
Disagree
1
Don't Know/
N/AMean*
Classified 41 2% 32% 17% 17% 32% 2.29
Faculty 99 8% 33% 11% 8% 39% 2.68
Management/Supervisory 24 8% 33% 25% 8% 25% 2.56
Less than 5 years 44 7% 14% 18% 16% 46% 2.21
5 to 10 years 32 3% 31% 19% 9% 38% 2.45
11 to 19 years 48 2% 50% 13% 6% 29% 2.68
20 years or more 41 15% 34% 10% 12% 29% 2.72
TOTAL 165 7% 33% 15% 11% 35% 2.54
Classified 41 15% 46% 2% 5% 32% 3.04
Faculty 100 12% 47% 14% 11% 16% 2.71
Management/Supervisory 24 29% 46% 8% 4% 13% 3.14
Less than 5 years 45 24% 24% 13% 11% 27% 2.85
5 to 10 years 32 9% 56% 9% 6% 19% 2.85
11 to 19 years 48 10% 52% 8% 10% 19% 2.77
20 years or more 41 15% 56% 10% 7% 12% 2.89
TOTAL 166 15% 46% 10% 9% 19% 2.84
Classified 41 7% 49% 7% 7% 29% 2.79
Faculty 100 12% 37% 25% 11% 15% 2.59
Management/Supervisory 24 29% 42% 17% 4% 8% 3.05
Less than 5 years 45 18% 24% 20% 16% 22% 2.57
5 to 10 years 32 6% 50% 16% 9% 19% 2.65
11 to 19 years 48 13% 42% 23% 8% 15% 2.68
20 years or more 41 15% 49% 17% 5% 15% 2.86
TOTAL 166 13% 40% 19% 10% 18% 2.69
Classified 40 3% 23% 15% 20% 40% 2.13
Faculty 99 4% 24% 33% 19% 19% 2.16
Management/Supervisory 24 0% 33% 46% 4% 17% 2.35
Less than 5 years 43 5% 23% 14% 23% 35% 2.14
5 to 10 years 32 0% 19% 41% 16% 24% 2.04
11 to 19 years 48 2% 25% 46% 14% 15% 2.20
20 years or more 41 5% 32% 22% 20% 22% 2.28
TOTAL 164 3% 25% 31% 18% 24% 2.18
a. The college delivers instruction in a way that maximizes the financial health of the district.
Respondents' level of agreement about the delivery of education and support services to students
in relation to the financial health of Cypress College:
c. I understand the relationship between average class size and the ability of the district to provide competitive salary
and benefits, adequate instructional supplies, and afford new program development.
d. Decisions related to educational quality, class size, and support staffing are made at the appropriate level.
b. I understand the relationship of class size, support services, and educational quality with the district's financial
health.
* Average of responses from 1 to 4, 1 being "Strongly disagree" and 4 being "Strongly agree". "Don't know/N/A" responses were excluded
from the calculation of the mean.
The Collaborative Brain Trust 84
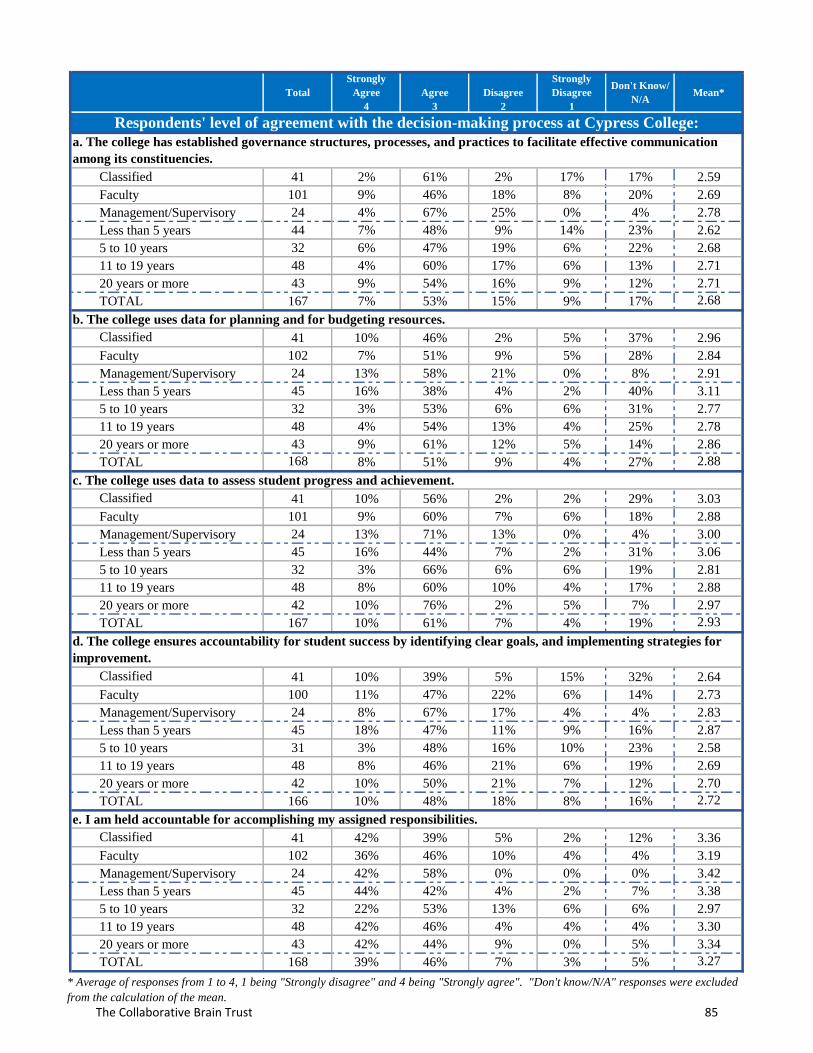
Total
Strongly
Agree
4
Agree
3
Disagree
2
Strongly
Disagree
1
Don't Know/
N/AMean*
Classified 41 2% 61% 2% 17% 17% 2.59
Faculty 101 9% 46% 18% 8% 20% 2.69
Management/Supervisory 24 4% 67% 25% 0% 4% 2.78
Less than 5 years 44 7% 48% 9% 14% 23% 2.62
5 to 10 years 32 6% 47% 19% 6% 22% 2.68
11 to 19 years 48 4% 60% 17% 6% 13% 2.71
20 years or more 43 9% 54% 16% 9% 12% 2.71
TOTAL 167 7% 53% 15% 9% 17% 2.68
Classified 41 10% 46% 2% 5% 37% 2.96
Faculty 102 7% 51% 9% 5% 28% 2.84
Management/Supervisory 24 13% 58% 21% 0% 8% 2.91
Less than 5 years 45 16% 38% 4% 2% 40% 3.11
5 to 10 years 32 3% 53% 6% 6% 31% 2.77
11 to 19 years 48 4% 54% 13% 4% 25% 2.78
20 years or more 43 9% 61% 12% 5% 14% 2.86
TOTAL 168 8% 51% 9% 4% 27% 2.88
c. The college uses data to assess student progress and achievement.
Classified 41 10% 56% 2% 2% 29% 3.03
Faculty 101 9% 60% 7% 6% 18% 2.88
Management/Supervisory 24 13% 71% 13% 0% 4% 3.00
Less than 5 years 45 16% 44% 7% 2% 31% 3.06
5 to 10 years 32 3% 66% 6% 6% 19% 2.81
11 to 19 years 48 8% 60% 10% 4% 17% 2.88
20 years or more 42 10% 76% 2% 5% 7% 2.97
TOTAL 167 10% 61% 7% 4% 19% 2.93
Classified 41 10% 39% 5% 15% 32% 2.64
Faculty 100 11% 47% 22% 6% 14% 2.73
Management/Supervisory 24 8% 67% 17% 4% 4% 2.83
Less than 5 years 45 18% 47% 11% 9% 16% 2.87
5 to 10 years 31 3% 48% 16% 10% 23% 2.58
11 to 19 years 48 8% 46% 21% 6% 19% 2.69
20 years or more 42 10% 50% 21% 7% 12% 2.70
TOTAL 166 10% 48% 18% 8% 16% 2.72
Classified 41 42% 39% 5% 2% 12% 3.36
Faculty 102 36% 46% 10% 4% 4% 3.19
Management/Supervisory 24 42% 58% 0% 0% 0% 3.42
Less than 5 years 45 44% 42% 4% 2% 7% 3.38
5 to 10 years 32 22% 53% 13% 6% 6% 2.97
11 to 19 years 48 42% 46% 4% 4% 4% 3.30
20 years or more 43 42% 44% 9% 0% 5% 3.34
TOTAL 168 39% 46% 7% 3% 5% 3.27
Respondents' level of agreement with the decision-making process at Cypress College:
a. The college has established governance structures, processes, and practices to facilitate effective communication
among its constituencies.
b. The college uses data for planning and for budgeting resources.
d. The college ensures accountability for student success by identifying clear goals, and implementing strategies for
improvement.
e. I am held accountable for accomplishing my assigned responsibilities.
* Average of responses from 1 to 4, 1 being "Strongly disagree" and 4 being "Strongly agree". "Don't know/N/A" responses were excluded
from the calculation of the mean.
The Collaborative Brain Trust 85
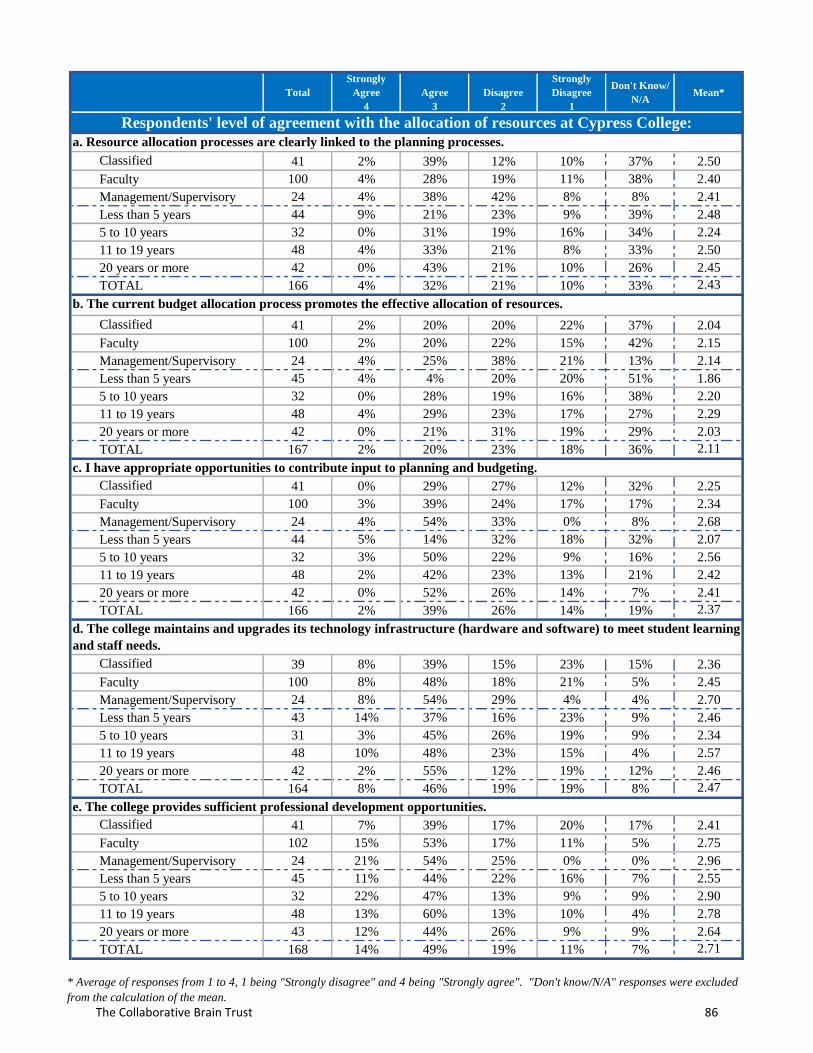
Total
Strongly
Agree
4
Agree
3
Disagree
2
Strongly
Disagree
1
Don't Know/
N/AMean*
Classified 41 2% 39% 12% 10% 37% 2.50
Faculty 100 4% 28% 19% 11% 38% 2.40
Management/Supervisory 24 4% 38% 42% 8% 8% 2.41
Less than 5 years 44 9% 21% 23% 9% 39% 2.48
5 to 10 years 32 0% 31% 19% 16% 34% 2.24
11 to 19 years 48 4% 33% 21% 8% 33% 2.50
20 years or more 42 0% 43% 21% 10% 26% 2.45
TOTAL 166 4% 32% 21% 10% 33% 2.43
Classified 41 2% 20% 20% 22% 37% 2.04
Faculty 100 2% 20% 22% 15% 42% 2.15
Management/Supervisory 24 4% 25% 38% 21% 13% 2.14
Less than 5 years 45 4% 4% 20% 20% 51% 1.86
5 to 10 years 32 0% 28% 19% 16% 38% 2.20
11 to 19 years 48 4% 29% 23% 17% 27% 2.29
20 years or more 42 0% 21% 31% 19% 29% 2.03
TOTAL 167 2% 20% 23% 18% 36% 2.11
Classified 41 0% 29% 27% 12% 32% 2.25
Faculty 100 3% 39% 24% 17% 17% 2.34
Management/Supervisory 24 4% 54% 33% 0% 8% 2.68
Less than 5 years 44 5% 14% 32% 18% 32% 2.07
5 to 10 years 32 3% 50% 22% 9% 16% 2.56
11 to 19 years 48 2% 42% 23% 13% 21% 2.42
20 years or more 42 0% 52% 26% 14% 7% 2.41
TOTAL 166 2% 39% 26% 14% 19% 2.37
Classified 39 8% 39% 15% 23% 15% 2.36
Faculty 100 8% 48% 18% 21% 5% 2.45
Management/Supervisory 24 8% 54% 29% 4% 4% 2.70
Less than 5 years 43 14% 37% 16% 23% 9% 2.46
5 to 10 years 31 3% 45% 26% 19% 9% 2.34
11 to 19 years 48 10% 48% 23% 15% 4% 2.57
20 years or more 42 2% 55% 12% 19% 12% 2.46
TOTAL 164 8% 46% 19% 19% 8% 2.47
Classified 41 7% 39% 17% 20% 17% 2.41
Faculty 102 15% 53% 17% 11% 5% 2.75
Management/Supervisory 24 21% 54% 25% 0% 0% 2.96
Less than 5 years 45 11% 44% 22% 16% 7% 2.55
5 to 10 years 32 22% 47% 13% 9% 9% 2.90
11 to 19 years 48 13% 60% 13% 10% 4% 2.78
20 years or more 43 12% 44% 26% 9% 9% 2.64
TOTAL 168 14% 49% 19% 11% 7% 2.71
Respondents' level of agreement with the allocation of resources at Cypress College:
b. The current budget allocation process promotes the effective allocation of resources.
a. Resource allocation processes are clearly linked to the planning processes.
c. I have appropriate opportunities to contribute input to planning and budgeting.
d. The college maintains and upgrades its technology infrastructure (hardware and software) to meet student learning
and staff needs.
e. The college provides sufficient professional development opportunities.
* Average of responses from 1 to 4, 1 being "Strongly disagree" and 4 being "Strongly agree". "Don't know/N/A" responses were excluded
from the calculation of the mean.
The Collaborative Brain Trust 86

Total
Strongly
Agree
4
Agree
3
Disagree
2
Strongly
Disagree
1
Don't Know/
N/AMean*
Classified 41 2% 27% 29% 22% 20% 2.12
Faculty 99 5% 41% 24% 8% 21% 2.55
Management/Supervisory 24 8% 38% 29% 8% 17% 2.55
Less than 5 years 45 11% 27% 29% 13% 20% 2.44
5 to 10 years 32 3% 44% 19% 13% 22% 2.48
11 to 19 years 46 2% 39% 24% 15% 20% 2.35
20 years or more 42 2% 41% 31% 7% 19% 2.47
TOTAL 165 5% 37% 26% 12% 20% 2.43
f. The college creates opportunities for career advancement.
* Average of responses from 1 to 4, 1 being "Strongly disagree" and 4 being "Strongly agree". "Don't know/N/A" responses were excluded
from the calculation of the mean.
The Collaborative Brain Trust 87
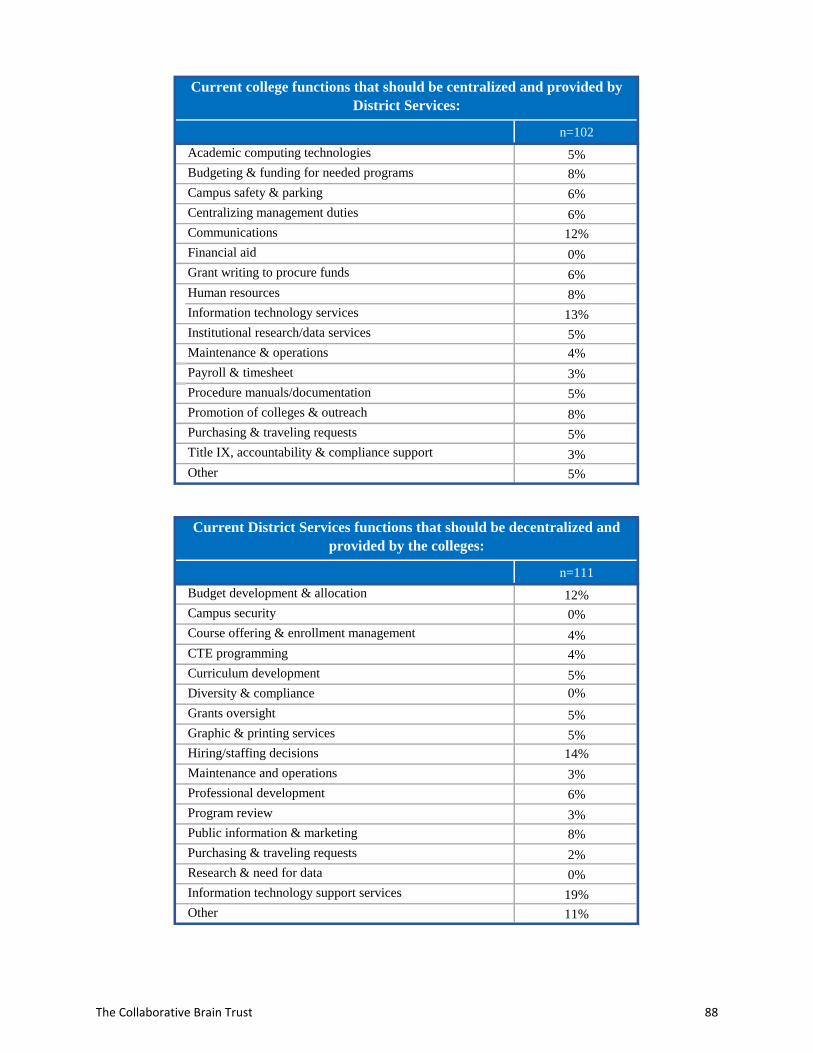
n=102
5%
8%
6%
6%
12%
0%
6%
8%
13%
5%
4%
3%
5%
8%
5%
3%
Other 5%
n=111
12%
0%
4%
4%
5%
0%
5%
5%
14%
3%
6%
3%
8%
2%
0%
19%
11%
Communications
Financial aid
Academic computing technologies
Budgeting & funding for needed programs
Campus safety & parking
Centralizing management duties
Grant writing to procure funds
Human resources
Information technology services
Institutional research/data services
Maintenance & operations
Budget development & allocation
Campus security
Course offering & enrollment management
Payroll & timesheet
Procedure manuals/documentation
Promotion of colleges & outreach
Purchasing & traveling requests
Title IX, accountability & compliance support
CTE programming
Curriculum development
Diversity & compliance
Grants oversight
Graphic & printing services
Hiring/staffing decisions
Maintenance and operations
Professional development
Program review
Public information & marketing
Purchasing & traveling requests
Research & need for data
Information technology support services
Other
Current college functions that should be centralized and provided by
District Services:
Current District Services functions that should be decentralized and
provided by the colleges:
The Collaborative Brain Trust 88
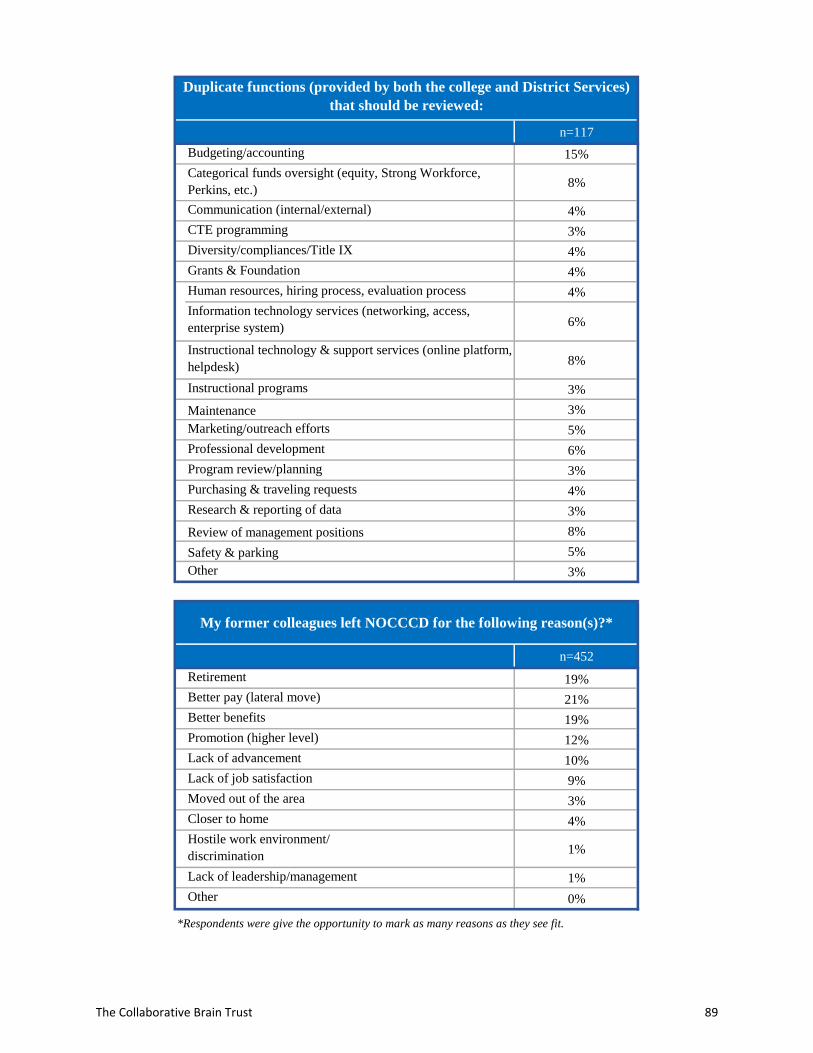
n=117
15%
8%
4%
3%
4%
4%
4%
6%
8%
3%
3%
5%
6%
3%
4%
3%
8%
5%
3%
n=452
Retirement 19%
Better pay (lateral move) 21%
Better benefits 19%
Promotion (higher level) 12%
Lack of advancement 10%
Lack of job satisfaction 9%
Moved out of the area 3%
Closer to home 4%
1%
1%
0%
*Respondents were give the opportunity to mark as many reasons as they see fit.
Budgeting/accounting
Categorical funds oversight (equity, Strong Workforce,
Perkins, etc.)
Communication (internal/external)
CTE programming
Maintenance
Marketing/outreach efforts
Professional development
Program review/planning
Diversity/compliances/Title IX
Grants & Foundation
Human resources, hiring process, evaluation process
Information technology services (networking, access,
enterprise system)
Instructional technology & support services (online platform,
helpdesk)
Hostile work environment/
discrimination
Lack of leadership/management
Other
Duplicate functions (provided by both the college and District Services)
that should be reviewed:
My former colleagues left NOCCCD for the following reason(s)?*
Purchasing & traveling requests
Research & reporting of data
Review of management positions
Safety & parking
Other
Instructional programs
The Collaborative Brain Trust 89
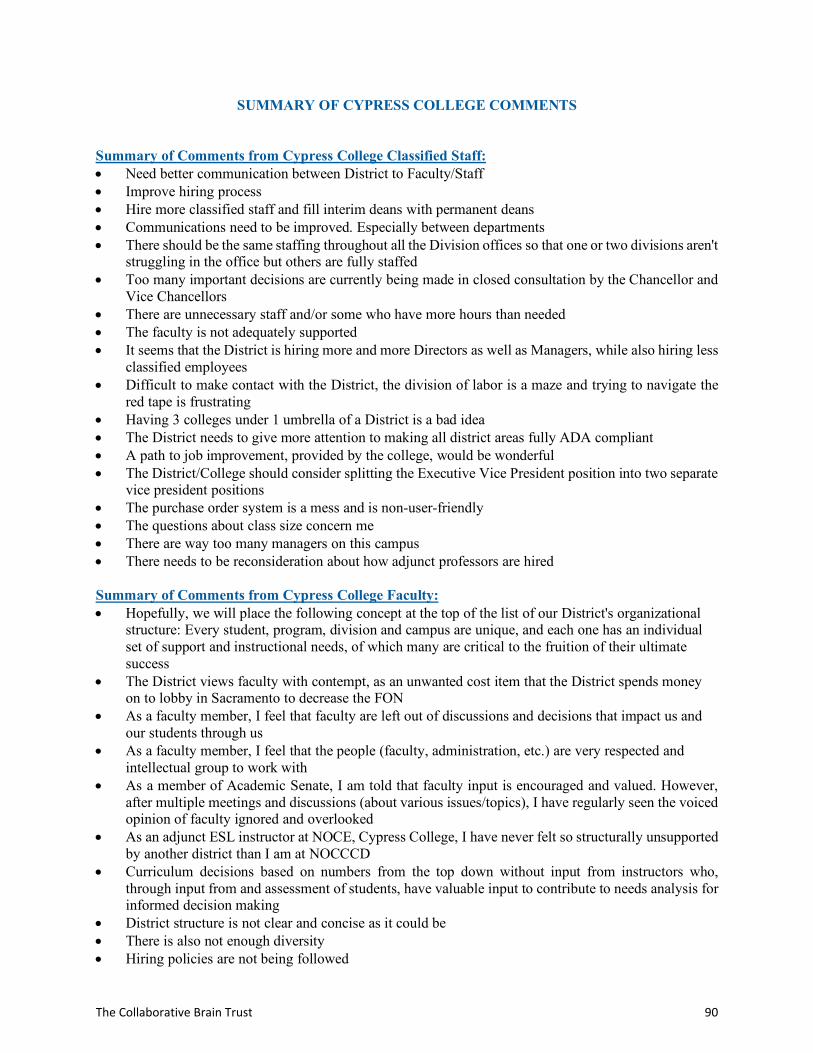
SUMMARY OF CYPRESS COLLEGE COMMENTS Summary of Comments from Cypress College Classified Staff: • Need better communication between District to Faculty/Staff • Improve hiring process • Hire more classified staff and fill interim deans with permanent deans • Communications need to be improved. Especially between departments • There should be the same staffing throughout all the Division offices so that one or two divisions aren't
struggling in the office but others are fully staffed • Too many important decisions are currently being made in closed consultation by the Chancellor and
Vice Chancellors • There are unnecessary staff and/or some who have more hours than needed • The faculty is not adequately supported • It seems that the District is hiring more and more Directors as well as Managers, while also hiring less
classified employees • Difficult to make contact with the District, the division of labor is a maze and trying to navigate the
red tape is frustrating • Having 3 colleges under 1 umbrella of a District is a bad idea • The District needs to give more attention to making all district areas fully ADA compliant • A path to job improvement, provided by the college, would be wonderful • The District/College should consider splitting the Executive Vice President position into two separate
vice president positions • The purchase order system is a mess and is non-user-friendly • The questions about class size concern me • There are way too many managers on this campus • There needs to be reconsideration about how adjunct professors are hired
Summary of Comments from Cypress College Faculty: • Hopefully, we will place the following concept at the top of the list of our District's organizational
structure: Every student, program, division and campus are unique, and each one has an individual set of support and instructional needs, of which many are critical to the fruition of their ultimate success
• The District views faculty with contempt, as an unwanted cost item that the District spends money on to lobby in Sacramento to decrease the FON
• As a faculty member, I feel that faculty are left out of discussions and decisions that impact us and our students through us
• As a faculty member, I feel that the people (faculty, administration, etc.) are very respected and intellectual group to work with
• As a member of Academic Senate, I am told that faculty input is encouraged and valued. However, after multiple meetings and discussions (about various issues/topics), I have regularly seen the voiced opinion of faculty ignored and overlooked
• As an adjunct ESL instructor at NOCE, Cypress College, I have never felt so structurally unsupported by another district than I am at NOCCCD
• Curriculum decisions based on numbers from the top down without input from instructors who, through input from and assessment of students, have valuable input to contribute to needs analysis for informed decision making
• District structure is not clear and concise as it could be • There is also not enough diversity • Hiring policies are not being followed
The Collaborative Brain Trust 90
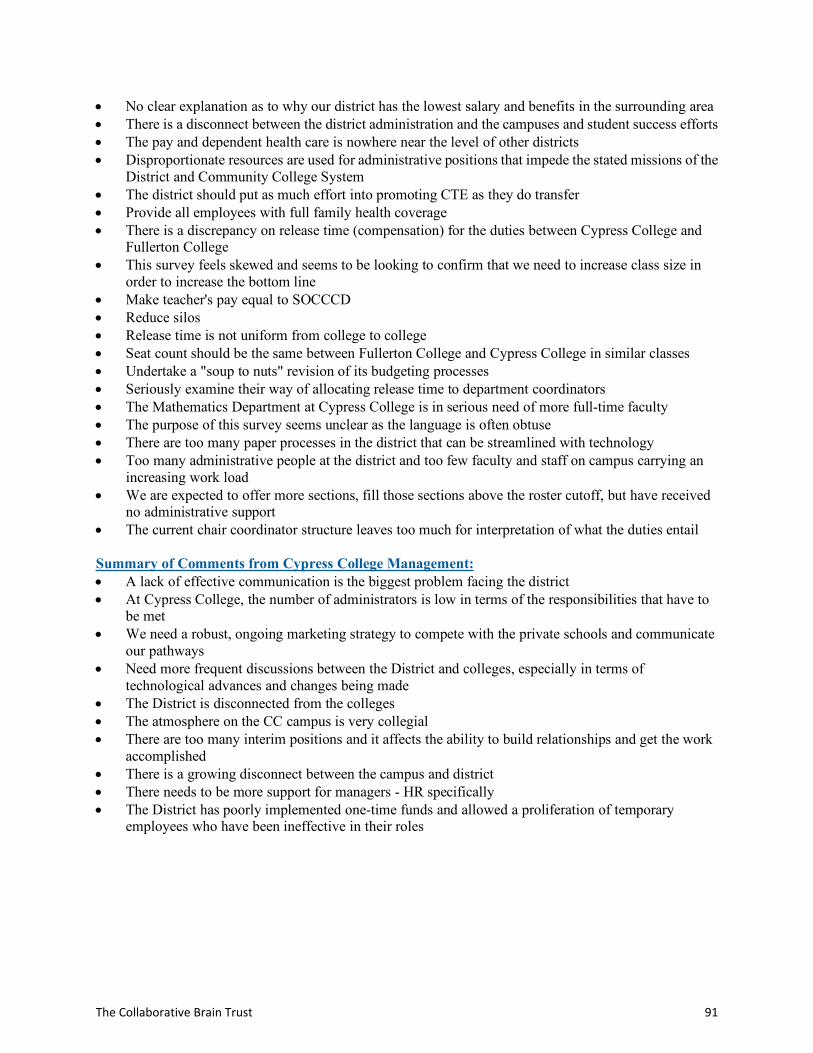
• No clear explanation as to why our district has the lowest salary and benefits in the surrounding area• There is a disconnect between the district administration and the campuses and student success efforts• The pay and dependent health care is nowhere near the level of other districts• Disproportionate resources are used for administrative positions that impede the stated missions of the
District and Community College System• The district should put as much effort into promoting CTE as they do transfer• Provide all employees with full family health coverage• There is a discrepancy on release time (compensation) for the duties between Cypress College and
Fullerton College• This survey feels skewed and seems to be looking to confirm that we need to increase class size in
order to increase the bottom line• Make teacher's pay equal to SOCCCD• Reduce silos• Release time is not uniform from college to college• Seat count should be the same between Fullerton College and Cypress College in similar classes• Undertake a "soup to nuts" revision of its budgeting processes• Seriously examine their way of allocating release time to department coordinators• The Mathematics Department at Cypress College is in serious need of more full-time faculty• The purpose of this survey seems unclear as the language is often obtuse• There are too many paper processes in the district that can be streamlined with technology• Too many administrative people at the district and too few faculty and staff on campus carrying an
increasing work load• We are expected to offer more sections, fill those sections above the roster cutoff, but have received
no administrative support• The current chair coordinator structure leaves too much for interpretation of what the duties entail
Summary of Comments from Cypress College Management: • A lack of effective communication is the biggest problem facing the district• At Cypress College, the number of administrators is low in terms of the responsibilities that have to
be met• We need a robust, ongoing marketing strategy to compete with the private schools and communicate
our pathways• Need more frequent discussions between the District and colleges, especially in terms of
technological advances and changes being made• The District is disconnected from the colleges• The atmosphere on the CC campus is very collegial• There are too many interim positions and it affects the ability to build relationships and get the work
accomplished• There is a growing disconnect between the campus and district• There needs to be more support for managers - HR specifically• The District has poorly implemented one-time funds and allowed a proliferation of temporary
employees who have been ineffective in their roles
The Collaborative Brain Trust 91

APPENDIX F F. Survey Results for District Services
The Collaborative Brain Trust 92
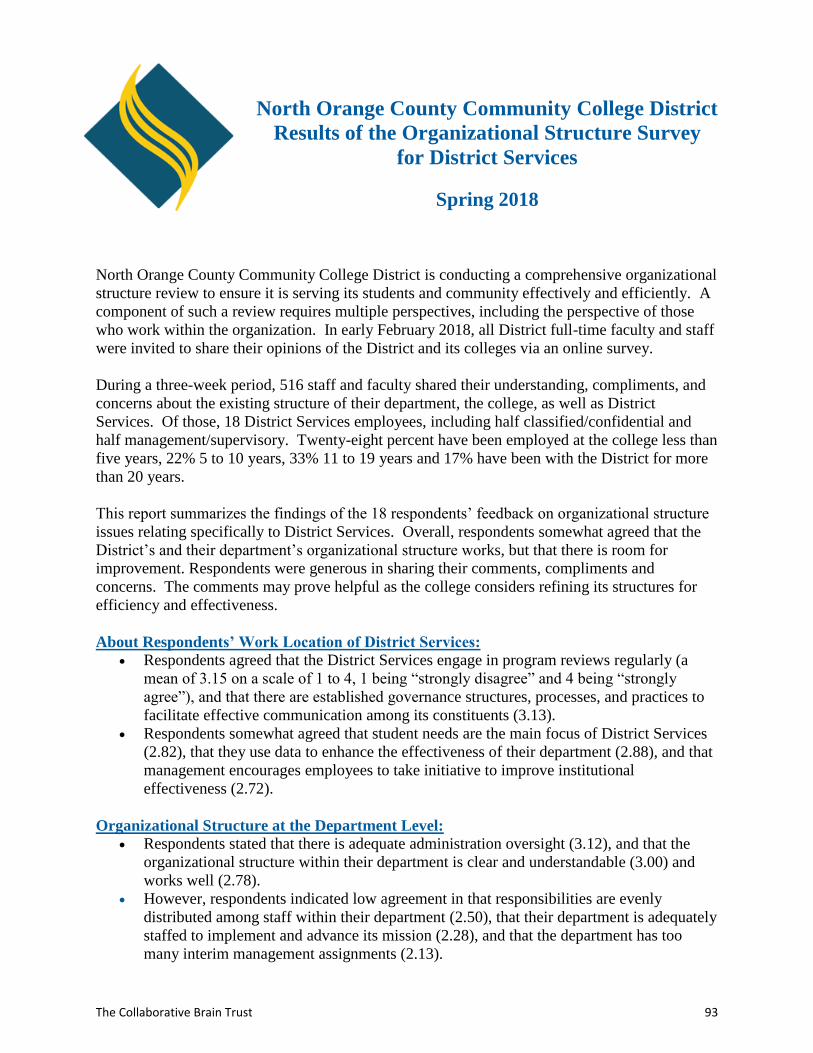
North Orange County Community College District
Results of the Organizational Structure Survey
for District Services
Spring 2018
North Orange County Community College District is conducting a comprehensive organizational
structure review to ensure it is serving its students and community effectively and efficiently. A
component of such a review requires multiple perspectives, including the perspective of those
who work within the organization. In early February 2018, all District full-time faculty and staff
were invited to share their opinions of the District and its colleges via an online survey.
During a three-week period, 516 staff and faculty shared their understanding, compliments, and
concerns about the existing structure of their department, the college, as well as District
Services. Of those, 18 District Services employees, including half classified/confidential and
half management/supervisory. Twenty-eight percent have been employed at the college less than
five years, 22% 5 to 10 years, 33% 11 to 19 years and 17% have been with the District for more
than 20 years.
This report summarizes the findings of the 18 respondents’ feedback on organizational structure
issues relating specifically to District Services. Overall, respondents somewhat agreed that the
District’s and their department’s organizational structure works, but that there is room for
improvement. Respondents were generous in sharing their comments, compliments and
concerns. The comments may prove helpful as the college considers refining its structures for
efficiency and effectiveness.
About Respondents’ Work Location of District Services:
Respondents agreed that the District Services engage in program reviews regularly (a
mean of 3.15 on a scale of 1 to 4, 1 being “strongly disagree” and 4 being “strongly
agree”), and that there are established governance structures, processes, and practices to
facilitate effective communication among its constituents (3.13).
Respondents somewhat agreed that student needs are the main focus of District Services
(2.82), that they use data to enhance the effectiveness of their department (2.88), and that
management encourages employees to take initiative to improve institutional
effectiveness (2.72).
Organizational Structure at the Department Level:
Respondents stated that there is adequate administration oversight (3.12), and that the
organizational structure within their department is clear and understandable (3.00) and
works well (2.78).
However, respondents indicated low agreement in that responsibilities are evenly
distributed among staff within their department (2.50), that their department is adequately
staffed to implement and advance its mission (2.28), and that the department has too
many interim management assignments (2.13).
The Collaborative Brain Trust 93
Organizational Structure at District Services: There is agreement that District Services has too many interim assignments within its
management level (2.67), and that it sometimes evaluates vacant positions to determine
whether or not each can be combined with another similar position (2.25).
Respondents somewhat agreed that there is adequate administration oversight at District
Services level (2.82).
Many respondents do not feel the current organizational structure of District Services
level works well (2.38) and that information within District Services is not disseminated
in a timely manner, leaving respondents uninformed (2.65).
There is an indication that responsibilities are not evenly distributed across departments
within District Services (2.23), and that there is unnecessary duplication of services
among departments (2.57).
Organizational Structure at District Services and the Colleges:
Respondents agreed that the District effectively communicates and advocates for the
colleges and in the community and at the state level (3.08), but that District Services is
not adequately staffed to implement and advance its mission (2.11).
Respondents noted some agreement that information between District Services and the
colleges is disseminated in a timely manner and that they are kept informed of the
changes within the District (2.50 and 2.76 respectively).
Respondents noted some agreement that District Services adequately supports the work
of the colleges (2.81), and that the division of labor between the two units is clear and
understandable (2.53).
Delivery of Education and Support Services to Students in Relation to Financial Health:
Respondents somewhat understood the relationship of class size, support services, and
educational quality with the District’s financial health (2.76), and of the relationship
between average class size and the ability of the District to provide competitive salary
and benefits, adequate instructional supplies, and afford new program development
(2.88).
However, respondents are in even less agreement that the District delivers instruction in a
way that maximizes the financial health of the District (2.25) and that decisions related to
educational quality, class size, and supporting staffing are made at the appropriate level
(1.90).
Decision-Making Process at District Services:
Many respondents agreed that they are held accountable for accomplishing their assigned
responsibilities (3.31), but less agreement that the college ensures accountability for
student success by identifying clear goals and implementing strategies for improvement
(2.54).
There is general agreement that District Services uses data to assess student progress and
achievement (2.83), as well as to plan and to budget resources (2.75).
Respondents slightly agreed that the college has established governance structures,
processes and practices to facilitate effective communication among its constituencies
(2.80).
The Collaborative Brain Trust 94
Allocation of Resources at District Services:
Respondents somewhat agreed that the college maintains and upgrades its technology
infrastructure to meet student learning and staff needs (2.80).
Respondents also somewhat agreed that District Services provides sufficient professional
development opportunities (2.65), and that it creates opportunities for career
advancement (2.50).
Many respondents slightly agreed that the current budget allocation process promotes the
effective allocation of resources (2.50) and that these processes are slightly linked to the
planning processes (2.82). However, there is little opportunity to contribute input to
planning and budgeting (2.33).
Alignment of District Services and College Functions:
Information technology services, communications, promotion of the college and outreach
efforts, grants writing to procure additional funding, and maintenance and operations
were among the functions that District Services respondents would like to see centralized
and offered by District Services. A comprehensive list of other functions can be found on
page 14.
Instructional technologies services, hiring/staffing decisions and public
information/marketing were among the services respondents would like to see
decentralized and offered at the colleges. A comprehensive list of other functions can be
found on page 14.
Budget development and allocation, information technology services and
marketing/outreach efforts were among the duplicate functions that should be reviewed
for effectiveness. A comprehensive list of other functions can be found on page 15.
Other than the one-quarter of responses noting retirement, respondents identified major
reasons that former colleagues left District Services as due to better pay for lateral move
(17%), better benefits (13%), promotion to higher level (21%), and lack of advancement
(4%).
There was an additional 17% of respondents that identified lack of job satisfaction
and lack of leadership as the causes of former employees leaving.
Respondent comments:
There were a few responses made by District Services respondents and can be found on
page 16.
The Collaborative Brain Trust 95
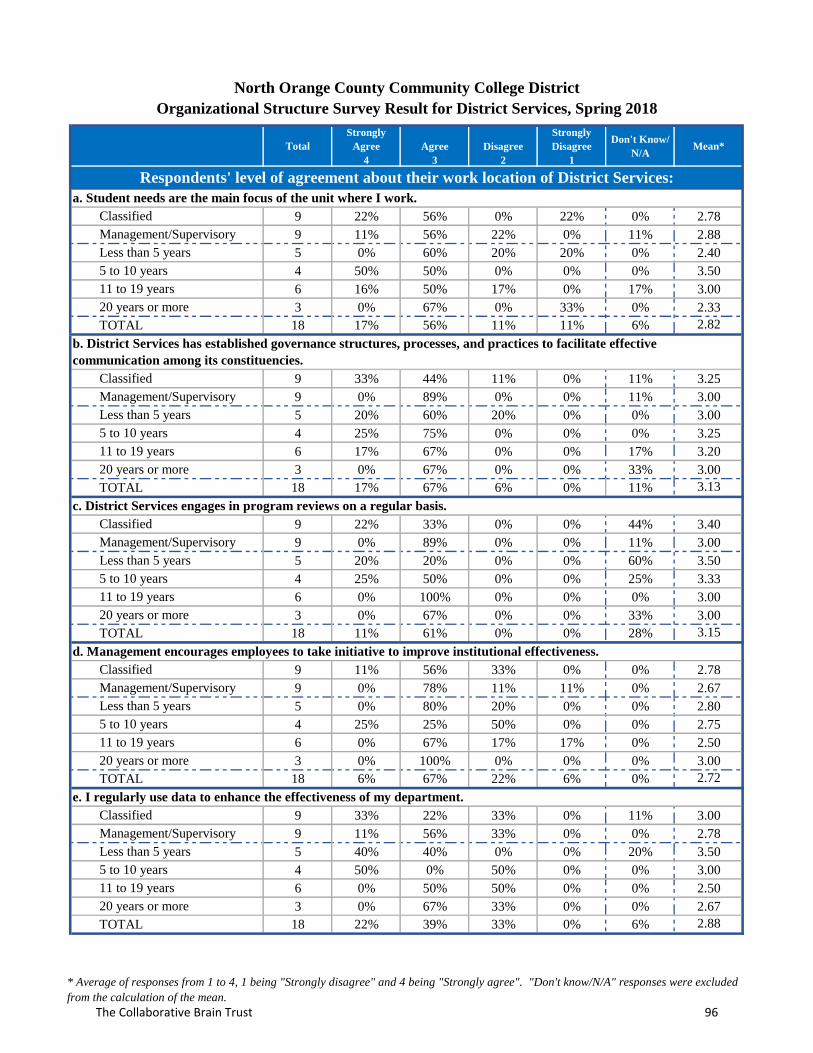
Total
Strongly
Agree
4
Agree
3
Disagree
2
Strongly
Disagree
1
Don't Know/
N/AMean*
Classified 9 22% 56% 0% 22% 0% 2.78
Management/Supervisory 9 11% 56% 22% 0% 11% 2.88
Less than 5 years 5 0% 60% 20% 20% 0% 2.40
5 to 10 years 4 50% 50% 0% 0% 0% 3.50
11 to 19 years 6 16% 50% 17% 0% 17% 3.00
20 years or more 3 0% 67% 0% 33% 0% 2.33
TOTAL 18 17% 56% 11% 11% 6% 2.82
Classified 9 33% 44% 11% 0% 11% 3.25
Management/Supervisory 9 0% 89% 0% 0% 11% 3.00
Less than 5 years 5 20% 60% 20% 0% 0% 3.00
5 to 10 years 4 25% 75% 0% 0% 0% 3.25
11 to 19 years 6 17% 67% 0% 0% 17% 3.20
20 years or more 3 0% 67% 0% 0% 33% 3.00
TOTAL 18 17% 67% 6% 0% 11% 3.13
Classified 9 22% 33% 0% 0% 44% 3.40
Management/Supervisory 9 0% 89% 0% 0% 11% 3.00
Less than 5 years 5 20% 20% 0% 0% 60% 3.50
5 to 10 years 4 25% 50% 0% 0% 25% 3.33
11 to 19 years 6 0% 100% 0% 0% 0% 3.00
20 years or more 3 0% 67% 0% 0% 33% 3.00
TOTAL 18 11% 61% 0% 0% 28% 3.15
Classified 9 11% 56% 33% 0% 0% 2.78
Management/Supervisory 9 0% 78% 11% 11% 0% 2.67
Less than 5 years 5 0% 80% 20% 0% 0% 2.80
5 to 10 years 4 25% 25% 50% 0% 0% 2.75
11 to 19 years 6 0% 67% 17% 17% 0% 2.50
20 years or more 3 0% 100% 0% 0% 0% 3.00
TOTAL 18 6% 67% 22% 6% 0% 2.72
Classified 9 33% 22% 33% 0% 11% 3.00
Management/Supervisory 9 11% 56% 33% 0% 0% 2.78
Less than 5 years 5 40% 40% 0% 0% 20% 3.50
5 to 10 years 4 50% 0% 50% 0% 0% 3.00
11 to 19 years 6 0% 50% 50% 0% 0% 2.50
20 years or more 3 0% 67% 33% 0% 0% 2.67
TOTAL 18 22% 39% 33% 0% 6% 2.88
Respondents' level of agreement about their work location of District Services:
b. District Services has established governance structures, processes, and practices to facilitate effective
communication among its constituencies.
c. District Services engages in program reviews on a regular basis.
d. Management encourages employees to take initiative to improve institutional effectiveness.
e. I regularly use data to enhance the effectiveness of my department.
North Orange County Community College District
Organizational Structure Survey Result for District Services, Spring 2018
a. Student needs are the main focus of the unit where I work.
* Average of responses from 1 to 4, 1 being "Strongly disagree" and 4 being "Strongly agree". "Don't know/N/A" responses were excluded
from the calculation of the mean.
The Collaborative Brain Trust 96
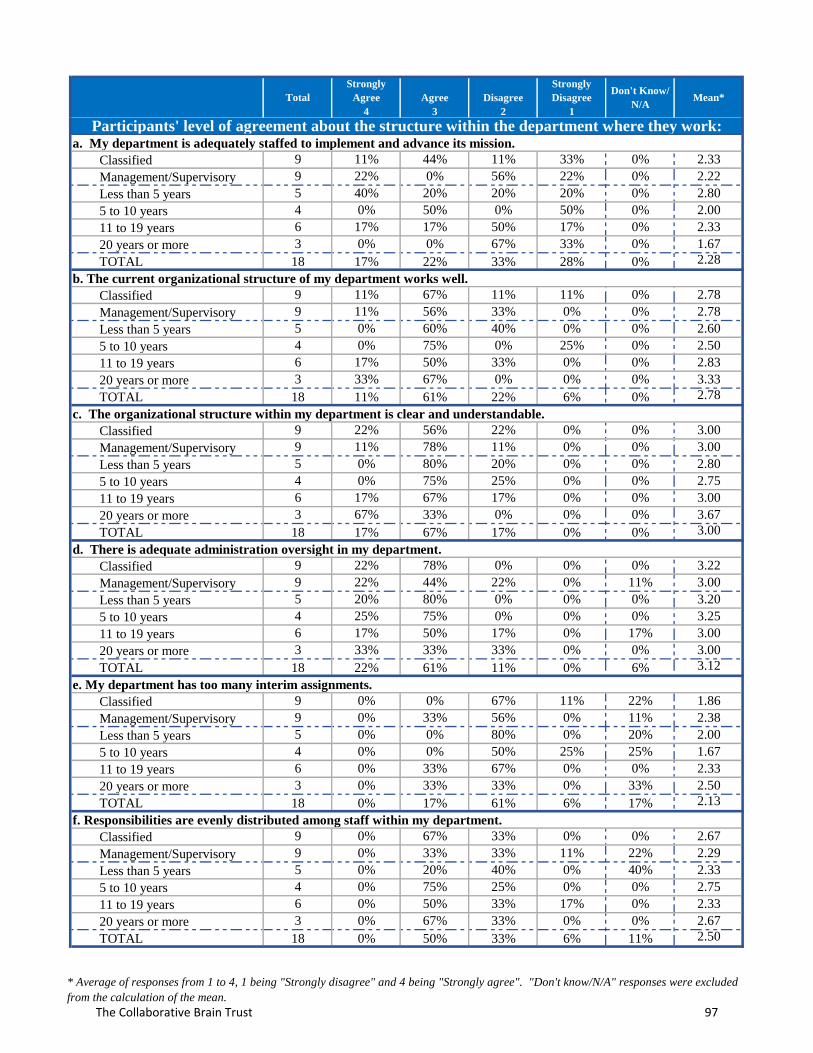
Total
Strongly
Agree
4
Agree
3
Disagree
2
Strongly
Disagree
1
Don't Know/
N/AMean*
a. My department is adequately staffed to implement and advance its mission.
Classified 9 11% 44% 11% 33% 0% 2.33
Management/Supervisory 9 22% 0% 56% 22% 0% 2.22
Less than 5 years 5 40% 20% 20% 20% 0% 2.80
5 to 10 years 4 0% 50% 0% 50% 0% 2.00
11 to 19 years 6 17% 17% 50% 17% 0% 2.33
20 years or more 3 0% 0% 67% 33% 0% 1.67
TOTAL 18 17% 22% 33% 28% 0% 2.28
Classified 9 11% 67% 11% 11% 0% 2.78
Management/Supervisory 9 11% 56% 33% 0% 0% 2.78
Less than 5 years 5 0% 60% 40% 0% 0% 2.60
5 to 10 years 4 0% 75% 0% 25% 0% 2.50
11 to 19 years 6 17% 50% 33% 0% 0% 2.83
20 years or more 3 33% 67% 0% 0% 0% 3.33
TOTAL 18 11% 61% 22% 6% 0% 2.78
Classified 9 22% 56% 22% 0% 0% 3.00
Management/Supervisory 9 11% 78% 11% 0% 0% 3.00
Less than 5 years 5 0% 80% 20% 0% 0% 2.80
5 to 10 years 4 0% 75% 25% 0% 0% 2.75
11 to 19 years 6 17% 67% 17% 0% 0% 3.00
20 years or more 3 67% 33% 0% 0% 0% 3.67
TOTAL 18 17% 67% 17% 0% 0% 3.00
d. There is adequate administration oversight in my department.
Classified 9 22% 78% 0% 0% 0% 3.22
Management/Supervisory 9 22% 44% 22% 0% 11% 3.00
Less than 5 years 5 20% 80% 0% 0% 0% 3.20
5 to 10 years 4 25% 75% 0% 0% 0% 3.25
11 to 19 years 6 17% 50% 17% 0% 17% 3.00
20 years or more 3 33% 33% 33% 0% 0% 3.00
TOTAL 18 22% 61% 11% 0% 6% 3.12
e. My department has too many interim assignments.
Classified 9 0% 0% 67% 11% 22% 1.86
Management/Supervisory 9 0% 33% 56% 0% 11% 2.38
Less than 5 years 5 0% 0% 80% 0% 20% 2.00
5 to 10 years 4 0% 0% 50% 25% 25% 1.67
11 to 19 years 6 0% 33% 67% 0% 0% 2.33
20 years or more 3 0% 33% 33% 0% 33% 2.50
TOTAL 18 0% 17% 61% 6% 17% 2.13
f. Responsibilities are evenly distributed among staff within my department.
Classified 9 0% 67% 33% 0% 0% 2.67
Management/Supervisory 9 0% 33% 33% 11% 22% 2.29
Less than 5 years 5 0% 20% 40% 0% 40% 2.33
5 to 10 years 4 0% 75% 25% 0% 0% 2.75
11 to 19 years 6 0% 50% 33% 17% 0% 2.33
20 years or more 3 0% 67% 33% 0% 0% 2.67
TOTAL 18 0% 50% 33% 6% 11% 2.50
b. The current organizational structure of my department works well.
c. The organizational structure within my department is clear and understandable.
Participants' level of agreement about the structure within the department where they work:
* Average of responses from 1 to 4, 1 being "Strongly disagree" and 4 being "Strongly agree". "Don't know/N/A" responses were excluded
from the calculation of the mean.
The Collaborative Brain Trust 97
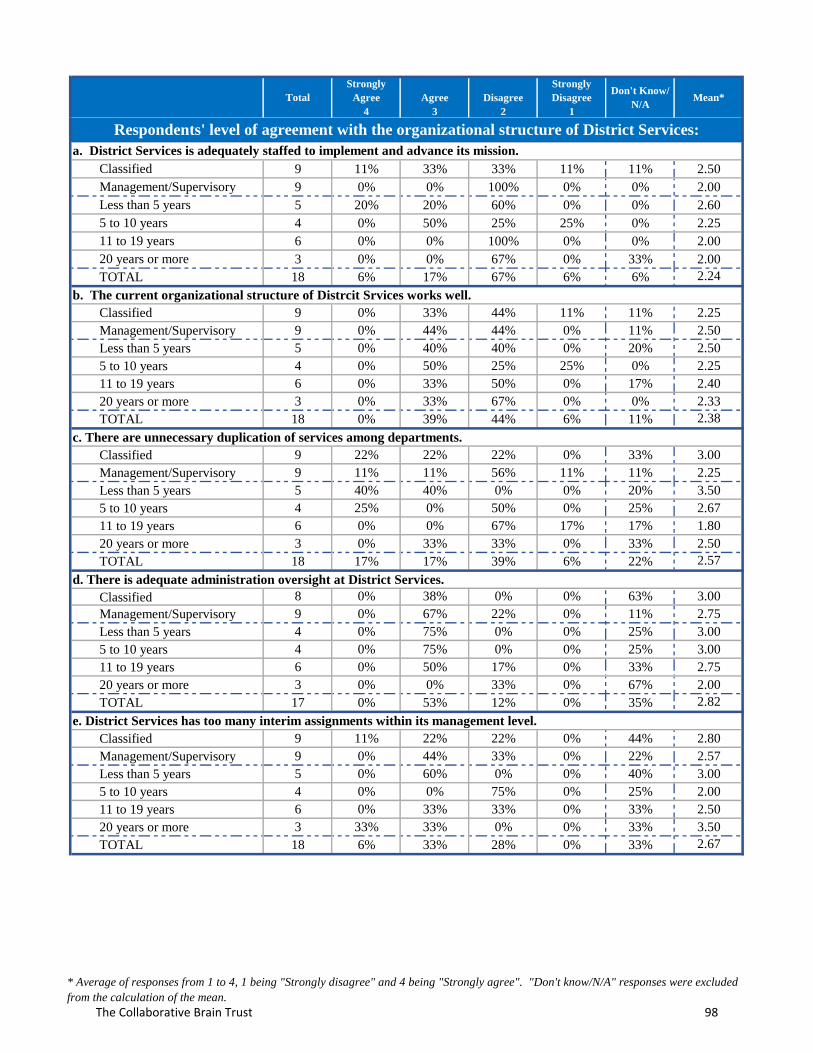
Total
Strongly
Agree
4
Agree
3
Disagree
2
Strongly
Disagree
1
Don't Know/
N/AMean*
a. District Services is adequately staffed to implement and advance its mission.
Classified 9 11% 33% 33% 11% 11% 2.50
Management/Supervisory 9 0% 0% 100% 0% 0% 2.00
Less than 5 years 5 20% 20% 60% 0% 0% 2.60
5 to 10 years 4 0% 50% 25% 25% 0% 2.25
11 to 19 years 6 0% 0% 100% 0% 0% 2.00
20 years or more 3 0% 0% 67% 0% 33% 2.00
TOTAL 18 6% 17% 67% 6% 6% 2.24
b. The current organizational structure of Distrcit Srvices works well.
Classified 9 0% 33% 44% 11% 11% 2.25
Management/Supervisory 9 0% 44% 44% 0% 11% 2.50
Less than 5 years 5 0% 40% 40% 0% 20% 2.50
5 to 10 years 4 0% 50% 25% 25% 0% 2.25
11 to 19 years 6 0% 33% 50% 0% 17% 2.40
20 years or more 3 0% 33% 67% 0% 0% 2.33
TOTAL 18 0% 39% 44% 6% 11% 2.38
c. There are unnecessary duplication of services among departments.
Classified 9 22% 22% 22% 0% 33% 3.00
Management/Supervisory 9 11% 11% 56% 11% 11% 2.25
Less than 5 years 5 40% 40% 0% 0% 20% 3.50
5 to 10 years 4 25% 0% 50% 0% 25% 2.67
11 to 19 years 6 0% 0% 67% 17% 17% 1.80
20 years or more 3 0% 33% 33% 0% 33% 2.50
TOTAL 18 17% 17% 39% 6% 22% 2.57
d. There is adequate administration oversight at District Services.
Classified 8 0% 38% 0% 0% 63% 3.00
Management/Supervisory 9 0% 67% 22% 0% 11% 2.75
Less than 5 years 4 0% 75% 0% 0% 25% 3.00
5 to 10 years 4 0% 75% 0% 0% 25% 3.00
11 to 19 years 6 0% 50% 17% 0% 33% 2.75
20 years or more 3 0% 0% 33% 0% 67% 2.00
TOTAL 17 0% 53% 12% 0% 35% 2.82
e. District Services has too many interim assignments within its management level.
Classified 9 11% 22% 22% 0% 44% 2.80
Management/Supervisory 9 0% 44% 33% 0% 22% 2.57
Less than 5 years 5 0% 60% 0% 0% 40% 3.00
5 to 10 years 4 0% 0% 75% 0% 25% 2.00
11 to 19 years 6 0% 33% 33% 0% 33% 2.50
20 years or more 3 33% 33% 0% 0% 33% 3.50
TOTAL 18 6% 33% 28% 0% 33% 2.67
Respondents' level of agreement with the organizational structure of District Services:
* Average of responses from 1 to 4, 1 being "Strongly disagree" and 4 being "Strongly agree". "Don't know/N/A" responses were excluded
from the calculation of the mean.
The Collaborative Brain Trust 98
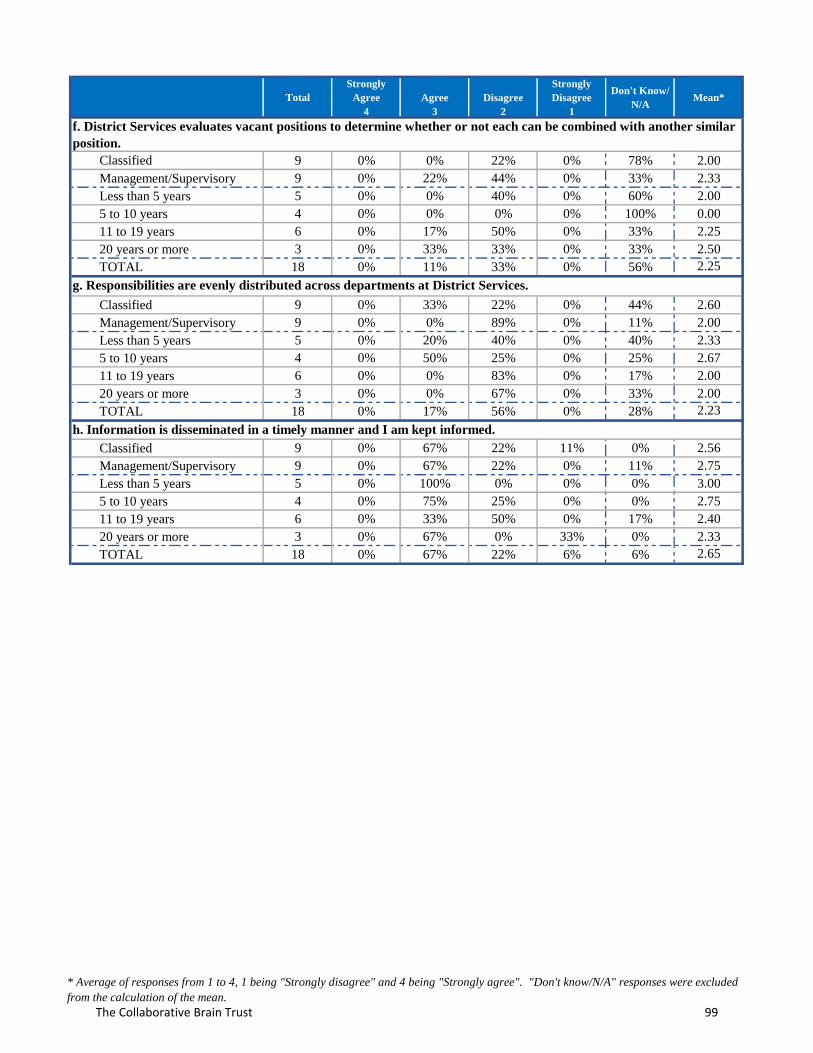
Total
Strongly
Agree
4
Agree
3
Disagree
2
Strongly
Disagree
1
Don't Know/
N/AMean*
Classified 9 0% 0% 22% 0% 78% 2.00
Management/Supervisory 9 0% 22% 44% 0% 33% 2.33
Less than 5 years 5 0% 0% 40% 0% 60% 2.00
5 to 10 years 4 0% 0% 0% 0% 100% 0.00
11 to 19 years 6 0% 17% 50% 0% 33% 2.25
20 years or more 3 0% 33% 33% 0% 33% 2.50
TOTAL 18 0% 11% 33% 0% 56% 2.25
Classified 9 0% 33% 22% 0% 44% 2.60
Management/Supervisory 9 0% 0% 89% 0% 11% 2.00
Less than 5 years 5 0% 20% 40% 0% 40% 2.33
5 to 10 years 4 0% 50% 25% 0% 25% 2.67
11 to 19 years 6 0% 0% 83% 0% 17% 2.00
20 years or more 3 0% 0% 67% 0% 33% 2.00
TOTAL 18 0% 17% 56% 0% 28% 2.23
Classified 9 0% 67% 22% 11% 0% 2.56
Management/Supervisory 9 0% 67% 22% 0% 11% 2.75
Less than 5 years 5 0% 100% 0% 0% 0% 3.00
5 to 10 years 4 0% 75% 25% 0% 0% 2.75
11 to 19 years 6 0% 33% 50% 0% 17% 2.40
20 years or more 3 0% 67% 0% 33% 0% 2.33
TOTAL 18 0% 67% 22% 6% 6% 2.65
f. District Services evaluates vacant positions to determine whether or not each can be combined with another similar
position.
g. Responsibilities are evenly distributed across departments at District Services.
h. Information is disseminated in a timely manner and I am kept informed.
* Average of responses from 1 to 4, 1 being "Strongly disagree" and 4 being "Strongly agree". "Don't know/N/A" responses were excluded
from the calculation of the mean.
The Collaborative Brain Trust 99
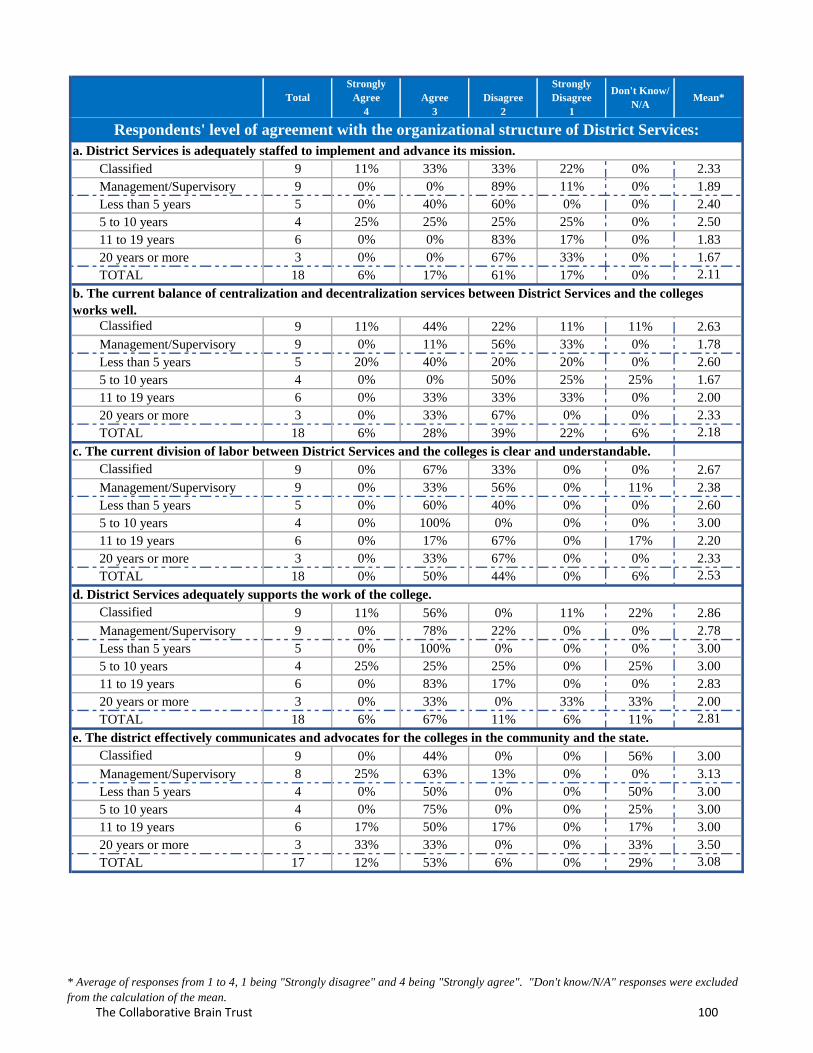
Total
Strongly
Agree
4
Agree
3
Disagree
2
Strongly
Disagree
1
Don't Know/
N/AMean*
Classified 9 11% 33% 33% 22% 0% 2.33
Management/Supervisory 9 0% 0% 89% 11% 0% 1.89
Less than 5 years 5 0% 40% 60% 0% 0% 2.40
5 to 10 years 4 25% 25% 25% 25% 0% 2.50
11 to 19 years 6 0% 0% 83% 17% 0% 1.83
20 years or more 3 0% 0% 67% 33% 0% 1.67
TOTAL 18 6% 17% 61% 17% 0% 2.11
Classified 9 11% 44% 22% 11% 11% 2.63
Management/Supervisory 9 0% 11% 56% 33% 0% 1.78
Less than 5 years 5 20% 40% 20% 20% 0% 2.60
5 to 10 years 4 0% 0% 50% 25% 25% 1.67
11 to 19 years 6 0% 33% 33% 33% 0% 2.00
20 years or more 3 0% 33% 67% 0% 0% 2.33
TOTAL 18 6% 28% 39% 22% 6% 2.18
c. The current division of labor between District Services and the colleges is clear and understandable.
Classified 9 0% 67% 33% 0% 0% 2.67
Management/Supervisory 9 0% 33% 56% 0% 11% 2.38
Less than 5 years 5 0% 60% 40% 0% 0% 2.60
5 to 10 years 4 0% 100% 0% 0% 0% 3.00
11 to 19 years 6 0% 17% 67% 0% 17% 2.20
20 years or more 3 0% 33% 67% 0% 0% 2.33
TOTAL 18 0% 50% 44% 0% 6% 2.53
Classified 9 11% 56% 0% 11% 22% 2.86
Management/Supervisory 9 0% 78% 22% 0% 0% 2.78
Less than 5 years 5 0% 100% 0% 0% 0% 3.00
5 to 10 years 4 25% 25% 25% 0% 25% 3.00
11 to 19 years 6 0% 83% 17% 0% 0% 2.83
20 years or more 3 0% 33% 0% 33% 33% 2.00
TOTAL 18 6% 67% 11% 6% 11% 2.81
e. The district effectively communicates and advocates for the colleges in the community and the state.
Classified 9 0% 44% 0% 0% 56% 3.00
Management/Supervisory 8 25% 63% 13% 0% 0% 3.13
Less than 5 years 4 0% 50% 0% 0% 50% 3.00
5 to 10 years 4 0% 75% 0% 0% 25% 3.00
11 to 19 years 6 17% 50% 17% 0% 17% 3.00
20 years or more 3 33% 33% 0% 0% 33% 3.50
TOTAL 17 12% 53% 6% 0% 29% 3.08
d. District Services adequately supports the work of the college.
Respondents' level of agreement with the organizational structure of District Services:
a. District Services is adequately staffed to implement and advance its mission.
b. The current balance of centralization and decentralization services between District Services and the colleges
works well.
* Average of responses from 1 to 4, 1 being "Strongly disagree" and 4 being "Strongly agree". "Don't know/N/A" responses were excluded
from the calculation of the mean.
The Collaborative Brain Trust 100
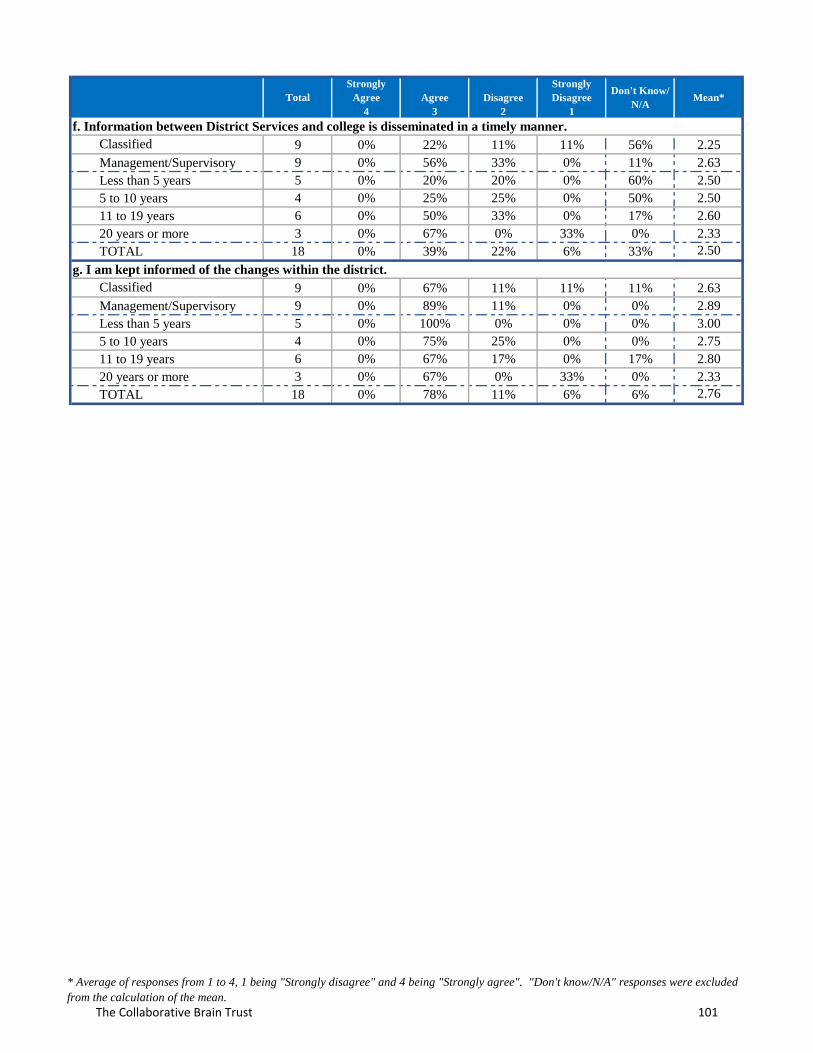
Total
Strongly
Agree
4
Agree
3
Disagree
2
Strongly
Disagree
1
Don't Know/
N/AMean*
Classified 9 0% 22% 11% 11% 56% 2.25
Management/Supervisory 9 0% 56% 33% 0% 11% 2.63
Less than 5 years 5 0% 20% 20% 0% 60% 2.50
5 to 10 years 4 0% 25% 25% 0% 50% 2.50
11 to 19 years 6 0% 50% 33% 0% 17% 2.60
20 years or more 3 0% 67% 0% 33% 0% 2.33
TOTAL 18 0% 39% 22% 6% 33% 2.50
Classified 9 0% 67% 11% 11% 11% 2.63
Management/Supervisory 9 0% 89% 11% 0% 0% 2.89
Less than 5 years 5 0% 100% 0% 0% 0% 3.00
5 to 10 years 4 0% 75% 25% 0% 0% 2.75
11 to 19 years 6 0% 67% 17% 0% 17% 2.80
20 years or more 3 0% 67% 0% 33% 0% 2.33
TOTAL 18 0% 78% 11% 6% 6% 2.76
g. I am kept informed of the changes within the district.
f. Information between District Services and college is disseminated in a timely manner.
* Average of responses from 1 to 4, 1 being "Strongly disagree" and 4 being "Strongly agree". "Don't know/N/A" responses were excluded
from the calculation of the mean.
The Collaborative Brain Trust 101
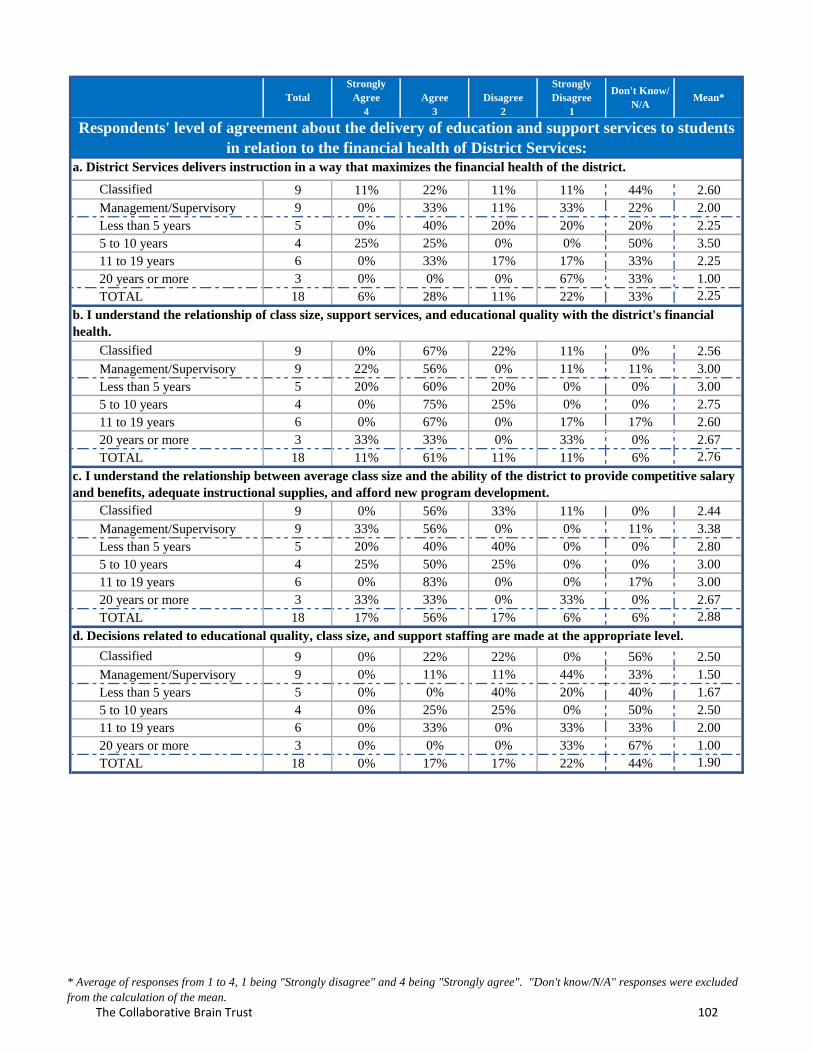
Total
Strongly
Agree
4
Agree
3
Disagree
2
Strongly
Disagree
1
Don't Know/
N/AMean*
Classified 9 11% 22% 11% 11% 44% 2.60
Management/Supervisory 9 0% 33% 11% 33% 22% 2.00
Less than 5 years 5 0% 40% 20% 20% 20% 2.25
5 to 10 years 4 25% 25% 0% 0% 50% 3.50
11 to 19 years 6 0% 33% 17% 17% 33% 2.25
20 years or more 3 0% 0% 0% 67% 33% 1.00
TOTAL 18 6% 28% 11% 22% 33% 2.25
Classified 9 0% 67% 22% 11% 0% 2.56
Management/Supervisory 9 22% 56% 0% 11% 11% 3.00
Less than 5 years 5 20% 60% 20% 0% 0% 3.00
5 to 10 years 4 0% 75% 25% 0% 0% 2.75
11 to 19 years 6 0% 67% 0% 17% 17% 2.60
20 years or more 3 33% 33% 0% 33% 0% 2.67
TOTAL 18 11% 61% 11% 11% 6% 2.76
Classified 9 0% 56% 33% 11% 0% 2.44
Management/Supervisory 9 33% 56% 0% 0% 11% 3.38
Less than 5 years 5 20% 40% 40% 0% 0% 2.80
5 to 10 years 4 25% 50% 25% 0% 0% 3.00
11 to 19 years 6 0% 83% 0% 0% 17% 3.00
20 years or more 3 33% 33% 0% 33% 0% 2.67
TOTAL 18 17% 56% 17% 6% 6% 2.88
Classified 9 0% 22% 22% 0% 56% 2.50
Management/Supervisory 9 0% 11% 11% 44% 33% 1.50
Less than 5 years 5 0% 0% 40% 20% 40% 1.67
5 to 10 years 4 0% 25% 25% 0% 50% 2.50
11 to 19 years 6 0% 33% 0% 33% 33% 2.00
20 years or more 3 0% 0% 0% 33% 67% 1.00
TOTAL 18 0% 17% 17% 22% 44% 1.90
a. District Services delivers instruction in a way that maximizes the financial health of the district.
Respondents' level of agreement about the delivery of education and support services to students
in relation to the financial health of District Services:
c. I understand the relationship between average class size and the ability of the district to provide competitive salary
and benefits, adequate instructional supplies, and afford new program development.
d. Decisions related to educational quality, class size, and support staffing are made at the appropriate level.
b. I understand the relationship of class size, support services, and educational quality with the district's financial
health.
* Average of responses from 1 to 4, 1 being "Strongly disagree" and 4 being "Strongly agree". "Don't know/N/A" responses were excluded
from the calculation of the mean.
The Collaborative Brain Trust 102
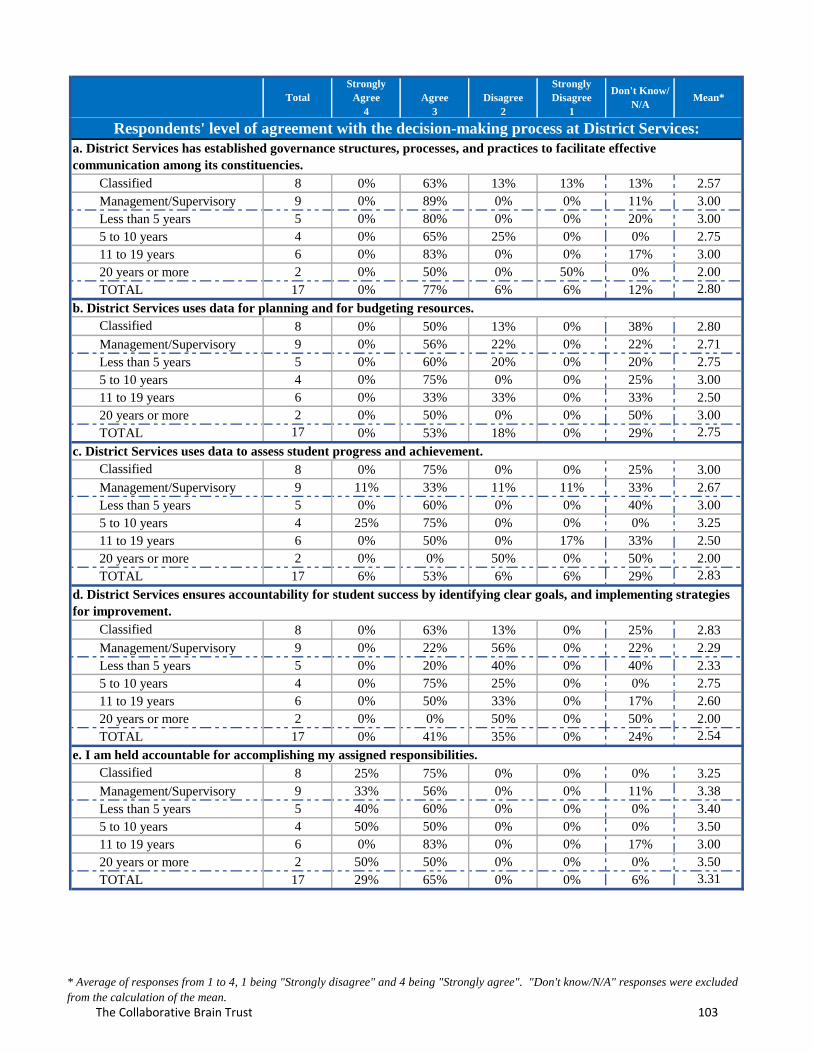
Total
Strongly
Agree
4
Agree
3
Disagree
2
Strongly
Disagree
1
Don't Know/
N/AMean*
Classified 8 0% 63% 13% 13% 13% 2.57
Management/Supervisory 9 0% 89% 0% 0% 11% 3.00
Less than 5 years 5 0% 80% 0% 0% 20% 3.00
5 to 10 years 4 0% 65% 25% 0% 0% 2.75
11 to 19 years 6 0% 83% 0% 0% 17% 3.00
20 years or more 2 0% 50% 0% 50% 0% 2.00
TOTAL 17 0% 77% 6% 6% 12% 2.80
Classified 8 0% 50% 13% 0% 38% 2.80
Management/Supervisory 9 0% 56% 22% 0% 22% 2.71
Less than 5 years 5 0% 60% 20% 0% 20% 2.75
5 to 10 years 4 0% 75% 0% 0% 25% 3.00
11 to 19 years 6 0% 33% 33% 0% 33% 2.50
20 years or more 2 0% 50% 0% 0% 50% 3.00
TOTAL 17 0% 53% 18% 0% 29% 2.75
c. District Services uses data to assess student progress and achievement.
Classified 8 0% 75% 0% 0% 25% 3.00
Management/Supervisory 9 11% 33% 11% 11% 33% 2.67
Less than 5 years 5 0% 60% 0% 0% 40% 3.00
5 to 10 years 4 25% 75% 0% 0% 0% 3.25
11 to 19 years 6 0% 50% 0% 17% 33% 2.50
20 years or more 2 0% 0% 50% 0% 50% 2.00
TOTAL 17 6% 53% 6% 6% 29% 2.83
Classified 8 0% 63% 13% 0% 25% 2.83
Management/Supervisory 9 0% 22% 56% 0% 22% 2.29
Less than 5 years 5 0% 20% 40% 0% 40% 2.33
5 to 10 years 4 0% 75% 25% 0% 0% 2.75
11 to 19 years 6 0% 50% 33% 0% 17% 2.60
20 years or more 2 0% 0% 50% 0% 50% 2.00
TOTAL 17 0% 41% 35% 0% 24% 2.54
Classified 8 25% 75% 0% 0% 0% 3.25
Management/Supervisory 9 33% 56% 0% 0% 11% 3.38
Less than 5 years 5 40% 60% 0% 0% 0% 3.40
5 to 10 years 4 50% 50% 0% 0% 0% 3.50
11 to 19 years 6 0% 83% 0% 0% 17% 3.00
20 years or more 2 50% 50% 0% 0% 0% 3.50
TOTAL 17 29% 65% 0% 0% 6% 3.31
Respondents' level of agreement with the decision-making process at District Services:
a. District Services has established governance structures, processes, and practices to facilitate effective
communication among its constituencies.
b. District Services uses data for planning and for budgeting resources.
d. District Services ensures accountability for student success by identifying clear goals, and implementing strategies
for improvement.
e. I am held accountable for accomplishing my assigned responsibilities.
* Average of responses from 1 to 4, 1 being "Strongly disagree" and 4 being "Strongly agree". "Don't know/N/A" responses were excluded
from the calculation of the mean.
The Collaborative Brain Trust 103
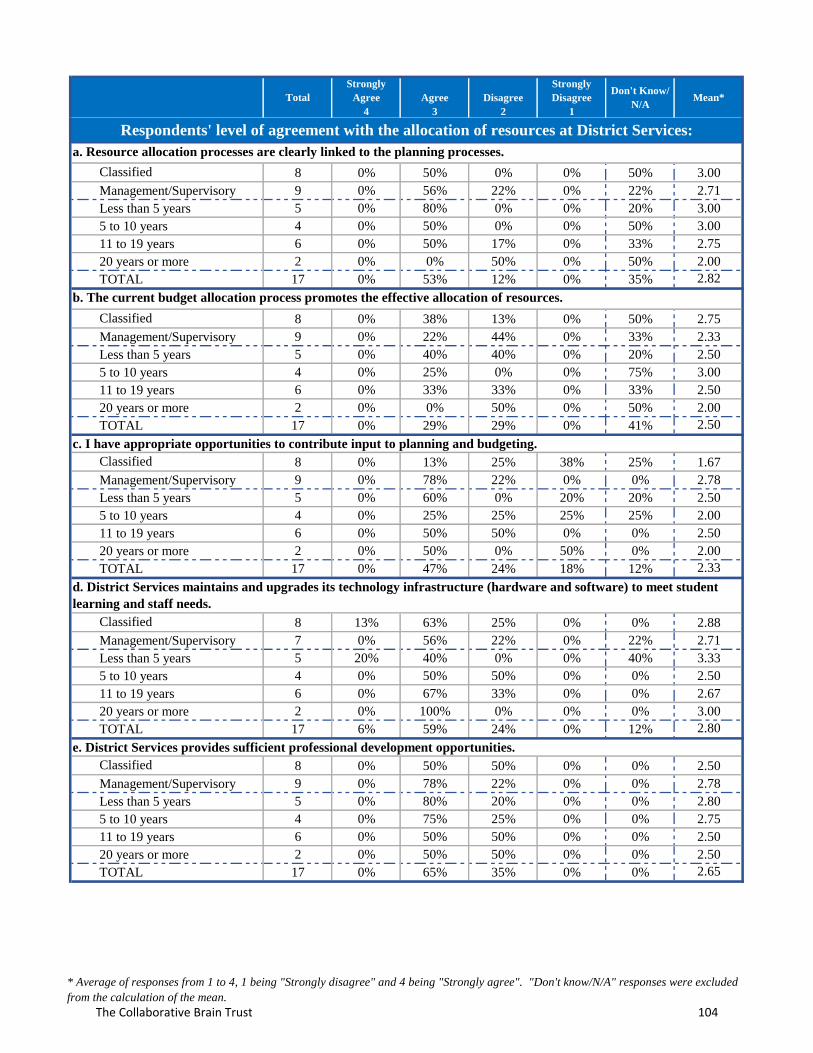
Total
Strongly
Agree
4
Agree
3
Disagree
2
Strongly
Disagree
1
Don't Know/
N/AMean*
Classified 8 0% 50% 0% 0% 50% 3.00
Management/Supervisory 9 0% 56% 22% 0% 22% 2.71
Less than 5 years 5 0% 80% 0% 0% 20% 3.00
5 to 10 years 4 0% 50% 0% 0% 50% 3.00
11 to 19 years 6 0% 50% 17% 0% 33% 2.75
20 years or more 2 0% 0% 50% 0% 50% 2.00
TOTAL 17 0% 53% 12% 0% 35% 2.82
Classified 8 0% 38% 13% 0% 50% 2.75
Management/Supervisory 9 0% 22% 44% 0% 33% 2.33
Less than 5 years 5 0% 40% 40% 0% 20% 2.50
5 to 10 years 4 0% 25% 0% 0% 75% 3.00
11 to 19 years 6 0% 33% 33% 0% 33% 2.50
20 years or more 2 0% 0% 50% 0% 50% 2.00
TOTAL 17 0% 29% 29% 0% 41% 2.50
Classified 8 0% 13% 25% 38% 25% 1.67
Management/Supervisory 9 0% 78% 22% 0% 0% 2.78
Less than 5 years 5 0% 60% 0% 20% 20% 2.50
5 to 10 years 4 0% 25% 25% 25% 25% 2.00
11 to 19 years 6 0% 50% 50% 0% 0% 2.50
20 years or more 2 0% 50% 0% 50% 0% 2.00
TOTAL 17 0% 47% 24% 18% 12% 2.33
Classified 8 13% 63% 25% 0% 0% 2.88
Management/Supervisory 7 0% 56% 22% 0% 22% 2.71
Less than 5 years 5 20% 40% 0% 0% 40% 3.33
5 to 10 years 4 0% 50% 50% 0% 0% 2.50
11 to 19 years 6 0% 67% 33% 0% 0% 2.67
20 years or more 2 0% 100% 0% 0% 0% 3.00
TOTAL 17 6% 59% 24% 0% 12% 2.80
Classified 8 0% 50% 50% 0% 0% 2.50
Management/Supervisory 9 0% 78% 22% 0% 0% 2.78
Less than 5 years 5 0% 80% 20% 0% 0% 2.80
5 to 10 years 4 0% 75% 25% 0% 0% 2.75
11 to 19 years 6 0% 50% 50% 0% 0% 2.50
20 years or more 2 0% 50% 50% 0% 0% 2.50
TOTAL 17 0% 65% 35% 0% 0% 2.65
Respondents' level of agreement with the allocation of resources at District Services:
b. The current budget allocation process promotes the effective allocation of resources.
a. Resource allocation processes are clearly linked to the planning processes.
c. I have appropriate opportunities to contribute input to planning and budgeting.
d. District Services maintains and upgrades its technology infrastructure (hardware and software) to meet student
learning and staff needs.
e. District Services provides sufficient professional development opportunities.
* Average of responses from 1 to 4, 1 being "Strongly disagree" and 4 being "Strongly agree". "Don't know/N/A" responses were excluded
from the calculation of the mean.
The Collaborative Brain Trust 104
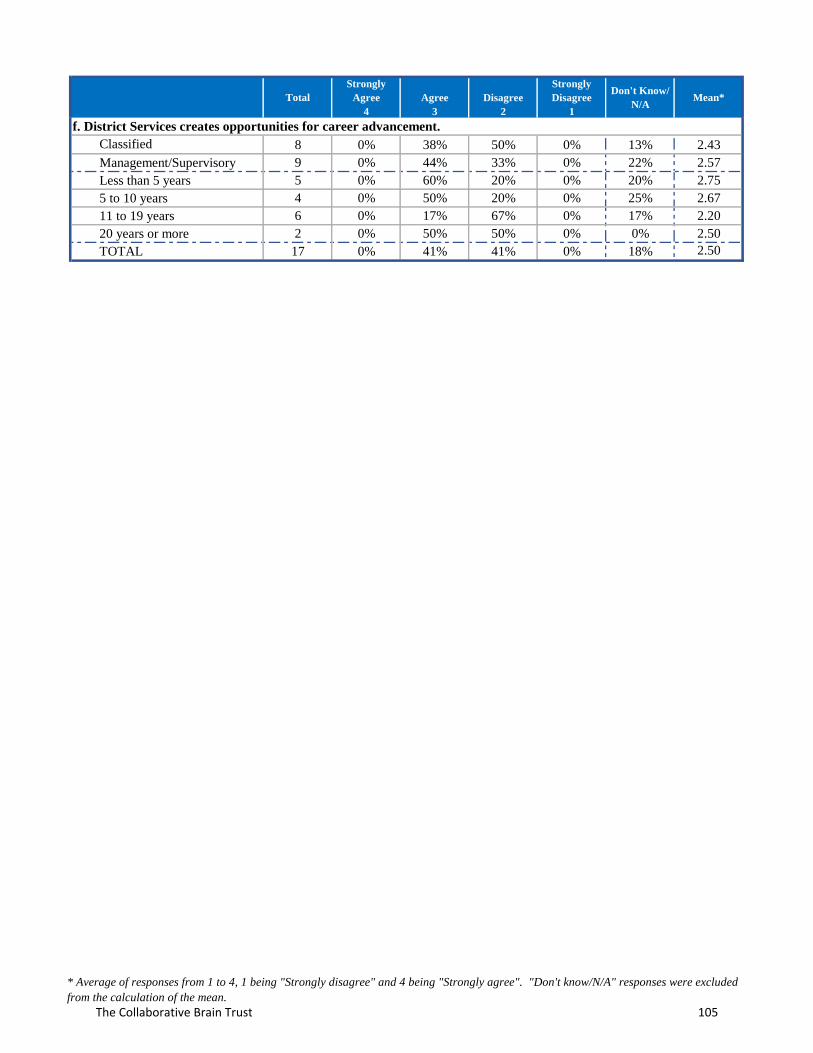
Total
Strongly
Agree
4
Agree
3
Disagree
2
Strongly
Disagree
1
Don't Know/
N/AMean*
Classified 8 0% 38% 50% 0% 13% 2.43
Management/Supervisory 9 0% 44% 33% 0% 22% 2.57
Less than 5 years 5 0% 60% 20% 0% 20% 2.75
5 to 10 years 4 0% 50% 20% 0% 25% 2.67
11 to 19 years 6 0% 17% 67% 0% 17% 2.20
20 years or more 2 0% 50% 50% 0% 0% 2.50
TOTAL 17 0% 41% 41% 0% 18% 2.50
f. District Services creates opportunities for career advancement.
* Average of responses from 1 to 4, 1 being "Strongly disagree" and 4 being "Strongly agree". "Don't know/N/A" responses were excluded
from the calculation of the mean.
The Collaborative Brain Trust 105
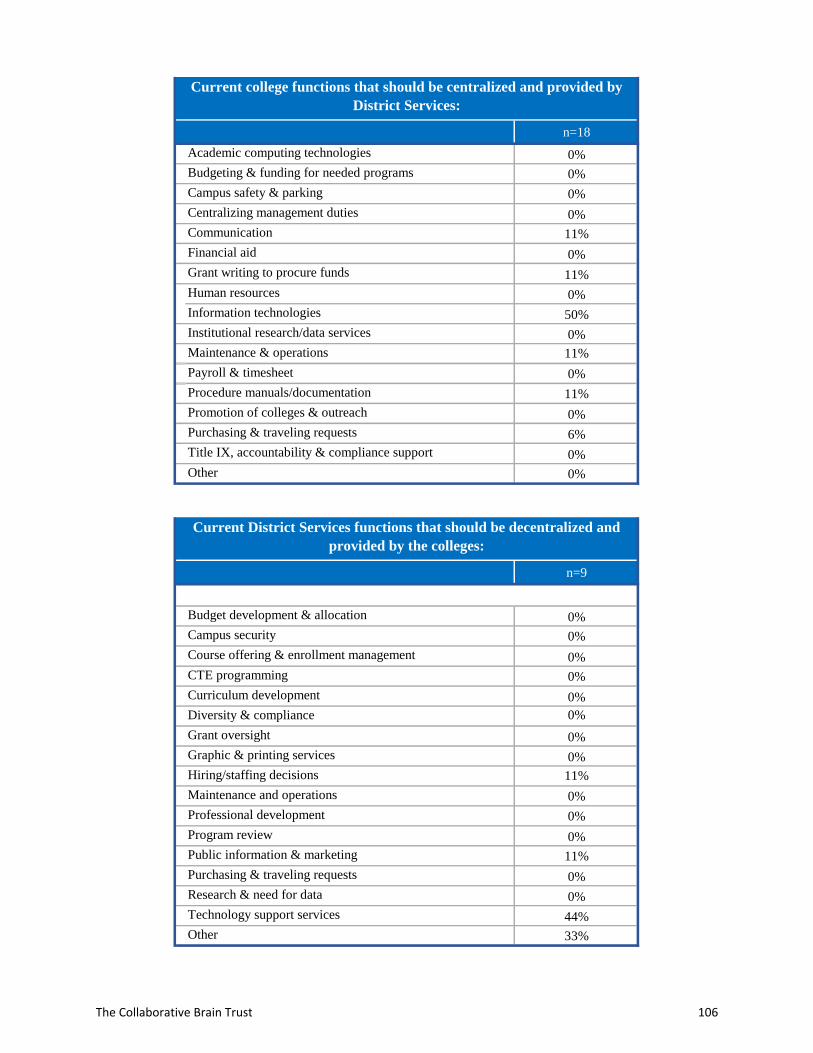
n=18
0%
0%
0%
0%
11%
0%
11%
0%
50%
0%
11%
0%
11%
0%
6%
0%
Other 0%
n=9
0%
0%
0%
0%
0%
0%
0%
0%
11%
0%
0%
0%
11%
0%
0%
44%
33%
Purchasing & traveling requests
Research & need for data
Technology support services
Other
Hiring/staffing decisions
Maintenance and operations
Professional development
Program review
Public information & marketing
CTE programming
Curriculum development
Diversity & compliance
Grant oversight
Graphic & printing services
Budget development & allocation
Campus security
Course offering & enrollment management
Procedure manuals/documentation
Promotion of colleges & outreach
Purchasing & traveling requests
Title IX, accountability & compliance support
Current District Services functions that should be decentralized and
provided by the colleges:
Human resources
Information technologies
Institutional research/data services
Maintenance & operations
Payroll & timesheet
Centralizing management duties
Communication
Financial aid
Grant writing to procure funds
Current college functions that should be centralized and provided by
District Services:
Academic computing technologies
Budgeting & funding for needed programs
Campus safety & parking
The Collaborative Brain Trust 106
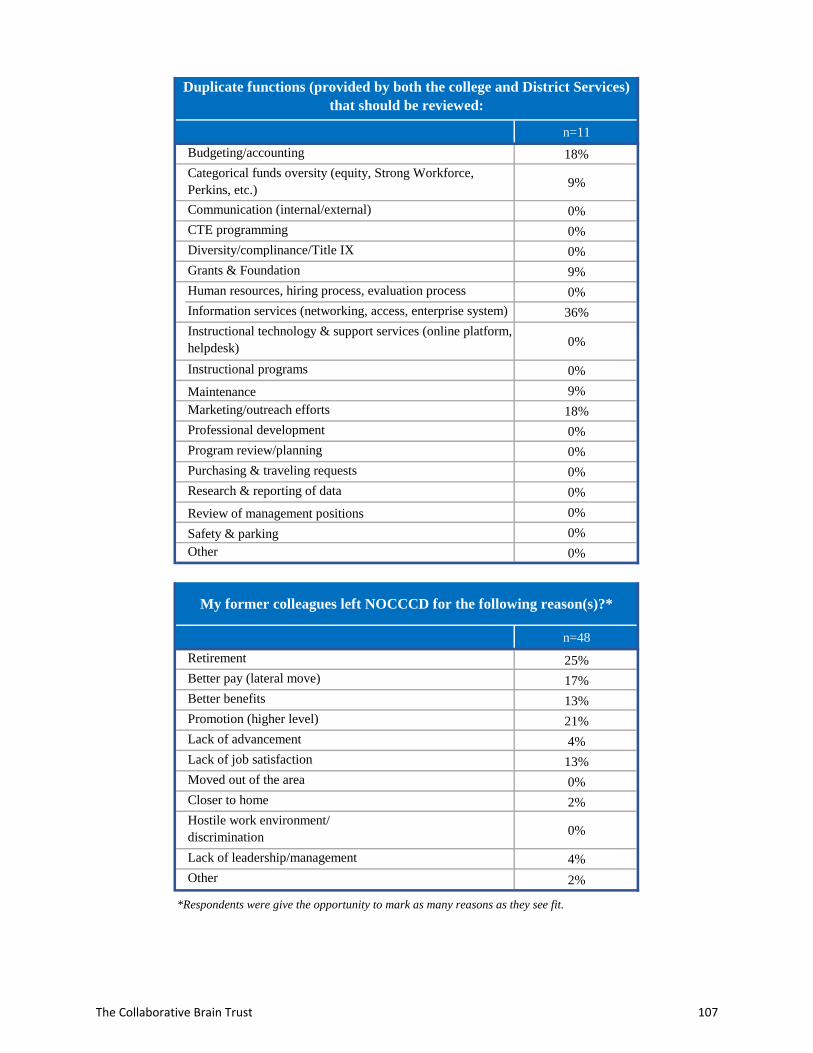
n=11
18%
9%
0%
0%
0%
9%
0%
36%
0%
0%
9%
18%
0%
0%
0%
0%
0%
0%
0%
n=48
Retirement 25%
Better pay (lateral move) 17%
Better benefits 13%
Promotion (higher level) 21%
Lack of advancement 4%
Lack of job satisfaction 13%
Moved out of the area 0%
Closer to home 2%
0%
4%
2%
*Respondents were give the opportunity to mark as many reasons as they see fit.
My former colleagues left NOCCCD for the following reason(s)?*
Hostile work environment/
discrimination
Lack of leadership/management
Other
Purchasing & traveling requests
Research & reporting of data
Review of management positions
Safety & parking
Other
Instructional programs
Maintenance
Marketing/outreach efforts
Professional development
Program review/planning
Diversity/complinance/Title IX
Grants & Foundation
Human resources, hiring process, evaluation process
Information services (networking, access, enterprise system)
Instructional technology & support services (online platform,
helpdesk)
Budgeting/accounting
Categorical funds oversity (equity, Strong Workforce,
Perkins, etc.)
Communication (internal/external)
CTE programming
Duplicate functions (provided by both the college and District Services)
that should be reviewed:
The Collaborative Brain Trust 107
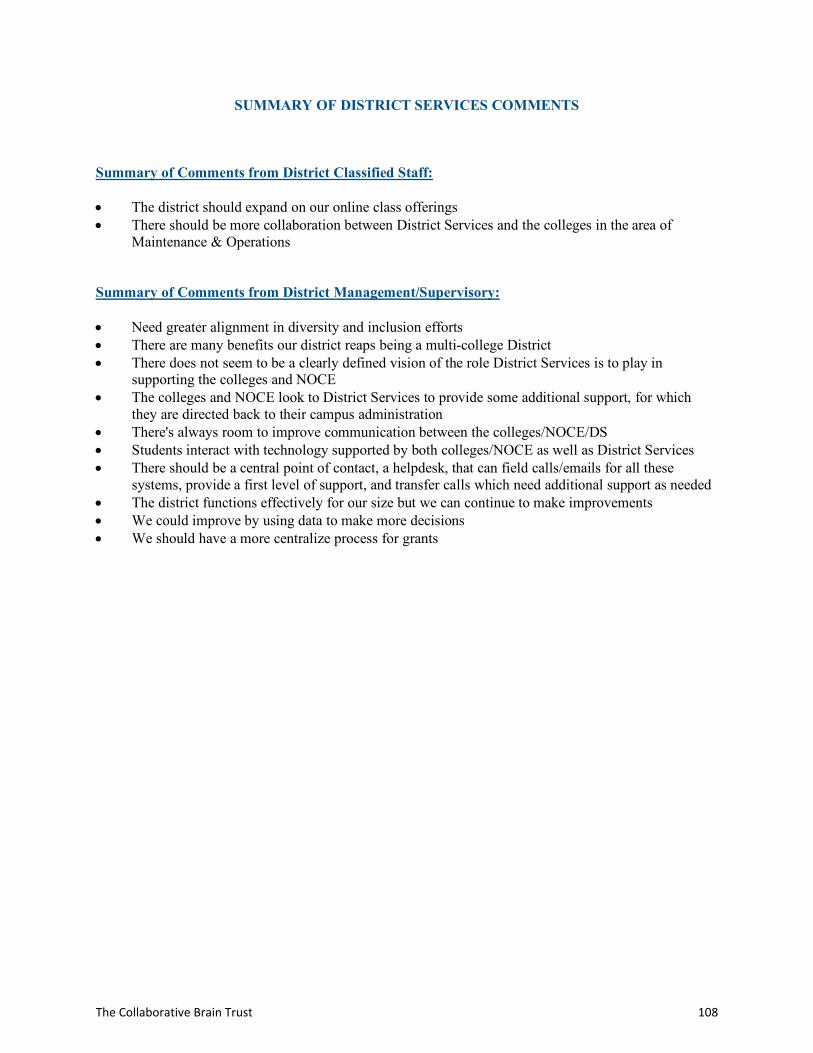
SUMMARY OF DISTRICT SERVICES COMMENTS
Summary of Comments from District Classified Staff:
• The district should expand on our online class offerings• There should be more collaboration between District Services and the colleges in the area of
Maintenance & Operations
Summary of Comments from District Management/Supervisory:
• Need greater alignment in diversity and inclusion efforts• There are many benefits our district reaps being a multi-college District• There does not seem to be a clearly defined vision of the role District Services is to play in
supporting the colleges and NOCE• The colleges and NOCE look to District Services to provide some additional support, for which
they are directed back to their campus administration• There's always room to improve communication between the colleges/NOCE/DS• Students interact with technology supported by both colleges/NOCE as well as District Services• There should be a central point of contact, a helpdesk, that can field calls/emails for all these
systems, provide a first level of support, and transfer calls which need additional support as needed• The district functions effectively for our size but we can continue to make improvements• We could improve by using data to make more decisions• We should have a more centralize process for grants
The Collaborative Brain Trust 108

APPENDIX G G. Survey Results for Fullerton College
The Collaborative Brain Trust 109
North Orange County Community College District
Results of the Organizational Structure Survey
for Fullerton College
Spring 2018
North Orange County Community College District is conducting a comprehensive organizational
structure to ensure it is serving its students and community effectively and efficiently. A
component of such a review requires multiple perspectives, including the perspective of those
who work within the organization. In early February 2018, all full-time faculty and staff were
invited to share their opinions of the District and its Colleges via an online survey.
During a three-week period, 516 staff and faculty shared their understanding, compliments, and
concerns about the existing structure of their department, the Colleges, as well as the District
Services. Of those, 246 Fullerton College employees participated, including from employees of
different employment classifications, and from employees grouped by years of employment:
Slightly more than half of the respondents were faculty, 34% classified/confidential, and
15% were management/supervisory; and
More than three-fourths (29%) have been employed at the college less than five years,
17% from 5 to 10 years, 31% 11 to 19 years and 23% have been with Fullerton College
for more than 20 years.
This report summarizes the findings of the 246 respondents’ feedback on organizational structure
issues relating specifically to Fullerton College. Overall, respondents somewhat agreed that the
District’s, the College’s, and their department’s organizational structure works, but that there is
room for improvement. Respondents were generous in sharing their comments, compliments and
concerns. The comments may prove helpful as the college considers refining its structures for
efficiency and effectiveness.
About Respondents’ Work Location of Fullerton College:
Many respondents stated that student needs are the main focus of their workplace (mean
of 3.52, on a scale of 1 to 4, 1 being “strongly disagree” and 4 being “strongly agree”),
that they engage in program reviews regularly (3.32) and that they use data to enhance
the effectiveness of the department (3.12).
Respondents somewhat agreed that management encourages employees to take initiative
to improve institutional effectiveness (3.00) or that their workplace has established
governance structures, processes and practices to facilitate effective communication
(2.88).
There were minor differences in ratings among the different employee groups and the
respondents grouped by years of service at the college.
Organizational Structure at the Department Level:
Respondents stated that there is adequate administration oversight (3.03) and that the
organizational structure within their department is clear and understandable (2.94).
The Collaborative Brain Trust 110
However, respondents indicated less agreement that their department is adequately
staffed to implement and advance its mission (2.44), that responsibilities are evenly
distributed among staff within the department (2.49), or that the department has too many
interim management assignments (2.16).
There were minor differences among the different employee groups and the
respondents grouped by years of services. Classified staff noted slightly less
agreement that there is adequate administrative oversight in their department
(2.91 vs. 3.07 and 3.14 for faculty and management/supervisory respectively).
Organizational Structure at the College Level:
Respondents agreed that there is adequate administrative oversight at the college (2.94),
that the current organizational structure of the college level works well (2.76), and that
information across the departments is not disseminated in a timely manner, leaving the
respondents uninformed (2.75).
Some respondents noted that the College somewhat evaluated vacant positions to
determine whether or not each can be combined with another similar position (2.61), has
too many interim assignments within its management level (2.61), and fairly adequate
staffing to implement and advance its mission (2.60),
Management/supervisory were more likely than faculty to agree that the college
does evaluate vacant positions (2.94 vs. 2.42 respectively).
The management/supervisory and those employed more than 20 years at Fullerton
College were more in agreement that there are too many interim positions among
management (2.84 and 2.74 respectively vs. 2.62 overall).
There was an indication that responsibilities are not evenly distributed across departments
(2.35) and that there is unnecessary duplication of services among departments (2.46).
The management/supervisory employee group indicated less agreement than the
other employee groups (2.16 vs. 2.37 and 2.42 for faculty and classified
respectively) that responsibilities are distributed across departments evenly.
Organizational Structure at the District Services:
Respondents noted that the District effectively communicates and advocates for the
Colleges in the community and at the state level (2.81) and that District Services is
adequately staffed to implement and advance its mission (2.69).
District Services respondents did not rate their agreement as high that they are
adequately staffed (2.11 vs. 2.69 to 2.77 from the other locations).
Respondents did not find information between District Services and the College to be
disseminated in a timely manner and that they are not kept informed of changes within
the District (2.59 and 2.54 respectively).
Respondents employed more than 20 years at Fullerton College were in less
agreement than the other sub-groups for these two categories.
Respondents noted some agreement in that District Services adequately supports the
work of the Colleges (2.59), that the current balance of centralization and decentralization
between District Services and the Colleges works well (2.45) and that the division of
labor between the two units is clear and understandable (2.42).
The Collaborative Brain Trust 111
Delivery of Education and Support Services to Students in Relation to Financial Health:
Respondents understood the relationship of class size, support services, and educational
quality with the district’s financial health (2.89), but slightly less agreement in their
understanding of the relationship between average class size and the ability of the district
to provide competitive salary and benefits, adequate instructional supplies, and afford
new program development (2.75).
The management/supervisory group had a slightly higher understanding than the
other sub-groups about these two areas (3.35 and 3.22 respectively).
Respondents somewhat agreed that the college delivers instruction in a way that
maximizes the financial health of the district (2.82) and much less agreement in that
decisions related to educational quality, class size, and supporting staffing are made at the
appropriate level (2.49).
Faculty rated lower agreement than the other sub-groups that decision making is made at
the appropriate level (2.42 vs. 2.56 and 2.60 for classified and management/supervisory
respectively).
Decision-Making Process at Fullerton College:
Many respondents agreed that they are held accountable for accomplishing their assigned
responsibilities (3.42), but slightly less agreement in that the College ensures
accountability for student success by identifying clear goals and implementing strategies
for improvement (2.99).
Classified staff and those who have been employed at the district for less than five
years were slightly more agreeable than those in the other sub-groups.
The College uses data to assess student progress and achievement (3.10), as well as to
plan and to budget resources (2.98).
Respondents also agreed that the College has established governance structures,
processes and practices to facilitate effective communication among its constituencies
(2.88).
Respondents employed at Fullerton College more than 20 years rated every question
consistently lower than the other sub-groups regarding the decision-making process.
Allocation of Resources at Fullerton College:
Respondents agreed that the College provides sufficient professional development
opportunities (2.92), but somewhat agreed that the College creates opportunities for
career advancement. There were minor differences among the sub-groups.
Respondents were somewhat in agreement that the current budget allocation processes
are clearly linked to the planning processes (2.62), but slightly lower agreement that it
promotes the effective allocation of resources (2.48) and that there are appropriate
opportunities to contribute input to planning and budgeting at the college (2.45).
Many respondents also did not agree that the College maintains and upgrades its
technology infrastructure to meet student learning and staff needs (2.32 respectively).
Respondents employed at the District for 20+ years were consistently slightly less
agreeable than those of other sub-groups in every question in this section,
The Collaborative Brain Trust 112
Alignment of District Services and College Functions:
Information technologies, budgeting and funding for needed programs, human resources,
communications, grants writing and safety were among the functions that Fullerton
College respondents would like to see centralized and offered by District Services. A
comprehensive list of other functions can be found on page 16.
Information technology services, budget development and allocation of funds, public
information/marketing, professional development (new instructional strategies,
conferences, training in the use of technology), and curriculum development were among
the services respondents would like to see decentralized and offered at the colleges. A
comprehensive list of other functions can be found on page 16.
Budget development and allocation, information technology and instructional support
services, human resources and hiring/staffing decisions, and Title IX and compliance
were duplicate functions that should be reviewed for effectiveness. A comprehensive list
of other functions can be found on page 17.
Other than the one-fifth of responses noting retirement, respondents identified major
reasons that former colleagues left the College due to better pay for lateral move (21%),
better benefits (17%), promotion to higher level (13%), and lack of advancement (10%).
There was an additional 12% of respondents that identified lack of job
satisfaction, hostile work environment and lack of leadership as the causes of
former employees leaving.
Respondent comments: Below are some observations from comments made by Fullerton College respondents. A
completed list of comments, by employee group and by college location, can be found on pages
18 to 28.
Staff expressed frustration when dealing with some of the District Services, such as
human resources and IT. They do not get a response to their requests in a timely manner,
nor do they feel the district staff plans meetings or trainings with consideration to the
activities, schedules, and needs of the colleges.
Human resources, payroll, and purchasing processes take too much time.
There is a lack of documentation of many processes and procedures.
Respondents noted there are too many interim management positions.
There were suggestions that the College needs to review various positions to
ensure fair wages for like positions.
There is a perception that decisions made at the District level do not include input from
college staff and faculty.
Communication between the Colleges and the District and between departments at the
College is limited and that respondents are uninformed.
Respondents did not understand many of the programs and services at District Services
and, therefore, question the need for the programs and personnel.
The College has not been able to hire the most qualified candidates due to low pay and
benefits. They also feel hiring decisions should be made at the College.
There are indications that employees have left due to the lack of benefits
coverages for dependents and low wages for the amount of work assigned.
Safety/security, compliance and workplace environment need more oversight.
Some respondents stated the need for oversight of various grants (equity, SSSP,
workforce development, etc.).
The Collaborative Brain Trust 113
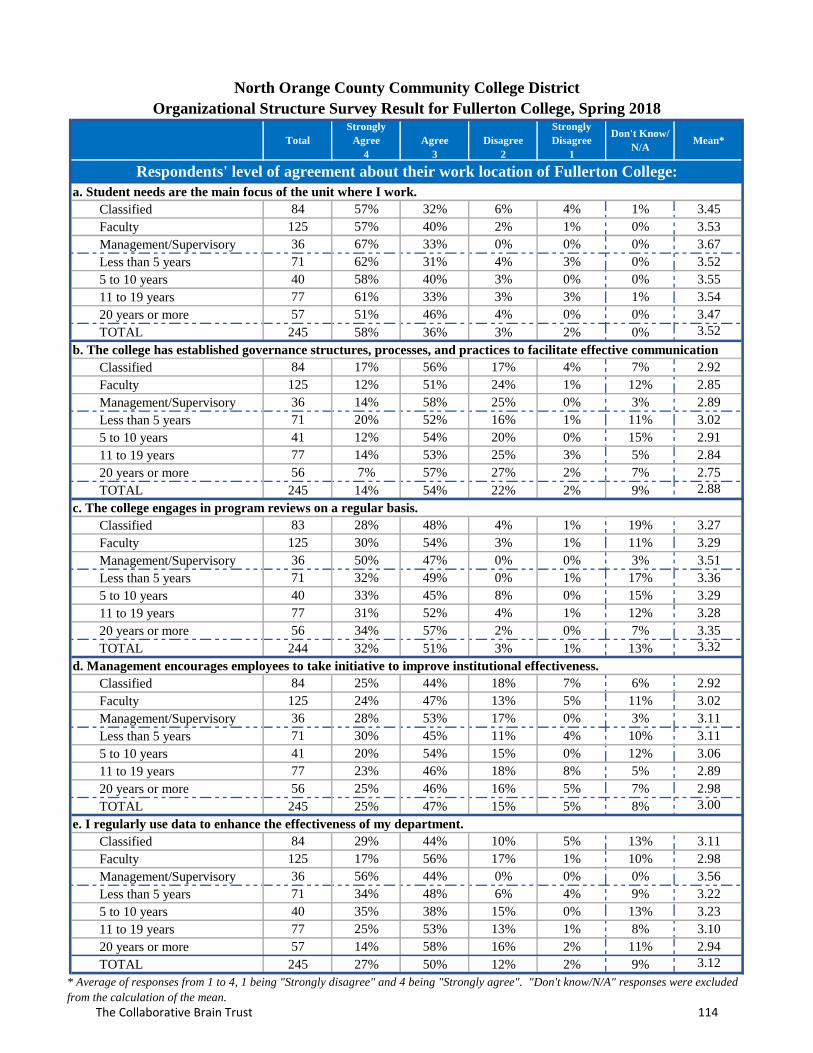
Total
Strongly
Agree
4
Agree
3
Disagree
2
Strongly
Disagree
1
Don't Know/
N/AMean*
Classified 84 57% 32% 6% 4% 1% 3.45
Faculty 125 57% 40% 2% 1% 0% 3.53
Management/Supervisory 36 67% 33% 0% 0% 0% 3.67
Less than 5 years 71 62% 31% 4% 3% 0% 3.52
5 to 10 years 40 58% 40% 3% 0% 0% 3.55
11 to 19 years 77 61% 33% 3% 3% 1% 3.54
20 years or more 57 51% 46% 4% 0% 0% 3.47
TOTAL 245 58% 36% 3% 2% 0% 3.52
Classified 84 17% 56% 17% 4% 7% 2.92
Faculty 125 12% 51% 24% 1% 12% 2.85
Management/Supervisory 36 14% 58% 25% 0% 3% 2.89
Less than 5 years 71 20% 52% 16% 1% 11% 3.02
5 to 10 years 41 12% 54% 20% 0% 15% 2.91
11 to 19 years 77 14% 53% 25% 3% 5% 2.84
20 years or more 56 7% 57% 27% 2% 7% 2.75
TOTAL 245 14% 54% 22% 2% 9% 2.88
Classified 83 28% 48% 4% 1% 19% 3.27
Faculty 125 30% 54% 3% 1% 11% 3.29
Management/Supervisory 36 50% 47% 0% 0% 3% 3.51
Less than 5 years 71 32% 49% 0% 1% 17% 3.36
5 to 10 years 40 33% 45% 8% 0% 15% 3.29
11 to 19 years 77 31% 52% 4% 1% 12% 3.28
20 years or more 56 34% 57% 2% 0% 7% 3.35
TOTAL 244 32% 51% 3% 1% 13% 3.32
Classified 84 25% 44% 18% 7% 6% 2.92
Faculty 125 24% 47% 13% 5% 11% 3.02
Management/Supervisory 36 28% 53% 17% 0% 3% 3.11
Less than 5 years 71 30% 45% 11% 4% 10% 3.11
5 to 10 years 41 20% 54% 15% 0% 12% 3.06
11 to 19 years 77 23% 46% 18% 8% 5% 2.89
20 years or more 56 25% 46% 16% 5% 7% 2.98
TOTAL 245 25% 47% 15% 5% 8% 3.00
Classified 84 29% 44% 10% 5% 13% 3.11
Faculty 125 17% 56% 17% 1% 10% 2.98
Management/Supervisory 36 56% 44% 0% 0% 0% 3.56
Less than 5 years 71 34% 48% 6% 4% 9% 3.22
5 to 10 years 40 35% 38% 15% 0% 13% 3.23
11 to 19 years 77 25% 53% 13% 1% 8% 3.10
20 years or more 57 14% 58% 16% 2% 11% 2.94
TOTAL 245 27% 50% 12% 2% 9% 3.12
Respondents' level of agreement about their work location of Fullerton College:
b. The college has established governance structures, processes, and practices to facilitate effective communication
c. The college engages in program reviews on a regular basis.
d. Management encourages employees to take initiative to improve institutional effectiveness.
e. I regularly use data to enhance the effectiveness of my department.
North Orange County Community College District
Organizational Structure Survey Result for Fullerton College, Spring 2018
a. Student needs are the main focus of the unit where I work.
* Average of responses from 1 to 4, 1 being "Strongly disagree" and 4 being "Strongly agree". "Don't know/N/A" responses were excluded
from the calculation of the mean.
The Collaborative Brain Trust 114
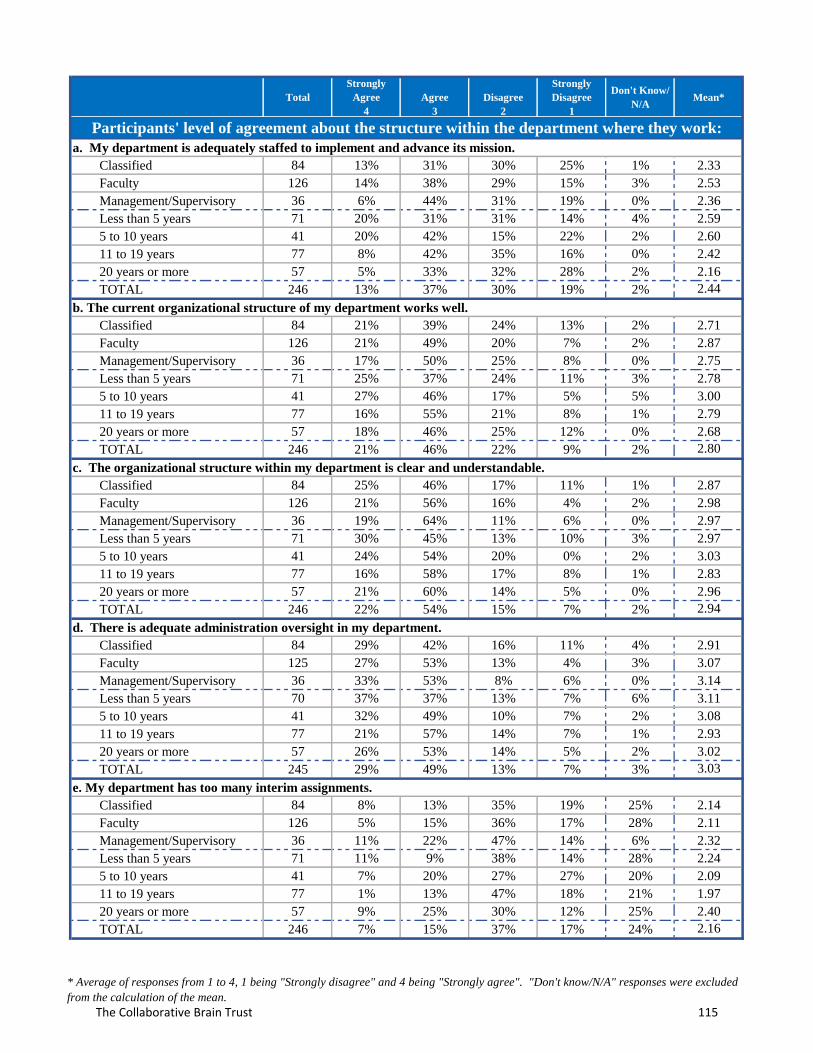
Total
Strongly
Agree
4
Agree
3
Disagree
2
Strongly
Disagree
1
Don't Know/
N/AMean*
a. My department is adequately staffed to implement and advance its mission.
Classified 84 13% 31% 30% 25% 1% 2.33
Faculty 126 14% 38% 29% 15% 3% 2.53
Management/Supervisory 36 6% 44% 31% 19% 0% 2.36
Less than 5 years 71 20% 31% 31% 14% 4% 2.59
5 to 10 years 41 20% 42% 15% 22% 2% 2.60
11 to 19 years 77 8% 42% 35% 16% 0% 2.42
20 years or more 57 5% 33% 32% 28% 2% 2.16
TOTAL 246 13% 37% 30% 19% 2% 2.44
Classified 84 21% 39% 24% 13% 2% 2.71
Faculty 126 21% 49% 20% 7% 2% 2.87
Management/Supervisory 36 17% 50% 25% 8% 0% 2.75
Less than 5 years 71 25% 37% 24% 11% 3% 2.78
5 to 10 years 41 27% 46% 17% 5% 5% 3.00
11 to 19 years 77 16% 55% 21% 8% 1% 2.79
20 years or more 57 18% 46% 25% 12% 0% 2.68
TOTAL 246 21% 46% 22% 9% 2% 2.80
Classified 84 25% 46% 17% 11% 1% 2.87
Faculty 126 21% 56% 16% 4% 2% 2.98
Management/Supervisory 36 19% 64% 11% 6% 0% 2.97
Less than 5 years 71 30% 45% 13% 10% 3% 2.97
5 to 10 years 41 24% 54% 20% 0% 2% 3.03
11 to 19 years 77 16% 58% 17% 8% 1% 2.83
20 years or more 57 21% 60% 14% 5% 0% 2.96
TOTAL 246 22% 54% 15% 7% 2% 2.94
d. There is adequate administration oversight in my department.
Classified 84 29% 42% 16% 11% 4% 2.91
Faculty 125 27% 53% 13% 4% 3% 3.07
Management/Supervisory 36 33% 53% 8% 6% 0% 3.14
Less than 5 years 70 37% 37% 13% 7% 6% 3.11
5 to 10 years 41 32% 49% 10% 7% 2% 3.08
11 to 19 years 77 21% 57% 14% 7% 1% 2.93
20 years or more 57 26% 53% 14% 5% 2% 3.02
TOTAL 245 29% 49% 13% 7% 3% 3.03
e. My department has too many interim assignments.
Classified 84 8% 13% 35% 19% 25% 2.14
Faculty 126 5% 15% 36% 17% 28% 2.11
Management/Supervisory 36 11% 22% 47% 14% 6% 2.32
Less than 5 years 71 11% 9% 38% 14% 28% 2.24
5 to 10 years 41 7% 20% 27% 27% 20% 2.09
11 to 19 years 77 1% 13% 47% 18% 21% 1.97
20 years or more 57 9% 25% 30% 12% 25% 2.40
TOTAL 246 7% 15% 37% 17% 24% 2.16
b. The current organizational structure of my department works well.
c. The organizational structure within my department is clear and understandable.
Participants' level of agreement about the structure within the department where they work:
* Average of responses from 1 to 4, 1 being "Strongly disagree" and 4 being "Strongly agree". "Don't know/N/A" responses were excluded
from the calculation of the mean.
The Collaborative Brain Trust 115

Total
Strongly
Agree
4
Agree
3
Disagree
2
Strongly
Disagree
1
Don't Know/
N/AMean*
f. Responsibilities are evenly distributed among staff within my department.
Classified 84 13% 32% 35% 17% 4% 2.43
Faculty 126 10% 35% 25% 15% 15% 2.46
Management/Supervisory 36 8% 64% 19% 8% 0% 2.72
Less than 5 years 71 20% 39% 18% 14% 9% 2.71
5 to 10 years 41 15% 34% 29% 12% 10% 2.57
11 to 19 years 77 7% 39% 30% 18% 7% 2.36
20 years or more 57 2% 39% 35% 12% 12% 2.34
TOTAL 246 11% 38% 28% 15% 9% 2.49
* Average of responses from 1 to 4, 1 being "Strongly disagree" and 4 being "Strongly agree". "Don't know/N/A" responses were excluded
from the calculation of the mean.
The Collaborative Brain Trust 116
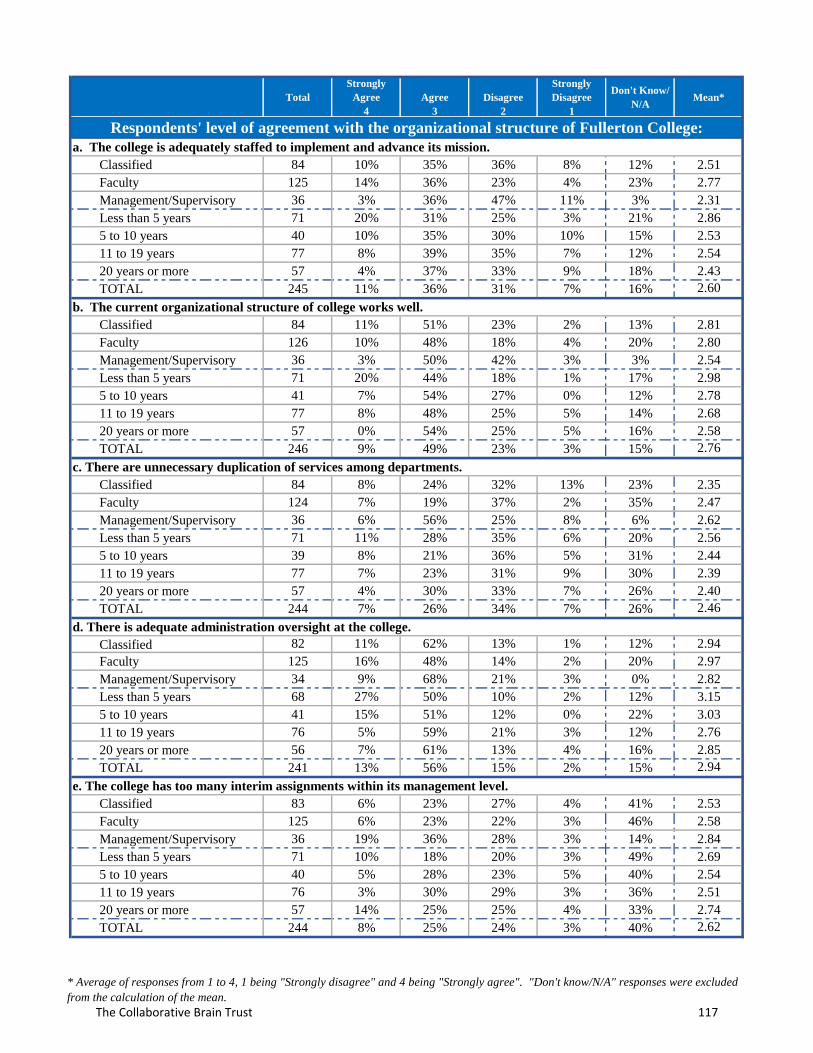
Total
Strongly
Agree
4
Agree
3
Disagree
2
Strongly
Disagree
1
Don't Know/
N/AMean*
a. The college is adequately staffed to implement and advance its mission.
Classified 84 10% 35% 36% 8% 12% 2.51
Faculty 125 14% 36% 23% 4% 23% 2.77
Management/Supervisory 36 3% 36% 47% 11% 3% 2.31
Less than 5 years 71 20% 31% 25% 3% 21% 2.86
5 to 10 years 40 10% 35% 30% 10% 15% 2.53
11 to 19 years 77 8% 39% 35% 7% 12% 2.54
20 years or more 57 4% 37% 33% 9% 18% 2.43
TOTAL 245 11% 36% 31% 7% 16% 2.60
b. The current organizational structure of college works well.
Classified 84 11% 51% 23% 2% 13% 2.81
Faculty 126 10% 48% 18% 4% 20% 2.80
Management/Supervisory 36 3% 50% 42% 3% 3% 2.54
Less than 5 years 71 20% 44% 18% 1% 17% 2.98
5 to 10 years 41 7% 54% 27% 0% 12% 2.78
11 to 19 years 77 8% 48% 25% 5% 14% 2.68
20 years or more 57 0% 54% 25% 5% 16% 2.58
TOTAL 246 9% 49% 23% 3% 15% 2.76
c. There are unnecessary duplication of services among departments.
Classified 84 8% 24% 32% 13% 23% 2.35
Faculty 124 7% 19% 37% 2% 35% 2.47
Management/Supervisory 36 6% 56% 25% 8% 6% 2.62
Less than 5 years 71 11% 28% 35% 6% 20% 2.56
5 to 10 years 39 8% 21% 36% 5% 31% 2.44
11 to 19 years 77 7% 23% 31% 9% 30% 2.39
20 years or more 57 4% 30% 33% 7% 26% 2.40
TOTAL 244 7% 26% 34% 7% 26% 2.46
d. There is adequate administration oversight at the college.
Classified 82 11% 62% 13% 1% 12% 2.94
Faculty 125 16% 48% 14% 2% 20% 2.97
Management/Supervisory 34 9% 68% 21% 3% 0% 2.82
Less than 5 years 68 27% 50% 10% 2% 12% 3.15
5 to 10 years 41 15% 51% 12% 0% 22% 3.03
11 to 19 years 76 5% 59% 21% 3% 12% 2.76
20 years or more 56 7% 61% 13% 4% 16% 2.85
TOTAL 241 13% 56% 15% 2% 15% 2.94
e. The college has too many interim assignments within its management level.
Classified 83 6% 23% 27% 4% 41% 2.53
Faculty 125 6% 23% 22% 3% 46% 2.58
Management/Supervisory 36 19% 36% 28% 3% 14% 2.84
Less than 5 years 71 10% 18% 20% 3% 49% 2.69
5 to 10 years 40 5% 28% 23% 5% 40% 2.54
11 to 19 years 76 3% 30% 29% 3% 36% 2.51
20 years or more 57 14% 25% 25% 4% 33% 2.74
TOTAL 244 8% 25% 24% 3% 40% 2.62
Respondents' level of agreement with the organizational structure of Fullerton College:
* Average of responses from 1 to 4, 1 being "Strongly disagree" and 4 being "Strongly agree". "Don't know/N/A" responses were excluded
from the calculation of the mean.
The Collaborative Brain Trust 117
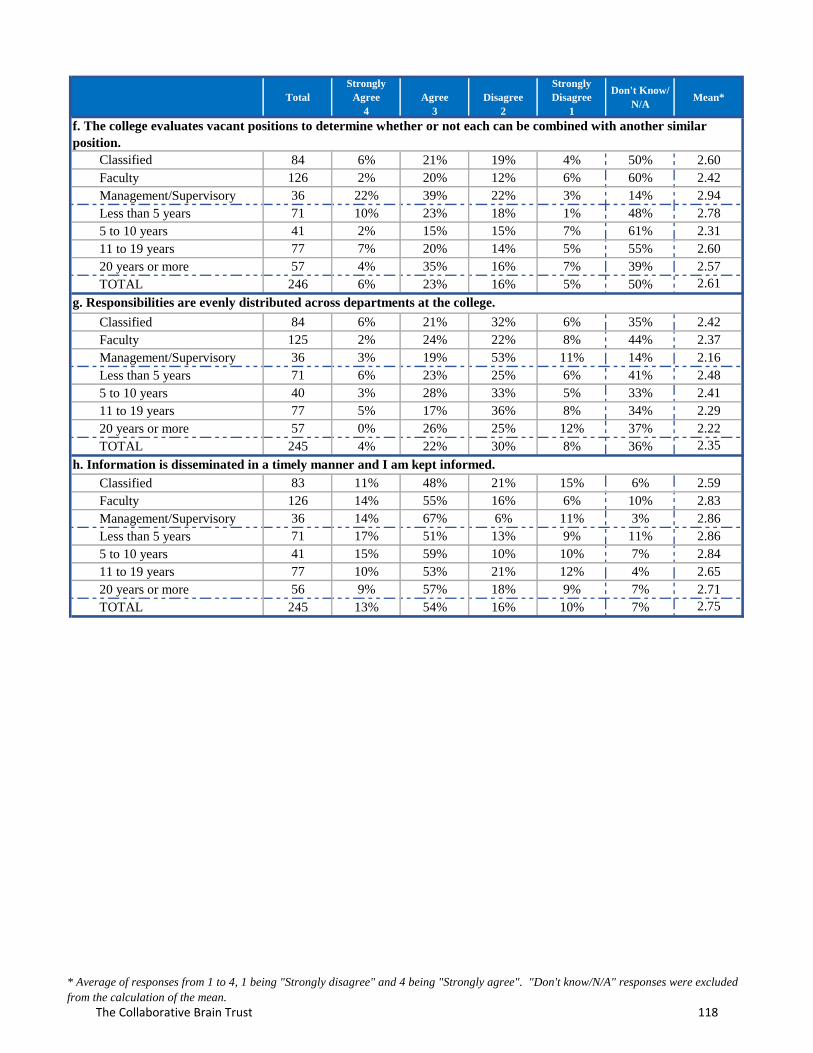
Total
Strongly
Agree
4
Agree
3
Disagree
2
Strongly
Disagree
1
Don't Know/
N/AMean*
Classified 84 6% 21% 19% 4% 50% 2.60
Faculty 126 2% 20% 12% 6% 60% 2.42
Management/Supervisory 36 22% 39% 22% 3% 14% 2.94
Less than 5 years 71 10% 23% 18% 1% 48% 2.78
5 to 10 years 41 2% 15% 15% 7% 61% 2.31
11 to 19 years 77 7% 20% 14% 5% 55% 2.60
20 years or more 57 4% 35% 16% 7% 39% 2.57
TOTAL 246 6% 23% 16% 5% 50% 2.61
Classified 84 6% 21% 32% 6% 35% 2.42
Faculty 125 2% 24% 22% 8% 44% 2.37
Management/Supervisory 36 3% 19% 53% 11% 14% 2.16
Less than 5 years 71 6% 23% 25% 6% 41% 2.48
5 to 10 years 40 3% 28% 33% 5% 33% 2.41
11 to 19 years 77 5% 17% 36% 8% 34% 2.29
20 years or more 57 0% 26% 25% 12% 37% 2.22
TOTAL 245 4% 22% 30% 8% 36% 2.35
Classified 83 11% 48% 21% 15% 6% 2.59
Faculty 126 14% 55% 16% 6% 10% 2.83
Management/Supervisory 36 14% 67% 6% 11% 3% 2.86
Less than 5 years 71 17% 51% 13% 9% 11% 2.86
5 to 10 years 41 15% 59% 10% 10% 7% 2.84
11 to 19 years 77 10% 53% 21% 12% 4% 2.65
20 years or more 56 9% 57% 18% 9% 7% 2.71
TOTAL 245 13% 54% 16% 10% 7% 2.75
f. The college evaluates vacant positions to determine whether or not each can be combined with another similar
position.
g. Responsibilities are evenly distributed across departments at the college.
h. Information is disseminated in a timely manner and I am kept informed.
* Average of responses from 1 to 4, 1 being "Strongly disagree" and 4 being "Strongly agree". "Don't know/N/A" responses were excluded
from the calculation of the mean.
The Collaborative Brain Trust 118
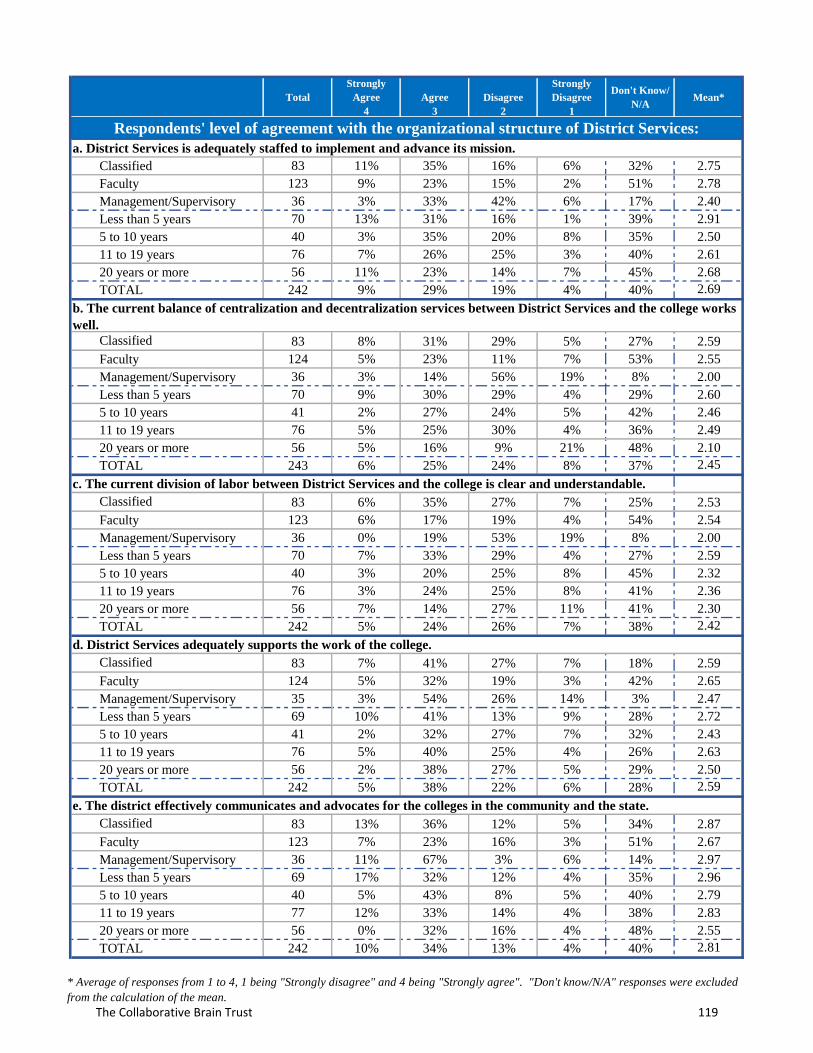
Total
Strongly
Agree
4
Agree
3
Disagree
2
Strongly
Disagree
1
Don't Know/
N/AMean*
Classified 83 11% 35% 16% 6% 32% 2.75
Faculty 123 9% 23% 15% 2% 51% 2.78
Management/Supervisory 36 3% 33% 42% 6% 17% 2.40
Less than 5 years 70 13% 31% 16% 1% 39% 2.91
5 to 10 years 40 3% 35% 20% 8% 35% 2.50
11 to 19 years 76 7% 26% 25% 3% 40% 2.61
20 years or more 56 11% 23% 14% 7% 45% 2.68
TOTAL 242 9% 29% 19% 4% 40% 2.69
Classified 83 8% 31% 29% 5% 27% 2.59
Faculty 124 5% 23% 11% 7% 53% 2.55
Management/Supervisory 36 3% 14% 56% 19% 8% 2.00
Less than 5 years 70 9% 30% 29% 4% 29% 2.60
5 to 10 years 41 2% 27% 24% 5% 42% 2.46
11 to 19 years 76 5% 25% 30% 4% 36% 2.49
20 years or more 56 5% 16% 9% 21% 48% 2.10
TOTAL 243 6% 25% 24% 8% 37% 2.45
c. The current division of labor between District Services and the college is clear and understandable.
Classified 83 6% 35% 27% 7% 25% 2.53
Faculty 123 6% 17% 19% 4% 54% 2.54
Management/Supervisory 36 0% 19% 53% 19% 8% 2.00
Less than 5 years 70 7% 33% 29% 4% 27% 2.59
5 to 10 years 40 3% 20% 25% 8% 45% 2.32
11 to 19 years 76 3% 24% 25% 8% 41% 2.36
20 years or more 56 7% 14% 27% 11% 41% 2.30
TOTAL 242 5% 24% 26% 7% 38% 2.42
Classified 83 7% 41% 27% 7% 18% 2.59
Faculty 124 5% 32% 19% 3% 42% 2.65
Management/Supervisory 35 3% 54% 26% 14% 3% 2.47
Less than 5 years 69 10% 41% 13% 9% 28% 2.72
5 to 10 years 41 2% 32% 27% 7% 32% 2.43
11 to 19 years 76 5% 40% 25% 4% 26% 2.63
20 years or more 56 2% 38% 27% 5% 29% 2.50
TOTAL 242 5% 38% 22% 6% 28% 2.59
e. The district effectively communicates and advocates for the colleges in the community and the state.
Classified 83 13% 36% 12% 5% 34% 2.87
Faculty 123 7% 23% 16% 3% 51% 2.67
Management/Supervisory 36 11% 67% 3% 6% 14% 2.97
Less than 5 years 69 17% 32% 12% 4% 35% 2.96
5 to 10 years 40 5% 43% 8% 5% 40% 2.79
11 to 19 years 77 12% 33% 14% 4% 38% 2.83
20 years or more 56 0% 32% 16% 4% 48% 2.55
TOTAL 242 10% 34% 13% 4% 40% 2.81
d. District Services adequately supports the work of the college.
Respondents' level of agreement with the organizational structure of District Services:
a. District Services is adequately staffed to implement and advance its mission.
b. The current balance of centralization and decentralization services between District Services and the college works
well.
* Average of responses from 1 to 4, 1 being "Strongly disagree" and 4 being "Strongly agree". "Don't know/N/A" responses were excluded
from the calculation of the mean.
The Collaborative Brain Trust 119
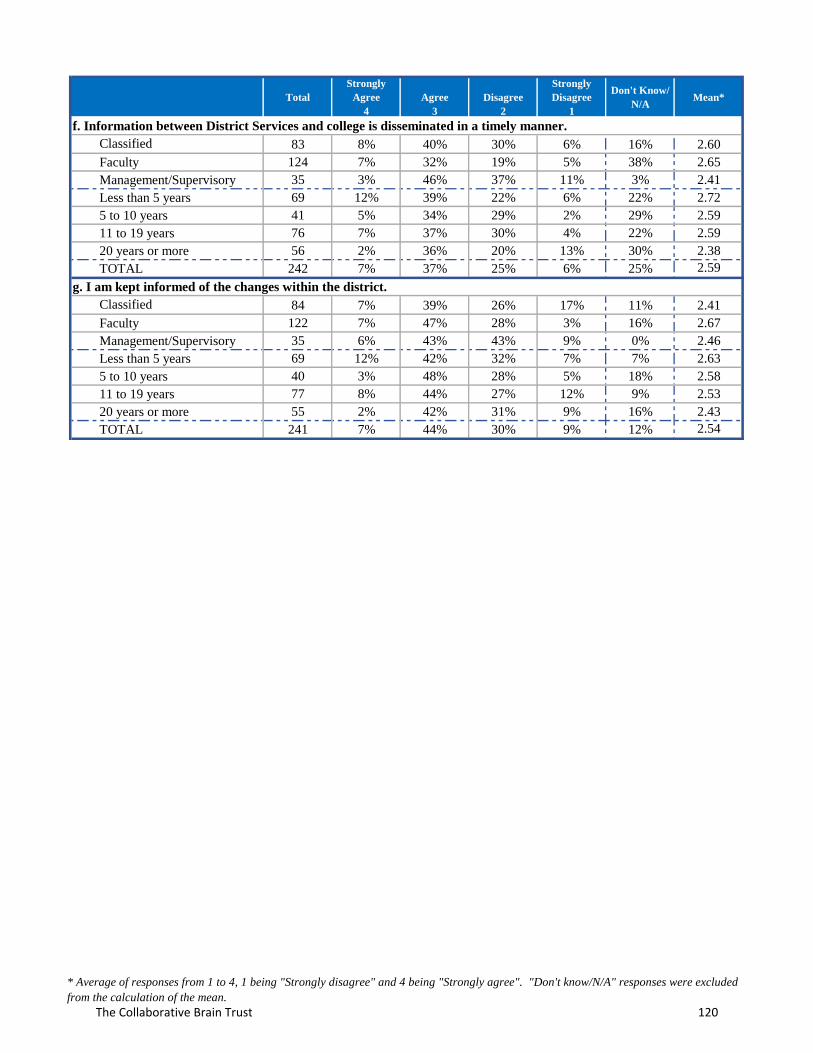
Total
Strongly
Agree
4
Agree
3
Disagree
2
Strongly
Disagree
1
Don't Know/
N/AMean*
Classified 83 8% 40% 30% 6% 16% 2.60
Faculty 124 7% 32% 19% 5% 38% 2.65
Management/Supervisory 35 3% 46% 37% 11% 3% 2.41
Less than 5 years 69 12% 39% 22% 6% 22% 2.72
5 to 10 years 41 5% 34% 29% 2% 29% 2.59
11 to 19 years 76 7% 37% 30% 4% 22% 2.59
20 years or more 56 2% 36% 20% 13% 30% 2.38
TOTAL 242 7% 37% 25% 6% 25% 2.59
Classified 84 7% 39% 26% 17% 11% 2.41
Faculty 122 7% 47% 28% 3% 16% 2.67
Management/Supervisory 35 6% 43% 43% 9% 0% 2.46
Less than 5 years 69 12% 42% 32% 7% 7% 2.63
5 to 10 years 40 3% 48% 28% 5% 18% 2.58
11 to 19 years 77 8% 44% 27% 12% 9% 2.53
20 years or more 55 2% 42% 31% 9% 16% 2.43
TOTAL 241 7% 44% 30% 9% 12% 2.54
g. I am kept informed of the changes within the district.
f. Information between District Services and college is disseminated in a timely manner.
* Average of responses from 1 to 4, 1 being "Strongly disagree" and 4 being "Strongly agree". "Don't know/N/A" responses were excluded
from the calculation of the mean.
The Collaborative Brain Trust 120
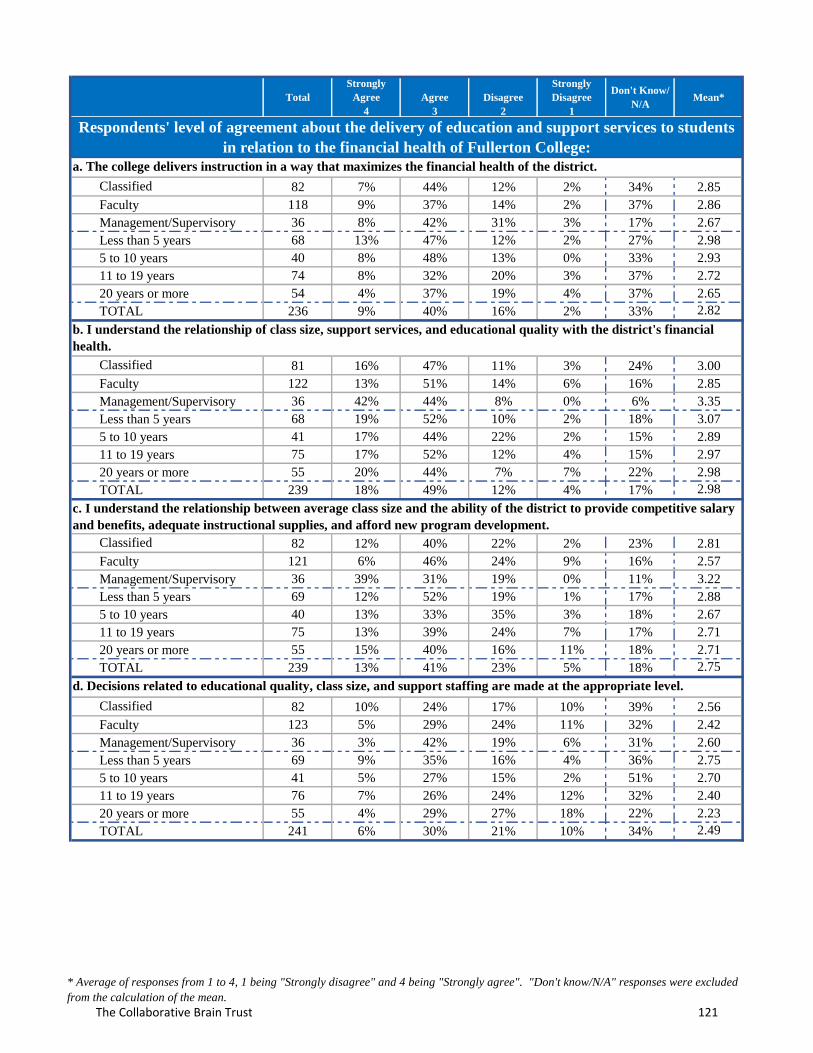
Total
Strongly
Agree
4
Agree
3
Disagree
2
Strongly
Disagree
1
Don't Know/
N/AMean*
Classified 82 7% 44% 12% 2% 34% 2.85
Faculty 118 9% 37% 14% 2% 37% 2.86
Management/Supervisory 36 8% 42% 31% 3% 17% 2.67
Less than 5 years 68 13% 47% 12% 2% 27% 2.98
5 to 10 years 40 8% 48% 13% 0% 33% 2.93
11 to 19 years 74 8% 32% 20% 3% 37% 2.72
20 years or more 54 4% 37% 19% 4% 37% 2.65
TOTAL 236 9% 40% 16% 2% 33% 2.82
Classified 81 16% 47% 11% 3% 24% 3.00
Faculty 122 13% 51% 14% 6% 16% 2.85
Management/Supervisory 36 42% 44% 8% 0% 6% 3.35
Less than 5 years 68 19% 52% 10% 2% 18% 3.07
5 to 10 years 41 17% 44% 22% 2% 15% 2.89
11 to 19 years 75 17% 52% 12% 4% 15% 2.97
20 years or more 55 20% 44% 7% 7% 22% 2.98
TOTAL 239 18% 49% 12% 4% 17% 2.98
Classified 82 12% 40% 22% 2% 23% 2.81
Faculty 121 6% 46% 24% 9% 16% 2.57
Management/Supervisory 36 39% 31% 19% 0% 11% 3.22
Less than 5 years 69 12% 52% 19% 1% 17% 2.88
5 to 10 years 40 13% 33% 35% 3% 18% 2.67
11 to 19 years 75 13% 39% 24% 7% 17% 2.71
20 years or more 55 15% 40% 16% 11% 18% 2.71
TOTAL 239 13% 41% 23% 5% 18% 2.75
Classified 82 10% 24% 17% 10% 39% 2.56
Faculty 123 5% 29% 24% 11% 32% 2.42
Management/Supervisory 36 3% 42% 19% 6% 31% 2.60
Less than 5 years 69 9% 35% 16% 4% 36% 2.75
5 to 10 years 41 5% 27% 15% 2% 51% 2.70
11 to 19 years 76 7% 26% 24% 12% 32% 2.40
20 years or more 55 4% 29% 27% 18% 22% 2.23
TOTAL 241 6% 30% 21% 10% 34% 2.49
a. The college delivers instruction in a way that maximizes the financial health of the district.
Respondents' level of agreement about the delivery of education and support services to students
in relation to the financial health of Fullerton College:
c. I understand the relationship between average class size and the ability of the district to provide competitive salary
and benefits, adequate instructional supplies, and afford new program development.
d. Decisions related to educational quality, class size, and support staffing are made at the appropriate level.
b. I understand the relationship of class size, support services, and educational quality with the district's financial
health.
* Average of responses from 1 to 4, 1 being "Strongly disagree" and 4 being "Strongly agree". "Don't know/N/A" responses were excluded
from the calculation of the mean.
The Collaborative Brain Trust 121
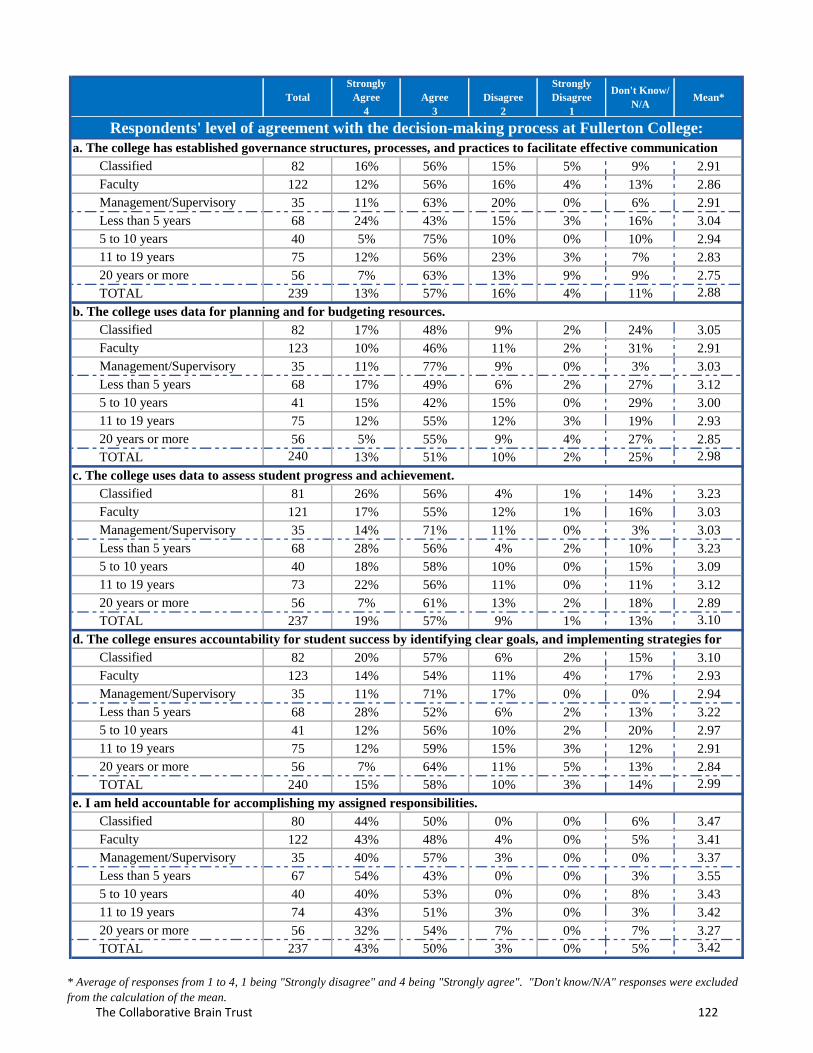
Total
Strongly
Agree
4
Agree
3
Disagree
2
Strongly
Disagree
1
Don't Know/
N/AMean*
Classified 82 16% 56% 15% 5% 9% 2.91
Faculty 122 12% 56% 16% 4% 13% 2.86
Management/Supervisory 35 11% 63% 20% 0% 6% 2.91
Less than 5 years 68 24% 43% 15% 3% 16% 3.04
5 to 10 years 40 5% 75% 10% 0% 10% 2.94
11 to 19 years 75 12% 56% 23% 3% 7% 2.83
20 years or more 56 7% 63% 13% 9% 9% 2.75
TOTAL 239 13% 57% 16% 4% 11% 2.88
Classified 82 17% 48% 9% 2% 24% 3.05
Faculty 123 10% 46% 11% 2% 31% 2.91
Management/Supervisory 35 11% 77% 9% 0% 3% 3.03
Less than 5 years 68 17% 49% 6% 2% 27% 3.12
5 to 10 years 41 15% 42% 15% 0% 29% 3.00
11 to 19 years 75 12% 55% 12% 3% 19% 2.93
20 years or more 56 5% 55% 9% 4% 27% 2.85
TOTAL 240 13% 51% 10% 2% 25% 2.98
c. The college uses data to assess student progress and achievement.
Classified 81 26% 56% 4% 1% 14% 3.23
Faculty 121 17% 55% 12% 1% 16% 3.03
Management/Supervisory 35 14% 71% 11% 0% 3% 3.03
Less than 5 years 68 28% 56% 4% 2% 10% 3.23
5 to 10 years 40 18% 58% 10% 0% 15% 3.09
11 to 19 years 73 22% 56% 11% 0% 11% 3.12
20 years or more 56 7% 61% 13% 2% 18% 2.89
TOTAL 237 19% 57% 9% 1% 13% 3.10
Classified 82 20% 57% 6% 2% 15% 3.10
Faculty 123 14% 54% 11% 4% 17% 2.93
Management/Supervisory 35 11% 71% 17% 0% 0% 2.94
Less than 5 years 68 28% 52% 6% 2% 13% 3.22
5 to 10 years 41 12% 56% 10% 2% 20% 2.97
11 to 19 years 75 12% 59% 15% 3% 12% 2.91
20 years or more 56 7% 64% 11% 5% 13% 2.84
TOTAL 240 15% 58% 10% 3% 14% 2.99
Classified 80 44% 50% 0% 0% 6% 3.47
Faculty 122 43% 48% 4% 0% 5% 3.41
Management/Supervisory 35 40% 57% 3% 0% 0% 3.37
Less than 5 years 67 54% 43% 0% 0% 3% 3.55
5 to 10 years 40 40% 53% 0% 0% 8% 3.43
11 to 19 years 74 43% 51% 3% 0% 3% 3.42
20 years or more 56 32% 54% 7% 0% 7% 3.27
TOTAL 237 43% 50% 3% 0% 5% 3.42
Respondents' level of agreement with the decision-making process at Fullerton College:
a. The college has established governance structures, processes, and practices to facilitate effective communication
among its constituencies.
b. The college uses data for planning and for budgeting resources.
d. The college ensures accountability for student success by identifying clear goals, and implementing strategies for
improvement.
e. I am held accountable for accomplishing my assigned responsibilities.
* Average of responses from 1 to 4, 1 being "Strongly disagree" and 4 being "Strongly agree". "Don't know/N/A" responses were excluded
from the calculation of the mean.
The Collaborative Brain Trust 122
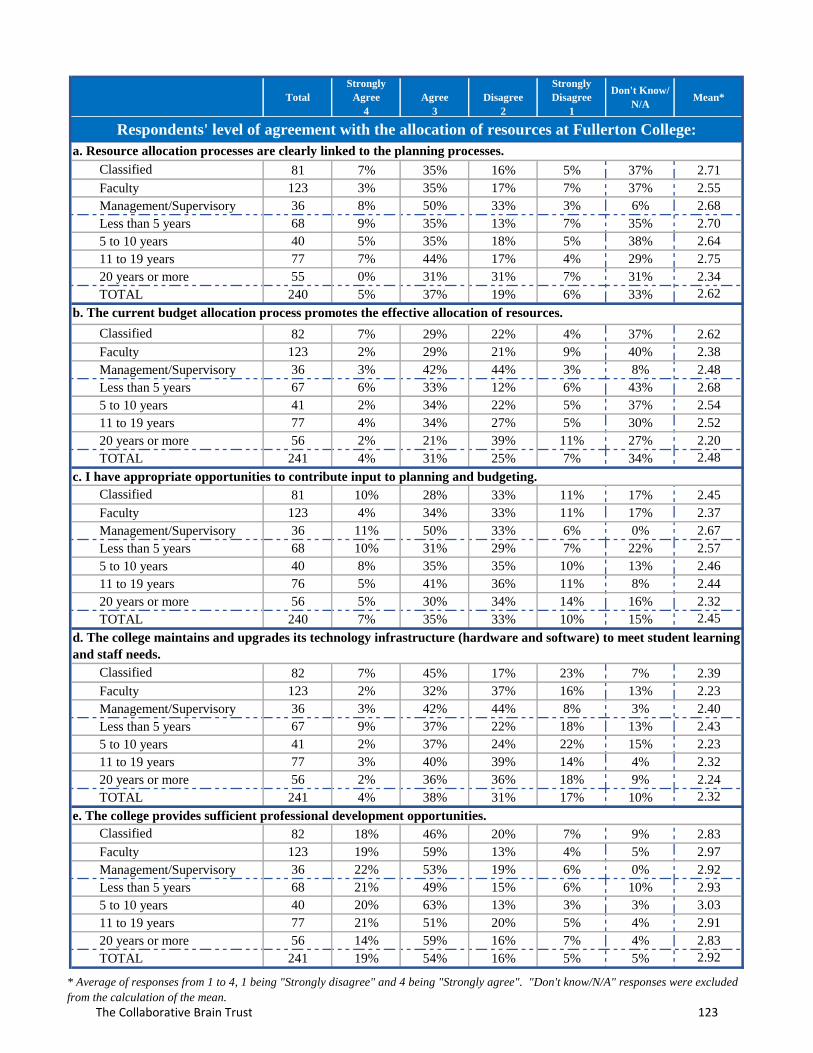
Total
Strongly
Agree
4
Agree
3
Disagree
2
Strongly
Disagree
1
Don't Know/
N/AMean*
Classified 81 7% 35% 16% 5% 37% 2.71
Faculty 123 3% 35% 17% 7% 37% 2.55
Management/Supervisory 36 8% 50% 33% 3% 6% 2.68
Less than 5 years 68 9% 35% 13% 7% 35% 2.70
5 to 10 years 40 5% 35% 18% 5% 38% 2.64
11 to 19 years 77 7% 44% 17% 4% 29% 2.75
20 years or more 55 0% 31% 31% 7% 31% 2.34
TOTAL 240 5% 37% 19% 6% 33% 2.62
Classified 82 7% 29% 22% 4% 37% 2.62
Faculty 123 2% 29% 21% 9% 40% 2.38
Management/Supervisory 36 3% 42% 44% 3% 8% 2.48
Less than 5 years 67 6% 33% 12% 6% 43% 2.68
5 to 10 years 41 2% 34% 22% 5% 37% 2.54
11 to 19 years 77 4% 34% 27% 5% 30% 2.52
20 years or more 56 2% 21% 39% 11% 27% 2.20
TOTAL 241 4% 31% 25% 7% 34% 2.48
Classified 81 10% 28% 33% 11% 17% 2.45
Faculty 123 4% 34% 33% 11% 17% 2.37
Management/Supervisory 36 11% 50% 33% 6% 0% 2.67
Less than 5 years 68 10% 31% 29% 7% 22% 2.57
5 to 10 years 40 8% 35% 35% 10% 13% 2.46
11 to 19 years 76 5% 41% 36% 11% 8% 2.44
20 years or more 56 5% 30% 34% 14% 16% 2.32
TOTAL 240 7% 35% 33% 10% 15% 2.45
Classified 82 7% 45% 17% 23% 7% 2.39
Faculty 123 2% 32% 37% 16% 13% 2.23
Management/Supervisory 36 3% 42% 44% 8% 3% 2.40
Less than 5 years 67 9% 37% 22% 18% 13% 2.43
5 to 10 years 41 2% 37% 24% 22% 15% 2.23
11 to 19 years 77 3% 40% 39% 14% 4% 2.32
20 years or more 56 2% 36% 36% 18% 9% 2.24
TOTAL 241 4% 38% 31% 17% 10% 2.32
Classified 82 18% 46% 20% 7% 9% 2.83
Faculty 123 19% 59% 13% 4% 5% 2.97
Management/Supervisory 36 22% 53% 19% 6% 0% 2.92
Less than 5 years 68 21% 49% 15% 6% 10% 2.93
5 to 10 years 40 20% 63% 13% 3% 3% 3.03
11 to 19 years 77 21% 51% 20% 5% 4% 2.91
20 years or more 56 14% 59% 16% 7% 4% 2.83
TOTAL 241 19% 54% 16% 5% 5% 2.92
Respondents' level of agreement with the allocation of resources at Fullerton College:
b. The current budget allocation process promotes the effective allocation of resources.
a. Resource allocation processes are clearly linked to the planning processes.
c. I have appropriate opportunities to contribute input to planning and budgeting.
d. The college maintains and upgrades its technology infrastructure (hardware and software) to meet student learning
and staff needs.
e. The college provides sufficient professional development opportunities.
* Average of responses from 1 to 4, 1 being "Strongly disagree" and 4 being "Strongly agree". "Don't know/N/A" responses were excluded
from the calculation of the mean.
The Collaborative Brain Trust 123
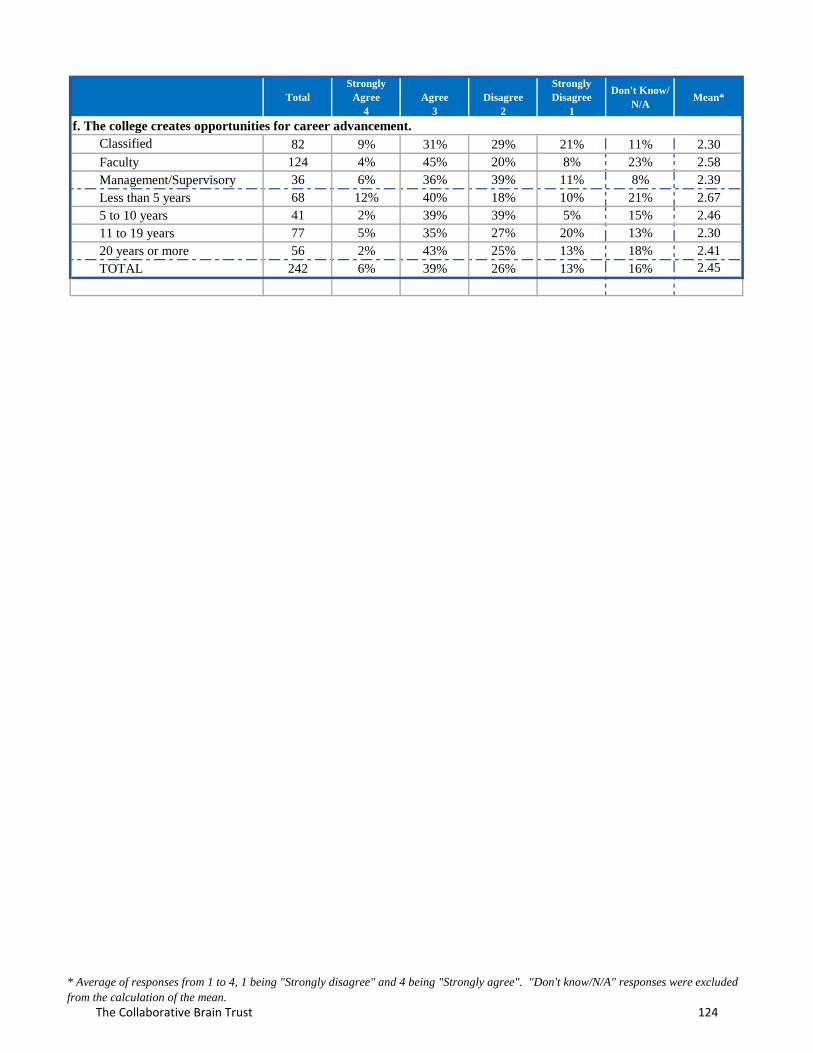
Total
Strongly
Agree
4
Agree
3
Disagree
2
Strongly
Disagree
1
Don't Know/
N/AMean*
Classified 82 9% 31% 29% 21% 11% 2.30
Faculty 124 4% 45% 20% 8% 23% 2.58
Management/Supervisory 36 6% 36% 39% 11% 8% 2.39
Less than 5 years 68 12% 40% 18% 10% 21% 2.67
5 to 10 years 41 2% 39% 39% 5% 15% 2.46
11 to 19 years 77 5% 35% 27% 20% 13% 2.30
20 years or more 56 2% 43% 25% 13% 18% 2.41
TOTAL 242 6% 39% 26% 13% 16% 2.45
f. The college creates opportunities for career advancement.
* Average of responses from 1 to 4, 1 being "Strongly disagree" and 4 being "Strongly agree". "Don't know/N/A" responses were excluded
from the calculation of the mean.
The Collaborative Brain Trust 124
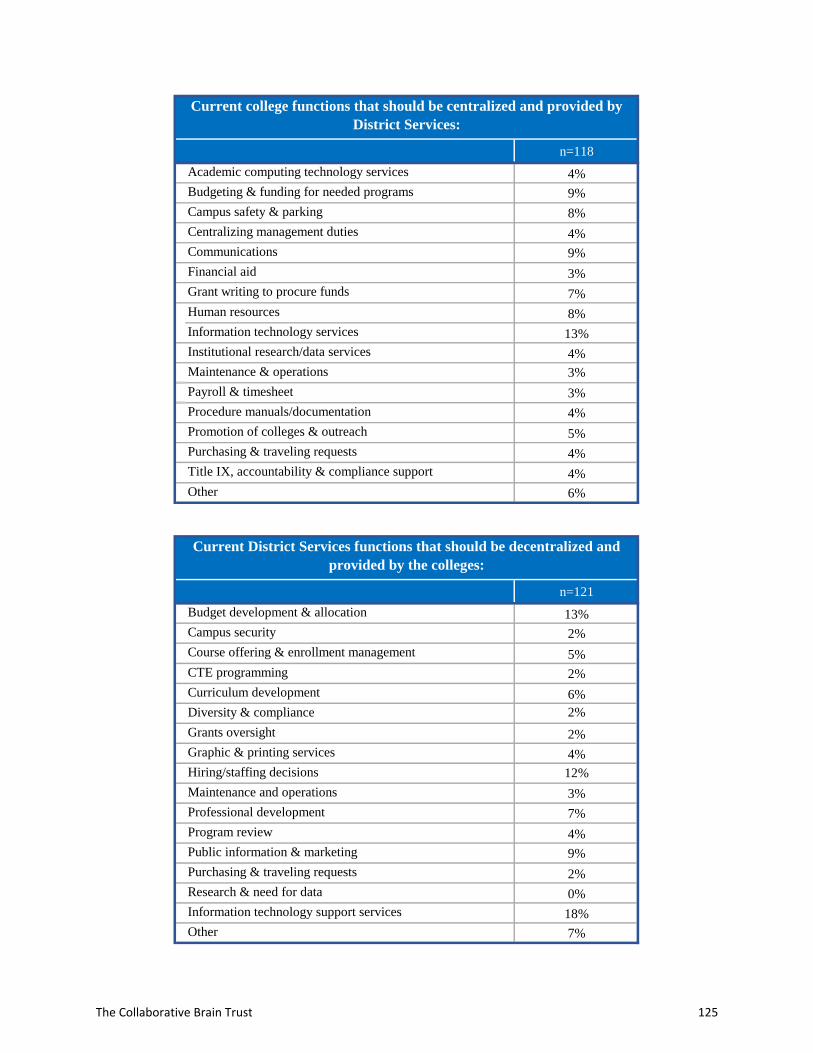
n=118
4%
9%
8%
4%
9%
3%
7%
8%
13%
4%
3%
3%
4%
5%
4%
4%
Other 6%
n=121
13%
2%
5%
2%
6%
2%
2%
4%
12%
3%
7%
4%
9%
2%
0%
18%
7%
Centralizing management duties
Communications
Financial aid
Grant writing to procure funds
Current college functions that should be centralized and provided by
District Services:
Academic computing technology services
Budgeting & funding for needed programs
Campus safety & parking
Human resources
Information technology services
Institutional research/data services
Maintenance & operations
Payroll & timesheet
Procedure manuals/documentation
Promotion of colleges & outreach
Purchasing & traveling requests
Title IX, accountability & compliance support
Current District Services functions that should be decentralized and
provided by the colleges:
Budget development & allocation
Campus security
Course offering & enrollment management
CTE programming
Curriculum development
Diversity & compliance
Grants oversight
Graphic & printing services
Hiring/staffing decisions
Maintenance and operations
Professional development
Program review
Public information & marketing
Purchasing & traveling requests
Research & need for data
Information technology support services
Other
The Collaborative Brain Trust 125
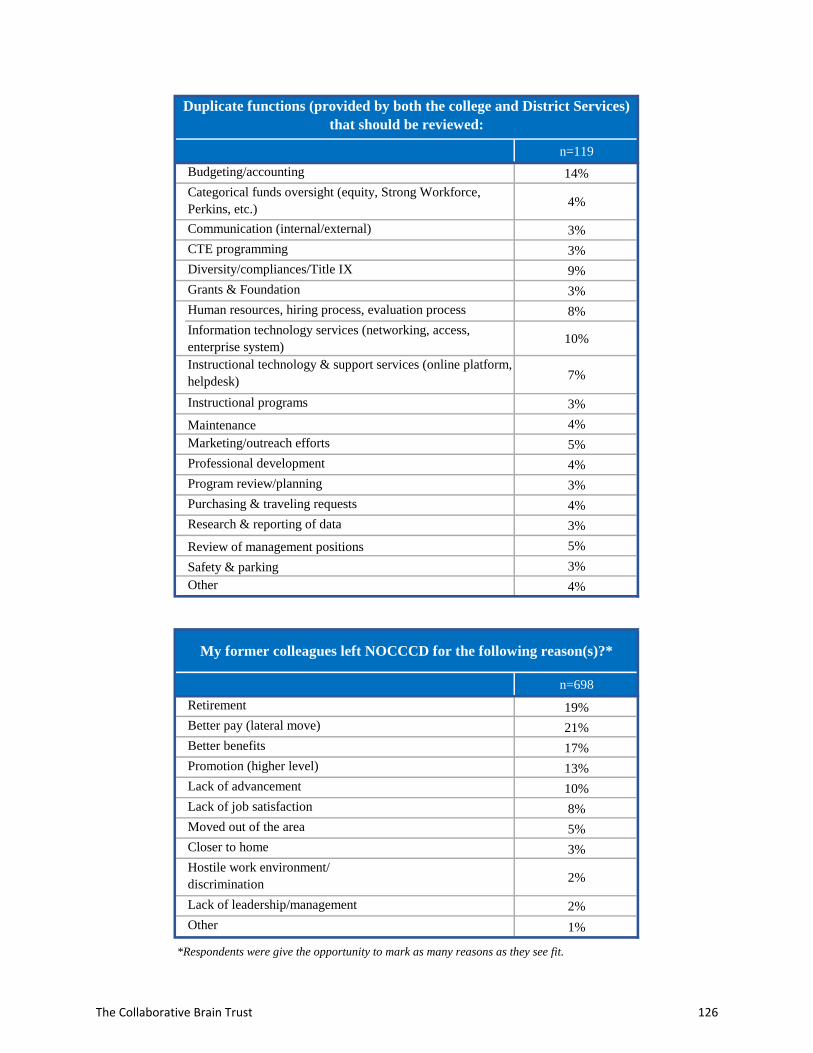
n=119
14%
4%
3%
3%
9%
3%
8%
10%
7%
3%
4%
5%
4%
3%
4%
3%
5%
3%
4%
n=698
Retirement 19%
Better pay (lateral move) 21%
Better benefits 17%
Promotion (higher level) 13%
Lack of advancement 10%
Lack of job satisfaction 8%
Moved out of the area 5%
Closer to home 3%
2%
2%
1%
*Respondents were give the opportunity to mark as many reasons as they see fit.
Duplicate functions (provided by both the college and District Services)
that should be reviewed:
Budgeting/accounting
Categorical funds oversight (equity, Strong Workforce,
Perkins, etc.)
Communication (internal/external)
CTE programming
Diversity/compliances/Title IX
Grants & Foundation
Human resources, hiring process, evaluation process
Information technology services (networking, access,
enterprise system)
Instructional technology & support services (online platform,
helpdesk)
Instructional programs
Maintenance
Marketing/outreach efforts
Professional development
Program review/planning
Purchasing & traveling requests
Hostile work environment/
discrimination
Lack of leadership/management
Other
Research & reporting of data
Review of management positions
Safety & parking
Other
My former colleagues left NOCCCD for the following reason(s)?*
The Collaborative Brain Trust 126
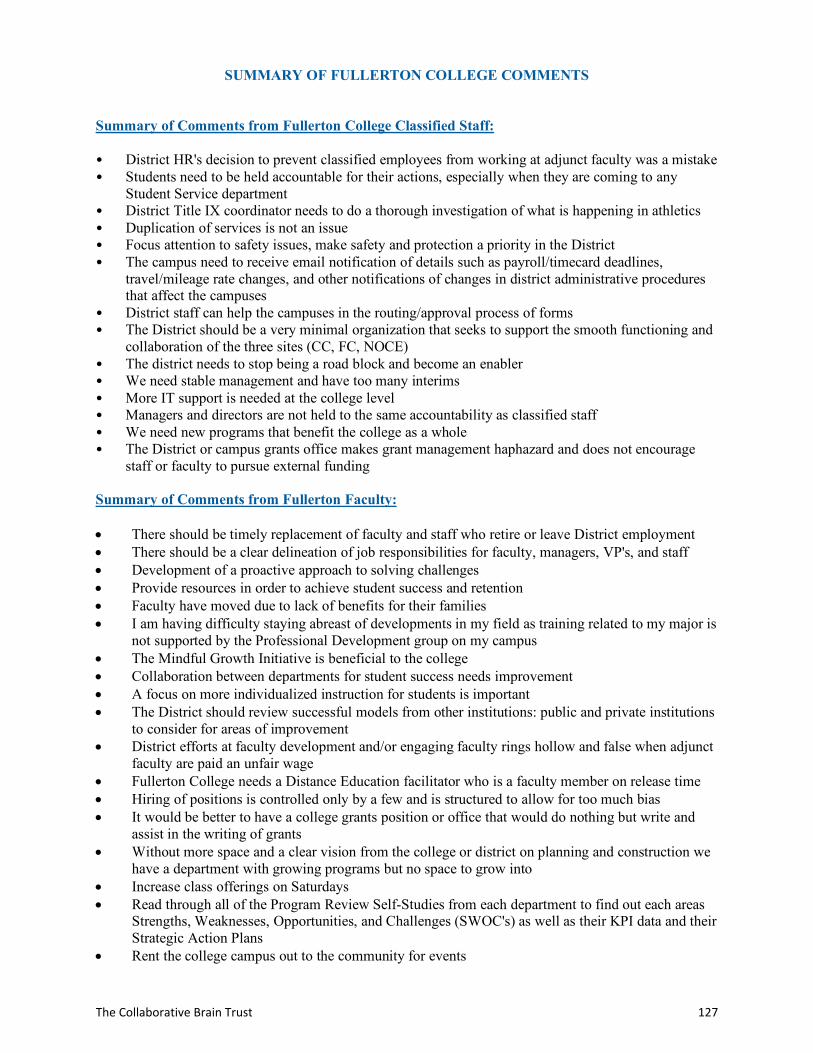
SUMMARY OF FULLERTON COLLEGE COMMENTS
Summary of Comments from Fullerton College Classified Staff:
• District HR's decision to prevent classified employees from working at adjunct faculty was a mistake• Students need to be held accountable for their actions, especially when they are coming to any
Student Service department• District Title IX coordinator needs to do a thorough investigation of what is happening in athletics• Duplication of services is not an issue• Focus attention to safety issues, make safety and protection a priority in the District• The campus need to receive email notification of details such as payroll/timecard deadlines,
travel/mileage rate changes, and other notifications of changes in district administrative proceduresthat affect the campuses
• District staff can help the campuses in the routing/approval process of forms• The District should be a very minimal organization that seeks to support the smooth functioning and
collaboration of the three sites (CC, FC, NOCE)• The district needs to stop being a road block and become an enabler• We need stable management and have too many interims• More IT support is needed at the college level• Managers and directors are not held to the same accountability as classified staff• We need new programs that benefit the college as a whole• The District or campus grants office makes grant management haphazard and does not encourage
staff or faculty to pursue external funding
Summary of Comments from Fullerton Faculty:
• There should be timely replacement of faculty and staff who retire or leave District employment• There should be a clear delineation of job responsibilities for faculty, managers, VP's, and staff• Development of a proactive approach to solving challenges• Provide resources in order to achieve student success and retention• Faculty have moved due to lack of benefits for their families• I am having difficulty staying abreast of developments in my field as training related to my major is
not supported by the Professional Development group on my campus• The Mindful Growth Initiative is beneficial to the college• Collaboration between departments for student success needs improvement• A focus on more individualized instruction for students is important• The District should review successful models from other institutions: public and private institutions
to consider for areas of improvement• District efforts at faculty development and/or engaging faculty rings hollow and false when adjunct
faculty are paid an unfair wage• Fullerton College needs a Distance Education facilitator who is a faculty member on release time• Hiring of positions is controlled only by a few and is structured to allow for too much bias• It would be better to have a college grants position or office that would do nothing but write and
assist in the writing of grants• Without more space and a clear vision from the college or district on planning and construction we
have a department with growing programs but no space to grow into• Increase class offerings on Saturdays• Read through all of the Program Review Self-Studies from each department to find out each areas
Strengths, Weaknesses, Opportunities, and Challenges (SWOC's) as well as their KPI data and theirStrategic Action Plans
• Rent the college campus out to the community for events
The Collaborative Brain Trust 127
• More school outreach efforts starting at the kindergarten level in the Fullerton School District andAnaheim and other school districts
• Actively support departments that would like to offer four-year degrees in specific careers likeSanta Monica College and other community colleges throughout California
• More outreach to corporations, industry, and businesses to develop relationships that could benefitthe district
• Need more inter-district training sessions made available for faculty and staff• There is no infrastructure support for CTE• There are no maintenance support fees on computers, digital devices, and equipment• Provide the infrastructure and financial support we need to run and expand our CTE programs• Pay people for their extracurricular activities that lead to the outcomes• Concerned about the centralization and additions of administrators at the district level• The district so severely limits the number of hours that adjunct faculty or professional experts can
work per week, it also constrains our ability to provide quality programs• Pay for faculty medical, dental and vision coverage for spouses and dependents• Do not accept that increasing class size is the only factor that influences "the ability of the district to
provide competitive salary and benefits, adequate instructional supplies, and afford new programdevelopment"
• Retirement and benefits organizational structure is very confusing, counter-intuitive, and notpeople-focused
• Safety issues need a lot more attention• The power distribution is transparent, nor is the budget allocation method explained to regular
faculty• There is very little diversity in middle management and is not reflective of the population we serve• Professional development needs much more financial support, a dedicated space, and leadership
resources• The Mindful Growth Initiative should be better supported• Many faculty who care deeply about the community are growing resentful about how our work is
viewed when the compensation is so low• The sheer number of committees almost seems detrimental to communication• Continuing problems with Wi-Fi connectivity could cause students to go to another college that
allows to them stay connected all day• We are still the lowest paid district and have no benefits for dependents• We need a better version of the software so we can help students achieve their goals, capture the
data, and award the certificates• Need hotlines for discrimination complaints and waste/fraud complaints• There is a lack of professional management skills necessary to operate the district and colleges• Departments have non-transparent decision making, favoritism and only certain folks are held
accountable• NOCCD is a great district with great people looking to advance the public education across Orange
County• Need more research done by the District to determine what factors (within our control) affect
student success• Need better pay to attract top-level faculty and administrators• Changing management style and methods when it comes to teaching could prove to be very "non-
efficient" and "non-effective"• Subcommittees of Senates should be sending their recommendations to the Senate for the Senate's
final vote• The District does many things correctly• There are many programs that are not being properly funded• The cost of living in North Orange County continues to rise at a rate that does not equal salary and
benefits of employees
The Collaborative Brain Trust 128
• There is certainly need for a balance of centralization and decentralization in different areas for theeffective functioning of the campuses and District as a whole
• Staffing levels and capability must first be raised to sufficiently address the changing needs of ourstudents and our organization
• There should be a special hub or room that can accommodate professional development for faculty• We do not need more centralization.• The District should try to decentralize as much as possible, and reduce expensive District positions• We don't need more administrators• We need better pay and benefits and release time for faculty, who are overworked• We need to address the levels of management for approving projects/purchases/donations/grants• The District has an overly impersonal style• Colleges should be independent of each other and that there should not be a district
Summary of Comments from Fullerton College Management/Supervisory:
• Planning processes really do not exist at the campus level• Processes related to hiring and payroll take a lot of time away from working directly with students• There is a need for better (updated) handbooks and trainings, especially related to Banner, Argos,
preparing reports for fiscal affairs (related to state categorical funds).• The payroll process is challenging due to short turnaround time and errors that have to be corrected
by individuals on the campuses• The process to request an on-going increase of funds in order to run a center or program is not clear• Program Review provides an opportunity to request a limited amount of one-time funds but in order
for programs to provide adequate staffing with increased costs for hourly employees• New managers have been hired at a much higher rate than current managers• Need to provide equal pay for equal work• Need to review the professional growth and development benefits• Need clear policies and procedures manual across district• Some staff at district either do not respond or have long delays in responding to calls, emails,
request for information or other• Need better communication and clear points of contact between district and campus• The colleges need associate deans• The communication between the district and campuses could use improvement• Could use opportunities for flexible schedules (4/10/ 9/80), working from home, comp time, and
more part time opportunities (classified & manager) for women who have to juggle both a heavyload at work and at home
• The communication from District to the campuses is challenging• There is a disconnect with the District offices being off campus• The workload of the deans has grown exponentially over the years and is now truly untenable• There are too many levels of approvals for simple processes• There is a lack of written policies and procedures to protect the general liability of
NOCCCD/college against incidents and accidents and staff that act inappropriately• There needs to be more opportunities for growth at the management level• With changing mandates from the state, we need to be able to be flexible with our staffing structure,
policies and resource allocation to meet the shifting demands• We also need to replace hourly with full time• Workload has continued to increase every year, however due to an increase in health and welfare
costs as well as step increases, COLA etc., staffing numbers have declined
The Collaborative Brain Trust 129
APPENDIX H H. Survey Results for
North Orange Continuing Education
The Collaborative Brain Trust 130
North Orange County Community College District
Results of the Organizational Structure Survey
for North Orange Continuing Education
Spring 2018
North Orange County Community College District is conducting a comprehensive organizational
structure review to ensure it is serving its students and community effectively and efficiently. A
component of such a review requires multiple perspectives, including the perspective of those
who work within the organization. In early February 2018, all district full-time faculty and staff
were invited to share their opinions of the District and its Colleges via an online survey.
During a three-week period, 516 staff and faculty shared their understanding, compliments, and
concerns about the existing structure of their department, the Colleges, as well as District
Services. Of those working at North Orange Continuing Education (NOCE), 80 employees
completed the survey, including 38% faculty, 40% classified/confidential, and 22%
management/supervisory; and 45% have been employed at the NOCE less than five years, 17% 5
to 10 years, 27% 11 to 19 years and 11% have been with NOCE for more than 20 years.
This report summarizes the findings of the 80 respondents’ feedback on organizational structure
issues relating specifically to NOCE. Overall, respondents somewhat agreed that the District’s,
NOCE’s and their department’s organizational structure works, but that there is room for
improvement. Respondents were generous in sharing their comments, compliments and
concerns. The comments may prove helpful as NOCE considers refining its structure for
efficiency and effectiveness.
About Respondents’ Work Location of NOCE:
Many respondents stated that student needs are the main focus of their workplace (mean
of 3.24, on a scale of 1 to 4, 1 being “strongly disagree” and 4 being “strongly agree”).
Respondents somewhat agreed that they engage in program reviews regularly (2.73) and
that they use data to enhance the effectiveness of the department (2.92).
Respondents also agreed that management encourages employees to take initiative to
improve institutional effectiveness (2.84) and that NOCE has established governance
structures, processes and practices to facilitate effective communication (2.82).
Classified staff and those employed at NOCE for 20+ years consistently noted a higher
level of agreement than the other sub-groups that NOCE engages in program review
regularly, that it has established governance structures and processes and that
management encourages them to take initiative to improve institutional effectiveness.
Organizational Structure at the Department Level:
Respondents stated that there is adequate administrative oversight (2.90), that the
organizational structure within their department is clear and understandable (2.83), and
that the current organizational structure of their department works well (2.70).
The Collaborative Brain Trust 131
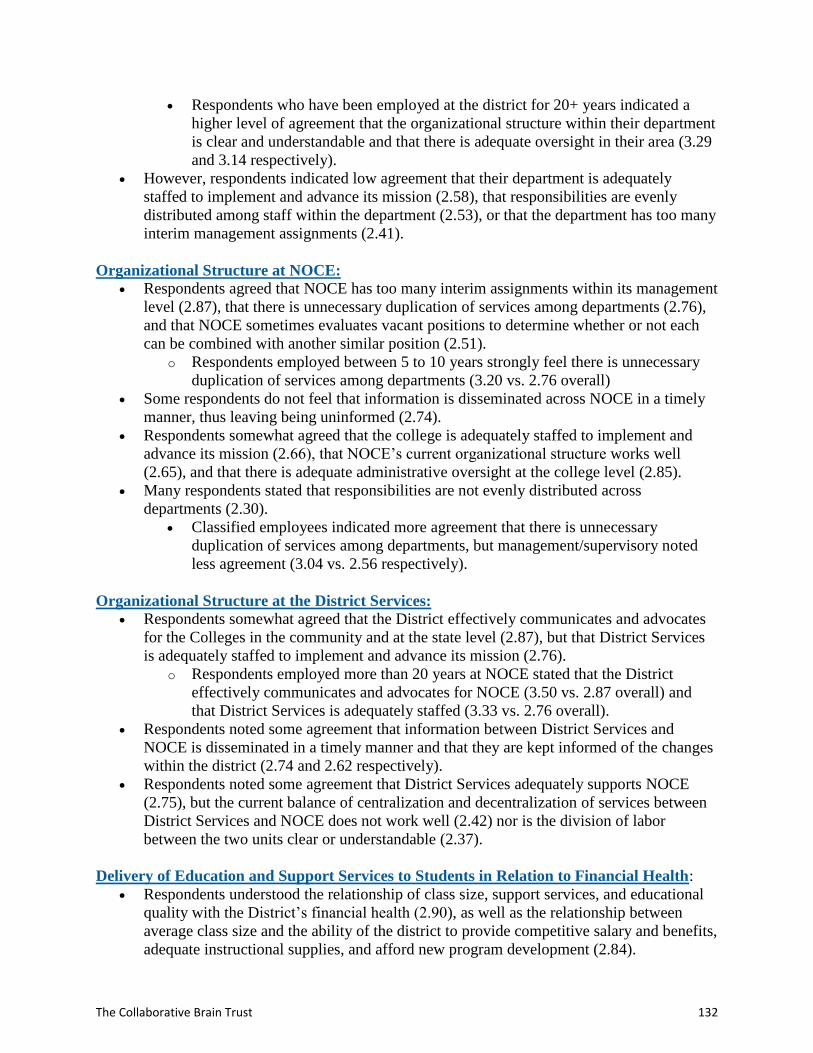
Respondents who have been employed at the district for 20+ years indicated a
higher level of agreement that the organizational structure within their department
is clear and understandable and that there is adequate oversight in their area (3.29
and 3.14 respectively).
However, respondents indicated low agreement that their department is adequately
staffed to implement and advance its mission (2.58), that responsibilities are evenly
distributed among staff within the department (2.53), or that the department has too many
interim management assignments (2.41).
Organizational Structure at NOCE:
Respondents agreed that NOCE has too many interim assignments within its management
level (2.87), that there is unnecessary duplication of services among departments (2.76),
and that NOCE sometimes evaluates vacant positions to determine whether or not each
can be combined with another similar position (2.51).
o Respondents employed between 5 to 10 years strongly feel there is unnecessary
duplication of services among departments (3.20 vs. 2.76 overall)
Some respondents do not feel that information is disseminated across NOCE in a timely
manner, thus leaving being uninformed (2.74).
Respondents somewhat agreed that the college is adequately staffed to implement and
advance its mission (2.66), that NOCE’s current organizational structure works well
(2.65), and that there is adequate administrative oversight at the college level (2.85).
Many respondents stated that responsibilities are not evenly distributed across
departments (2.30).
Classified employees indicated more agreement that there is unnecessary
duplication of services among departments, but management/supervisory noted
less agreement (3.04 vs. 2.56 respectively).
Organizational Structure at the District Services:
Respondents somewhat agreed that the District effectively communicates and advocates
for the Colleges in the community and at the state level (2.87), but that District Services
is adequately staffed to implement and advance its mission (2.76).
o Respondents employed more than 20 years at NOCE stated that the District
effectively communicates and advocates for NOCE (3.50 vs. 2.87 overall) and
that District Services is adequately staffed (3.33 vs. 2.76 overall).
Respondents noted some agreement that information between District Services and
NOCE is disseminated in a timely manner and that they are kept informed of the changes
within the district (2.74 and 2.62 respectively).
Respondents noted some agreement that District Services adequately supports NOCE
(2.75), but the current balance of centralization and decentralization of services between
District Services and NOCE does not work well (2.42) nor is the division of labor
between the two units clear or understandable (2.37).
Delivery of Education and Support Services to Students in Relation to Financial Health:
Respondents understood the relationship of class size, support services, and educational
quality with the District’s financial health (2.90), as well as the relationship between
average class size and the ability of the district to provide competitive salary and benefits,
adequate instructional supplies, and afford new program development (2.84).
The Collaborative Brain Trust 132
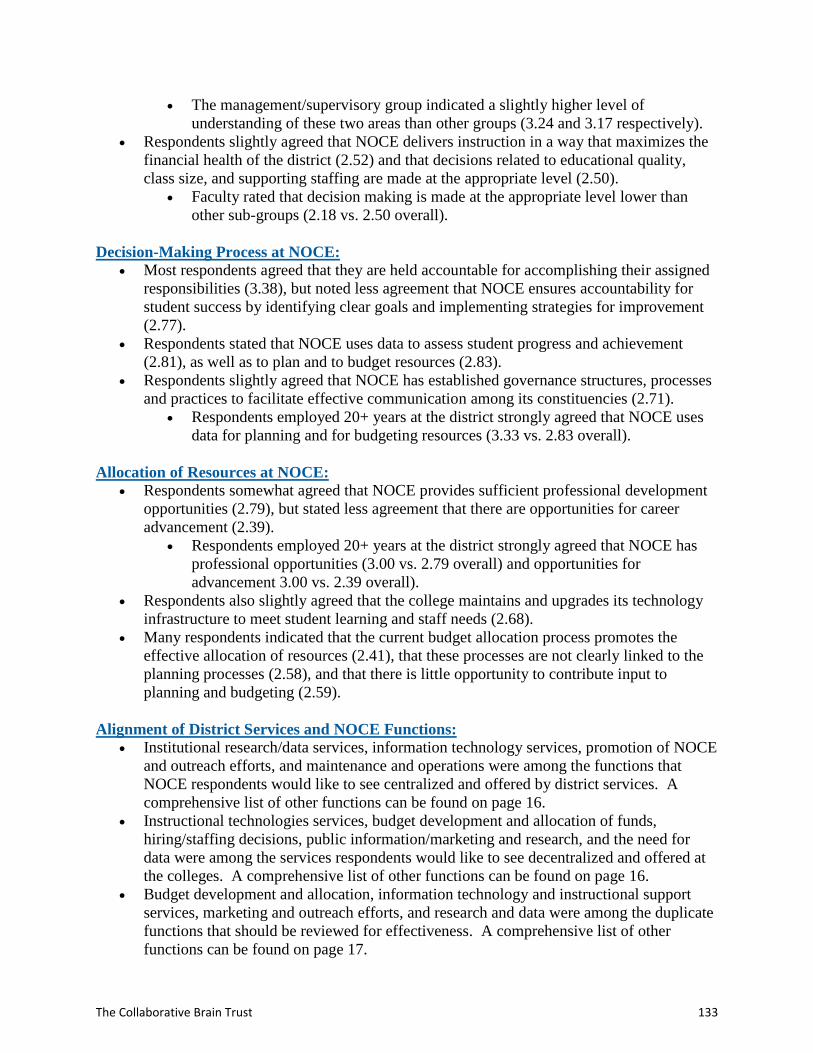
The management/supervisory group indicated a slightly higher level of
understanding of these two areas than other groups (3.24 and 3.17 respectively).
Respondents slightly agreed that NOCE delivers instruction in a way that maximizes the
financial health of the district (2.52) and that decisions related to educational quality,
class size, and supporting staffing are made at the appropriate level (2.50).
Faculty rated that decision making is made at the appropriate level lower than
other sub-groups (2.18 vs. 2.50 overall).
Decision-Making Process at NOCE:
Most respondents agreed that they are held accountable for accomplishing their assigned
responsibilities (3.38), but noted less agreement that NOCE ensures accountability for
student success by identifying clear goals and implementing strategies for improvement
(2.77).
Respondents stated that NOCE uses data to assess student progress and achievement
(2.81), as well as to plan and to budget resources (2.83).
Respondents slightly agreed that NOCE has established governance structures, processes
and practices to facilitate effective communication among its constituencies (2.71).
Respondents employed 20+ years at the district strongly agreed that NOCE uses
data for planning and for budgeting resources (3.33 vs. 2.83 overall).
Allocation of Resources at NOCE:
Respondents somewhat agreed that NOCE provides sufficient professional development
opportunities (2.79), but stated less agreement that there are opportunities for career
advancement (2.39).
Respondents employed 20+ years at the district strongly agreed that NOCE has
professional opportunities (3.00 vs. 2.79 overall) and opportunities for
advancement 3.00 vs. 2.39 overall).
Respondents also slightly agreed that the college maintains and upgrades its technology
infrastructure to meet student learning and staff needs (2.68).
Many respondents indicated that the current budget allocation process promotes the
effective allocation of resources (2.41), that these processes are not clearly linked to the
planning processes (2.58), and that there is little opportunity to contribute input to
planning and budgeting (2.59).
Alignment of District Services and NOCE Functions:
Institutional research/data services, information technology services, promotion of NOCE
and outreach efforts, and maintenance and operations were among the functions that
NOCE respondents would like to see centralized and offered by district services. A
comprehensive list of other functions can be found on page 16.
Instructional technologies services, budget development and allocation of funds,
hiring/staffing decisions, public information/marketing and research, and the need for
data were among the services respondents would like to see decentralized and offered at
the colleges. A comprehensive list of other functions can be found on page 16.
Budget development and allocation, information technology and instructional support
services, marketing and outreach efforts, and research and data were among the duplicate
functions that should be reviewed for effectiveness. A comprehensive list of other
functions can be found on page 17.
The Collaborative Brain Trust 133
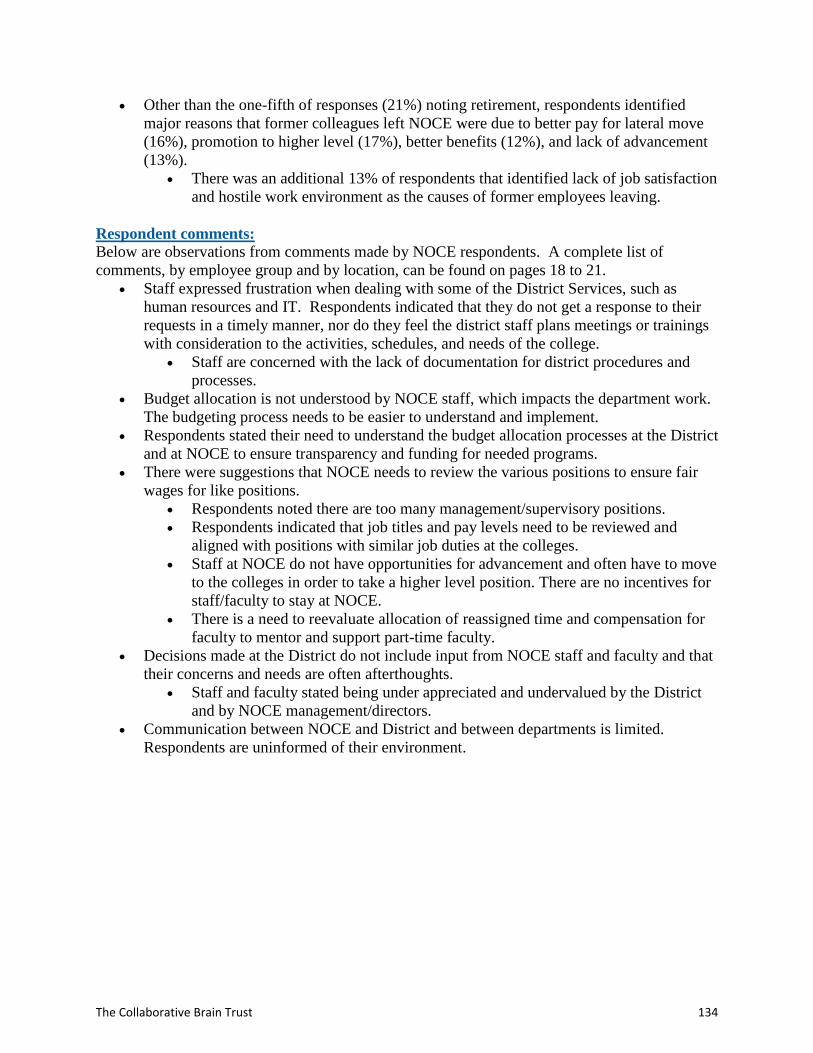
Other than the one-fifth of responses (21%) noting retirement, respondents identified
major reasons that former colleagues left NOCE were due to better pay for lateral move
(16%), promotion to higher level (17%), better benefits (12%), and lack of advancement
(13%).
There was an additional 13% of respondents that identified lack of job satisfaction
and hostile work environment as the causes of former employees leaving.
Respondent comments:
Below are observations from comments made by NOCE respondents. A complete list of
comments, by employee group and by location, can be found on pages 18 to 21.
Staff expressed frustration when dealing with some of the District Services, such as
human resources and IT. Respondents indicated that they do not get a response to their
requests in a timely manner, nor do they feel the district staff plans meetings or trainings
with consideration to the activities, schedules, and needs of the college.
Staff are concerned with the lack of documentation for district procedures and
processes.
Budget allocation is not understood by NOCE staff, which impacts the department work.
The budgeting process needs to be easier to understand and implement.
Respondents stated their need to understand the budget allocation processes at the District
and at NOCE to ensure transparency and funding for needed programs.
There were suggestions that NOCE needs to review the various positions to ensure fair
wages for like positions.
Respondents noted there are too many management/supervisory positions.
Respondents indicated that job titles and pay levels need to be reviewed and
aligned with positions with similar job duties at the colleges.
Staff at NOCE do not have opportunities for advancement and often have to move
to the colleges in order to take a higher level position. There are no incentives for
staff/faculty to stay at NOCE.
There is a need to reevaluate allocation of reassigned time and compensation for
faculty to mentor and support part-time faculty.
Decisions made at the District do not include input from NOCE staff and faculty and that
their concerns and needs are often afterthoughts.
Staff and faculty stated being under appreciated and undervalued by the District
and by NOCE management/directors.
Communication between NOCE and District and between departments is limited.
Respondents are uninformed of their environment.
The Collaborative Brain Trust 134
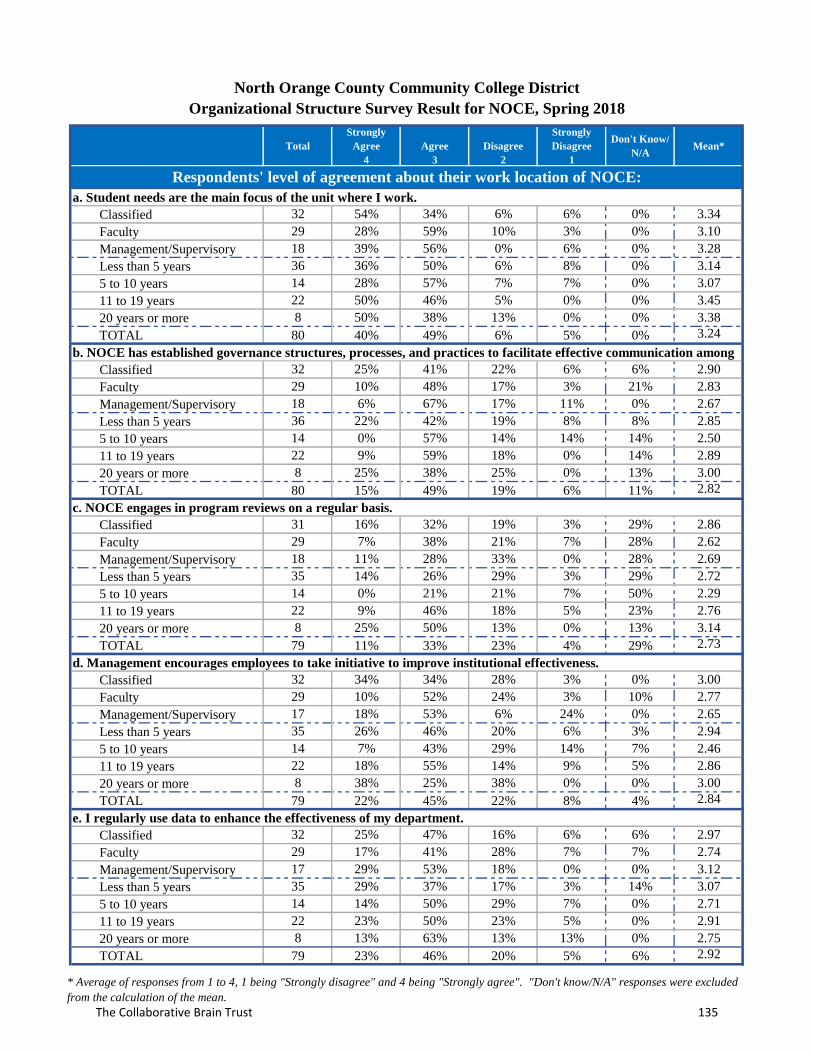
Total
Strongly
Agree
4
Agree
3
Disagree
2
Strongly
Disagree
1
Don't Know/
N/AMean*
Classified 32 54% 34% 6% 6% 0% 3.34
Faculty 29 28% 59% 10% 3% 0% 3.10
Management/Supervisory 18 39% 56% 0% 6% 0% 3.28
Less than 5 years 36 36% 50% 6% 8% 0% 3.14
5 to 10 years 14 28% 57% 7% 7% 0% 3.07
11 to 19 years 22 50% 46% 5% 0% 0% 3.45
20 years or more 8 50% 38% 13% 0% 0% 3.38
TOTAL 80 40% 49% 6% 5% 0% 3.24
Classified 32 25% 41% 22% 6% 6% 2.90
Faculty 29 10% 48% 17% 3% 21% 2.83
Management/Supervisory 18 6% 67% 17% 11% 0% 2.67
Less than 5 years 36 22% 42% 19% 8% 8% 2.85
5 to 10 years 14 0% 57% 14% 14% 14% 2.50
11 to 19 years 22 9% 59% 18% 0% 14% 2.89
20 years or more 8 25% 38% 25% 0% 13% 3.00
TOTAL 80 15% 49% 19% 6% 11% 2.82
Classified 31 16% 32% 19% 3% 29% 2.86
Faculty 29 7% 38% 21% 7% 28% 2.62
Management/Supervisory 18 11% 28% 33% 0% 28% 2.69
Less than 5 years 35 14% 26% 29% 3% 29% 2.72
5 to 10 years 14 0% 21% 21% 7% 50% 2.29
11 to 19 years 22 9% 46% 18% 5% 23% 2.76
20 years or more 8 25% 50% 13% 0% 13% 3.14
TOTAL 79 11% 33% 23% 4% 29% 2.73
Classified 32 34% 34% 28% 3% 0% 3.00
Faculty 29 10% 52% 24% 3% 10% 2.77
Management/Supervisory 17 18% 53% 6% 24% 0% 2.65
Less than 5 years 35 26% 46% 20% 6% 3% 2.94
5 to 10 years 14 7% 43% 29% 14% 7% 2.46
11 to 19 years 22 18% 55% 14% 9% 5% 2.86
20 years or more 8 38% 25% 38% 0% 0% 3.00
TOTAL 79 22% 45% 22% 8% 4% 2.84
Classified 32 25% 47% 16% 6% 6% 2.97
Faculty 29 17% 41% 28% 7% 7% 2.74
Management/Supervisory 17 29% 53% 18% 0% 0% 3.12
Less than 5 years 35 29% 37% 17% 3% 14% 3.07
5 to 10 years 14 14% 50% 29% 7% 0% 2.71
11 to 19 years 22 23% 50% 23% 5% 0% 2.91
20 years or more 8 13% 63% 13% 13% 0% 2.75
TOTAL 79 23% 46% 20% 5% 6% 2.92
North Orange County Community College District
Organizational Structure Survey Result for NOCE, Spring 2018
a. Student needs are the main focus of the unit where I work.
Respondents' level of agreement about their work location of NOCE:
b. NOCE has established governance structures, processes, and practices to facilitate effective communication among
c. NOCE engages in program reviews on a regular basis.
d. Management encourages employees to take initiative to improve institutional effectiveness.
e. I regularly use data to enhance the effectiveness of my department.
* Average of responses from 1 to 4, 1 being "Strongly disagree" and 4 being "Strongly agree". "Don't know/N/A" responses were excluded
from the calculation of the mean.
The Collaborative Brain Trust 135
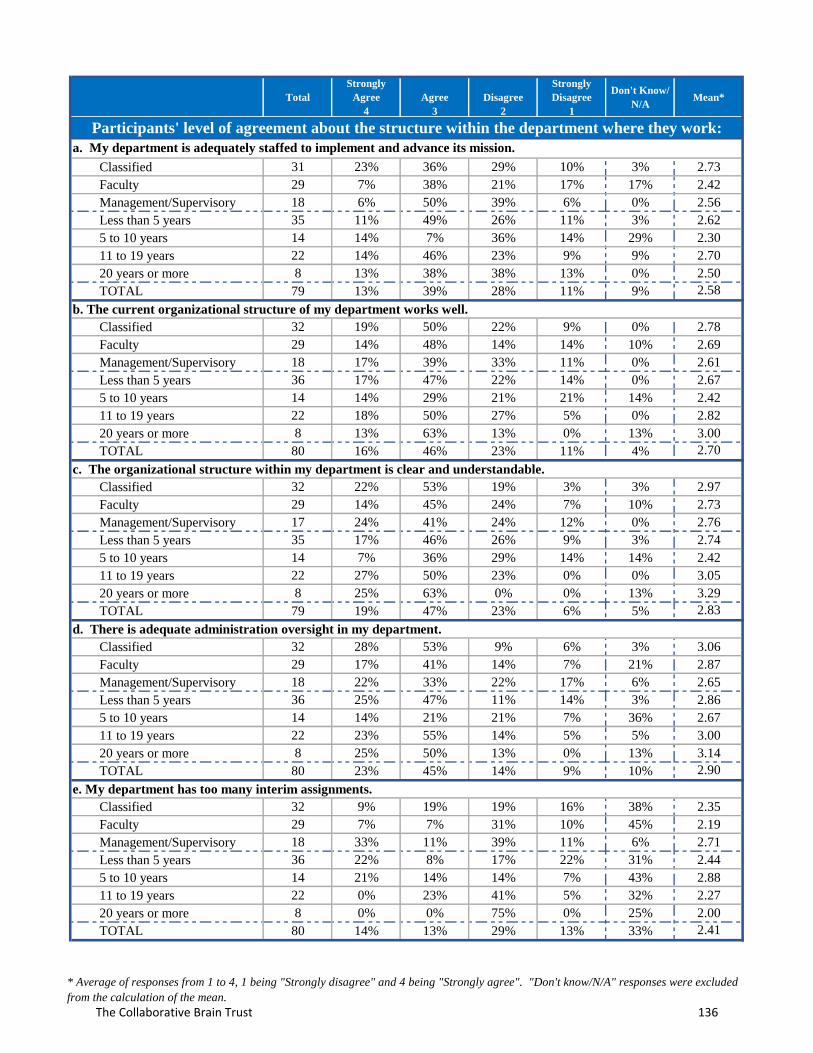
Total
Strongly
Agree
4
Agree
3
Disagree
2
Strongly
Disagree
1
Don't Know/
N/AMean*
a. My department is adequately staffed to implement and advance its mission.
Classified 31 23% 36% 29% 10% 3% 2.73
Faculty 29 7% 38% 21% 17% 17% 2.42
Management/Supervisory 18 6% 50% 39% 6% 0% 2.56
Less than 5 years 35 11% 49% 26% 11% 3% 2.62
5 to 10 years 14 14% 7% 36% 14% 29% 2.30
11 to 19 years 22 14% 46% 23% 9% 9% 2.70
20 years or more 8 13% 38% 38% 13% 0% 2.50
TOTAL 79 13% 39% 28% 11% 9% 2.58
Classified 32 19% 50% 22% 9% 0% 2.78
Faculty 29 14% 48% 14% 14% 10% 2.69
Management/Supervisory 18 17% 39% 33% 11% 0% 2.61
Less than 5 years 36 17% 47% 22% 14% 0% 2.67
5 to 10 years 14 14% 29% 21% 21% 14% 2.42
11 to 19 years 22 18% 50% 27% 5% 0% 2.82
20 years or more 8 13% 63% 13% 0% 13% 3.00
TOTAL 80 16% 46% 23% 11% 4% 2.70
Classified 32 22% 53% 19% 3% 3% 2.97
Faculty 29 14% 45% 24% 7% 10% 2.73
Management/Supervisory 17 24% 41% 24% 12% 0% 2.76
Less than 5 years 35 17% 46% 26% 9% 3% 2.74
5 to 10 years 14 7% 36% 29% 14% 14% 2.42
11 to 19 years 22 27% 50% 23% 0% 0% 3.05
20 years or more 8 25% 63% 0% 0% 13% 3.29
TOTAL 79 19% 47% 23% 6% 5% 2.83
d. There is adequate administration oversight in my department.
Classified 32 28% 53% 9% 6% 3% 3.06
Faculty 29 17% 41% 14% 7% 21% 2.87
Management/Supervisory 18 22% 33% 22% 17% 6% 2.65
Less than 5 years 36 25% 47% 11% 14% 3% 2.86
5 to 10 years 14 14% 21% 21% 7% 36% 2.67
11 to 19 years 22 23% 55% 14% 5% 5% 3.00
20 years or more 8 25% 50% 13% 0% 13% 3.14
TOTAL 80 23% 45% 14% 9% 10% 2.90
e. My department has too many interim assignments.
Classified 32 9% 19% 19% 16% 38% 2.35
Faculty 29 7% 7% 31% 10% 45% 2.19
Management/Supervisory 18 33% 11% 39% 11% 6% 2.71
Less than 5 years 36 22% 8% 17% 22% 31% 2.44
5 to 10 years 14 21% 14% 14% 7% 43% 2.88
11 to 19 years 22 0% 23% 41% 5% 32% 2.27
20 years or more 8 0% 0% 75% 0% 25% 2.00
TOTAL 80 14% 13% 29% 13% 33% 2.41
Participants' level of agreement about the structure within the department where they work:
b. The current organizational structure of my department works well.
c. The organizational structure within my department is clear and understandable.
* Average of responses from 1 to 4, 1 being "Strongly disagree" and 4 being "Strongly agree". "Don't know/N/A" responses were excluded
from the calculation of the mean.
The Collaborative Brain Trust 136

Total
Strongly
Agree
4
Agree
3
Disagree
2
Strongly
Disagree
1
Don't Know/
N/AMean*
f. Responsibilities are evenly distributed among staff within my department.
Classified 31 13% 32% 36% 19% 0% 2.39
Faculty 29 7% 31% 17% 10% 35% 2.53
Management/Supervisory 18 17% 50% 28% 6% 0% 2.78
Less than 5 years 36 14% 36% 31% 11% 8% 2.58
5 to 10 years 14 0% 29% 21% 14% 36% 2.22
11 to 19 years 22 14% 36% 27% 14% 9% 2.55
20 years or more 7 14% 43% 14% 14% 14% 2.67
TOTAL 79 11% 35% 27% 13% 14% 2.53
* Average of responses from 1 to 4, 1 being "Strongly disagree" and 4 being "Strongly agree". "Don't know/N/A" responses were excluded
from the calculation of the mean.
The Collaborative Brain Trust 137
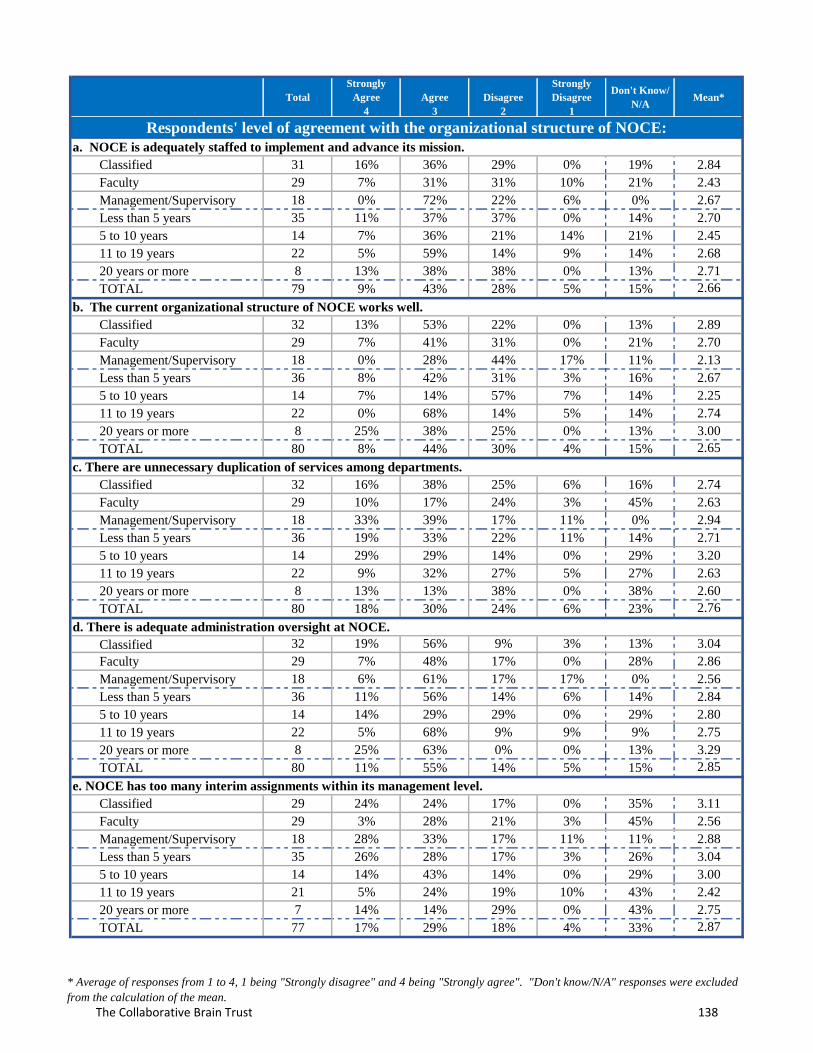
Total
Strongly
Agree
4
Agree
3
Disagree
2
Strongly
Disagree
1
Don't Know/
N/AMean*
a. NOCE is adequately staffed to implement and advance its mission.
Classified 31 16% 36% 29% 0% 19% 2.84
Faculty 29 7% 31% 31% 10% 21% 2.43
Management/Supervisory 18 0% 72% 22% 6% 0% 2.67
Less than 5 years 35 11% 37% 37% 0% 14% 2.70
5 to 10 years 14 7% 36% 21% 14% 21% 2.45
11 to 19 years 22 5% 59% 14% 9% 14% 2.68
20 years or more 8 13% 38% 38% 0% 13% 2.71
TOTAL 79 9% 43% 28% 5% 15% 2.66
b. The current organizational structure of NOCE works well.
Classified 32 13% 53% 22% 0% 13% 2.89
Faculty 29 7% 41% 31% 0% 21% 2.70
Management/Supervisory 18 0% 28% 44% 17% 11% 2.13
Less than 5 years 36 8% 42% 31% 3% 16% 2.67
5 to 10 years 14 7% 14% 57% 7% 14% 2.25
11 to 19 years 22 0% 68% 14% 5% 14% 2.74
20 years or more 8 25% 38% 25% 0% 13% 3.00
TOTAL 80 8% 44% 30% 4% 15% 2.65
c. There are unnecessary duplication of services among departments.
Classified 32 16% 38% 25% 6% 16% 2.74
Faculty 29 10% 17% 24% 3% 45% 2.63
Management/Supervisory 18 33% 39% 17% 11% 0% 2.94
Less than 5 years 36 19% 33% 22% 11% 14% 2.71
5 to 10 years 14 29% 29% 14% 0% 29% 3.20
11 to 19 years 22 9% 32% 27% 5% 27% 2.63
20 years or more 8 13% 13% 38% 0% 38% 2.60
TOTAL 80 18% 30% 24% 6% 23% 2.76
d. There is adequate administration oversight at NOCE.
Classified 32 19% 56% 9% 3% 13% 3.04
Faculty 29 7% 48% 17% 0% 28% 2.86
Management/Supervisory 18 6% 61% 17% 17% 0% 2.56
Less than 5 years 36 11% 56% 14% 6% 14% 2.84
5 to 10 years 14 14% 29% 29% 0% 29% 2.80
11 to 19 years 22 5% 68% 9% 9% 9% 2.75
20 years or more 8 25% 63% 0% 0% 13% 3.29
TOTAL 80 11% 55% 14% 5% 15% 2.85
e. NOCE has too many interim assignments within its management level.
Classified 29 24% 24% 17% 0% 35% 3.11
Faculty 29 3% 28% 21% 3% 45% 2.56
Management/Supervisory 18 28% 33% 17% 11% 11% 2.88
Less than 5 years 35 26% 28% 17% 3% 26% 3.04
5 to 10 years 14 14% 43% 14% 0% 29% 3.00
11 to 19 years 21 5% 24% 19% 10% 43% 2.42
20 years or more 7 14% 14% 29% 0% 43% 2.75
TOTAL 77 17% 29% 18% 4% 33% 2.87
Respondents' level of agreement with the organizational structure of NOCE:
* Average of responses from 1 to 4, 1 being "Strongly disagree" and 4 being "Strongly agree". "Don't know/N/A" responses were excluded
from the calculation of the mean.
The Collaborative Brain Trust 138
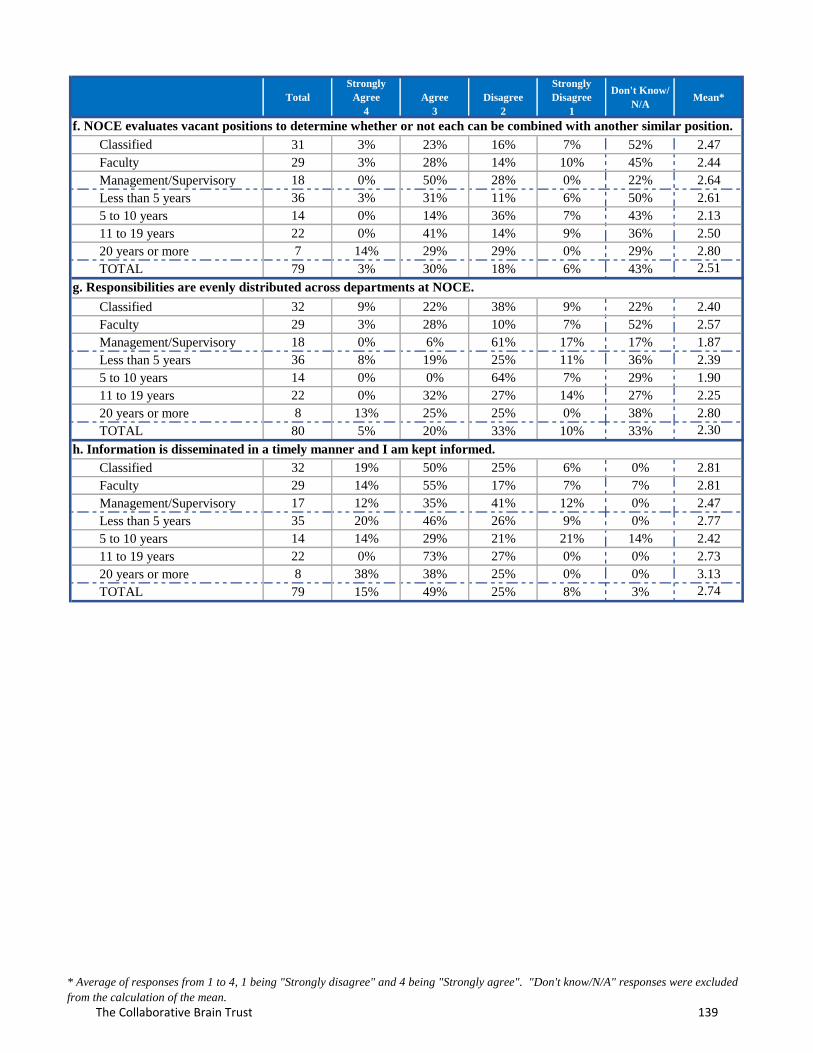
Total
Strongly
Agree
4
Agree
3
Disagree
2
Strongly
Disagree
1
Don't Know/
N/AMean*
Classified 31 3% 23% 16% 7% 52% 2.47
Faculty 29 3% 28% 14% 10% 45% 2.44
Management/Supervisory 18 0% 50% 28% 0% 22% 2.64
Less than 5 years 36 3% 31% 11% 6% 50% 2.61
5 to 10 years 14 0% 14% 36% 7% 43% 2.13
11 to 19 years 22 0% 41% 14% 9% 36% 2.50
20 years or more 7 14% 29% 29% 0% 29% 2.80
TOTAL 79 3% 30% 18% 6% 43% 2.51
Classified 32 9% 22% 38% 9% 22% 2.40
Faculty 29 3% 28% 10% 7% 52% 2.57
Management/Supervisory 18 0% 6% 61% 17% 17% 1.87
Less than 5 years 36 8% 19% 25% 11% 36% 2.39
5 to 10 years 14 0% 0% 64% 7% 29% 1.90
11 to 19 years 22 0% 32% 27% 14% 27% 2.25
20 years or more 8 13% 25% 25% 0% 38% 2.80
TOTAL 80 5% 20% 33% 10% 33% 2.30
Classified 32 19% 50% 25% 6% 0% 2.81
Faculty 29 14% 55% 17% 7% 7% 2.81
Management/Supervisory 17 12% 35% 41% 12% 0% 2.47
Less than 5 years 35 20% 46% 26% 9% 0% 2.77
5 to 10 years 14 14% 29% 21% 21% 14% 2.42
11 to 19 years 22 0% 73% 27% 0% 0% 2.73
20 years or more 8 38% 38% 25% 0% 0% 3.13
TOTAL 79 15% 49% 25% 8% 3% 2.74
g. Responsibilities are evenly distributed across departments at NOCE.
h. Information is disseminated in a timely manner and I am kept informed.
f. NOCE evaluates vacant positions to determine whether or not each can be combined with another similar position.
* Average of responses from 1 to 4, 1 being "Strongly disagree" and 4 being "Strongly agree". "Don't know/N/A" responses were excluded
from the calculation of the mean.
The Collaborative Brain Trust 139

Total
Strongly
Agree
4
Agree
3
Disagree
2
Strongly
Disagree
1
Don't Know/
N/AMean*
Classified 32 9% 31% 22% 3% 34% 2.71
Faculty 29 7% 21% 17% 0% 55% 2.77
Management/Supervisory 18 6% 56% 22% 0% 17% 2.80
Less than 5 years 36 3% 28% 22% 3% 44% 2.55
5 to 10 years 14 7% 14% 14% 0% 64% 2.80
11 to 19 years 22 5% 55% 23% 0% 18% 2.78
20 years or more 8 38% 25% 13% 0% 25% 3.33
TOTAL 80 8% 33% 20% 1% 38% 2.76
Classified 32 9% 31% 25% 3% 31% 2.68
Faculty 29 3% 10% 14% 7% 66% 2.30
Management/Supervisory 18 0% 11% 56% 6% 28% 2.08
Less than 5 years 36 6% 17% 22% 8% 47% 2.37
5 to 10 years 14 7% 0% 36% 7% 50% 2.14
11 to 19 years 22 0% 32% 32% 0% 36% 2.50
20 years or more 8 13% 25% 25% 0% 38% 2.80
TOTAL 80 5% 19% 28% 5% 44% 2.42
c. The current division of labor between District Services and NOCE is clear and understandable.
Classified 32 6% 41% 25% 3% 25% 2.67
Faculty 29 3% 14% 7% 10% 66% 2.30
Management/Supervisory 18 0% 22% 50% 22% 6% 2.00
Less than 5 years 36 6% 17% 22% 14% 42% 2.24
5 to 10 years 14 0% 14% 36% 14% 36% 2.00
11 to 19 years 22 0% 50% 18% 5% 27% 2.63
20 years or more 8 13% 25% 25% 0% 38% 2.80
TOTAL 80 4% 26% 24% 10% 36% 2.37
Classified 31 16% 45% 13% 10% 16% 2.81
Faculty 29 7% 28% 14% 3% 48% 2.73
Management/Supervisory 18 6% 50% 22% 6% 17% 2.67
Less than 5 years 35 11% 37% 17% 9% 26% 2.69
5 to 10 years 14 14% 7% 21% 7% 50% 2.57
11 to 19 years 22 0% 73% 5% 5% 18% 2.83
20 years or more 8 25% 25% 25% 0% 25% 3.00
TOTAL 79 10% 41% 15% 6% 28% 2.75
e. The district effectively communicates and advocates for NOCE in the community and the state.
Classified 32 19% 41% 6% 6% 28% 3.00
Faculty 29 14% 17% 21% 3% 45% 2.75
Management/Supervisory 18 17% 33% 22% 6% 22% 2.79
Less than 5 years 36 17% 28% 17% 6% 33% 2.83
5 to 10 years 14 7% 7% 29% 14% 43% 2.13
11 to 19 years 22 18% 50% 9% 0% 23% 3.13
20 years or more 8 25% 25% 0% 0% 50% 3.50
TOTAL 80 16% 30% 15% 5% 34% 2.87
Respondents' level of agreement with the organizational structure of District Services:
a. District Services is adequately staffed to implement and advance its mission.
b. The current balance of centralization and decentralization services between District Services and NOCE works
well.
d. District Services adequately supports the work of NOCE.
* Average of responses from 1 to 4, 1 being "Strongly disagree" and 4 being "Strongly agree". "Don't know/N/A" responses were excluded
from the calculation of the mean.
The Collaborative Brain Trust 140
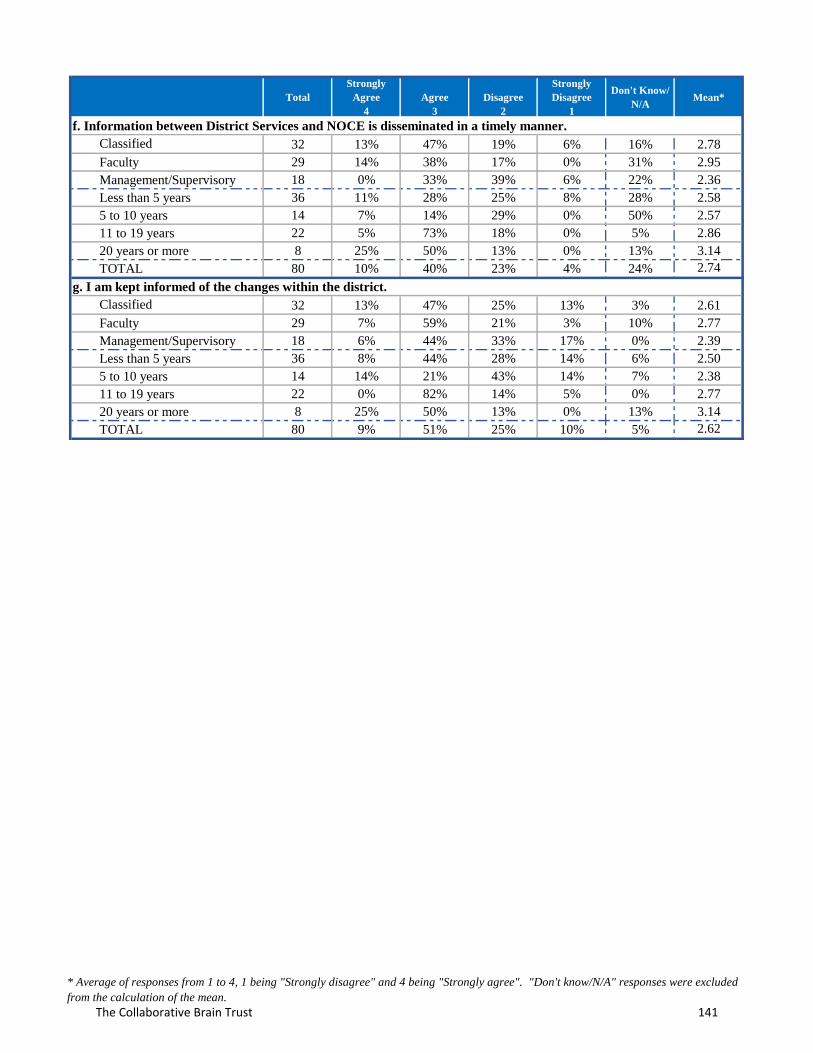
Total
Strongly
Agree
4
Agree
3
Disagree
2
Strongly
Disagree
1
Don't Know/
N/AMean*
Classified 32 13% 47% 19% 6% 16% 2.78
Faculty 29 14% 38% 17% 0% 31% 2.95
Management/Supervisory 18 0% 33% 39% 6% 22% 2.36
Less than 5 years 36 11% 28% 25% 8% 28% 2.58
5 to 10 years 14 7% 14% 29% 0% 50% 2.57
11 to 19 years 22 5% 73% 18% 0% 5% 2.86
20 years or more 8 25% 50% 13% 0% 13% 3.14
TOTAL 80 10% 40% 23% 4% 24% 2.74
Classified 32 13% 47% 25% 13% 3% 2.61
Faculty 29 7% 59% 21% 3% 10% 2.77
Management/Supervisory 18 6% 44% 33% 17% 0% 2.39
Less than 5 years 36 8% 44% 28% 14% 6% 2.50
5 to 10 years 14 14% 21% 43% 14% 7% 2.38
11 to 19 years 22 0% 82% 14% 5% 0% 2.77
20 years or more 8 25% 50% 13% 0% 13% 3.14
TOTAL 80 9% 51% 25% 10% 5% 2.62
f. Information between District Services and NOCE is disseminated in a timely manner.
g. I am kept informed of the changes within the district.
* Average of responses from 1 to 4, 1 being "Strongly disagree" and 4 being "Strongly agree". "Don't know/N/A" responses were excluded
from the calculation of the mean.
The Collaborative Brain Trust 141
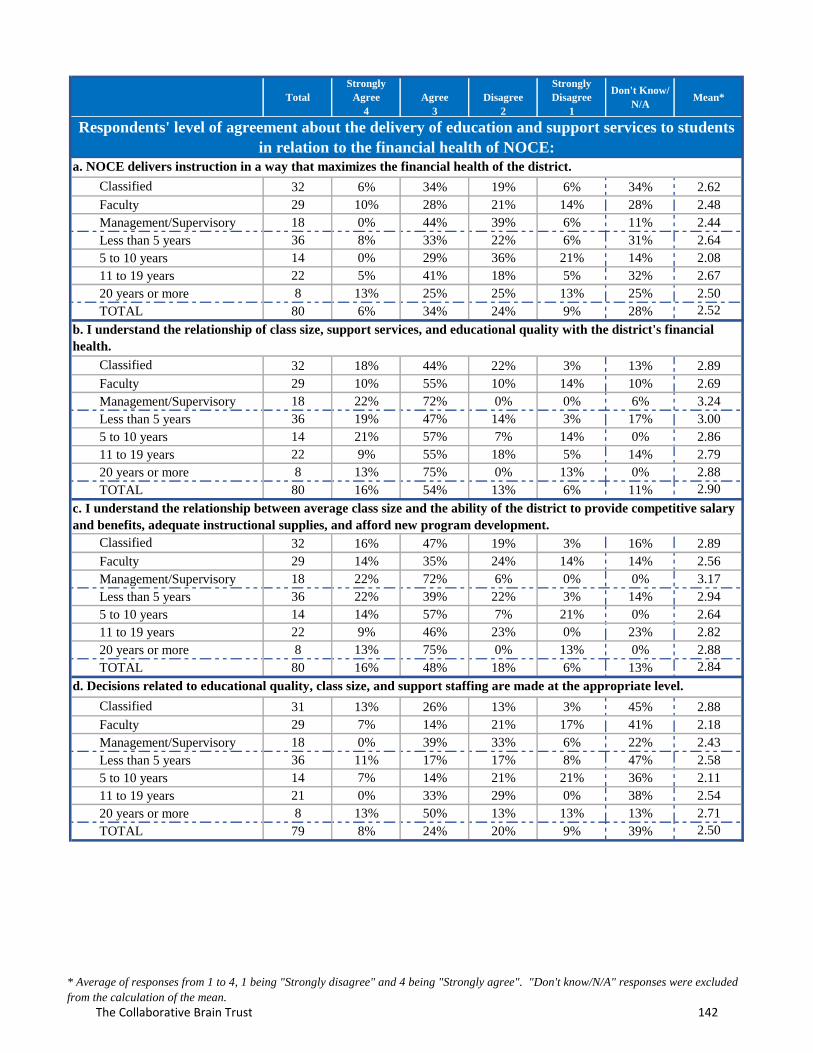
Total
Strongly
Agree
4
Agree
3
Disagree
2
Strongly
Disagree
1
Don't Know/
N/AMean*
Classified 32 6% 34% 19% 6% 34% 2.62
Faculty 29 10% 28% 21% 14% 28% 2.48
Management/Supervisory 18 0% 44% 39% 6% 11% 2.44
Less than 5 years 36 8% 33% 22% 6% 31% 2.64
5 to 10 years 14 0% 29% 36% 21% 14% 2.08
11 to 19 years 22 5% 41% 18% 5% 32% 2.67
20 years or more 8 13% 25% 25% 13% 25% 2.50
TOTAL 80 6% 34% 24% 9% 28% 2.52
Classified 32 18% 44% 22% 3% 13% 2.89
Faculty 29 10% 55% 10% 14% 10% 2.69
Management/Supervisory 18 22% 72% 0% 0% 6% 3.24
Less than 5 years 36 19% 47% 14% 3% 17% 3.00
5 to 10 years 14 21% 57% 7% 14% 0% 2.86
11 to 19 years 22 9% 55% 18% 5% 14% 2.79
20 years or more 8 13% 75% 0% 13% 0% 2.88
TOTAL 80 16% 54% 13% 6% 11% 2.90
Classified 32 16% 47% 19% 3% 16% 2.89
Faculty 29 14% 35% 24% 14% 14% 2.56
Management/Supervisory 18 22% 72% 6% 0% 0% 3.17
Less than 5 years 36 22% 39% 22% 3% 14% 2.94
5 to 10 years 14 14% 57% 7% 21% 0% 2.64
11 to 19 years 22 9% 46% 23% 0% 23% 2.82
20 years or more 8 13% 75% 0% 13% 0% 2.88
TOTAL 80 16% 48% 18% 6% 13% 2.84
Classified 31 13% 26% 13% 3% 45% 2.88
Faculty 29 7% 14% 21% 17% 41% 2.18
Management/Supervisory 18 0% 39% 33% 6% 22% 2.43
Less than 5 years 36 11% 17% 17% 8% 47% 2.58
5 to 10 years 14 7% 14% 21% 21% 36% 2.11
11 to 19 years 21 0% 33% 29% 0% 38% 2.54
20 years or more 8 13% 50% 13% 13% 13% 2.71
TOTAL 79 8% 24% 20% 9% 39% 2.50
b. I understand the relationship of class size, support services, and educational quality with the district's financial
health.
a. NOCE delivers instruction in a way that maximizes the financial health of the district.
Respondents' level of agreement about the delivery of education and support services to students
in relation to the financial health of NOCE:
c. I understand the relationship between average class size and the ability of the district to provide competitive salary
and benefits, adequate instructional supplies, and afford new program development.
d. Decisions related to educational quality, class size, and support staffing are made at the appropriate level.
* Average of responses from 1 to 4, 1 being "Strongly disagree" and 4 being "Strongly agree". "Don't know/N/A" responses were excluded
from the calculation of the mean.
The Collaborative Brain Trust 142
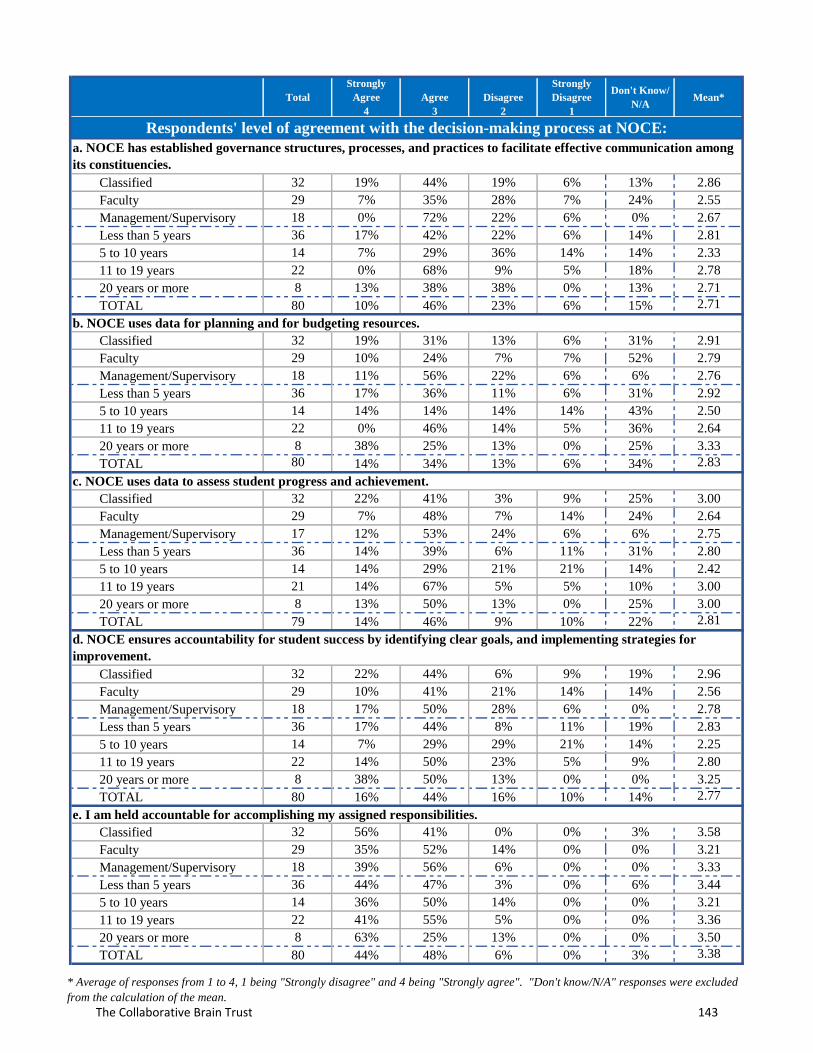
Total
Strongly
Agree
4
Agree
3
Disagree
2
Strongly
Disagree
1
Don't Know/
N/AMean*
Classified 32 19% 44% 19% 6% 13% 2.86
Faculty 29 7% 35% 28% 7% 24% 2.55
Management/Supervisory 18 0% 72% 22% 6% 0% 2.67
Less than 5 years 36 17% 42% 22% 6% 14% 2.81
5 to 10 years 14 7% 29% 36% 14% 14% 2.33
11 to 19 years 22 0% 68% 9% 5% 18% 2.78
20 years or more 8 13% 38% 38% 0% 13% 2.71
TOTAL 80 10% 46% 23% 6% 15% 2.71
Classified 32 19% 31% 13% 6% 31% 2.91
Faculty 29 10% 24% 7% 7% 52% 2.79
Management/Supervisory 18 11% 56% 22% 6% 6% 2.76
Less than 5 years 36 17% 36% 11% 6% 31% 2.92
5 to 10 years 14 14% 14% 14% 14% 43% 2.50
11 to 19 years 22 0% 46% 14% 5% 36% 2.64
20 years or more 8 38% 25% 13% 0% 25% 3.33
TOTAL 80 14% 34% 13% 6% 34% 2.83
c. NOCE uses data to assess student progress and achievement.
Classified 32 22% 41% 3% 9% 25% 3.00
Faculty 29 7% 48% 7% 14% 24% 2.64
Management/Supervisory 17 12% 53% 24% 6% 6% 2.75
Less than 5 years 36 14% 39% 6% 11% 31% 2.80
5 to 10 years 14 14% 29% 21% 21% 14% 2.42
11 to 19 years 21 14% 67% 5% 5% 10% 3.00
20 years or more 8 13% 50% 13% 0% 25% 3.00
TOTAL 79 14% 46% 9% 10% 22% 2.81
Classified 32 22% 44% 6% 9% 19% 2.96
Faculty 29 10% 41% 21% 14% 14% 2.56
Management/Supervisory 18 17% 50% 28% 6% 0% 2.78
Less than 5 years 36 17% 44% 8% 11% 19% 2.83
5 to 10 years 14 7% 29% 29% 21% 14% 2.25
11 to 19 years 22 14% 50% 23% 5% 9% 2.80
20 years or more 8 38% 50% 13% 0% 0% 3.25
TOTAL 80 16% 44% 16% 10% 14% 2.77
Classified 32 56% 41% 0% 0% 3% 3.58
Faculty 29 35% 52% 14% 0% 0% 3.21
Management/Supervisory 18 39% 56% 6% 0% 0% 3.33
Less than 5 years 36 44% 47% 3% 0% 6% 3.44
5 to 10 years 14 36% 50% 14% 0% 0% 3.21
11 to 19 years 22 41% 55% 5% 0% 0% 3.36
20 years or more 8 63% 25% 13% 0% 0% 3.50
TOTAL 80 44% 48% 6% 0% 3% 3.38
b. NOCE uses data for planning and for budgeting resources.
d. NOCE ensures accountability for student success by identifying clear goals, and implementing strategies for
improvement.
e. I am held accountable for accomplishing my assigned responsibilities.
a. NOCE has established governance structures, processes, and practices to facilitate effective communication among
its constituencies.
Respondents' level of agreement with the decision-making process at NOCE:
* Average of responses from 1 to 4, 1 being "Strongly disagree" and 4 being "Strongly agree". "Don't know/N/A" responses were excluded
from the calculation of the mean.
The Collaborative Brain Trust 143
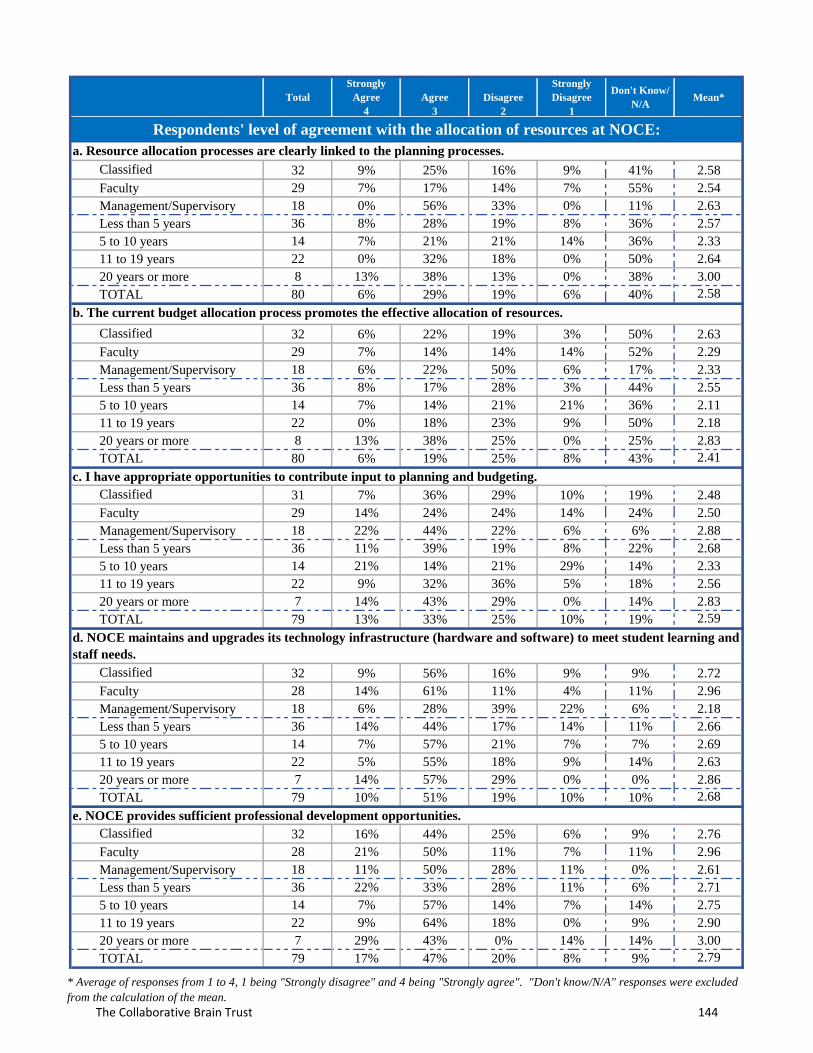
Total
Strongly
Agree
4
Agree
3
Disagree
2
Strongly
Disagree
1
Don't Know/
N/AMean*
Classified 32 9% 25% 16% 9% 41% 2.58
Faculty 29 7% 17% 14% 7% 55% 2.54
Management/Supervisory 18 0% 56% 33% 0% 11% 2.63
Less than 5 years 36 8% 28% 19% 8% 36% 2.57
5 to 10 years 14 7% 21% 21% 14% 36% 2.33
11 to 19 years 22 0% 32% 18% 0% 50% 2.64
20 years or more 8 13% 38% 13% 0% 38% 3.00
TOTAL 80 6% 29% 19% 6% 40% 2.58
Classified 32 6% 22% 19% 3% 50% 2.63
Faculty 29 7% 14% 14% 14% 52% 2.29
Management/Supervisory 18 6% 22% 50% 6% 17% 2.33
Less than 5 years 36 8% 17% 28% 3% 44% 2.55
5 to 10 years 14 7% 14% 21% 21% 36% 2.11
11 to 19 years 22 0% 18% 23% 9% 50% 2.18
20 years or more 8 13% 38% 25% 0% 25% 2.83
TOTAL 80 6% 19% 25% 8% 43% 2.41
Classified 31 7% 36% 29% 10% 19% 2.48
Faculty 29 14% 24% 24% 14% 24% 2.50
Management/Supervisory 18 22% 44% 22% 6% 6% 2.88
Less than 5 years 36 11% 39% 19% 8% 22% 2.68
5 to 10 years 14 21% 14% 21% 29% 14% 2.33
11 to 19 years 22 9% 32% 36% 5% 18% 2.56
20 years or more 7 14% 43% 29% 0% 14% 2.83
TOTAL 79 13% 33% 25% 10% 19% 2.59
Classified 32 9% 56% 16% 9% 9% 2.72
Faculty 28 14% 61% 11% 4% 11% 2.96
Management/Supervisory 18 6% 28% 39% 22% 6% 2.18
Less than 5 years 36 14% 44% 17% 14% 11% 2.66
5 to 10 years 14 7% 57% 21% 7% 7% 2.69
11 to 19 years 22 5% 55% 18% 9% 14% 2.63
20 years or more 7 14% 57% 29% 0% 0% 2.86
TOTAL 79 10% 51% 19% 10% 10% 2.68
Classified 32 16% 44% 25% 6% 9% 2.76
Faculty 28 21% 50% 11% 7% 11% 2.96
Management/Supervisory 18 11% 50% 28% 11% 0% 2.61
Less than 5 years 36 22% 33% 28% 11% 6% 2.71
5 to 10 years 14 7% 57% 14% 7% 14% 2.75
11 to 19 years 22 9% 64% 18% 0% 9% 2.90
20 years or more 7 29% 43% 0% 14% 14% 3.00
TOTAL 79 17% 47% 20% 8% 9% 2.79
c. I have appropriate opportunities to contribute input to planning and budgeting.
d. NOCE maintains and upgrades its technology infrastructure (hardware and software) to meet student learning and
staff needs.
e. NOCE provides sufficient professional development opportunities.
Respondents' level of agreement with the allocation of resources at NOCE:
b. The current budget allocation process promotes the effective allocation of resources.
a. Resource allocation processes are clearly linked to the planning processes.
* Average of responses from 1 to 4, 1 being "Strongly disagree" and 4 being "Strongly agree". "Don't know/N/A" responses were excluded
from the calculation of the mean.
The Collaborative Brain Trust 144

Total
Strongly
Agree
4
Agree
3
Disagree
2
Strongly
Disagree
1
Don't Know/
N/AMean*
Classified 31 7% 36% 29% 13% 16% 2.42
Faculty 28 7% 43% 14% 14% 21% 2.55
Management/Supervisory 18 6% 28% 44% 22% 0% 2.17
Less than 5 years 36 8% 33% 31% 14% 14% 2.42
5 to 10 years 14 0% 29% 21% 36% 14% 1.92
11 to 19 years 21 5% 38% 29% 10% 19% 2.47
20 years or more 7 14% 57% 14% 0% 14% 3.00
TOTAL 78 6% 36% 29% 15% 15% 2.39
f. NOCE creates opportunities for career advancement.
* Average of responses from 1 to 4, 1 being "Strongly disagree" and 4 being "Strongly agree". "Don't know/N/A" responses were excluded
from the calculation of the mean.
The Collaborative Brain Trust 145
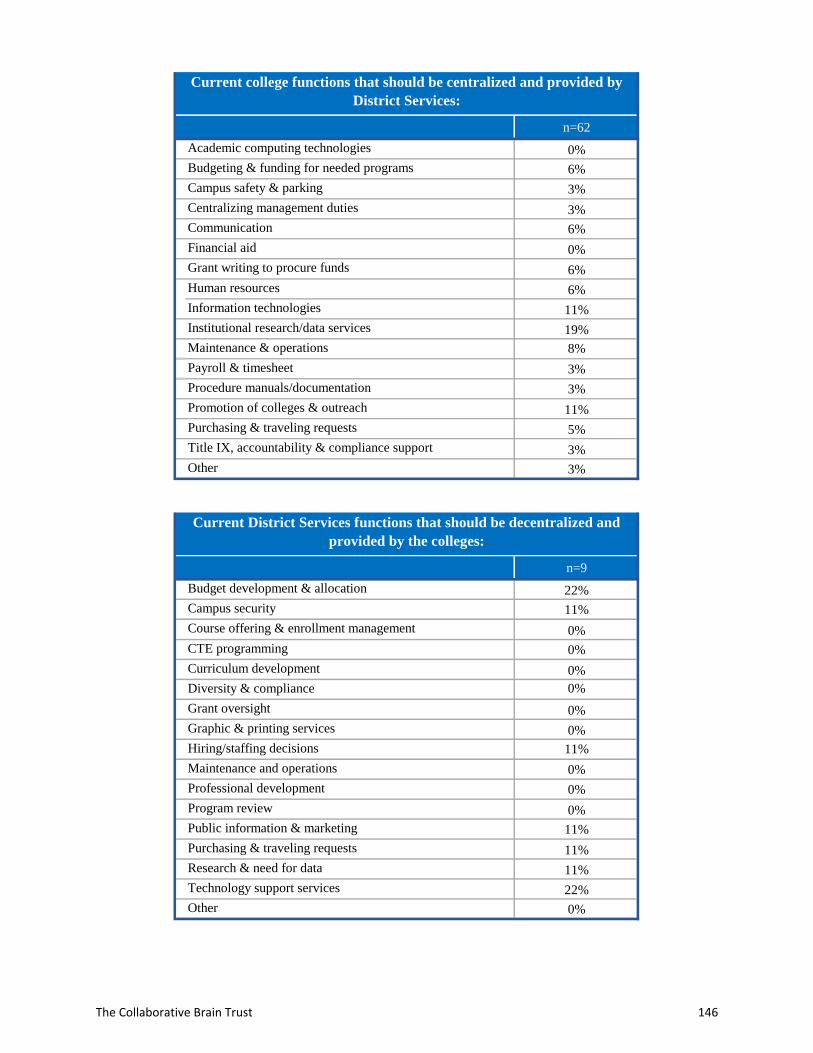
n=62
0%
6%
3%
3%
6%
0%
6%
6%
11%
19%
8%
3%
3%
11%
5%
3%
Other 3%
n=9
22%
11%
0%
0%
0%
0%
0%
0%
11%
0%
0%
0%
11%
11%
11%
22%
0%
Centralizing management duties
Communication
Financial aid
Grant writing to procure funds
Current college functions that should be centralized and provided by
District Services:
Academic computing technologies
Budgeting & funding for needed programs
Campus safety & parking
Human resources
Information technologies
Institutional research/data services
Maintenance & operations
Payroll & timesheet
Budget development & allocation
Campus security
Course offering & enrollment management
Procedure manuals/documentation
Promotion of colleges & outreach
Purchasing & traveling requests
Title IX, accountability & compliance support
Current District Services functions that should be decentralized and
provided by the colleges:
CTE programming
Curriculum development
Diversity & compliance
Grant oversight
Graphic & printing services
Hiring/staffing decisions
Maintenance and operations
Professional development
Program review
Public information & marketing
Purchasing & traveling requests
Research & need for data
Technology support services
Other
The Collaborative Brain Trust 146
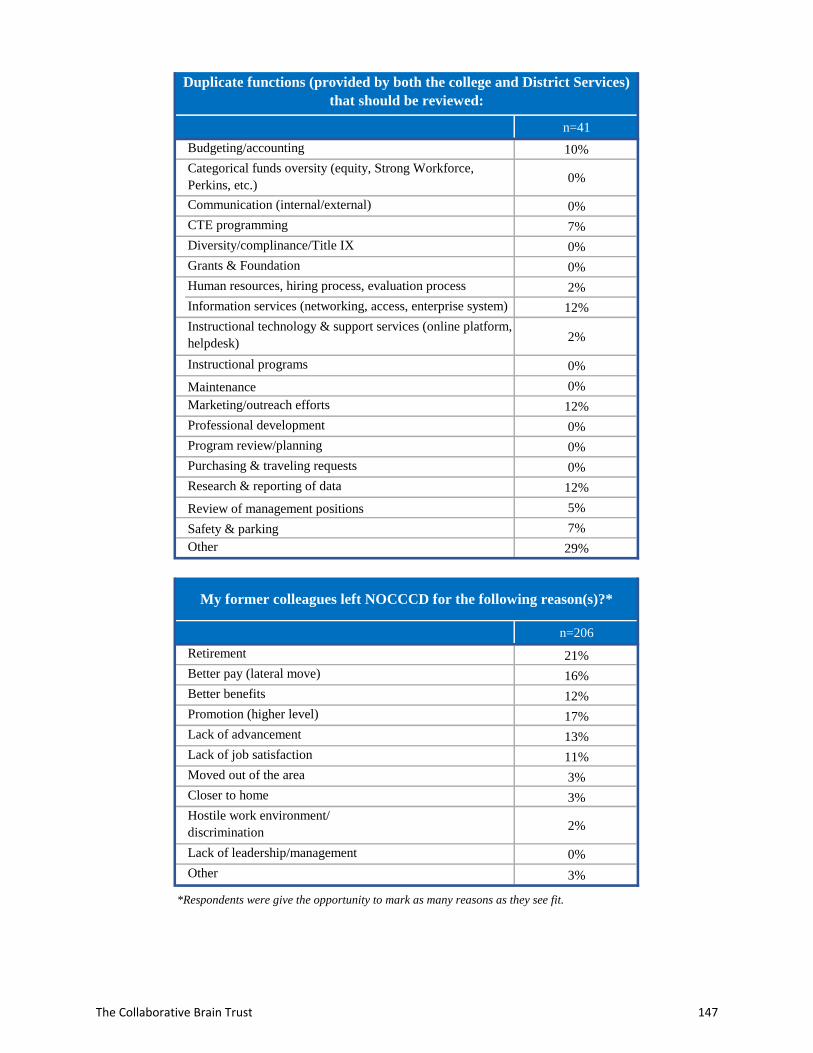
n=41
10%
0%
0%
7%
0%
0%
2%
12%
2%
0%
0%
12%
0%
0%
0%
12%
5%
7%
29%
n=206
Retirement 21%
Better pay (lateral move) 16%
Better benefits 12%
Promotion (higher level) 17%
Lack of advancement 13%
Lack of job satisfaction 11%
Moved out of the area 3%
Closer to home 3%
2%
0%
3%
*Respondents were give the opportunity to mark as many reasons as they see fit.
Duplicate functions (provided by both the college and District Services)
that should be reviewed:
Budgeting/accounting
Categorical funds oversity (equity, Strong Workforce,
Perkins, etc.)
Communication (internal/external)
CTE programming
Diversity/complinance/Title IX
Grants & Foundation
Human resources, hiring process, evaluation process
Information services (networking, access, enterprise system)
Instructional technology & support services (online platform,
helpdesk)
Instructional programs
Maintenance
Marketing/outreach efforts
Professional development
Program review/planning
Purchasing & traveling requests
Research & reporting of data
Review of management positions
Safety & parking
Other
My former colleagues left NOCCCD for the following reason(s)?*
Hostile work environment/
discrimination
Lack of leadership/management
Other
The Collaborative Brain Trust 147
SUMMARY OF NORTH ORANGE CONTINUING EDUCATION COMMENTS
Summary of Comments from NOCE Classified Staff:
• Admission and Registration offices in all three locations that should be staffed with well-knowledgeable people ready to deliver the best customer services that our students, co-workers andfaculty deserve
• Do not hire people who don't have a personal desire to work with students• Ineffective communication/archaic processes/outdated documentation are issues• We are going in the right direction, but there is room for improvement• Need to review each department organizational chart and justify the budget and the headcount of
the department• Student data can be used to analyze the departmental hiring and budget• NOCE often feels sidelined during conversations, and district attitudes toward promoting the
development of NOCE seems mostly negative• Staff and faculty are spread too thin in relation to the number of students that need to be served,
specifically in the high school diploma labs• Vocational training should emphasize new technologies and green emphasis (robotics and solar
energy)• We need to include classified staff on department decision making as a whole with open dialogue
Summary of Comments from NOCE Faculty:
• DSS students should be given specific accommodation for his/her needs• Classroom equipment need scheduled/regular maintenance such as replacing lights on ELMO and
other teaching equipment• Develop employee benefits such as paid holidays, lesson planning/office hours compensation, to all
faculty members• Need clear and thorough explanation of employee benefits and services and unions for adjunct
faculty and part-time employees• Change free class policy to attendance-based and state test-required policy for enrollment• Too much management• Too much time and treasure are spent on "process": layers of bureaucracy, work groups, planning
sessions, etc.• Importance of competent leadership may make a huge a difference in departments that work as a
team• Non-credit is often at the bottom of the totem pole and even our students• The retirement incentive has left our department so sparsely staffed that student's needs are being
affected• Management is wonderful and supportive but we need more support working directly with the
students• There have been heavy handed top down decisions made outside of the ESL department regarding
enrollment of 27 students per class• There is a general feeling and belief among staff and instructors that the district's organizational
structure is too focused on management and not enough on students
The Collaborative Brain Trust 148
Summary of Comments from NOCE Management/Supervisory:
• Communication among departments relating to current programs being implemented/activities/workshops, is still in need of strong improvement
• Departments are blind to budgets and how their programs impact budget within NOCE• There is not proper or adequate training for new leaders• The structure at the colleges, NOCE and district are quite archaic and have not evolved given the
systemic changes within community colleges• There is a plethora of new statewide initiatives which in turn bring about additional mandates,
regulations and procedural changes, but NOCCCD entities have continued with its existingstructure, resulting in staff feeling overworked, overwhelmed and overburdened
• The NOCE Deans' assignments are equivalent to Vice Presidents yet without fair compensation orclassification
• NOCE Directors do the work of associate deans• NOCE is the same size as Cypress College's student population, yet we have far fewer tenured
faculty• The communication of processes, use of technology, and customer service could use enhancement• Currently, due to the uneven job titles and duties within the NOCE management team many times
communication down to the directors and/or involving the proper ones in district meetings and inadministrative decisions does not happen
• Many times, we move forward and don't communicate as best we can in order to ensure we doimplement things that help or faculty and students succeed
• Some positions could adequately be accomplished with a shorter work week• The District and colleges/NOCE need to be organized in a way that encourages courageous
conversations - as a District, but also as individual entities within the District, we need to cultivateand foster a culture of candor in order always be improving what we do in order to better serve ourstudents
• There are people who control certain processes that deliberately hold up the process• District salaries may be competitive, but when prospective employees find out about this limited
health benefit, they do not accept the position
The Collaborative Brain Trust 149
APPENDIX I I. FTE Employee Analysis of Comparative
District and Colleges by FTES
The Collaborative Brain Trust 150
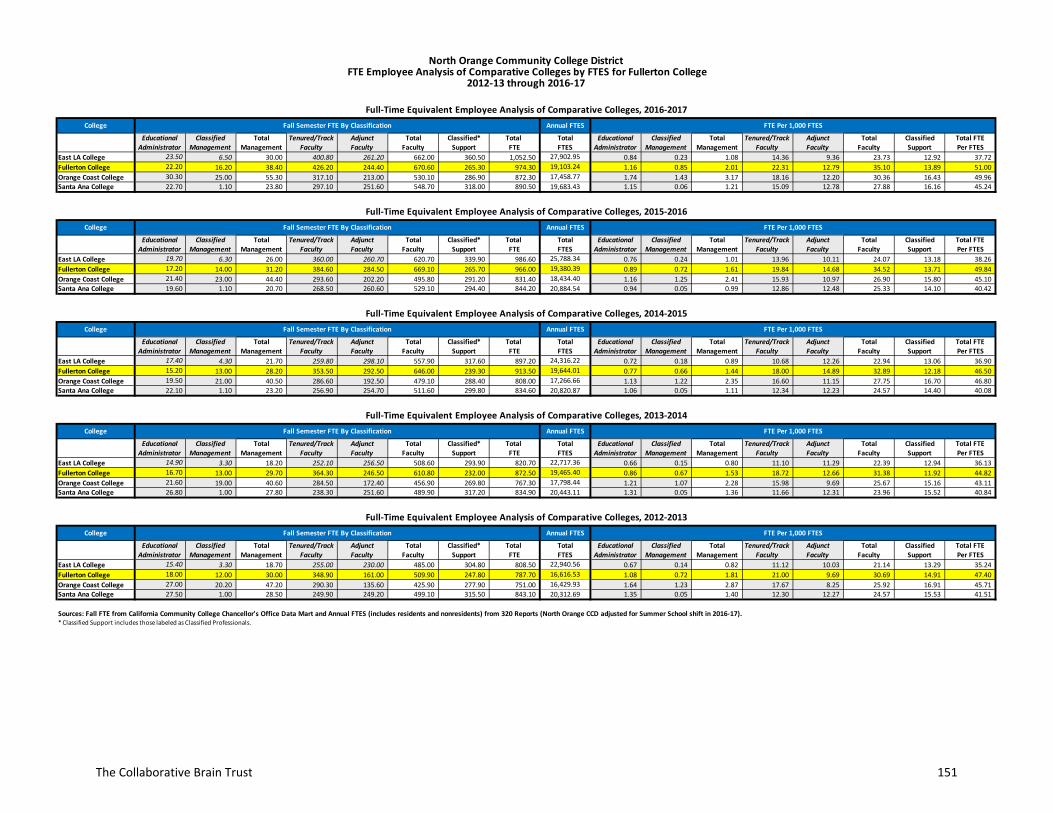
College Annual FTES
Educational Classified Total Tenured/Track Adjunct Total Classified* Total Total Educational Classified Total Tenured/Track Adjunct Total Classified Total FTEAdministrator Management Management Faculty Faculty Faculty Support FTE FTES Administrator Management Management Faculty Faculty Faculty Support Per FTES
East LA College 23.50 6.50 30.00 400.80 261.20 662.00 360.50 1,052.50 27,902.95 0.84 0.23 1.08 14.36 9.36 23.73 12.92 37.72 Fullerton College 22.20 16.20 38.40 426.20 244.40 670.60 265.30 974.30 19,103.24 1.16 0.85 2.01 22.31 12.79 35.10 13.89 51.00 Orange Coast College 30.30 25.00 55.30 317.10 213.00 530.10 286.90 872.30 17,458.77 1.74 1.43 3.17 18.16 12.20 30.36 16.43 49.96 Santa Ana College 22.70 1.10 23.80 297.10 251.60 548.70 318.00 890.50 19,683.43 1.15 0.06 1.21 15.09 12.78 27.88 16.16 45.24
College Annual FTES
Educational Classified Total Tenured/Track Adjunct Total Classified* Total Total Educational Classified Total Tenured/Track Adjunct Total Classified Total FTEAdministrator Management Management Faculty Faculty Faculty Support FTE FTES Administrator Management Management Faculty Faculty Faculty Support Per FTES
East LA College 19.70 6.30 26.00 360.00 260.70 620.70 339.90 986.60 25,788.34 0.76 0.24 1.01 13.96 10.11 24.07 13.18 38.26 Fullerton College 17.20 14.00 31.20 384.60 284.50 669.10 265.70 966.00 19,380.39 0.89 0.72 1.61 19.84 14.68 34.52 13.71 49.84 Orange Coast College 21.40 23.00 44.40 293.60 202.20 495.80 291.20 831.40 18,434.40 1.16 1.25 2.41 15.93 10.97 26.90 15.80 45.10 Santa Ana College 19.60 1.10 20.70 268.50 260.60 529.10 294.40 844.20 20,884.54 0.94 0.05 0.99 12.86 12.48 25.33 14.10 40.42
College Annual FTES
Educational Classified Total Tenured/Track Adjunct Total Classified* Total Total Educational Classified Total Tenured/Track Adjunct Total Classified Total FTEAdministrator Management Management Faculty Faculty Faculty Support FTE FTES Administrator Management Management Faculty Faculty Faculty Support Per FTES
East LA College 17.40 4.30 21.70 259.80 298.10 557.90 317.60 897.20 24,316.22 0.72 0.18 0.89 10.68 12.26 22.94 13.06 36.90 Fullerton College 15.20 13.00 28.20 353.50 292.50 646.00 239.30 913.50 19,644.01 0.77 0.66 1.44 18.00 14.89 32.89 12.18 46.50 Orange Coast College 19.50 21.00 40.50 286.60 192.50 479.10 288.40 808.00 17,266.66 1.13 1.22 2.35 16.60 11.15 27.75 16.70 46.80 Santa Ana College 22.10 1.10 23.20 256.90 254.70 511.60 299.80 834.60 20,820.87 1.06 0.05 1.11 12.34 12.23 24.57 14.40 40.08
College Annual FTES
Educational Classified Total Tenured/Track Adjunct Total Classified* Total Total Educational Classified Total Tenured/Track Adjunct Total Classified Total FTEAdministrator Management Management Faculty Faculty Faculty Support FTE FTES Administrator Management Management Faculty Faculty Faculty Support Per FTES
East LA College 14.90 3.30 18.20 252.10 256.50 508.60 293.90 820.70 22,717.36 0.66 0.15 0.80 11.10 11.29 22.39 12.94 36.13 Fullerton College 16.70 13.00 29.70 364.30 246.50 610.80 232.00 872.50 19,465.40 0.86 0.67 1.53 18.72 12.66 31.38 11.92 44.82 Orange Coast College 21.60 19.00 40.60 284.50 172.40 456.90 269.80 767.30 17,798.44 1.21 1.07 2.28 15.98 9.69 25.67 15.16 43.11 Santa Ana College 26.80 1.00 27.80 238.30 251.60 489.90 317.20 834.90 20,443.11 1.31 0.05 1.36 11.66 12.31 23.96 15.52 40.84
College Annual FTES
Educational Classified Total Tenured/Track Adjunct Total Classified* Total Total Educational Classified Total Tenured/Track Adjunct Total Classified Total FTEAdministrator Management Management Faculty Faculty Faculty Support FTE FTES Administrator Management Management Faculty Faculty Faculty Support Per FTES
East LA College 15.40 3.30 18.70 255.00 230.00 485.00 304.80 808.50 22,940.56 0.67 0.14 0.82 11.12 10.03 21.14 13.29 35.24 Fullerton College 18.00 12.00 30.00 348.90 161.00 509.90 247.80 787.70 16,616.53 1.08 0.72 1.81 21.00 9.69 30.69 14.91 47.40 Orange Coast College 27.00 20.20 47.20 290.30 135.60 425.90 277.90 751.00 16,429.93 1.64 1.23 2.87 17.67 8.25 25.92 16.91 45.71 Santa Ana College 27.50 1.00 28.50 249.90 249.20 499.10 315.50 843.10 20,312.69 1.35 0.05 1.40 12.30 12.27 24.57 15.53 41.51
Sources: Fall FTE from California Community College Chancellor's Office Data Mart and Annual FTES (includes residents and nonresidents) from 320 Reports (North Orange CCD adjusted for Summer School shift in 2016-17).* Classified Support includes those labeled as Classified Professionals.
Full-Time Equivalent Employee Analysis of Comparative Colleges, 2016-2017Fall Semester FTE By Classification FTE Per 1,000 FTES
North Orange Community College District FTE Employee Analysis of Comparative Colleges by FTES for Fullerton College
2012-13 through 2016-17
Full-Time Equivalent Employee Analysis of Comparative Colleges, 2015-2016Fall Semester FTE By Classification FTE Per 1,000 FTES
Full-Time Equivalent Employee Analysis of Comparative Colleges, 2014-2015Fall Semester FTE By Classification FTE Per 1,000 FTES
Full-Time Equivalent Employee Analysis of Comparative Colleges, 2013-2014Fall Semester FTE By Classification FTE Per 1,000 FTES
Full-Time Equivalent Employee Analysis of Comparative Colleges, 2012-2013Fall Semester FTE By Classification FTE Per 1,000 FTES
The Collaborative Brain Trust 151
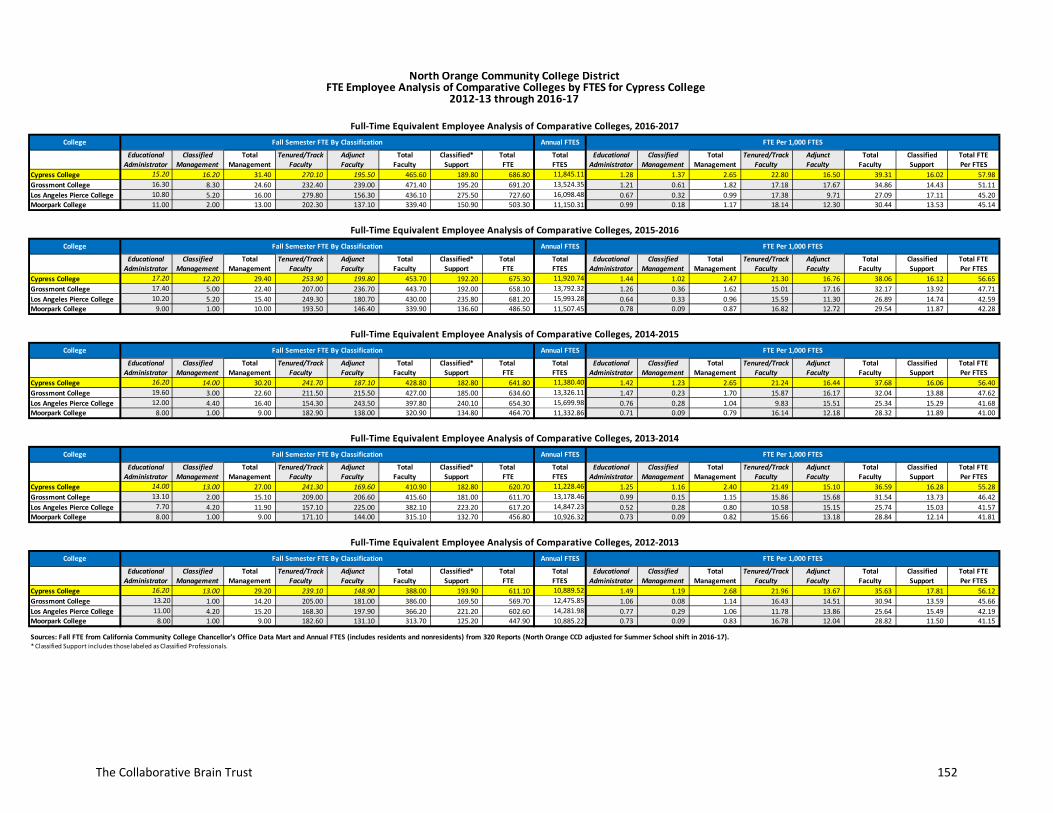
College Annual FTES
Educational Classified Total Tenured/Track Adjunct Total Classified* Total Total Educational Classified Total Tenured/Track Adjunct Total Classified Total FTEAdministrator Management Management Faculty Faculty Faculty Support FTE FTES Administrator Management Management Faculty Faculty Faculty Support Per FTES
Cypress College 15.20 16.20 31.40 270.10 195.50 465.60 189.80 686.80 11,845.11 1.28 1.37 2.65 22.80 16.50 39.31 16.02 57.98 Grossmont College 16.30 8.30 24.60 232.40 239.00 471.40 195.20 691.20 13,524.35 1.21 0.61 1.82 17.18 17.67 34.86 14.43 51.11 Los Angeles Pierce College 10.80 5.20 16.00 279.80 156.30 436.10 275.50 727.60 16,098.48 0.67 0.32 0.99 17.38 9.71 27.09 17.11 45.20 Moorpark College 11.00 2.00 13.00 202.30 137.10 339.40 150.90 503.30 11,150.31 0.99 0.18 1.17 18.14 12.30 30.44 13.53 45.14
College Annual FTES
Educational Classified Total Tenured/Track Adjunct Total Classified* Total Total Educational Classified Total Tenured/Track Adjunct Total Classified Total FTEAdministrator Management Management Faculty Faculty Faculty Support FTE FTES Administrator Management Management Faculty Faculty Faculty Support Per FTES
Cypress College 17.20 12.20 29.40 253.90 199.80 453.70 192.20 675.30 11,920.74 1.44 1.02 2.47 21.30 16.76 38.06 16.12 56.65 Grossmont College 17.40 5.00 22.40 207.00 236.70 443.70 192.00 658.10 13,792.32 1.26 0.36 1.62 15.01 17.16 32.17 13.92 47.71 Los Angeles Pierce College 10.20 5.20 15.40 249.30 180.70 430.00 235.80 681.20 15,993.28 0.64 0.33 0.96 15.59 11.30 26.89 14.74 42.59 Moorpark College 9.00 1.00 10.00 193.50 146.40 339.90 136.60 486.50 11,507.45 0.78 0.09 0.87 16.82 12.72 29.54 11.87 42.28
College Annual FTES
Educational Classified Total Tenured/Track Adjunct Total Classified* Total Total Educational Classified Total Tenured/Track Adjunct Total Classified Total FTEAdministrator Management Management Faculty Faculty Faculty Support FTE FTES Administrator Management Management Faculty Faculty Faculty Support Per FTES
Cypress College 16.20 14.00 30.20 241.70 187.10 428.80 182.80 641.80 11,380.40 1.42 1.23 2.65 21.24 16.44 37.68 16.06 56.40 Grossmont College 19.60 3.00 22.60 211.50 215.50 427.00 185.00 634.60 13,326.11 1.47 0.23 1.70 15.87 16.17 32.04 13.88 47.62 Los Angeles Pierce College 12.00 4.40 16.40 154.30 243.50 397.80 240.10 654.30 15,699.98 0.76 0.28 1.04 9.83 15.51 25.34 15.29 41.68 Moorpark College 8.00 1.00 9.00 182.90 138.00 320.90 134.80 464.70 11,332.86 0.71 0.09 0.79 16.14 12.18 28.32 11.89 41.00
College Annual FTES
Educational Classified Total Tenured/Track Adjunct Total Classified* Total Total Educational Classified Total Tenured/Track Adjunct Total Classified Total FTEAdministrator Management Management Faculty Faculty Faculty Support FTE FTES Administrator Management Management Faculty Faculty Faculty Support Per FTES
Cypress College 14.00 13.00 27.00 241.30 169.60 410.90 182.80 620.70 11,228.46 1.25 1.16 2.40 21.49 15.10 36.59 16.28 55.28 Grossmont College 13.10 2.00 15.10 209.00 206.60 415.60 181.00 611.70 13,178.46 0.99 0.15 1.15 15.86 15.68 31.54 13.73 46.42 Los Angeles Pierce College 7.70 4.20 11.90 157.10 225.00 382.10 223.20 617.20 14,847.23 0.52 0.28 0.80 10.58 15.15 25.74 15.03 41.57 Moorpark College 8.00 1.00 9.00 171.10 144.00 315.10 132.70 456.80 10,926.32 0.73 0.09 0.82 15.66 13.18 28.84 12.14 41.81
College Annual FTES
Educational Classified Total Tenured/Track Adjunct Total Classified* Total Total Educational Classified Total Tenured/Track Adjunct Total Classified Total FTEAdministrator Management Management Faculty Faculty Faculty Support FTE FTES Administrator Management Management Faculty Faculty Faculty Support Per FTES
Cypress College 16.20 13.00 29.20 239.10 148.90 388.00 193.90 611.10 10,889.52 1.49 1.19 2.68 21.96 13.67 35.63 17.81 56.12 Grossmont College 13.20 1.00 14.20 205.00 181.00 386.00 169.50 569.70 12,475.85 1.06 0.08 1.14 16.43 14.51 30.94 13.59 45.66 Los Angeles Pierce College 11.00 4.20 15.20 168.30 197.90 366.20 221.20 602.60 14,281.98 0.77 0.29 1.06 11.78 13.86 25.64 15.49 42.19 Moorpark College 8.00 1.00 9.00 182.60 131.10 313.70 125.20 447.90 10,885.22 0.73 0.09 0.83 16.78 12.04 28.82 11.50 41.15
Sources: Fall FTE from California Community College Chancellor's Office Data Mart and Annual FTES (includes residents and nonresidents) from 320 Reports (North Orange CCD adjusted for Summer School shift in 2016-17).* Classified Support includes those labeled as Classified Professionals.
North Orange Community College District FTE Employee Analysis of Comparative Colleges by FTES for Cypress College
2012-13 through 2016-17
Full-Time Equivalent Employee Analysis of Comparative Colleges, 2014-2015Fall Semester FTE By Classification FTE Per 1,000 FTES
Full-Time Equivalent Employee Analysis of Comparative Colleges, 2016-2017Fall Semester FTE By Classification FTE Per 1,000 FTES
Full-Time Equivalent Employee Analysis of Comparative Colleges, 2015-2016Fall Semester FTE By Classification FTE Per 1,000 FTES
Full-Time Equivalent Employee Analysis of Comparative Colleges, 2012-2013Fall Semester FTE By Classification FTE Per 1,000 FTES
Full-Time Equivalent Employee Analysis of Comparative Colleges, 2013-2014Fall Semester FTE By Classification FTE Per 1,000 FTES
The Collaborative Brain Trust 152
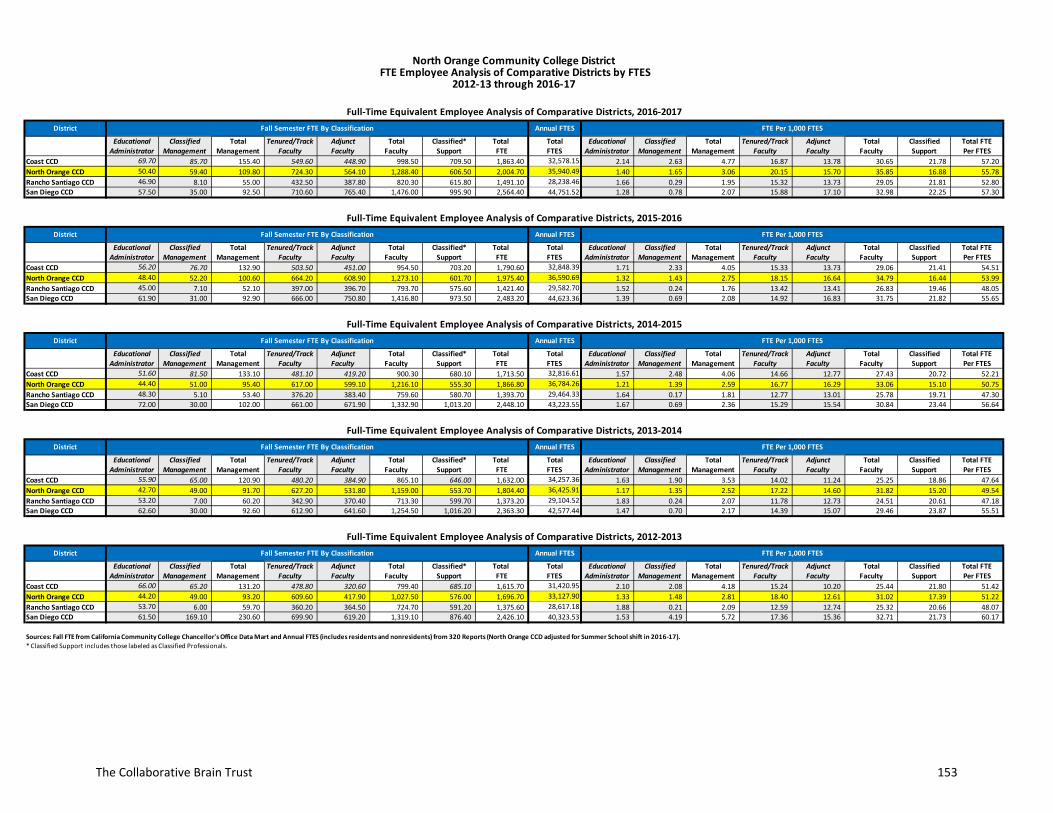
District Annual FTES
Educational Classified Total Tenured/Track Adjunct Total Classified* Total Total Educational Classified Total Tenured/Track Adjunct Total Classified Total FTEAdministrator Management Management Faculty Faculty Faculty Support FTE FTES Administrator Management Management Faculty Faculty Faculty Support Per FTES
Coast CCD 69.70 85.70 155.40 549.60 448.90 998.50 709.50 1,863.40 32,578.15 2.14 2.63 4.77 16.87 13.78 30.65 21.78 57.20 North Orange CCD 50.40 59.40 109.80 724.30 564.10 1,288.40 606.50 2,004.70 35,940.49 1.40 1.65 3.06 20.15 15.70 35.85 16.88 55.78 Rancho Santiago CCD 46.90 8.10 55.00 432.50 387.80 820.30 615.80 1,491.10 28,238.46 1.66 0.29 1.95 15.32 13.73 29.05 21.81 52.80 San Diego CCD 57.50 35.00 92.50 710.60 765.40 1,476.00 995.90 2,564.40 44,751.52 1.28 0.78 2.07 15.88 17.10 32.98 22.25 57.30
District Annual FTES
Educational Classified Total Tenured/Track Adjunct Total Classified* Total Total Educational Classified Total Tenured/Track Adjunct Total Classified Total FTEAdministrator Management Management Faculty Faculty Faculty Support FTE FTES Administrator Management Management Faculty Faculty Faculty Support Per FTES
Coast CCD 56.20 76.70 132.90 503.50 451.00 954.50 703.20 1,790.60 32,848.39 1.71 2.33 4.05 15.33 13.73 29.06 21.41 54.51 North Orange CCD 48.40 52.20 100.60 664.20 608.90 1,273.10 601.70 1,975.40 36,590.69 1.32 1.43 2.75 18.15 16.64 34.79 16.44 53.99 Rancho Santiago CCD 45.00 7.10 52.10 397.00 396.70 793.70 575.60 1,421.40 29,582.70 1.52 0.24 1.76 13.42 13.41 26.83 19.46 48.05 San Diego CCD 61.90 31.00 92.90 666.00 750.80 1,416.80 973.50 2,483.20 44,623.36 1.39 0.69 2.08 14.92 16.83 31.75 21.82 55.65
District Annual FTES
Educational Classified Total Tenured/Track Adjunct Total Classified* Total Total Educational Classified Total Tenured/Track Adjunct Total Classified Total FTEAdministrator Management Management Faculty Faculty Faculty Support FTE FTES Administrator Management Management Faculty Faculty Faculty Support Per FTES
Coast CCD 51.60 81.50 133.10 481.10 419.20 900.30 680.10 1,713.50 32,816.61 1.57 2.48 4.06 14.66 12.77 27.43 20.72 52.21 North Orange CCD 44.40 51.00 95.40 617.00 599.10 1,216.10 555.30 1,866.80 36,784.26 1.21 1.39 2.59 16.77 16.29 33.06 15.10 50.75 Rancho Santiago CCD 48.30 5.10 53.40 376.20 383.40 759.60 580.70 1,393.70 29,464.33 1.64 0.17 1.81 12.77 13.01 25.78 19.71 47.30 San Diego CCD 72.00 30.00 102.00 661.00 671.90 1,332.90 1,013.20 2,448.10 43,223.55 1.67 0.69 2.36 15.29 15.54 30.84 23.44 56.64
District Annual FTES
Educational Classified Total Tenured/Track Adjunct Total Classified* Total Total Educational Classified Total Tenured/Track Adjunct Total Classified Total FTEAdministrator Management Management Faculty Faculty Faculty Support FTE FTES Administrator Management Management Faculty Faculty Faculty Support Per FTES
Coast CCD 55.90 65.00 120.90 480.20 384.90 865.10 646.00 1,632.00 34,257.36 1.63 1.90 3.53 14.02 11.24 25.25 18.86 47.64 North Orange CCD 42.70 49.00 91.70 627.20 531.80 1,159.00 553.70 1,804.40 36,425.91 1.17 1.35 2.52 17.22 14.60 31.82 15.20 49.54 Rancho Santiago CCD 53.20 7.00 60.20 342.90 370.40 713.30 599.70 1,373.20 29,104.52 1.83 0.24 2.07 11.78 12.73 24.51 20.61 47.18 San Diego CCD 62.60 30.00 92.60 612.90 641.60 1,254.50 1,016.20 2,363.30 42,577.44 1.47 0.70 2.17 14.39 15.07 29.46 23.87 55.51
District Annual FTES
Educational Classified Total Tenured/Track Adjunct Total Classified* Total Total Educational Classified Total Tenured/Track Adjunct Total Classified Total FTEAdministrator Management Management Faculty Faculty Faculty Support FTE FTES Administrator Management Management Faculty Faculty Faculty Support Per FTES
Coast CCD 66.00 65.20 131.20 478.80 320.60 799.40 685.10 1,615.70 31,420.95 2.10 2.08 4.18 15.24 10.20 25.44 21.80 51.42 North Orange CCD 44.20 49.00 93.20 609.60 417.90 1,027.50 576.00 1,696.70 33,127.90 1.33 1.48 2.81 18.40 12.61 31.02 17.39 51.22 Rancho Santiago CCD 53.70 6.00 59.70 360.20 364.50 724.70 591.20 1,375.60 28,617.18 1.88 0.21 2.09 12.59 12.74 25.32 20.66 48.07 San Diego CCD 61.50 169.10 230.60 699.90 619.20 1,319.10 876.40 2,426.10 40,323.53 1.53 4.19 5.72 17.36 15.36 32.71 21.73 60.17
Sources: Fall FTE from California Community College Chancellor's Office Data Mart and Annual FTES (includes residents and nonresidents) from 320 Reports (North Orange CCD adjusted for Summer School shift in 2016-17).* Classified Support includes those labeled as Classified Professionals.
Full-Time Equivalent Employee Analysis of Comparative Districts, 2013-2014Fall Semester FTE By Classification FTE Per 1,000 FTES
Full-Time Equivalent Employee Analysis of Comparative Districts, 2012-2013Fall Semester FTE By Classification FTE Per 1,000 FTES
Full-Time Equivalent Employee Analysis of Comparative Districts, 2015-2016Fall Semester FTE By Classification FTE Per 1,000 FTES
Full-Time Equivalent Employee Analysis of Comparative Districts, 2014-2015Fall Semester FTE By Classification FTE Per 1,000 FTES
North Orange Community College District FTE Employee Analysis of Comparative Districts by FTES
2012-13 through 2016-17
Full-Time Equivalent Employee Analysis of Comparative Districts, 2016-2017Fall Semester FTE By Classification FTE Per 1,000 FTES
The Collaborative Brain Trust 153
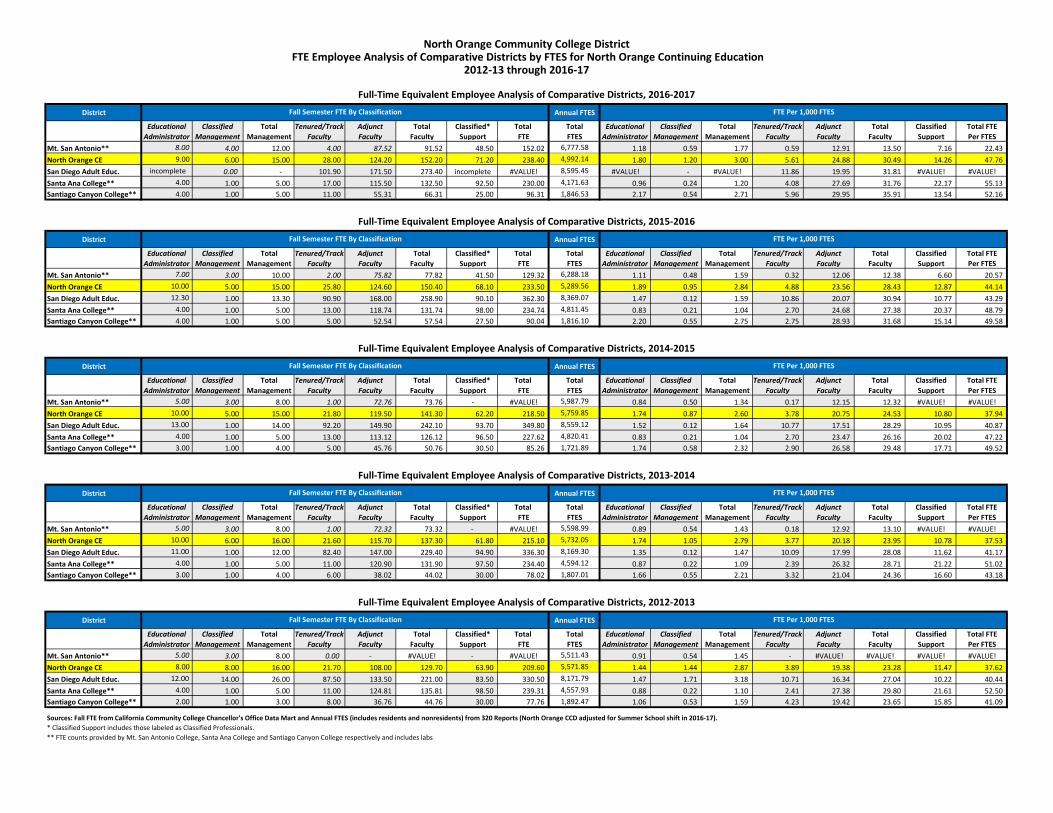
District Annual FTES
Educational Classified Total Tenured/Track Adjunct Total Classified* Total Total Educational Classified Total Tenured/Track Adjunct Total Classified Total FTE
Administrator Management Management Faculty Faculty Faculty Support FTE FTES Administrator Management Management Faculty Faculty Faculty Support Per FTES
Mt. San Antonio** 8.00 4.00 12.00 4.00 87.52 91.52 48.50 152.02 6,777.58 1.18 0.59 1.77 0.59 12.91 13.50 7.16 22.43
North Orange CE 9.00 6.00 15.00 28.00 124.20 152.20 71.20 238.40 4,992.14 1.80 1.20 3.00 5.61 24.88 30.49 14.26 47.76
San Diego Adult Educ. incomplete 0.00 - 101.90 171.50 273.40 incomplete #VALUE! 8,595.45 #VALUE! - #VALUE! 11.86 19.95 31.81 #VALUE! #VALUE!
Santa Ana College** 4.00 1.00 5.00 17.00 115.50 132.50 92.50 230.00 4,171.63 0.96 0.24 1.20 4.08 27.69 31.76 22.17 55.13
Santiago Canyon College** 4.00 1.00 5.00 11.00 55.31 66.31 25.00 96.31 1,846.53 2.17 0.54 2.71 5.96 29.95 35.91 13.54 52.16
District Annual FTES
Educational Classified Total Tenured/Track Adjunct Total Classified* Total Total Educational Classified Total Tenured/Track Adjunct Total Classified Total FTE
Administrator Management Management Faculty Faculty Faculty Support FTE FTES Administrator Management Management Faculty Faculty Faculty Support Per FTES
Mt. San Antonio** 7.00 3.00 10.00 2.00 75.82 77.82 41.50 129.32 6,288.18 1.11 0.48 1.59 0.32 12.06 12.38 6.60 20.57
North Orange CE 10.00 5.00 15.00 25.80 124.60 150.40 68.10 233.50 5,289.56 1.89 0.95 2.84 4.88 23.56 28.43 12.87 44.14
San Diego Adult Educ. 12.30 1.00 13.30 90.90 168.00 258.90 90.10 362.30 8,369.07 1.47 0.12 1.59 10.86 20.07 30.94 10.77 43.29
Santa Ana College** 4.00 1.00 5.00 13.00 118.74 131.74 98.00 234.74 4,811.45 0.83 0.21 1.04 2.70 24.68 27.38 20.37 48.79
Santiago Canyon College** 4.00 1.00 5.00 5.00 52.54 57.54 27.50 90.04 1,816.10 2.20 0.55 2.75 2.75 28.93 31.68 15.14 49.58
District Annual FTES
Educational Classified Total Tenured/Track Adjunct Total Classified* Total Total Educational Classified Total Tenured/Track Adjunct Total Classified Total FTE
Administrator Management Management Faculty Faculty Faculty Support FTE FTES Administrator Management Management Faculty Faculty Faculty Support Per FTES
Mt. San Antonio** 5.00 3.00 8.00 1.00 72.76 73.76 - #VALUE! 5,987.79 0.84 0.50 1.34 0.17 12.15 12.32 #VALUE! #VALUE!
North Orange CE 10.00 5.00 15.00 21.80 119.50 141.30 62.20 218.50 5,759.85 1.74 0.87 2.60 3.78 20.75 24.53 10.80 37.94
San Diego Adult Educ. 13.00 1.00 14.00 92.20 149.90 242.10 93.70 349.80 8,559.12 1.52 0.12 1.64 10.77 17.51 28.29 10.95 40.87
Santa Ana College** 4.00 1.00 5.00 13.00 113.12 126.12 96.50 227.62 4,820.41 0.83 0.21 1.04 2.70 23.47 26.16 20.02 47.22
Santiago Canyon College** 3.00 1.00 4.00 5.00 45.76 50.76 30.50 85.26 1,721.89 1.74 0.58 2.32 2.90 26.58 29.48 17.71 49.52
District Annual FTES
Educational Classified Total Tenured/Track Adjunct Total Classified* Total Total Educational Classified Total Tenured/Track Adjunct Total Classified Total FTE
Administrator Management Management Faculty Faculty Faculty Support FTE FTES Administrator Management Management Faculty Faculty Faculty Support Per FTES
Mt. San Antonio** 5.00 3.00 8.00 1.00 72.32 73.32 - #VALUE! 5,598.99 0.89 0.54 1.43 0.18 12.92 13.10 #VALUE! #VALUE!
North Orange CE 10.00 6.00 16.00 21.60 115.70 137.30 61.80 215.10 5,732.05 1.74 1.05 2.79 3.77 20.18 23.95 10.78 37.53
San Diego Adult Educ. 11.00 1.00 12.00 82.40 147.00 229.40 94.90 336.30 8,169.30 1.35 0.12 1.47 10.09 17.99 28.08 11.62 41.17
Santa Ana College** 4.00 1.00 5.00 11.00 120.90 131.90 97.50 234.40 4,594.12 0.87 0.22 1.09 2.39 26.32 28.71 21.22 51.02
Santiago Canyon College** 3.00 1.00 4.00 6.00 38.02 44.02 30.00 78.02 1,807.01 1.66 0.55 2.21 3.32 21.04 24.36 16.60 43.18
District Annual FTES
Educational Classified Total Tenured/Track Adjunct Total Classified* Total Total Educational Classified Total Tenured/Track Adjunct Total Classified Total FTE
Administrator Management Management Faculty Faculty Faculty Support FTE FTES Administrator Management Management Faculty Faculty Faculty Support Per FTES
Mt. San Antonio** 5.00 3.00 8.00 0.00 - #VALUE! - #VALUE! 5,511.43 0.91 0.54 1.45 - #VALUE! #VALUE! #VALUE! #VALUE!
North Orange CE 8.00 8.00 16.00 21.70 108.00 129.70 63.90 209.60 5,571.85 1.44 1.44 2.87 3.89 19.38 23.28 11.47 37.62
San Diego Adult Educ. 12.00 14.00 26.00 87.50 133.50 221.00 83.50 330.50 8,171.79 1.47 1.71 3.18 10.71 16.34 27.04 10.22 40.44
Santa Ana College** 4.00 1.00 5.00 11.00 124.81 135.81 98.50 239.31 4,557.93 0.88 0.22 1.10 2.41 27.38 29.80 21.61 52.50
Santiago Canyon College** 2.00 1.00 3.00 8.00 36.76 44.76 30.00 77.76 1,892.47 1.06 0.53 1.59 4.23 19.42 23.65 15.85 41.09
Sources: Fall FTE from California Community College Chancellor's Office Data Mart and Annual FTES (includes residents and nonresidents) from 320 Reports (North Orange CCD adjusted for Summer School shift in 2016-17).
* Classified Support includes those labeled as Classified Professionals.
** FTE counts provided by Mt. San Antonio College, Santa Ana College and Santiago Canyon College respectively and includes labs
Full-Time Equivalent Employee Analysis of Comparative Districts, 2013-2014
Fall Semester FTE By Classification FTE Per 1,000 FTES
Full-Time Equivalent Employee Analysis of Comparative Districts, 2012-2013
Fall Semester FTE By Classification FTE Per 1,000 FTES
Full-Time Equivalent Employee Analysis of Comparative Districts, 2015-2016
Fall Semester FTE By Classification FTE Per 1,000 FTES
Full-Time Equivalent Employee Analysis of Comparative Districts, 2014-2015
Fall Semester FTE By Classification FTE Per 1,000 FTES
North Orange Community College District FTE Employee Analysis of Comparative Districts by FTES for North Orange Continuing Education
2012-13 through 2016-17
Full-Time Equivalent Employee Analysis of Comparative Districts, 2016-2017
Fall Semester FTE By Classification FTE Per 1,000 FTES
APPENDIX J J. State Recommendation on Position Control
The Collaborative Brain Trust 155
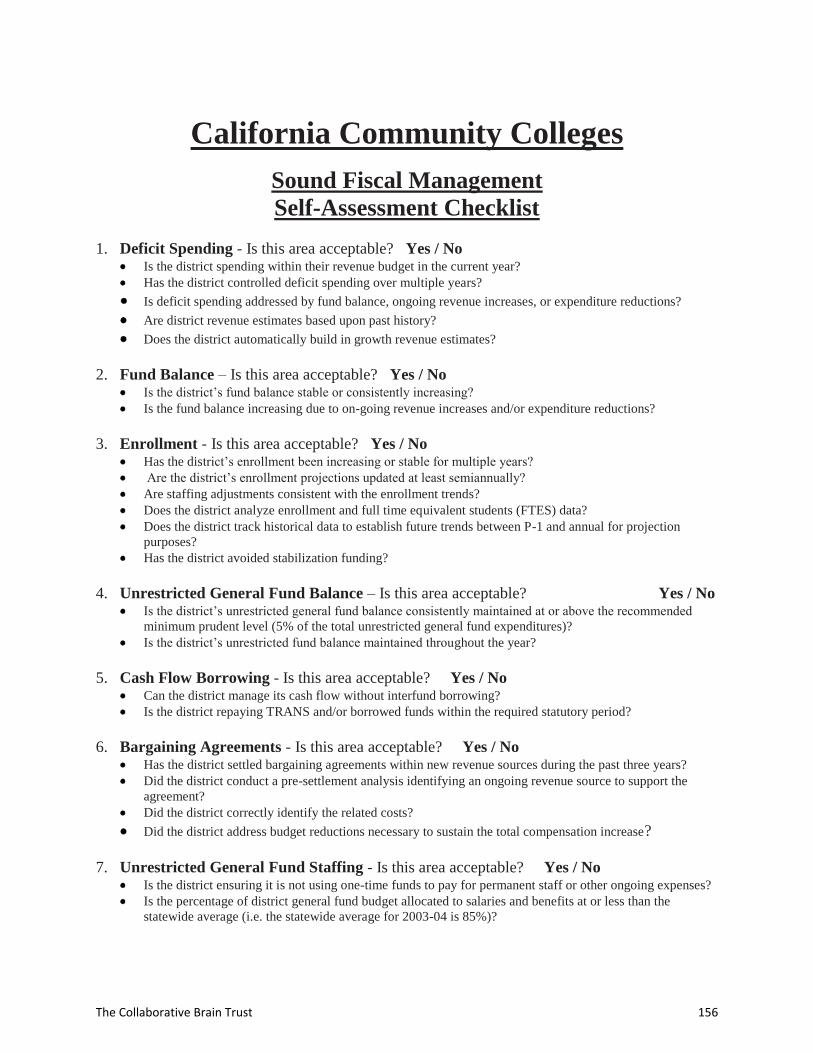
California Community Colleges Sound Fiscal Management Self-Assessment Checklist
1. Deficit Spending - Is this area acceptable? Yes / NoIs the district spending within their revenue budget in the current year? Has the district controlled deficit spending over multiple years? Is deficit spending addressed by fund balance, ongoing revenue increases, or expenditure reductions? Are district revenue estimates based upon past history? Does the district automatically build in growth revenue estimates?
2. Fund Balance – Is this area acceptable? Yes / NoIs the district’s fund balance stable or consistently increasing? Is the fund balance increasing due to on-going revenue increases and/or expenditure reductions?
3. Enrollment - Is this area acceptable? Yes / NoHas the district’s enrollment been increasing or stable for multiple years? Are the district’s enrollment projections updated at least semiannually? Are staffing adjustments consistent with the enrollment trends? Does the district analyze enrollment and full time equivalent students (FTES) data? Does the district track historical data to establish future trends between P-1 and annual for projection purposes? Has the district avoided stabilization funding?
4. Unrestricted General Fund Balance – Is this area acceptable? Yes / No Is the district’s unrestricted general fund balance consistently maintained at or above the recommended minimum prudent level (5% of the total unrestricted general fund expenditures)? Is the district’s unrestricted fund balance maintained throughout the year?
5. Cash Flow Borrowing - Is this area acceptable? Yes / NoCan the district manage its cash flow without interfund borrowing? Is the district repaying TRANS and/or borrowed funds within the required statutory period?
6. Bargaining Agreements - Is this area acceptable? Yes / NoHas the district settled bargaining agreements within new revenue sources during the past three years? Did the district conduct a pre-settlement analysis identifying an ongoing revenue source to support the agreement? Did the district correctly identify the related costs? Did the district address budget reductions necessary to sustain the total compensation increase?
7. Unrestricted General Fund Staffing - Is this area acceptable? Yes / NoIs the district ensuring it is not using one-time funds to pay for permanent staff or other ongoing expenses? Is the percentage of district general fund budget allocated to salaries and benefits at or less than the statewide average (i.e. the statewide average for 2003-04 is 85%)?
The Collaborative Brain Trust 156
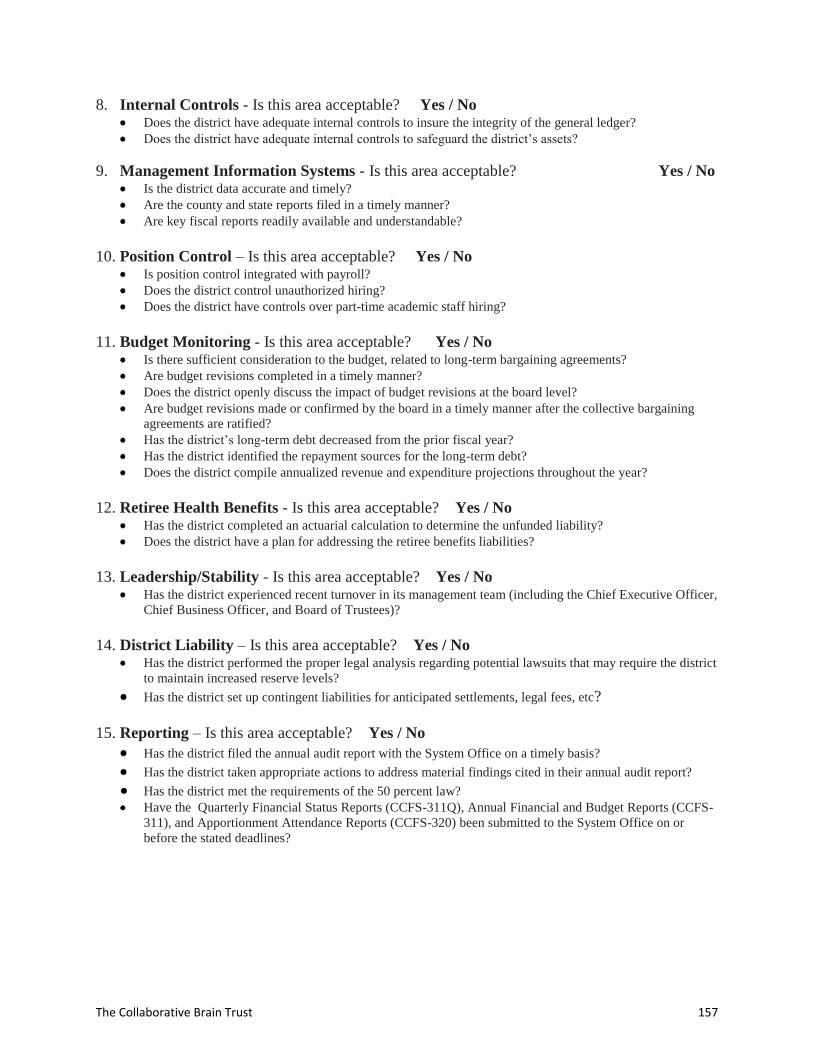
8. Internal Controls - Is this area acceptable? Yes / NoDoes the district have adequate internal controls to insure the integrity of the general ledger? Does the district have adequate internal controls to safeguard the district’s assets?
9. Management Information Systems - Is this area acceptable? Yes / No Is the district data accurate and timely? Are the county and state reports filed in a timely manner? Are key fiscal reports readily available and understandable?
10. Position Control – Is this area acceptable? Yes / NoIs position control integrated with payroll? Does the district control unauthorized hiring? Does the district have controls over part-time academic staff hiring?
11. Budget Monitoring - Is this area acceptable? Yes / NoIs there sufficient consideration to the budget, related to long-term bargaining agreements? Are budget revisions completed in a timely manner? Does the district openly discuss the impact of budget revisions at the board level? Are budget revisions made or confirmed by the board in a timely manner after the collective bargaining agreements are ratified? Has the district’s long-term debt decreased from the prior fiscal year? Has the district identified the repayment sources for the long-term debt? Does the district compile annualized revenue and expenditure projections throughout the year?
12. Retiree Health Benefits - Is this area acceptable? Yes / NoHas the district completed an actuarial calculation to determine the unfunded liability? Does the district have a plan for addressing the retiree benefits liabilities?
13. Leadership/Stability - Is this area acceptable? Yes / NoHas the district experienced recent turnover in its management team (including the Chief Executive Officer, Chief Business Officer, and Board of Trustees)?
14. District Liability – Is this area acceptable? Yes / NoHas the district performed the proper legal analysis regarding potential lawsuits that may require the district to maintain increased reserve levels? Has the district set up contingent liabilities for anticipated settlements, legal fees, etc?
15. Reporting – Is this area acceptable? Yes / NoHas the district filed the annual audit report with the System Office on a timely basis? Has the district taken appropriate actions to address material findings cited in their annual audit report? Has the district met the requirements of the 50 percent law? Have the Quarterly Financial Status Reports (CCFS-311Q), Annual Financial and Budget Reports (CCFS-311), and Apportionment Attendance Reports (CCFS-320) been submitted to the System Office on or before the stated deadlines?
The Collaborative Brain Trust 157
APPENDIX K K. NOCCCD Average Class Size
The Collaborative Brain Trust 158
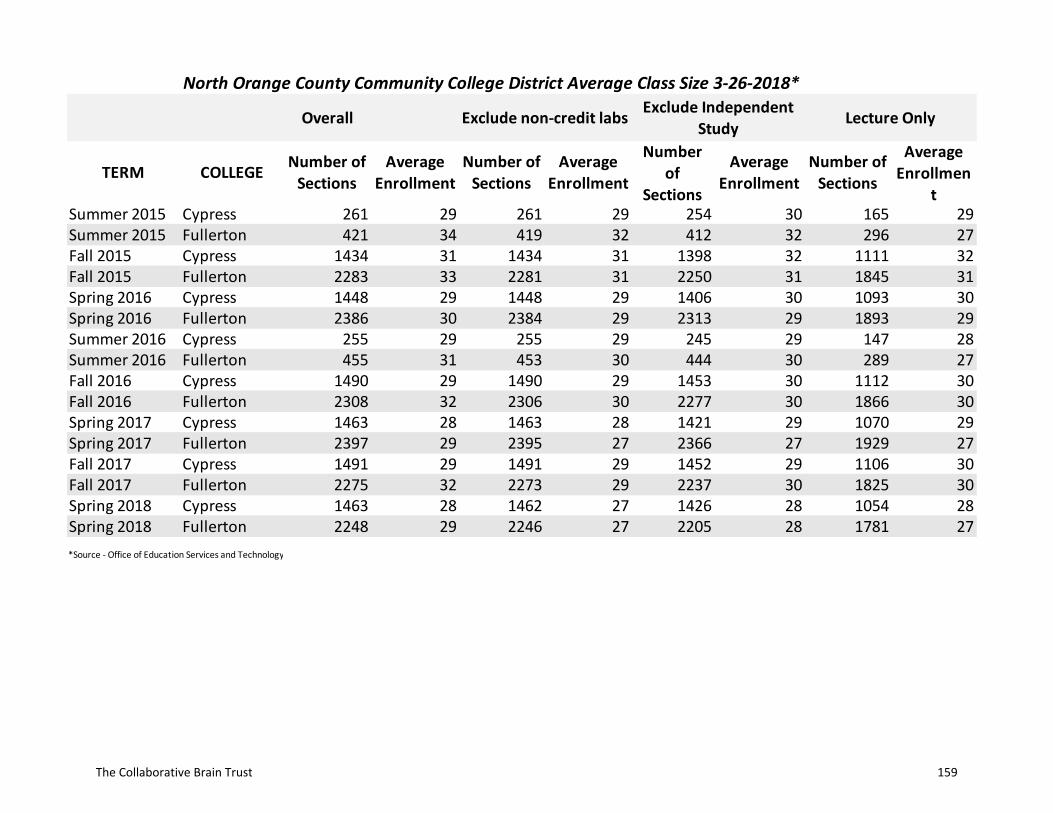
North Orange County Community College District Average Class Size 3-26-2018*
Overall
TERM COLLEGE Number of Sections
Average Enrollment
Number of Sections
Average Enrollment
Number of
Sections
Average Enrollment
Number of Sections
Average Enrollmen
tSummer 2015 Cypress 261 29 261 29 254 30 165 29Summer 2015 Fullerton 421 34 419 32 412 32 296 27Fall 2015 Cypress 1434 31 1434 31 1398 32 1111 32Fall 2015 Fullerton 2283 33 2281 31 2250 31 1845 31Spring 2016 Cypress 1448 29 1448 29 1406 30 1093 30Spring 2016 Fullerton 2386 30 2384 29 2313 29 1893 29Summer 2016 Cypress 255 29 255 29 245 29 147 28Summer 2016 Fullerton 455 31 453 30 444 30 289 27Fall 2016 Cypress 1490 29 1490 29 1453 30 1112 30Fall 2016 Fullerton 2308 32 2306 30 2277 30 1866 30Spring 2017 Cypress 1463 28 1463 28 1421 29 1070 29Spring 2017 Fullerton 2397 29 2395 27 2366 27 1929 27Fall 2017 Cypress 1491 29 1491 29 1452 29 1106 30Fall 2017 Fullerton 2275 32 2273 29 2237 30 1825 30Spring 2018 Cypress 1463 28 1462 27 1426 28 1054 28Spring 2018 Fullerton 2248 29 2246 27 2205 28 1781 27*Source - Office of Education Services and Technology
Exclude non-credit labs Exclude Independent Study Lecture Only
The Collaborative Brain Trust 159
APPENDIX L L. WSCH/FTES Comparison by College/Unit
The Collaborative Brain Trust 160
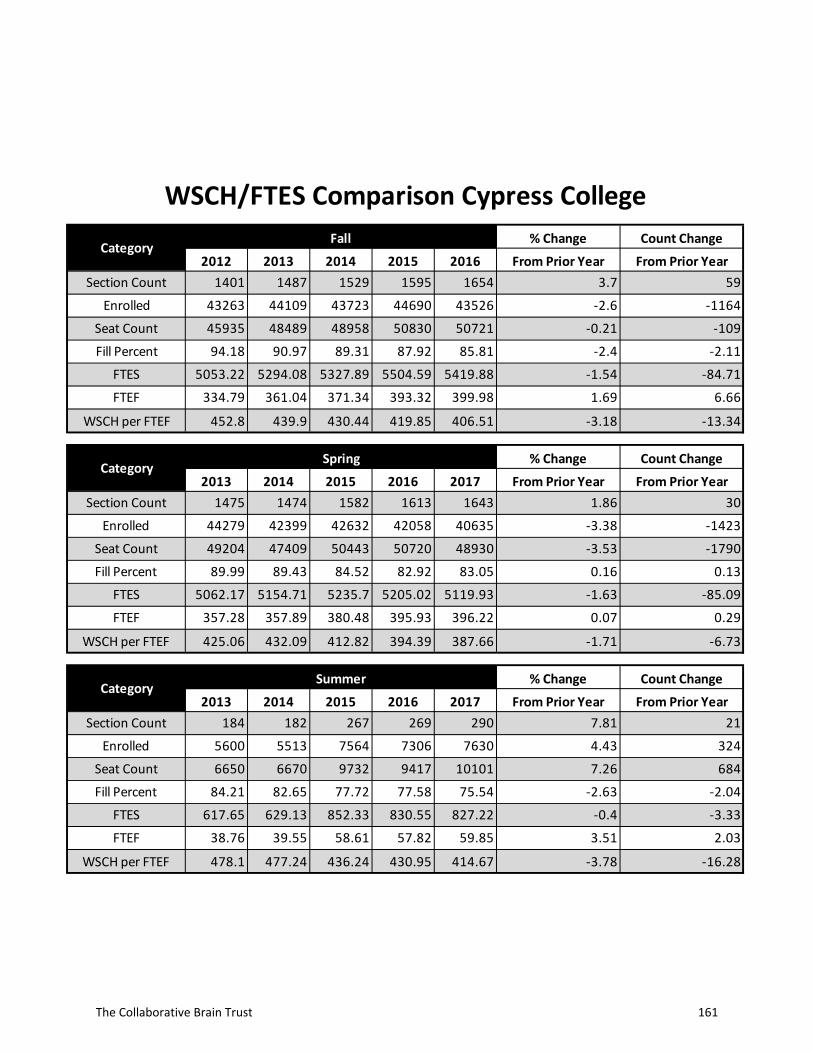
% Change Count Change
2012 2013 2014 2015 2016 From Prior Year From Prior YearSection Count 1401 1487 1529 1595 1654 3.7 59
Enrolled 43263 44109 43723 44690 43526 -2.6 -1164
Seat Count 45935 48489 48958 50830 50721 -0.21 -109
Fill Percent 94.18 90.97 89.31 87.92 85.81 -2.4 -2.11
FTES 5053.22 5294.08 5327.89 5504.59 5419.88 -1.54 -84.71
FTEF 334.79 361.04 371.34 393.32 399.98 1.69 6.66
WSCH per FTEF 452.8 439.9 430.44 419.85 406.51 -3.18 -13.34
% Change Count Change
2013 2014 2015 2016 2017 From Prior Year From Prior YearSection Count 1475 1474 1582 1613 1643 1.86 30
Enrolled 44279 42399 42632 42058 40635 -3.38 -1423
Seat Count 49204 47409 50443 50720 48930 -3.53 -1790
Fill Percent 89.99 89.43 84.52 82.92 83.05 0.16 0.13
FTES 5062.17 5154.71 5235.7 5205.02 5119.93 -1.63 -85.09
FTEF 357.28 357.89 380.48 395.93 396.22 0.07 0.29
WSCH per FTEF 425.06 432.09 412.82 394.39 387.66 -1.71 -6.73
% Change Count Change
2013 2014 2015 2016 2017 From Prior Year From Prior YearSection Count 184 182 267 269 290 7.81 21
Enrolled 5600 5513 7564 7306 7630 4.43 324
Seat Count 6650 6670 9732 9417 10101 7.26 684
Fill Percent 84.21 82.65 77.72 77.58 75.54 -2.63 -2.04
FTES 617.65 629.13 852.33 830.55 827.22 -0.4 -3.33
FTEF 38.76 39.55 58.61 57.82 59.85 3.51 2.03
WSCH per FTEF 478.1 477.24 436.24 430.95 414.67 -3.78 -16.28
CategorySummer
WSCH/FTES Comparison Cypress College
Category
CategorySpring
Fall
The Collaborative Brain Trust 161
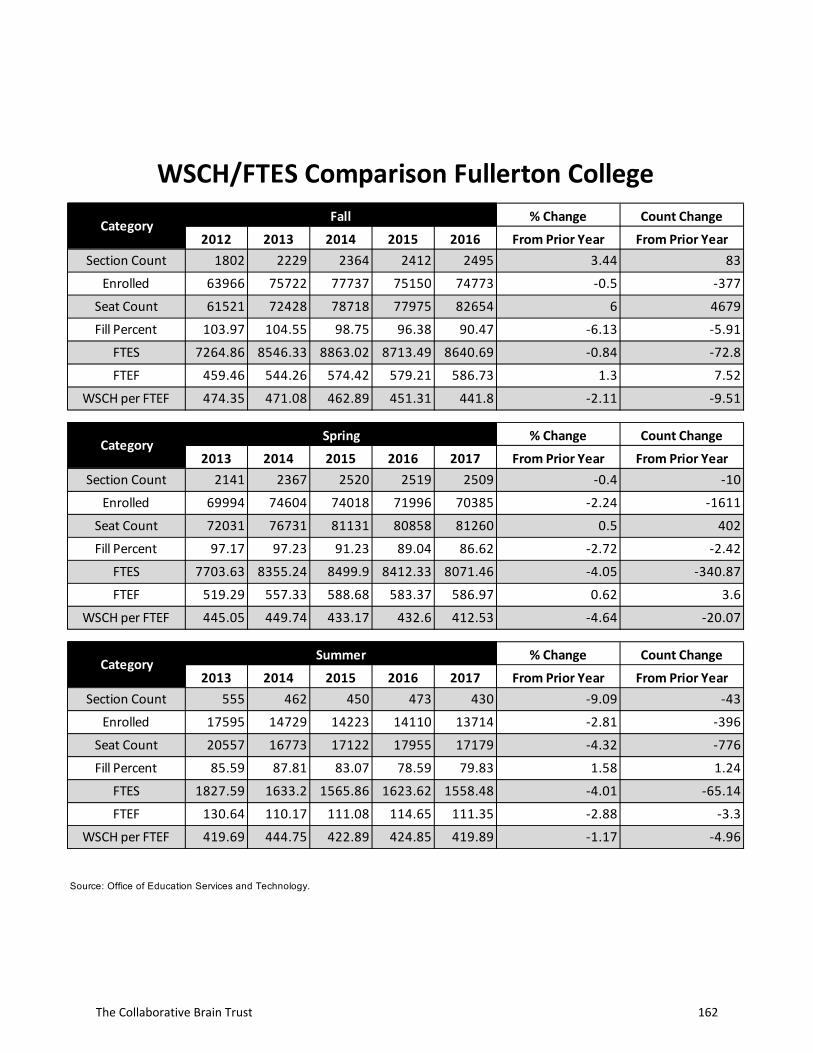
% Change Count Change
2012 2013 2014 2015 2016 From Prior Year From Prior YearSection Count 1802 2229 2364 2412 2495 3.44 83
Enrolled 63966 75722 77737 75150 74773 -0.5 -377
Seat Count 61521 72428 78718 77975 82654 6 4679
Fill Percent 103.97 104.55 98.75 96.38 90.47 -6.13 -5.91
FTES 7264.86 8546.33 8863.02 8713.49 8640.69 -0.84 -72.8
FTEF 459.46 544.26 574.42 579.21 586.73 1.3 7.52
WSCH per FTEF 474.35 471.08 462.89 451.31 441.8 -2.11 -9.51
% Change Count Change
2013 2014 2015 2016 2017 From Prior Year From Prior YearSection Count 2141 2367 2520 2519 2509 -0.4 -10
Enrolled 69994 74604 74018 71996 70385 -2.24 -1611
Seat Count 72031 76731 81131 80858 81260 0.5 402
Fill Percent 97.17 97.23 91.23 89.04 86.62 -2.72 -2.42
FTES 7703.63 8355.24 8499.9 8412.33 8071.46 -4.05 -340.87
FTEF 519.29 557.33 588.68 583.37 586.97 0.62 3.6
WSCH per FTEF 445.05 449.74 433.17 432.6 412.53 -4.64 -20.07
% Change Count Change
2013 2014 2015 2016 2017 From Prior Year From Prior YearSection Count 555 462 450 473 430 -9.09 -43
Enrolled 17595 14729 14223 14110 13714 -2.81 -396
Seat Count 20557 16773 17122 17955 17179 -4.32 -776
Fill Percent 85.59 87.81 83.07 78.59 79.83 1.58 1.24
FTES 1827.59 1633.2 1565.86 1623.62 1558.48 -4.01 -65.14
FTEF 130.64 110.17 111.08 114.65 111.35 -2.88 -3.3
WSCH per FTEF 419.69 444.75 422.89 424.85 419.89 -1.17 -4.96
Source: Office of Education Services and Technology.
CategorySummer
WSCH/FTES Comparison Fullerton College
CategoryFall
CategorySpring
The Collaborative Brain Trust 162
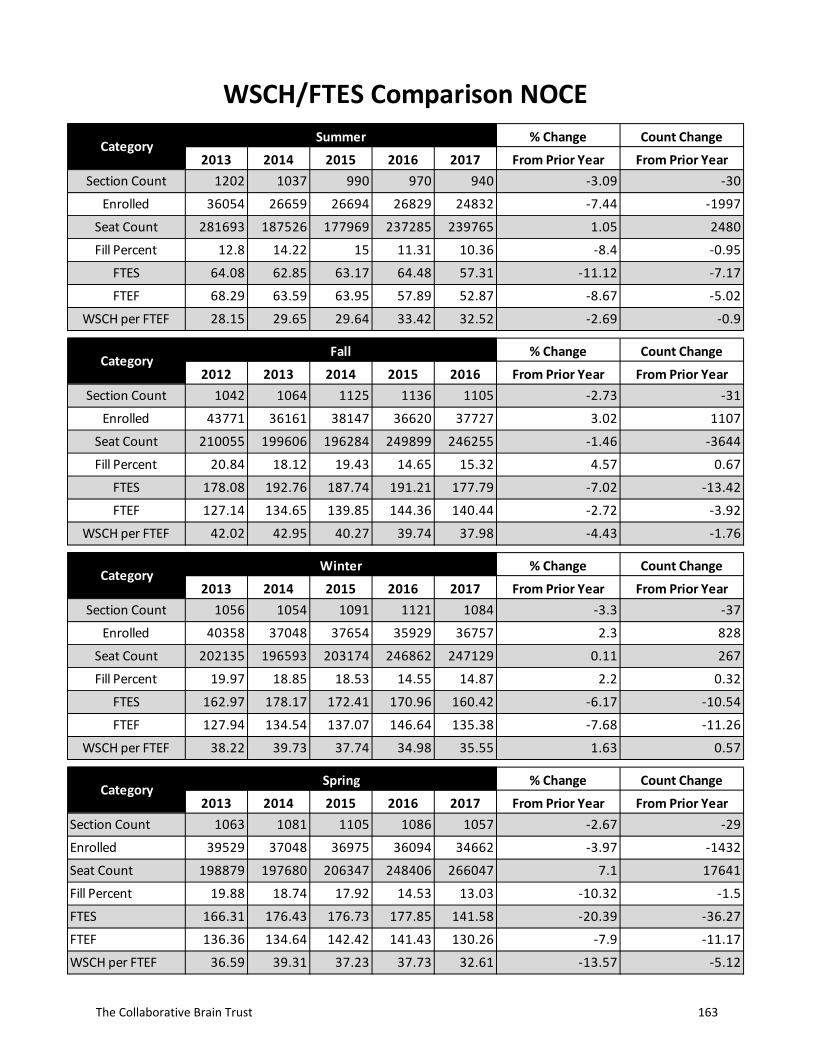
% Change Count Change
2013 2014 2015 2016 2017 From Prior Year From Prior YearSection Count 1202 1037 990 970 940 -3.09 -30
Enrolled 36054 26659 26694 26829 24832 -7.44 -1997
Seat Count 281693 187526 177969 237285 239765 1.05 2480
Fill Percent 12.8 14.22 15 11.31 10.36 -8.4 -0.95
FTES 64.08 62.85 63.17 64.48 57.31 -11.12 -7.17
FTEF 68.29 63.59 63.95 57.89 52.87 -8.67 -5.02
WSCH per FTEF 28.15 29.65 29.64 33.42 32.52 -2.69 -0.9
% Change Count Change
2012 2013 2014 2015 2016 From Prior Year From Prior YearSection Count 1042 1064 1125 1136 1105 -2.73 -31
Enrolled 43771 36161 38147 36620 37727 3.02 1107
Seat Count 210055 199606 196284 249899 246255 -1.46 -3644
Fill Percent 20.84 18.12 19.43 14.65 15.32 4.57 0.67
FTES 178.08 192.76 187.74 191.21 177.79 -7.02 -13.42
FTEF 127.14 134.65 139.85 144.36 140.44 -2.72 -3.92
WSCH per FTEF 42.02 42.95 40.27 39.74 37.98 -4.43 -1.76
% Change Count Change
2013 2014 2015 2016 2017 From Prior Year From Prior YearSection Count 1056 1054 1091 1121 1084 -3.3 -37
Enrolled 40358 37048 37654 35929 36757 2.3 828
Seat Count 202135 196593 203174 246862 247129 0.11 267
Fill Percent 19.97 18.85 18.53 14.55 14.87 2.2 0.32
FTES 162.97 178.17 172.41 170.96 160.42 -6.17 -10.54
FTEF 127.94 134.54 137.07 146.64 135.38 -7.68 -11.26
WSCH per FTEF 38.22 39.73 37.74 34.98 35.55 1.63 0.57
% Change Count Change
2013 2014 2015 2016 2017 From Prior Year From Prior YearSection Count 1063 1081 1105 1086 1057 -2.67 -29
Enrolled 39529 37048 36975 36094 34662 -3.97 -1432
Seat Count 198879 197680 206347 248406 266047 7.1 17641
Fill Percent 19.88 18.74 17.92 14.53 13.03 -10.32 -1.5
FTES 166.31 176.43 176.73 177.85 141.58 -20.39 -36.27
FTEF 136.36 134.64 142.42 141.43 130.26 -7.9 -11.17
WSCH per FTEF 36.59 39.31 37.23 37.73 32.61 -13.57 -5.12
CategorySpring
CategorySummer
WSCH/FTES Comparison NOCE
CategoryFall
CategoryWinter
The Collaborative Brain Trust 163

APPENDIX M M. Draft Revised Organizational Chart for
North Orange Continuing Education
The Collaborative Brain Trust 164
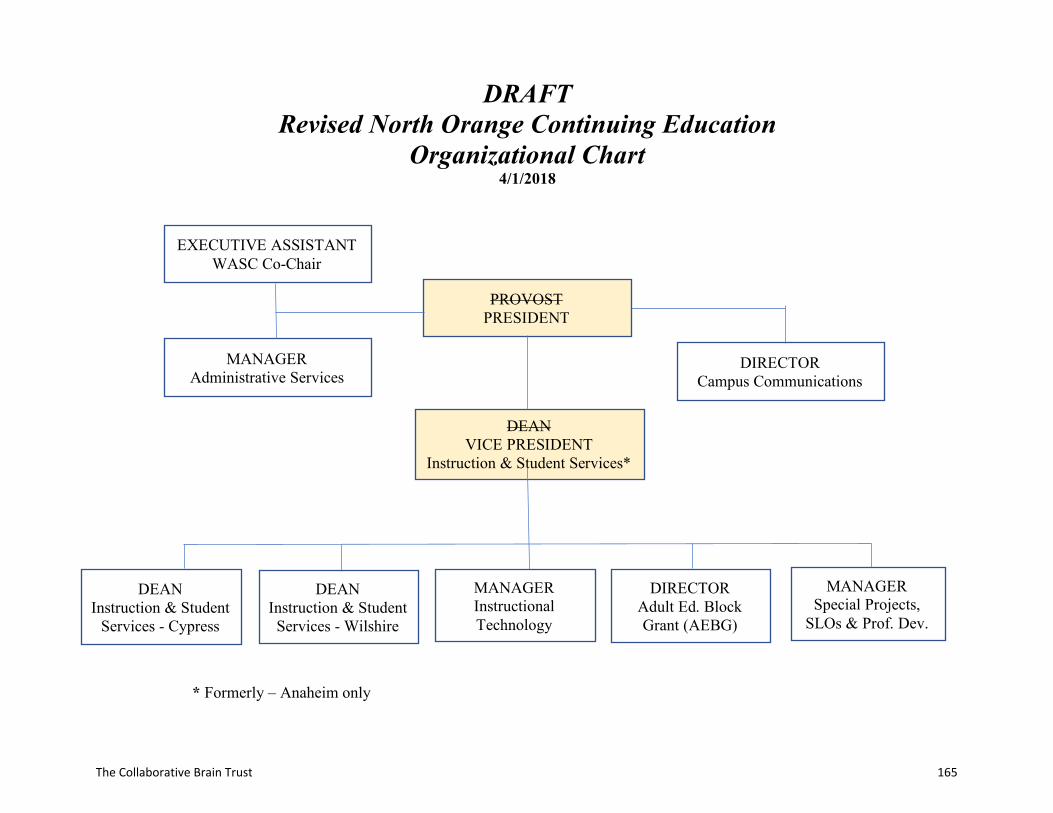
EXECUTIVE ASSISTANT WASC Co-Chair
PROVOST PRESIDENT
MANAGER Administrative Services
DEAN VICE PRESIDENT
Instruction & Student Services*
DIRECTOR Campus Communications
DEAN Instruction & Student
Services - Cypress
DEAN Instruction & Student Services - Wilshire
MANAGER Instructional Technology
DIRECTOR Adult Ed. Block Grant (AEBG)
MANAGER Special Projects,
SLOs & Prof. Dev.
DRAFT Revised North Orange Continuing Education
Organizational Chart 4/1/2018
* Formerly – Anaheim only
The Collaborative Brain Trust 165