Embed Size (px)
Citation preview
A Review of Potential Zinc and Copper Pollution Sources in the Kenai River Watershed
A REVIEW OF POTENTIAL ZINC AND COPPER POLLUTION SOURCES IN THE KENAI RIVER WATERSHED
4/13/2017 Prepared by the Kenai Watershed Forum for the Alaska Department of Environmental Conservation
A Review of Potential Zinc and Copper Pollution Sources in the Kenai River Watershed
i
Prepared by: Jeff Sires Environmental Scientist Kenai Watershed Forum (907) 260-5449 x1207 www.kenaiwatershed.org The Kenai Watershed Forum (KWF) is a 501(c)(3) non-profit and is recognized as the regional watershed organization of the Kenai Peninsula, successfully identifying and addressing the environmental needs of the region by providing high quality education, restoration and research programs. KWF is a dynamic organization dedicated to protecting the streams, rivers, and surrounding communities on the Kenai Peninsula.
TABLE OF FIGURES Figure 1: Kenai River Watershed Division and Water Quality Sampling Sites ......................................................................................... 5 Figure 2: Zinc Source Mentions Compiled From Literature Review ............................................................................................................... 7 Figure 3: Copper Source Mentions Compiled from Literature Review ......................................................................................................... 7 Figure 4: AADT Comparison for Major Highways in Alaska (Alaska DOT&PF, 2014) ............................................................................ 9 Figure 5: AADT Comparison for Other Area [Outside of Anchorage] Roads & Highways (Alaska DOT&PF, 2014) .....................10 Figure 6: K-Beach Road AADT (Alaska DOT&PF, 2014) ..............................................................................................................................10 Figure 7: Bridge Access Road AADT (Alaska DOT&PF, 2014) ....................................................................................................................11 Figure 8: Kenai Spur Highway AADT (Alaska DOT&PF, 2014) ..................................................................................................................11 Figure 9: River Mile 31.0 and Surroundings ....................................................................................................................................................13 Figure 10: River Mile 6.5 and Surroundings ....................................................................................................................................................14 Figure 11: Spring Copper Concentrations at River Mile 10.1 vs. Spur Highway AADT ........................................................................16 Figure 12: Soldotna WWTP and Downstream Sampling Sites ....................................................................................................................18
A Review of Potential Zinc and Copper Pollution Sources in the Kenai River Watershed
ii
TABLE OF TABLES Table 1: Top Five Percent Differences Between 2010 – 2014 and pre-2010 Spring Zinc Concentrations .....................................12 Table 2: Top Five Percent Differences Between 2010 – 2014 and pre-2010 Spring Copper Concentrations ..............................17 Table 3: Top Five Percent Differences Between 2010 – 2014 and pre-2010 Summer Copper Concentrations ............................17
A Review of Potential Zinc and Copper Pollution Sources in the Kenai River Watershed
3
PURPOSE This review is being submitted as a deliverable under ACWA 17-06 for the Alaska Department of Environmental Conservation. Its purpose is to highlight potential sources of zinc and copper in the Kenai River watershed. A review of relevant literature was carried out and related to general features of the Kenai River watershed, and to specific conditions at sites that demonstrated a significant increase for these two parameters from 2010 through 2014. The sites displaying the greatest increase in zinc and copper levels were summarized in the Discussion of Literature Review Focus Sites in the Kenai River Watershed, a previous deliverable for this grant. Data analysis was presented in Supplemental Analysis of Recent Zinc and Copper Concentrations in the Kenai River Watershed. This review will aim to answer the following questions:
1. What are the common sources of zinc and copper according to relevant literature?
2. Which of these sources have a realistic potential to contribute to zinc and copper pollution in the Kenai River watershed?
3. Are any of these sources present at or near Kenai River watershed sites that have demonstrated the highest levels of
zinc and copper in the recent past?
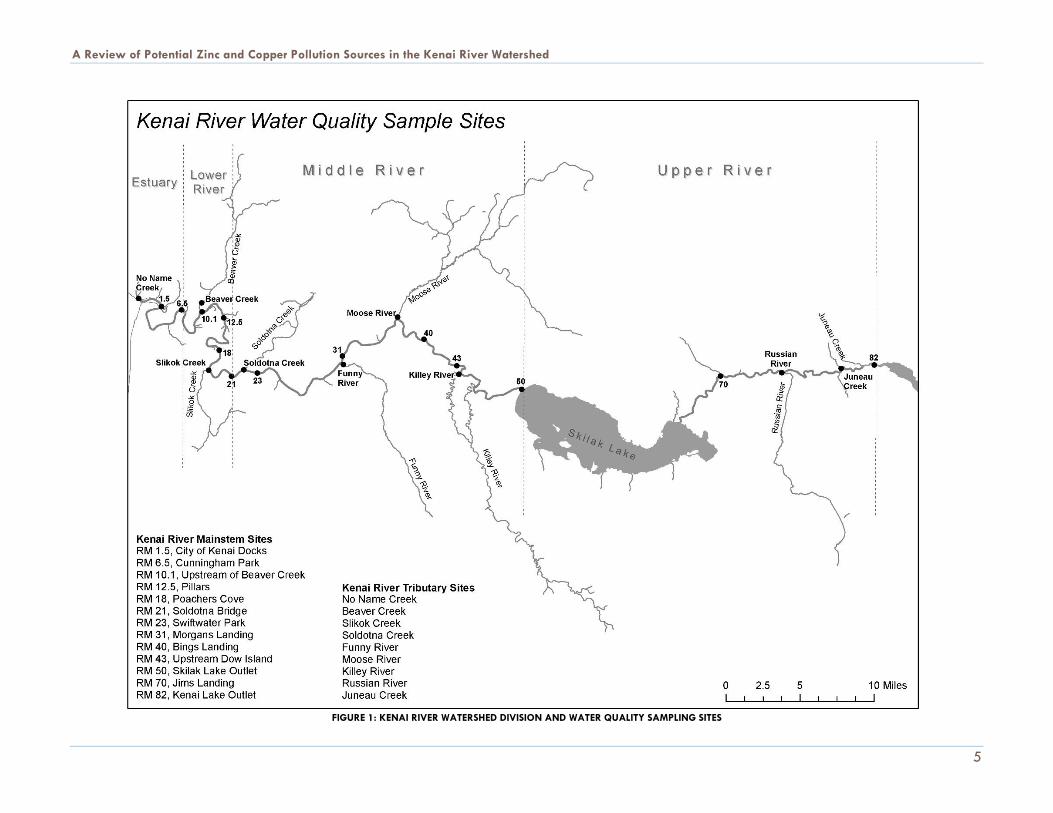
INTRODUCTION The Kenai River is a glacially-fed system running 82 miles from Kenai Lake in Cooper Landing, to its mouth on the Cook Inlet in Kenai. Several major tributaries flow into the Kenai at various points along its path. The river is commonly divided into three sections known as the Upper River (from Cooper Landing at River Mile (RM) 82 to Skilak Lake at RM 65), Middle River (from RM 50 after Skilak Lake to the Sterling Highway Bridge in Soldotna at RM 21), and Lower River (from RM 21 to the mouth in Kenai at RM 0) (Figure 1). Despite the river’s close proximity to the Sterling Highway from RM 82 to RM 69, large portions of the Upper River watershed
remain relatively undeveloped. The community of Sterling (RM 37), the City of Soldotna (RM 21.5), and the City of Kenai (RM 0) represent the most developed areas of the Kenai River watershed, and the Kenai Peninsula in general. The most recent census population estimates for Sterling, Soldotna, and Kenai are 5,617 (US Census Bureau, 2010), 4,163 (US Census Bureau, 2010), and 7,100 (US Census Bureau, 2010) respectively. In addition, several thousand residents live outside the legal boundaries of these communities. The most recent data provided by the Alaska Department of Labor and Workforce Development (Alaska DOLWD) estimates the total population of the Kenai Peninsula Borough (KPB) at 58,060 (Alaska DOLWD, 2016). An interactive map of the KPB and its geographic features, including the Kenai River, can be accessed at: http://mapserver.borough.kenai.ak.us/kpbmapviewer/. Given its environmental and economic significance to the region, the Kenai River watershed has been the focus of inspiring conservation efforts, as well the bearer of significant anthropogenic pressures. The Kenai Watershed Forum established the Kenai River Baseline Water Quality Monitoring project in 2000 to track water quality changes over time throughout the Kenai
A Review of Potential Zinc and Copper Pollution Sources in the Kenai River Watershed
4
River watershed. Several sites were chosen along the Kenai River mainstem and in its major tributaries with the goal of providing information on overall watershed health twice per year. Kenai River and tributary sampling sites are labeled in Figure 1 and will be referred to throughout this report. Baseline water quality monitoring within the Kenai River watershed demonstrated a notable increase in dissolved zinc and copper concentrations from 2010 through 2014 as compared with previous sampling years. Several sites on the Kenai River mainstem and in Kenai River tributaries produced sampling results for these parameters that were significantly higher than average, with zinc demonstrating the most notable rises, mainly occurring at several lower watershed sites. Currently, there are not sufficient data for the creation of site specific zinc and copper standards in the sampled waterbodies. However, given the deleterious effects copper (Hecht, et al., 2007) and zinc (Bowen, Werner, & Johnson, 2006) can have on salmonids and the ecosystems they rely on, the noted elevations warrant concern and further investigation. A literature review was conducted in order to determine potential sources of zinc and copper in the Kenai River watershed. Many literature sources were selected based on their relevance to the geographic, geologic, hydrologic, or anthropogenic characteristics of the Kenai River watershed. Numerous articles and reports concerning areas in the western United States, especially those with salmon-bearing streams and rivers, were given highest priority. Some consideration was also given to literature which did not focus specifically on these characteristics, but still provided pertinent information. The literature review aimed to account for a wide range of possibilities, eventually narrowing the field of potential contributors based on local conditions.
A Review of Potential Zinc and Copper Pollution Sources in the Kenai River Watershed
5
FIGURE 1: KENAI RIVER WATERSHED DIVISION AND WATER QUALITY SAMPLING SITES
A Review of Potential Zinc and Copper Pollution Sources in the Kenai River Watershed
6
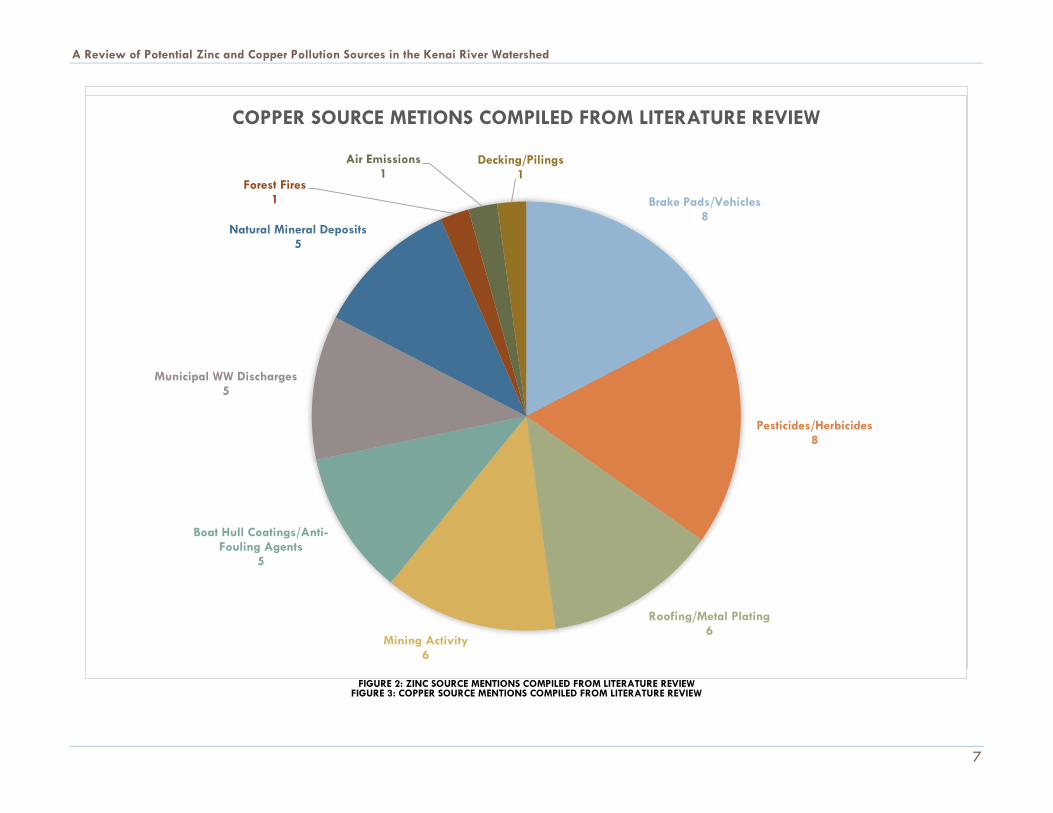
LITERATURE REVIEW RESULTS Shown in the pie charts below are breakdowns of the most mentioned sources of zinc and copper in the articles and papers selected for the literature review. In total, 27 sources were reviewed. 10 primarily discussed copper sources, 8 primarily discussed zinc sources, and 9 discussed potential sources of both trace elements. Some articles discussed sources of zinc and copper in more general terms (e.g. runoff, traffic, urbanization), while many sources pointed to specific items, industries, products, and practices that can contribute zinc or copper to a waterbody. Several papers highlighted not only the sources of these metals, but their ability to harm fish at relatively low concentrations. While these charts show that there are numerous potential sources of zinc and copper in the environment, several papers highlighted a few sources as the major contributors for each trace metal. Additionally, as expected, the noted sources of zinc and copper were found to be highly dependent on the level of development in the vicinity of the sampled waterbodies. As will be discussed, natural mineral deposits can certainly contribute to high-levels of either of these trace elements. However, the general nonpoint source factors found to influence zinc and copper concentrations were urbanization, increased percentage of impervious surfaces, accelerated storm water transport, traffic intensification, and deforestation/devegetation – all processes which are typically associated with one another. The following sections will address these factors, and their accompanying point sources as they relate to the Kenai River watershed.
A Review of Potential Zinc and Copper Pollution Sources in the Kenai River Watershed
7
Galvanized Metals (Roofing, Guardrails, Piping,
Plumbing, Fences, Construction Materials etc.)
13
Tire Wear13
Motor Oils/Hydraulic Fluids8
Fertilizer/Pesticides/Fungicides7
Natural Mineral Deposits3
Mining Activity 3
Forest Fires3
Brakes1
ZINC SOURCE MENTIONS COMPILED FROM LITERATURE REVIEW
FIGURE 2: ZINC SOURCE MENTIONS COMPILED FROM LITERATURE REVIEW
Brake Pads/Vehicles8
Pesticides/Herbicides8
Roofing/Metal Plating6
Mining Activity6
Boat Hull Coatings/Anti-Fouling Agents
5
Municipal WW Discharges5
Natural Mineral Deposits 5
Forest Fires1
Air Emissions 1
Decking/Pilings1
COPPER SOURCE METIONS COMPILED FROM LITERATURE REVIEW
FIGURE 3: COPPER SOURCE MENTIONS COMPILED FROM LITERATURE REVIEW
A Review of Potential Zinc and Copper Pollution Sources in the Kenai River Watershed
8
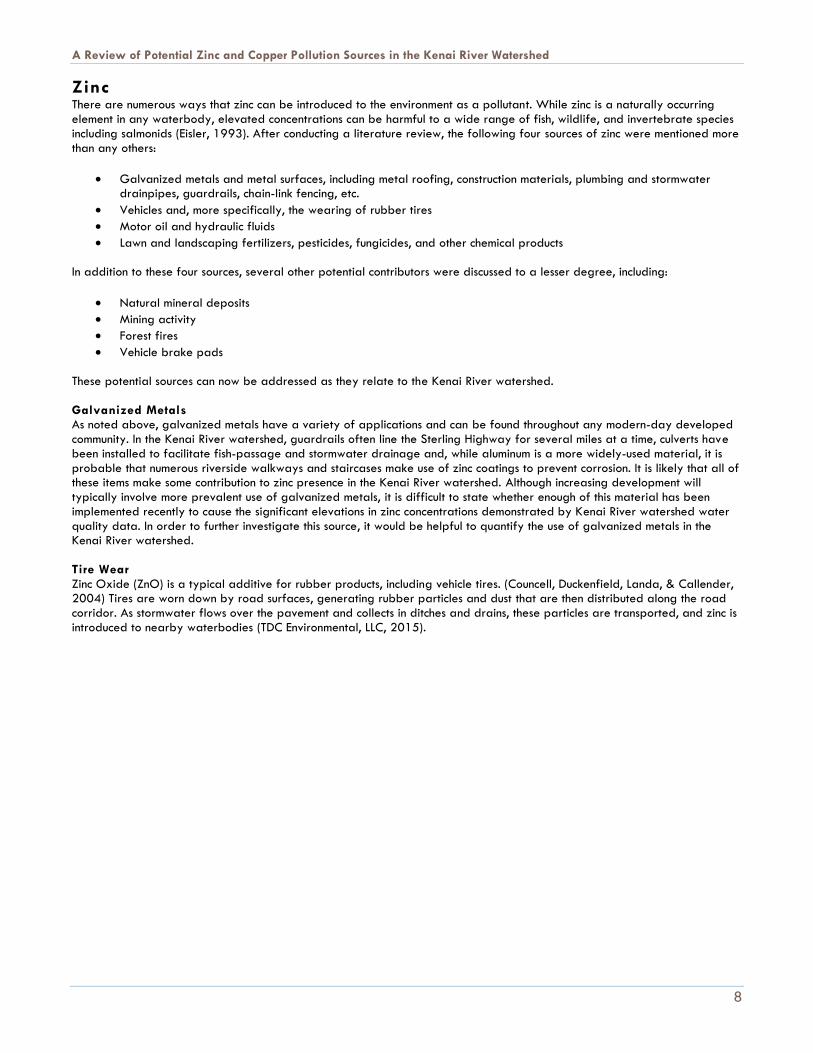
Zinc There are numerous ways that zinc can be introduced to the environment as a pollutant. While zinc is a naturally occurring element in any waterbody, elevated concentrations can be harmful to a wide range of fish, wildlife, and invertebrate species including salmonids (Eisler, 1993). After conducting a literature review, the following four sources of zinc were mentioned more than any others:
Galvanized metals and metal surfaces, including metal roofing, construction materials, plumbing and stormwater drainpipes, guardrails, chain-link fencing, etc.
Vehicles and, more specifically, the wearing of rubber tires
Motor oil and hydraulic fluids
Lawn and landscaping fertilizers, pesticides, fungicides, and other chemical products
In addition to these four sources, several other potential contributors were discussed to a lesser degree, including:
Natural mineral deposits
Mining activity
Forest fires
Vehicle brake pads These potential sources can now be addressed as they relate to the Kenai River watershed. Galvanized Metals As noted above, galvanized metals have a variety of applications and can be found throughout any modern-day developed community. In the Kenai River watershed, guardrails often line the Sterling Highway for several miles at a time, culverts have been installed to facilitate fish-passage and stormwater drainage and, while aluminum is a more widely-used material, it is probable that numerous riverside walkways and staircases make use of zinc coatings to prevent corrosion. It is likely that all of these items make some contribution to zinc presence in the Kenai River watershed. Although increasing development will typically involve more prevalent use of galvanized metals, it is difficult to state whether enough of this material has been implemented recently to cause the significant elevations in zinc concentrations demonstrated by Kenai River watershed water quality data. In order to further investigate this source, it would be helpful to quantify the use of galvanized metals in the Kenai River watershed. Tire Wear Zinc Oxide (ZnO) is a typical additive for rubber products, including vehicle tires. (Councell, Duckenfield, Landa, & Callender, 2004) Tires are worn down by road surfaces, generating rubber particles and dust that are then distributed along the road corridor. As stormwater flows over the pavement and collects in ditches and drains, these particles are transported, and zinc is introduced to nearby waterbodies (TDC Environmental, LLC, 2015).
A Review of Potential Zinc and Copper Pollution Sources in the Kenai River Watershed
9
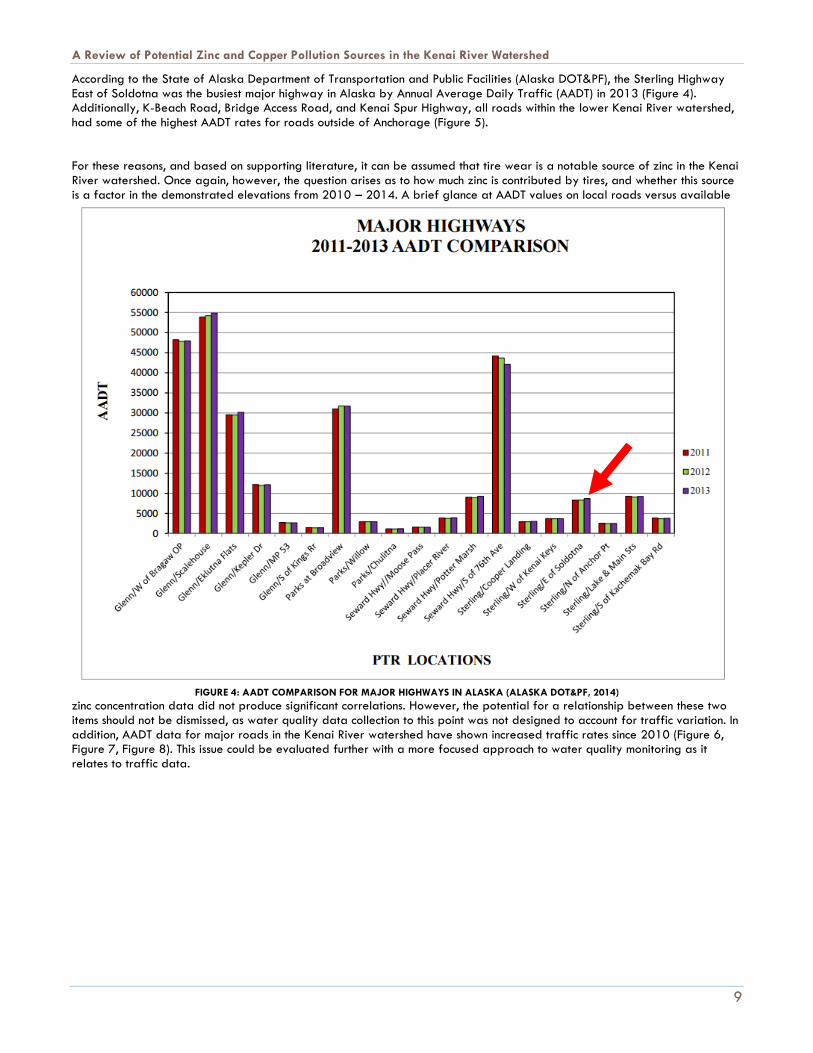
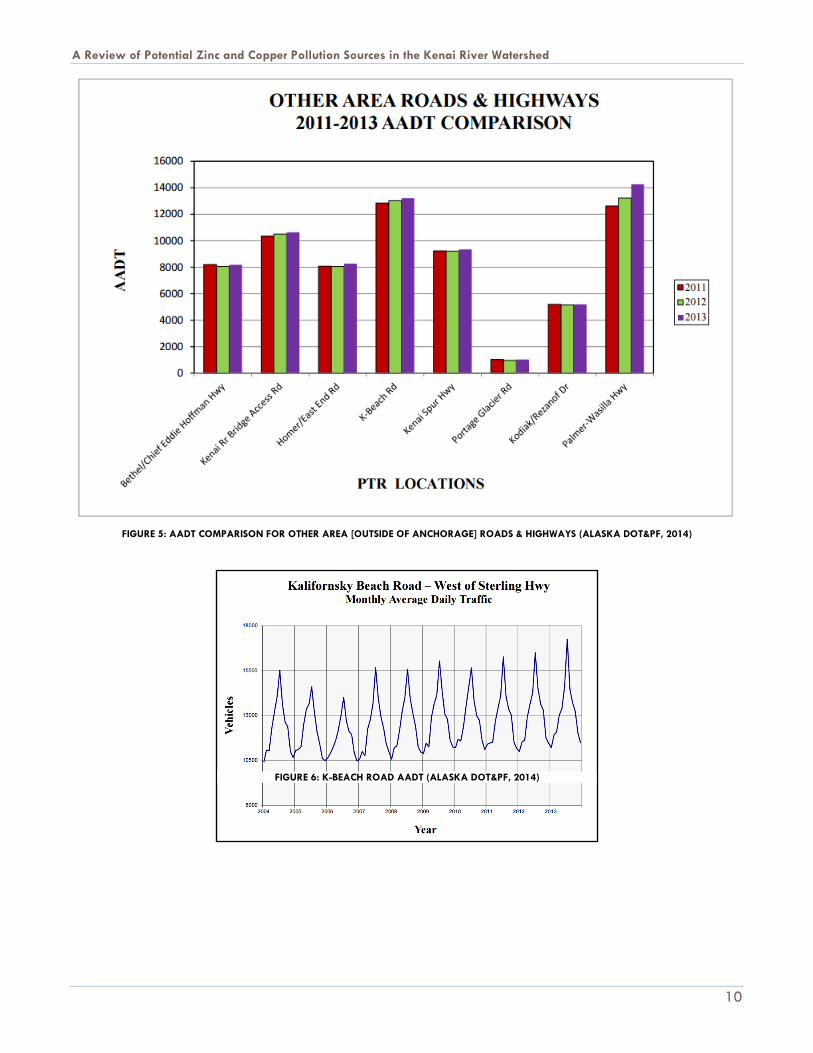
According to the State of Alaska Department of Transportation and Public Facilities (Alaska DOT&PF), the Sterling Highway East of Soldotna was the busiest major highway in Alaska by Annual Average Daily Traffic (AADT) in 2013 (Figure 4). Additionally, K-Beach Road, Bridge Access Road, and Kenai Spur Highway, all roads within the lower Kenai River watershed, had some of the highest AADT rates for roads outside of Anchorage (Figure 5). For these reasons, and based on supporting literature, it can be assumed that tire wear is a notable source of zinc in the Kenai River watershed. Once again, however, the question arises as to how much zinc is contributed by tires, and whether this source is a factor in the demonstrated elevations from 2010 – 2014. A brief glance at AADT values on local roads versus available
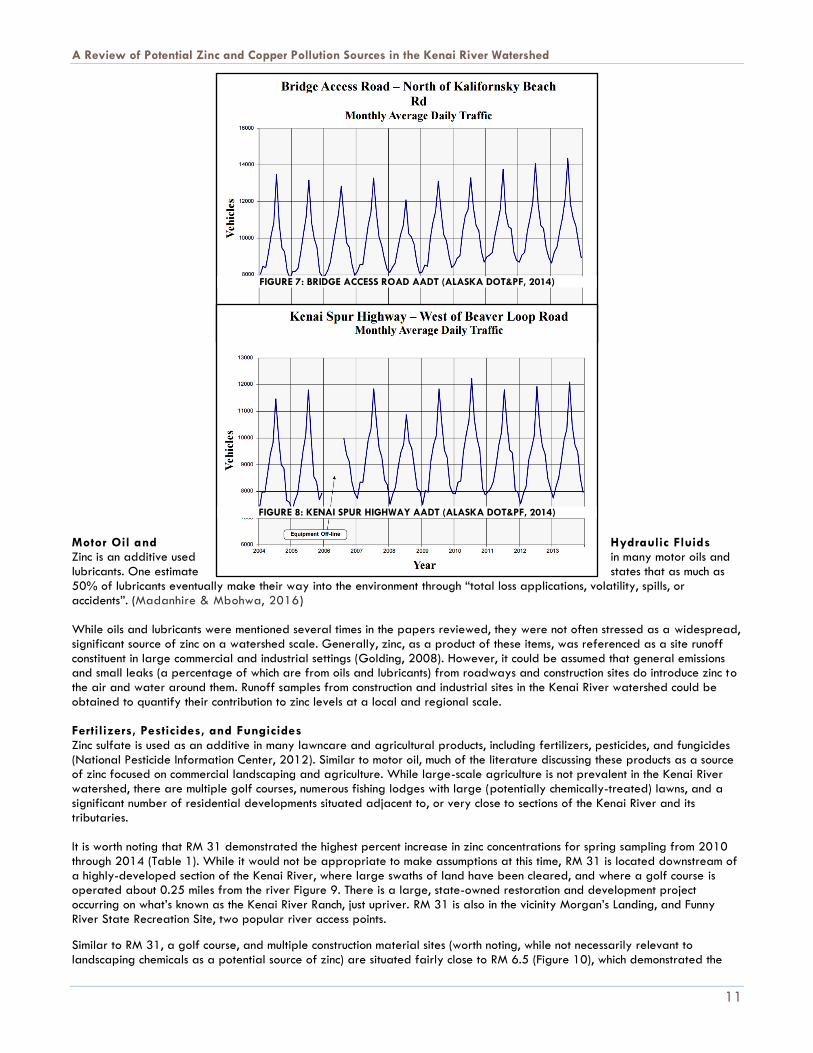
zinc concentration data did not produce significant correlations. However, the potential for a relationship between these two items should not be dismissed, as water quality data collection to this point was not designed to account for traffic variation. In addition, AADT data for major roads in the Kenai River watershed have shown increased traffic rates since 2010 (Figure 6, Figure 7, Figure 8). This issue could be evaluated further with a more focused approach to water quality monitoring as it relates to traffic data.
FIGURE 4: AADT COMPARISON FOR MAJOR HIGHWAYS IN ALASKA (ALASKA DOT&PF, 2014)
A Review of Potential Zinc and Copper Pollution Sources in the Kenai River Watershed
10
FIGURE 5: AADT COMPARISON FOR OTHER AREA [OUTSIDE OF ANCHORAGE] ROADS & HIGHWAYS (ALASKA DOT&PF, 2014)
FIGURE 6: K-BEACH ROAD AADT (ALASKA DOT&PF, 2014)
A Review of Potential Zinc and Copper Pollution Sources in the Kenai River Watershed
11
Motor Oil and Hydraulic Fluids Zinc is an additive used in many motor oils and lubricants. One estimate states that as much as 50% of lubricants eventually make their way into the environment through “total loss applications, volatility, spills, or accidents”. (Madanhire & Mbohwa, 2016) While oils and lubricants were mentioned several times in the papers reviewed, they were not often stressed as a widespread, significant source of zinc on a watershed scale. Generally, zinc, as a product of these items, was referenced as a site runoff constituent in large commercial and industrial settings (Golding, 2008). However, it could be assumed that general emissions and small leaks (a percentage of which are from oils and lubricants) from roadways and construction sites do introduce zinc to the air and water around them. Runoff samples from construction and industrial sites in the Kenai River watershed could be obtained to quantify their contribution to zinc levels at a local and regional scale. Fertilizers, Pesticides, and Fungicides Zinc sulfate is used as an additive in many lawncare and agricultural products, including fertilizers, pesticides, and fungicides (National Pesticide Information Center, 2012). Similar to motor oil, much of the literature discussing these products as a source of zinc focused on commercial landscaping and agriculture. While large-scale agriculture is not prevalent in the Kenai River watershed, there are multiple golf courses, numerous fishing lodges with large (potentially chemically-treated) lawns, and a
significant number of residential developments situated adjacent to, or very close to sections of the Kenai River and its tributaries. It is worth noting that RM 31 demonstrated the highest percent increase in zinc concentrations for spring sampling from 2010 through 2014 (Table 1). While it would not be appropriate to make assumptions at this time, RM 31 is located downstream of a highly-developed section of the Kenai River, where large swaths of land have been cleared, and where a golf course is operated about 0.25 miles from the river Figure 9. There is a large, state-owned restoration and development project occurring on what’s known as the Kenai River Ranch, just upriver. RM 31 is also in the vicinity Morgan’s Landing, and Funny River State Recreation Site, two popular river access points.
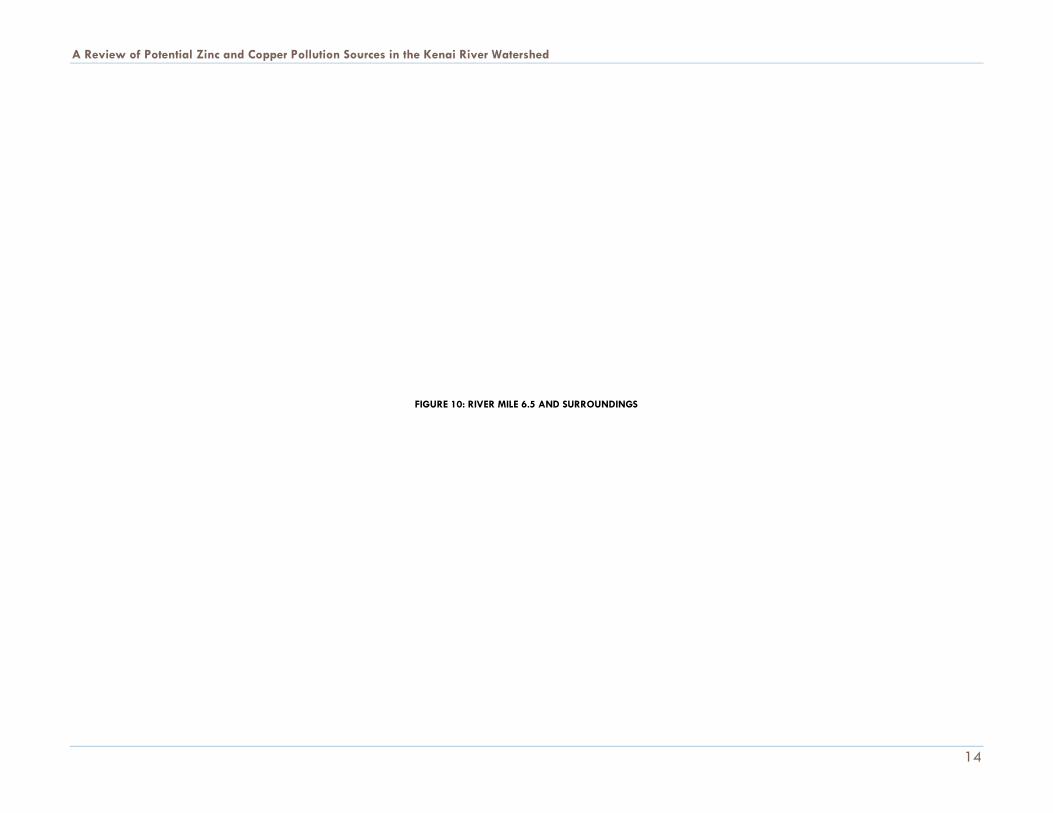
Similar to RM 31, a golf course, and multiple construction material sites (worth noting, while not necessarily relevant to landscaping chemicals as a potential source of zinc) are situated fairly close to RM 6.5 (Figure 10), which demonstrated the
FIGURE 7: BRIDGE ACCESS ROAD AADT (ALASKA DOT&PF, 2014)
FIGURE 8: KENAI SPUR HIGHWAY AADT (ALASKA DOT&PF, 2014)
A Review of Potential Zinc and Copper Pollution Sources in the Kenai River Watershed
12
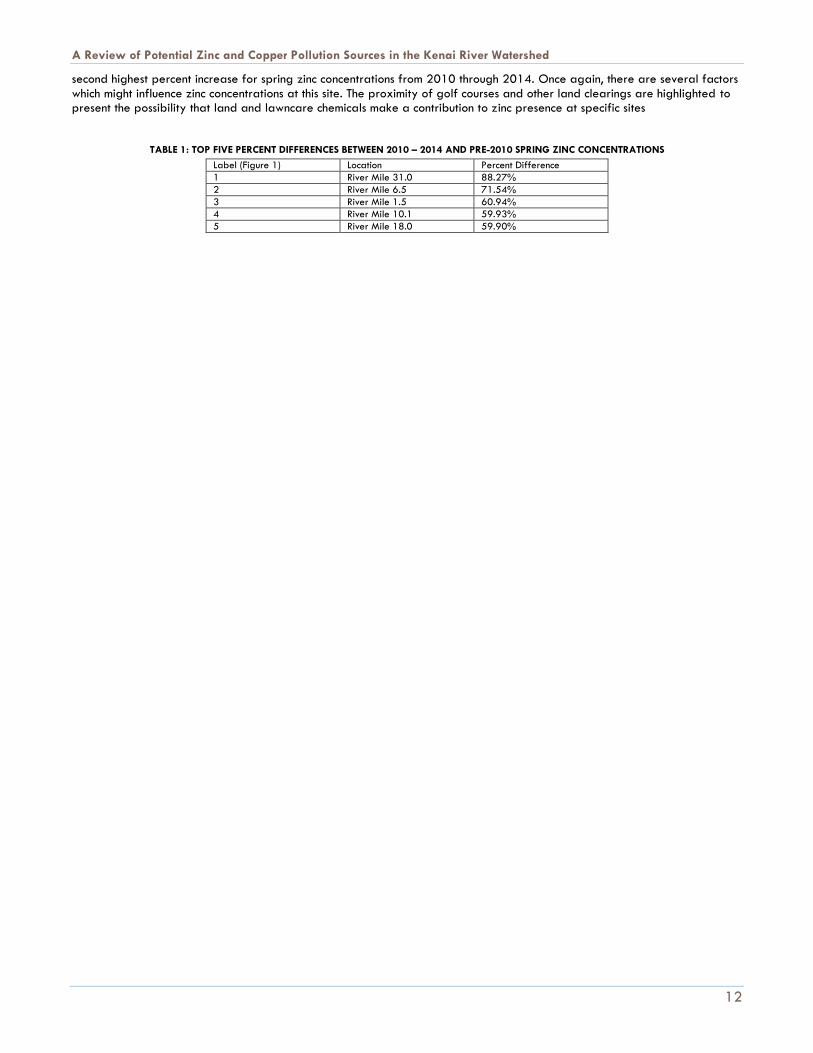
second highest percent increase for spring zinc concentrations from 2010 through 2014. Once again, there are several factors which might influence zinc concentrations at this site. The proximity of golf courses and other land clearings are highlighted to present the possibility that land and lawncare chemicals make a contribution to zinc presence at specific sites
TABLE 1: TOP FIVE PERCENT DIFFERENCES BETWEEN 2010 – 2014 AND PRE-2010 SPRING ZINC CONCENTRATIONS
Label (Figure 1) Location Percent Difference
1 River Mile 31.0 88.27%
2 River Mile 6.5 71.54%
3 River Mile 1.5 60.94%
4 River Mile 10.1 59.93%
5 River Mile 18.0 59.90%

A Review of Potential Zinc and Copper Pollution Sources in the Kenai River Watershed
13
FIGURE 9: RIVER MILE 31.0 AND SURROUNDINGS
A Review of Potential Zinc and Copper Pollution Sources in the Kenai River Watershed
14
FIGURE 10: RIVER MILE 6.5 AND SURROUNDINGS
A Review of Potential Zinc and Copper Pollution Sources in the Kenai River Watershed
15
Other Potential Sources Several other potential sources of zinc were mentioned to a lesser degree in the literature reviewed. While these options are worthy of consideration and discussion, they may not be priorities for further investigation with regards to this issue. NATURAL MINERAL DEPOSITS As discussed previously, zinc is a naturally occurring element in virtually every waterbody on earth. In some waters, zinc concentrations are naturally high as a result of watershed geology. That being the case, it is unlikely that natural mineral deposits would be a major contributing factor in significant fluctuations such as those seen in the lower Kenai River watershed from 2010 – 2014. In addition, Dr. Richard Reger, an expert in regional geology, indicated that there were no substantial polymetallic deposits in the Kenai River watershed (R. Reger, PhD, personal communication, 2016). Samples taken at RM 50, and at the mouth of the Killey River, both locations in largely undeveloped portions of the watershed, did demonstrate increases in average zinc concentrations during the relevant time period. This signifies that some natural influence is probable. However, zinc concentrations at these sites were, on average, much lower than those seen in downstream sections of the river, and in more developed tributary corridors. MINING ACTIVITY Zinc is known to contaminate waters in the vicinity of historical mining districts, or areas where zinc and/or other metals mining is currently taking place. While Alaska in general is known for rich gold and copper deposits, which are often found together with zinc (Plumlee, Montour, Taylor, Wallace, & Klein, 1996), no significant mining activity has taken place in the Cook Inlet
Basin (Glass, Brabets, Frenzel, Whitman, & Ourso, 1999), which includes the Kenai River watershed. FOREST FIRES Forest fires were mentioned by multiple literature sources as potential contributors of zinc to nearby waterbodies through air deposition. This possibility raises some interesting questions about the Funny River Fire, a large wildfire that burned nearly 200,000 acres near Soldotna over the course of two months in 2014. While it can be assumed that this fire did have some effect on water quality, elevations in zinc concentrations had occurred to a greater extent in the summers (when any water quality changes resulting from the Funny River Fire would have been captured) leading up to 2014. A plan could be produced similar to that of the Southern California Coastal Water Research Project (Stein & Brown, 2009) for monitoring water quality changes in response to wildfires in the Kenai River watershed. VEHICLE BRAKE PADS Vehicle brake pads were occasionally brought up as a potential source of zinc in the environment. However, most papers referenced brake pads as a major source of copper, and an insignificant source of zinc.
Copper Similar to zinc, there are a variety of potential sources of copper in water and the environment. Copper is a naturally occurring element that provides benefits to a given ecosystem at the proper concentrations. However, sudden exposure to high concentrations, or chronic exposure to slightly elevated concentrations, can be harmful to ecosystems and the species they support. A National Oceanic and Atmospheric Administration report published in 2007 summarized the effects of above-background copper levels on juvenile salmonids:
“A LARGE BODY OF SCIENTIFIC LITERATURE HAS SHOWN THAT FISH BEHAVIORS CAN BE DISRUPTED AT CONCENTRATIONS OF [DISSOLVED COPPER (DCU)]
THAT ARE AT OR SLIGHTLY ABOVE AMBIENT CONCENTRATIONS (I.E., BACKGROUND). IN THIS DOCUMENT, BACKGROUND IS OPERATIONALLY DEFINED AS
SURFACE WATERS WITH LESS THAN 3 µG/L DCU, AS EXPERIMENTAL WATER HAD BACKGROUND DCU CONCENTRATIONS AS HIGH AS 3 µG/L DCU. SENSORY SYSTEM EFFECTS ARE GENERALLY AMONG THE MORE SENSITIVE FISH RESPONSES AND UNDERLIE IMPORTANT BEHAVIORS INVOLVED IN GROWTH, REPRODUCTION, AND (ULTIMATELY) SURVIVAL (I.E., PREDATOR AVOIDANCE). RECENT EXPERIMENTS ON THE SENSORY SYSTEMS AND CORRESPONDING
BEHAVIOR OF JUVENILE SALMONIDS CONTRIBUTE TO MORE THAN FOUR DECADES OF RESEARCH AND SHOW THAT DCU IS A NEUROTOXICANT THAT DIRECTLY
DAMAGES THE SENSORY CAPABILITIES OF SALMONIDS AT LOW CONCENTRATIONS. THESE EFFECTS CAN MANIFEST OVER A PERIOD OF MINUTES TO HOURS
AND CAN PERSIST FOR WEEKS.” (HECHT, ET AL., 2007)
After conducting the literature review for this project, it was found that the following six sources were mentioned more than any others:
Vehicle brake pads
Pesticides, herbicides, and fungicides
Copper roofing and metal plating
Mining activity
Boat hull coatings and anti-fouling chemicals
Municipal wastewater discharges
Natural mineral deposits
A Review of Potential Zinc and Copper Pollution Sources in the Kenai River Watershed
16
In addition to these four sources, several other potential contributors were discussed to a lesser degree, including:
Forest fires
Air emissions
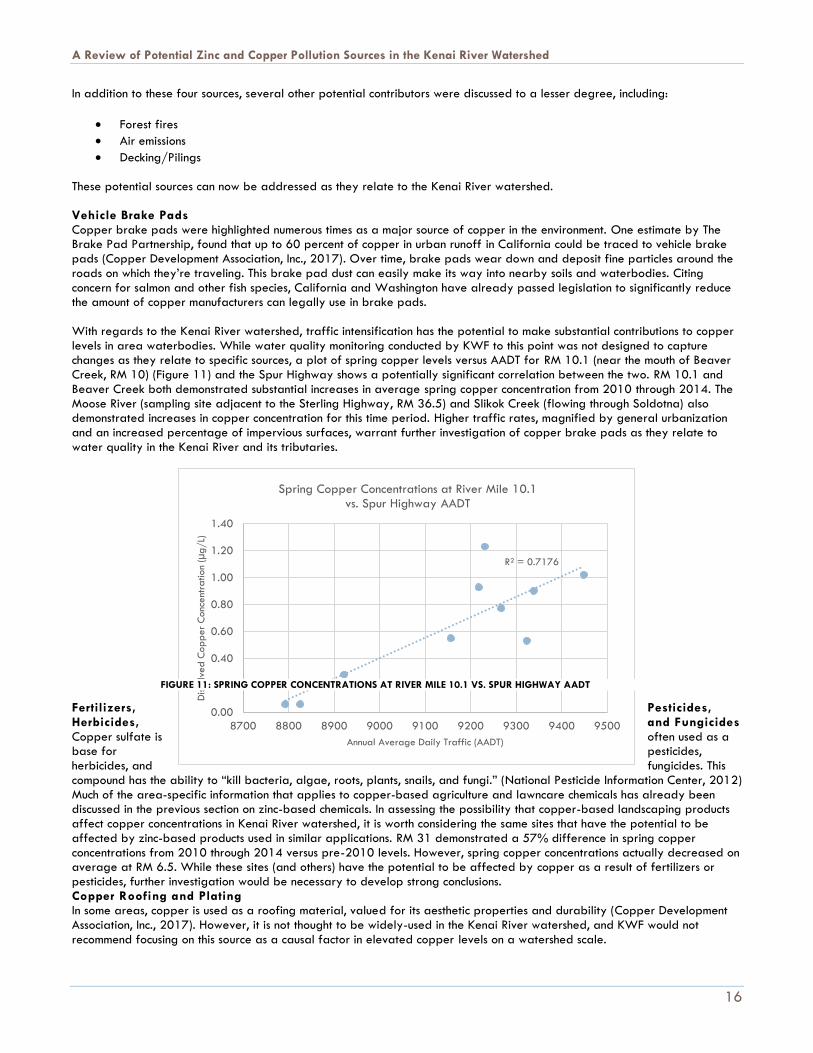
Decking/Pilings These potential sources can now be addressed as they relate to the Kenai River watershed. Vehicle Brake Pads Copper brake pads were highlighted numerous times as a major source of copper in the environment. One estimate by The Brake Pad Partnership, found that up to 60 percent of copper in urban runoff in California could be traced to vehicle brake pads (Copper Development Association, Inc., 2017). Over time, brake pads wear down and deposit fine particles around the roads on which they’re traveling. This brake pad dust can easily make its way into nearby soils and waterbodies. Citing concern for salmon and other fish species, California and Washington have already passed legislation to significantly reduce the amount of copper manufacturers can legally use in brake pads. With regards to the Kenai River watershed, traffic intensification has the potential to make substantial contributions to copper
levels in area waterbodies. While water quality monitoring conducted by KWF to this point was not designed to capture changes as they relate to specific sources, a plot of spring copper levels versus AADT for RM 10.1 (near the mouth of Beaver Creek, RM 10) (Figure 11) and the Spur Highway shows a potentially significant correlation between the two. RM 10.1 and Beaver Creek both demonstrated substantial increases in average spring copper concentration from 2010 through 2014. The Moose River (sampling site adjacent to the Sterling Highway, RM 36.5) and Slikok Creek (flowing through Soldotna) also demonstrated increases in copper concentration for this time period. Higher traffic rates, magnified by general urbanization and an increased percentage of impervious surfaces, warrant further investigation of copper brake pads as they relate to water quality in the Kenai River and its tributaries. Fertilizers, Pesticides, Herbicides, and Fungicides Copper sulfate is often used as a base for pesticides, herbicides, and fungicides. This compound has the ability to “kill bacteria, algae, roots, plants, snails, and fungi.” (National Pesticide Information Center, 2012) Much of the area-specific information that applies to copper-based agriculture and lawncare chemicals has already been discussed in the previous section on zinc-based chemicals. In assessing the possibility that copper-based landscaping products affect copper concentrations in Kenai River watershed, it is worth considering the same sites that have the potential to be affected by zinc-based products used in similar applications. RM 31 demonstrated a 57% difference in spring copper concentrations from 2010 through 2014 versus pre-2010 levels. However, spring copper concentrations actually decreased on average at RM 6.5. While these sites (and others) have the potential to be affected by copper as a result of fertilizers or pesticides, further investigation would be necessary to develop strong conclusions. Copper Roofing and Plating In some areas, copper is used as a roofing material, valued for its aesthetic properties and durability (Copper Development Association, Inc., 2017). However, it is not thought to be widely-used in the Kenai River watershed, and KWF would not recommend focusing on this source as a causal factor in elevated copper levels on a watershed scale.
R² = 0.7176
0.00
0.20
0.40
0.60
0.80
1.00
1.20
1.40
8700 8800 8900 9000 9100 9200 9300 9400 9500
Disso
lved
Cop
per
Conc
ent
ration
(µg
/L)
Annual Average Daily Traffic (AADT)
Spring Copper Concentrations at River Mile 10.1 vs. Spur Highway AADT
FIGURE 11: SPRING COPPER CONCENTRATIONS AT RIVER MILE 10.1 VS. SPUR HIGHWAY AADT
A Review of Potential Zinc and Copper Pollution Sources in the Kenai River Watershed
17
Mining Activity The same information discussed in the mining activity section for zinc sources can be applied to this section for copper. While historical and current mining practices may be the result of copper pollution in other areas on the Kenai Peninsula, or in the state of Alaska, the Kenai River watershed is not known to have been a focus point for copper extraction (Glass, et al., 1999). Boat Hull Coatings and Anti-Fouling Agents Boat hull coatings and anti-fouling paints were discussed multiple times as a factor in copper pollution in marine environments. The Alaska Department of Environmental Conservation (Alaska DEC) provides a manual on anti-fouling paint application, and discusses “concerns over the use of copper-based paints” (Alaska DEC, 2016). One report, while noting moderate uncertainty in the estimate, found that marine anti-fouling agents may contribute up to 20,000 pounds of copper each year to San Francisco Bay (TDC Environmental, 2004). While most of the Kenai River watershed is classified as freshwater, the substantial commercial and sport fishing traffic that occurs in estuarine areas of the Kenai River makes this potential source worthy of further consideration and investigation. The same report referenced above notes that dry-stored boats (likely most, if not all, river boats) are not normally treated with anti-fouling paint (TDC Environmental, 2004). For this reason, it is probable that copper contributions from anti-fouling paints are more significant in permanent harbors. Still, it may be worthwhile to attempt to quantify the number of boats using such chemicals, given that many of the greatest increases in copper concentrations occurred in river areas with heavy boat traffic during the summer.
Municipal Wastewater Effluent Copper from water infrastructure can leach at the source, or accumulate from various residential sources before arriving at municipal wastewater treatment plants (WWTP) in high concentrations (City of Palo Alto, 2002). Many municipalities struggle to meet water quality requirements, or necessitate adjusted criteria as a result. A report published by the City of Soldotna in
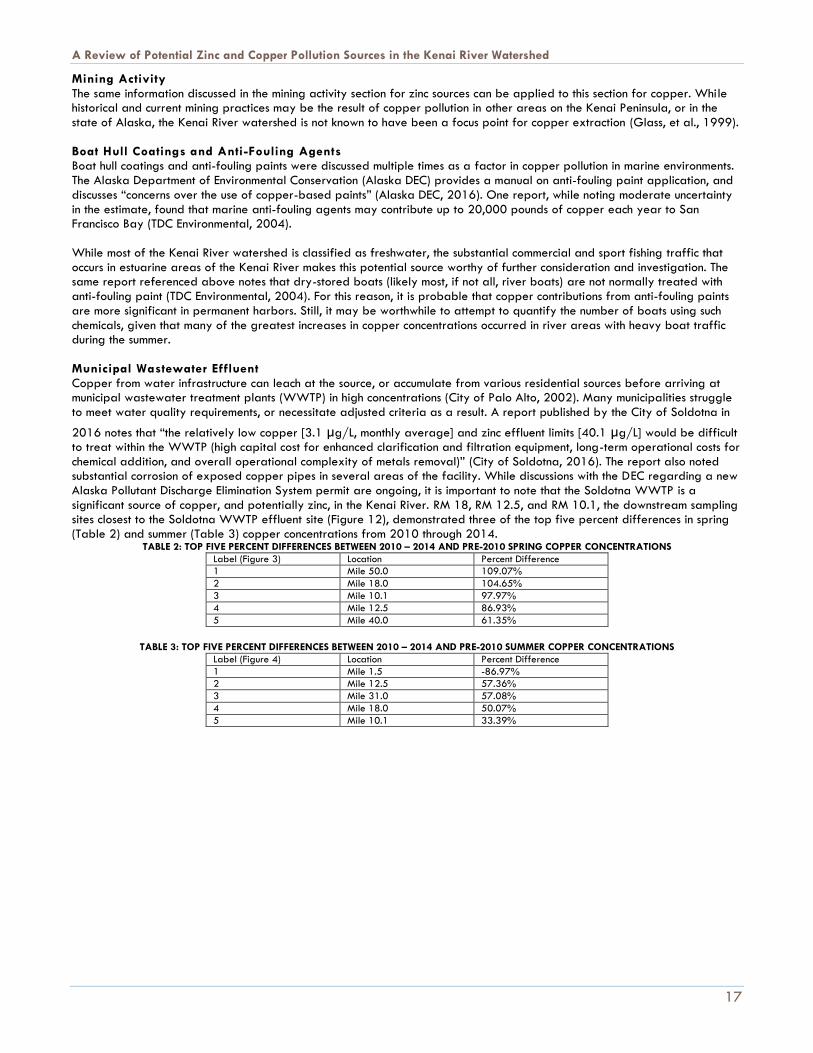
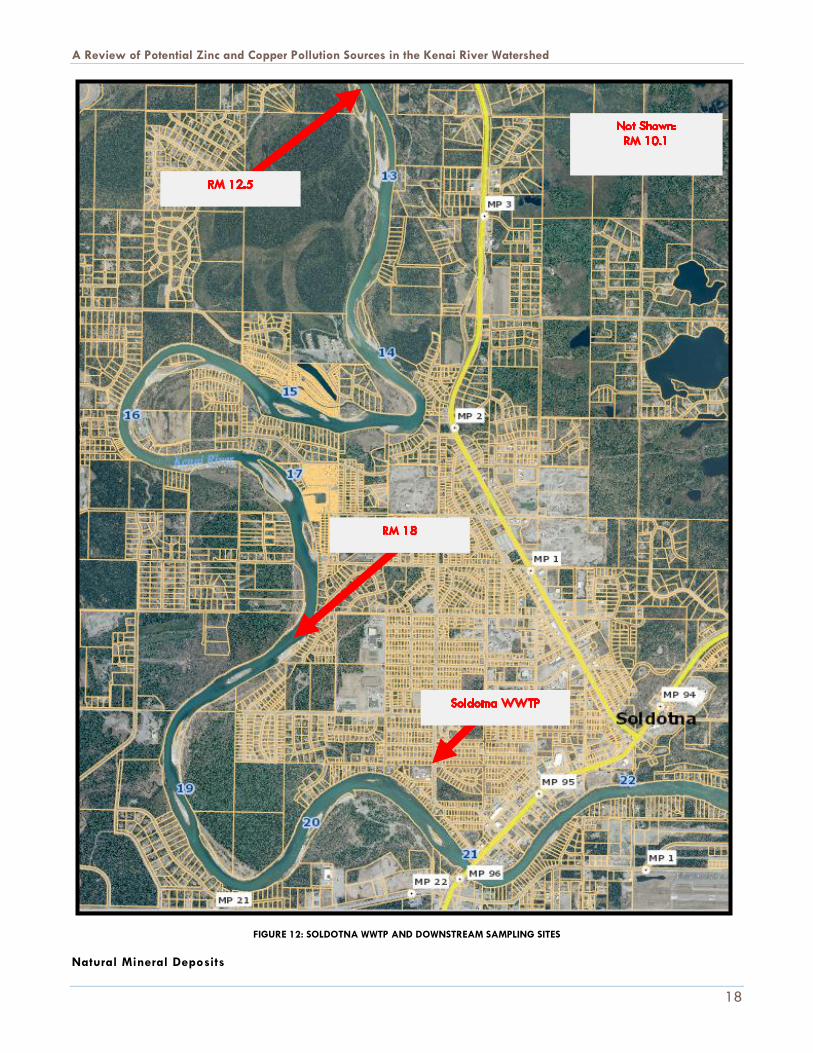
2016 notes that “the relatively low copper [3.1 µg/L, monthly average] and zinc effluent limits [40.1 µg/L] would be difficult to treat within the WWTP (high capital cost for enhanced clarification and filtration equipment, long-term operational costs for chemical addition, and overall operational complexity of metals removal)” (City of Soldotna, 2016). The report also noted substantial corrosion of exposed copper pipes in several areas of the facility. While discussions with the DEC regarding a new Alaska Pollutant Discharge Elimination System permit are ongoing, it is important to note that the Soldotna WWTP is a significant source of copper, and potentially zinc, in the Kenai River. RM 18, RM 12.5, and RM 10.1, the downstream sampling sites closest to the Soldotna WWTP effluent site (Figure 12), demonstrated three of the top five percent differences in spring (Table 2) and summer (Table 3) copper concentrations from 2010 through 2014.
TABLE 2: TOP FIVE PERCENT DIFFERENCES BETWEEN 2010 – 2014 AND PRE-2010 SPRING COPPER CONCENTRATIONS
Label (Figure 3) Location Percent Difference
1 Mile 50.0 109.07%
2 Mile 18.0 104.65%
3 Mile 10.1 97.97%
4 Mile 12.5 86.93%
5 Mile 40.0 61.35%
TABLE 3: TOP FIVE PERCENT DIFFERENCES BETWEEN 2010 – 2014 AND PRE-2010 SUMMER COPPER CONCENTRATIONS
Label (Figure 4) Location Percent Difference
1 Mile 1.5 -86.97%
2 Mile 12.5 57.36%
3 Mile 31.0 57.08%
4 Mile 18.0 50.07%
5 Mile 10.1 33.39%
A Review of Potential Zinc and Copper Pollution Sources in the Kenai River Watershed
18
Natural Mineral Deposits
FIGURE 12: SOLDOTNA WWTP AND DOWNSTREAM SAMPLING SITES
A Review of Potential Zinc and Copper Pollution Sources in the Kenai River Watershed
19
Much of the information regarding natural mineral deposits has been summarized in the section of the same name for zinc sources. While copper occurs naturally in the Kenai River watershed, it is not thought to be a major contributor to the elevations seen from 2010 through 2014. It is interesting to note that, similar to zinc sampling results, RM 50 and the Killey River demonstrated a significant increase in spring copper concentrations during this time period. However, RM 50 showed minimal differences in 2010 through 2014 summer copper concentrations compared with those recorded prior to 2010. Killey River sampling results actually indicated a decrease in copper concentrations during the 2010 – 2014 period. Because these sites are located in an undeveloped portion of the watershed, these results do indicate some natural variation or environmental influence on copper concentrations. However, concentrations at this site are still lower on average than sites in more developed areas of the watershed. Further, as will be discussed in the final report for this project, some site data demonstrating decreases in metals concentration may be skewed as a result of exceptionally high values recorded in early sampling years. Other Potential Sources Several other potential sources of copper were mentioned to a lesser degree in the literature reviewed. While these options are worthy of consideration and discussion, they may not be priorities for further investigation with regards to this issue. FOREST FIRES Note: Sourced from same literature as zinc forest fire discussion.
Forest fires were mentioned by multiple literature sources as potential contributors of copper to nearby waterbodies through
air deposition. This possibility raises some interesting questions about the Funny River Fire, a large wildfire that burned nearly 200,000 acres near Soldotna over the course of two months in 2014. While it can be assumed that this fire did have some effect on water quality, without direct sampling it is difficult to quantify. However, it is worth noting that several of the highest copper concentrations for lower Kenai River sampling sites did occur in the summer of 2014. A plan could be produced similar to that of the Southern California Coastal Water Research Project (Stein & Brown, 2009) for monitoring water quality changes in response to wildfires in the Kenai River watershed. AIR EMISSIONS One literature source noted that air emissions from combustion engines could be a potential source of copper in water. However, given the extreme complexity of quantifying and tracking air emissions, and their potential to have a relatively minor contribution to copper levels in this area, KWF does not recommend allotting time and resources to this possibility. DECKING/PILINGS According to the EPA, chromated copper aresenate (CCA) has been used to treat timber and prevent rotting since the 1940s (US Environmental Protection Agency, 2016). This treatment was used on a widespread basis for outdoor residential settings from the 1970s until the early 2000s. The use of CCA was restricted in 2003 and its use on a large scale has been discontinued. It is certainly possible that this chemical has contributed, and continues to contribute, copper to the Kenai River watershed. However, based on its limited use in modern residential construction, it is probably not a major factor in the increases seen from 2010 through 2014.
CONCLUSION The discussions of potential zinc and copper sources in this report allow for the organization of further investigations as they relate to the Kenai River watershed. While the current data do not provide an accurate picture of the degree to which each of these sources affect water quality, KWF recommends that the following potential sources and factors are prioritized and assessed in future studies and/or water quality sampling:
Zinc 1. Tire wear and traffic intensification 2. Galvanized metals including roofing, fences, culverts, drain pipes, construction materials, etc. 3. Fertilizer, pesticides, and fungicides 4. Natural and environmental variables including flow rates, air and water temperature, water hardness, dissolved
oxygen, and other water quality parameters related to the development of site-specific zinc standards 5. General urbanization, anthropogenic development, prevalence of impervious surfaces, deforestation, etc.
Copper 1. Copper brake pads and traffic intensification 2. Municipal wastewater discharges 3. Fertilizers, pesticides, herbicides, and fungicides 4. Boat Hull Coatings and Anti-Fouling Paints 5. Natural and environmental variables including flow rates, air and water temperature, water hardness dissolved
oxygen, and other water quality parameters related to the development of site-specific copper standards 6. General urbanization, anthropogenic development, prevalence of impervious surfaces, deforestation, etc.
A Review of Potential Zinc and Copper Pollution Sources in the Kenai River Watershed
20
There are numerous studies assessing the impact of these potential sources, which could be drawn on to develop a similar plan for the Kenai River watershed. While it may be a resource consuming endeavor to attempt to quantify each source’s relative effect on zinc and copper concentrations, a better understanding would likely be gained by taking more frequent samples at strategic sites, and from urban runoff sources nearby. In addition, it would be helpful to develop area specific standards for these metals (through the EPA’s Biotic Ligand Model), such that the impact of current concentrations on water quality, the environment, and specific species can be assessed. The final report for this project will summarize the Kenai River baseline water quality data previously discussed, reiterate the potential sources of zinc and copper in the Kenai River watershed, and make recommendations for further study regarding these two items.
REFERENCES
Cited in Text Alaska, Department of Labor and Workforce Analysis, Research and Analysis. (n.d.). 2016 Population Estimates by Borough,
Census Area, and Economic Region. Retrieved from http://live.laborstats.alaska.gov/pop/ Alaska Anti-Fouling Paint Applicator Manual. (2016). Alaska Department of Environmental Conservation.
Alaska DOT&PF. (n.d.). Central Region Annual Traffic Volume Report 2011-2013 (Alaska, Department of Transportation and Public Facilities, Highway Data Section).
United States, Census Bureau. (n.d.). American FactFinder. Retrieved from
https://factfinder.census.gov/faces/nav/jsf/pages/community_facts.xhtml?src=bkmk United States, Census Bureau. (n.d.). American FactFinder. Retrieved from
https://factfinder.census.gov/faces/nav/jsf/pages/community_facts.xhtml?src=bkmk# Bowen, L., Werner, I., & Johnson, M. L. (2006). Physiological and Behavioral Effects of Zinc and Temperature on Coho Salmon
(Oncorhynchus kisutch). Hydrobiologia,559(1), 161-168. doi:10.1007/s10750-005-1095-3 Copper Development Association, Inc. (n.d.). Copper in Brake Pads. Retrieved from
https://www.copper.org/environment/impact/copper-brake.html Copper Development Association, Inc. (n.d.). 8. Roofing Systems. Retrieved from
https://www.copper.org/applications/architecture/arch_dhb/arch-details/roofing/ Copper Program (Tech. No. 26518). (2002). CA: City of Palo Alto. Councell, T. B., Duckenfield, K. U., Landa, E. R., & Callender, E. (2004). Environmental Science & Technology (15th ed., Vol. 38)
(United States, Department of the Interior, U.S. Geological Survey). Reston, VA: American Chemical Society. Eisler, R. (1993). Zinc hazards to fish, wildlife, and invertebrates: a synoptic review. Washington, D.C.: U.S. Dept. of the Interior,
Fish and Wildlife Service. Glass, R. L., Brabets, T. P., Frenzel, S. A., Whitman, M. S., & Ourso, R. T. (1999). Water-quality assessment of the Cook Inlet
Basin, Alaska: Environmental Setting. Anchorage, AK: U.S. Dept. of the Interior, U.S. Geological Survey. Golding, S. (2008). Suggested practices to reduce zinc concentrations in industrial stormwater discharges. Olympia, WA:
Washington State Dept. of Ecology, Water Quality Program. Hecht, S. A., Baldwin, D. H., Membane, C. A., Hawkes, T., Gross, S. J., & Scholz, N. L. (2007). An overview of sensory effects on
juvenile salmonids exposed to dissolved copper: applying a benchmark concentration approach to evaluate sublethal neurobehavioral toxicity. U.S. Dept. of Commerce, National Oceanic and Atmospheric Administration, National Marine Fisheries Service.
Madanhire, I., & Mbohwa, C. (2016). Mitigating the environmental impact of petroleum lubricants. National Pesticide Information Center. (n.d.). Zinc Sulfate. Retrieved from http://npic.orst.edu/ingred/znso4.html National Pesticide Information Center. (n.d.). Copper Sulfate. Retrieved from http://npic.orst.edu/factsheets/cuso4gen.html
A Review of Potential Zinc and Copper Pollution Sources in the Kenai River Watershed
21
Plumlee, G., Montour, M., Taylor, C. D., Wallace, A. R., & Klein, D. P. (n.d.). Preliminary Compilation of Descriptive
Geoenvironmental Mineral Deposit Models, Chapter 14: Polymetallic Vein and Replacement Deposits (United States Geological Survey).
United States, Census Bureau. (n.d.). Population, Census, April 1, 2010. Retrieved from
https://www.census.gov/quickfacts/table/PST045215/0273070 Reger, R., PhD. (2016, October 27). Discussion of Zinc and Copper Sources in Kenai River Watershed [Personal interview]. Stein, E. D., & Brown, J. (2009). Effects of Post-fire Runoff on Surface Water Quality: Development of a Southern California
Regional Monitoring Program with Management Questions and Implementation Recommendations (Tech. No. 598). TDC Environmental, LLC. (2015). Zinc Sources in California Urban Runoff (Tech.). California Stormwater Quality Association. TDC Environmental , LLC. (2004). Copper Sources in Urban Runoff and Shoreline Activities (Rep.). Clean Estuary Partnership. US Environmental Protection Agency. (2016, November 22). Chromated Arsenicals (CCA). Retrieved from
https://www.epa.gov/ingredients-used-pesticide-products/chromated-arsenicals-cca
Wastewater Facilities Master Plan, 2015 Update. (2016). AK: City of Soldotna.
Literature Review Sources Not Directly Cited in Text Copper, Chromium, Nickel and Zinc in Minnesota's Ground Water. (1999). St. Paul, Minnesota: Minnesota Pollution Control
Agency, Environmental Outcomes Division. Davis, A. P., Shokouhian, M., & Ni, S. (2001). Loading estimates of lead, copper, cadmium, and zinc in urban runoff from specific
sources. Chemosphere,44(5), 997-1009. doi:10.1016/s0045-6535(00)00561-0 U.S. Environmental Protection Agency, Office of Water. (2016, July). Fact Sheet: Draft Estuarine/Marine Copper Aquatic Life
Ambient Water Quality Criteria. Retrieved from https://www.epa.gov/sites/production/files/2016-08/documents/copper-estuarine-marine-draft-factsheet.pdf
Gale, N. L., Adams, C. D., Wixson, B. G., Loftin, K. A., & Huang, Y. (2004). Lead, zinc, copper, and cadmium in fish and
sediments from the Big River and Flat River Creek of Missouri’s Old Lead Belt (Vol. 26, Tech.). Environmental Geochemistry and Health.
Glass, R. L., Brabets, T. P., Frenzel, S. A., Whitman, M. S., & Ourso, R. T. (2004). Water quality in the Cook Inlet Basin, Alaska,
1998-2001. Reston, VA: U.S. Dept. of the Interior, U.S. Geological Survey. Golding, S. (2006). A survey of zinc concentrations in industrial stormwater runoff. Olympia, WA: Washington State Dept. of
Ecology. Hillenbrand, T., Toussaint, D., Bohm, E., Fuchs, S., Scherer, U., Rudolphi, A., & Hoffmann, M. (2005). Discharges of copper, zinc,
and lead to water and soil - analysis of the emission pathways and possible emission reduction measures (Tech. No. 202 242 20/02). Germany: Federal Ministry of the Environment, Nature Conservation and Nuclear Safety.
International Zinc Association. (n.d.). Zinc in the Environment. Retrieved from http://www.zinc.org/environment/
Nason, J. A., Bloomquist, D. J., & Sprick, M. S. (2012). Factors Influencing Dissolved Copper Concentrations in Oregon Highway Stormwater Runoff. Journal of Environmental Engineering,138(7). http://dx.doi.org/10.1061/(ASCE)EE.1943-7870.0000537#sthash.xeb1o5YU.dpuf
Newport Bay Toxics TMDL, Part E—Metals (Cadmium, Copper, Lead and Zinc). (2002). Orange County, California: Santa Ana
Regional Water Quality Control Board. Nirel, P. M., & Pasquini, F. (2010). Differentiation of copper pollution origin: agricultural and urban sources (Tech.). Geneva,
Switzerland: Department of Water Ecology. Pelletier, G. J. (1994). Cadmium, copper, mercury, lead, and zinc in the Spokane River: comparisons with water quality standards
and recommendations for total maximum daily loads. Olympia, WA: Washington State Dept. of Ecology, Environmental
A Review of Potential Zinc and Copper Pollution Sources in the Kenai River Watershed
22
Investigations and Laboratory Services Program, Watershed Assessments Section. USGS. (2016, December 02). Contaminants Found in Groundwater. Retrieved from https://water.usgs.gov/edu/groundwater-
contaminants.html Wildfire Effects on Source-Water Quality—Lessons from Fourmile Canyon Fire, Colorado, and Implications for Drinking-Water
Treatment. (2012). United States Department of the Interior, United States Geological Survey.