Embed Size (px)
Citation preview

�������� ����� ��
A review of the applications of the JK size-dependent breakage model part 3:Comminution equipment modelling
Fengnian Shi
PII: S0301-7516(16)30207-1DOI: doi: 10.1016/j.minpro.2016.09.011Reference: MINPRO 2961
To appear in: International Journal of Mineral Processing
Received date: 3 June 2016Revised date: 22 September 2016Accepted date: 29 September 2016
Please cite this article as: Shi, Fengnian, A review of the applications of the JK size-dependent breakage model part 3: Comminution equipment modelling, International Jour-nal of Mineral Processing (2016), doi: 10.1016/j.minpro.2016.09.011
This is a PDF file of an unedited manuscript that has been accepted for publication.As a service to our customers we are providing this early version of the manuscript.The manuscript will undergo copyediting, typesetting, and review of the resulting proofbefore it is published in its final form. Please note that during the production processerrors may be discovered which could affect the content, and all legal disclaimers thatapply to the journal pertain.
ACC
EPTE
D M
ANU
SCR
IPT
ACCEPTED MANUSCRIPT
A review of the applications of the JK size-dependent breakage model Part 3: Comminution equipment modelling
Fengnian Shi
The University of Queensland, Sustainable Minerals Institute, Julius Kruttschnitt Mineral Research Centre, 40 Isles Road, Indooroopilly, Brisbane, Qld 4068, Australia
Email address: [email protected]; Telephone: +617 3365 5913; Fax: +617 3365 5999
ABSTRACT
It has been 10 years since the JK size-dependent breakage model was developed (Shi and
Kojovic, 2007). This series of papers present 20 applications of the model for the mineral and
coal industries. Part 3 of this series reviews its application to modelling comminution
equipment. It is demonstrated that the JK size-dependent breakage model not only can be
used for modelling particle breakage, but also can be employed as a basic structure for
modelling comminution equipment. This is different to the traditional equipment modelling
approaches, in which the population balance models are dominant. In this energy-size
reduction modelling approach, the JK size-dependent breakage model provides a key
mathematical template to rationally link the size reduction as the equipment model output with
ore breakage property and specific energy as the two model inputs. Five case studies are
reviewed, which includes modelling of a hammer mill for coke feed preparation, a vertical
spindle mill for coal pulverised fuel grinding, a ball mill for batch grinding and continuous
operation, HPGR simulations based on piston press testing data, and high voltage pulse
disintegration of ores. A common feature of these models is that they all incorporate the
measured material breakage characteristic parameters and machine operational conditions
that are represented by the size-specific energy relation. The energy-size reduction modelling
approach permits the simulations of the effects of changes in ore/coal and machine operating
conditions on comminution product size distribution.
Keywords: Breakage characterisation; Size effect; Modelling; Energy efficiency.

ACC
EPTE
D M
ANU
SCR
IPT
ACCEPTED MANUSCRIPT 2
1. Introduction
The population balance model has been widely used as a basic structure in modelling of
grinding mills for the mineral and coal industries (Kelsall and Reid, 1965; Herbst and Mika,
1970; Austin, 1971-1972; Herbst and Fuerstenau, 1973, 1980; Whiten, 1974; Austin et al.,
1984). The population balance model is based on a rate-size balance around a mill with two
sets of breakage functions: a specific rate of breakage function and a breakage distribution
function. Since the model parameters are simultaneously fitted to the mill feed and product
data, the fitted (or back-calculated) parameters are interrelated, and it is difficult to decouple
the machine-dependent and material-dependent effects. This limits the ability to do
simulations of mill response to the variation in mill feed properties. Other researchers have
criticised the fact that the traditional population balance model has no intrinsic capabilities to
allow for simulating the process under conditions that are different from those that were used
to fit its parameters (Carvalho and Tavares, 2013).
The swing hammer mill model published by Callcott (1960) is an early version of the
population balance model presented in a vector form. The model incorporates three vectors:
the selection vector, S, the breakage vector, B, and classification vector, C. Values of each
element in the three vectors were manually adjusted for the model to represent the product
size distribution. Thus for a product with 9 size fractions (i.e. 9 constraints for model fitting),
the model offers 27 (3 vectors x 9 elements) adjustable parameters. Since the model
parameters are less defined, it is difficult to establish a genuine relationship between these
vectors and the machine operating conditions to predict hammer mill performance from the
machine settings and the given feed.
The JKMRC (Julius Kruttschnitt Mineral Research Centre) ball mill model is based on a perfect
mixing assumption (Whiten, 1974). This is a mill content based model, usually expressed as a
ACC
EPTE
D M
ANU
SCR
IPT
ACCEPTED MANUSCRIPT 3
rate-size balance of mill contents under a steady-state. Morrell et al. (1993) demonstrated that
the JKMRC model can lead exactly to the population balance model. One of the distinguishing
features of the JKMRC models compared to the traditional population balance model is that
the ore-specific appearance functions are physically measured, allowing the fitted model
parameters to better reflect the operational conditions, thus decoupling the machine-
dependent and material-dependent effects.
In the aforementioned models, the rate-size balance is merely based on the size distributions
of mill feed and product, regardless of mill geometry and operational conditions. Although
physical significance was assigned to some of the fitted model parameters by various
researchers, the model itself is presented by a mathematical balance, and the grinding mill is
treated as a “black box”. It is argued that a model for comminution should be based on an
energy-size reduction relationship, rather than merely on the rate-size balance. Any variations
in mill (or equipment) geometry and operational conditions can be reflected in the energy input
and the efficiency to deliver the energy for size reduction. Therefore a model taking into
account both energy input and size reduction output would be more rational than those that
only take account of the size reduction output without the energy input.
The energy-size reduction relationship has been used by many researchers and engineers to
describe particle breakage, such as the three comminution laws by von Rittinger, Kick and
Bond (Hukki, 1962), the various relationships presented by Rumpf (1973), Weichert (1988),
King and Bourgeois (1993), Tavares and King (1998), Morrell (2004), Vogel and
Peukert (2003), the JK breakage model (Napier-Munn et al., 1996), and the JK size-dependent
breakage model (Shi and Kojovic, 2007). Traditionally, all these relationships were used to
model a particle breakage event (either breakage probability or size reduction). Since in any
comminution equipment, size reduction is resulted from the applied energy, it is believed that
the energy-size reduction approach not only can be used for modelling particle breakage, but
also can be applied for modelling comminution equipment. The author and his colleagues

ACC
EPTE
D M
ANU
SCR
IPT
ACCEPTED MANUSCRIPT 4
have endeavoured to use this energy-size reduction approach to model comminution
equipment in the past. In such a modelling exercise, the JK size-dependent breakage model
provides a useful tool. In fact, it serves as the core equation in some of the equipment models
developed at the JKMRC, since this model describes size reduction output as a function of two
identified input variables – ore specific breakage property and machine related specific energy.
Part 3 of this review presents five case studies to demonstrate how the energy-size reduction
approach, together with the JK size-dependent breakage model, is implemented in modelling
comminution equipment and processes.
2. Hammer mill modelling
Swing hammer mills have been used for a long time in the Australian coal industry to prepare
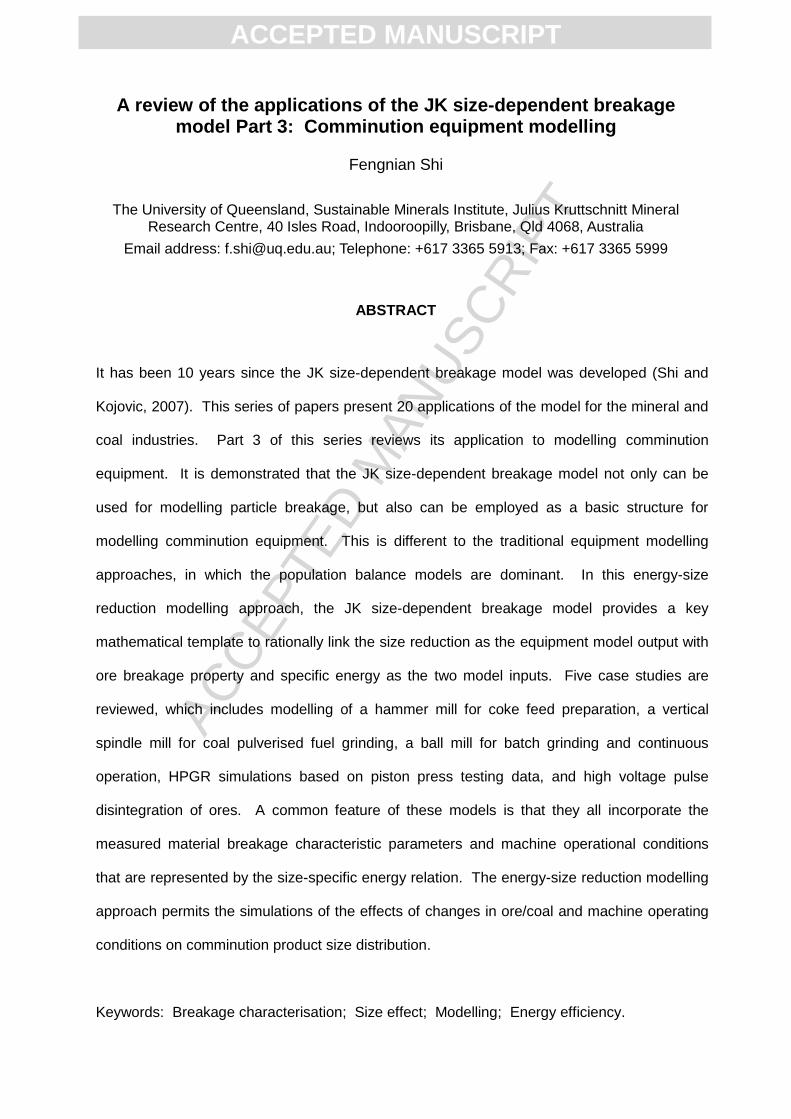
coke oven feed. When feed particles drop into the path of the hammer tip circle (Fig. 1), some
particles are severely shattered by the high-speed hammers. These products may be further
broken again by the high velocity impact of particles on the breaker plates and breaker bar.
The broken particles pass through the gap between the breaker bar and the hammer tip circle
and land on an under-screen. Three typical orientations of screen apertures that can be
selected include longitudinal, lateral and diagonal (relative to the particle flow direction).
Aperture size of the under-screen can also be selected. Particles smaller than the screen
aperture may be discharged through the under-screen and become the hammer mill product.
Oversize materials will be carried over by the swing hammers into the breakage zone, and
hence be subjected to further breakage. This size reduction process repeats until the particles
are discharged through the under-screen. At steady-state there will be a charge of coal
particles in the mill, drawing power in their movement and breakage.
ACC
EPTE
D M
ANU
SCR
IPT
ACCEPTED MANUSCRIPT 5
Fig. 1. Schematic diagram of the pilot-scale BJD swing hammer mill (Shi et al., 2003)
An energy-based swing hammer mill model was developed by Shi et al. (2003). This model
consists of a crusher model with a dual classification function and a mechanistic power model
to determine the dynamic internal recirculating load. This was perhaps the first trial by the
author and colleagues using the energy-size reduction approach to model comminution
equipment. The so-called energy-based model is distinguished in two aspects: i) a power
model was developed to calculate the dynamic recirculating load; ii) the hammer mill product
size distribution is calculated from a relationship between the applied specific comminution
energy and the breakage distributions established from a single particle breakage test.
From the detailed experimental data using a pilot scale hammer mill, it was observed that the
amount of fines in the product is positively correlated with mill power input, indicating that the
use of under-screen causes recirculation, which offers more opportunity for particles to be
broken finer by repetitive impacts, and the mill thus consumes more power. Callcott (1960)
showed the motion of coal particles inside the BJD hammer mill using high-speed cine camera
studies. Based on the assumption that the majority of mill power is consumed to rotate the
fluidised coal inside the mill chamber, the hammer mill was modelled as a fan consuming
power when moving a gas (Shi, 2002).
Feed
Product
Rotor
Hammers
Hammer pivotBreaker plate
Breaker bar
Under-screen
ACC
EPTE
D M
ANU
SCR
IPT
ACCEPTED MANUSCRIPT 6
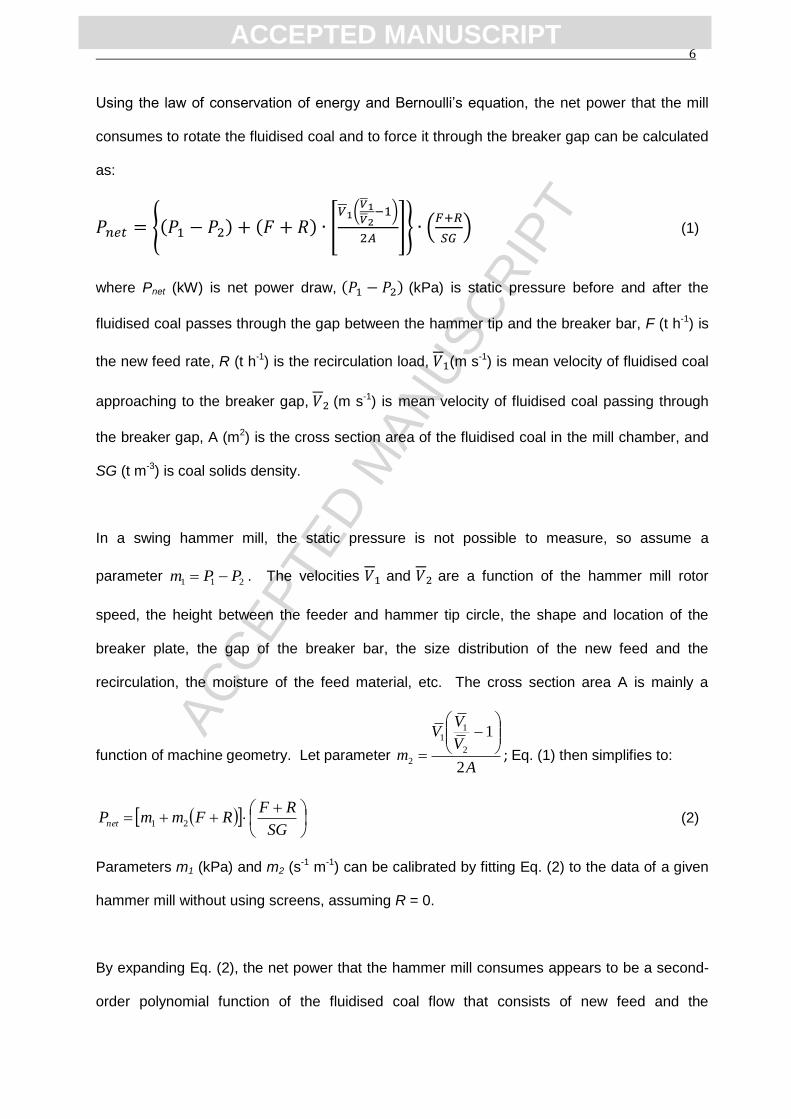
Using the law of conservation of energy and Bernoulli’s equation, the net power that the mill
consumes to rotate the fluidised coal and to force it through the breaker gap can be calculated
as:
𝑃𝑛𝑒𝑡 = {(𝑃1 − 𝑃2) + (𝐹 + 𝑅) ∙ [𝑉1(
𝑉1𝑉2
−1)
2𝐴]} ∙ (
𝐹+𝑅
𝑆𝐺) (1)
where Pnet (kW) is net power draw, (𝑃1 − 𝑃2) (kPa) is static pressure before and after the
fluidised coal passes through the gap between the hammer tip and the breaker bar, F (t h-1) is
the new feed rate, R (t h-1) is the recirculation load, 𝑉1(m s-1) is mean velocity of fluidised coal
approaching to the breaker gap, 𝑉2 (m s-1) is mean velocity of fluidised coal passing through
the breaker gap, A (m2) is the cross section area of the fluidised coal in the mill chamber, and
SG (t m-3) is coal solids density.
In a swing hammer mill, the static pressure is not possible to measure, so assume a
parameter 211 PPm . The velocities 𝑉1 and 𝑉2 are a function of the hammer mill rotor
speed, the height between the feeder and hammer tip circle, the shape and location of the
breaker plate, the gap of the breaker bar, the size distribution of the new feed and the
recirculation, the moisture of the feed material, etc. The cross section area A is mainly a
function of machine geometry. Let parameter A
V
VV
m2
12
11
2
; Eq. (1) then simplifies to:
SG
RFRFmmPnet 21 (2)
Parameters m1 (kPa) and m2 (s-1 m-1) can be calibrated by fitting Eq. (2) to the data of a given
hammer mill without using screens, assuming R = 0.
By expanding Eq. (2), the net power that the hammer mill consumes appears to be a second-
order polynomial function of the fluidised coal flow that consists of new feed and the

ACC
EPTE
D M
ANU
SCR
IPT
ACCEPTED MANUSCRIPT 7
recirculating load. Eq. (2) can then be solved for the recirculating load, R, eliminating the
negative sign in front of the square root:
2
1
2
22
2
2121
2
422
m
SGPFmFmmFmmFmmR
net (3)
As long as the two model parameters, m1 and m2, are calibrated for a particular hammer mill,
then given the new feed rate, the net power draw and the solids density, the recirculating load
can be calculated by Eq. (3).
A model with a dual-classification function was proposed based on the operating mechanisms
of the swing hammer mill. Fig. 2 shows symbolically the parts of this hammer mill model and
the internal flows between them. The model describes the process in such a way that a
particle entering the milling chamber can be selected for breakage, or drop through the
breaker gap onto the under-screen. The broken particles then have a similar chance of being
broken further or dropping through the gap onto the under-screen. Particles reporting to the
under-screen are subject to another classification: some particles are discharged from the
under-screen as hammer mill product, and some are recirculated and subject to further
breakage. Thus, the hammer mill is simplified to a single breakage zone and dual probabilities
of entering or re-entering this breakage zone. The vectors f, x, and p give the flow rates in
each size fraction. The matrix B gives the relative distribution of each size fraction after being
broken and the diagonal matrices C1 and C2 give the proportions of particles entering the
breakage region. Details of the two classification functions are given in Shi et al. (2003).

ACC
EPTE
D M
ANU
SCR
IPT
ACCEPTED MANUSCRIPT 8
Fig. 2. Symbolic representation of the hammer mill model (Shi et al., 2003)
The breakage matrix B is material-specific, and should be measured, rather than being fitted
as in the procedures of the population balance model or Callcott’s hammer mill model
(Callcott, 1960). Breakage characterisation on individual lithotype coals and the blended feed
was conducted using the Drop Weight Tester (DWT), which is an impact tester with controlled
kinetic energy. Three size fractions were tested for each type of coal: 8–16 mm, 22.4–31.5
mm and 45–50 mm. Energy imparted to the coal was varied from 0.01 kWh t-1 to
0.074 kWh t-1. The product size distribution can be represented by a family of curves using
marker points on the size distribution defined as the percentage passing at a fraction of the
parent particle size (tn) (Narayanan and Whiten, 1988). To make use of this description of coal
particle breakage, marker points t2, t4, t25, t50 and t75 are stored in matrix form against specific
comminution energy, Ecs, for different initial coal particle size fractions. Table 1 shows typical
breakage distribution matrices for the industrial hammer mill blend feed tested with the DWT.
f C 1 C 2
B
x
C 1 x
BC 1 x
y
C 2 ( 1-C 1 ) x
p
Feed Product
ACC
EPTE
D M
ANU
SCR
IPT
ACCEPTED MANUSCRIPT 9
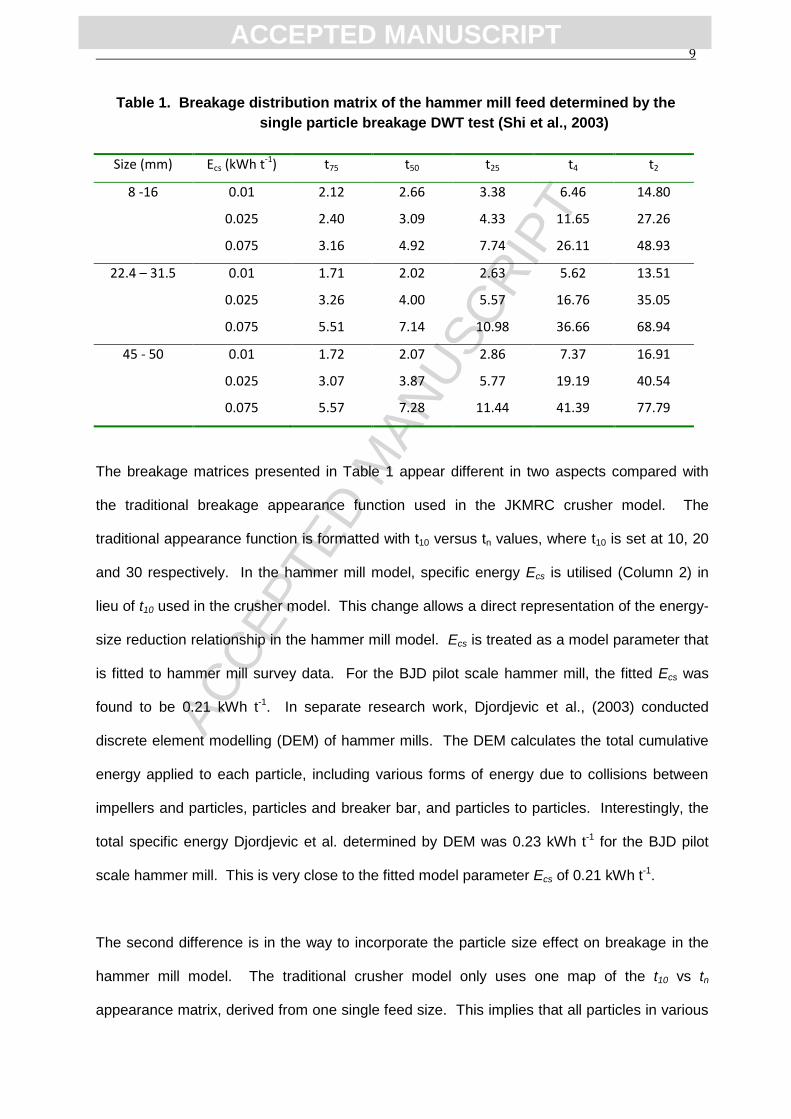
Table 1. Breakage distribution matrix of the hammer mill feed determined by the
single particle breakage DWT test (Shi et al., 2003)
Size (mm) Ecs (kWh t-1) t75 t50 t25 t4 t2
8 -16 0.01 2.12 2.66 3.38 6.46 14.80
0.025 2.40 3.09 4.33 11.65 27.26
0.075 3.16 4.92 7.74 26.11 48.93
22.4 – 31.5 0.01 1.71 2.02 2.63 5.62 13.51
0.025 3.26 4.00 5.57 16.76 35.05
0.075 5.51 7.14 10.98 36.66 68.94
45 - 50 0.01 1.72 2.07 2.86 7.37 16.91
0.025 3.07 3.87 5.77 19.19 40.54
0.075 5.57 7.28 11.44 41.39 77.79
The breakage matrices presented in Table 1 appear different in two aspects compared with
the traditional breakage appearance function used in the JKMRC crusher model. The
traditional appearance function is formatted with t10 versus tn values, where t10 is set at 10, 20
and 30 respectively. In the hammer mill model, specific energy Ecs is utilised (Column 2) in
lieu of t10 used in the crusher model. This change allows a direct representation of the energy-
size reduction relationship in the hammer mill model. Ecs is treated as a model parameter that
is fitted to hammer mill survey data. For the BJD pilot scale hammer mill, the fitted Ecs was
found to be 0.21 kWh t-1. In separate research work, Djordjevic et al., (2003) conducted
discrete element modelling (DEM) of hammer mills. The DEM calculates the total cumulative
energy applied to each particle, including various forms of energy due to collisions between
impellers and particles, particles and breaker bar, and particles to particles. Interestingly, the
total specific energy Djordjevic et al. determined by DEM was 0.23 kWh t-1 for the BJD pilot
scale hammer mill. This is very close to the fitted model parameter Ecs of 0.21 kWh t-1.
The second difference is in the way to incorporate the particle size effect on breakage in the
hammer mill model. The traditional crusher model only uses one map of the t10 vs tn
appearance matrix, derived from one single feed size. This implies that all particles in various
ACC
EPTE
D M
ANU
SCR
IPT
ACCEPTED MANUSCRIPT 10
size fractions will be broken in the same way, and will appear in the product with the same size
distribution. There is evidence of a particle size effect on breakage to oppose this assumption,
showing that large particles will be broken with greater tn values (Banini, 2000). The data
presented in Table 1 acquired from single particle DWT impact tests also support this trend
(except the 8-16 mm at 0.01 kWh t-1). However, at the time when the hammer mill model was
developed, the JK size-dependent breakage model had not been developed yet, and there
was no validated breakage model available to represent the particle size effect on breakage.
Therefore, three maps of Ecs-tn appearance matrices for three feed particle size fractions were
incorporated in the hammer mill model, as shown in Table 1. For a given feed size fraction
and a specific energy level, a cubic spline function is used to interpolate or extrapolate the
corresponding tn values from the three maps of breakage appearance matrices.
There is a limitation using three maps of breakage appearance matrices to represent particle
size effect. Since the breakage appearance matrix for each size is determined separately
without a logical link of each other to represent its true effect, experimental errors may obscure
the trend of the true size effect. After the JK size-dependent breakage model was developed,
the DWT data used to generate the breakage distribution matrices presented in Table 1 were
used to fit the JK size-dependent breakage model, with three model parameters determined:
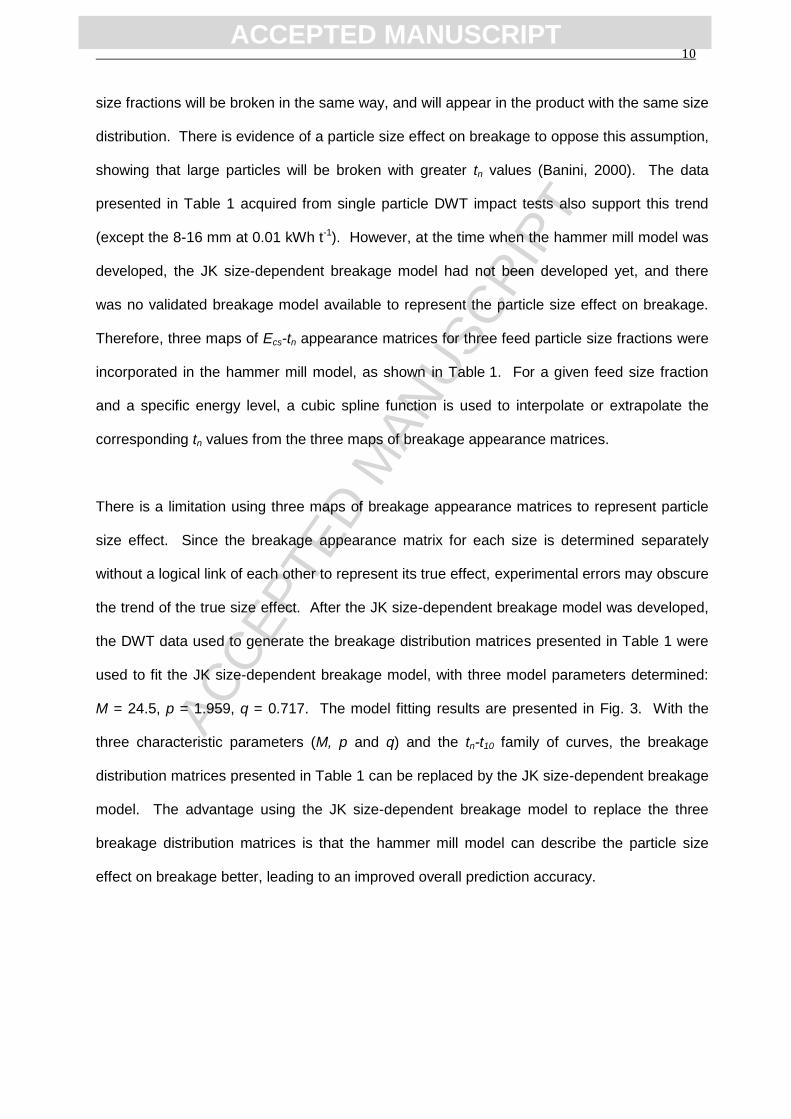
M = 24.5, p = 1.959, q = 0.717. The model fitting results are presented in Fig. 3. With the
three characteristic parameters (M, p and q) and the tn-t10 family of curves, the breakage
distribution matrices presented in Table 1 can be replaced by the JK size-dependent breakage
model. The advantage using the JK size-dependent breakage model to replace the three
breakage distribution matrices is that the hammer mill model can describe the particle size
effect on breakage better, leading to an improved overall prediction accuracy.
ACC
EPTE
D M
ANU
SCR
IPT
ACCEPTED MANUSCRIPT 11
Fig. 3. The JK size-dependent breakage model fitted to the hammer mill breakage data
3. Vertical spindle mill model
The Vertical Spindle Mill (VSM) is one of the most widely used grinding devices for pulverised
fuel (PF) generation in coal-fired power stations worldwide. According to published figures,
coal pulverisation is an energy intensive process. Approximately 0.5 to 1% of gross power
generation from coal fired power stations is consumed in coal grinding.
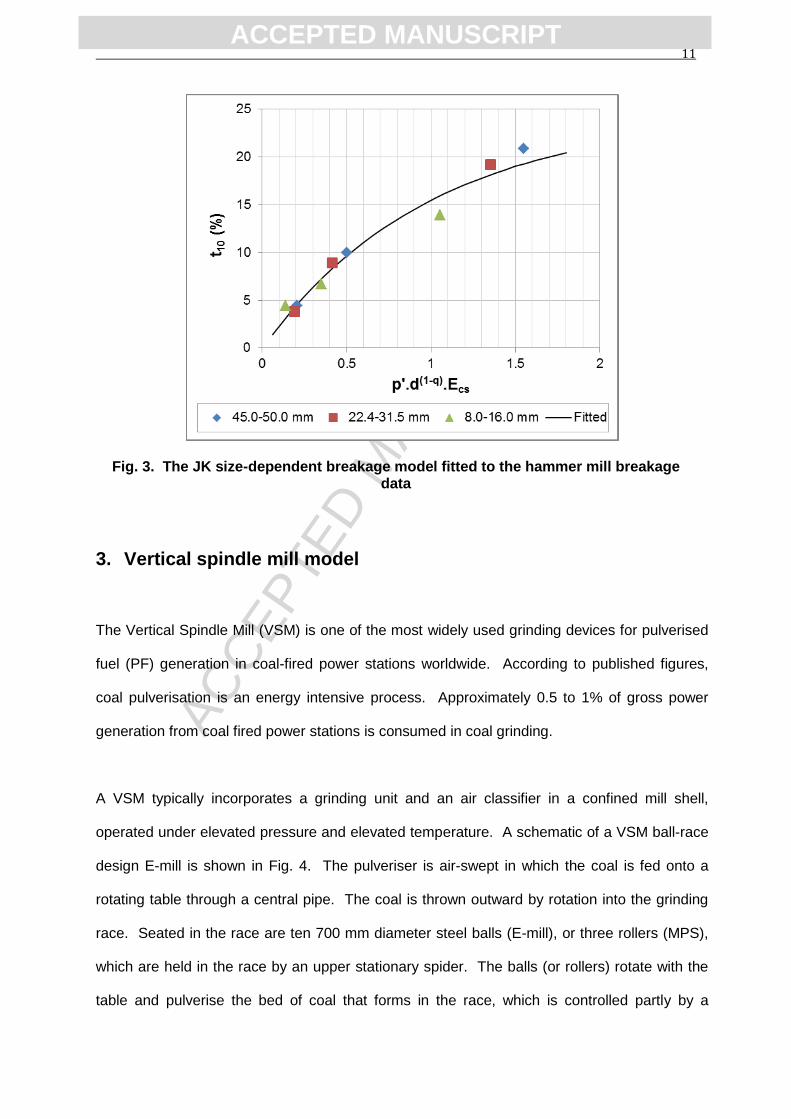
A VSM typically incorporates a grinding unit and an air classifier in a confined mill shell,
operated under elevated pressure and elevated temperature. A schematic of a VSM ball-race
design E-mill is shown in Fig. 4. The pulveriser is air-swept in which the coal is fed onto a
rotating table through a central pipe. The coal is thrown outward by rotation into the grinding
race. Seated in the race are ten 700 mm diameter steel balls (E-mill), or three rollers (MPS),
which are held in the race by an upper stationary spider. The balls (or rollers) rotate with the
table and pulverise the bed of coal that forms in the race, which is controlled partly by a
ACC
EPTE
D M
ANU
SCR
IPT
ACCEPTED MANUSCRIPT 12
hydraulic loading system that adjusts the grinding pressure exerted by the spider through the
balls (or roller) on the table. Primary air enters the pulveriser through jets arranged
circumferentially outside the grinding table, and where the ground coal is pushed radially
outward into the primary air flow, which entrains the coal.
Both E-mill and MPS pulverisers have two stages of classification in which oversize coal
returns onto the grinding table. The first stage of classification is a simple elutriator which
effects a crude classification of large coal fragments which have a terminal velocity exceeding
the upward air velocity at this point in the device. The second stage of classification is a true
gas cyclone which operates with inlet vanes and relies on the swirl to further classify the coal.
The final PF exiting the gas cyclone will meet the required product size (70% < 75 µm).
Fig. 4. Schematic of the grinding, elutriation and main classification zones in an
E-mill (Shi et al, 2015a)
A VSM model was developed at the JKMRC (Shi et al., 2015a; Kojovic et al., 2015). The
JKMRC VSM model takes a different approach to that in the literature using the population
balance modelling method (Austin et al., 1982; Sato et al., 1996; Shoji et al., 1998). In these
modelling processes, the mill was treated as a “black box”, with its parameters being
determined from the mill external sampling data (feed and ground product). The fitted
Feed
PF Output
PF Output
Elutriation zone
Hot air Hot airGrinding zone
Air classifier
Elutriator coarse return
Air classifier underflow
Adjustable blades
Elutriation zone
Hydraulic loading
ACC
EPTE
D M
ANU
SCR
IPT
ACCEPTED MANUSCRIPT 13
breakage rate parameters were then scaled up to run simulations for a full scale VSM
operation in steady state. As this modelling approach did not directly incorporate mill
geometry data and operational conditions in describing the mechanisms of particle breakage,
transportation and classification, its success in optimisation of the pulveriser operation may be
limited.
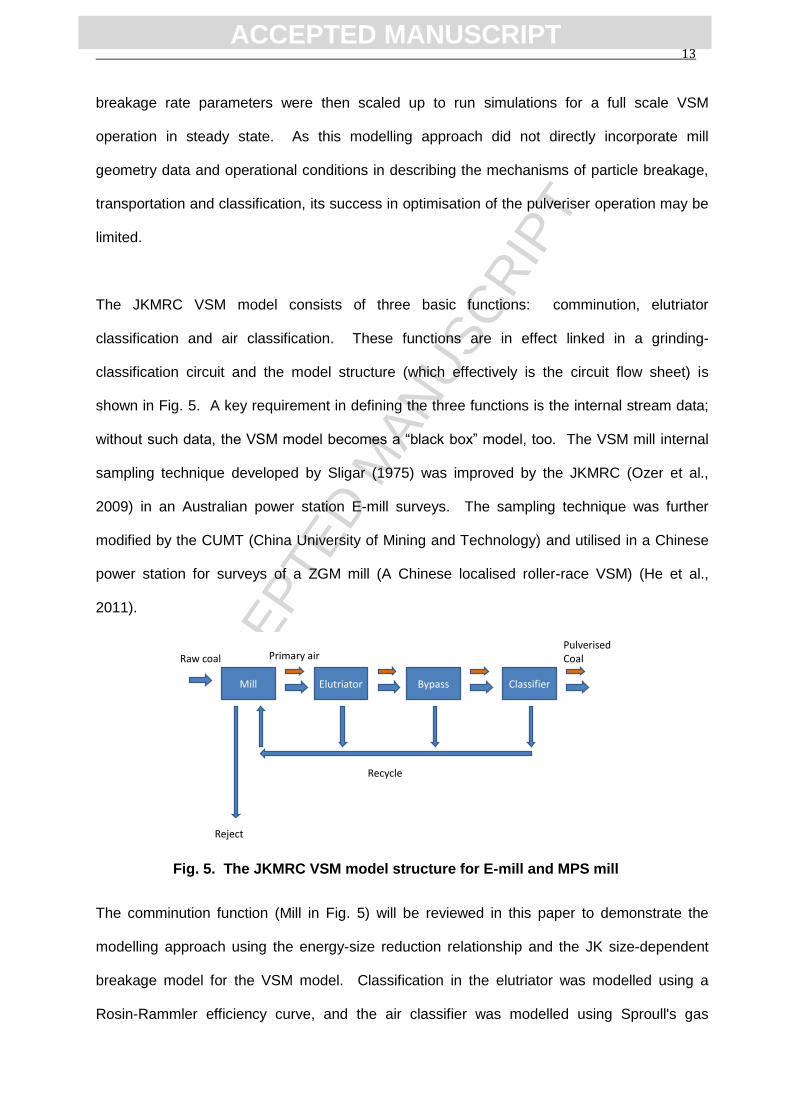
The JKMRC VSM model consists of three basic functions: comminution, elutriator
classification and air classification. These functions are in effect linked in a grinding-
classification circuit and the model structure (which effectively is the circuit flow sheet) is
shown in Fig. 5. A key requirement in defining the three functions is the internal stream data;
without such data, the VSM model becomes a “black box” model, too. The VSM mill internal
sampling technique developed by Sligar (1975) was improved by the JKMRC (Ozer et al.,
2009) in an Australian power station E-mill surveys. The sampling technique was further
modified by the CUMT (China University of Mining and Technology) and utilised in a Chinese
power station for surveys of a ZGM mill (A Chinese localised roller-race VSM) (He et al.,
2011).
Mill Elutriator Bypass Classifier
Raw coalPulverisedCoal
Reject
Recycle
Primary air
Fig. 5. The JKMRC VSM model structure for E-mill and MPS mill
The comminution function (Mill in Fig. 5) will be reviewed in this paper to demonstrate the
modelling approach using the energy-size reduction relationship and the JK size-dependent
breakage model for the VSM model. Classification in the elutriator was modelled using a
Rosin-Rammler efficiency curve, and the air classifier was modelled using Sproull's gas

ACC
EPTE
D M
ANU
SCR
IPT
ACCEPTED MANUSCRIPT 14
cyclone model (Sproull, 1970). Details of the two classification functions can be found in Shi
et al., (2015a) and Kojovic et al. (2015).
In order to use the energy-size reduction approach to model the VSM, three sub-models for
the comminution function were developed: mill power draw model, size specific energy
model, and particle breakage model.
The mill power draw, Pm (J s-1), is modelled from physical principles: Pm = torque x angular
velocity, where torque is calculated as
𝜏 = 𝐹 ∙ 𝜇 ∙ 𝑅 ∙ 𝑛𝑏 (4)
and angular velocity is calculated as
60
2 N
(5)
where (N.m) is the mill torque, F (N) is the force acting on each ball/roller, is the friction
coefficient, R (m) is the radius of rotation, nb is the number of balls (or rollers), (radian s-1)
is the angular velocity, and N (revolution min-1) is the grinding table (race) rotational speed.
Based on the survey data collected from the E-mill operated at the Australian power station,
a model for the frictional coefficient was developed. This model takes the following form:
31
2
1
C
net
GTFC - * Fine
C- exp (6)
where net is the predicted friction coefficient of 10 balls on the coal bed, GTF (t h-1) is
ACC
EPTE
D M
ANU
SCR
IPT
ACCEPTED MANUSCRIPT 15
grinding table total feed rate, Fine is % passing 75 m in the GTF. Both GTF and Fine are
estimated from the mass balanced mill internal sampling data. C1, C2 and C3 are parameters
fitted to six sets of power station survey data: C1 = 0.1337; C2 = 848.6 and
C3 = 0.4509. GTF/C2 is the race filling fraction. The total friction coefficient (total) reflects
the non-load friction (non-load) plus balls on coal bed friction (net). When GTF = 0, Eq. (6)
indicates net = 0, so that total = non-load.
The survey data collected from the E-mill in Australia and ZGM mill in China all indicated that
breakage varied with particle size. This is attributed both to grinding conditions (reflected by
the size-specific energy) and the inherent material properties. The VSM model was
therefore constructed with incorporation of two factors for particle size reduction.
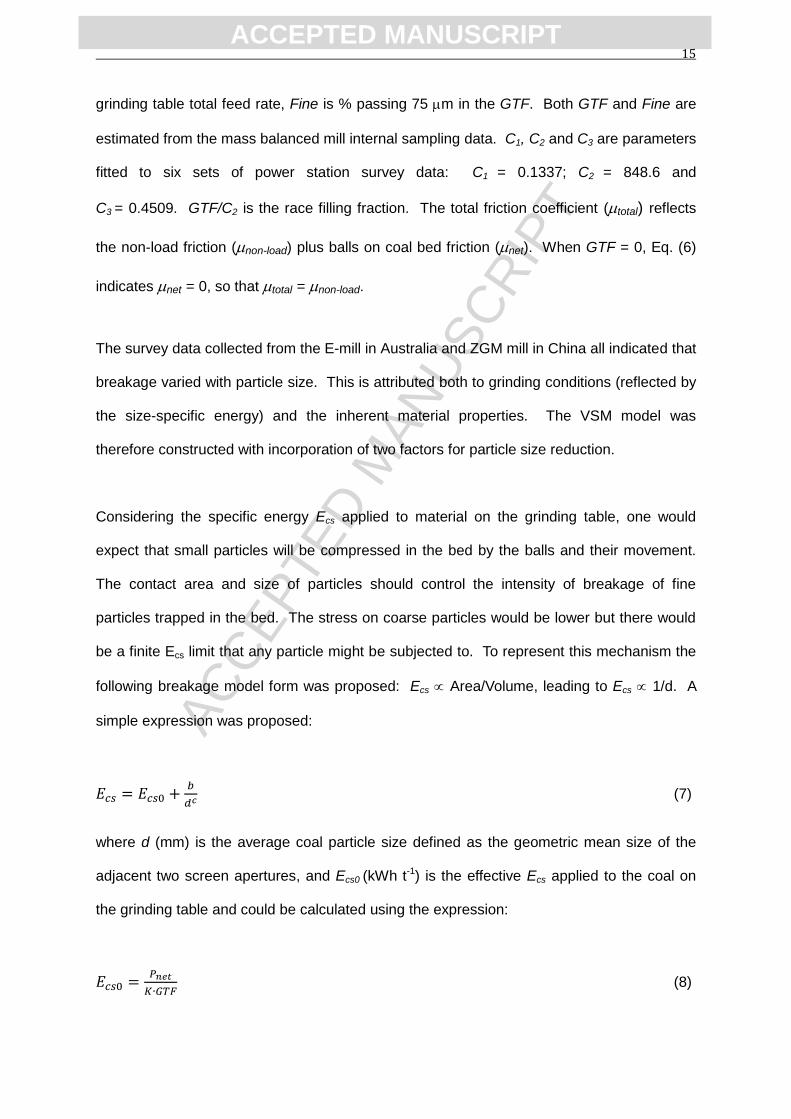
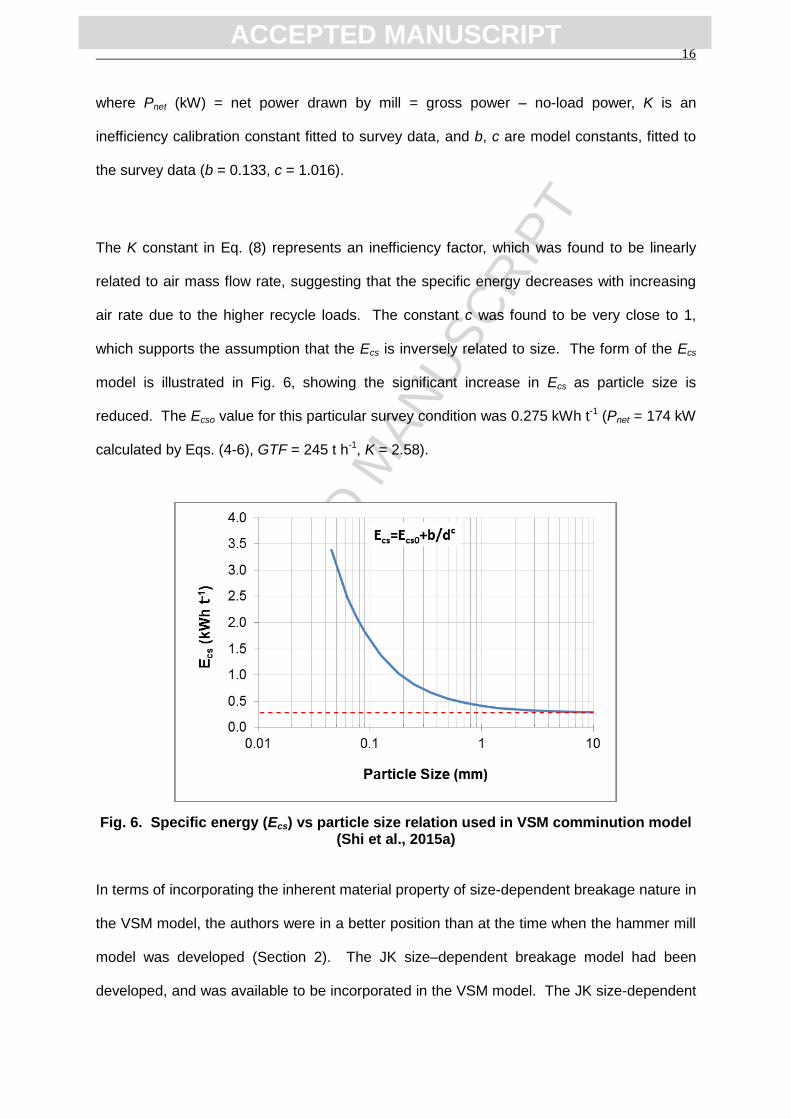
Considering the specific energy Ecs applied to material on the grinding table, one would
expect that small particles will be compressed in the bed by the balls and their movement.
The contact area and size of particles should control the intensity of breakage of fine
particles trapped in the bed. The stress on coarse particles would be lower but there would
be a finite Ecs limit that any particle might be subjected to. To represent this mechanism the
following breakage model form was proposed: Ecs Area/Volume, leading to Ecs 1/d. A
simple expression was proposed:
𝐸𝑐𝑠 = 𝐸𝑐𝑠0 +𝑏
𝑑𝑐 (7)
where d (mm) is the average coal particle size defined as the geometric mean size of the
adjacent two screen apertures, and Ecs0 (kWh t-1) is the effective Ecs applied to the coal on
the grinding table and could be calculated using the expression:
𝐸𝑐𝑠0 =𝑃𝑛𝑒𝑡
𝐾∙𝐺𝑇𝐹 (8)
ACC
EPTE
D M
ANU
SCR
IPT
ACCEPTED MANUSCRIPT 16
where Pnet (kW) = net power drawn by mill = gross power – no-load power, K is an
inefficiency calibration constant fitted to survey data, and b, c are model constants, fitted to
the survey data (b = 0.133, c = 1.016).
The K constant in Eq. (8) represents an inefficiency factor, which was found to be linearly
related to air mass flow rate, suggesting that the specific energy decreases with increasing
air rate due to the higher recycle loads. The constant c was found to be very close to 1,
which supports the assumption that the Ecs is inversely related to size. The form of the Ecs
model is illustrated in Fig. 6, showing the significant increase in Ecs as particle size is
reduced. The Ecso value for this particular survey condition was 0.275 kWh t-1 (Pnet = 174 kW
calculated by Eqs. (4-6), GTF = 245 t h-1, K = 2.58).
Fig. 6. Specific energy (Ecs) vs particle size relation used in VSM comminution model
(Shi et al., 2015a)
In terms of incorporating the inherent material property of size-dependent breakage nature in
the VSM model, the authors were in a better position than at the time when the hammer mill
model was developed (Section 2). The JK size–dependent breakage model had been
developed, and was available to be incorporated in the VSM model. The JK size-dependent
ACC
EPTE
D M
ANU
SCR
IPT
ACCEPTED MANUSCRIPT 17
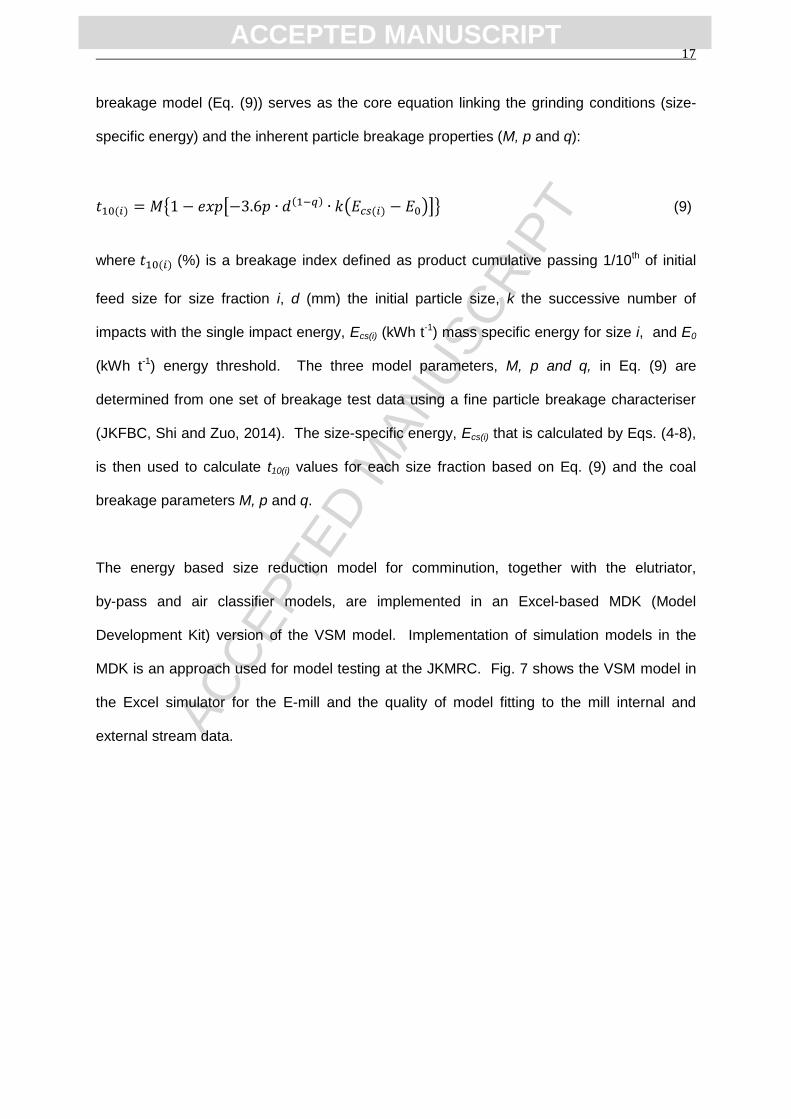
breakage model (Eq. (9)) serves as the core equation linking the grinding conditions (size-
specific energy) and the inherent particle breakage properties (M, p and q):
𝑡10(𝑖) = 𝑀{1 − 𝑒𝑥𝑝[−3.6𝑝 ∙ 𝑑(1−𝑞) ∙ 𝑘(𝐸𝑐𝑠(𝑖) − 𝐸0)]} (9)
where 𝑡10(𝑖) (%) is a breakage index defined as product cumulative passing 1/10th of initial
feed size for size fraction i, d (mm) the initial particle size, k the successive number of
impacts with the single impact energy, Ecs(i) (kWh t-1) mass specific energy for size i, and E0
(kWh t-1) energy threshold. The three model parameters, M, p and q, in Eq. (9) are
determined from one set of breakage test data using a fine particle breakage characteriser
(JKFBC, Shi and Zuo, 2014). The size-specific energy, Ecs(i) that is calculated by Eqs. (4-8),
is then used to calculate t10(i) values for each size fraction based on Eq. (9) and the coal
breakage parameters M, p and q.
The energy based size reduction model for comminution, together with the elutriator,
by-pass and air classifier models, are implemented in an Excel-based MDK (Model
Development Kit) version of the VSM model. Implementation of simulation models in the
MDK is an approach used for model testing at the JKMRC. Fig. 7 shows the VSM model in
the Excel simulator for the E-mill and the quality of model fitting to the mill internal and
external stream data.

ACC
EPTE
D M
ANU
SCR
IPT
ACCEPTED MANUSCRIPT 18
Fig. 7. Excel mill simulator interface for VSM E-mill, with four fitted model parameters
to produce the size distributions
4. Specific energy based ball mill model
The ball mill is widely used in the mineral, cement and coal industries for primary,
secondary, tertiary and regrinding duties. As discussed in the Introduction, the population
balance model is typically employed for ball mill modelling. The existing JKMRC perfect
mixing ball mill model, developed by Whiten (1974) and implemented in the comminution
software JKSimMet, is used extensively. The perfect mixing ball mill model is another form
of the population balance model (Morrell et al., 1993). A number of limitations associated
with this ball mill model have been identified, such as the use of a set of default breakage
appearance functions for all ores, and the lumped model parameter R/D* for breakage rate
and mass discharge rate.
In developing a specific energy based ball mill model, Shi and Xie (2015) first modelled the
energy-size reduction relationship in batch grinding, in which there is no mass transport or
discharge mechanism occurring, so as to decouple particle breakage from mass transport
E-mill Survey (normal operation conditions, coal E) VSM Model Inputs VSM Design Inputs
New feed: 29.1 t/h Force on each ball F 54.5 kN Mill diameter (m) Dmt 3.14 m
Primary air rate (Ma) 19.1 kg/s Grinding table radius R 1.27 m Classifier diameter (m) Dc 2.38 m
Air temparature (Ta) 302.0 C Number of balls n 10 # Class. U/F diameter Du 1.14 m
Air pressure (Pa) 107.6 kPa Grinding table rotational speed N 37.9 rpm Cylinder height Hc 0.8 m
Mill no load power - kw Po 106.4 kw Inlet height Hi 0.4 m
Solids Density (SG) 1.50 t/m3 Coal Breakage Parameter M 56.8 % Apex height Ha 1.46 m
Coal Breakage Parameter p 0.026 Inlet blade angle alpha 45 degrees
Coal Breakage App Function Coal Breakage Parameter q 0.098
t10 t75 t50 t25 t4 t2 Coal Breakage Parameter, Eo=C/(x/1000) C 0
10 1.808 2.526 4.447 26.057 53.402
20 3.389 4.865 8.849 48.352 84.356
30 4.940 7.215 13.365 66.756 98.488 VSM Modelled mass flow rates
Raw coal feed t/h 29.1
Grinding table feed t/h 244.2
E-mill Survey 2 raw sizing data (Cum. % Passing) PF feed t/h 29.1
Size, mm Coal Feed GrTabFeed Mill Rej. [R2] MB Feed Sep. Feed Sep. Rej. Pul. Fuel Elutriator reject t/h 71.9
90 100.0 100.0 100.0 100.0 100.0 100.0 100.0 Classifier reject t/h 143.2
63 99.1 99.9 100.0 99.99 99.99 100 100 Total recirculation rate t/h 215.1
45 95.1 99.5 100.0 99.99 99.99 100 100 Mill Power - kw 280.1006
31.5 86.9 98.6 100.0 99.99 99.99 100 100 Friction coeff 0.063231
22.4 77.2 97.5 99.8 99.99 99.99 100 100
16 67.9 96.5 98.6 99.79 99.99 100 100
11.2 59.1 95.1 95.6 98.99 99.99 100 100
8 50.0 92.8 88.1 98.52 99.98 99.99 100
5.6 42.2 90.9 75.5 98.03 99.89 99.9 100
4 35.9 89.2 60.7 96.08 98.99 99 100
2.8 30.3 84.4 44.2 93.08 98.1 97.9 100
2 25.7 79.2 31.3 89.77 96.81 95.5 100
1.4 20.4 74.3 19.5 82.92 93.4 91.89 100
1 16.1 68.9 12.3 78.47 89.77 87.62 100
0.71 12.7 61.7 7.8 73.05 85.23 81.31 100
0.5 9.6 54.7 4.9 64.45 78.46 73.98 100
0.355 7.5 45.7 3.4 57.36 70.85 64.45 99.99
0.25 5.8 36.0 2.3 47.16 59.6 51.7 99.99
0.18 4.4 25.2 1.6 37.18 47.15 34.92 99
0.125 3.3 15.5 1.2 24.18 34.43 20.72 93.86
0.09 2.5 8.4 0.7 17.42 23.27 11.32 82.65
0.075 2.1 5.3 0.6 13.34 19.15 7.77 73.35
0.063 1.8 3.8 0.4 10.86 15.19 5.53 64.44
0.045 1.4 1.9 0.3 7.45 10.68 2.44 50.16
0
20
40
60
80
100
0.01 0.1 1 10 100
Cu
m. %
pas
sin
g
Particle size (mm)
VSM Modelled coal size distributions
New feed
Table feed
GR.TB.FD
Sep feed
EL.PROD
Meas TabProdGR.TB.PR
PF MEAS
PF
New feed
RUN VSM MODEL

ACC
EPTE
D M
ANU
SCR
IPT
ACCEPTED MANUSCRIPT 19
and discharge classification. This energy-size reduction relationship is then applied in full
scale continuous ball mill operation, by adding discharge function into the batch grinding
model (Shi and Xie, 2016).
Following the present author’s modelling concept, a specific energy-size reduction function
(Eq. (9)) was utilised for the batch grinding ball mill model. This model first calculates the
particle breakage index, t10, according to size-specific energy, and then the product size
distribution using the t10-tn relationships and the mass-size balance approach. Symbolically,
the mass-size balance, or mass conservation, can be expressed by Eq. (10).
1
1
iji mfi
j
ip (10)
where fi and pi are the mass fractions of size i in the mill feed and product, and 𝑚𝑖𝑗 is a
lower-triangular breakage matrix, indicating the mass fraction of appearance of size i
material produced by fracture of size j material. For each size i, the summation sign sums
up the total material from sizes larger than i to size i-1. Fig. 8 exhibits an example of the
lower-triangular breakage matrix 𝑚𝑖𝑗 determined by the method described below.
Fig. 8. Example of the lower-triangular breakage matrix (𝒎𝒊𝒋)
Size (mm) 2.800 2.360 2.000 1.700 1.180 0.850 0.600 0.425 0.300 0.212 0.150 0.125 0.106 0.090 0.075 0.063 0.053 0.045 0.038
3.350
2.800 0.3409
2.360 0.2085 0.3446
2.000 0.1289 0.2096 0.3480
1.700 0.0801 0.1288 0.2105 0.3514
1.180 0.0847 0.0797 0.1288 0.2115 0.3564
0.850 0.0296 0.0837 0.0793 0.1287 0.2128 0.3637
0.600 0.0213 0.0290 0.0827 0.0789 0.1286 0.2147 0.3706
0.425 0.0186 0.0208 0.0284 0.0818 0.0783 0.1284 0.2164 0.3778
0.300 0.0160 0.0182 0.0204 0.0278 0.0804 0.0774 0.1281 0.2181 0.3849
0.212 0.0135 0.0158 0.0179 0.0199 0.0269 0.0783 0.0765 0.1278 0.2197 0.3921
0.150 0.0115 0.0132 0.0155 0.0176 0.0193 0.0256 0.0764 0.0756 0.1273 0.2212 0.3992
0.125 0.0054 0.0112 0.0129 0.0152 0.0172 0.0184 0.0245 0.0744 0.0746 0.1268 0.2226 0.4049
0.106 0.0045 0.0053 0.0110 0.0127 0.0149 0.0165 0.0176 0.0233 0.0724 0.0736 0.1263 0.2237 0.4084
0.090 0.0042 0.0045 0.0052 0.0108 0.0124 0.0143 0.0159 0.0168 0.0222 0.0705 0.0726 0.1258 0.2243 0.4118
0.075 0.0043 0.0041 0.0044 0.0051 0.0105 0.0119 0.0138 0.0154 0.0160 0.0211 0.0685 0.0717 0.1254 0.2249 0.4153
0.063 0.0038 0.0042 0.0040 0.0043 0.0049 0.0101 0.0114 0.0134 0.0148 0.0152 0.0201 0.0670 0.0712 0.1251 0.2254 0.4189
0.053 0.0034 0.0037 0.0041 0.0040 0.0042 0.0047 0.0097 0.0110 0.0129 0.0142 0.0145 0.0193 0.0661 0.0707 0.1248 0.2260 0.4224
0.045 0.0029 0.0033 0.0036 0.0041 0.0038 0.0040 0.0045 0.0093 0.0106 0.0124 0.0137 0.0139 0.0188 0.0652 0.0701 0.1244 0.2265 0.4258
0.038 0.0164 0.0028 0.0033 0.0035 0.0039 0.0037 0.0038 0.0044 0.0089 0.0101 0.0120 0.0133 0.0136 0.0184 0.0642 0.0695 0.1240 0.2270 0.4291
0.000 0.0015 0.0175 0.0199 0.0227 0.0254 0.0281 0.0305 0.0329 0.0357 0.0427 0.0506 0.0605 0.0722 0.0841 0.1002 0.1612 0.2271 0.3472 0.5709
ACC
EPTE
D M
ANU
SCR
IPT
ACCEPTED MANUSCRIPT 20
It is emphasised that in this modelling approach, the breakage rate used in the population
balance model is excluded from the mass-size balance equation (Eq. (10)); instead, a
breakage matrix, 𝑚𝑖𝑗, is adopted in the mass-size balance calculation. The breakage matrix
𝑚𝑖𝑗 has three distinguishing features:
Ore-specific: The ore breakage characteristic parameters are independently measured
with the JKFBC from the ball mill feed sample (referring to Section 7 in Part 1 of the
review paper (Shi, 2016)), rather than using a default appearance function.
Size-dependent: Particle size effect on breakage is measured through the JKFBC tests
and described by the JK size-dependent breakage model parameters M, p and q (Eqn. 9).
Specific energy available for size reduction is also size-dependent.
Specific energy-based: The breakage matrix 𝑚𝑖𝑗 is calculated based on the estimated
specific energy, reflecting a breakage result from the combined effects of ore inherent
breakage properties and the effective specific energy input to cause this size reduction.
To determine the breakage matrix in Eq. (10), two major input factors are considered in the
model: the ore factor and the machine factor. This is similar to the VSM model reviewed in
Section 3. The size reduction model incorporates two separate functions: the breakage
function that describes the relationship between particle size reduction and input specific
energy; and the selection function that describes the probability of particles in a given size
fraction being selected for breakage.
The size-specific energy is used to determine particle size reduction in a ball mill. The size-
specific energy is calculated from mill power draw divided by mass flow rate to give a mean
specific energy. The mean specific energy is then used to calculate size-specific energy.
The mill power is estimated by the Morrell power model (Morrell, 1992), which has the
advantage of incorporating mill geometry and operational conditions in the ball mill model.
From the power draw, grinding time and the particle mass in a batch grinding test, the mean

ACC
EPTE
D M
ANU
SCR
IPT
ACCEPTED MANUSCRIPT 21
specific energy in batch grinding can be estimated. In a continuous mill, the mill power
dividing the fresh mill feed rate gives mean specific energy.
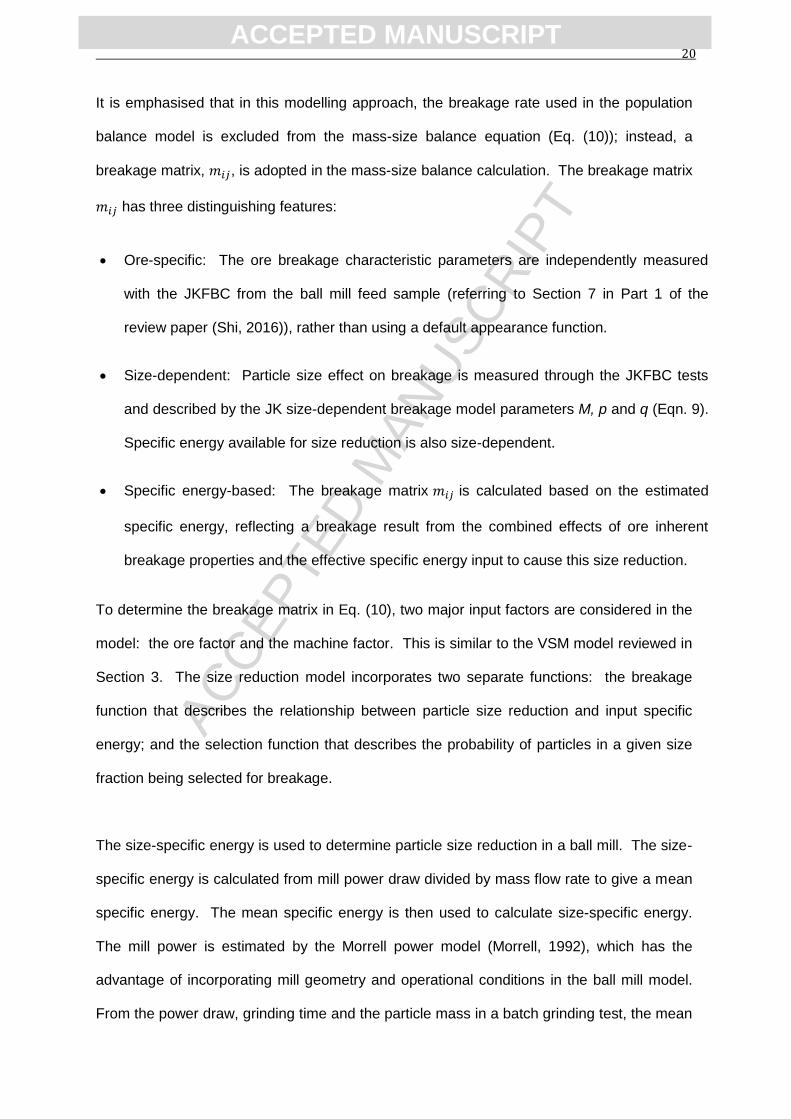
It is hypothesised that the mean specific energy Ecs is not applied to all particles evenly in a
ball mill. There is a selection function governing the size-specific energy level, some
particle sizes receiving more specific energy, and some other sizes receiving less. The
available specific energy for each particle size, Ecs(i), is determined by a selection function Si
(Eq. (11)):
csiics ESE )( (11)
The selection function values (dimensionless) are treated as model parameters. Three S-
values at three size spline knots were fitted. The cubic spline method was incorporated in
the model to calculate the full size selection function from the three fitted knot values. The
fitted selection functions for the three Bond ball milling cycles of Sample A are given in
Fig. 9. Sample A is a gold-copper ore collected from an Australian gold-copper
concentrator. The shape of the selection function indicates that the 0.6 to 0.8 mm particles
in the Bond ball mill have a higher tendency to be selected for breakage. The probability of
selection for breakage decreases for the particle sizes away from the peak size, particularly
for the fine end. The shape of a selection function curve in a ball mill is dominated by ball
charge size distribution and feed particle size distribution. For a given ball charge, a certain
particle size is more easily broken than the other sizes. Since the Bond ball charge was
identical in the seven cycles of grinding, the peak of the fitted selection function is similar.
Note from Eq. (11), the selection function is used to define size-specific energy efficiency,
which indicates that with the standard Bond ball mill charge, the mill has the optimal energy
efficiency to break particles around 0.6 to 0.8 mm.
ACC
EPTE
D M
ANU
SCR
IPT
ACCEPTED MANUSCRIPT 22
Fig.9. The fitted selection functions for three cycles of Bond ball mill test (Shi and Xie, 2015)
Once the specific energy-based size reduction model was proved to be able to work with
batch grinding ball mill data, it was extended from batch grinding to full scale ball milling in
continuous operation mode. A set of classification data collected by Man (2001) from the
internal sampling of an operational ball mill reveals that the shape of the classification
function in a ball mill is similar to the Whiten expression for corrected efficiency to overflow
(Napier Munn et al., 1996). Therefore the Whiten efficiency equation was adopted and
modified to describe the ball mill discharge function in the continuous ball mill model (Shi
and Xie, 2016).
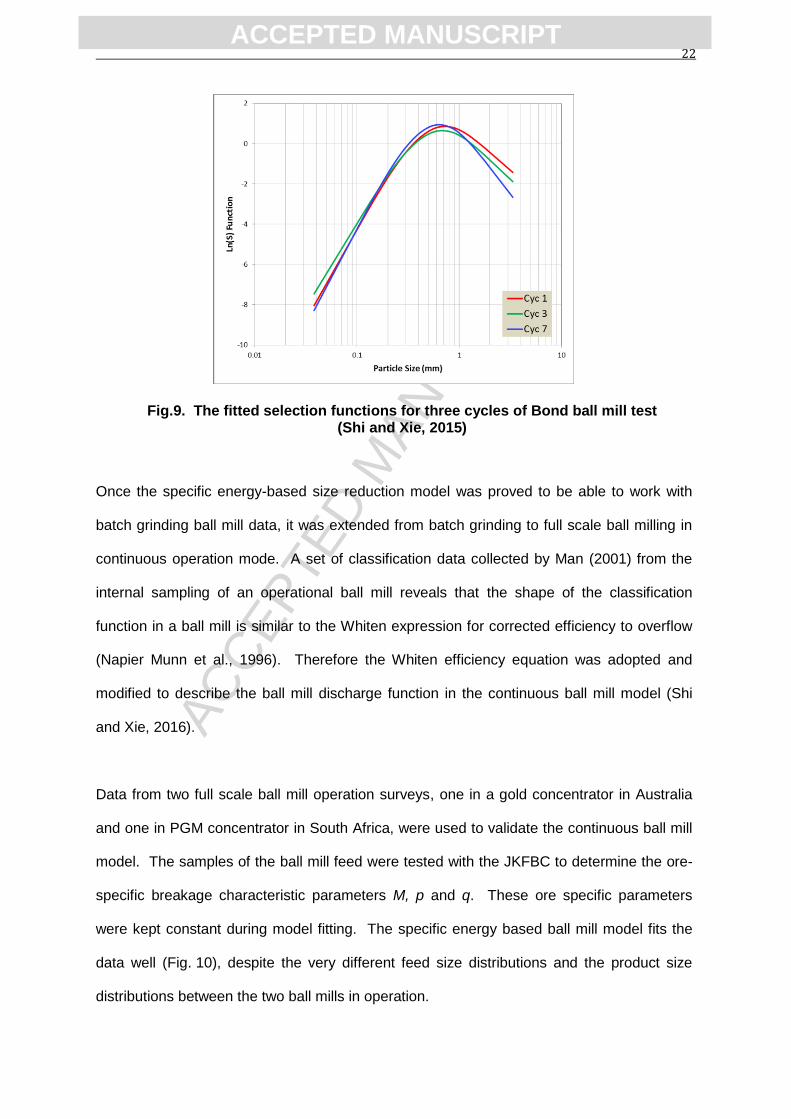
Data from two full scale ball mill operation surveys, one in a gold concentrator in Australia
and one in PGM concentrator in South Africa, were used to validate the continuous ball mill
model. The samples of the ball mill feed were tested with the JKFBC to determine the ore-
specific breakage characteristic parameters M, p and q. These ore specific parameters
were kept constant during model fitting. The specific energy based ball mill model fits the
data well (Fig. 10), despite the very different feed size distributions and the product size
distributions between the two ball mills in operation.
ACC
EPTE
D M
ANU
SCR
IPT
ACCEPTED MANUSCRIPT 23
Fig. 10. Ball mill product size distributions fitted by the specific energy based ball mill model in comparison with the survey data (BM1 for a gold concentrator and PL1 for
PGM concentrator) (Shi and Xie, 2016)
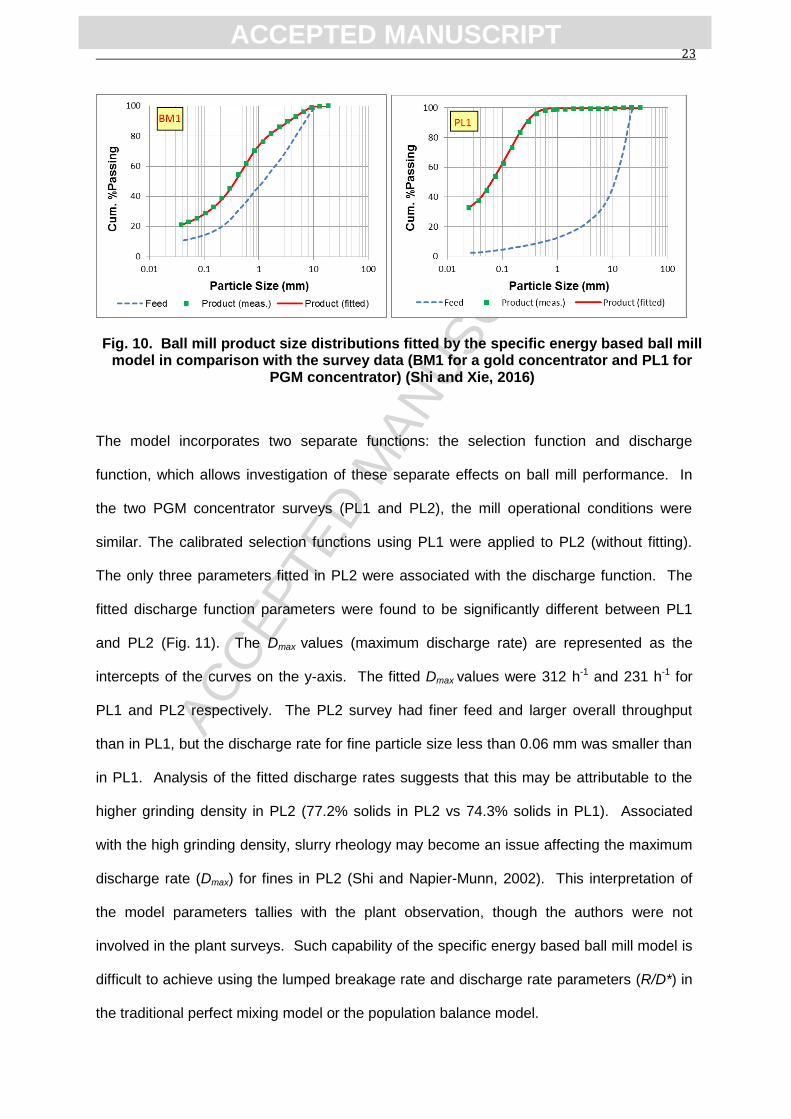
The model incorporates two separate functions: the selection function and discharge
function, which allows investigation of these separate effects on ball mill performance. In
the two PGM concentrator surveys (PL1 and PL2), the mill operational conditions were
similar. The calibrated selection functions using PL1 were applied to PL2 (without fitting).
The only three parameters fitted in PL2 were associated with the discharge function. The
fitted discharge function parameters were found to be significantly different between PL1
and PL2 (Fig. 11). The Dmax values (maximum discharge rate) are represented as the
intercepts of the curves on the y-axis. The fitted Dmax values were 312 h-1 and 231 h-1 for
PL1 and PL2 respectively. The PL2 survey had finer feed and larger overall throughput
than in PL1, but the discharge rate for fine particle size less than 0.06 mm was smaller than
in PL1. Analysis of the fitted discharge rates suggests that this may be attributable to the
higher grinding density in PL2 (77.2% solids in PL2 vs 74.3% solids in PL1). Associated
with the high grinding density, slurry rheology may become an issue affecting the maximum
discharge rate (Dmax) for fines in PL2 (Shi and Napier-Munn, 2002). This interpretation of
the model parameters tallies with the plant observation, though the authors were not
involved in the plant surveys. Such capability of the specific energy based ball mill model is
difficult to achieve using the lumped breakage rate and discharge rate parameters (R/D*) in
the traditional perfect mixing model or the population balance model.
ACC
EPTE
D M
ANU
SCR
IPT
ACCEPTED MANUSCRIPT 24
Fig. 11. The model fitted discharge functions, with the same selection functions being used in two surveys conducted at the PGM concentrator (Shi and Xie, 2016)
5. HPGR simulation model
In recent years, HPGR (High Pressure Grinding Rolls) has found wide application in the
mineral industry, attributed mainly to its energy efficiency. Since sizing the HPGR often
needs pilot scale HPGR tests, which requires large amount of ore samples and the
associated testing costs, there is an incentive to use small scale testing to predict the
energy requirement and the resultant product size distribution of the HPGR for a given ore.
Davaanyam (2015) and Davaanyam et al. (2015) of The University of British Columbia
present a simulation method to predict the energy requirement of the HPGR and the size
reduction result under compression. They used piston press testing on five narrow size
classes of particles at three energy levels. The data collected are used to fit an energy–
breakage model (Eq. (12)). The energy–breakage model was modified from the work of Shi
and Kojovic (2007) by adding an exponent n to particle size x. As commented in Part 1 of
ACC
EPTE
D M
ANU
SCR
IPT
ACCEPTED MANUSCRIPT 25
this review (Shi, 2016), this equation is coincidently the same equation as the JK size-
dependent breakage model (Eq. (5a) in Part 1 when E0 = 0 and q = 1-n, which leads to 1-q
equal to n) developed 10 years ago.
sp
n
mat ExfMt .10 exp1 (12)
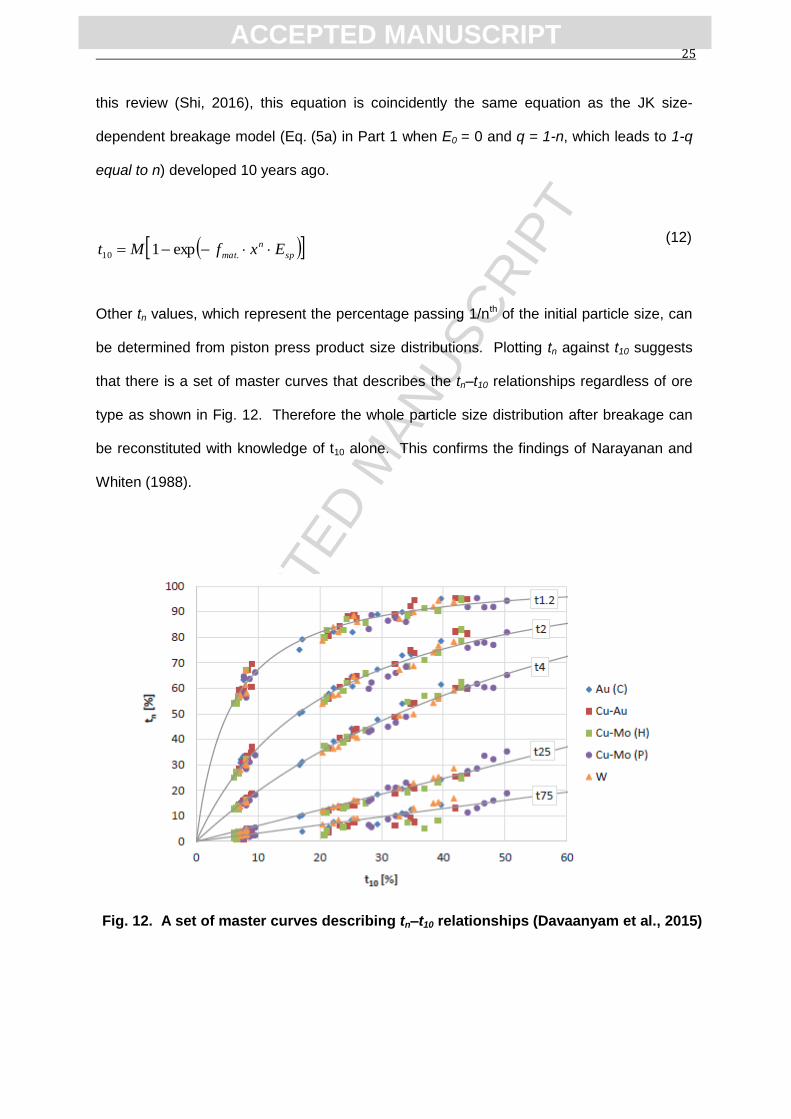
Other tn values, which represent the percentage passing 1/nth of the initial particle size, can
be determined from piston press product size distributions. Plotting tn against t10 suggests
that there is a set of master curves that describes the tn–t10 relationships regardless of ore
type as shown in Fig. 12. Therefore the whole particle size distribution after breakage can
be reconstituted with knowledge of t10 alone. This confirms the findings of Narayanan and
Whiten (1988).
Fig. 12. A set of master curves describing tn–t10 relationships (Davaanyam et al., 2015)

ACC
EPTE
D M
ANU
SCR
IPT
ACCEPTED MANUSCRIPT 26
Once the energy–breakage relationship is defined by the piston press testing data on a
given ore, and the set of master curves describing the t10 versus tn relationship is known, the
energy–size reduction performance of the HPGR can be simulated. In the simulation
process, it is assumed that there are two breakage zones. Particles above a critical size, xc,
are pre-crushed, and below the critical size they are ground in a compression bed. This
assumption is similar to Morrell et al. (1997a, b), with the exception that the coarser
particles in the feed of this model are assumed to break by compressed bed mechanisms
rather than by single particle impact breakage. Therefore Eq. (12) is used to calculate the
size reduction index t10 by pre-crushing with a split of specific energy described below.
The product from the pre-crushing stage is combined with the finer fraction (below xc) in the
feed and the combined product is subjected to size reduction in the grinding stage. This
arrangement in the simulation allows the coarse particles to break via both pre-crushing and
grinding stages, while the fine particles break only via the grinding stage. It was found that
the fines content in HPGR feed will affect the inter-particle breakage by bed compression.
Eq. (12) was therefore modified to take account the effect of fines content in feed (Eq. (13)),
which is used for the simulation of the breakage in the grinding stage.
sp
n
matfines ExfPcMt .10 exp1 (13)
where c is a fitted constant to multiply by the percentage of fines (below xc) in the feed,
Pfines.
In the simulation, it was assumed that the total energy is distributed between the pre-
crushing and the grinding stages. The energy to the pre-crushing stage is a function of the
fraction of coarser particles in the feed, and the specific energy in the pre-crushing stage
and the grinding stage is calculated using Eqs. (14) and (15). Note that there is a printing
error in the original publications (Davaanyam, 2015; Davaanyam et al., 2015) that the sum
ACC
EPTE
D M
ANU
SCR
IPT
ACCEPTED MANUSCRIPT 27
of the two stages of specific energy is not equal to the total specific energy. This error has
been corrected in Eq. (14).
spcoarsesplit
crush
spEfE (14)
coarsesplitsp
grind
spfEE 1 (15)
where coarsef is the coarse (above xc) particle fraction in the feed, and βsplit is a model
parameter.
The simulation models have three parameters that were fitted to the data of 36 HPGR tests
on five different ores: xc = 16 mm, βsplit = 0.157 and c = 1.08 (Davaanyam et al. (2015)).
The total specific energy, Esp, in Eqs. (13-15) is unknown. A two-step approach was taken
to estimate the specific energy used for HPGR: i) Estimate the required piston pressure by
an empirical regression equation (Eq. (16)) to deliver the same specific energy into the
sample as the HPGR; ii) Conduct piston press tests at the estimated pressures and
integrate the resulting force-displacement curves to provide a prediction of net specific
energy of HPGR.
PFF
FP
mmP
H
H
bspPiston wFP1
50
50
5098.24.441.132.863.243.5353.5 (16)
where PistonP (MPa) is the estimate of required piston pressure, spF (N mm-2) is specific
pressing force, w (%) is moisture content, ρb (g ml-1) is bulk density, F50 (mm) are 50% passing feed particle sizes for HPGR and piston press tests, and P
P
mm1 (%) is percentage
passing 1 mm in feed to piston press test.
ACC
EPTE
D M
ANU
SCR
IPT
ACCEPTED MANUSCRIPT 28
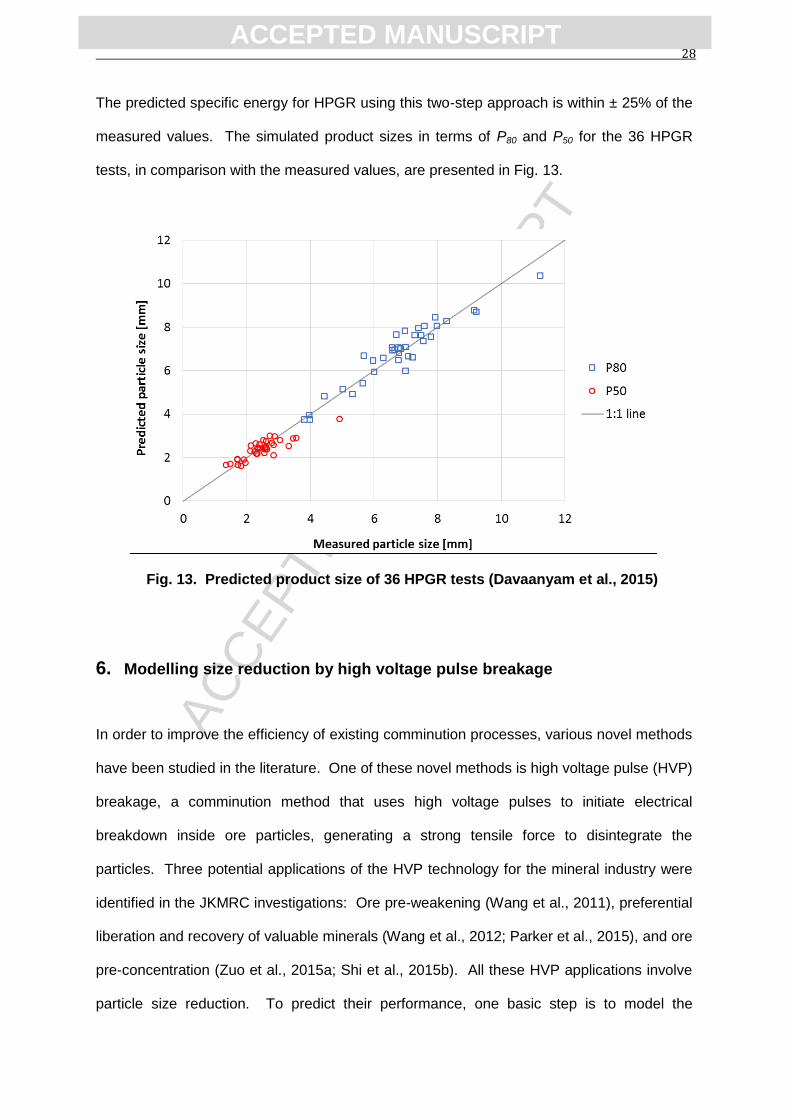
The predicted specific energy for HPGR using this two-step approach is within ± 25% of the
measured values. The simulated product sizes in terms of P80 and P50 for the 36 HPGR
tests, in comparison with the measured values, are presented in Fig. 13.
Fig. 13. Predicted product size of 36 HPGR tests (Davaanyam et al., 2015)
6. Modelling size reduction by high voltage pulse breakage
In order to improve the efficiency of existing comminution processes, various novel methods
have been studied in the literature. One of these novel methods is high voltage pulse (HVP)
breakage, a comminution method that uses high voltage pulses to initiate electrical
breakdown inside ore particles, generating a strong tensile force to disintegrate the
particles. Three potential applications of the HVP technology for the mineral industry were
identified in the JKMRC investigations: Ore pre-weakening (Wang et al., 2011), preferential
liberation and recovery of valuable minerals (Wang et al., 2012; Parker et al., 2015), and ore
pre-concentration (Zuo et al., 2015a; Shi et al., 2015b). All these HVP applications involve
particle size reduction. To predict their performance, one basic step is to model the
ACC
EPTE
D M
ANU
SCR
IPT
ACCEPTED MANUSCRIPT 29
relationships between size reduction and HVP energy input. The JK size-dependent
breakage model was again utilised (Zuo et al., 2015b). In the HVP application, it becomes
simpler than the aforementioned modelling of mechanical comminution equipment, as the
HVP specific energy is directly measured by the generator energy divided by ore sample
mass in both batch tests and pilot scale tests. This exercise was the first time that the
viability of the JK size-dependent breakage model applied in electrical disintegration in lieu
of the traditional mechanical breakage has been investigated.
There are two distinct breakage modes when a particle is subjected to a single pulse
discharge. If an electrical breakdown channel passes through the particle body and splits
the particle into several fragments, this is called body breakage. If the electrical breakdown
channel develops along the particle surface and generates a few chips (less than 90% of
the parent particle mass), while the main body of the particle is unbroken and remains at the
parent size fraction, this is called surface breakage. Two HVP breakage indices were used
to describe HVP breakage behaviour: body breakage probability (the D1-model) and body
breakage product fineness (the D2-model). The body breakage probability is defined as a
percentage of the mass of body breakage product divided by the mass of initial feed. The
breakage index, t10, is used as the second index to describe product fineness and size
distribution.
The two HVP breakage models take the same equation form (Eq. (17)).
0
16.3exp1 EEkdpMD cs
q
nnn
(17)
where Dn is the HVP breakage indices defined above. When n = 1, D1 (%) is body
breakage probability; when n = 2, D2 is t10. Ecs (kWh t-1) is HVP specific energy, calculated
by pulse generator energy divided by ore mass treated. The pulse generator energy is
determined by Eq. (18):

ACC
EPTE
D M
ANU
SCR
IPT
ACCEPTED MANUSCRIPT 30
25.0 UCEp (18)
where pE (J) is the pulse generator energy, C (F) is the capacitance and U (V) is the voltage
of the pulse from a generator. Note that the pulse generator energy is determined by the
HVP operational conditions – at a constant operational condition setting, the energy for
each pulse is a constant. However, the spark energy that is the energy delivered to the ore
sample is different from the pulse generator energy, which depends on the ore properties.
In evaluation of HVP energy efficiency, the pulse energy from a generator (Eq. (18)) is often
used, since this energy is usually greater than the spark energy. The energy efficiency to
deliver the pulse energy from a generator to spark energy is referred in van der Wielen et al.
(2013) and Zuo et al. (2015a).
The data collected from the tests on three ore samples using a pilot scale HVP installed in
Switzerland (Zuo et al., 2015) were used to validate the HVP breakage model. Ore A was
collected from a gold-copper mine operation located in New South Wales, Australia. The
gold-copper mineralization occurs in quartz veins, sheeted quartz sulphide veins and as
disseminations. Ore B was collected from a major copper, silver and gold mine in South
Australia. The deposit is an iron oxide copper gold (IOCG) style mineralization. Ore C is a
hematite ore with Fe grade of around 63.0%. It was observed that some particles were
highly porous. Fig. 14 shows the fitting results of the two HVP breakage indices for the
three ore samples. There are a nominal 27 data points for Ore A (3 sizes × 3 voltages ×3
energies), 6 data points for Ore B (3 sizes ×2 energies) and 9 data points for Ore C (3 sizes
×3 energies). All of these data points represented the HVP breakage testing results of
particles subjected to a single pulse discharge.
ACC
EPTE
D M
ANU
SCR
IPT
ACCEPTED MANUSCRIPT 31
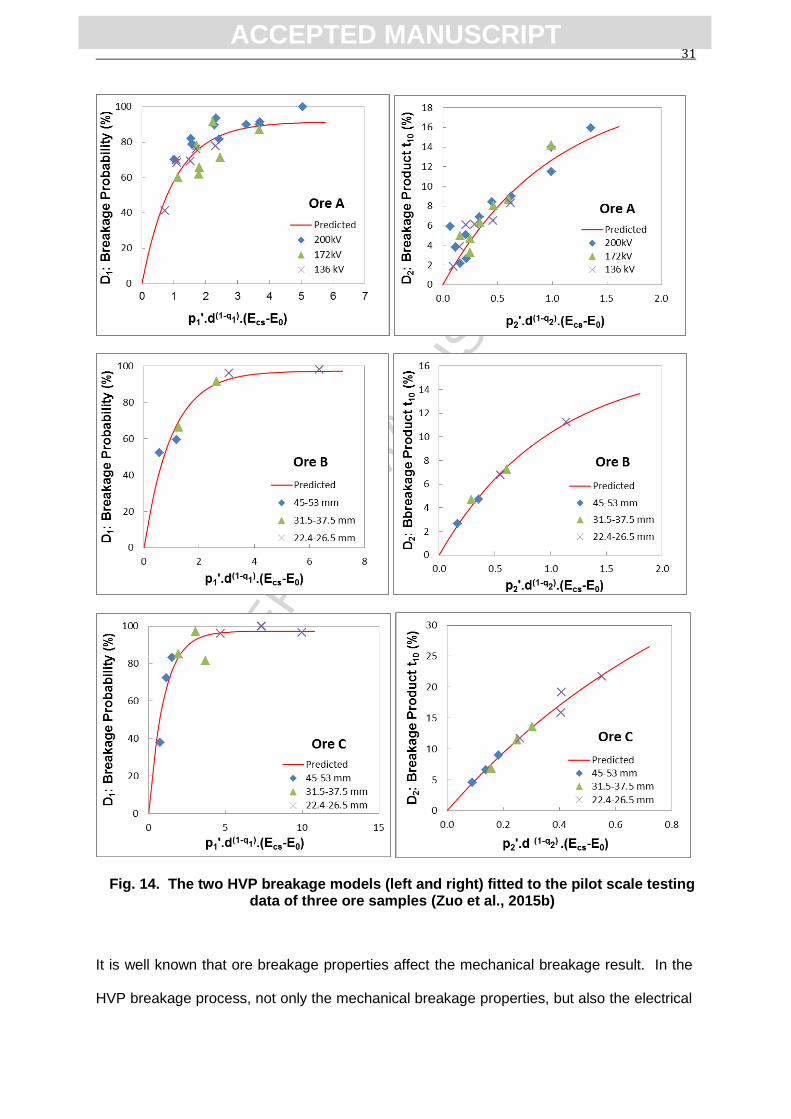
Fig. 14. The two HVP breakage models (left and right) fitted to the pilot scale testing data of three ore samples (Zuo et al., 2015b)
It is well known that ore breakage properties affect the mechanical breakage result. In the
HVP breakage process, not only the mechanical breakage properties, but also the electrical
ACC
EPTE
D M
ANU
SCR
IPT
ACCEPTED MANUSCRIPT 32
properties of the ore, will affect the breakage results. Therefore a large variation in the HVP
breakage results would be expected. Indeed Fig. 14 shows the scatter in the Ore A data.
This was believed to reflect variation in metal grades. Ore A was also used for HVP pre-
concentration tests, in which copper grade variations in the feed particles have been
demonstrated (Zuo et al., 2015a). Despite the scatter, the fitting results suggest that the
model is robust enough to replicate the complex interaction of different influencing factors
on the HVP breakage indices.
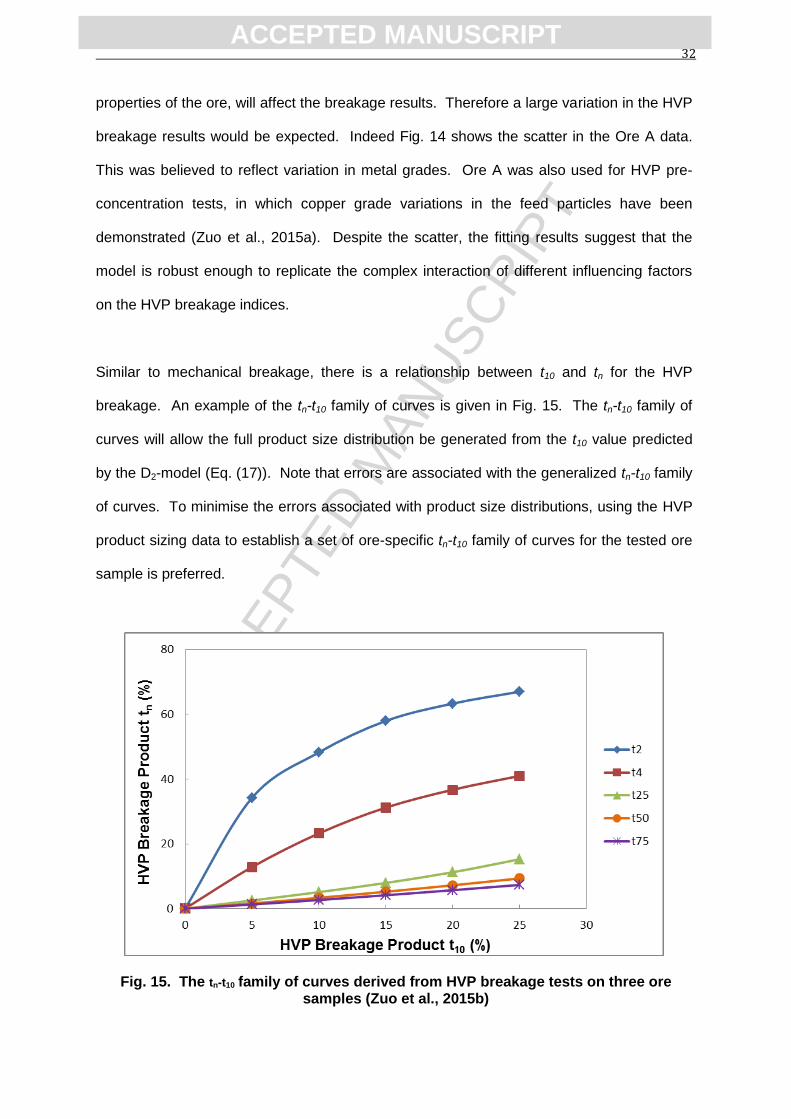
Similar to mechanical breakage, there is a relationship between t10 and tn for the HVP
breakage. An example of the tn-t10 family of curves is given in Fig. 15. The tn-t10 family of
curves will allow the full product size distribution be generated from the t10 value predicted
by the D2-model (Eq. (17)). Note that errors are associated with the generalized tn-t10 family
of curves. To minimise the errors associated with product size distributions, using the HVP
product sizing data to establish a set of ore-specific tn-t10 family of curves for the tested ore
sample is preferred.
Fig. 15. The tn-t10 family of curves derived from HVP breakage tests on three ore samples (Zuo et al., 2015b)
ACC
EPTE
D M
ANU
SCR
IPT
ACCEPTED MANUSCRIPT 33
It was demonstrated that body breakage of particles is often caused by metalliferous grain-
induced breakdown, and the index of body breakage probability is closely related to metal
grade (Zuo et al., 2015a). It is anticipated that the breakage probability predicted by the D1-
model will closely link with the mass yield of the high grade product when using HVP
pre-concentration, thus providing a new opportunity to use the HVP breakage model to
predict the recovery of valuable metals. Preliminary results are given in Zuo et al. (2015b).
More data are needed for validation and further improvement.
7. Summary and Conclusion
A modelling method that is different to the traditional population balance model for
comminution has been reviewed. This modelling approach is based on a mechanistic
structure of the energy-size reduction relationship. The JK size-dependent breakage model
(Shi and Kojovic, 2007) provides a key mathematical template to rationally link the size
reduction as the model output with ore breakage properties and specific energy as the
model inputs in a comminution process. This is different to the population balance model,
which is based only on the structure of rate-size balance of the size reduction, without
directly incorporating the input energy and the material properties that affect the size
reduction results in the model structure.
In the energy-size reduction modelling approach, the size reduction output is described by a
breakage index, t10, which is a normalised index taking into account the feed particle size
(Narayanan and Whiten, 1988). By using the tn-t10 family of curves, the product size
distribution can be determined from the single index, t10, alone. The size reduction inputs
consist of two categories: material-specific properties and properties related to operational
conditions. The material-specific breakage property is described by model parameters M, p
and q, which are determined from breakage characterisation tests on the particular material,
ACC
EPTE
D M
ANU
SCR
IPT
ACCEPTED MANUSCRIPT 34
and remain constant during the model fitting process. The breakage characterisation test to
determine the material M, p and q parameters include a single particle impact test using
DWT or JKRBT (a rotary breakage tester developed by the JKMRC (Shi et al., 2009),
compression bed breakage test using JKFBC, or a piston press test. The material-specific
property also includes feed particle size, whose effect on breakage is defined by the
characteristic parameter q. The second category, the properties related to operational
conditions, is described by specific energy.
Five case studies using the energy-size reduction approach for comminution modelling have
been reviewed, including a hammer mill for coke feed preparation, a vertical spindle mill for
coal PF grinding, a ball mill for batch grinding and continuous operation, HPGR for ore
grinding and high voltage pulse disintegration of ores. In these modelling processes, the
key was to estimate the specific energy. This involves three common steps described
below.
The first step is to estimate power draw or energy consumption. This procedure is machine-
dependent, which allows a mechanistic structure be established to link the power draw or
energy consumption with machine geometry and operational conditions. In the five cases
reviewed, different approaches were taken to model the power draw or energy consumption
for different comminution devices. The hammer mill was modelled as a fan consuming power
when moving a gas using the law of conservation of energy and Bernoulli’s equation. The
vertical spindle mill power draw was modelled from physical principles as a product of driving
torque multiplied by the angular velocity of the grinding table. The ball mill power draw was
calculated by Morrell’s power model (Morrell, 1992) that takes account of mill geometry and
operational conditions. The HPGR energy consumption was inferred from a piston press test
by integrating the resulting force-displacement curves. The high voltage pulse breakage
energy was directly calculated from high voltage physics from the machine setting conditions.
ACC
EPTE
D M
ANU
SCR
IPT
ACCEPTED MANUSCRIPT 35
The second step is to estimate the specific energy. By definition, specific energy is
calculated as energy divided by mass of material for a batch grinding, or power divided by
mass flow rate for continuous operation. In some cases such as the hammer mill, the
internal circulating load is unknown. The calculated power draw data can be used to
estimate the hammer mill content.
It is argued that the mean specific energy calculated in Step 2 cannot be evenly delivered to
all sizes of particles. Step 3 is therefore used to estimate the size-specific energy. In the
VSM model example, the size specific energy is estimated by an empirical equation with its
parameters fitted to the survey data. In the ball mill model, it is described by a selection
function with three knot values fitted. This selection function is then used to calculate the
size specific energy for all size fractions by a cubic spline function.
There are a number of advantages in using the energy-size reduction approach for
comminution modelling, attributable to the decoupled material property and the operational
conditions in the model. As the material breakage properties are measured, and the
characteristic parameters are explicitly incorporated in the energy-size reduction model, it is
possible to run simulations for ore/coal changes, including the feed size variation, on
comminution performance. Another advantage is that, because the size-specific energy in
the model is mechanistically modelled as a function of machine geometry and operating
condition, it is possible to use the model to optimise a comminution machine or a circuit by
varying the geometry or the operating conditions.
It is understood that the objective of comminution is not only for size reduction, but also for
valuable mineral liberation. Since the liberation must be associated with particle size
reduction, the energy-size reduction approach may be used as a basis for liberation. This
requires further work, in which the JK size-dependent breakage model may play a role in
liberation modelling.

ACC
EPTE
D M
ANU
SCR
IPT
ACCEPTED MANUSCRIPT 36
Acknowledgement
Financial support of the JKMRC projects reviewed in this article was provided by the
following organisations: AMIRA P9N Program for the development of the JK size-dependent
breakage model, Anglo American, Barrick Gold, BHP Billiton, Rio Tinto, Teck and JKTech in
the JKRBT and size dependent breakage model validation project, ACARP C8057 Project
for hammer mill model, the Australian Government Department of Resources, Energy and
Tourism in the Asia-Pacific Partnership on Clean Development and Climate program (APP)
for the vertical spindle mill model, AMIRA P9P Program for the specific energy based ball
mill model, Newcrest Mining for the high voltage pulse breakage model. The author has
had the pleasure of working with his JKMRC colleagues in developing the JK size-
dependent breakage model and applying it for the mineral and coal industries. In particular,
the contributions made by the following JKMRC colleagues are gratefully acknowledged: Dr
Toni Kojovic in the JKRBT, the JK size-dependent breakage model, the hammer mill model
and the vertical spindle mill models; Professor William Whiten for the tn-t10 family of curves
that were utilised in all the JKMRC models reviewed in this paper and the classification
equation used in the specific energy based ball mill model; Professor Alban Lynch in power
station grinding work; Professor Emmy Manlapig in the JKRBT and the high voltage pulse
research projects; Dr Stephen Morrell for the power model used in the specific energy
based ball mill model; Professor Tim Napier–Munn in statistical analysis of the data; Dr Rob
Morrison in the incremental breakage; Professor Malcolm Powell in comminution modelling;
Dr Matthew Brennan in the vertical spindle mill models, Dr Weiguo Xie in the specific energy
based ball mill model, and many postgraduate students whose work has been reviewed in
the papers as co-authors. The present author enjoys working with a number of research
collaborators involved in the projects reviewed in this series of papers: Professor Yaqun He
and his team in China University of Mining and Technology in Xuzhou, Dr Alexander Weh
and Dr Klaas van der Wielen of SELFRAG AG in Switzerland, Mr Philip Bennett of ALS
ACC
EPTE
D M
ANU
SCR
IPT
ACCEPTED MANUSCRIPT 37
Coal in Brisbane, Dr Terry Dixon of Tarong Power Station in Queensland, Dr Tom Callcott
of Callcott Consulting Pty. Ltd and Professor Joan Esterle of CSIRO Exploration and Mining
(now at the School of Earth Sciences of the University of Queensland). The author
sincerely appreciates the review and the valuable comments on the three review articles in
the series by Professor Tim Napier-Munn.
References
Austin, L.G., 1971-72. A review introduction to the mathematical description of grinding as a rate process. Powder Technology, 5: 1-17.
Austin, L.G., Klimpel, R.R., Luckie, P.T., 1984. Process engineering of size reduction: ball milling. The Pennsylvania State University, SME.
Austin, L.G., Luckie, P.T. and Shoji, K., 1982. An analysis of ball-and-race milling Part II: The Badcock E1.7 mill. Powder Technology, 33, 113-125.
Banini, G.A., 2000. An integrated description of rock breakage in comminution machines. Ph.D. Thesis, University of Queensland (JKMRC), Australia.
Callcott T.G. A study of size reduction mechanism of swing hammer mills. J. Inst. Fuel, 33, 1960, 529–39
Carvalho, R.M. and Tavares, L.M., 2013. Predicting the effect of operating and design variables on breakage rates using the mechanistic ball mill model. Minerals Engineering, 43-44, 91-101.
Davaanyam, Z., 2015. Piston press test procedures for predicting energy–size reduction of high pressure grinding rolls. Ph.D. Thesis, The University of British Columbia, Canada.
Davaanyam, Z., Klein, B. and Nadolski, S., 2015. Using piston press tests for determining optimal energy input for an HPGR operation. SAG 2015 Conference, UBC/CIM, Vancouver, Canada, Paper 23.
Djordjevic, N., Shi, F. and Morrison, R.D., 2003. Applying discrete element modelling to vertical and horizontal shaft impact crushers. Minerals Engineering, 16, 983-991.
He, Y., Zuo, W., Duan, C., Zhou, N. and Wang, S., 2011. CUMT plant work and data analysis. In F. Shi (Ed.): APP Final Report – Efficiency Improvement in Coal Fired Utilities, Chapter 2.
Herbst, J.A. and Fuerstenau, D.W., 1973. Mathematical simulation of dry ball milling using specific power information. Transaction SME-AIME, 254, 343–348.
Herbst, J.A. and Fuerstenau, D.W., 1980. Scale-up procedure for continuous grinding mill design using population balance models. International Journal of Mineral Processing, 7, 1–31.
Herbst, J.A. and Mika, T.S., 1970. Mathematical simulation of tumbling mill grinding: an improved method. Rudy, 18(3/4): 70-75.
Hukki, R.T., 1962. Proposal for a solomnic settlement between the theories of von Rittinger, Kick and Bond. Transactions of the AIME 223, 403– 408.

ACC
EPTE
D M
ANU
SCR
IPT
ACCEPTED MANUSCRIPT 38
Kelsall, D.F. and Reid, K.J., 1965. The derivation of a mathematical model for breakage in a small, continuous, wet, ball mill. American Institute of Chemical Engineers – Institution of Chemical Engineers Symposium, Series No. 4, 14-20.
King, R.P. and Bourgeois, F., 1993. Measurement of fracture energy during single-particle breakage. Minerals Engineering, 6, 353–367.
Kojovic, T., Shi, F. and Brennan M., 2015. Modelling of vertical spindle mills Part 2: Integrated models for E-mill, MPS and CKP mills. Fuel, 143, 602-611.
Man, Y.T., 2001. Model-based procedure for scale-up of wet, overflow ball mills, Part 1: Outline of the methodology. Minerals Engineering, 14 (10), 1237-1246.
Morrell, S., 1992. Prediction of grinding mill power. Transactions of the Institution of Mining and Metallurgy, Section C, 101, C25-32.
Morrell, S., 2004. An alternative energy–size relationship to that proposed by Bond for the design and optimisation of grinding circuits. International Journal of Mineral Processing, 74, 133-141.
Morrell, S., Lim, W., Shi, F. and Tondo, L., 1997a. Modelling of the HPGR crusher. SME Annual Conference (Kawatra Ed.), Denver, USA: Chapter 17, 117-126.
Morrell, S., Shi, F. and Tondo, L., 1997b. Modelling and scale-up of high pressure grinding rolls. The 20th International Mineral Processing Congress, Vol. 2: 129-140.
Morrell, S., Sterns, U.J. and Weller, K.R., 1993. The application of population balance models to very fine grinding in tower mills. The 18th International Mineral Processing Congress, Sydney, 61-66.
Napier-Munn, T.J., Morrell, S., Morrison, R.D., and Kojovic, T., 1996. Mineral comminution circuits: their operation and optimisation. ISBN 0 646 28861 x. Julius Kruttschnitt Mineral Research Centre.
Narayanan, S.S., and Whiten, W.J., 1988. Determination of comminution characteristics from single particle breakage tests and its application to ball mill scale-up. Trans. Inst. Miner. Metall. 97, C115-C124.
Özer, C., Shi, F. and Whiten, W., 2009. Improving the efficiency of fine coal grinding circuits – Tarong power station site work. ACARP C15079 Final Report. <http://www.acarp.com.au/abstracts.aspx?repId=C15079>
Parker, T., Shi, F., Evans C. and Powell, P., 2015. The effects of electrical comminution on the mineral liberation and surface chemistry of a porphyry copper ore. Minerals Engineering, 82, 101-106
Rumpf, H., 1973. Physical aspects of comminution and a new formulation of a Law of Comminution. Powder Technology 7, 145– 159.
Sato, K., Meguri, N., Shoji, K., Kanemoto, H., Hasegawa, T. and Maruyama, T., 1996. Breakage of coals in ring-roller mills Part 1: The breakage properties of various coals and simulation model to predict steady-state mill performance. Powder Technology, 86(3), 275-283.
Shi, F., 2002. Development of a power draw model for estimation of the dynamic recirculating load of swing hammer mills with internal classifiers. Trans. Instn Min. Metall. (Sect. C: Mineral Process. Extr. Mrtall.), 111-119/Proc. Australas. Inst. Min. Metall., 307, September-December 2002.
Shi, F., 2016. A review of the applications of the JK size-dependent breakage model Part 1: Ore and coal breakage characterisations. International Journal of Mineral Processing, 155, 118-129.
ACC
EPTE
D M
ANU
SCR
IPT
ACCEPTED MANUSCRIPT 39
Shi, F., Kojovic, T. and Brennan M., 2015a. Modelling of vertical spindle mills Part 1: Sub-models for comminution and classification. Fuel, 143, 595-601.
Shi, F., Kojovic, T., Esterle, J. and David, D., 2003. An energy-based model for swing hammer mills. International Journal of Mineral Processing, 71, 147-166.
Shi, F., Kojovic, T., Larbi-Bram, S. and Manlapig, E., 2009. Development of a rapid particle breakage characterization device – the JKRBT. Minerals Engineering, 22, 602-612.
Shi, F. and Napier-Munn, T.J., 2002. Effects of slurry rheology on industrial grinding performance. International Journal of Mineral Processing, 65/3-4, 125-140.
Shi, F. and Zuo, W., 2014. Coal breakage characterisation - Part 1: Breakage testing with the JKFBC. Fuel, 117, 1148-1155.
Shi, F., Zuo, W. and Manlapig, E., 2015b. Pre-concentration of copper ores by high voltage pulses, Part 2: Opportunities and challenges. Minerals Engineering, 79, 315-323.
Shoji, K., Meguri, N., Sato, K., Kanemoto, H., Hasegawa, T. and Maruyama, T., 1998. Breakage of coals in ring-roller mills Part 2: An unsteady-state simulation model. Powder Technology, 99(1), 46-52.
Sligar, N.J. 1975. Estimation of crushing and classification functions for and mathematical simulation of a medium speed roll/table mill. PhD Thesis, University of Newcastle.
Sproull, W. T., 1970. Air pollution and its control. Exposition Press, Jericho, New York.
Tavares, L.M. and King, R.P., 1998. Single-particle fracture under impact loading. International Journal of Mineral Processing, 54, 1-28.
van der Wielen, K.P., Pascoe, R., Weh, A., Wall, F., Rollinson, G., 2013. The influence of equipment settings and rock properties on high voltage breakage. Minerals Engineering, 46–47, 100-111.
Vogel, L. and Peukert, W., 2003a. Breakage behaviour of different materials – construction of a mastercurve for the breakage probability. Powder Technology. 129, 101-110.
Wang, E., Shi, F. and Manlapig, E., 2011. Pre-weakening of mineral ores by high voltage pulses. Minerals Engineering, 24, 455-462.
Wang, E., Shi, F. and Manlapig, E., 2012. Mineral liberation by high voltage pulses and conventional comminution with same specific energy levels. Minerals Engineering, 27-28, 28-36.
Weichert, R., 1988. Correlation between probability of breakage and fragment size distribution of mineral particles. International Journal of Mineral Processing, 22, 1-8.
Whiten, W.J., 1974. A matrix theory of comminution machines. Chemical Engineering Science, 29, 31–34.
Zuo, W., Shi, F. and Manlapig, E., 2015a. Pre-concentration of copper ores by high voltage pulses, Part 1: Principle and major findings. Minerals Engineering, 79, 306-314.
Zuo, W., Shi, F. and Manlapig, E., 2015b. Modelling of high voltage pulse breakage of ores. Minerals Engineering, 83, 168-174.
Zuo, W., Shi, F., van der Wielen, K. and Weh, A., 2015. Ore particle breakage behaviour in a pilot scale high voltage pulse machine. Minerals Engineering, 84, 64-73.

ACC
EPTE
D M
ANU
SCR
IPT
ACCEPTED MANUSCRIPT 40
Part 3 Research Highlights
Using the energy-size reduction relationship for comminution equipment modelling
Five comminution models based on the energy-size reduction relationship reviewed
The JK size-dependent breakage model provides a key mathematical template.
Capability to simulate the effects of changes in ore/coal and machine conditions