Embed Size (px)
Citation preview

A Review of the Emulsification Tendencies and Long-term
Petroleum Trends of Alaska North Slope (ANS) Oils and the “White
Paper on Emulsification of ANS Crude Oil Spilled in Valdez”
Prepared for
Prince William Sound Regional Citizens’ Advisory Council (PWSRCAC)Anchorage, Alaska
by
Merv FingasEnvironmental Technology Centre
Environment CanadaOttawa, Ontario
August, 2005
600.431.050801.MFtrendsANSC.pdf
iii
AbstractThis paper reviews three topics: the potential for formation and the stability of water-in-
oil states (emulsions) of Alaska North Slope (ANS) oils, the change in the lightness or heavinessof these oils, and the report prepared by S.L. Ross Environmental Research Ltd. on these firsttwo topics.
A review of the emulsification of Alaskan North Slope oils shows that these oils do nottypically form entrained water-in-oil or stable emulsions. After weathering, however, many ofthese oils will form meso-stable emulsions, which are not as stable and have a lifetime of lessthan 3 days.
The following are the prime indicators of emulsion formation.1. The major indicator is the stability of the emulsions as measured by the stability index.
The overall tendency of the stability analysis of ANS meso-stable emulsions is that thereis a slight decrease in the stability over time.
2. The asphaltene/resin ratio, another strong indicator, is decreasing over time, indicating aslight decrease in emulsion stability or formation tendency.
3. The asphaltene content is slowly rising over the years, but this is offset by a greaterincrease in the resin content, which decreases the asphaltene/resin ratio.
4. The resin content is increasing over the years, lowering the asphaltene/resin ratio andcreating a meso-stable emulsion.
5. The viscosity of the oil is decreasing. This may decrease the emulsification potential,especially that of the entrained water-in-oil state.
6. The prediction of emulsification using the latest model shows a lower prediction factor(related to stability).
7. The measured stability of meso-stable emulsions shows a slight decrease over the years.Overall, it is concluded that both the potential for formation of meso-stable emulsions
and the stability of these emulsions will decrease if the current trend in petroleum propertiescontinues.
The comparison and analysis of the oil analytical and properties data show apparenttrends in the nature of the ANS oils. Most indicators show that the mix that constitutes ANS oilis becoming lighter, probably due to the mix of crude oils added to the start of the pipelines. It isimportant to note that the sampling points, sampling times, and other conditions of the feed andpipeline operations were not always recorded. The important indicators of distillation data,chemical composition, viscosity, and density show a general increase in the lightness of ANSoils. The amount of volatile organic compounds (VOCs) in the oil is rising. Despite indicatorsthat the oil is becoming lighter, the resins are rising somewhat. This indicates that the oil maybecome lighter but more resiny.
The comparison of the data shows several considerations about the analytical data andconclusions presented in the report on ANS oils prepared by S.L. Ross Environmental ResearchLtd. Several crucial parameters to consider when making decisions about oil behaviour andemulsification are missing from the report, including standard distillation data, standardemulsification procedures, and SARA and VOC analyses. Several data points variedconsiderably from the data in the literature including flash point, density, pour point, oil-airinterfacial tensions, distillation data, and viscosity measurements. The emulsification data wasquite different and could not be related to the data in the literature. None of the importantconcepts or references about emulsification was included in the report. Despite this, the reportdoes indicate that the oil is becoming lighter and may thus be less prone to emulsification.
600.431.050801.MFtrendsANSC.pdf

iv
600.431.050801.MFtrendsANSC.pdf
v
Summary and Issues
OverallThe emulsification tendency of Alaska North Slope (ANS) oils is considered, both in the
past and the future, as well as the long-term changes in the properties of the oil. In addition, thereport on the emulsification of ANS oils prepared by S.L. Ross Environmental Research Ltd. isreviewed.
Specific IssuesThe following is a summary of the specific issues and technical concerns related to these
topics.1. In terms of the long-term emulsification trend of Alaska North Slope crude oil, will it
be more or less prone to form emulsions in the future? Will these emulsions or water-in-oil bemore or less stable?
2. In relation to the properties of ANS crudes, are they becoming lighter or heavier?3. Are the conclusion implied by the report on ANS crude oil prepared by S.L. Ross
Environmental Research Ltd. correct? Are the methods and analytical results in this report in linewith industry standards? Is the emulsification data in this report valid?
ConclusionsThe following are the overall conclusions of this study.
1. EmulsificationOverall, it is concluded that both the potential for formation and the stability of meso-
stable emulsions will decrease if the current trend in petroleum properties continues. This isbased on the following indicators.
A. The strongest indicator is the stability of the emulsions as measured by the stabilityindex of complex modulus of the formed product, divided by the viscosity of the starting oil. Theoverall tendency of the stability analysis of the ANS meso-stable emulsions is that there is aslight decrease in the stability over time, although there is no extensive data on this.
B. The asphaltene/resin ratio is decreasing over time, indicating that there is a slightdecrease in emulsion stability or formation tendency over the years.
C. The asphaltene content is slowly rising over the years, but this is offset by the greaterincrease in the resin content, which is decreasing the asphaltene/resin ratio.
D. The resin content is increasing over the years. This will lower the asphaltene/resinratio and create a meso-stable emulsion.
E. The viscosity of the oil is decreasing. This may decrease the emulsification potential,especially that of the entrained water-in-oil state.
F. The prediction of emulsification using the latest model shows a lower prediction factor(related to stability). This model incorporates a variety of factors including density and viscosity,as well as saturate, asphaltene, and resin content.
G. The measured stability of meso-stable emulsions shows a slight decrease over theyears.
600.431.050801.MFtrendsANSC.pdf

vi
2. Long-term TrendsMost indicators show that the mix that constitutes ANS oil is becoming lighter, probably
due to the mix of crude oils added to the start of the pipelines. It is important to note that thesampling points, sampling times, and other conditions of the pipeline and feed operations werenot always recorded. These trends are indicated by the following.
A. The important indicators of distillation data, viscosity, and density confirm theconclusions.
B. The amount of VOCs in the oil is rising.C. Despite the indicators that the oil is becoming lighter, the resins are rising somewhat.
This indicates that the oil may become a lighter, but more resiny oil.
3. The S.L. Ross ReportThe comparison of the data shows the following about the analytical data presented in the
report prepared by S.L. Ross Environmental Research Ltd.A. Several parameters that are crucial to making decisions on oil behaviour andemulsification are missing from the report, including standard distillation data, standardemulsification procedures, and SARA and VOC analyses.B. The flash point measured was high.C. The density at 15 C was low.o
D. The pour point was high.E. The viscosity measurements were either higher or lower than the results in theliterature.F. The oil-air interfacial tensions were high.G. The distillation curves were different.H. The emulsification data was quite different and could not be related to the data in theliterature. None of the important concepts or references about emulsification wasincluded in the report.Despite this, the report does indicate that the oil is becoming lighter and may thus be less
prone to emulsification.
600.431.050801.MFtrendsANSC.pdf

vii
List of Acronyms
ANS Alaska North Slope - This usually refers to the crude oil mixture at the end of thepipeline.
DLVO Derjaguin Landau Verway Overbeek - This refers to a theory on surfactantstabilization, with each letter referring to the author of the original theory.
EPA U.S. Environmental Protection Agency
FT-IR Fourier transform-infrared
GC Gas chromatograph - This is a chemical analytical technique.
IFT Interfacial tension
NMR Nuclear magnetic resonance
PAH Polynuclear aromatic hydrocarbons
PWSRCAC Prince William Sound Regional Citizens’ Advisory Council
RSD Relative standard deviation
SARA Saturates, aromatics, resins, and asphaltenes
VOCs Volatile organic compounds
600.431.050801.MFtrendsANSC.pdf

viii
AcknowledgementsThe author thanks Lisa Ka’aihue of the Regional Citizens’ Advisory Council of Prince
William Sound, who is the contract manager for this project. The author also thanks JenniferCharles for her editorial work and Lloyd Gamble for collecting the references necessary for thisreport. Ben Fieldhouse is acknowledged for assembling the oil property data.
600.431.050801.MFtrendsANSC.pdf
ix
Table of Contents
Abstract . . . . . . . . . . . . . . . . . . . . . . . . . . . . . . . . . . . . . . . . . . . . . . . . . . . . . . . . . . . . . . . . . . . . iiiSummary and Issues . . . . . . . . . . . . . . . . . . . . . . . . . . . . . . . . . . . . . . . . . . . . . . . . . . . . . . . . . . vList of Acronyms . . . . . . . . . . . . . . . . . . . . . . . . . . . . . . . . . . . . . . . . . . . . . . . . . . . . . . . . . . . viiAcknowledgements . . . . . . . . . . . . . . . . . . . . . . . . . . . . . . . . . . . . . . . . . . . . . . . . . . . . . . . . . viii
1. Introduction . . . . . . . . . . . . . . . . . . . . . . . . . . . . . . . . . . . . . . . . . . . . . . . . . . . . . . . . . . . 11.1 Background . . . . . . . . . . . . . . . . . . . . . . . . . . . . . . . . . . . . . . . . . . . . . . . . . . . . . . . . 11.2 Oil Properties and Alyeska Crude . . . . . . . . . . . . . . . . . . . . . . . . . . . . . . . . . . . . . . . 11.3 A Summary of Oil Composition and Behaviour . . . . . . . . . . . . . . . . . . . . . . . . . . . . 1
1.3.1 Oil Properties . . . . . . . . . . . . . . . . . . . . . . . . . . . . . . . . . . . . . . . . . . . . . . . . . 21.3.2 Behaviour of Oil . . . . . . . . . . . . . . . . . . . . . . . . . . . . . . . . . . . . . . . . . . . . . . . 4
2. Emulsion Formation . . . . . . . . . . . . . . . . . . . . . . . . . . . . . . . . . . . . . . . . . . . . . . . . . . . . 82.1 Asphaltenes . . . . . . . . . . . . . . . . . . . . . . . . . . . . . . . . . . . . . . . . . . . . . . . . . . . . . . . 112.2 Resins . . . . . . . . . . . . . . . . . . . . . . . . . . . . . . . . . . . . . . . . . . . . . . . . . . . . . . . . . . . 142.3 Waxes . . . . . . . . . . . . . . . . . . . . . . . . . . . . . . . . . . . . . . . . . . . . . . . . . . . . . . . . . . . 14
3. Methodologies for Studying Emulsions . . . . . . . . . . . . . . . . . . . . . . . . . . . . . . . . . . . . 153.1 Dielectric . . . . . . . . . . . . . . . . . . . . . . . . . . . . . . . . . . . . . . . . . . . . . . . . . . . . . . . . . 153.2 Rheology . . . . . . . . . . . . . . . . . . . . . . . . . . . . . . . . . . . . . . . . . . . . . . . . . . . . . . . . . 163.3 Nuclear Magnetic Resonance (NMR) . . . . . . . . . . . . . . . . . . . . . . . . . . . . . . . . . . . 163.4 Interfacial Studies . . . . . . . . . . . . . . . . . . . . . . . . . . . . . . . . . . . . . . . . . . . . . . . . . . 173.5 Physical Studies - Structure and Droplet Sizes . . . . . . . . . . . . . . . . . . . . . . . . . . . . 183.6 Recent Studies on Stability Classes . . . . . . . . . . . . . . . . . . . . . . . . . . . . . . . . . . . . 18
4. Emulsion Formation Modelling . . . . . . . . . . . . . . . . . . . . . . . . . . . . . . . . . . . . . . . . . . 194.1 Fingas 2001 Model . . . . . . . . . . . . . . . . . . . . . . . . . . . . . . . . . . . . . . . . . . . . . . . . . 224.2 Fingas 2004 Model . . . . . . . . . . . . . . . . . . . . . . . . . . . . . . . . . . . . . . . . . . . . . . . . . 224.3 Fingas 2005 Model . . . . . . . . . . . . . . . . . . . . . . . . . . . . . . . . . . . . . . . . . . . . . . . . . 24
5. Review of the “White Paper on Emulsification of ANS Oil” by S.L. Ross . . . . . . . . 26
6. Analysis of Alaska North Slope Oils from Literature and Data Comparison . . . . . 35
7. Most Probable Emulsification Behaviour of Alaskan Oils . . . . . . . . . . . . . . . . . . . . 38
8. Conclusions . . . . . . . . . . . . . . . . . . . . . . . . . . . . . . . . . . . . . . . . . . . . . . . . . . . . . . . . . . . 39
9. References . . . . . . . . . . . . . . . . . . . . . . . . . . . . . . . . . . . . . . . . . . . . . . . . . . . . . . . . . . . . 41
600.431.050801.MFtrendsANSC.pdf
x
List of Tables1 Values for Fingas 2004 Emulsion Model . . . . . . . . . . . . . . . . . . . . . . . . . . . . . . . . . . . . 512 Values for Fingas 2005 Emulsion Model . . . . . . . . . . . . . . . . . . . . . . . . . . . . . . . . . . . . 523 Properties of Alaska North Slope Oils . . . . . . . . . . . . . . . . . . . . . . . . . . . . . . . . . . . . . . . 534 Assessment Property Data Relevance . . . . . . . . . . . . . . . . . . . . . . . . . . . . . . . . . . . . . . . 59
List of Figures1 Correlation of Resins with Stability Before Correction . . . . . . . . . . . . . . . . . . . . . 602 Correlation of Resins with Stability After Correction of 4.9 . . . . . . . . . . . . . . . . . . . . . . 603 Sulphur Content of Fresh Alaska North Slope Oils by Year . . . . . . . . . . . . . . . . . . . . . . 614 Sulphur Content of Weathered Alaska North Slope Oils by Weathering Percentage . . . 615 Flash Point of Fresh Alaska North Slope Oils by Year . . . . . . . . . . . . . . . . . . . . . . . . . . 626 Flash Point of Weathered Alaska North Slope Oils by Weathering Percentage . . . . . . . 627 Density (at 0°C) of Fresh Alaska North Slope Oils by Year . . . . . . . . . . . . . . . . . . . . . . 638 Density (at 0°C) of Alaska North Slope Oils by Weathering Percentage . . . . . . . . . . . . 639 Density of Fresh Alaska North Slope Oils by Year and Weathering Percentage . . . . . . 6410 Density (at 15°C) of Fresh Alaska North Slope Oils by Year . . . . . . . . . . . . . . . . . . . . . 6411 Density (at 15°C) of Weathered Alaska North Slope Oils by Weathering Percentage . . 6512 Density (at 15°C) of Fresh Alaska North Slope Oils by Year and Weathering
Percentage . . . . . . . . . . . . . . . . . . . . . . . . . . . . . . . . . . . . . . . . . . . . . . . . . . . . . . . . . . . . 6513 Pour Point of Fresh Alaska North Slope Oils by Year . . . . . . . . . . . . . . . . . . . . . . . . . . . 6614 Pour Point of Weathered Alaska North Slope Oils by Weathering Percentage . . . . . . . . 6615 Viscosity (at 0°C) of Fresh Alaska North Slope Oils by Year . . . . . . . . . . . . . . . . . . . . . 6716 Viscosity (at 0°C) of Weathered Alaska North Slope Oils by Weathering Percentage . . 6717 Viscosity (at 15°C) of Fresh Alaska North Slope Oils by Year . . . . . . . . . . . . . . . . . . . 6818 Viscosity (at 15°C) of Weathered Alaska North Slope Oils by Weathering Percentage 6819 Saturate Content of Fresh Alaska North Slope Oils by Year . . . . . . . . . . . . . . . . . . . . . . 6920 Saturate Content of Weathered Alaska North Slope Oils by Weathering Percentage . . . 6921 Aromatic Content of Fresh Alaska North Slope Oils by Year . . . . . . . . . . . . . . . . . . . . . 7022 Aromatic Content of Weathered Alaska North Slope Oils by Weathering Percentage . . 7023 Resin Content of Fresh Alaska North Slope Oils by Year . . . . . . . . . . . . . . . . . . . . . . . . 7124 Resin Content of Weathered Alaska North Slope Oils by Weathering Percentage . . . . . 7125 Asphaltene Content of Fresh Alaska North Slope Oils by Year . . . . . . . . . . . . . . . . . . . 7226 Asphaltene Content of Weathered Alaska North Slope Oils by Weathering Percentage 7227 Wax Content of Fresh Alaska North Slope Oils by Year . . . . . . . . . . . . . . . . . . . . . . . . 7328 Wax Content of Weathered Alaska North Slope Oils by Weathering Percentage . . . . . . 7329 Adhesion of Fresh Alaska North Slope Oils by Year . . . . . . . . . . . . . . . . . . . . . . . . . . . 7430 Adhesion of Weathered Alaska North Slope Oils by Weathering Percentage . . . . . . . . 7431 VOC Content of Fresh Alaska North Slope Oils by Year . . . . . . . . . . . . . . . . . . . . . . . . 7532 VOC Content of Weathered Alaska North Slope Oils by Weathering Percentage . . . . . 7533 Interfacial Tension of Fresh Alaska North Slope Oils with Air (at 0°C) by Year . . . . . . 7634 Interfacial Tension of Weathered Alaska North Slope Oils with Air (at 0°C)
Weathering Percentage . . . . . . . . . . . . . . . . . . . . . . . . . . . . . . . . . . . . . . . . . . . . . . . . . . 7635 Interfacial Tension of Fresh Alaska North Slope Oils with Air (at 15°C) by Year . . . . . 77
600.431.050801.MFtrendsANSC.pdf
xi
36 Interfacial Tension of Weathered Alaska North Slope Oils with Air (at 15°C) byWeathering Percentage . . . . . . . . . . . . . . . . . . . . . . . . . . . . . . . . . . . . . . . . . . . . . . . . . . 77
37 Interfacial Tension of Fresh Alaska North Slope Oils with Seawater (at 0°C)by Year . . . . . . . . . . . . . . . . . . . . . . . . . . . . . . . . . . . . . . . . . . . . . . . . . . . . . . . . . . . . . . . 78
38 Interfacial Tension of Weathered Alaska North Slope Oils with Seawater (at 0°C)by Weathering Percentage . . . . . . . . . . . . . . . . . . . . . . . . . . . . . . . . . . . . . . . . . . . . . . . . 78
39 Interfacial Tension of Fresh Alaska North Slope Oils with Seawater (at 15°C)by Year . . . . . . . . . . . . . . . . . . . . . . . . . . . . . . . . . . . . . . . . . . . . . . . . . . . . . . . . . . . . . . . 79
40 Interfacial Tension of Weathered Alaska North Slope Oils with Seawater (at 15°C)by Weathering Percentage . . . . . . . . . . . . . . . . . . . . . . . . . . . . . . . . . . . . . . . . . . . . . . . . 79
41 Interfacial Tension of Fresh Alaska North Slope Oils with Fresh Water (at 0°C)by Year . . . . . . . . . . . . . . . . . . . . . . . . . . . . . . . . . . . . . . . . . . . . . . . . . . . . . . . . . . . . . . . 80
42 Interfacial Tension of Weathered Alaskan North Slope Oils withFresh Water (at 0°C) by Weathering Percentage . . . . . . . . . . . . . . . . . . . . . . . . . . . . . . . 80
43 Interfacial Tension of Fresh Alaska North Slope Oils with FreshWater (at 15°C) by Year . . . . . . . . . . . . . . . . . . . . . . . . . . . . . . . . . . . . . . . . . . . . . . . . . 81
44 Interfacial Tension of Weathered Alaska North Slope Oils with FreshWater (at 15°C) by Weathering Percentage . . . . . . . . . . . . . . . . . . . . . . . . . . . . . . . . . . . 81
45 Corexit 9500 Dispersibility of Fresh Alaska North Slope Oils by Year . . . . . . . . . . . . . 8246 Dispersibility of Weathered Alaska North Slope Oils by Weathering Percentage . . . . . 8247 Distillation Curves of Alaska North Slope Oils by Year . . . . . . . . . . . . . . . . . . . . . . . . . 8348 Distillation Curves of Weathered Alaska North Slope Oils by Weathering Percentage . 8349 Distillation Curves of Alaska North Slope Oils by Year by Percent Distilled . . . . . . . . 8450 Percent Distillation of Weathered Alaska North Slope Oils by Weathering Percentage . 8451 Stability of Emulsions of Fresh Alaska North Slope Oils by Year . . . . . . . . . . . . . . . . . 8552 Stability of Emulsions of Weathered Alaska North Slope Oils by Weathering
Percentage . . . . . . . . . . . . . . . . . . . . . . . . . . . . . . . . . . . . . . . . . . . . . . . . . . . . . . . . . . . . 8553 Emulsion Class by the Second Fingas Model for Fresh Alaska North Slope Oils . . . . . 8654 Emulsion Class by the Second Fingas Model for Weathered Alaska North Slope Oils . 8655 Water Content of the Water-in-oil States by Stability . . . . . . . . . . . . . . . . . . . . . . . . . . . 8756 Stability of the Meso-stable Emulsions by Year . . . . . . . . . . . . . . . . . . . . . . . . . . . . . . . 8757 Stability of the Meso-stable Emulsions by Year . . . . . . . . . . . . . . . . . . . . . . . . . . . . . . . 8858 Stability of the Meso-stable Emulsions by Weathering Percentage . . . . . . . . . . . . . . . . 8859 Asphaltene/Resin Ratio of Fresh Alaska North Slope Oils by Year . . . . . . . . . . . . . . . . 8960 Asphaltene/Resin Ratio of Weathered Alaska North Slope Oils by
Weathering Percentage . . . . . . . . . . . . . . . . . . . . . . . . . . . . . . . . . . . . . . . . . . . . . . . . . . 89
600.431.050801.MFtrendsANSC.pdf

1
1. Introduction1.1 Background
The objective of this paper is to comment on the report entitled, “White Paper onEmulsification of ANS Crude Oil Spilled in Valdez” by S.L. Ross Environmental ResearchLimited, published in November, 2004. In addition, the two topics in the report, namely theemulsification of ANS oil and the long-term trends in the oil, will be examined separately.
1.2 Oil Properties and Alyeska CrudeIt is important to recognize the nature of a crude oil that stems from the inputs into the
pipeline and the changing blends that occur over time. A crude oil sample drawn at one point intime from a pipeline may be completely different than a sample drawn at a later time.
The Alaska crude is an example of this principle. The Trans-Alaska Pipeline begins atpump station number one (International Petroleum Encyclopedia, 2004). At this point, it is amixture of crude oils in varying proportions from several fields. These fields include the majorfields of Prudhoe Bay and Kuparuk and several minor fields including Tarn, Alpine, Fiord,Kabulkic, Milne Point, Point Mcintyre, West Beach, Point Thompson, Endicott, and Sandpiper.The characteristics of these fields vary and thus, as they are blended into pump station number 1at the head of the Alyeska pipeline, the starting crude varies as well. Oil is withdrawn from thepipeline for the refinery at Fairbanks where residual oils are re-injected into the pipeline. Thesequence of this changes the composition of the oil when it arrives in Valdez.
1.3 A Summary of Oil Composition and BehaviourCrude oils are mixtures of hydrocarbon compounds ranging from smaller, volatile
compounds to very large, non-volatile compounds (Fingas, 2000). This mixture of compoundsvaries according to the geological formation of the area in which the oil is found and stronglyinfluences the properties of the oil. Petroleum products such as gasoline or diesel fuel aremixtures of fewer compounds and thus their properties are more specific and less variable.Hydrocarbon compounds are composed of hydrogen and carbon, which are therefore the mainelements in oils. Oils also contain varying amounts of sulphur, nitrogen, oxygen, and sometimesmineral salts, as well as trace metals such as nickel, vanadium, and chromium.
In general, the hydrocarbons found in oils are characterized by their structure. Thehydrocarbon structures found in oil are the saturates, olefins, aromatics, and polar compounds.The saturate group of components in oils consists primarily of alkanes, which are compounds ofhydrogen and carbon with the maximum number of hydrogen atoms around each carbon. Thus,the term 'saturate' is used because the carbons are ‘saturated’ with hydrogen. Larger saturatecompounds are often referred to as ‘waxes’. The aromatic compounds include at least onebenzene ring of six carbons. Three double carbon-to-carbon bonds float around the ring and addstability. Because of this stability, benzene rings are very persistent and can have toxic effects onthe environment.
The most common smaller and more volatile compounds found in oil are often referred toas BTEX, or benzene, toluene, ethyl-benzene, and xylenes. Polyaromatic hydrocarbons or PAHsare compounds consisting of at least two benzene rings.
Polar compounds are those that have a significant molecular charge as a result of bondingwith compounds such as sulphur, nitrogen, or oxygen. The 'polarity' or charge that the moleculecarries results in behaviour that is different than that of unpolarized compounds, under some
600.431.050801.MFtrendsANSC.pdf

2
circumstances. In the petroleum industry, the smallest polar compounds are called 'resins', whichare largely responsible for oil adhesion. The larger polar compounds are called 'asphaltenes'because they often make up the largest percentage of the asphalt commonly used for roadconstruction. Asphaltenes often have very large molecules and, if in abundance in an oil, theyhave a significant effect on oil behaviour.
1.3.1 Oil PropertiesThe properties of oil discussed here are viscosity, density, specific gravity, solubility,
flash point, pour point, distillation fractions, interfacial tension, and vapour pressure. Viscosity is the resistance to flow in a liquid (Fingas, 2000). The lower the viscosity, the
more readily the liquid flows. For example, water has a low viscosity and flows readily, whereashoney, with a high viscosity, flows poorly. The viscosity of the oil is largely determined by theamount of lighter and heavier fractions that it contains. The greater the percentage of lightcomponents such as saturates and the lesser the amount of asphaltenes, the lower the viscosity.
As with other physical properties, viscosity is affected by temperature, with a lowertemperature giving a higher viscosity. For most oils, the viscosity varies as the logarithm of thetemperature, which is a very significant variation. Oils that flow readily at high temperatures canbecome a slow-moving, viscous mass at low temperatures. In terms of oil spill cleanup, viscositycan affect the oil's behaviour. Viscous oils do not spread rapidly, do not penetrate soil as readily,and affect the ability of pumps and skimmers to handle the oil.
Density is the mass (weight) of a given volume of oil and is typically expressed in gramsper cubic centimetre (g/cm ). It is the property used by the petroleum industry to define light or3
heavy crude oils. Density is also important as it indicates whether a particular oil will float orsink in water. As the density of water is 1.0 g/cm at 15 C and the density of most oils ranges3 o
from 0.7 to 0.99 g/cm , most oils will float on water. As the density of seawater is 1.03 g/cm ,3 3
even heavier oils will usually float on it. As the light fractions evaporate with time, the density ofoil increases.
Occasionally, when the density of an oil becomes greater than the density of freshwater orseawater, the oil will sink. Sinking is rare, however, and happens only with a few oils, usuallyresidual oils such as Bunker C. Significant amounts of oil have sunk in only about 25 incidentsout of thousands.
Another measure of density is specific gravity, which is an oil's relative density comparedto that of water at 15°C. It is the same value as density at the same temperature. Another gravityscale is that of the American Petroleum Institute (API). The API gravity is based on the densityof pure water which has an arbitrarily assigned API gravity value of 10 (10 degrees). Oils witho
progressively lower specific gravities have higher API gravities.The following is the formula for calculating API gravity: API gravity = [141.5 ÷ (density
at 15.5°C)] - 131.5. Oils with high densities have low API gravities and vice versa. In the UnitedStates, the price of a specific oil may be based on its API gravity as well as other properties of theoil.
Solubility in water is the measure of how much of an oil will dissolve in the watercolumn on a molecular basis. Solubility is important in that the soluble fractions of the oil aresometimes toxic to aquatic life, especially at higher concentrations. As the amount of oil lost tosolubility is always small, this is not as great a loss mechanism as evaporation. In fact, thesolubility of oil in water is so low (generally less than 100 parts per million) that it would be the
600.431.050801.MFtrendsANSC.pdf

3
equivalent of approximately one grain of sugar dissolving in a cup of water.The flash point of an oil is the temperature at which the liquid gives off sufficient vapours
to ignite upon exposure to an open flame. A liquid is considered to be flammable if its flash pointis less than 60°C. There is a broad range of flash points for oils and petroleum products, many ofwhich are considered flammable, especially when fresh. Gasoline, which is flammable under allambient conditions, poses a serious hazard when spilled. Many fresh crude oils have anabundance of volatile components and may be flammable for as long as one day until the morevolatile components have evaporated. On the other hand, Bunker C and heavy crude oils are notgenerally flammable when spilled.
The pour point of an oil is the temperature at which it takes longer than a specified timeto pour from a standard measuring vessel. As oils are made up of hundreds of compounds, someof which may still be liquid at the pour point, the pour point is not the temperature at which theoil will no longer pour. The pour point represents a consistent temperature at which an oil willpour very slowly and therefore has limited use as an indicator of the state of the oil. In fact, pourpoint has been used too much in the past to predict how oils will behave in the environment. Forexample, waxy oils can have very low pour points, but may continue to spread slowly at thattemperature and can evaporate to a significant degree. Because pour point is not the solidificationpoint of oil, it is not the best predictor of how oil will behave or even more specifically, how itwill move in the environment. Pour point is often used incorrectly as a parameter of oilbehaviour.
Distillation fractions of an oil represent the fraction of an oil (generally measured byvolume) that is boiled off at a given temperature. This data is obtained on most crude oils so thatoil companies can adjust parameters in their refineries to handle the oil. This data also providesenvironmentalists with useful insights into the chemical composition of oils. For example, while70% of gasoline will boil off at 100 C, only about 5% of a crude oil will boil off at thato
temperature and an even smaller amount of a typical Bunker C. The distillation fractionscorrelate strongly to the composition of the oil as well as to other physical properties of the oil.
The oil/water interfacial tension, sometimes called surface tension, is the force ofattraction or repulsion between the surface molecules of oil and water. Together with viscosity,surface tension is an indication of how rapidly and to what extent an oil will spread on water. Thelower the interfacial tension with water, the greater the extent of spreading. In actual practice, theinterfacial tension must be considered along with the viscosity because it has been found thatinterfacial tension alone does not account for spreading behaviour.
The vapour pressure of an oil is a measure of how the oil partitions between the liquidand gas phases, or how much vapour is in the space above a given amount of liquid oil at a fixedtemperature. Because oils are a mixture of many compounds, the vapour pressure changes as theoil weathers. Vapour pressure is difficult to measure and is not frequently used to assess oilspills.
While there is a high correlation between the various properties of an oil, thesecorrelations should be used cautiously as oils vary so much in composition (Jokuty et al., 1995).For example, the density of many oils can be predicted based on their viscosity. For other oils,however, this could result in errors. For example, waxy oils have much higher viscosities thanwould be implied from their densities. There are several mathematical equations for predictingone property of an oil from another property, but these must be used carefully as there are manyexceptions.
600.431.050801.MFtrendsANSC.pdf

4
The measurement of oil properties is an important consideration. While there are manystandards for measuring fuel, e.g., ASTM, many of these standards are not applicable to crudeoils and especially not to heavier crudes and residual oils. Similarly, many of the apparatuses formeasurement are only appropriate for lighter fuels. The best examples of inappropriatemeasurements are the use of Brookfield viscometers for measuring heavier crudes (McDonagh etal., 1995). These can result in errors of over 3 orders-of-magnitude (Durrell et al., 1994). Anextensive report on measurement techniques and standards is available in Wang et al. (2004).
1.3.2 Behaviour of OilOil spilled on water undergoes a series of changes in physical and chemical properties
which in combination are termed 'weathering' (Fingas, 2000). Weathering processes occur at verydifferent rates, but begin immediately after oil is spilled into the environment. Weathering ratesare not consistent throughout the duration of an oil spill and are usually highest immediately afterthe spill.
Both weathering processes and the rates at which they occur depend more on the type ofoil than on environmental conditions. Most weathering processes are highlytemperature-dependent, however, and will often slow to insignificant rates as temperaturesapproach zero degrees. The processes included in weathering are evaporation, emulsification,natural dispersion, dissolution, photooxidation, sedimentation, adhesion to materials, interactionwith mineral fines, biodegradation, and the formation of tar balls. These processes are listed inorder of importance in terms of their affect on the percentage of total mass balance, i.e., thegreatest loss from the slick in terms of percentage and what is known about the process.
Evaporation is usually the most important weathering process. It has the greatest effect onthe amount of oil remaining on water or land after a spill. Over a period of several days, a lightfuel such as gasoline evaporates completely at temperatures above freezing, whereas only a smallpercentage of a heavier Bunker C oil evaporates. The rate at which an oil evaporates dependsprimarily on the oil's composition. The more volatile components an oil or fuel contains, thegreater the extent and rate of its evaporation. Many components of heavier oils will not evaporateat all, even over long periods of time and at high temperatures.
Oil and petroleum products evaporate in a slightly different manner than water and theprocess is much less dependent on wind speed and surface area. Oil evaporation can beconsiderably slowed down, however, by the formation of a 'crust' or 'skin' on top of the oil. Thishappens primarily on land where the oil layer does not mix with water. The skin or crust isformed when the smaller compounds in the oil are removed, leaving the larger compounds, suchas waxes and resins, at the surface. These then seal off the remainder of the oil and preventevaporation. Stranded oil from old spills has been re-examined over many years and it has beenfound that, when this crust has formed, there is no significant evaporation in the oil underneath.When this crust has not formed, the same oil could be weathered to the hardness of wood.
The rate of evaporation is very rapid immediately after a spill and then slowsconsiderably. About 80% of evaporation occurs in the first few days after a spill. The evaporationof most oils follows a logarithmic curve with time. Some oils such as diesel fuel, however,evaporate as the square root of time, at least for the first few days. This means that theevaporation rate slows very rapidly in both cases. The properties of an oil can changesignificantly with the extent of evaporation. If about 40% (by weight) of an oil evaporates, itsviscosity could increase by as much as a thousand-fold. Its density could rise by as much as 10%
600.431.050801.MFtrendsANSC.pdf
5
and its flash point by as much as 400%. The extent of evaporation can be the most importantfactor in determining properties of an oil at a given time after the spill and in changing thebehaviour of the oil.
Emulsification is the process by which one liquid is dispersed into another one in theform of small droplets. Water droplets can remain in an oil layer in a stable form and theresulting material is completely different. These water-in-oil emulsions are sometimes called'mousse' or 'chocolate mousse' as they resemble this dessert. In fact, both the tastier version ofchocolate mousse and butter are common examples of water-in-oil emulsions.
The mechanism of emulsion formation is not yet fully understood, but it probably startswith sea energy forcing the entry of small water droplets, about 10 to 25 :m (or 0.010 to0.025 mm) in size, into the oil. If the oil is only slightly viscous, these small droplets will notleave the oil quickly. On the other hand, if the oil is too viscous, droplets will not enter the oil toany significant extent. Once in the oil, the droplets slowly gravitate to the bottom of the oil layer.Any asphaltenes and resins in the oil will interact with the water droplets to stabilize them.Depending on the quantity of asphaltenes and resins, as well as aromatic compounds thatstabilize asphaltenes and resins in solution, an emulsion may be formed. The conditions requiredfor emulsions of any stability to form may only be reached after a period of evaporation.Evaporation lowers the amount of low-molecular weight aromatics in the oil and increases theviscosity to the critical value.
Water can be present in oil in four ways. First, some oils contain about 1% water assoluble water. This water does not significantly change the physical or chemical properties of theoil. The second way is called 'entrainment', whereby water droplets are simply held in the oil byits viscosity to form an unstable emulsion. These are formed when water droplets areincorporated into oil by the sea's wave action and there are not enough asphaltenes and resins inthe oil or if there is a high amount of aromatics in the oil which stabilizes the asphaltenes andresins, preventing them from acting on the water droplets. Unstable emulsions break down intowater and oil within minutes or a few hours, at most, once the sea energy diminishes. Theproperties and appearance of the unstable emulsion are almost the same as those of the startingoil, although the water droplets may be large enough to be seen with the naked eye.
Semi- or meso-stable emulsions represent the third way water can be present in oil. Theseare formed when the small droplets of water are stabilized to a certain extent by a combination ofthe viscosity of the oil and the interfacial action of asphaltenes and resins. For this to happen, theasphaltene or resin content of the oil must be at least 3% by weight. The viscosity of meso-stableemulsions is 20 to 80 times higher than that of the starting oil. These emulsions generally breakdown into oil and water or sometimes into water, oil, and stable emulsion within a few days.Semi- or meso-stable emulsions are viscous liquids that are reddish-brown or black in colour.
The fourth way that water exists in oil is in the form of stable emulsions. These form in away similar to meso-stable emulsions except that the oil must contain at least 8% asphaltenes.The viscosity of stable emulsions is 500 to 800 times higher than that of the starting oil and theemulsion will remain stable for weeks and even months after formation. Stable emulsions arereddish-brown in colour and appear to be nearly solid. Because of their high viscosity and nearsolidity, these emulsions do not spread and tend to remain in lumps or mats on the sea or shore.
The formation of emulsions is an important event in an oil spill. First, and mostimportantly, it substantially increases the actual volume of the spill. Emulsions of all typescontain about 70% water and thus when emulsions are formed the volume of the oil spill more
600.431.050801.MFtrendsANSC.pdf
6
than triples. Even more significantly, the viscosity of the oil increases by as much as 1000 times,depending on the type of emulsion formed. For example, a highly viscous oil such as a motor oilcan triple in volume and become almost solid through the process of emulsification.
These increases in volume and viscosity make cleanup operations more difficult.Emulsified oil is difficult or impossible to disperse, to recover with skimmers, or to burn.Emulsions can be broken down with special chemicals in order to recover the oil with skimmersor to burn it. It is thought that emulsions break down into oil and water by further weathering,oxidation, and freeze-thaw action. Meso- or semi-stable emulsions are relatively easy to breakdown, whereas stable emulsions may take months or years to break down naturally.
Emulsion formation also changes the fate of the oil. It has been noted that when oil formsstable or meso-stable emulsions, evaporation slows considerably. Biodegradation also appears toslow down. The dissolution of soluble components from oil may also cease once emulsificationhas occurred.
The process of emulsion formation is discussed in detail in Section 2 of this report. Natural dispersion occurs when fine droplets of oil are transferred into the water column
by wave action or turbulence. Small oil droplets (less than 20 :m or 0.020 mm) are relativelystable in water and will remain so for long periods of time. Large droplets tend to rise and largerdroplets (more than 100 :m) will not stay in the water column for more than a few seconds.Depending on oil conditions and the amount of sea energy available, natural dispersion can beinsignificant or it can remove the bulk of the oil. In 1993, the oil from a stricken ship, the Braer,dispersed almost entirely as a result of high seas off Scotland at the time of the spill and thedispersible nature of the oil cargo.
Natural dispersion is dependent on both the oil properties and the amount of sea energy.Heavy oils such as Bunker C or a heavy crude will not disperse naturally to any significantextent, whereas light crudes and diesel fuel can disperse significantly if the saturate content ishigh and the asphaltene and resin contents are low. In addition, significant wave action is neededto disperse oil. In 30 years of monitoring spills on the oceans, those spills at which oil hasdispersed naturally have all occurred in very energetic seas.
The long-term fate of dispersed oil is not known, although it probably degrades to someextent as it consists primarily of saturate components. Some of the dispersed oil may also riseand form another surface slick or it may become associated with sediment and be precipitated tothe bottom.
Through the process of dissolution, some of the most soluble components of the oil arelost to the water under the slick. These include some of the lower molecular weight aromaticsand some of the polar compounds, broadly categorized as resins. As only a small amount actuallyenters the water column, usually much less than a fraction of a percent of the oil, dissolution doesnot measurably change the mass balance of the oil. The significance of dissolution is that thesoluble aromatic compounds are particularly toxic to fish and other aquatic life. If a spill of oilcontaining a large amount of soluble aromatic components occurs in shallow water and creates ahigh localized concentration of compounds, then significant numbers of aquatic organisms can bekilled.
Gasoline, diesel fuel, and light crude oils are the most likely to cause aquatic toxicity. Ahighly weathered oil is unlikely to dissolve into the water. On open water, the concentrations ofhydrocarbons in the water column are unlikely to kill aquatic organisms.
600.431.050801.MFtrendsANSC.pdf

7
Dissolution occurs immediately after the spill occurs and the rate of dissolution decreasesrapidly after the spill as soluble substances are quickly depleted. Some of the soluble compoundsalso evaporate rapidly.
Photooxidation can change the composition of an oil. It occurs when the sun's action onan oil slick causes oxygen and carbons to combine and form new products that may be resins.The resins may be somewhat soluble and dissolve into the water or they may cause water-in-oilemulsions to form. It is not well understood how photooxidation specifically affects oils,although certain oils are susceptible to the process, while others are not. For most oils,photooxidation is not an important process in terms of changing their fate or mass balance after aspill.
Sedimentation is the process by which oil is deposited on the bottom of the sea or otherwater body. While the process itself is not well understood, certain facts about it are. Mostsedimentation noted in the past has occurred when oil droplets reached a higher density thanwater after interacting with mineral matter in the water column. This interaction sometimesoccurs on the shoreline or very close to the shore. Once oil is on the bottom, it is usually coveredby other sediment and degrades very slowly. In a few well studied spills, a significant amount(about 10%) of the oil was sedimented on the sea floor. Such amounts can be very harmful tobiota that inevitably come in contact with the oil on the sea bottom. Because of the difficulty ofstudying this, data are limited.
Oil is very adhesive, especially when it is moderately weathered, and binds to shorelinematerials or other mineral material with which it comes in contact. A significant amount of oilcan be left in the environment after a spill in the form of residual amounts adhering to shorelinesand man-made structures such as piers and artificial shorelines. As this oil usually contains ahigh percentage of aromatics and asphaltenes with high molecular weight, it does not degradesignificantly and can remain in the environment for decades.
Oil slicks and oil on shorelines sometimes interact with mineral fines suspended in thewater column and the oil is thereby transferred to the water column. Particles of mineral with oilattached may be heavier than water and sink to the bottom as sediment or the oil may detach andrefloat. Oil-fines interaction does not generally play a significant role in the fate of most oil spillsin their early stages, but can have an impact on the rejuvenation of an oiled shoreline over thelong term.
A large number of microorganisms are capable of degrading petroleum hydrocarbons.Many species of bacteria, fungi, and yeasts metabolize petroleum hydrocarbons as a food energysource. Bacteria and other degrading organisms are most abundant on land in areas where therehave been petroleum seeps, although these microorganisms are found everywhere in theenvironment. As each species can utilize only a few related compounds at most, however,broad-spectrum degradation does not occur. Hydrocarbons metabolized by microorganisms aregenerally converted to an oxidized compound, which may be further degraded, may be soluble,or may accumulate in the remaining oil. The aquatic toxicity of the biodegradation products issometimes greater than that of the parent compounds.
The rate of biodegradation depends primarily on the nature of the hydrocarbons and thenon the temperature. Generally, rates of degradation tend to increase as the temperature rises.Some groupings of bacteria, however, function better at lower temperatures and others functionbetter at higher temperatures. Indigenous bacteria and other microorganisms are often the bestadapted and most effective at degrading oil as they are acclimatized to the temperatures and other
600.431.050801.MFtrendsANSC.pdf
8
conditions of the area. Adding 'super-bugs' to the oil does not necessarily improve thedegradation rate.
The rate of biodegradation is greatest on saturates, particularly those containingapproximately 12 to 20 carbons (Haus et al., 2004). Aromatics and asphaltenes, which have ahigh molecular weight, biodegrade very slowly, if at all. This explains the durability of roofshingles containing tar and roads made of asphalt, as both tar and asphalt consist primarily ofaromatics and asphaltenes. On the other hand, diesel fuel is a highly degradable product as it islargely composed of degradable saturates. Light crudes are also degradable to a degree. Whilegasoline contains degradable components, it also contains some compounds that are toxic tosome microorganisms. These compounds generally evaporate more rapidly, but in many cases,most of the gasoline will evaporate before it can degrade. Heavy crudes contain little materialthat is readily degradable and Bunker C contains almost none.
The rate of biodegradation is also highly dependent on the availability of oxygen. Onland, oils such as diesel can degrade rapidly at the surface, but very slowly if at all only a fewcentimetres below the surface, depending on oxygen availability. In water, oxygen levels can beso low that degradation is limited. It is estimated that it would take all the dissolved oxygen inapproximately 400,000 L of sea water to completely degrade 1 L of oil. The rate of degradationalso depends on the availability of nutrients such as nitrogen and phosphorus, which are mostlikely to be available on shorelines or on land. Finally, the rate of biodegradation also depends onthe availability of the oil to the bacteria or microorganism. Oil degrades significantly at theoil-water interface at sea and, on land, mostly at the interface between soil and the oil.
Biodegradation can be a very slow process for some oils. It may take weeks for 50% of adiesel fuel to biodegrade under optimal conditions and years for 10% of a crude oil to biodegradeunder less optimal conditions. For this reason, biodegradation is not considered an importantweathering process in the short term.
Tar balls are agglomerations of thick oil less than about 10 cm in diameter. Largeraccumulations of the same material ranging from about 10 cm to 1 m in diameter are called tarmats. Tar mats are pancake-shaped, rather than round. Their formation is still not completelyunderstood, but it is known that they are formed from the residuals of heavy crudes and BunkerC. After these oils weather at sea and slicks are broken up, the residuals remain in tar balls or tarmats. The reformation of droplets into tar balls and tar mats has also been observed, with thebinding force being simply adhesion.
The formation of tar balls is the ultimate fate of many oils. These tar balls are thendeposited on shorelines around the world. The oil may come from spills, but it is also residual oilfrom natural oil seeps or from deliberate operational releases such as from ships. Tar balls areregularly recovered by machine or by hand from recreational beaches.
2. Emulsion FormationEmulsification is the process whereby water-in-oil emulsions are formed. These
emulsions are often called “chocolate mousse” or “mousse” by oil spill workers. Whenemulsions form, the properties and characteristics of oil spills change to a very large degree. Forexample, stable emulsions contain from 60 to 80% water, thus expanding the spilled materialfrom 2 to 5 times the original volume. The density of the resulting emulsion can be as great as1.03 g/mL compared to a starting density as low as 0.80 g/mL. Most significantly, the viscosityof the oil typically changes from a few hundred mPa.s to about 100,000 mPa.s, a typical increase
600.431.050801.MFtrendsANSC.pdf

9
of 1,000. A liquid product is thereby changed to a heavy, semi-solid material.Many researchers feel that emulsification is the second most important behavioural
characteristic of oil after evaporation. Emulsification has a significant effect on the behaviour ofoil spills at sea. As a result of emulsification, evaporation of oil spills slows by orders-of-magnitude, spreading slows by similar rates, and the oil rides lower in the water column,showing different drag with respect to the wind. Emulsification also significantly affects otheraspects of a spill, such as cleanup response. Spill countermeasures are quite different foremulsions as they are hard to recover mechanically, to treat, or to burn.
In terms of understanding emulsions and emulsification, the oil spill industry has not keptpace with the petroleum production industry and colloid science generally. Workers in the spillindustry often revert to old papers published in oil spill literature, which are frequently incorrectand outdated. A basic understanding of the formation, stability, and processes of emulsions isnow evident in literature in both the colloid science and oil spill fields, although some newpapers still appear with references only to 20-year-old literature.
The availability of methodologies to study emulsions is very important. In the past tenyears, both dielectric methods and rheological methods have been exploited to study formationmechanisms and stability of emulsions made from many different types of oils (Sjöblom et al.,1994; Fingas et al., 1998). Standard chemical techniques, including Nuclear Magnetic Resonance(NMR), chemical analysis techniques, microscopy, interfacial pressure, and interfacial tension,are also being applied to emulsions. These techniques have largely confirmed findings noted inthe dielectric and rheological mechanisms.
The mechanism and dynamics of emulsification were poorly understood until the 1990s.It was not recognized until recently that the basics of water-in-oil emulsification were understoodin the surfactant industry, but not in the oil spill industry. In the late 60s, Berridge and coworkerswere the first to describe emulsification in detail and measured several physical properties ofemulsions (Berridge et al., 1968). Berridge described the emulsions as forming because of theasphaltene and resin content of the oil. Workers in the 1970s concluded that emulsificationoccurred primarily due to increased turbulence or mixing energy (Haegh and Ellingson, 1977;Wang and Huang, 1979). The oil’s composition was not felt to be a major factor in emulsionformation. Some workers speculated that particulate matter in the oil may be a factor and otherssuggested it was viscosity. Evidence could be found for and against all these hypotheses.
Twardus (1980) studied emulsions and found that emulsion formation might be correlatedwith oil composition. It was suggested that asphaltenes and metal porphyrins contributed toemulsion stability. Bridie and coworkers (1980) studied emulsions in the same year and proposedthat the asphaltenes and waxes in the oil stabilized water-in-oil emulsions. The wax andasphaltene content of two test oils correlated with the formation of emulsions in a laboratory test.Mackay and coworkers hypothesized that emulsion stability was due to the formation of a film inoil that resisted water droplet coalescence (Mackay and Zagorski, 1981, 1982a, 1982b). Thenature of these thin films was not described, but it was proposed that they were caused by theaccumulation of certain types of compounds. Later work led to the conclusion that thesecompounds were asphaltenes and waxes. A standard procedure was devised for makingemulsions and measuring stability. This work formed the basis of much of the emulsionformation theory in the oil spill literature over the past two decades.
In 1983, Thingstad and Pengerud conducted photooxidation experiments and found thatphotooxidized oil formed emulsions (Thingstad and Pengerud, 1983). Nesterova and coworkers
600.431.050801.MFtrendsANSC.pdf

10
studied emulsion formation and concluded that it was strongly correlated with both theasphaltene and tar content of the oil and the salinity of the water with which it was formed(Nesterova et al., 1983). Mackay and Nowak studied emulsions and found that stable emulsionshad low conductivity and therefore a continuous phase of oil (Mackay and Nowak, 1984;Mackay, 1984). Stability was discussed and it was proposed that it was a function of oilcomposition, particularly waxes and asphaltenes. It was proposed that a water droplet could bestabilized by waxes, asphaltenes, or a combination of both. The viscosity of the resultingemulsions was correlated with water content.
Later work by the same group reported examination of Russian hypotheses that emulsionsare stabilized by colloidal particles that gather at the oil-water interface and may combine to forma near-solid barrier that resists deformation and thus water-water coalescence (Stiver et al.,1983). It was speculated that these particles could be mineral, wax crystals, aggregates of tar andasphaltenes, or mixtures of these. It was felt that asphaltenes were the most important of theseparticles and that they controlled the formation of all particles. A formation equation relating theasphaltene, paraffin, aromatic, and silica gel (resin) content was proposed, but it was later shownto be a poor predictor of oil emulsion tendencies.
Desmaison and coworkers conducted studies on Arabian crudes and noted that emulsionformation was correlated with two factors: photooxidation exposure and the amount ofasphaltenes in the oil (Desmaison et al., 1984). The photooxidation was found to occur on thearomatic fractions of the oil. Asphaltenes were found to become structured with time and thiswas associated with emulsion formation.
Miyahara (1985) reported that the stability of emulsions was primarily controlled by thecomposition of the oil, specifically that which resided in the hexane-insoluble fraction of the oil,but he did not define what this content was. Miyahara also reported that salt and freshwateremulsions were relatively similar in stability, although in one case the salt water emulsionappeared to be more stable.
Payne and Phillips (1985) reviewed the subject in detail and reported on their ownexperiments of emulsification with Alaskan crudes in the presence and absence of ice. Theirstudies showed that emulsions can form in an ice field, thus indicating that there was sufficientenergy in this environment and that the process could occur at relatively low temperatures.
Because of the many differing theories in the literature, many oil spill workers wereconfused about the stability, source of stability, and properties of water-in-oil emulsions.Furthermore, until about 1995, neither advanced rheological techniques nor other techniquessuch as dielectric studies were applied to emulsions.
Much of the information on emulsions available in the oil spill industry has been obtainedby practical studies in the laboratory or in the field. In the early 90s, Jenkins and coworkersstudied emulsions formed in the laboratory and concluded that the formation did not correlatewith previously established codes of properties, or with pour point, asphaltene, and wax contentsof the fresh oils (Jenkins et al., 1991). They suggest that, in the absence of any correlation, everyoil should be characterized using a standardized procedure in the laboratory.
Other examples of empirical studies include a two-year study conducted on emulsions byWalker (1993) at Warren Spring Laboratory in Britain in which approximately 40 North Seacrude oils were prepared and characterized in the laboratory. Some of these oils weresubsequently spilled at sea and some of their properties measured. Walker concluded that thelaboratory procedures did not result in emulsions similar to those found at sea, but also noted that
600.431.050801.MFtrendsANSC.pdf
11
there was a marked lack of characterization techniques to study emulsions.The same group participated in another field trial conducted in 1994 (Walker et al.,
1995). The correlation between parallel experiments, physical properties, and emulsioncharacteristics was poor. It was concluded that delays in sampling and analyses were partiallyresponsible for the poor results as well as the lack of standard measurement and characterizationtechniques. It was also noted that slight differences in release conditions resulted in majordifferences in slick behaviour. It was found that there must be a high level of energy foremulsions to form and that the oil must be weathered to a degree before release. Stability couldnot be characterized, but appeared to be a continuum through the process.
Sjöblom and coworkers surveyed several oils from the Norwegian continental shelf. Afterthe interfacially active fraction was removed from the oils, none would form water-in-oilemulsions (Sjöblom et al., 1990a, b, 1992a). Model emulsions could be made from the extractedinterfacially active fractions. Stability was gauged by measuring the separation of water overtime. Destabilization studies showed that the rigidity of the interfacial film or reaction with thefilm components are the principle methods of emulsion breakdown. Medium chain alcohols andamines destabilized emulsions the most.
In 1992, Friberg reviewed the stability of emulsions, noting that a primary measure ofstability is the separation into two phases (Friberg, 1992). Friberg noted the focus on two factors,the rheology of the continuous phase and the barrier between the dispersed droplets. It wasdemonstrated that an increase in viscosity of the continuous phase of the emulsion is not a viablealternative to increasing the halflife of the emulsion. Friberg noted that the continuous phasemust show a small yield value to demonstrate stability.
In 1994, Tambe and Sharma proposed a model for the stability of colloid-stabilizedemulsions (Tambe and Sharma, 1994). They noted that colloidal particles stabilize emulsionsboth by providing steric hindrance to drop-drop coalescence and by modifying the rheologicalproperties of the interfacial region. Tambe and Sharma also noted that the effectiveness ofcolloidal particles in stabilizing emulsions depends in part on the ability of these particles toreside at a state of equilibrium at the oil-water interface and showed that the adsorption ofparticles at the oil-water interface also affects the rheological properties of the interfacial region.If the concentration of the particles is high, the colloid-laden interface will exhibit viscoelasticbehaviour. In turn, viscoelastic interfaces affect emulsion stability by retarding the rate of filmdrainage between coalescing emulsion droplets and by increasing the energy required to displaceparticles from the contact region between water droplets and, in other words, by increasing themagnitude of the steric hindrance.
2.1 AsphaltenesMore than 30 years ago, it was found that asphaltenes were a major factor in emulsion
stability (Berridge et al., 1968). Specific roles of emulsions have not been defined until recently.The Sjöblom group in Norway defined the interfacial properties of asphaltenes in several localoffshore crudes (Nordli et al., 1991). Asphaltenes were separated from the oils using consecutiveseparations involving absorption to silica. Molecular weights ranged from 950 to 1,450 Daltons.Elemental analysis revealed that 99 mole % of the asphaltenes was carbon and hydrogen, whileup to 1% was nitrogen, oxygen, and/or sulphur. The films form monomolecular layers at theair/water interface. Aromatic solvents such as benzylalcohol strongly influence the asphaltenesand will destabilize water-in-oil emulsions. Asphaltenes were shown to be the agent responsible
600.431.050801.MFtrendsANSC.pdf

12
for stabilizing the Norwegian crudes tested.Workers in the same group separated resins and asphaltenes and studied the Fourier-
transform infrared spectrum and the emulsions formed by each fraction (Mingyuan et al., 1992).The asphaltenes were separated using pentane precipitations and the resins by desorption fromsilica gel using mixtures of benzene and methanol. The fractions were tested in model systemsfor their emulsion-forming tendencies. Model emulsions were stabilized by both asphaltene andresin fractions, but the asphaltene fractions were much more stable.
Acevedo and coworkers studied the interfacial behaviour of a Cerro Negro crude by aplanar rheology (Acevedo et al., 1993). Distilled water and salt water were used with a 30% anda 3.2% xylene-diluted crude. The elasticity and viscosity were obtained from creep compliancemeasurements. The high values of viscoelastic and elastic moduli were attributed to theflocculation of asphaltene:resin micelles at the interface. The high moduli were associated withthe elastic interface. In the absence of resins, asphaltenes were not dispersed and did not formstable interface layers and then, by implication, stable emulsions.
Mohammed and coworkers studied surface pressure, as measured in a Langmuir filmbalance, of crude oils and solutions of asphaltenes and resins (Mohammed et al., 1993a, 1993b).They found that the pseudo-dilational modulus has high values for low resin-to-asphaltene ratiosand low values for high resin-to-asphaltene ratios. They suggest that low resin-to-asphalteneratios lead to more stable emulsions and vice-versa.
Chaala and coworkers studied the flocculation and the colloidal stability of crudefractions (Chaala et al., 1994). Stability was defined as the differential in spectral absorptionbetween the bottom and top of a test vessel. The effects of temperature and additions of waxesand aromatics on stability were noted. Increasing both waxes and aromatics generally decreasedstability. Temperature increased stability up to 60 C and then stability decreased.o
In another study, the resins and asphaltenes were extracted from four crude oils byvarious means (Schildberg et al., 1995). It was found that different extraction methods resulted indifferent characteristics as measured by FT-IR spectroscopy as well as different stabilities whenthe asphaltenes and resins were used as stabilizers in model systems. It was concluded that theinterfacially active components in crude oil were interacting and were difficult to distinguish.Both the resins and asphaltenes appeared to be involved in interfacial processes.
Urdahl and Sjöblom (1995) studied stabilization and destabilization of water-in-crude oilemulsion. It was concluded that indigenous, interfacially active components in the crude oils areresponsible for stabilization. These fractions would be the asphaltenes and resins. Model systemsstabilized by extracted interfacially active components had stability properties similar to thecrude oil emulsions. The same group studied the ageing of the interfacial components (Sjöblomet al., 1995). Resins and asphaltenes were extracted from North Sea crudes and exposed toageing under normal atmospheric and ultraviolet conditions. The FT-IR spectra show that thecarbonyl peak grew significantly as indicated by the C=C mode. Spectra also showed thatcondensation was occurring. The interfacial activity increased in all fractions as the ageingprocess proceeded. In the case of two crude oils, the ageing was accompanied by an increase inthe water/oil emulsion stability.
McLean and Kilpatrick (1997a) studied asphaltene aggregation in model emulsions madefrom heptane and toluene. The resins and asphaltenes were extracted from four different crudeoils - two from Saudia Arabia, Alaskan North Slope, and San Joaquin Valley crudes. Theasphaltenes were extracted using heptane and the resins using open-column silica columns.
600.431.050801.MFtrendsANSC.pdf

13
Asphaltenes dissolved in heptol consisting of only about 0.5% asphaltenes generated more stableemulsions than those generated by the originating crude oils. Although some emulsions could begenerated using resins, they were much less stable than those generated by asphaltenes. Themodel emulsions showed that the aromaticity of the crude medium was a prime factor. This wasadjusted by varying the heptane:toluene ratio. It was also found that the concentration ofasphaltenes and the availability of solvating resins were important. The model emulsions weremost stable when the crude medium was from 30 to 40% toluene and with low resin:asphalteneratios.
McLean and Kilpatrick (1997b) put forward the thesis that asphaltenes were the mosteffective in stabilizing emulsions when they are near the point of incipient precipitation. It wasnoted that there are specific resin-asphaltene interactions, as differing combinations yieldeddifferent results in the model emulsions. The resins and asphaltenes were characterized byelemental and neutron activation analyses. The most effective emulsion stabilizers of the resinsand asphaltenes were the most polar and the most condensed. McLean and Kilpatrick concludedthat the solubility state of asphaltenes is the most significant factor in emulsion formation.
In 1998, Mouraille and coworkers studied the stability of emulsions usingseparation/sedimentation tests and high voltage destabilization. It was found that the mostimportant factor was the stabilization state of the asphaltenes. The wax content did not appear toaffect the stability except that a high wax content displayed a high temperature dependence.Resins affected the solubilization of the asphaltenes and thus indirectly, the stability.
In the same year, McLean and coworkers reviewed emulsions and concluded that theasphaltene content is the single most important factor in the formation of emulsions (McLean etal., (1998). Even in the absence of any other synergistic compounds, i.e., resins, waxes, andaromatics, asphaltenes were found to be capable of forming rigid, cross-linked, elastic filmswhich are the primary agents in stabilizing water-in-crude oil emulsions. It was noted that theexact conformations in which asphaltenes organize at oil-water interfaces and the correspondingintermolecular interactions have not been elucidated. McLean and colleagues suggest that theintermolecular interactions must be either B-bonds between fused aromatic sheets, H-bondsmediated by carboxyl, pyrrolic, and sulfoxide functional groups, or electron donor-acceptorinteractions mediated by porphyrin rings, heavy metals, or heteroatomic functional groups.
It is suggested that specific experimental designs to test these concepts are needed tounderstand the phenomenon on a molecular level. Such knowledge would aid in the design ofchemical demulsifiers. The oleic medium plays an important role in the surface activity ofasphaltenic aggregates and in the resulting emulsion stability. It is noted that the precise role ofwaxes and inorganic solids in either stabilizing or destabilizing emulsions is not known.Emulsions are stabilized primarily by rigid, elastic asphaltenic films.
Recently, Singh and coworkers studied the effect of the fused-ring solvents includingnaphthalene, phenanthrene, and phenanthridine in destabilizing emulsions (Singh et al., 1999).They note that the primary mechanism for emulsion formation is the stability of asphaltene filmsat the oil-water interface. They suggest that the mechanism is one in which planar, disk-likeasphaltene molecules aggregate through lateral intermolecular forces to form aggregates. Theaggregates form a viscoelastic network after absorption at the oil-water interface. The network issometimes called a film or skin and the strength of this film correlates with emulsion stability.The strength of the film can be gauged by shear and elastic moduli. Singh and coworkers probedthe film-bonding interactions by studying the destabilization by aromatic solvents (Singh et al.,
600.431.050801.MFtrendsANSC.pdf
14
1999). It was found that fused-ring solvents, in particular, were effective in destabilizingasphaltene-stabilized emulsions. It is suggested that both B-bonds between fused aromatic sheetsand H-bonds play significant roles in the formation of the asphaltene films.
Sjöblom and coworkers (1999) used dielectric spectroscopy to study emulsions over aperiod of years. It is concluded that the asphaltenes, not the resins, are the stabilizing fraction inwater-in-oil emulsions. It was noted, however, that some resins must be present to give rise tostability. It is suggested that the greater mobility of the resins is needed to stabilize the emulsionsuntil the asphaltenes, which migrate slowly, can align at the interface and stabilize the emulsions.
2.2 ResinsNeuman and Paczynska-Lahme (1996) studied the stability of petroleum o/w emulsions
and found that they are stabilized by ‘thick films’ which appeared to be largely composed ofpetroleum resins. These thick films demonstrate elasticity and thus increase stability.Temperature increases showed increasing structure formation of the films. Isolated petroleumresins showed structure formation as well.
Rønningsen and coworkers studied the ageing of crude oils and its effect on the stabilityof emulsions (Rønningsen et al., 1995). The oil was exposed to air and light and it was found thatthe interfacial tension of the oil towards formation water decreased as a result of the ageing. Thiswas caused by the formation of various oxidation products, mainly carbonyl compounds. Ingeneral, the emulsions became more stable. In some cases, however, the opposite was observed,namely, that although the interfacial tension was high, the emulsion stability was lower,presumably because new compounds with less beneficial film properties are formed. Presumably,the compounds that were formed could be loosely classified as resins.
2.3 WaxesJohansen and coworkers studied water-in-crude oil emulsions from the Norwegian
continental shelf (Johansen et al., 1988/89). The crudes contained a varying amount of waxes (2to 15%) and few asphaltenes (0 to 1.5% by weight). Emulsion stability was characterized byvisual inspection as well as by ultracentrifugation at 650 to 30,000 g. Mean water droplet sizes of10 to 100 :m were measured in the emulsions. It was found that higher mixing rates reduced thedroplet size and a longer mixing time yielded a narrow distribution of droplet size. The emulsionstability correlated with the emulsion viscosity, the crude oil viscosity, and the wax content.
McMahon (1992) studied the effect of waxes on emulsion stability as monitored by theseparation of water over time. The size of the wax crystals showed an effect in some emulsionsbut not in others. Interfacial viscosity indicated that the wax crystals form a barrier at thewater/oil interface that retards the coalescence of colliding water droplets. Studies withoctacosane, a model crude oil wax, show that a limited wax/asphaltene/resin interaction occurs.A wax layer, even with absorbed asphaltenes and resins, does not by itself stabilize an emulsion.McMahon concludes that the effect of wax on emulsion stability does not appear to be throughaction at the interface. Instead, the wax may act in the bulk oil phase by inhibiting film thinningbetween approaching droplets or by a scavenging demulsifier. It was found that the asphaltenesand resins affected stability via interfacial action and are primarily responsible for the emulsionformation.
Puskas and coworkers extracted paraffinic deposits from oil wells and pipelines. Thishydrophobic paraffin derivative had a high molar mass and melting point and contained polar end
600.431.050801.MFtrendsANSC.pdf
15
groups (carbonyls) (Puskas et al., 1996). This paraffinic derivative stabilized water-in-oilemulsions at concentrations of 1 to 2%.
3. Methodologies for Studying Emulsions3.1 Dielectric
Dielectric spectroscopy is one of the methods used to study emulsions. The permittivityof the emulsion can be used to characterize an emulsion and assign a stability (Sjöblom et al.,1994, 1997, 1999; Sjöblom and Førdedal, 1996; Førdedal et al., 1996a; Gestblom et al., 1994;Skodvin et al., 1994a, b; Skodvin and Sjöblom, 1996).
The Sjöblom group has measured the dielectric spectra using the time domainspectroscopy (TDS) technique. A sample is placed at the end of a coaxial line to measure totalreflection. Reflected pulses are observed in time windows of 20 ns, Fourier-transformed in thefrequency range from 50 MHz to 2 Ghz, and the complex permittivity calculated. Water or aircan be used as reference samples. The total complex permittivity at a frequency (T) is given by:
swhere: , is the static permittivity,
N, is the permittivity at high frequencies,T is the angular frequency, andJ is the relaxation time.
The measuring system used by the Sjöblom group includes a digital sampling oscilloscopeand a pulse generator. A computer is connected to the oscilloscope and controls the measurementtiming as well as performing the calculations.
The data are used to indicate stability and the geometry of the droplets. Flocculation of theemulsion can be detected. In tests of flowing and static emulsions, it was shown that the flowingemulsions have lower static permittivities, which was interpreted as indicating flocculation in thestatic emulsions (Skodvin et al., 1994a).
Skodvin and Sjöblom (1996) used dielectric spectroscopy in conjunction with rheology tostudy a series of emulsions. A close connection was found between the viscosity and dielectricproperties of the emulsions. The large effects of shear on both the static permittivity and thedielectric relaxation time for the emulsion was ascribed, at least in part, to the degree offlocculation in the emulsion system. At high shear rates, at which emulsions are expected to havea low degree of flocculation and high stability, the dielectric properties still varied from thoseexpected from a theoretical model for spherical emulsion droplets.
Førdedal and coworkers used dielectric spectroscopy to study several real crude oilemulsions and model systems stabilized with either separated asphaltenes and resins from crudeoil or by commercial surfactants (Førdedal et al., 1996a,b). Emulsions could be stabilized by theasphaltene fraction alone, but not by the resin fraction alone. A study of a combination ofmixtures shows an important interaction between emulsifying components. Førdedal andcoworkers used dielectric spectroscopy to study model emulsions stabilized by asphaltenesextracted from crude oils. Analysis showed that the choice of organic solvent and the amount ofasphaltenes, as well as the interaction between these variables, were the most significantparameters for determining the stability of the emulsions.
600.431.050801.MFtrendsANSC.pdf
16
Ese and coworkers found similar results on model emulsions stabilized with resins andasphaltenes extracted from North Sea oil (Ese et al., 1997). The dielectric spectroscopy resultsshowed that the stability of model emulsions could be characterized. Stability was found todepend mainly on the amount of asphaltenes, the degree of aging of asphaltenes and resins, andthe ratio between asphaltenes and resins.
3.2 RheologyIn 1983, Steinborn and Flock studied the rheology of crude oils and water-in-oil emulsions
(Steinborn and Flock, 1983). Emulsions with high proportions of water exhibited pseudo-plasticbehaviour and were only slightly time-dependent at higher shear rates. Omar and coworkers alsomeasured the rheological characteristics of Saudi crude oil emulsions (Omar et al., 1991). Non-Newtonian emulsions exhibit pseudo-plastic behaviour and followed a power-law model.Mohammed and coworkers studied crude oil emulsions using a biconical bob rheometersuspended at the interface (Mohammed et al., 1993b). More stable emulsions displayed aviscoelastic behaviour and a solid-like interface. Demulsifiers changed the solid-like interfaceinto a liquid one.
Tadros (1994) summarized the fundamental principles of emulsion rheology. Emulsionsstabilized by surfactant films (such as resins and asphaltenes) behave like hard spheredispersions. These dispersions display viscoelastic behaviour. Water-in-oil emulsions show atransition from a predominantly viscous to a predominantly elastic response as the frequency ofoscillation exceeds a critical value. Thus, a relaxation time can be determined for the system,which increases with the volume fraction of the discontinuous phase. At the critical value, thesystem shows a transition from predominantly viscous to predominantly elastic response. Thisreflects the increasing steric interaction with increases in volume of the discontinuous phase.
In 1996, Pal studied the effect of droplet size and found it had a dramatic influence onemulsion rheology (Pal, 1996). Fine emulsions have much higher viscosity and storage modulithan the corresponding coarse emulsions. The shear thinning effect is much stronger in the caseof fine emulsions. Water-in-oil emulsions age much more rapidly than oil-in-water emulsions.More recently, Lee and coworkers and Aomari and coworkers examined model emulsions andfound that a maximum shear strain existed that occurred around 100 s (Lee et al., 1997; Aomari-1
et al., 1998).
3.3 Nuclear Magnetic Resonance (NMR)Urdahl and coworkers studied crude oils and the silica-absorbed compounds (asphaltenes
and resins) using C Nuclear Magnetic Resonance (NMR) techniques (Urdahl et al., 1992). It13
was found that the asphaltenes and resins are enriched in condensed aromatics compared to thewhole crude oils. There was strong indications of a long, straight-chain aliphatic compoundcontaining a heteroatom substituent which is abundant in paraffinic oils. There was also reason tobelieve that this compound was active in the formation of stable water-in-crude oil emulsions.The range from 130 to 210 ppm in the C NMR was of particular interest as this region13
represents quaternary aromatic and heteroatom-bonded carbons.Balinov and coworkers studied the use of C NMR to characterize emulsions using the13
NMR self-diffusion technique (Balinov et al., 1994). The technique uses the phase differences inconsecutive pulses to measure the diffusion length of the target molecules. As such, thetechnique indicates the relative particle size in an emulsion. The NMR technique was compared
600.431.050801.MFtrendsANSC.pdf

17
to optical microscopy and showed good correlation over several experiments involving ageingand breaking of the emulsions.
LaTorraca and coworkers used proton NMR to study oils and emulsions (LaTorraca, 1998).They found that the amount of hydrogen was inversely proportional to the viscosity. The amountof water could be determined in an emulsion because of the separation downfield of the protonon water and on hydrocarbons. The viscosity and water content of emulsions could besimultaneously determined.
3.4 Interfacial StudiesSjöblom and coworkers studied model emulsions stabilized by interfacially active fractions
from crude oil (Sjöblom et al., 1992a). A good correlation was found between interfacial pressureof the fractions, as measured in a Langmuir trough, and the stability of emulsions as measured bythe amount of water separated with time. Surface tension, as measured by the drop volumemethod, did not show a surfactant-like behaviour for the asphaltenes and resins.
Børve and coworkers studied the pressure-area isotherms and relaxation behaviour in aLangmuir trough (Børve et al., 1992). In one study, model polymers, styrene, and allyl alcohol(PSAA, molecular weight 150 g mol ) and mixtures of PSAA with 4-hexadecylaniline or-1
eicosylamine were used as comparative polymers to the natural surfactants in oils. The mixturesof PSAA with the amines reproduce the B-A isotherms and relation properties shown by theinterfacially active fractions of crude oils. The main difference was found to be a lowermaximum compressibility and a higher surface activity. The crude oil fractions are well modelledby a relatively low-molecular weight aromatic, weakly polar, water-insoluble hydrocarbonpolymer to which long-chain amines have been added.
In a similar study, Ebeltoft and coworkers mixed surfactants (sodium dodecylsulphate, andcetyltrimethlyammonium bromide or cetylpyridinium chloride) with PSAA and studied thepressure-area isotherms (Ebeltoft et al., 1992). All the surfactants appeared to interact with thePSAA and in similar ways. It was concluded that PSAA monolayers are good models foremulsion-stabilizing monolayers in Norwegian crude oils. Monolayers of both PSA and crude oilinterfacially active fractions responded similarly to the presence of ionic surfactants, indicatinganalogous dissolution mechanisms.
Hartland and Jeelani (1994) performed a theoretical study of the effect of interfacial tensiongradients on emulsion stability. Dispersion stability and instability were explained in terms of asurface mobility that is proportional to the surface velocity. When the interfacial tension gradientis negative, the surface mobility is negative under some conditions, which greatly reduces thedrainage so that the dispersion is stable. This is a normal situation as surfactant is present at theinterface. Demulsifier molecules penetrate the interface within the film, thereby lowering theinterfacial tension sufficiently and causing a positive interfacial tension gradient. Drainage issubsequently increased and the emulsion becomes unstable.
Ese and coworkers studied the film-forming properties of asphaltenes and resins using aLangmuir trough (Ese et al., 1998). Asphaltenes and resins were separated from different crudeoils. It was found that the asphaltenes appear to pack closer at the water surface and form a morerigid surface than the resins. The size of asphaltene aggregates appears to increase when thespreading solvent becomes more aliphatic and with increasing asphaltene bulk concentration.Resin films show high compressibility, which indicates a collapse of the monomolecular film. Acomparison between asphaltenes and resins shows that resins are more polar and do not
600.431.050801.MFtrendsANSC.pdf
18
aggregate to the same extent as the asphaltenes. Resins also show a high degree of sensitivity tooxidation. When resins and asphaltenes are mixed, resins begin to dominate the film propertieswhen resins exceed about 40 wt %.
3.5 Physical Studies - Structure and Droplet SizesEley and coworkers studied the size of water droplets in emulsions using optical
microscopy and found that the droplet sizes followed a log-normal distribution (Eley et al.,1988). The number mean diameters of the droplets varied from about 1.4 to 5.6 :m. Paczynska-Lahme (1990) studied several mesophases in petroleum using optical microscopy. Petroleumresins showed highly organized laminar structures and water-in-oil emulsions were generallyunstructured but sometimes hexagonal.
Toulhoat and coworkers studied asphaltenes extracted from crude oils of various originsusing atomic-force microscopy (Toulhoat et al., 1994). The asphaltenes were dried onto freshlycleaved mica and in some cases were present in discoids of approximately 2 nm × 30 nm. It wasnoted that these dimensions were similar to those measured using neutron scattering ofasphaltenes in solvents. An increase in discoid size was observed with increasing sulphur contentof the asphaltenes, but no correlation in size was observed with increasing asphaltene molecularweight. Absorption of asphaltenes from unfiltered solutions revealed fractal-like asphalteneclusters a few micrometers long, 1 :m wide, and 10 to 20 m thick.
Balinov and coworkers studied the use of C NMR to characterize emulsions using the13
NMR self-diffusion technique and compared this to optical microscopy (Balinov et al., 1994).The optical microscopy showed an average droplet size of about 4 :m with a volume mean ofapproximately 8 :m (estimated by the present author).
Eley and coworkers studied the formation of emulsions and found that the rate was firstorder with respect to stirring time (Eley et al., 1988). As the asphaltene content increased, the rateconstant decreased.
3.6 Recent Studies on Stability ClassesThe most important characteristic of a water-in-oil emulsion is its ‘stability’. The reason for
this is that one must first characterize an emulsion as stable (or unstable) before one cancharacterize its properties. Properties change significantly for each type of emulsion. Untilrecently, emulsion stability has not been defined (Fingas et al., 1995). Studies were thereforedifficult because the end points of analysis were not defined.
This section summarizes studies to measure the stability of water-in-oil emulsions anddefine characteristics of different stability classes. Four ‘states’ in which water can exist in oilwill be described. These include: stable emulsions, meso-stable emulsions, unstable emulsions(or simply water and oil), and entrained water. These four ‘states’ are differentiated by visualappearance as well as by rheological measures.
Studies in the past three years have shown that a class of very ‘stable’ emulsions exists,characterized by their persistence over several months. The viscosity of these stable emulsionsactually increases over time. These emulsions have been monitored for as long as 3 years in thelaboratory. ‘Unstable’ emulsions do not show this increase in viscosity and their viscosity is lessthan about 20 times greater than the starting oil. The viscosity increase for stable emulsions is atleast three orders-of-magnitude more than the starting oil.
600.431.050801.MFtrendsANSC.pdf

19
Fingas and coworkers have studied emulsions for many years (Bobra et al., 1992; Fingas et al.,1993, 1995, 1996, 1997, 1998, 1999, 2000a, 2000b, 2001a, 2002b; Fingas and Fieldhouse, 1994).The last two of these references as well as Fingas et al. (1995) describe studies to define stability.The findings of these earlier studies are summarized here. Both on the basis of the literature andexperimental evidence, it was concluded that certain emulsions can be classed as stable. Some, ifnot all or many, stable emulsions increase in apparent viscosity with time, i.e., their elasticityincreases. It is suspected that the stability derives from the strong viscoelastic interface caused byasphaltenes, perhaps along with resins. Increasing viscosity may be caused by increasingalignment of asphaltenes at the oil-water interface.
Meso-stable emulsions are emulsions that have properties between stable and unstableemulsions (really oil/water mixtures) (Fingas et al., 1995). It is suspected that meso-stableemulsions either lack sufficient asphaltenes to render them completely stable or still contain toomany destabilizing materials, perhaps some aromatics and aliphatics. The viscosity of the oil maybe high enough to stabilize some water droplets for a period of time. Meso-stable emulsions maydegrade to form layers of oil and stable emulsions. Meso-stable emulsions can be red or blackand are probably the most commonly formed emulsions in the field.
Unstable emulsions are those that decompose (largely) to water and oil rapidly aftermixing, generally within a few hours. Some water, usually less than about 10%, may be retainedby the oil, especially if the oil is viscous.
The most important measurements to characterize emulsions are forced oscillationrheometry studies. The presence of significant elasticity clearly defines whether a stable emulsionhas been formed. The viscosity by itself can be an indicator of the stability of the emulsion,although it is not necessarily conclusive unless one is absolutely certain of the viscosity of thestarting oil. Colour is an indicator, but may not be definitive. This laboratory’s experience is thatall stable emulsions were reddish. Some meso-stable emulsions had a reddish colour andunstable emulsions were always the colour of the starting oil.
Water content is not an indicator of stability and is error-prone because of ‘excess’ waterthat may be present. It should be noted, however, that stable emulsions contain more than 70%water and unstable emulsions or entrained water-in-oil generally contain less than 50% water.Water content after a period of about one week is found to be more reliable than initial watercontent because separation will occur in emulsions that are less stable.
4. Emulsion Formation ModellingThe early emulsion formation theories were translated into modelling equations at that
time. Unfortunately, the processes described above were not apparent until about 10 years agoand have not yet been translated into modelling equations. Furthermore, the presence of differentwater-in-oil states dictates that one simple equation is not adequate to predict formation. Information on the kinetics of formation at sea and other modelling data was less abundant in thepast than it is now. It is now known that emulsion formation is a result of surfactant-likebehaviour of the polar asphaltene and resin compounds. These are similar compounds and bothbehave like surfactants when they are not in solution, but asphaltenes form much more stableemulsions. Emulsions begin to form when the above chemical conditions are met and when thereis sufficient sea energy.
In the past, the rate of emulsion formation was assumed to be first-order with time. Thiscan be approximated with a logarithmic (or exponential) curve. Although not consistent with the
600.431.050801.MFtrendsANSC.pdf
20
knowledge of how emulsions formed, this assumption has been used extensively in oil spillmodels. Most models that incorporate the phenomenon use the estimation technique developedby Mackay and coworkers (Mackay and Zagorski, 1982a,b; Mackay et al., 1980a,b, 1982) or avariation of this.
Mackay suggested an equation to model water uptake:
a b)W = K (U + 1) (1 - K W))t, (2)2
where: )W is the water uptake rate, W is the fractional water content,
aK is an empirical constant,U is the wind speed,
bK is a constant with the value of approximately 1.33, andt is time.
Because eqn (1) predicts that most oils will form emulsions rapidly given a high windspeed, most users have adjusted the equation by changing constants or the form slightly.
Mackay and Zagorski (1982a,b) proposed two relationships to predict the formation ofemulsions on the sea. They proposed that the stability could be predicted as follows:
where: S is the stability index in relative units, high numbers indicate stability,
a x is the fraction of asphaltenes,
a( is the activity of asphaltenes,
aoK is a constant which here is 3.3,
wx is the fraction of waxes,
awK is a constant which is 200 at 293 K, andT is the temperature in kelvin.
Water uptake was given as:
T L s)W = )W + )W
f l l= )T[k -k W ], (4)
Twhere: )W is the total change in water content,
L)W is the change in water content for large droplets,
s)W is the change in water content for small droplets,
f l)T is time, k is the rate constant for formation, typically 1 h , k is the rate constant for-1
large droplet formation and is about 3 h , and-1
lW is the fraction of large droplets which is typically 3 to 4.Kirstein and Redding (1988) used a variation of the Mackay equation to predict
emulsification:
600.431.050801.MFtrendsANSC.pdf

21
2where: k is a coalescing constant which is the inverse of the maximum weight fraction waterin the mixture,W is the weight fraction water in the mixture,
1k is the Mooney constant which is 0.62 to 0.65,
5k is the increase in mousse formation by weathering,
3k is the lumped water incorporation rate constant and is a function of wind speed inknots, andt is the time in days.
The change in viscosity due to mousse formation was given by:
where: : is the resulting viscosity,
0: is the viscosity of the starting oil, andthe remainder are identical to the above.
Reed (1989) used the Mackay equations in a series of models. The constants were adjustedto correspond to field observations:
wcwhere: dF /dt is the rate of water incorporation,W is the wind speed in m/s,
wcF is the fraction of water in oil, and
3C is the rate constant equal to 0.7 for crude oils and heavy fuel oils.The viscosity of the emulsion was predicted using the following variant of the Mooney
equation:
where: : is the viscosity of the mixture,
0: is the viscosity of the starting oil, and
wcF is the fraction of water in oil.The effect of evaporation on viscosity is modelled as:
0 4 evap: = : exp (C F ), (9)
where: : is the viscosity of the mixture,
0: is the viscosity of the starting oil,
4C is a constant which is 1 for light fuels and 10 for heavy fuels, and
600.431.050801.MFtrendsANSC.pdf
22
evapF is the fraction evaporated from the slick. All of the above work has a basis in the Mackay equations, which were developed beforeextensive work on emulsion physics took place. The present author suggests that both thetendency and the formation of emulsions could be predicted with a greater degree of accuracyusing empirical data as described below.
4.1 Fingas 2001 ModelIn 2001, Fingas proposed that a characteristic table be used to predict the formation of
water-in oil emulsions (Fingas et al., 2001a, b). A table of threshold properties relevant topredicting the formation of emulsions is used. Starting at the bottom of this table, it is presumedthat unstable emulsions are the most common state, which they are. The properties of the oil arethen compared, up to the final state or stable emulsions. The properties of the starting oil changeas it weathers and most models already incorporate formulae to estimate density and viscosity asthe oil weathers. Since resins and emulsions do not evaporate, it can be presumed that theyincrease proportionately to the loss by weathering. For example, if an oil containing 5% resinsand 5% asphaltenes weathers to 50%, the resin content is now 10% and the asphaltene content is10% as well.
4.2 Fingas 2004 ModelIn 2004, Fingas proposed a continuous model to predict any of the four emulsion states
(Fingas and Fieldhouse, 2004a,b,c). The formation data were used to develop mathematicalcorrelation equations. The value for each parameter was correlated in a series of models usingDataFit (Oakdale Engineering), which calculates linear models. A two-step process wasnecessary as DataFit is not able to calculate the specific mathematical function with more than 2variables due to the large number of possibilities. Thus, the function, e.g., linear, square, log,were calculated using a two-way regression (TableCurve) and these functions were in turn usedto develop a predictor model for emulsification.
The steps to produce the model are summarized here. First the parameters available werecorrelated one at a time. Regression coefficients were optimized by adjusting the class criteriafrom a starting value of 1 to 4 to a logarithm of this value. This was performed on a trial-and-error basis to yield the highest regression coefficient. The resulting criteria are: - 0.22 is unstable,0.69 is entrained, 1.1 is meso-stable, and 1.38 is stable. Several of these parameters can have azero value which causes calculation problems. If this is the case, the 0 is adjusted to either deletethese values or to adjust it to the typical high value for the parameter. This is called the ‘firsttransform’. A second transformation is performed to adjust the data to a singular increasing ordecreasing function. Most parameters have an optimal value with respect to class, that is thevalues have a peak function with respect to stability or class.
This is illustrated in Figure 1 and Figure 2. The resin content without any adjustment isplotted against the stability in Figure 1. As can be seen in this figure, the values of stability peakat about 5% resins. After this correction is made to the values, the regression coefficientincreases. The modified distribution is shown in Figure 2. The arithmetic converts values in frontof the peak to values behind the peak, thus yielding a singular declining or increasing function.The optimal value of this manipulation is found by trial and error, beginning with the estimatedpeak from the first correlation such as can be seen in Figure 1. The arithmetic to perform thismanipulation is: if the initial value is less than the peak value, then the adjusted value is the peak
600.431.050801.MFtrendsANSC.pdf

23
value less the initial value, and if the initial value is more than the peak value, the adjusted valueis the initial value less the peak value. The peak values are shown as the ‘second transform’value.
The values of the second correction were then correlated using the package Data Fit.Several models were developed. It had been noted in earlier work that heavy oils were somewhatdifferent in emulsion formation than were light oils (Fingas and Fieldhouse, 2003). For thisreason, trial models were created separately for light and heavy oils. These were actually poorerthan the other combined models and so ultimately were not used. The best model was one thatincluded only five parameters: density, viscosity, saturates, resins, and asphaltenes. It was foundthat the regression coefficients of class with aromatic content, asphaltene/resin ratio, and waxeswere too low to include in the model. It should be noted that there are some problems with thefundamental process of categorizing water-in-oil states at the onset. Some crude oils areenhanced when emulsion preventors, also called asphaltene suspenders, are added directly at thewell-head because they are very emulsion-prone. Some emulsion-prone oils may therefore notform emulsions during the laboratory or field tests because of these emulsion-preventingmaterials. Although attempts are made to obtain oils that do not contain these emulsion-preventing materials, it is impossible to know this fact in every case.
The oils and resulting water-in-oil states used for this correlation were studied to yield theaverage water content and increase in the viscosity from the starting oil to the water-in-oil class.This will be used to predict the water content and the viscosity, given the known class of water-in-oil mixture formed.
The kinetics of emulsion formation have been studied and data are available to computethe time to formation. A kinetics study has shown the times to formation for stable emulsions areparticularly rapid and that of entrainment is also rapid - both in a matter of minutes (Fingas et al.,2000b). This study yields data in terms of relative formation time and energy (rpm) of the mixingapparatus. This particular data set is thought to be especially accurate. A study in a large test-tankhas yielded data on the formation time of the various water-in-oil states (Fingas et al., 2002b).The data of the relative formation times and the wave height are available. The average data over25 runs was used to make the calculations. The formation time is taken as that time at which 75%of the maximum stability measured occurs. The conditions under which these tests took placeand the measurements taken are described in the literature (Fingas et al., 2002b). The waveheight for each experiment was measured and used to indicate relative sea energy, taken for afully developed sea. The laboratory data was converted from relative rotational energy to waveheight by equating formation times and then using this multiplier to calculate the equivalentwave height. Formulae were fitted to each of the three categories and the common formulaamong all three relevant classes, was found to be 1/x . Application of the equations will then1.5
provide a user with a time to formation of a particular water-in-oil state, given the wave height.The first step in using the model is to obtain or estimate the oil properties as they are at the
weathering condition of concern. The properties needed are the density, viscosity, and saturate,resin and asphaltene contents. These values require transformation as noted below.
Density - If the density is less than 0.96, then the density parameter is 0.96 less the densityand if it is greater than 0.96, it becomes the density less 0.96. The value used in the equation isthen the exponential of this transformed value. (10)
Viscosity - Take the natural logarithm (ln) of the viscosity. If the natural log of theviscosity is less than 7.7, then the viscosity parameter is 7.7 less the viscosity natural log and if it
600.431.050801.MFtrendsANSC.pdf
24
is greater than 7.7, it becomes the natural log of viscosity less 7.7. The value used in the equationis this transformed value. (11)
Saturate Content - If the saturate content (in percent) is less than 39, then the saturatecontent parameter is 39 less the saturate content and if it is greater than 39, it becomes thesaturate content less 39. The value used in the equation is this transformed value. (12)
Resin Content - If the value of the resins is zero, then set this value to 20. If the resincontent is less than 2.4, then the resin content parameter is 2.4 less the resin content and if it isgreater than 2.4, it becomes the resin content less 2.4. The value used in the equation is thenatural logarithm of this transformed value. (13)
Asphaltene Content - If the value of the asphaltene content is zero, then set the value to30. If the asphaltene content is less than 15.4, then the asphaltene content parameter is 15.4 lessthe asphaltene content and, if it is greater than 15.4, it becomes the asphaltene content less 15.4.The value used in the equation is then the exponential of this transformed value.
(14)The class of the resulting emulsion is then calculated as follows:
Class = -1.36 + 2.62*Dt - 0.18*Vt -0.01*St +0.02*Rt - 2.25 10 *At (15)-7
where: Class is the numerical index of classification,Dt is the transformed density as calculated in equation (10),Vt is the transformed viscosity as calculated in equation (11),St is the transformed saturate content as calculated in equation (12),Rt is the transformed resin content as calculated in equation (13), andAt is the transformed saturate content as calculated in equation (14).
The second step in calculating the emulsion formation and its properties is to apply thenumeric class value as yielded from equation (15). This is simply accomplished by usingTable1a.
The third step is to predict the properties of the resulting water-in-oil emulsion. Table 1bgives the average water content and increase in viscosity of the various types of emulsions.
The fourth step is to predict the time to formation after the oil is weathered to the statedpercentage. This calculation can be made using the equations given in Table 1c:
Time to formation (min) = a + b/Wh (16)1.5
where: a is a constant and is 27.1 for a stable emulsion formation, 47 for meso-stable, and30.8 for an entrained water-in-oil class,b is a constant and is 7,520 for a stable emulsion formation, 49,100 for meso-stable,and 18,300 for an entrained water-in-oil class, andWh is the wave height in cm.
4.3 Fingas 2005 ModelThe 2004 model was totally revised in 2005 to provide a model of greater accuracy (Fingas
and Fieldhouse, 2005). The development methodology was similar to that above. Themathematical procedures still required transformations of the data for the reasons stated above.
600.431.050801.MFtrendsANSC.pdf
25
These transformations of input values are summarized below. Density - If the density is less than 0.97, then the density parameter is 0.97, less the density
and, if it is greater than 0.97, it becomes the density, less 0.97. The value used in the equation isthis transformed value. (17)
Viscosity - Take the natural logarithm (ln) of the viscosity. If the natural log of theviscosity is less than 8.7, then the viscosity parameter is 8.7 less the viscosity natural log, and if itis greater than 8.7, it becomes the natural log of viscosity less 8.7. The value used in the equationis this transformed value. (18)
Resin Content - If the value of the resins is zero, then set this value to 20. If the resincontent is less than 5.4, then the resin content parameter is 5.4, less the resin content and if it isgreater than 5.4, it becomes the resin content, less 5.4. The value used in the equation is thistransformed value. (19)
Asphaltene Content - If the value of the asphaltene content is zero, then set the value to30. If the asphaltene content is less than 12, then the asphaltene content parameter is 12 less theasphaltene content and, if it is greater than 12, it becomes the asphaltene content less 12. Thevalue used in the equation is this transformed value. (20)
The class of the resulting emulsion is then calculated as follows:
Class = 0.738 - 0.197*Dt - 0.0126*Vt -0.0007*Rt - 0.00358*At (21)
where: Class is the numerical index of classification,Dt is the transformed density as calculated in equation (17),Vt is the transformed viscosity as calculated in equation (18),Rt is the transformed resin content as calculated in equation (19), andAt is the transformed asphaltene content as calculated in equation (20).
The second step in calculating the emulsion formation and its properties is to apply thenumeric class value as yielded from equation (21). This is simply accomplished by using Table 2.
The third step is to predict the properties of the resulting water-in-oil emulsion. Theaverage water contents and increase in viscosity are given in Table 2.
The fourth step is to predict the time to formation after the oil is weathered to the statedpercentage. This calculation can be made using the equations in Table 2:
Time to formation (min) = a + b/Wh (22)1.5
where: a is a constant and is 27.1 for a stable emulsion formation, 47 for meso-stable, and30.8 for an entrained water-in-oil class,b is a constant and is 7,520 for a stable emulsion formation, 49,100 for meso-stable,and 18,300 for an entrained water-in-oil class, andWh is the wave height in cm.
600.431.050801.MFtrendsANSC.pdf
26
5. Review of the “White Paper on Emulsification of ANS Oil” by S.L. RossThis section will focus on summarizing the report by S.L. Ross, emphasizing those areas
where there are issues of fact or procedure. As much of the report contains introductory orsummary material, this will not be dealt with here. When there are differences from the generalknowledge on oil properties as already noted, this will be highlighted by references to thespecific section in this review. The report will be referred to as the SLR report. Direct quotesfrom the report are shown in italics.
Page 3 - Evaporation - the report states: It is known that evaporation of an oil slick iscontrolled or affected by:1) the temperature of the oil and the air;2) the surface area of the oil in contact with air ; 3) the thickness of the oil;4) wind speed; and5) the concentration and vapor pressure of the individual components of the oil.
This is old boundary-layer regulation evaporation theory and does not reflect the newfindings on oil evaporation such as described in Fingas (2004). Nor is there mention of thenewer, more accurate findings noted in this paper or its references. The report goes on to list only1978, 1983, and 1984 references for evaporation behaviour. In fact, Fingas (2004) noted that, ofthe factors listed, only the temperature and the basic oil properties are factors and inclusion of theother factors, derived from water evaporation equations, lead to great inaccuracies in prediction.
Page 4 - Emulsification- The report does not cite any of the most important references onemulsification (over 50 references) noted in Section 2 of this review. Furthermore, it cites onlyreferences from 1990, 1991, and 1993 that are not part of the main stream of emulsificationtheory. It does not include references that are key to modern understanding of emulsification suchas those by Førdedal, Sjöblom, McLean, Kilpatrick, Fingas, Masliyah, and others in the peer-reviewed literature.
The report states: The mechanisms and rates of the emulsification of oils spilled at sea arestill poorly understood. Through some mechanism, the mixing energy associated with wavescauses small water droplets to become entrapped in the oil layer. Several theories have beenadvanced about the main chemical mechanisms involved in the process (Bobra 1990, 1991,Walker et al., 1993). Most experts believe that precipitates of asphaltenes and resins in the oilact as surface-active agents to stabilize the smaller water droplets in the forming emulsion.These natural surfactants form a "skin" around the smaller water droplets, preventing them fromcoalescing to form larger droplets. Without such stabilizing agents the small water droplets inthe oil layer would tend to combine into larger droplets that would sink through and leave the oilslick. An increase in the number of water droplets retained in the slick increases its viscosity,which in turn decreases the rate at which water droplets settle out, thus emulsification tends tooccur rapidly once the appropriate conditions for forming a stable emulsion are reached. In anycase, emulsification inhibits natural dispersion because the process greatly increases slickviscosity. Spills of some crude oils (generally those with higher concentrations of asphaltenesand resins) will start to form an emulsion within a few minutes of environmental exposure, andwill form a highly viscous and stable emulsion within hours. This has been recorded many timesduring actual and experimental spills. On the other hand, some crude oils must lose some oftheir lighter components through evaporation before the concentrations of their asphaltenes andresins are raised to the levels required to stabilize emulsions. Most refined petroleum products
600.431.050801.MFtrendsANSC.pdf
27
do not easily emulsify at all. This section is not entirely inaccurate but misses any relevant reference to the formation of
emulsions as noted in Section 2 of this review and other very extensive literature on this topic.Most of the discoveries have been after the references noted by the SLR report. The remainder ofthe paragraph is relatively correct, but lacks the detail to render it useful to the prediction orunderstanding of emulsification. The SLR report misses the absolutely critical factor that thereare four water-in-oil states, only two of which are emulsions.
Page 5 - Emulsification prediction - The report states: Oil spill emulsification is one of themost difficult processes to model or predict on a spill-specific basis. Except perhaps for a fewoils that have been tested extensively, such as ANS, it is virtually impossible to quantitativelypredict when a particular crude oil will start to emulsify once spilled in a particularenvironment, and, once the emulsification process begins, to predict how long it will take for thespilled oil to form a "stable", highly viscous emulsion. Nonetheless, modellers of spill behaviorhave to deal with the problem of spill emulsification because it is such an important process. Theusual tactic is to take advantage of a laboratory test, called the Mackay-Zagorski Test (Mackayand Zagorski, 1982) that was developed to measure (1) an oil's tendency to form an emulsionand (2) the stability of the emulsion once formed. The test provides some indication of an oil'semulsion forming characteristics, but does not predict rates of spill emulsification in the field.
This section misses the very important set of references by Fingas and Fieldhouse (2001,2004a,b,c, and 2005) on reviews of existing emulsification models and development of newmodels. Furthermore, very early after it was written, it was shown that there were severeproblems with the Mackay-Zagorski emulsification test and it was subsequently abandoned(Bobra et al., 1990). It must also be stated that this method has little to do with modelling, butwas only a proposed method to examine emulsion stability and has no predictive power.
Page 5 - Modelling - The report states: The major spill processes discussed above thatdetermine the behavior of oil spilled on water are interrelated and must be considered togetherto arrive at an accurate estimate of an oil's likely behavior. That is the purpose of oil spillbehavior models, of which there are several available internationally. Most are similar in manyways because they use similar mathematical algorithms in the structure of the models. For thiswork we have used the model developed by S. L. Ross Environmental Research Ltd., which isparticularly useful in this study because it is able to deal with high pour-point oils.
It should be noted that the S.L. Ross model is relatively unknown and unproven and is notdocumented at all in the peer-reviewed literature, while several other models are. The mostcommon models are the suite of models by Applied Science Associates (ASI) such as Oilmap,Simap, etc. As will be shown later in this review, the S.L. Ross paper does not contain anyalgorithms more recent than about 1985. The algorithms in the report are at least 20 years old andmany have been shown to be outdated and inaccurate.
The next item that stands out is the ‘high-pour point oils’. As noted in Section 1.3.1 on oilproperties in this review, pour point is a very poor descriptor of oils and should not be usedtoday.
Page 6 - Oil sample - The report states: One gallon of ANS crude oil was obtained fromthe Valdez Terminal in the spring of 2004 and shipped to the SL Ross laboratory in Ottawa.
It should be noted that the entire emulsification results in the S.L. Ross report are based onone sample. As noted in Section 1.3.1 of this review, the oil properties of any field system areconstantly changing and thus one sample may not be representative and can in no way be used to
600.431.050801.MFtrendsANSC.pdf

28
predict a trend.Page 6 - The report notes: A wind tunnel was used to determine the evaporative
characteristics of the ANS crude oil, and to prepare weathered samples for physical propertyanalysis. Three 900-mL samples of oil were withdrawn from the shipping container. One of thesewas reserved, while the remaining two were poured into shallow metal trays and placed in awind tunnel operating at a wind speed of approximately 3 m/s, and an air temperature ofapproximately 15/C. The initial thickness of oil in the trays was 2 cm. One sample was removedfrom the tunnel after two days, and the second after two weeks. Depending on the conditions at aspill site, this duration is typically equivalent to a few hours and a few days at sea.
The wind tunnel method is not an accurate method of weathering oil for the purposes ofstudying evaporation (Fingas, 1994). Furthermore, the relationship of this type of weathering to a‘few hours or a few days’ has never been established.
Page 7 - Table 1 - Analytical methods - It is stated that evaporation is performed by ASTMD86. This is not the method used in this study and the wind tunnel does not conform to anystandard.
The viscosity was purportedly measured by a Brookfield viscometer which is out of rangefor these measurements and is not shear-stress controlled (Wang et al., 2004).
The CSC DuNuoy ring tensiometer is a low-grade instrument and will yield poorrepeatability (Wang et al., 2004).
The pour point tests and the standard it refers to are highly questionable. The rotating flask apparatus noted (Mackay and Zagorski, 1982a,b) was never accepted
and was never a standard. As already stated, several references noted difficulties with this testvery soon after it was written.
Page 8 - Oil gelling - The SLR report states: It is this increase in pour point, and eventualgelling of the oil at freezing temperatures, that accounts for the higher stability, water content,and viscosity of the moderately stable emulsions created with the evaporated samples at 0/C asopposed to the unstable emulsions created at 15/C. At freezing temperatures, the oil, as itweathers, will gel when it reaches about 20% evaporated, trapping the low amounts of water ithas incorporated to this point. No further emulsification will occur once the oil has gelled, andthe encapsulated water drops will be trapped until the oil is heated above its pour point.
Oil does not gel, rather its viscosity increases with decreasing temperature. This statementis entirely spurious and is not backed by references. It is true that at lower temperatures,emulsions may be more prone to form, for different reasons. The correct process ofemulsification is described in Section 2 of this review.
Page 8 - Additions of demulsifier and gelling - The report states: In the original scope ofthis study, it was expected that a stable emulsion would indeed form. As such it was proposed toinvestigate the potential beneficial effects of adding demulsifying chemical. Because the oil didnot form a stable emulsion, this was examined only briefly, in two tests at 0/C and 15/C. Theaddition of demulsifier had no effect on the gelled “emulsion” at 0/C. It did resolve the lightemulsion created at 15/C; however, its use on such low water content, low viscosity mixtureswould not be justified.
There was no reason to expect that a stable emulsion would form, as literature on the topicindicated that meso-stable emulsions form (Fingas et al., 2001b). Part of the problem with thiswork is that the water-in-oil states created here are not characterized. The result of theexperiment was probably entrained water in oil, in which case de-emulsifier has no effect. Again,
600.431.050801.MFtrendsANSC.pdf

29
there is no such thing as ‘gelled oil’ or ‘gelled emulsion’.Page 9 - Table 3 - Spill-related properties - Evaporation was carried out as volume %. This
is an incorrect procedure as it results in inaccuracies due to adhesion of oil to vessel surfaces andthe change in density with weathering. The latter results in a change of volume that is difficult torelate to weight % weathering (Wang et al., 2004). Dynamic viscosity is given. This method isonly for fuels (Wang et al., 2004) and cannot be extended to denser crude oils. The distillation isalso given as ‘modified ASTM’, which is not ASTM as ASTM specifies very clearly that onlythe vapour temperature yields an accurate measurement (Wang et al., 2004). The weatheringmodel given is a Mackay model including three constants. Such a model does not yield accuratedata as will be shown later.
Page 10 - Formation of emulsions - The SLR report states: What was somewhatsurprising, and of particular interest to this study, was the fact that the oil was unlikely to form astable emulsion, even at 0/C when weathered up to 39% by volume. Previous analyses of ANScrude (SL Ross, 1994 and 1997, Jokuty et al., 1999) indicated that once approximately 20% ofthe light ends of ANS crude had evaporated, a stable emulsion would form. Potential reasons forthis difference are discussed below.
The Jokuty et al. report did not indicate the formation of emulsions to the stable state butrather to the meso-stable state and, for lighter weathering, to the unstable state. The literaturenever reported on a stable emulsion forming from ANS.
Page 10 - Changes in ANS crude oil properties over time - The SLR report states: The factthat the 2004-vintage ANS crude does not form a stable emulsion is likely due to continuingchanges in the characteristics of the “sales” oil as a result of an ever-changing blend of crudeoil feeds on the North Slope. ANS crude oil has been subjected to similar spill-related propertyanalysis over the last 20 years, and the results indicate a steady decline in both oil density andoil viscosity. Figure 3 shows a graph of the density and Figure 4 shows the oil's viscosity; bothare for fresh, unweathered ANS crude at 15/C, and data is shown from 1983 to the presentsample. Both density and viscosity have been decreasing significantly with the passage of time;presumably as more high API gravity crudes are added to the mixture at Pump Station 1. Figure5 is a similar graph showing the change in pour point over time for ANS crude. This graphindicates a significant decrease over time of the pour point up until the late 1990s, with anequally significant increase in more recent years.
These conclusions are drawn from unspecified sources, e.g., the sources of the density,viscosity, and pour point data in Figure 3, 4, and 5 of the SLR report are not specified. Figure 5of the SLR report shows the pour point. The above quote from the text indicates that the pourpoint is decreasing, however, this is not shown distinctly in Figure 5. Rather, Figure 5 shows whypour point is not a good value. As pour point can vary as much as 20 degrees with operator andtest conditions, Figure 5 is anomalous.
Page 11 - Model inputs - The slick is presumed to be 100 mm in thickness due tocontainment. This appears to be quite thick and would in reality certainly escape under the boom.
Page 12 - ADIOS Model - The SLR report states: Although many oil property predictionfeatures of the ADIOS 2.0 model are similar to those in the SL Ross model (note that ADIOS 2.0does not predict pour point), two differences are worthy of note. First, the ADIOS 2.0 model usesa pseudo-component approach to estimating evaporation rates (the oil is divided into tencomponents representing different boiling ranges and the evaporation rate of each is estimated),whereas the SL Ross model uses the analytical method (more simply, the crude is treated as one
600.431.050801.MFtrendsANSC.pdf
30
component with evaporation rates based on the slope and intercept of a modified ASTMdistillation curve - Stiver and Mackay, 1984).
The ADIOS model does not predict pour point for good reason. First, it is not a very usefulnumber and second it is unreliable. There is also good reason for using the pseudo-componentapproach as is done in the ADIOS model as it yields more realistic results than the ‘analytical’approach used in the S.L. Ross report. As will be seen later, neither model is as accurate as theempirical approach (Fingas, 2004).
Page 13 - Prediction on free-spreading oil - The SLR report states: The free-spreading155,000 bbl release is predicted to lose approximately 26% to evaporation in 72 hours, andemulsify to nearly 90% water content with a viscosity in excess of 100,000 mPas. This differencefrom the predicted behaviour of the contained slick is due to the difference in evaporation rate:the uncontained slick thins rapidly as it spreads and thus is predicted to evaporate much morequickly than the contained slick. The uncontained slick evaporates more than 18%, and ispredicted to emulsify; the contained slick never reaches 18% evaporated in the 72 hour modelingperiod.
The result that free-spreading oil achieves a weathering amount of 26% by volumewhereas a contained slick only weathers to 14% by volume is only an artefact of the predictionscheme used. As is explained in the literature, the use of a boundary-layer regulated modelderived from water evaporation inputs the wind and slick area (Fingas, 2004). However,extensive testing and measurement on actual spills shows that this is not the case and that slicksweather largely as a function of time and temperature (Fingas, 2004). While it is true that verythick slicks weather somewhat more slowly, this is a function of internal mass transfer ofvolatiles rather than a water-like evaporative behaviour (Berger and Mackay, 1994). Thus, thescenario differences between uncontained and contained slicks would not be much differentexcept for the fact that, for emulsification to occur, wave energy would be required. This isunlikely to be sufficient in a boomed area.
Page 13 - Discussion - The SLR report states: Both models predict that, in winterconditions, the contained slick of ANS crude would not evaporate to a great enough extent in 72hours to begin emulsifying. The SL Ross model indicates that the contained oil, even in winter atfreezing temperatures, would not evaporate enough to cause the pour point of the crude toexceed ambient temperatures, and commence gelling.
As already noted, this is an artefact of the evaporation model used and not a true physicaloutcome.
Page 13 - Discussion - The SLR report states: After the Exxon Valdez spill Allen (1991)observed that the slick was not significantly emulsified (20 to 30% water, based on the visualappearance of the slick and its ignition behavior during an in situ burning test) approximately 40hours after the incident. Winds in this time period were in the 10-knot and less range withtemperatures in the mid-30s/F. Within the next 24 hours, a storm passed through the area withwinds up to 70 knots that resulted in significant emulsification of the oil (USCG, 1993). Samplesof emulsion on the water collected two to three weeks after the spill had water contents in the 45to 70% range and viscosities at 38/C (100/F) in the 450 to 2700 mPas (cP) range (Payne et al.,1991).
Several issues are confused in this statement. As noted in Section 2 of this review, thereare four water-in-oil states: unstable, entrained water in oil, meso-stable, and stable emulsions.Only the latter two are emulsions. Most oils uptake water to some degree. Those that do not
600.431.050801.MFtrendsANSC.pdf
31
retain very much water or form emulsions are ‘unstable’. Those that retain about 30% water doso by viscous entrainment. This is not emulsification. Those oils that emulsify can form anemulsion that breaks down rapidly, form meso-stable emulsions within 3 days, and thoseemulsions that last for longer than about 30 days can be called stable (Fingas et al., 2002a). WhatAllen (1991) observed was entrained water or unstable water-in-oil. Note that no measurementwas carried out, only visual observation. Later sampling of the oil purportedly contained 45 to70% water. These states would have been either entrained water or meso-stable emulsions.Unfortunately, no time resolution tests or rheometric tests were carried out to confirm thesestates, although the existing data would indicate that both entrained water (for the 45% water and450 cP material) and meso-stable emulsions (for the 70% water and 2700 cP material) would bepossible. Both results would be consistent with laboratory findings (Fingas et al., 2002a).
Page 14 and on - Pumping – There are no comments on this section as the pumpingcalculations are more or less correct and deviations do not change the calculations thatsignificantly.
Page 16 and 17 references - The references used here are remarkably old and few. See thereferences for this review in Section 9.
Page 20 - Figure 5 and 6 - A change in pour point of fresh ANS and predicted evaporationfrom scenario 5 - Figure 5 illustrates why pour point should not be used as a predictor or anyparameter for oil behaviour. Its value increases or decreases regardless of the overall trend andmerely reflects the high variances in the measurement (plus or minus 10 to 20 degrees). Theevaporation curve in Figure 6 predicts a loss of about 15% (by volume, inappropriately)compared to an empirical result of 22% by weight (Fingas, 2004). This is typical of the older,inaccurate evaporation prediction methods.
Page 21 - Figures 7 and 8 - Predicted slick thickness - It is predicted that the slickthickness goes from 100 mm (set initially) down to 80 mm. This is based only on evaporationand changes in volume. As noted above, this is not an appropriate calculation. Furthermore,setting the thickness to that great a value, based on containment, is unlikely since such a highthickness could not be successfully contained (Fingas, 2000).The predicted emulsification is 0and, based only on water content, which is again inappropriate. The no-emulsification result iscorrect as there would be little energy to initiate emulsification.
Page 22 - Figures 9 and 10 - Predicted pour point and viscosity - These are based on asmooth increase function based on weathering. These are probably not accurate as will be shownin the analysis of the data in Section 6 of this review.
Page 23 - Figures 11 and 12 - Predicted evaporation and slick thickness for scenario 5 - Itshould be noted that all scenarios in this appendix are named as scenario 5. One presumes thatthe second one is the summer scenario. The predicted evaporation is about 18.5% by volume,compared to an empirical result of 30% by weight (Fingas, 2004). This is typical of the older,inaccurate evaporation prediction methods in that they typically under-predict the evaporation ofcrude oils and vastly over-predict the evaporation of diesel fuel. It is predicted that the slickthickness goes from 100 mm (set initially) down to about 80 mm. This is based only onevaporation and changes in volume, which is not an appropriate calculation. Furthermore, settingthe thickness to that great a value, based on containment, is unlikely since such a high thicknesscould not be successfully contained (Fingas, 2000).
Page 24 and 25 - Figures 13, 14, and 15 - These cover the water content of the slick andpredict pour point and viscosity. The same comments as noted above apply.
600.431.050801.MFtrendsANSC.pdf
32
Appendix A - Description of the SL Ross model - It might be noted that the model isbased on very old literature. An extensive body of new literature has superceded this olderliterature for most algorithms.
Appendix B - ANS 2004 Crude Analysis Page 2-1 Evaporation - It has been noted that themethod referred to as ASTM D86-90 is actually not that method. The wind tunnel is not referredto in any peer-reviewed literature as such. A detailed up-to-date review of evaporation is given inthe literature (Fingas, 2004).
Viscosity - Use of Brookfield viscometry - The ASTM standard referred to (ASTM D86-90) is actually for fuels and light oils. A cross-laboratory study of viscosity measurement is givenin the literature (McDonagh, 1995). A detailed presentation of standard oil analytical methods isgiven in Wang et al. (2004).
Pour point - The method given here is different than that given in the front of the SLRreport.
Emulsion formation tendency - It has been shown that the Mackay-Zagorski emulsificationtest had severe problems and it was subsequently abandoned soon after it was first written (Bobraet al., 1990). Furthermore, this method is not good for modelling. It was only a proposed methodto examine emulsion stability and has no predictive power.
Section 2.1.1 Evaporation - Figure 2.1 shows an evaporation curve that is not a smoothcurve. An empirical curve is shown later in the report that is a different shape than this one.Furthermore, the percent evaporated is much lower than the actual measured values.
Appendix A (second one - presumably an appendix to the oil property test measurementmethods). A.1 Evaporation - As noted earlier, this includes modified data from Stiver andMackay, 1984 and the main work of Mackay and Matsugu, 1973. These are older works of onetheory progression and there are many differing theories on oil evaporation (Fingas, 1995). In theliterature at this time, it is generally accepted that the behaviour of oil evaporation is not like thatof water and that these older works used in the SLR report are not valid (Fingas 1997, 1998).
Appendix A.5 - Pour point - The SLR report states: The pour point is the lowesttemperature (to the nearest multiple of 3/C) at which an oil will still flow. Below thistemperature, the oil develops an internal yield stress and, in essence, solidifies. The pour point ofan oil increases with weathering. Pour point affects the following processes:A spreading - oils at temperatures below their pour points will not spread;A viscosity - an oil’s viscosity increases dramatically at temperatures below its pour point;A dispersion - an oil below its pour point is more difficult to disperse; and,A recovery, transfer and storage - an oil below its pour point will resist flowing towardsskimmers or down inclined surfaces in skimmers, and presents storage and transfer problems.
Pour point is not the lowest temperature at which an oil will flow. As defined by theASTM standard, pour point is the temperature at which the flow falls below a certain rate. Asthis involves some judgement, pour point is measured with poor repeatability. As it is a definedrate, there is lack of continuity in the values and pour point cannot be used to providecorrelations. The points noted above are also in need of modification. Oil below its pour pointwill still spread, sometimes rapidly. The viscosity of the oil does not increase dramatically belowthe pour point and countermeasures are just a matter of continuity, i.e., there is no drastic changeat temperatures above and below the pour point.
Appendix A.7 - Emulsion Formation - The report states: A water-in-oil emulsion(colloquially named “chocolate mousse”) is a stable emulsion of small droplets of water
600.431.050801.MFtrendsANSC.pdf
33
incorporated in oil. Oil spills on a water surface may form stable water-in-oil emulsions, whichcan have very different characteristics than the parent crude oil.The tendency of an oil to form water-in-oil emulsions (or “mousse”) and the stability of theemulsion formed are measured by two indices: the Emulsification Tendency Index and theEmulsion Stability Index. The Emulsion Formation-Tendency Index can have a value of low,indicating that the oil will not form an emulsion, or high, indicating that the oil will form anemulsion. The Emulsion Stability Index can be low, which indicates the emulsion is unstable andwill break quickly once it is removed from the mixing environment, moderate, which means theemulsion will break within a few hours, and high, which means the oil forms a very stableemulsion that is unlikely to break even after standing for 24 hours.
Both the Tendency Index and Stability Index generally increase with increased degree ofevaporation. Colder temperatures generally increase both the Tendency Index and StabilityIndex (i.e., promote emulsification). Emulsion formation results in large increases in the spill'svolume, enormous viscosity increases (which can reduce dispersant effectiveness), and increasedwater content.
The test procedure for emulsion tendency and stability follows the method now called theMackay and Zagorski Test (Mackay, 1982a, Mackay, 1984). Three hundred millilitres ofartificial seawater and 30 mL of oil are placed in a 500 mL Fleaker (oil to water ratio of 1:10),and the Fleaker is sealed. The Fleaker is rotated for one hour at a rotation speed of 65 rpm andthen allowed to settle for 30 minutes. The fraction of oil that forms an emulsion, f, is determinedby measuring the height of the emulsion and the height of the unemulsified oil. Three additionalmixing/settling cycles are performed with measurements of f taken at each rotation interval. The
initialtendency of an oil to form an emulsion is given by f which is obtained by plotting f versustime, and by extrapolating f to time zero.
The following criteria are used to classify the tendency of a crude oil to form a stableemulsion:
initialRange of f Emulsion Formation Tendency0.0 to 0.25 Not likely0.25 to 0.75 Fairly likely0.75 to 1.0 Very likely
The stability of a water-in-oil emulsion is obtained by allowing the emulsion to settle for an
finaladditional 24 hours, and then measuring the fraction of oil in the emulsion (f ) visually. Thestability of the water-in-oil emulsion is classified as follows:
finalRange of f Emulsion Stability0.0 to 0.25 Unstable0.25 to 0.75 Fairly stable0.75 to 1.0 Very stable
The calculated water content of stable water-in-oil emulsions is also provided.As already noted, these old, unaccepted procedures should be replaced with a modern
understanding of emulsification. The Mackay-Zagorski procedure noted here was never acceptedand was rapidly replaced by more modern procedures. The current state of the art in emulsionunderstanding and measurement is summarized in Section 2 of this review.
600.431.050801.MFtrendsANSC.pdf

34
The basis of emulsification is summarized here. Emulsification is the process by whichone liquid is dispersed into another one in the form of small droplets. Water droplets can remainin an oil layer in a stable form and the resulting material is completely different. Thesewater-in-oil emulsions are sometimes called ‘mousse’ or ‘chocolate mousse’ as they resemblethis dessert.
The mechanism of emulsion formation starts with sea energy forcing small water droplets,about 10 to 25 um (or 0.010 to 0.025 mm) in size, to enter the oil. If the oil is only slightlyviscous, these small droplets will not leave the oil quickly. On the other hand, if the oil is tooviscous, droplets will not enter the oil to any significant extent. Once in the oil, the dropletsslowly gravitate to the bottom of the oil layer. Any asphaltenes and resins in the oil will interactwith the water droplets to stabilize them. Depending on the quantity of asphaltenes and resins, aswell as aromatic compounds that stabilize asphaltenes and resins in solution, an emulsion may beformed. The conditions required for emulsions of any stability to form are reached only after aperiod of evaporation. Evaporation lowers the amount of low-molecular weight aromatics in theoil and increases the oil’s viscosity to the critical value.
Water can be present in oil in four ways. First, some oils contain about 1% water assoluble water. This water does not significantly change the physical or chemical properties of theoil. The second way is called “entrainment”, whereby water droplets are simply held in the oil byits viscosity to form an unstable emulsion. These are formed when water droplets areincorporated into oil by the sea’s wave action and there are not enough asphaltenes and resins inthe oil or if there is a high amount of aromatics in the oil that stabilizes the asphaltenes andresins, preventing them from acting on the water droplets. When the sea energy diminishes,unstable emulsions break down into water and oil within minutes or a few hours, at most. Theunstable emulsion has almost the same properties and appearance as the starting oil, although thewater droplets may be large enough to be seen with the naked eye.
Meso-stable emulsions represent the third way water can be present in oil. These areformed when the small droplets of water are stabilized to a certain extent by a combination of theviscosity of the oil and the interfacial action of asphaltenes and resins. For this to happen, theasphaltene or resin content of the oil must be about 3% by weight or greater. The viscosity ofmeso-stable emulsions is 50 to 150 times higher than that of the starting oil. These emulsionsgenerally break down into oil and water or sometimes into water, oil, and stable emulsion withina few days. Meso-stable emulsions are viscous liquids that are reddish-brown or black in colour.
The fourth way that water exists in oil is in the form of stable emulsions. These form in away similar to meso-stable emulsions except that the oil must contain at least 8% asphaltenes.The viscosity of stable emulsions is 1,000 to 1,500 times higher than that of the starting oil andthe emulsion will remain stable for weeks and even months after formation. Stable emulsions arereddish-brown in colour and appear to be nearly solid. Because of their high viscosity and nearsolidity, these emulsions do not spread and tend to remain in lumps or mats on the sea or shore.
Each of these four ‘states’ is readily distinguished by lifetime and is quite different by thisdiscriminator. In addition, rheological studies can be carried out to immediately distinguishtypes.
600.431.050801.MFtrendsANSC.pdf
35
6. Analysis of Alaskan North Slope Oils from Literature and Data ComparisonThe Environment Canada database contains a number of high quality data on the Alaskan
North Slope Oils (ETC, 2005). These data will be useful for comparing the data in the SLRreport and establishing the properties of the Alaskan oils, the emulsification behaviour, and thechange in properties/behaviour over time. These data are shown in Table 3, which includes thedata from the SLR report in the bottom rows.
In this section, the various data will be compared with emphasis on two critical factors -the change in properties over time that would indicate whether the oil is becoming lighter orheavier and the changes in emulsification properties. The differences between the SLR data andthe ETC on-line data will then be summarized. Each parameter in the ETC database will beexamined from two points of view: the year of the sample and the weathering percentage (byweight) of the sample.
The various figures providing comparison are summarized in Table 4. The first columnlists the parameter of interest. The second lists the relevant figure in which the data is illustrated.The third column summarizes whether the parameter under discussion is indicative of the trendof the oil becoming heavier or lighter over the years and the next column indicates whether anychanges in this parameter would show that emulsification is more or less likely. The fifth columnindicates the significance of the data to the two questions of the heaviness trend and theemulsification trend. The sixth column provides a rating of the accuracy of the data. The seventhcolumn assesses the accuracy of old data on the topic, and finally the eighth column assesses theaccuracy of the data in the SLR report. This is repeated for the weathered oils. As the weatheringpercentage is different in most samples, it is difficult to directly compare properties over time.
Figure 3 shows the percentage of sulphur in the samples over the years, which isdecreasing with time. This indicates the oil mixture is getting lighter, perhaps by the addition oflighter oils in the Trans-Alaska pipeline. Figure 4 shows that the sulphur content increases as theweathering percent increases. This is not highly significant in terms of the two major questionshere, as it is expected that the sulphur content would increase with weathering percentage.
Figure 5 shows the change in flash point over the years. The data from the SLR report isshown in this figure and subsequent figures by the arrow. The flash point decreased over the pastyears indicating that there is a lighter oil in the pipeline than in previous years. Figure 6 showsthe change in flash point with weathering percentage. As would be expected, the flash point riseswith increasing weathering. The values from the subject point appear to be slightly lower than theother data.
Figure 7 shows the density (at 0 C) in the samples over the years. The density iso
decreasing with time, which indicates that the oil mixture is getting lighter, perhaps by theaddition of lighter oils in the North Slope mix. The decrease in density over the years indicatesthat emulsification would also be slightly less likely. Figure 8 shows that the density (at 0 C)o
increases as the weathering percentage increases.Figure 9 shows the change in density by both weathering and year. The density itself is
shown by the size of the circle in the figure. The data from the SLR report is shown in this figureand subsequent figures by the arrow. Figure 10 shows the change in density (at 15 C) by year.o
The values show a similar trend to that of the density at 0 C. This shows a constantly decreasingo
value with time. Figure 11 shows the density change (at 15 C) with weathering percent. Aso
expected this shows the density increasing with weathering. Figure 12 shows the change indensity by both weathering and year. The density itself is shown by the size of the circle in the
600.431.050801.MFtrendsANSC.pdf
36
figure. There does not appear to be a 3-way correlation in the data.Figure 13 shows the pour point of the samples over the years, which is decreasing with
time. This indicates that the oil mixture is getting lighter, perhaps due to the addition of lighteroils in the Trans-Alaska pipeline. The high scatter of pour point shows the difficulty in pourpoint measurements. Figure 14 shows that the pour point increases as the weathering percentageincreases. This is not highly significant in terms of the two major questions here, as it is expectedthat the pour point would increase with weathering percentage.
Figure 15 shows the change in viscosity at 0 C over the years. The data from the SLRo
report is shown in this figure and subsequent figures by the arrow. The flash point increased overthe past years indicating that there is a lighter oil in the pipeline than in previous years. Figure 16shows the change in viscosity with weathering percentage. As would be expected, the viscosityrises with increasing weathering. The values from the subject point appear to be slightly higherthan the other data. Figure 17 shows the viscosity at 15 C of the samples over the years. Theo
density is decreasing with time, indicating that the oil mixture is getting lighter, perhaps due tothe addition of lighter oils in the North Slope mix. The density decrease over the years indicatesthat emulsification would also be slightly less likely. Figure 18 shows that the viscosity (at 15 C)o
increases as the weathering percentage increases.Figure 19 shows the change in saturate content by year, which appears to go down over the
years. Contrary to the other trends, this would indicate that the oil is getting heavier and may bemore prone to emulsification. This depends, however, on the types of saturates present as theymay be of different chain lengths, which have different effects. Figure 20 shows the change insaturate content by weathering percentage. Figure 21 shows the aromatic content by year.Although this shows that the aromatic content is decreasing somewhat with time, there issignificant scatter. Figure 22 shows the change in aromatic content with weathering and revealsthat there is no particular drastic tendency.
Figure 23 shows the resin content of the samples over the years, which increases withtime. This indicates that the oil mixture is becoming more prone to forming emulsions (meso-stable) over the years. Figure 24 shows that the resin content increases as the weatheringpercentage increases. Figure 25 shows that the asphaltene content is changing over the years,indicating that the oil may be more emulsion-prone. It should be noted that the rise in asphaltenecontent is not as great as that of the resin content. Figure 26 shows the change in asphaltenecontent with weathering percentage. As would be expected, the asphaltene content rises withincreasing weathering. The SLR report did not provide measurements of SARA content.
Figure 27 shows the wax content of the samples over the years, which is decreasing withtime. This indicates the oil mixture is getting lighter, perhaps due to the addition of lighter oils inthe North Slope mix. The wax content decrease over the years is not any indication ofemulsification behaviour. Figure 28 shows that the wax content increases as the weatheringpercentage increases, although the change is very slight. Figure 29 shows that there is littlechange in adhesion over the years. Figure 30 shows that there doesn’t appear to be a significantchange in adhesion with weathering. Figure 31 shows the VOC content decreasing somewhatover the years, although there is significant scatter. Figure 32 shows the decrease in VOC contentwith weathering.
Figure 33 shows the decreasing interfacial tension of the samples with air over the years(at 0 C), which indicates that the oil mixture is becoming lighter with time. Figure 34 shows thato
the interfacial tension with air increases as the weathering percentage increases. Figure 35 shows
600.431.050801.MFtrendsANSC.pdf
37
the interfacial tension of the samples with air decreasing over the years (at 15 C), indicating thato
the oil mixture is becoming lighter over the years. Figure 36 shows the change in interfacialtension with air with weathering percentage. The SLR report provides interfacial values that arehigh.
Figure 37 shows interfacial tension of the samples with seawater over the years (at 0 C).o
The interfacial tension is decreasing with time, indicating that the oil mixture is becoming lighterover the years. Figure 38 shows the change in interfacial tension with air with weatheringpercentage at 0 C. Figure 39 shows interfacial tension of the samples with seawater over theo
years (at 15 C). The interfacial tension is decreasing with time, which indicates that the oilo
mixture is becoming lighter over the years. Figure 40 shows the change in interfacial tension withseawater (at 15 C) with weathering percentage. Figure 41 shows the interfacial tension of theo
samples with freshwater over the years (at 0 C). The interfacial tension is decreasing with time.o
This indicates that the oil mixture is becoming lighter over the years. Figure 42 shows the changein interfacial tension of the samples with freshwater (at 0 C) with weathering percentage.o
Figure 43 shows that the interfacial tension of the samples with freshwater (at 15 C) iso
decreasing with time, indicating that the oil mixture is becoming lighter over the years. Figure 44shows that the interfacial tension with freshwater (at 15 C) increases as the weathering percento
increases. Figure 45 shows the chemical dispersibility with Corexit 9500 of the samples with airover the years. It should be noted that, although the trend appears upwards, the methods ofanalysis have changed and the trend may now be stable, not upward. Figure 46 shows the changein chemical dispersibility with weathering percentage. The downwards trend is expected.
Figure 47 shows that the distillation curves of the samples with seawater are decreasingwith time, strongly indicating that the oil mixture is becoming lighter over the years. Figure 48shows the change in distillation curves with weathering percentage. Figure 49 shows that thedistillation curves (by percent distilled) of the samples are decreasing over the years, which is astrong indication that the oil mixture is becoming lighter with time. The non-standard distillationcurve from the SLR report is indicated by the arrow. Figure 50 shows the change in distillationcurves with weathering percentage.
Figure 51 shows water-in-oil and emulsion stability of the fresh ANS samples over theyears. The fresh ANS largely does not form emulsions. Figure 52 shows water-in-oil andemulsion stability of the samples with weathering. The data from the SLR report are shown in theundefined region as this data was not obtained by standard procedure. Figure 53 shows thepredicted water-in-oil and emulsion stability of the fresh ANS samples using the second Fingasmodel. This model predicts that fresh ANS would always form unstable water-in-oil states. Thiswas also observed in tests. Figure 54 shows the predicted water-in-oil and emulsion stability ofthe weathered samples with weathering using the second Fingas model. This model predicts thatfresh ANS would always form meso-stable emulsions. This was also observed in tests.
Figure 55 shows the water content of the various water-in-oil states as measured inlaboratory experiments. As can be seen, the meso-stable emulsions have a higher water content,which is known from the extensive studies. The values from the SLR report are noted by anarrow. The low water content indicates that the data in the SLR report probably relate to theunstable state. Figure 57 shows a comparison of the stability of the meso-stable emulsions. Thesize of circle indicates the degree of weathering of the samples. Figure 57 shows that there isrelatively little change in the stability of meso-stable emulsions with weathering over the years.Figure 58 shows the stability of the meso-stable emulsions with weathering percentage. There
600.431.050801.MFtrendsANSC.pdf
38
does not appear to be an increase in stability with increasing weathering percentage.Figure 59 shows the asphaltene/resin ratio of ANS oil with the years. The asphaltene/resin
ratio appears to be dropping over time which would indicate lesser emulsion stability over time. Figure 60 shows the asphaltene/resin ratio versus the weathering percentage. It appears that theasphaltene/resin ratio is not changing significantly with weathering percentage.
The comparison and analysis of the data show the following about the trend of the ANSoil.
1. Most indicators reveal that the mix that constitutes ANS oil is becoming lighter,probably because of the mix of crudes added to the start of the pipelines.
2. The crucial indicator of distillation data confirms this, as do the important indicators ofviscosity and density.
3. Caution must be exercised on the use of the published data as this was never intendedto show a long-term trend. Furthermore, the specific sample points, times, and pipelineconditions were not documented.
4. Despite the indicators that the oil is becoming lighter, the resins are rising somewhat.This indicates that the oil may become a lighter, but more resiny oil.
The comparison of the data shows the following about the analytical data presented in the S.L. Ross report.
1. Several crucial parameters required to make decisions on oil behaviour andemulsification are missing from the SLR report, including standard distillation data,standard emulsification procedures, and SARA analysis.2. The flash point measured was high.3. The density at 15 C was low.o
4. The pour point was high.5. The viscosity measurements were either higher or lower than those in the literature.6. The oil-air interfacial tensions were high.7. The distillation curves were different.8 The emulsification data was quite different and could not be related to the literaturedata.
7. Most Probable Emulsification Behaviour of Alaskan OilsThe historic tendency of ANS crudes is that the fresh ones will not form any type of
emulsion and will result in an unstable water-in-oil state. After some amount of weathering, theseoils will then sometimes form meso-stable emulsions. The question then becomes what thetendency for the future might be. The many data sets of parameters relating to the emulsionformation of ANS oils are summarized in Table 4.
The following is a summary of the tendencies of the water-in-oil states for ANS oils.1. The most indicative tendency is the stability of the emulsions as measured by the
stability index of complex modulus of the formed product, divided by the viscosity of the startingoil. The stability of the meso-stable emulsions was calculated and is illustrated in a number offigures. Figure 56 shows the emulsion stability by year and ignores the effect of weathering. Onthe basis of the one oil with a high stability, it is noted that there is a slight decrease in emulsionstability over the years. The same graph is shown in Figure 57, however, the weatheringpercentage of the emulsions is shown by the size of the circle. This graph appears to indicate
600.431.050801.MFtrendsANSC.pdf
39
about the same trend as shown in Figure 56, except that the weathering does not appear to affectemulsion stability. Figure 58 shows the stability in relation to the weathering percentage. Itappears that there is little correlation between the stability and the weathering percentage. Theoverall tendency of the stability analysis is that there is a slight decrease in the stability of themeso-stable emulsions over time. It should be noted, however, that this is based on one morestable emulsion from about 1995.
2. The asphaltene/resin ratio is a strong indication of the emulsification tendency of an oil.As noted in Section 2 of this review, asphaltene-stabilized emulsions are more stable. Figure 59shows the variation of the asphaltene/resin ratio over the years that fresh ANS samples weretaken. This shows a slight downward trend in the ratio, which would indicate that there is a slightdecrease in emulsion stability or formation tendency over the years. Figure 60 shows theexpected slight increase in asphaltene ratio with weathering percentage.
3. The asphaltene amount is also an indicator of emulsification tendency. Figure 25 showsthat the asphaltene content is slowly rising over the years, although this is obviously offset by thegreater increase in the resin content, which decreases the asphaltene/resin ratio.
4. The change in resin content over the years is shown in Figure 23. The resin contentappears to be rising significantly, which has the effect of lowering the asphaltene/resin ratio asnoted in point 2 and creating a meso-stable emulsion as noted in the discussion in Section 2 ofthis review.
5. The viscosity of the oil is decreasing as shown in Figures 15 and 17. To a certain extent,the effect of this may be to decrease the emulsification potential, especially of the entrainedwater-in-oil state.
6. The prediction of emulsification using the latest model shows a lower prediction factor(related to stability). As shown in Figures 53 and 54, a low tendency or stability value appears tobe the trend over the years. This model incorporates a variety of factors including density andviscosity, as well as saturate, asphaltene, and resin content.
7. The measured stability of meso-stable emulsions shows a slight decrease as shown inFigure 56. This is an indicator of the trend.
Overall, the seven indicators show that there is a general decline in the tendency foremulsions to form and in the stability of those emulsions.
8. ConclusionsA review of the emulsification of Alaskan North Slope oils shows that these oils do not
typically form entrained water in oil or stable emulsions. After weathering, however, many ofthese oils will form meso-stable emulsions. These are less stable emulsions with a lifetime of lessthan 3 days.
The examination of the prime indicators of emulsion formation included the following.1. The major indicator is the stability of the emulsions as measured by the stability index
of complex modulus of the formed product, divided by the viscosity of the starting oil. Theoverall tendency of the stability analysis of the ANS meso-stable emulsions is that there is aslight decrease in the stability over time. It should be noted, however, that this is based on limiteddata.
2. The asphaltene/resin ratio is another strong indicator of the emulsification tendency ofan oil. Asphaltene-stabilized emulsions are more stable. The asphaltene/resin ratio is decreasingover time, indicating that there is a slight decrease in emulsion stability or formation tendency
600.431.050801.MFtrendsANSC.pdf
40
over the years.3. The amount of asphaltene in an oil is also an indicator of emulsification tendency. The
asphaltene content is slowly rising over the years, although this is obviously offset by the greaterincrease in the resin content, which decreases the asphaltene/resin ratio.
4. The resin content is increasing over the years, which will lower the asphaltene/resinratio and cause the formation of a meso-stable emulsion.
5. The viscosity of the oil is decreasing. This may decrease the emulsification potential,especially that of the entrained water-in-oil state.
6. The prediction of emulsification using the latest model shows a lower prediction factor(related to stability). This model incorporates a variety of factors including density and viscosity,and saturate, asphaltene, and resin content. This model shows a slight decrease in tendency toform emulsions and their stability.
7. The measured stability of meso-stable emulsions shows a slight decrease over the years.Overall, it is concluded that both the potential for formation of meso-stable emulsions and
their stability will decrease if the current trend in petroleum properties continues.The comparison and analysis of the oil analytical and properties data show the following
apparent trends in the nature of the ANS oil.1. Most indicators show that the mix that constitutes ANS oil is becoming lighter,
probably due to the mix of crudes added to the start of the pipelines. It is important to stress herethat the sampling points, sampling times, and other conditions of the pipeline and feed operationswere not always recorded.
2. The important indicators of distillation data, chemical composition, viscosity, anddensity show a general increase in the lightness of ANS oils.
3. The amount of volatile organic compounds (VOCs) in the oil is rising.4. Despite the indicators that the oil is becoming lighter, the resins are rising somewhat.
This indicates that the oil may become a lighter, but more resiny oil.The comparison of the data shows the following about the analytical data presented in the
S.L. Ross report.1. Several crucial parameters to consider when making decisions about oil behaviour andemulsification are missing from the report, including standard distillation data, standardemulsification procedures, and SARA and VOC analyses.2. The flash point measured was high.3. The density at 15 C was low.o
4. The pour point was high.5. The viscosity measurements were either higher or lower than the results in the literature.6. The oil-air interfacial tensions were high.7. The distillation curves were different.8. The emulsification data was quite different and could not be related to the data in theliterature. None of the important concepts or references about emulsification was includedin the report.Despite this, in one place the report does indicate that the oil is becoming lighter and may
thus be less prone to emulsification. This judgement was, however, based on inappropriateemulsification data.
600.431.050801.MFtrendsANSC.pdf
41
9. ReferencesAcevedo, S., G. Escobar, L.B. Gutierrez, and H. Rivas, “Interfacial Rheological Studies of Extra-Heavy Crude Oils and Asphaltenes: Role of the Dispersion Effect of Resins in the Adsorption ofAsphaltenes at the Interface of Water-in-Crude Oil Emulsions”, Colloids and Surfaces A, Vol.71, pp 65-71, 1993.
Allen, A., “Controlled Burning of Crude Oil on Water following the Grounding of the ExxonValdez, Proceedings of the 1991 Oil Spill Conference, American Petroleum Institute,Washington, DC, pp 213-216, 1991.
Aomari, N., R. Gaudu, F. Cabioc’h, and A. Omari, “Rheology of Water in Crude Emulsions”,Colloids and Surfaces A, Vol. 139, pp 13-20, 1998.
Balinov, B., O. Urdahl, O. Soderman, and J. Sjöblom, “Characterization of Water-in-Crude OilEmulsions by the NMR Self-Diffusion Technique”, Colloids and Surfaces A, Vol. 82, pp 173-181, 1994.
Berger, D. and D. Mackay, “The Evaporation of Viscous or Waxy Oils: When is a Liquid-PhaseResistance Significant?”, in Proceedings of the Seventeenth Arctic Marine Oilspill ProgramTechnical Seminar, Environment Canada, Ottawa, ON, pp 77-92, 1994.
Berridge, S.A., R.A. Dean, R.G. Fallows, and A. Fish, “The Properties of Persistent Oils at Sea”,Journal of the Institute of Petroleum, Vol. 54, The Institute of Petroleum, London, UK, pp 300-309, 1968.
Bobra, M., “A Study of the Formation of Water-in-Oil Emulsions”, in Proceedings of theThirteenth Arctic Marine Oilspill Program Technical Seminar, Environment Canada, Ottawa,ON, pp 87-117, 1990.
Bobra, M., M. Fingas, and E. Tennyson, “When Oil Spills Emulsify”, Chemtech, April, pp 214-236, 1992.
Børve, K.G.N., J. Sjöblom, and P. Stenius, “Water-in-Crude Oil Emulsions from the NorwegianContinental Shelf: 5. A Comparative Monolayer Study of Model Polymers”, Colloids andSurfaces, Vol. 63, pp 241-251, 1992.
Bridie, A.L., T.H. Wanders, W. Zegveld, and H.B. Van Der Heijde, “Formation, Prevention andBreaking of Sea Water in Crude Oil Emulsions 'Chocolate Mousses'”, Marine Pollution Bulletin,Vol. 11, pp 343-348, 1980.
Chaala, A., B. Benallal, and S. Hachelef, “Investigation on the Flocculation of Asphaltenes andthe Colloidal Stability of the Crude Oil Fraction (>210 C)”, Canadian Journal of Chemicalo
Engineering, Vol. 72, pp 1036-1041, 1994.
600.431.050801.MFtrendsANSC.pdf

42
Desmaison, M., C. Pierkarski, S. Pierkarski, and J.P. Desmarquest, “Formation et stabilisationdes emulsions inverses eau de mer-petrole : Role de la tension et de la viscosité d’interface”,Revue de l'Institute française du petrole, Vol. 39, No. 5, pp 603-615, 1984.
Durell, G.S., S.A. Ostazeski, A.D. Uhler, I.K. Almas, P.S. Daling, T. Strom-Kristiansen, andA.B. Nordvik, “Evaluation of the Transfer of Crude Oil Weathering Technology: InterlaboratoryComparison of Physico-Chemical Characteristics of Weathered Oils and Emulsions”, inProceedings of the Seventeenth Arctic Marine Oilspill Program Technical Seminar, EnvironmentCanada, Ottawa, ON, pp 39-75, 1994.
Ebeltoft, H., K.G.N. Børve, J. Sjöblom, and P. Stenius, Progress in Colloids and PolymerScience, Vol. 88, pp 131-139, 1992.
Eley, D.D., M.J. Hey, and J.D. Symonds, “Emulsions of Water in Asphaltene-containing Oils: 1.Droplet Size Distribution and Emulsification Rates”, Colloids and Surfaces, Vol. 32, pp 87-101,1988.
Ese, M.-H., J. Sjöblom, H. Førdedal, O. Urdahl, and H.P. Rønningsen, “Ageing of InterfaciallyActive Components and Its Effect on Emulsion Stability as Studied by Means of High VoltageDielectric Spectroscopy Measurements”, Colloids and Surfaces A, Vol. 123-124, pp 225-232,1997.
Ese, M., X. Yang, and J. Sjöblom, “Film Forming Properties of Asphaltenes and Resins. AComparative Langmuir-Blodgett Study of Crude Oils from North Sea, European Continent andVenezuela”, Colloids and Polymer Science, Vol. 276, pp 800-809, 1998.
ETC (Environmental Technology Centre), World Catalogue of Oil Properties, WWW.ETC-CTE.ec.gc.ca, 2005.
Fingas, M.F., “Studies on the Evaporation of Oil Spills”, in Proceedings of the SeventeenthArctic and Marine Oil Spill Program Technical Seminar, Environment Canada, Ottawa, ON, pp 189-212, 1994.
Fingas, M.F., “A Literature Review of the Physics and Predictive Modelling of Oil SpillEvaporation”, Journal of Hazardous Materials, Vol. 42, pp 157-175, 1995.
Fingas, M.F., “Studies on the Evaporation of Crude Oil and Petroleum Products: I. TheRelationship between Evaporation Rate and Time”, Journal of Hazardous Materials, Vol. 56, pp227-236, 1997.
Fingas, M.F., “Studies on the Evaporation of Crude Oil and Petroleum Products: II. BoundaryLayer Regulation”, Journal of Hazardous Materials, Vol. 57, pp 41-58, 1998.
Fingas, M.F., The Basics of Oil Spill Cleanup: Second Edition, CRC Press, Boca Raton, FL,256 p, 2000.
600.431.050801.MFtrendsANSC.pdf

43
Fingas, M., “Modeling Evaporation Using Models That Are Not Boundary-layer Regulated”,Journal of Hazardous Materials, Vol. 107, pp. 27-36, 2004.
Fingas, M.F. and B. Fieldhouse, “Studies of Water-in-Oil Emulsions and Techniques to MeasureEmulsion Treating Agents”, in Proceedings of the Seventeenth Arctic and Marine Oil SpillProgram Technical Seminar, Environment Canada, Ottawa, ON, pp 213-244, 1994.
Fingas, M. and B. Fieldhouse, “Water-in-Oil Emulsions and Application to Oil Spill Modelling”,in Proceedings of the Fifth International Marine Environmental Modelling Seminar, SintefApplied Chemistry, Trondheim, Norway, pp 339-351, 2001.
Fingas, M.F. and B. Fieldhouse, “Studies of the Formation Process of Water-in-Oil Emulsions”,Marine Pollution Bulletin, Vol. 47, pp 369-396, 2003.
Fingas, M. and B. Fieldhouse, “Formation of Water-in-oil Emulsions and Application to Oil SpillModelling”, Journal of Hazardous Materials, Vol. 107, pp. 37-50, 2004.
Fingas, M.F. and B. Fieldhouse, “Modelling of Water-in-Oil Emulsions”, in Proceedings of theTwenty-seventh Arctic and Marine Oil Spill Program Technical Seminar, Environment Canada,Ottawa, ON, pp 335-350, 2004a.
Fingas, M.F. and B. Fieldhouse, “A New Approach to Modelling Water-in-Oil Emulsions”, inProceedings of the Seventh International Marine Environmental Modeling Seminar, Washington,DC, SINTEF, Trondheim, Norway, pp. iii 32-53, 2004b.
Fingas, M.F. and B. Fieldhouse, “Formation of Water-in-oil Emulsions and Application to OilSpill Modelling”, Journal of Hazardous Materials, Vol. 107, pp. 37-50, 2004c.
Fingas, M.F. and B. Fieldhouse, “How to Model Water-in-Oil Emulsion Formation” inProceedings of the 2005 International Oil Spill Conference, American Petroleum Institute,Washington, DC, 2005.
Fingas, M., B. Fieldhouse, M. Bobra, and E. Tennyson, “The Physics and Chemistry ofEmulsions”, in Proceedings of the Workshop on Emulsions, Marine Spill Response Corporation,Washington, DC, 1993.
Fingas, M.F, B. Fieldhouse, L. Gamble, and J.V. Mullin, “Studies of Water-in-Oil Emulsions:Stability Classes and Measurement”, in Proceedings of the Eighteenth Arctic and Marine OilSpill Program Technical Seminar, Environment Canada, Ottawa, ON, pp 21-42, 1995.
Fingas, M.F., B. Fieldhouse, and J.V. Mullin, “Studies of Water-in-Oil Emulsions: The Role ofAsphaltenes and Resins”, in Proceedings of the Nineteenth Arctic and Marine Oil Spill ProgramTechnical Seminar, Environment Canada, Ottawa, ON, pp 73-88, 1996.
600.431.050801.MFtrendsANSC.pdf
44
Fingas, M.F., B. Fieldhouse, and J.V. Mullin, “Studies of Water-in-Oil Emulsions: StabilityStudies”, in Proceedings of the Twentieth Arctic and Marine Oil Spill Program TechnicalSeminar, Environment Canada, Ottawa, ON, pp 21-42, 1997.
Fingas, M.F., B. Fieldhouse, and J.V. Mullin, “Studies of Water-in-Oil Emulsions: Stability andOil Properties”, in Proceedings of the Twenty-first Arctic and Marine Oil Spill ProgramTechnical Seminar, Environment Canada, Ottawa, ON, pp 1-25, 1998.
Fingas, M.F., B. Fieldhouse, and J.V. Mullin, “Studies of Water-in-Oil Emulsions: Energy Threshold of Emulsion Formation”, in Proceedings of the Twenty-second Arctic andMarine Oil Spill Program Technical Seminar, Environment Canada, Ottawa, ON, pp 57-68,1999.
Fingas, M.F., B. Fieldhouse, J. Lane, and J.V. Mullin, “Studies of Water-in-Oil Emulsions:Long-Term Stability, Oil Properties, and Emulsions Formed at Sea”, in Proceedings of theTwenty-third Arctic and Marine Oil Spill Program Technical Seminar, Environment Canada,Ottawa, ON, pp 145-160, 2000a.
Fingas, M.F., B. Fieldhouse, J. Lane, and J.V. Mullin, “Studies of Water-in-Oil Emulsions:Energy and Work Threshold for Emulsion Formation”, in Proceedings of the Twenty-third Arcticand Marine Oil Spill Program Technical Seminar, Environment Canada, Ottawa, ON, pp 19-36,2000b.
Fingas, M.F., B. Fieldhouse, L. Lerouge, J. Lane, and J. Mullin, “Studies of Water-in-OilEmulsions: Energy and Work Threshold as a Function of Temperature”, in Proceedings of theTwenty-fourth Arctic and Marine Oil Spill Program Technical Seminar, Environment Canada,Ottawa, ON, pp 65-77, 2001a.
Fingas, M.F., B. Fieldhouse, J. Lane, and J. Mullin, “Studies of Water-in-Oil Emulsions: Testingof Emulsion Formation in OHMSETT”, in Proceedings of the Twenty-fourth Arctic and MarineOil Spill Program Technical Seminar, Environment Canada, Ottawa, ON, pp 47-63, 2001b.
Fingas, M.F., B. Fieldhouse, P. Lambert, Z. Wang, J. Noonan, J. Lane, and J.V. Mullin, “Water-in-Oil Emulsions Formed at Sea, in Test Tanks, and in the Laboratory”, Manuscript Report EE-169, Environmental Protection Service, Environment Canada, Ottawa, ON, 2002a.
Fingas, M.F., B. Fieldhouse, J. Noonan, P. Lambert, J. Lane and J. Mullin, “Studies of Water-in-Oil Emulsions: Testing of Emulsion Formation in OHMSETT, Year II”, in Proceedings of theTwenty-fifth Arctic and Marine Oil Spill Program Technical Seminar, Environment Canada,Ottawa, ON, pp 29-44, 2002b.
Fingas, M.F., B. Fieldhouse and Z. Wang, “The Long Term Weathering of Water-in-OilEmulsions”, Spill Science and Technology Bulletin, Vol. 8, No. 2, pp 137-143, 2003.
600.431.050801.MFtrendsANSC.pdf
45
Førdedal, H., Y. Schildberg, J. Sjöblom, and J-L. Volle,“Crude Oil Emulsions in High ElectricFields as Studied by Dielectric Spectroscopy: Influence of Interaction between Commercial andIndigenous Surfactants”, Colloids and Surfaces, Vol. 106, pp 33-47, 1996a.
Førdedal, H., Ø. Midttun, J. Sjöblom, O.M. Kvalheim, Y, Schildberg, and J-L Volle, “AMultivariate Screening Analysis of W/O Emulsions in High External Electric Fields as Studiedby Means of Dielectric Time Domain Spectroscopy, II”, Journal of Colloid and InterfaceScience, Vol 182, pp 117-125, 1996b.
Friberg, S.E., “Emulsion Stability”, in Emulsions: A Fundamental and Practical Approach, J.Sjöblom (ed.), Kluwer Academic Publishers, Dordrecht, The Netherlands, pp 1-24, 1992.
Friberg, S. E. and J. Yang, “Emulsion Stability”, in Emulsions and Emulsion Stability, JohanSjöblom (ed.), Marcel Dekker, New York, NY, pp 1-40, 1996.
Gestblom, B., H. Førdedal, and J. Sjöblom, “W/O Emulsions in High Electric Fields as Studiedby Means of Dielectric Spectroscopy”, Journal of Dispersion Science and Technology, Vol. 15,pp 450-464, 1994.
Haegh, T. and T. Ellingsen, “The Effect of Breaking Waves On Oil Spills; 1. Emulsification ofCrude Oil at Sea”, SINTEF, The Foundation of Scientific and Industrial Research at theUniversity of Trondheim, Norway, 23 p, 1977.
Hartland, S. and S.A.K. Jeelani, “Effect of Interfacial Tension Gradients on Emulsion Stability”,Colloids and Surfaces A, Vol. 88, pp 289-302, 1994.
Haus, F., O. Boissel, and G.-A. Junter, “Primary and Ultimate Biodegradabilities of Mineral-based Oils and their Relationships with Oil Viscosity”, International Biodeterioration andBiodegradation, Vol. 54, pp 189-192, 2004.
International Petroleum Encyclopedia, PenWell Books, Tulsa, OK, 2004
Jenkins, R.H., S.J.W. Grigson, and J. McDougall, “The Formation of Emulsions at Marine OilSpills and the Implications for Response Strategies”, in Proceedings of the First InternationalConference on Health, Safety and Environment in Oil and Gas Exploration and Production,Vol. 2, Society of Petroleum Engineers, Richardson, TX, pp 437-443, 1991.
Johansen, E.J., I.M. Skjärvo, T. Lund, J. Sjöblom, H. Söderlund, and G. Boström, “Water-in-Crude Oil Emulsions from the Norwegian Continental Shelf: Part 1. Formation, Characterizationand Stability Correlations”, Colloids and Surfaces, Vol. 34, pp 353-370, 1988/89.
Jokuty, P., M. Fingas, S. Whiticar, and B. Fieldhouse, “A Study of Viscosity and InterfacialTension of Oils and Emulsions”, Manuscript Report EE-153, Environmental Protection Service,Environment Canada, Ottawa, ON, 43 p, 1995.
600.431.050801.MFtrendsANSC.pdf

46
Jokuty, P., S. Whiticar, Z. Wang, M.F. Fingas, B. Fieldhouse, P. Lambert, and J. Mullin,“Properties of Crude Oils and Oil Products, (Volume 1, A-K; Volume 2, L-Z)”, ManuscriptReport EE-165, Environmental Protection Service, Environment Canada, Ottawa, ON, 1999.
Kirstein, B.E. and R.T. Redding, “Ocean-Ice Oil-Weathering Computer Program User's Manual”,Outer Continental Shelf Environmental Assessment Program, Vol. 59, National Oceanic andAtmospheric Administration, Ocean Assessment Division, Alaska, 83 p, 1988.
LaTorraca, G.A., K.J. Dunn, P.R. Webber, and R.M. Carlson, “Low-Field NMR Determinationsof the Properties of Heavy Oils and Water-in-Oil Emulsions”, Magnetic Resonance Imaging,Vol. 16, Nos. 5/6, pp 659-662, 1998.
Lee, H.M., J.W. Lee, and O.O. Park, “Rheology and Dynamics of Water-in-Oil Emulsions UnderSteady and Dynamic Shear Flow”, Journal of Colloid and Interface Science, Vol. 185, pp 297-305, 1997.
Mackay, D., “The Fate and Behaviour of Oil in Cold Climates”, Environment CanadaUnpublished Report, Ottawa, ON, 1984.
Mackay, D. and R.S. Matsugu, “Evaporation Rates of Liquid Hydrocarbon Spills on Land andWater”, Canadian Journal Chemical Engineering, Vol. 51, pp 434-439, 1973.
Mackay, D. and W. Zagorski, “Studies of the Formation of Water-In-Oil Emulsions”, inProceedings of the Fourth Annual Arctic Marine Oilspill Program Technical Seminar,Environment Canada, Ottawa, ON, pp 75-86, 1981.
Mackay, D. and W. Zagorski, “Studies of Water-In-Oil Emulsions”, Manuscript Report EE-34,Environmental Protection Service, Environment Canada, Ottawa, ON, 93 p, 1982a.
Mackay, D. and W. Zagorski, “Water-In-Oil Emulsions: A Stability Hypothesis”, in Proceedingsof the Fifth Annual Arctic Marine Oilspill Program Technical Seminar, Environment Canada,Ottawa, ON, pp 61-74, 1982b.
Mackay, D. and M. Nowak, “Water-in-Oil Emulsions: Some Recent Advances”, in Proceedingsof the Seventh Annual Arctic Marine Oilspill Program Technical Seminar, Environment Canada,Ottawa, ON, pp 37-46, 1984.
Mackay, D., S. Paterson, and K. Trudel, “A Mathematical Model of Oil Spill Behaviour”,Manuscript Report EE-7, Environmental Protection Service, Environment Canada, Ottawa, ON,50 p, 1980a.
Mackay, D., I. Buist, R. Mascarenhas, and S. Paterson, “Oil Spill Processes and Models”,Manuscript Report EE-8, Environmental Protection Service, Environment Canada, Ottawa, ON,96 p, 1980b.
600.431.050801.MFtrendsANSC.pdf
47
McDonagh, M., J.N. Hokstad, and A.B. Nordvik, “Standard Method for Viscosity Measurementof Water-in-Oil Emulsions”, MSRC Technical Report Series 95-003, Marine Spill ResponseCorporation, Washington, DC, 36 p, 1995.
McLean, J.D. and P.K. Kilpatrick, “Effects of Asphaltene Solvency on Stability of Water-in-OilEmulsions”, Journal of Colloid and Interface Science, Vol. 189, pp 242-253, 1997a.
McLean, J.D. and P.K. Kilpatrick, “Effects of Asphaltene Aggregation in Model Heptane-Toluene Mixtures on Stability of Water-in-Oil Emulsions”, Journal of Colloid and InterfaceScience, Vol. 196, pp 23-34, 1997b.
McLean, J.D., P.M. Spiecker, A.P. Sullivan, and P.K. Kilpatrick, “The Role of PetroleumAsphaltenes in the Stabilization of Water-in-Oil Emulsions”, in Structure and Dynamics ofAsphaltenes, Mullins and Sheu (eds.), Plenum Press, New York, NY, pp 377-422, 1998.
Mingyuan, L., A.A. Christy, and J. Sjöblom, “Water-in-Crude Oil Emulsions from theNorwegian Continental Shelf: Part VI. Diffuse Reflectance Fourier Transform InfraredCharacterization of Interfacially Active Fractions from North Sea Crude Oil”, in Emulsions - AFundamental and Practical Approach, J. Sjöblom (ed.), Kluwer Academic Publishers,Dordrecht, The Netherlands, pp 157-172, 1992.
Miyahara, S., “On the Formation of Water-In-Oil Emulsions”, in Proceedings of Oil inFreshwater: Chemistry, Biology, Countermeasure Technology, John H. Vandermeulen and SteveE. Hrudey (eds.), Pergamon Press, New York, NY, 1985.
Mohammed, R.A., A.I. Bailey, P.F. Luckham, and S.E. Taylor, “Dewatering of Crude OilEmulsions: 2. Interfacial Properties of the Asphaltic Constituents of Crude Oil”, Colloids andSurfaces A, Vol. 80, pp 237-242, 1993a.
Mohammed, R.A., A.I. Bailey, P.F. Luckham, and S.E. Taylor, “Dewatering of Crude OilEmulsions: 1. Rheological Behaviour of the Crude Oil-Water Interface”, Colloids and SurfacesA, Vol. 80, pp 223-235, 1993b.
Mouraille, O., T. Skodvin, J. Sjöblom, and J.-L. Peytavy, “Stability of Water-in-Crude OilEmulsions: Role Played by the State of Solvation of Asphaltenes and by Waxes”, Journal ofDispersion Science and Technology, Vol. 19, pp 339-367, 1998.
Nesterova, M.P., O.S. Mochalova, and A.B. Mamayev, “Transformation of Oil-in-WaterEmulsion into Solid Tar Balls in the Sea”, Oceanology, Vol. 23, No. 6, pp 734-737, 1983.
Neumann, H.J. and B. Paczynska-Lahme, “Stability and Demulsification of PetroleumEmulsions”, Progress in Colloid and Polymer Sciences, Vol. 101, pp 101-104, 1996.
600.431.050801.MFtrendsANSC.pdf
48
Nordli, K.G., J. Sjöblom, and P. Stenius, “Water-in-Crude Oil Emulsions from the NorwegianContinental Shelf: 4. Monolayer Properties of the Interfacially Active Crude Oil Fraction”,Colloids and Surfaces, Vol. 57, pp 83-98, 1991.
Omar, A.E., S.M. Desouky, and B. Karama, Journal of Petroleum Science and Engineering, Vol. 6, pp 149-160, 1991.
Paczynska-Lahme, B., “Mesophases in Petroleum”, Progress in Colloid & Polymer Science,Vol. 83, pp 196-199, 1990.
Pal, R., “Effect of Droplet Size on the Rheology of Emulsions”, AIChE Journal, Vol. 42, pp 3181-3190, 1996.
Payne, J.R. and C.R. Phillips, Petroleum Spills in the Marine Environment - The Chemistry andFormation of Water-in-Oil Emulsions and Tar Balls, Lewis Publishers Inc., Chelsea, MI, 1985.
Puskas, S., J. Balazs, A. Farkas, I. Regdon, O. Berkesi, and I. Dekany, “The Significance ofColloidal Hydrocarbons in Crude Oil Production: Part 1. New Aspects of the Stability andRheological Properties of Water-Crude Oil Emulsions”, Colloids and Surfaces, Vol. 113, pp 279-293, 1996.
Reed, M., “The Physical Fates Component of the Natural Resource Damage Assessment ModelSystem”, Oil and Chemical Pollution, Vol. 5, pp 99-123, 1989.
Rønningsen, H.P., J. Sjöblom, and L. Mingyuan, “Water-in-Crude Oil Emulsions from theNorwegian Continental Shelf: 11. Ageing of Crude Oils and Its Influence on the EmulsionStability”, Colloids and Surfaces A, Vol. 97, pp 119-128, 1995.
Schildberg, Y., J. Sjoblom, A.A. Christy, J.-L. Volle, and O. Rambeau, “Characterization ofInterfacially Active Fractions and their Relations to Water-in-Oil Emulsion Stability”, Journal ofDispersion Science and Technology, Vol. 16, pp 575-605, 1995.
Singh, S., J.D. McLean, and P.K. Kilpatrick, “Fused Ring Aromatic Solvency in DestabilizingWater-in-Asphaltene-Heptane-Toluene Emulsions”, Journal of Dispersion Science andTechnology, Vol. 20 (1&2), pp 279-293, 1999.
Sjöblom, J., O. Urdahl, H. Høiland, A.A. Christy, and E.J. Johansen, “Water-In-Crude OilEmulsions: Formation, Characterization and Destabilization”, Progress in Colloid & PolymerScience, Vol. 82, pp 131-139, 1990a.
Sjöblom, J., H. Söderlund, S. Lindblad, E.J. Johansen, and I.M. Skjärvo, “Water-in-Crude OilEmulsions from the Norwegian Continental Shelf: Part II. Chemical Destabilization andInterfacial Tensions”, Colloid and Polymer Science, Vol. 268, pp 389-398, 1990b.
600.431.050801.MFtrendsANSC.pdf

49
Sjöblom, J., O. Urdahl, K.G.N. Børve, L. Mingyuan, J.O. Saeten, A.A. Christy, and T. Gu,“Stabilization and Destabilization of Water-in-Oil Emulsions from the Norwegian ContinentalShelf: Correlation With Model Systems”, Advances in Colloids and Interface Science, Vol. 41,pp 241-271, 1992.
Sjöblom, J., T. Skodvin, T. Jakobsen, and S.S. Dukhin, “Dielectric Spectroscopy and Emulsions:A Theoretical and Experimental Approach”, Journal of Dispersion Science and Technology,Vol. 15, pp 401-421, 1994.
Sjöblom, J., L. Mingyuan, A.A. Christy, and H.P. Ronningsen, “Water-in-Crude Oil Emulsionsfrom the Norwegian Continental Shelf: 10: Ageing of the Interfacially Active Components andthe Influence on the Emulsion Stability”, Colloids and Surfaces A, Vol. 96, pp 261-272, 1995.
Sjöblom, J., T. Skodvin, O. Holt, and F.P. Nilsen, “Colloid Chemistry and ModernInstrumentation in Offshore Petroleum Production and Transport”, Colloids and Surfaces,Vol. 123/124 A, pp 593-607, 1997.
Sjöblom, J., H. Førdedal, T. Skodvin, and B. Gestblom, “Emulsions Characterized by Means ofTime Domain Dielectric Measurements (TDS): Technical Applications”, Journal of DispersionScience and Technology, Vol. 30(3), pp 921-943, 1999.
Skodvin, T., T. Jakobsen, and J. Sjöblom, “Dielectric Properties of W/O Emulsions UnderFlow”, Journal of Dispersion Science and Technology, Vol. 15, pp 423-448, 1994a.
Skodvin, T., J. Sjöblom, J.O. Saeten, O. Urdahl, and B. Gestblom, “Water-in-Crude OilEmulsions from the Norwegian Continental Shelf”, Journal of Colloid and Interface Science,Vol. 166, pp 43-50, 1994b.
Skodvin, T. and J. Sjöblom, “Models for the Dielectric Properties of Flocculated W/O-Emulsions”, Journal of Colloid and Interface Science, Vol. 182, pp 190-198, 1996.
Steinborn, R. and D.L. Flock, “The Rheology of Heavy Crude Oils and their Emulsions”, Journalof Canadian Petroleum Technology, Vol. 22, pp 38-52, 1983.
Stiver, W., M. Novak, W.Y. Shiu, and D. Mackay, “Recent University of Toronto Studies on theFate and Effects of Oil in the Marine Environment”, in Proceedings of the Sixth Annual ArcticMarine Oilspill Program Technical Seminar, Environment Canada, Ottawa, ON, pp 24-29, 1983.
Stiver, W. and D. Mackay, “Evaporation Rate of Spills of Hydrocarbons and PetroleumMixtures”, Environmental Science and Technology, Vol. 18, pp 834-840, 1984.
Tadros, Th.F., “Fundamental Principles of Emulsion Rheology and their Applications”, Colloidsand Surfaces A, Vol. 91, pp 39-55, 1994.
600.431.050801.MFtrendsANSC.pdf
50
Tambe, D.E. and M.M. Sharma, “The Effect of Colloidal Particles on Fluid-Fluid InterfacialProperties and Emulsion Stability”, Advances in Colloid and Interface Science, Vol. 52, pp 1-63,1994.
Thingstad, T. and B. Pengerud, “The Formation of ‘Chocolate Mousse’ from Statfjord Crude Oiland Seawater”, Marine Pollution Bulletin, Vol. 14, No. 6, pp 214-216, 1983.
Toulhoat, H., C. Prayer, and G. Rouquet, “Characterization by Atomic Force Microscopy ofAdsorbed Asphaltenes”, Colloids and Surfaces A, Vol. 91, pp 267-283, 1994.
Twardus, E.M., “A Study to Evaluate the Combustibility and Other Physical and ChemicalProperties of Aged Oils and Emulsions”, Manuscript Report EE-5, Environmental ProtectionService, Environment Canada, Ottawa, ON, 159 p, 1980.
Urdahl, O., T. Brekke, and J. Sjöblom, “ C NMR and Multivariate Statistical Analysis of13
Adsorbed Surface-Active Crude Oil Fractions and the Corresponding Crude Oils”, Fuel, Vol. 71,pp 739-746, 1992.
Urdahl, O. and J. Sjöblom, “Water-in-Crude Oil Emulsions from the Norwegian ContinentalShelf: A Stabilization and Destabilization Study”, Journal of Dispersion Science andTechnology, Vol. 16, pp 557-574, 1995.
Walker, M., “Crude Oil Emulsification: A Comparison of Laboratory and Sea Trials Data”, inFormation and Breaking of Water-in-Oil Emulsions Workshop, Technical Report Series 93-018,Marine Spill Response Corporation, Washington, DC, pp 163-178, 1993.
Walker, M.I., T. Lunel, P.J. Brandvik, and A. Lewis, “Emulsification Processes at Sea - FortiesCrude Oil”, in Proceedings of the Eighteenth Arctic Marine Oilspill Program TechnicalSeminar, Environment Canada, Ottawa, ON, pp 471-491, 1995.
Wang, H. and C.P. Huang, “The Effect of Turbulence on Oil Emulsification”, presented at theworkshop on The Physical Behaviour of Oil in the Marine Environment, Princeton University,Princeton, NJ, pp 81-100, 1979.
Wang, Z., B.P. Hollebone, M. Fingas, B. Fieldhouse, C. Yang, M. Landriault, and S. Peng,“Characteristics of Spilled Oils, Fuels, and Petroleum Products: I Composition and Properties ofSelected Oils”, U.S. Environmental Protection Agency, EPA/600/R-03/072, National ExposureLaboratory, Atlanta, GA, 2004.
600.431.050801.MFtrendsANSC.pdf
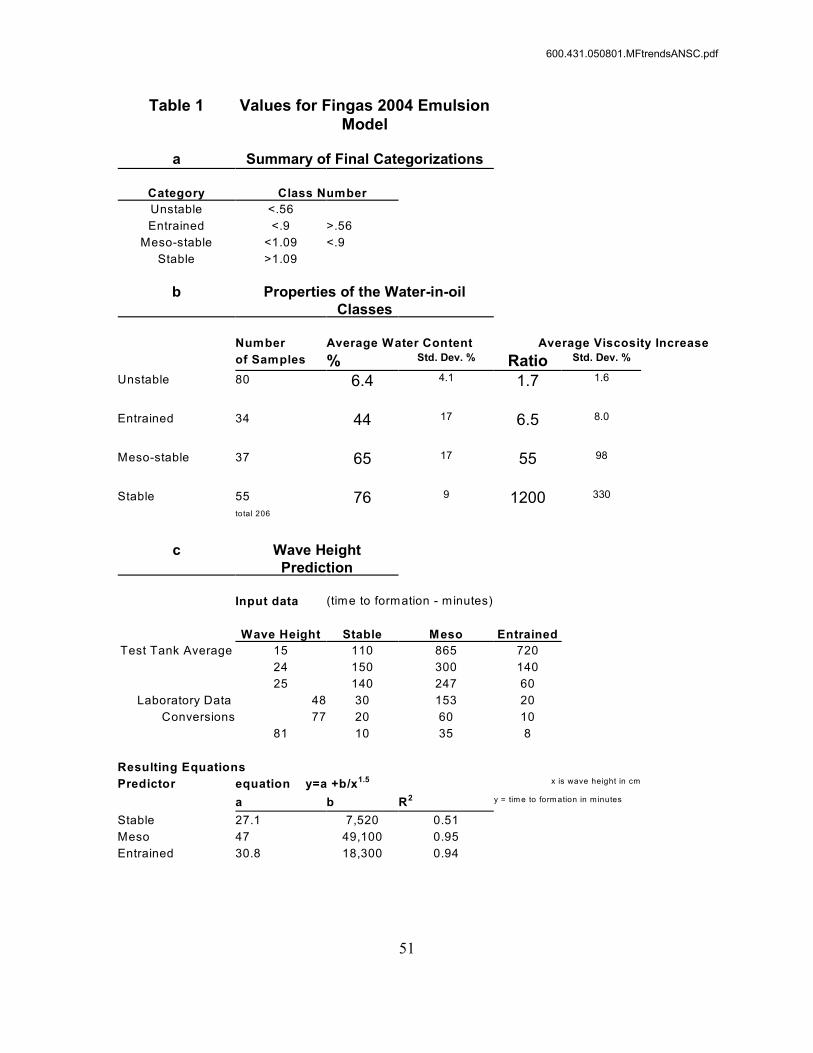
51
Table 1 Values for Fingas 2004 EmulsionModel
a Summary of Final Categorizations
Category Class Number
Unstable <.56
Entrained <.9 >.56
Meso-stable <1.09 <.9
Stable >1.09
b Properties of the Water-in-oilClasses
Number Average Water Content Average Viscosity Increase
of Samples % Std. Dev. % Ratio Std. Dev. %
Unstable 80 6.4 4.1 1.7 1.6
Entrained 34 44 17 6.5 8.0
Meso-stable 37 65 17 55 98
Stable 55 76 9 1200 330
total 206
c Wave HeightPrediction
Input data (time to formation - minutes)
Wave Height Stable Meso Entrained
Test Tank Average 15 110 865 720
24 150 300 140
25 140 247 60
Laboratory Data 48 30 153 20
Conversions 77 20 60 10
81 10 35 8
Resulting Equations
Predictor equation y=a +b/x1.5 x is wave height in cm
a b R2 y = tim e to form ation in m inutes
Stable 27.1 7,520 0.51
Meso 47 49,100 0.95
Entrained 30.8 18,300 0.94
600.431.050801.MFtrendsANSC.pdf
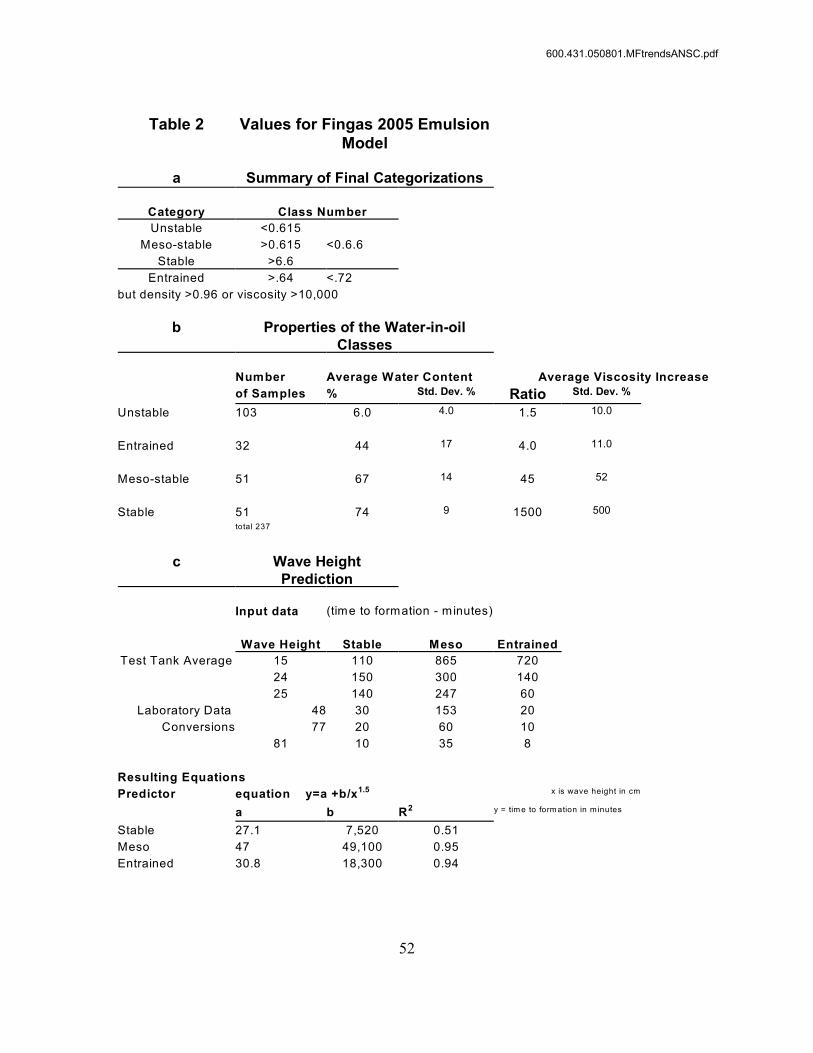
52
Table 2 Values for Fingas 2005 EmulsionModel
a Summary of Final Categorizations
Category Class Number
Unstable <0.615
Meso-stable >0.615 <0.6.6
Stable >6.6
Entrained >.64 <.72
but density >0.96 or viscosity >10,000
b Properties of the Water-in-oilClasses
Number Average Water Content Average Viscosity Increase
of Samples % Std. Dev. % Ratio Std. Dev. %
Unstable 103 6.0 4.0 1.5 10.0
Entrained 32 44 17 4.0 11.0
Meso-stable 51 67 14 45 52
Stable 51 74 9 1500 500
total 237
c Wave HeightPrediction
Input data (time to formation - minutes)
Wave Height Stable Meso Entrained
Test Tank Average 15 110 865 720
24 150 300 140
25 140 247 60
Laboratory Data 48 30 153 20
Conversions 77 20 60 10
81 10 35 8
Resulting Equations
Predictor equation y=a +b/x1.5 x is wave height in cm
a b R2 y = tim e to form ation in m inutes
Stable 27.1 7,520 0.51
Meso 47 49,100 0.95
Entrained 30.8 18,300 0.94
600.431.050801.MFtrendsANSC.pdf
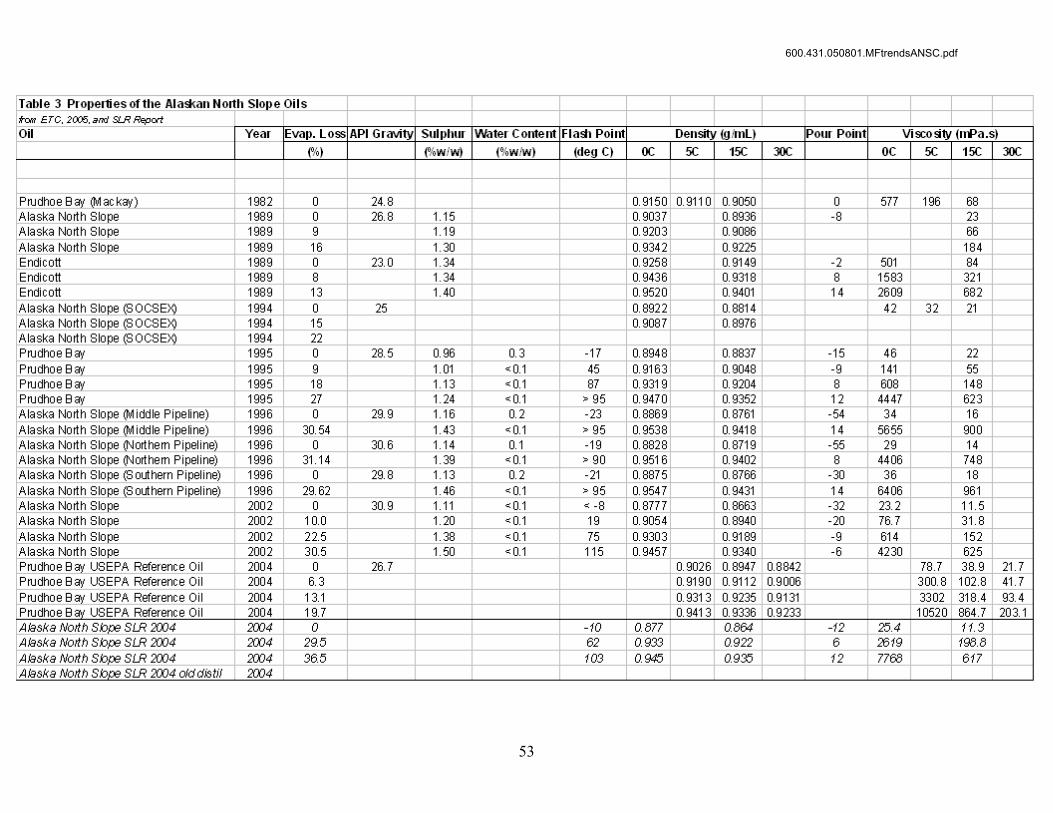
53
600.431.050801.MFtrendsANSC.pdf
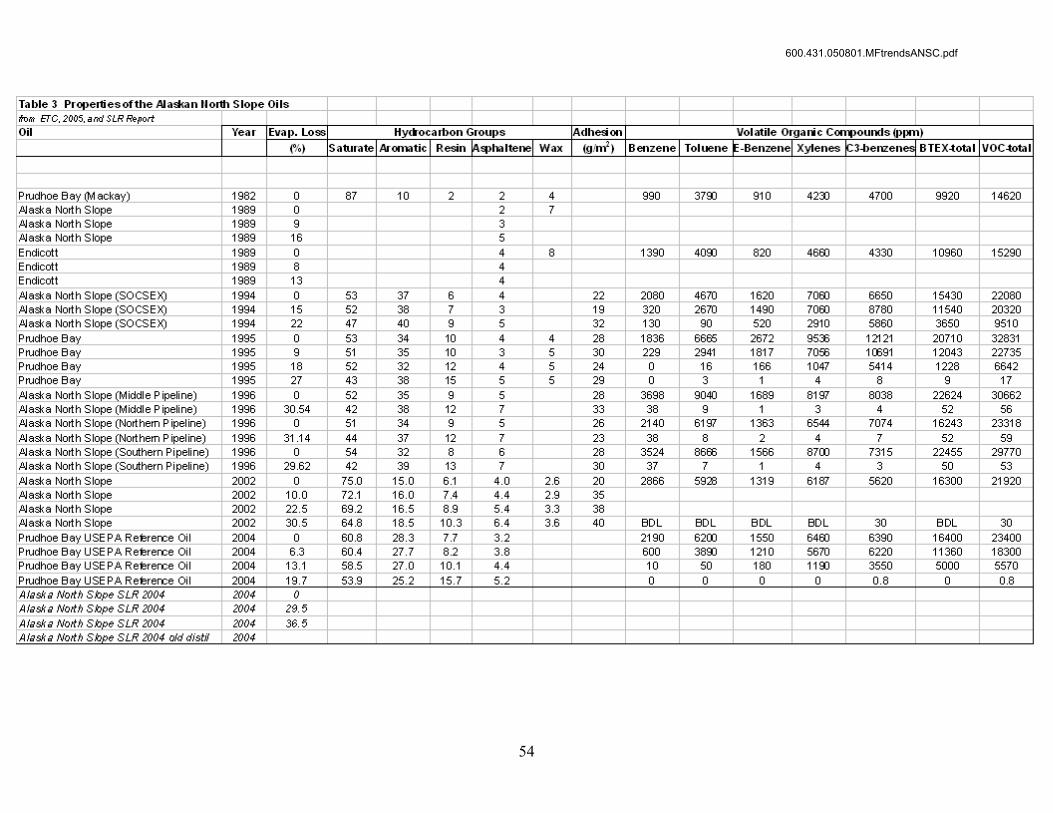
54
600.431.050801.MFtrendsANSC.pdf
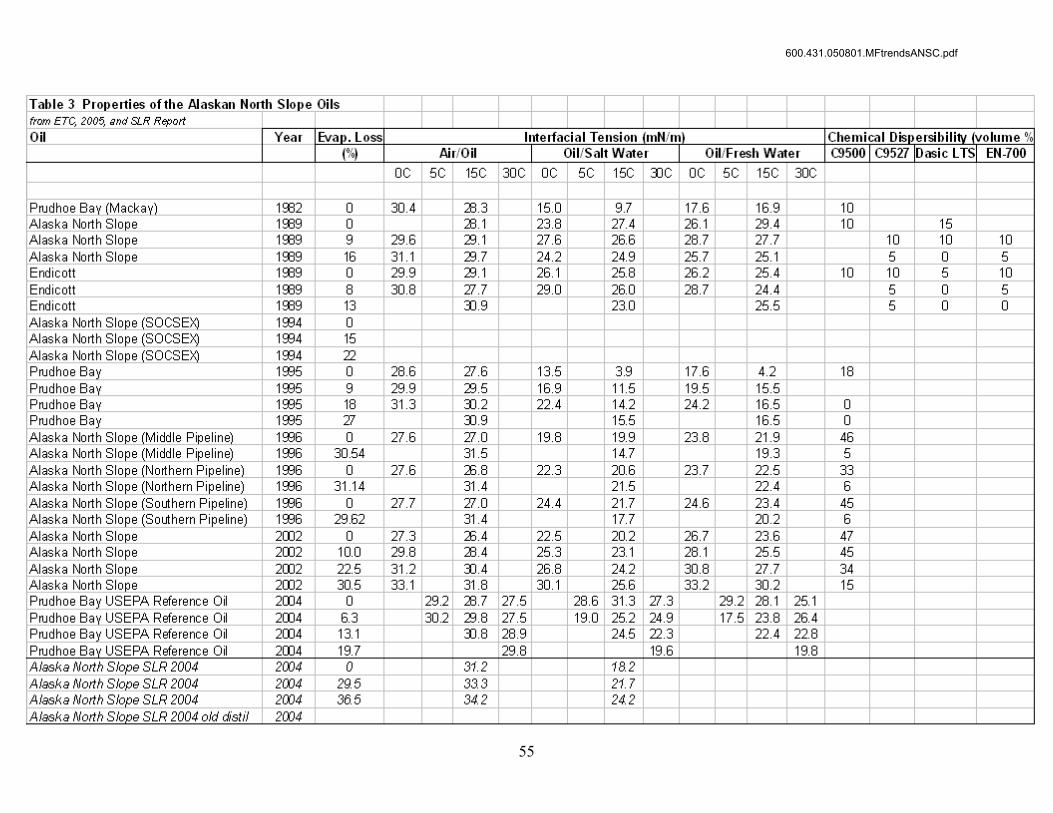
55
600.431.050801.MFtrendsANSC.pdf
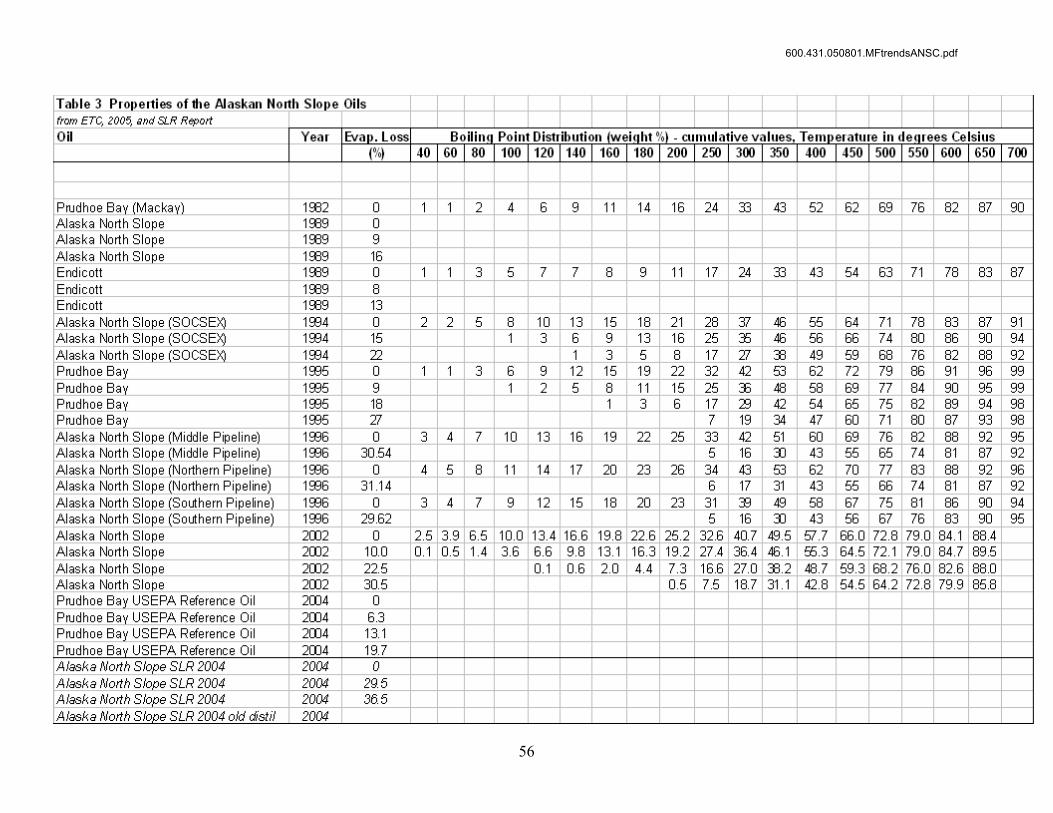
56
600.431.050801.MFtrendsANSC.pdf
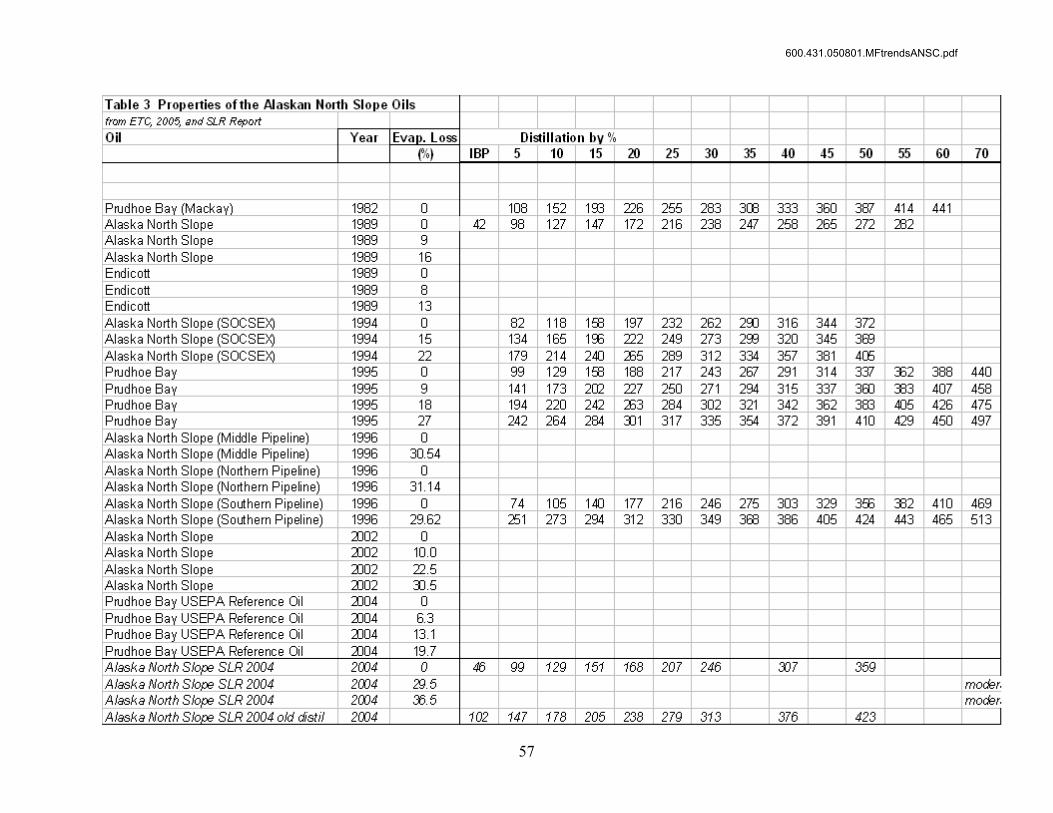
57
600.431.050801.MFtrendsANSC.pdf

58
600.431.050801.MFtrendsANSC.pdf
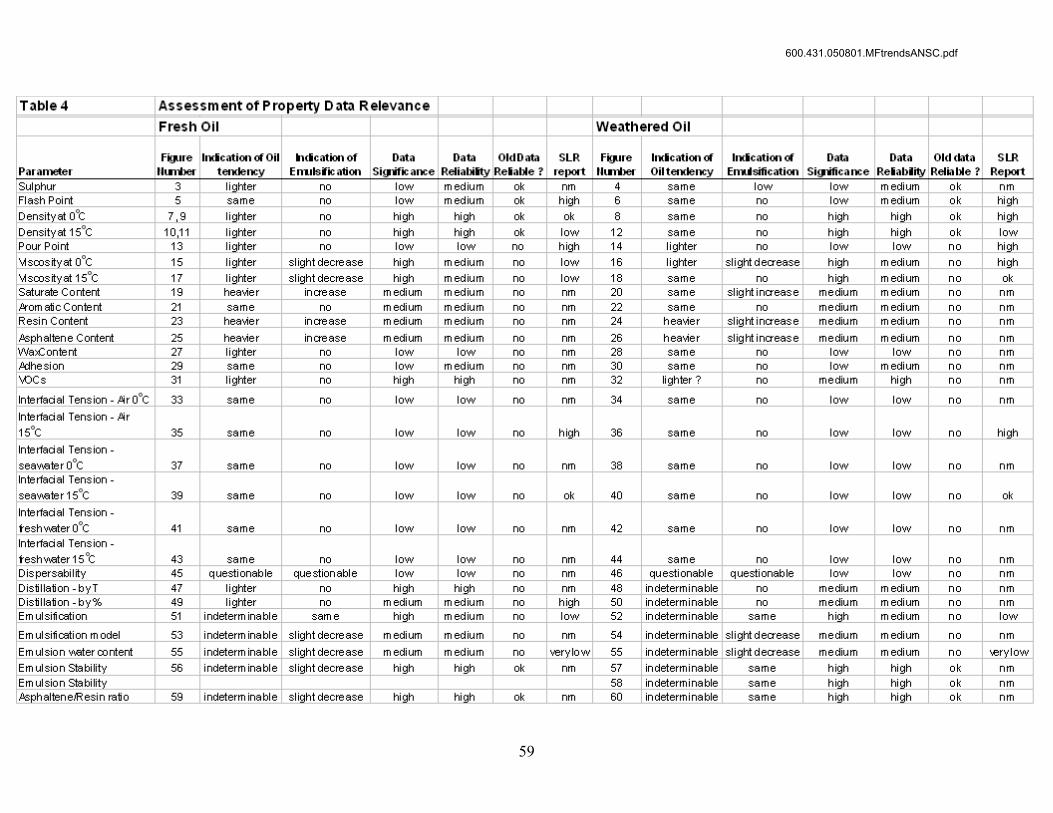
59
600.431.050801.MFtrendsANSC.pdf

60
600.431.050801.MFtrendsANSC.pdf
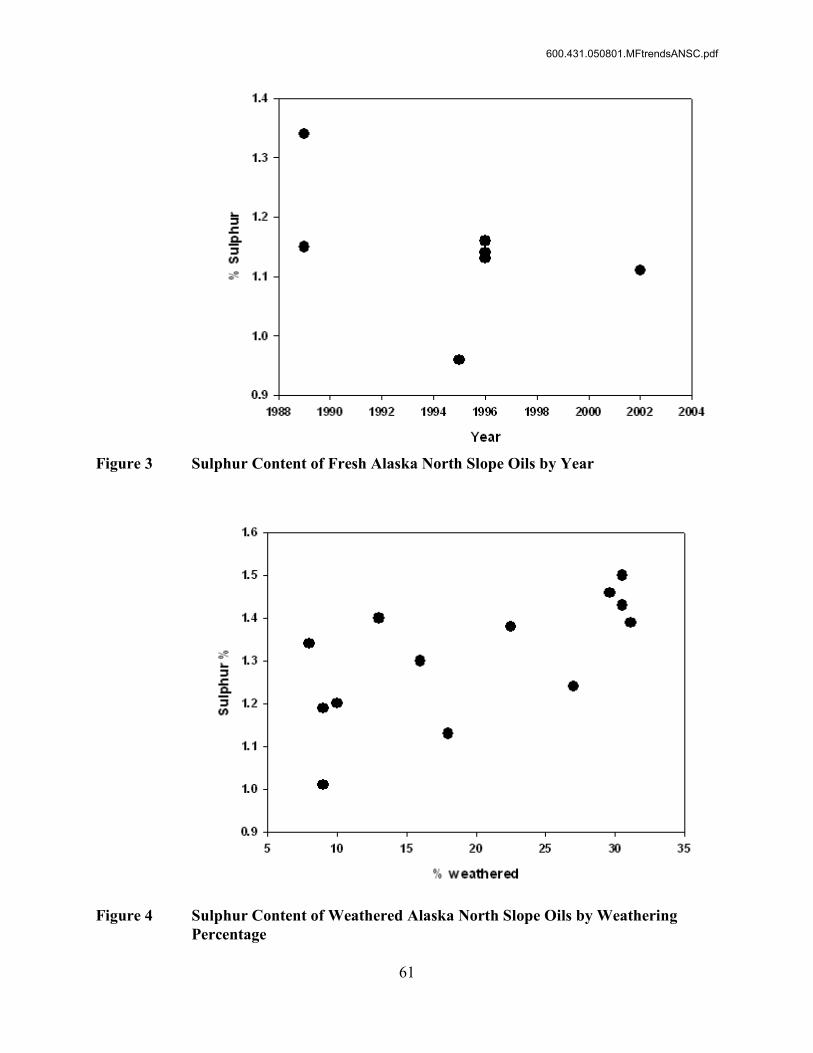
61
Figure 3 Sulphur Content of Fresh Alaska North Slope Oils by Year
Figure 4 Sulphur Content of Weathered Alaska North Slope Oils by WeatheringPercentage
600.431.050801.MFtrendsANSC.pdf

62
Figure 5 Flash Point of Fresh Alaska North Slope Oils by Year (Arrow indicatesdata from SLR Report.)
Figure 6 Flash Point of Weathered Alaska North Slope Oils by WeatheringPercentage
600.431.050801.MFtrendsANSC.pdf
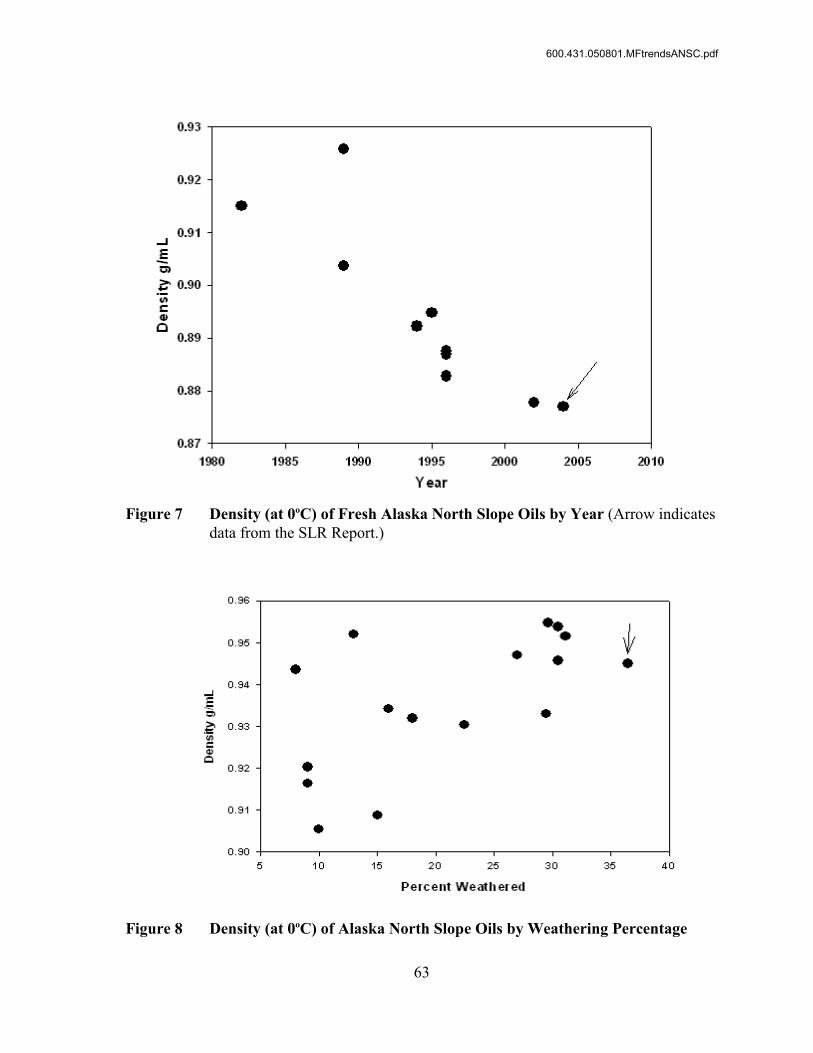
63
Figure 7 Density (at 0 C) of Fresh Alaska North Slope Oils by Year (Arrow indicateso
data from the SLR Report.)
Figure 8 Density (at 0 C) of Alaska North Slope Oils by Weathering Percentageo
600.431.050801.MFtrendsANSC.pdf
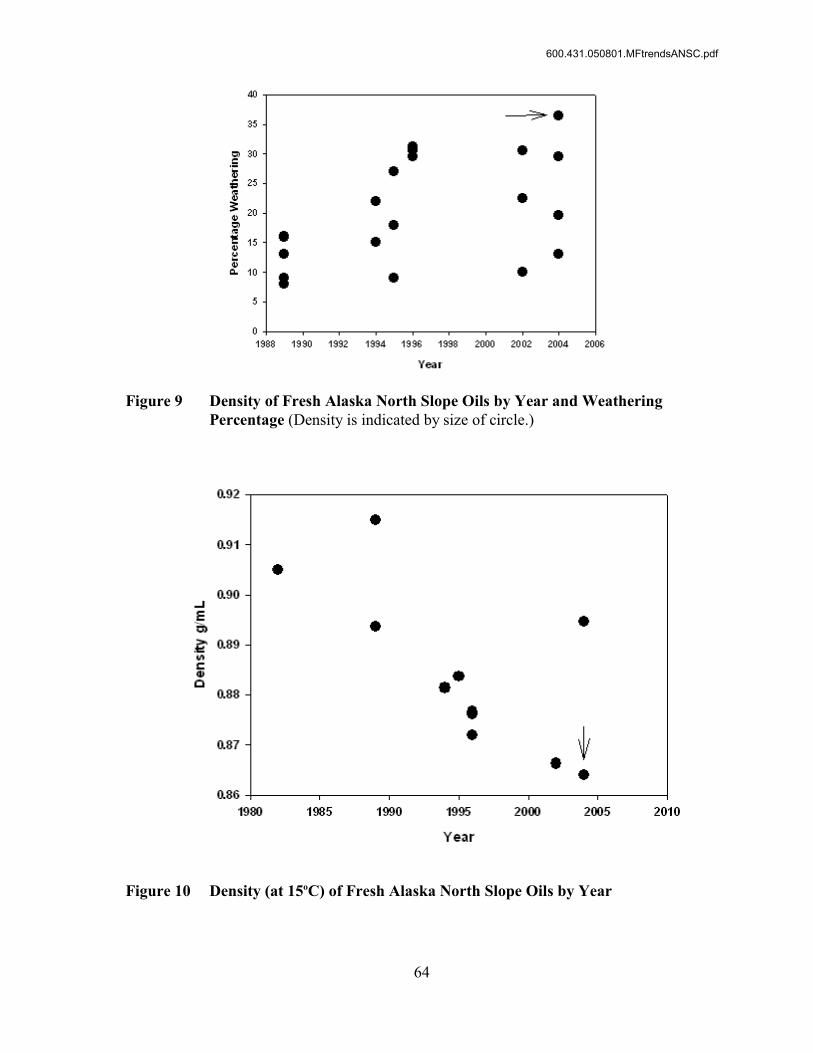
64
Figure 9 Density of Fresh Alaska North Slope Oils by Year and WeatheringPercentage (Density is indicated by size of circle.)
Figure 10 Density (at 15 C) of Fresh Alaska North Slope Oils by Yearo
600.431.050801.MFtrendsANSC.pdf
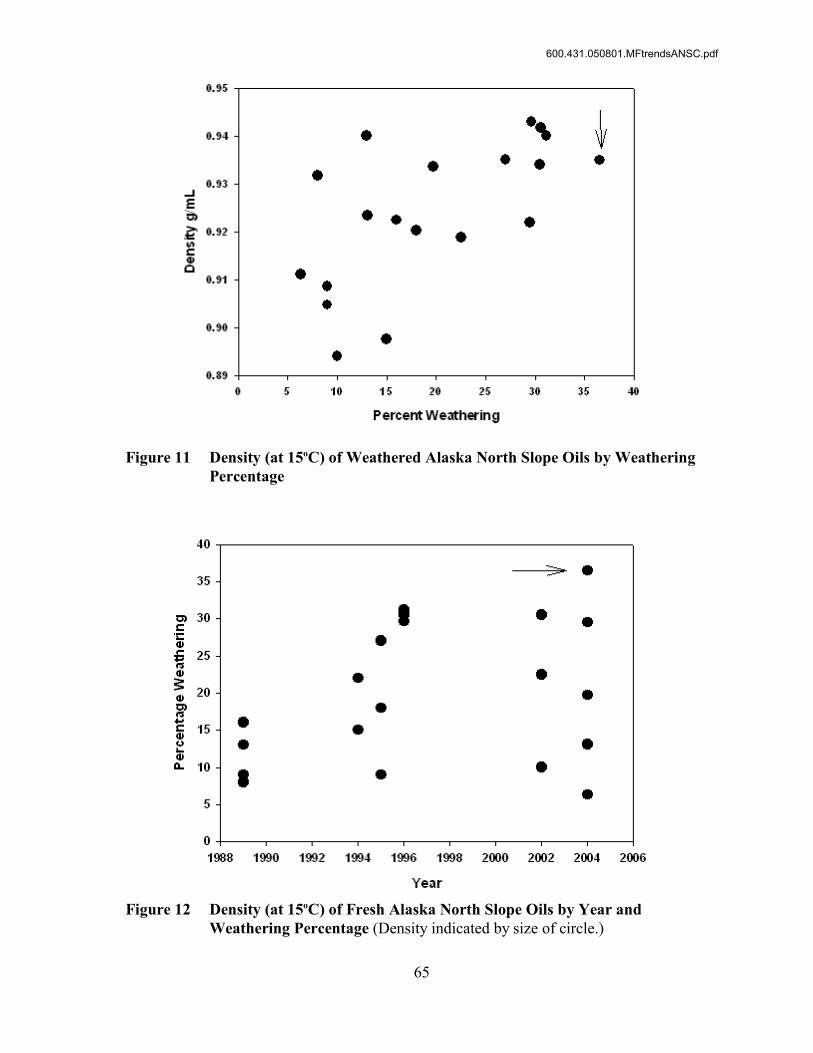
65
Figure 11 Density (at 15 C) of Weathered Alaska North Slope Oils by Weatheringo
Percentage
Figure 12 Density (at 15 C) of Fresh Alaska North Slope Oils by Year ando
Weathering Percentage (Density indicated by size of circle.)
600.431.050801.MFtrendsANSC.pdf

66
Figure 13 Pour Point of Fresh Alaska North Slope Oils by Year
Figure 14 Pour Point of Weathered Alaska North Slope Oils by WeatheringPercentage
600.431.050801.MFtrendsANSC.pdf
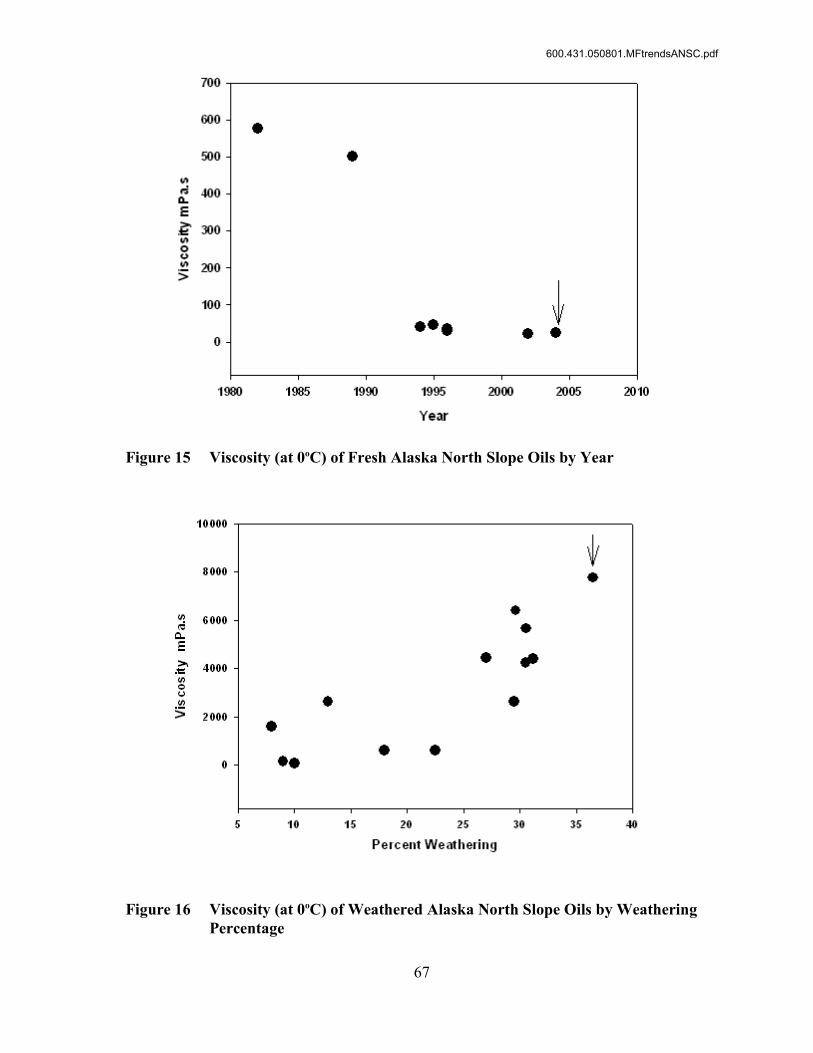
67
Figure 15 Viscosity (at 0 C) of Fresh Alaska North Slope Oils by Yearo
Figure 16 Viscosity (at 0 C) of Weathered Alaska North Slope Oils by Weatheringo
Percentage
600.431.050801.MFtrendsANSC.pdf

68
Figure 17 Viscosity (at 15 C) of Fresh Alaska North Slope Oils by Yearo
Figure 18 Viscosity (at 15 C) of Weathered Alaska North Slope Oils by Weatheringo
Percentage
600.431.050801.MFtrendsANSC.pdf
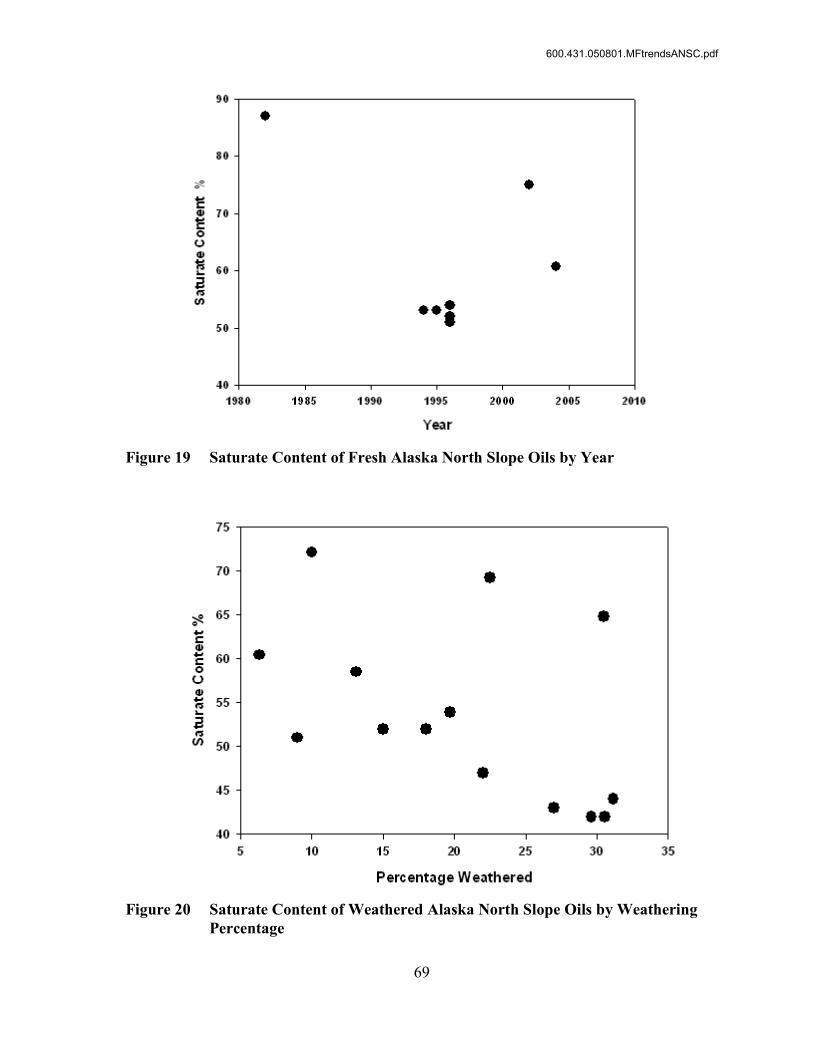
69
Figure 19 Saturate Content of Fresh Alaska North Slope Oils by Year
Figure 20 Saturate Content of Weathered Alaska North Slope Oils by WeatheringPercentage
600.431.050801.MFtrendsANSC.pdf

70
Figure 21 Aromatic Content of Fresh Alaska North Slope Oils by Year
Figure 22 Aromatic Content of Weathered Alaska North Slope Oils by WeatheringPercentage
600.431.050801.MFtrendsANSC.pdf
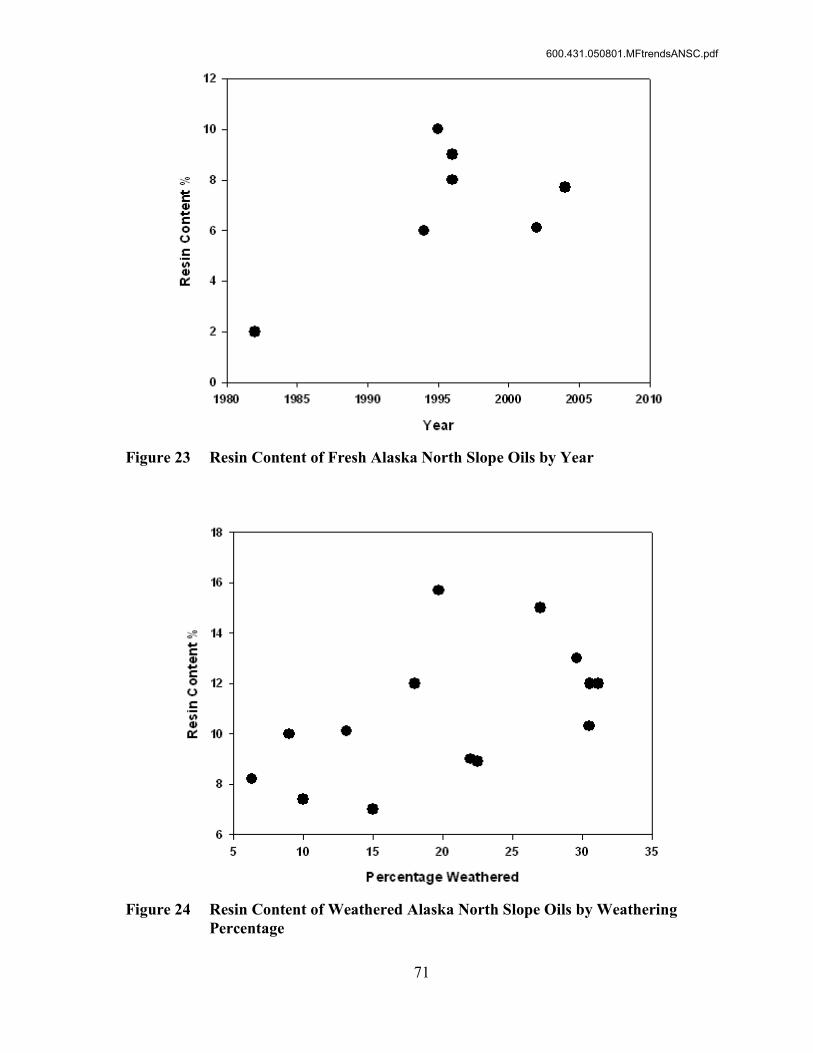
71
Figure 23 Resin Content of Fresh Alaska North Slope Oils by Year
Figure 24 Resin Content of Weathered Alaska North Slope Oils by WeatheringPercentage
600.431.050801.MFtrendsANSC.pdf
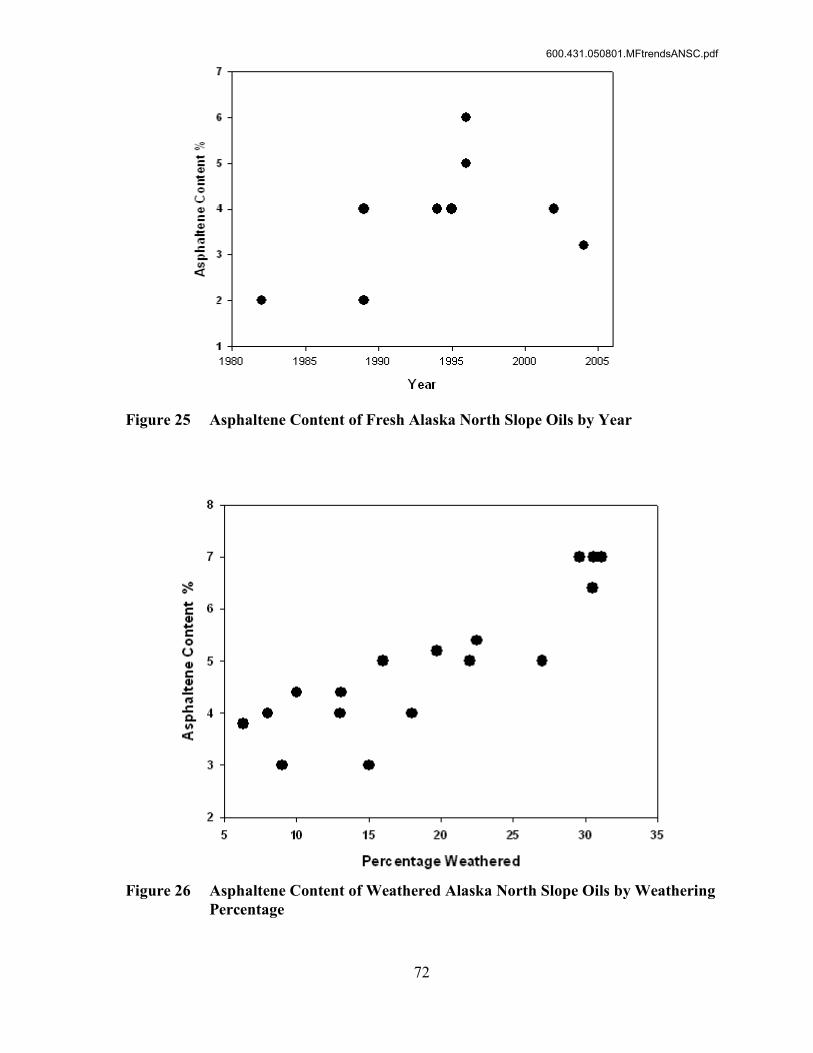
72
Figure 25 Asphaltene Content of Fresh Alaska North Slope Oils by Year
Figure 26 Asphaltene Content of Weathered Alaska North Slope Oils by WeatheringPercentage
600.431.050801.MFtrendsANSC.pdf
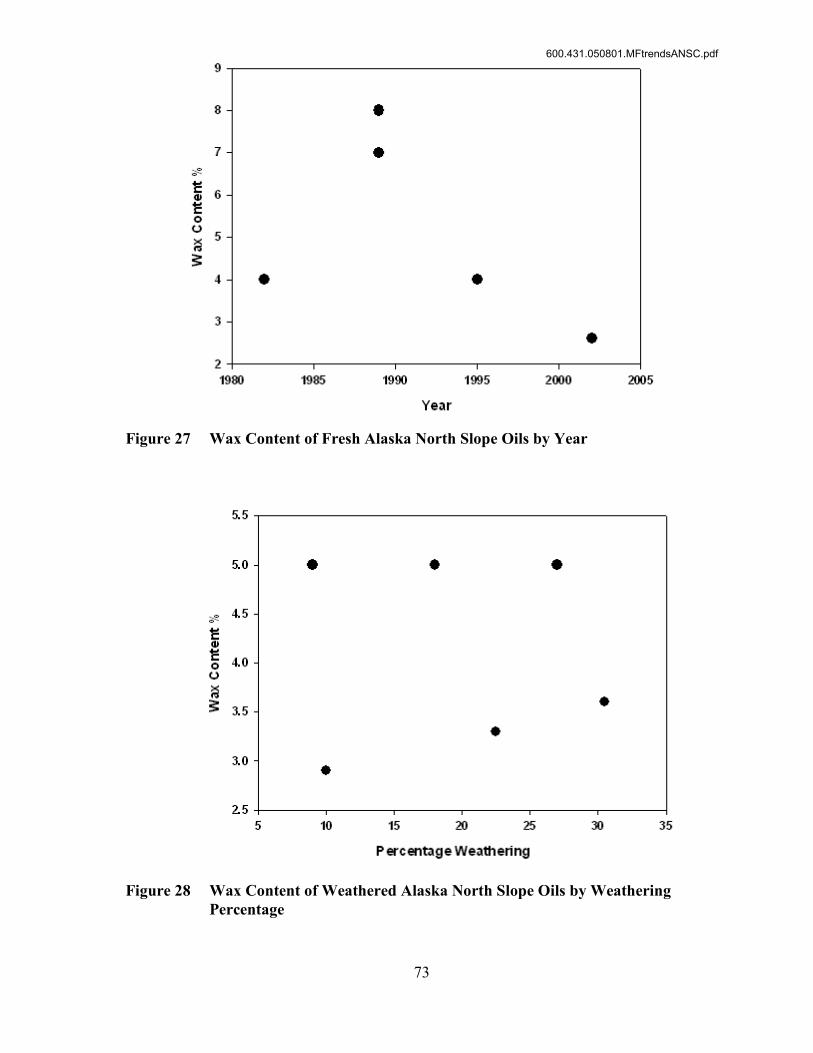
73
Figure 27 Wax Content of Fresh Alaska North Slope Oils by Year
Figure 28 Wax Content of Weathered Alaska North Slope Oils by WeatheringPercentage
600.431.050801.MFtrendsANSC.pdf

74
Figure 29 Adhesion of Fresh Alaska North Slope Oils by Year
Figure 30 Adhesion of Weathered Alaska North Slope Oils by WeatheringPercentage
600.431.050801.MFtrendsANSC.pdf
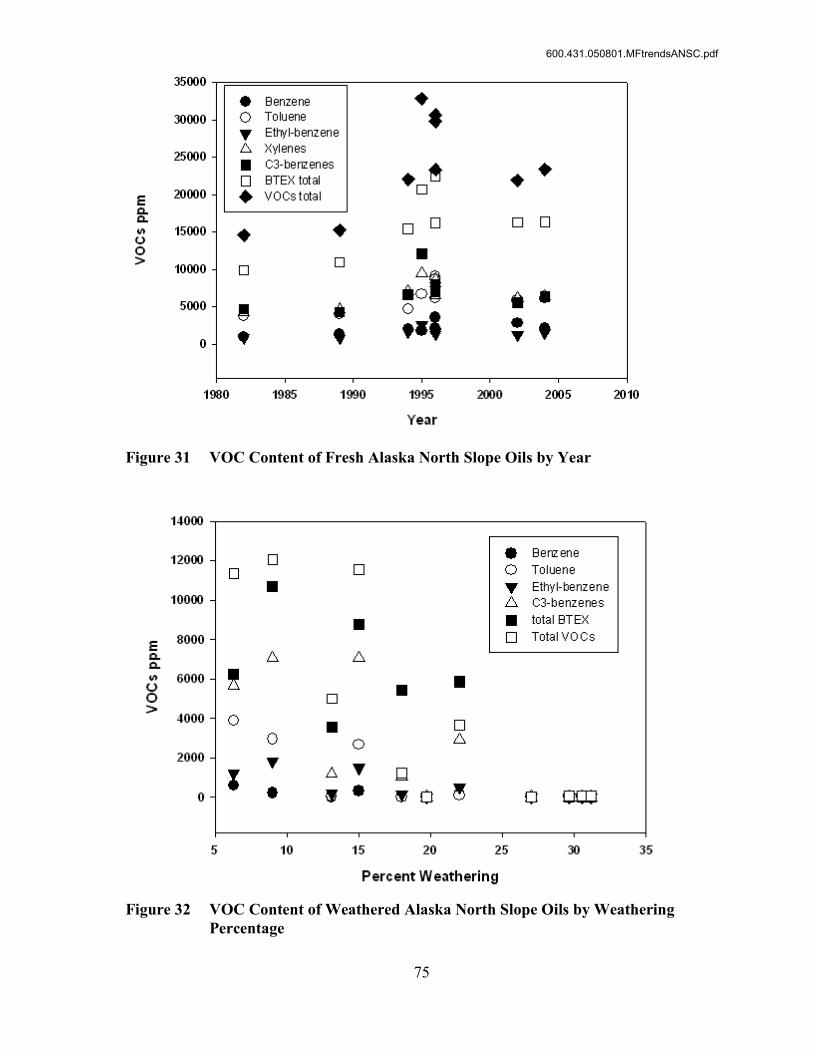
75
Figure 31 VOC Content of Fresh Alaska North Slope Oils by Year
Figure 32 VOC Content of Weathered Alaska North Slope Oils by WeatheringPercentage
600.431.050801.MFtrendsANSC.pdf

76
Figure 33 Interfacial Tension of Fresh Alaska North Slope Oils with Air (at 0 C) byo
Year
Figure 34 Interfacial Tension of Weathered Alaska North Slope Oils with Air (at0 C) by Weathering Percentageo
600.431.050801.MFtrendsANSC.pdf

77
Figure 35 Interfacial Tension of Fresh Alaska North Slope Oils with Air (at 15 C) byo
Year
Figure 36 Interfacial Tension of Weathered Alaska North Slope Oils with Air (at15 C) by Weathering Percentageo
600.431.050801.MFtrendsANSC.pdf

78
Figure 37 Interfacial Tension of Fresh Alaska North Slope Oils with Seawater (at0 C) by Yearo
Figure 38 Interfacial Tension of Weathered Alaska North Slope Oils with Seawater(at 0 C) by Weathering Percentageo
600.431.050801.MFtrendsANSC.pdf
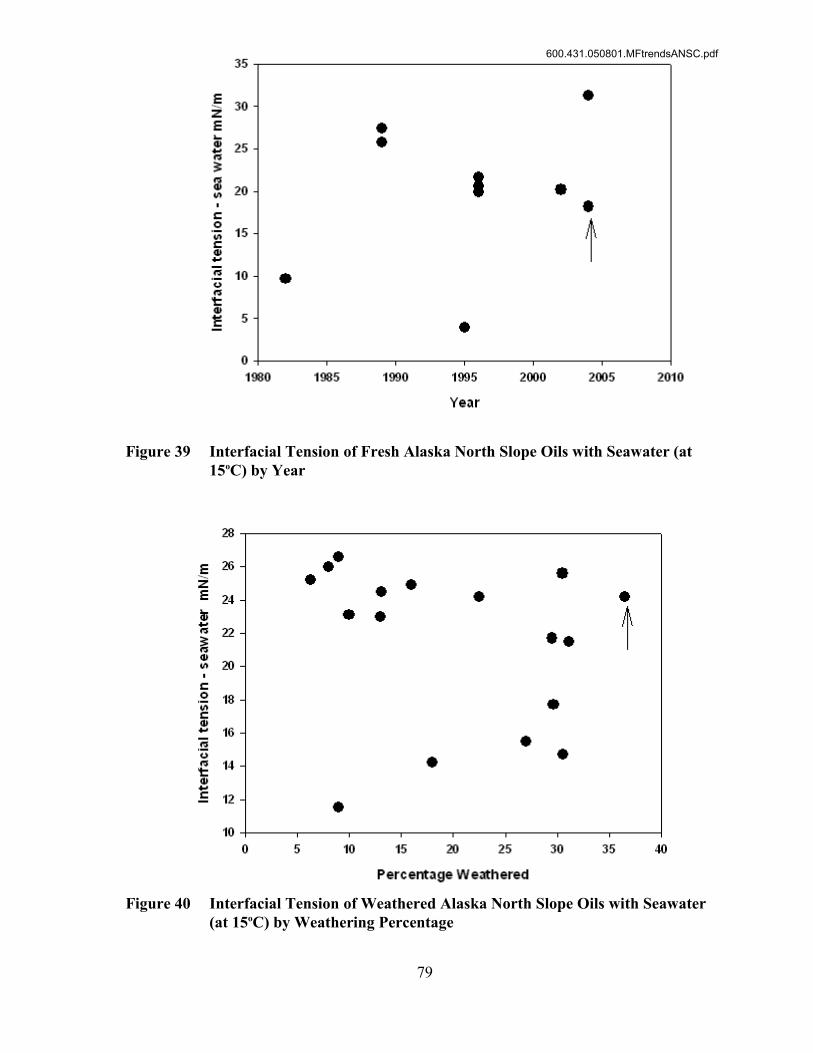
79
Figure 39 Interfacial Tension of Fresh Alaska North Slope Oils with Seawater (at15 C) by Yearo
Figure 40 Interfacial Tension of Weathered Alaska North Slope Oils with Seawater(at 15 C) by Weathering Percentageo
600.431.050801.MFtrendsANSC.pdf
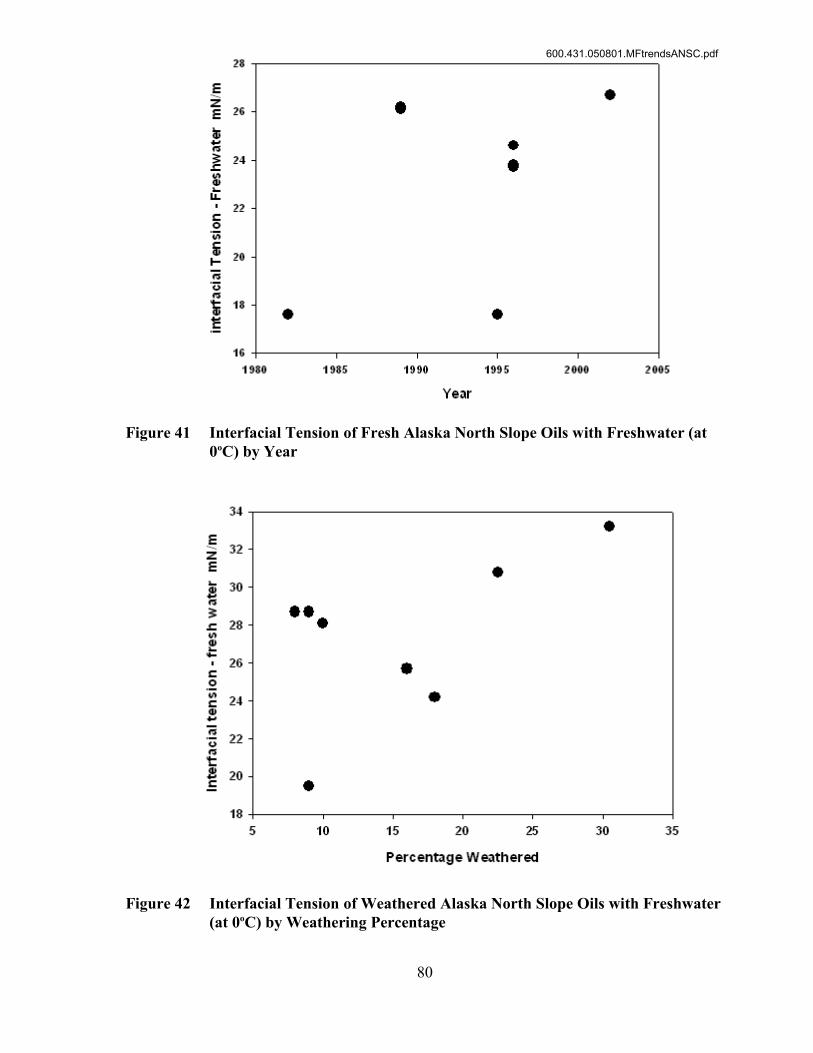
80
Figure 41 Interfacial Tension of Fresh Alaska North Slope Oils with Freshwater (at0 C) by Yearo
Figure 42 Interfacial Tension of Weathered Alaska North Slope Oils with Freshwater(at 0 C) by Weathering Percentageo
600.431.050801.MFtrendsANSC.pdf
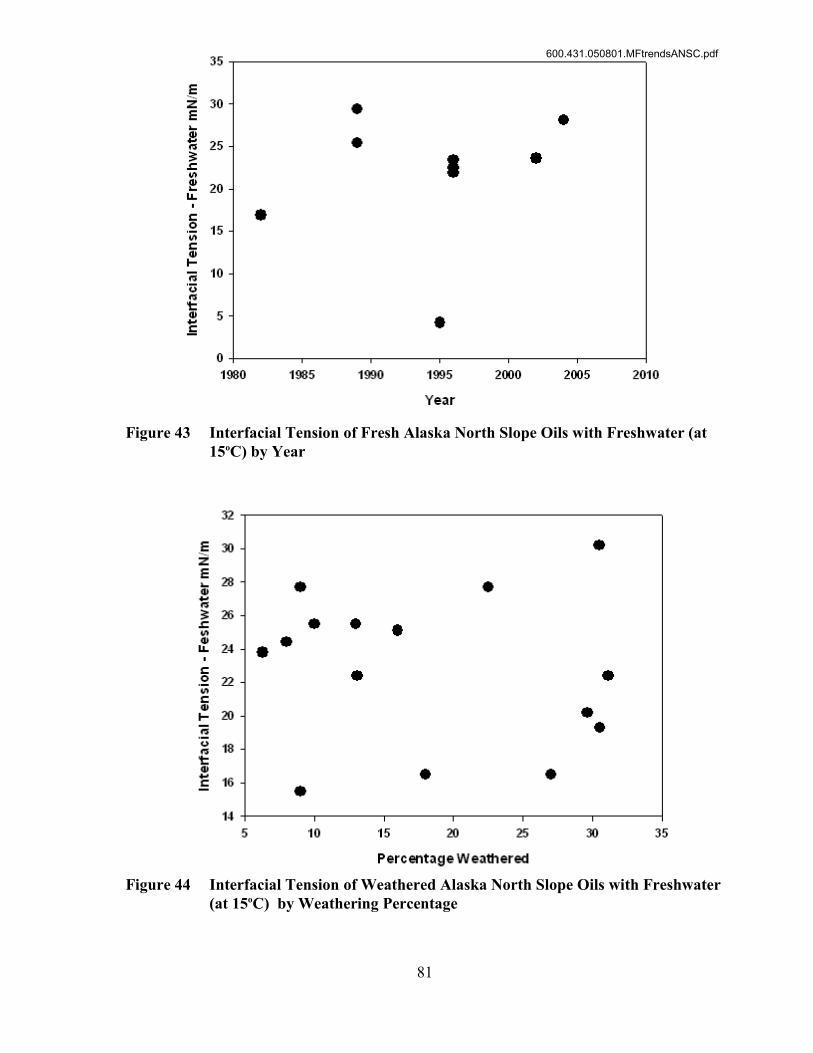
81
Figure 43 Interfacial Tension of Fresh Alaska North Slope Oils with Freshwater (at15 C) by Yearo
Figure 44 Interfacial Tension of Weathered Alaska North Slope Oils with Freshwater(at 15 C) by Weathering Percentageo
600.431.050801.MFtrendsANSC.pdf
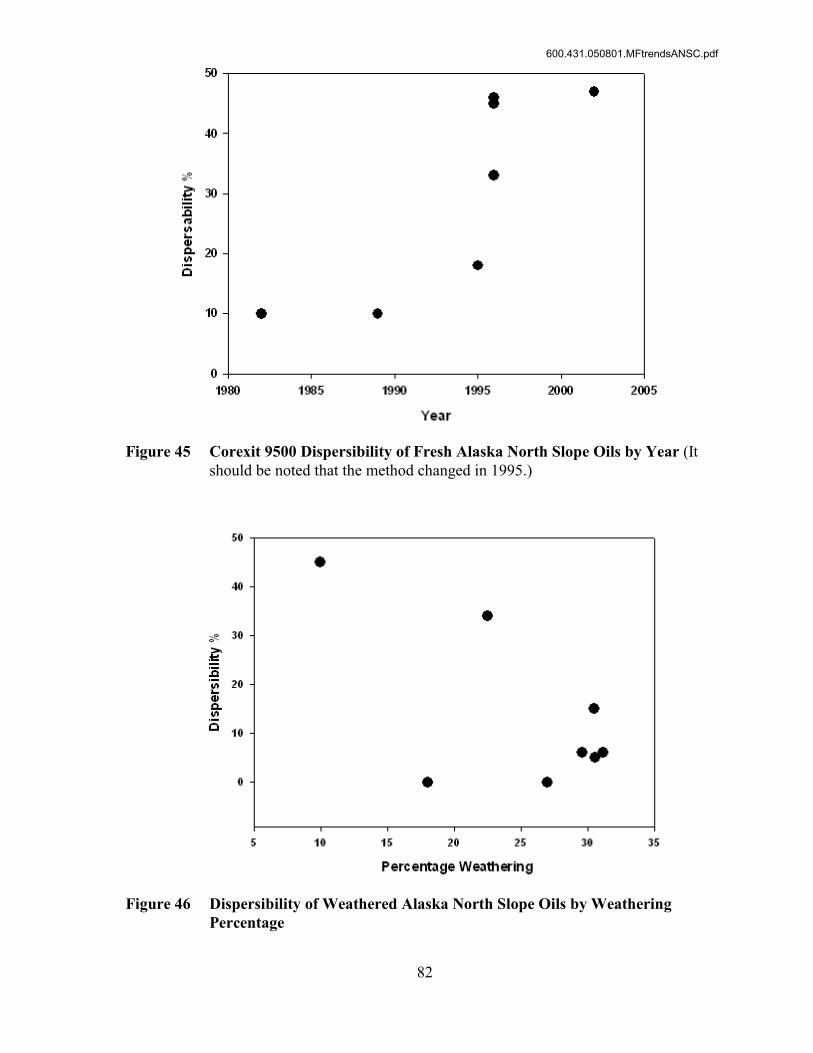
82
Figure 45 Corexit 9500 Dispersibility of Fresh Alaska North Slope Oils by Year (Itshould be noted that the method changed in 1995.)
Figure 46 Dispersibility of Weathered Alaska North Slope Oils by WeatheringPercentage
600.431.050801.MFtrendsANSC.pdf
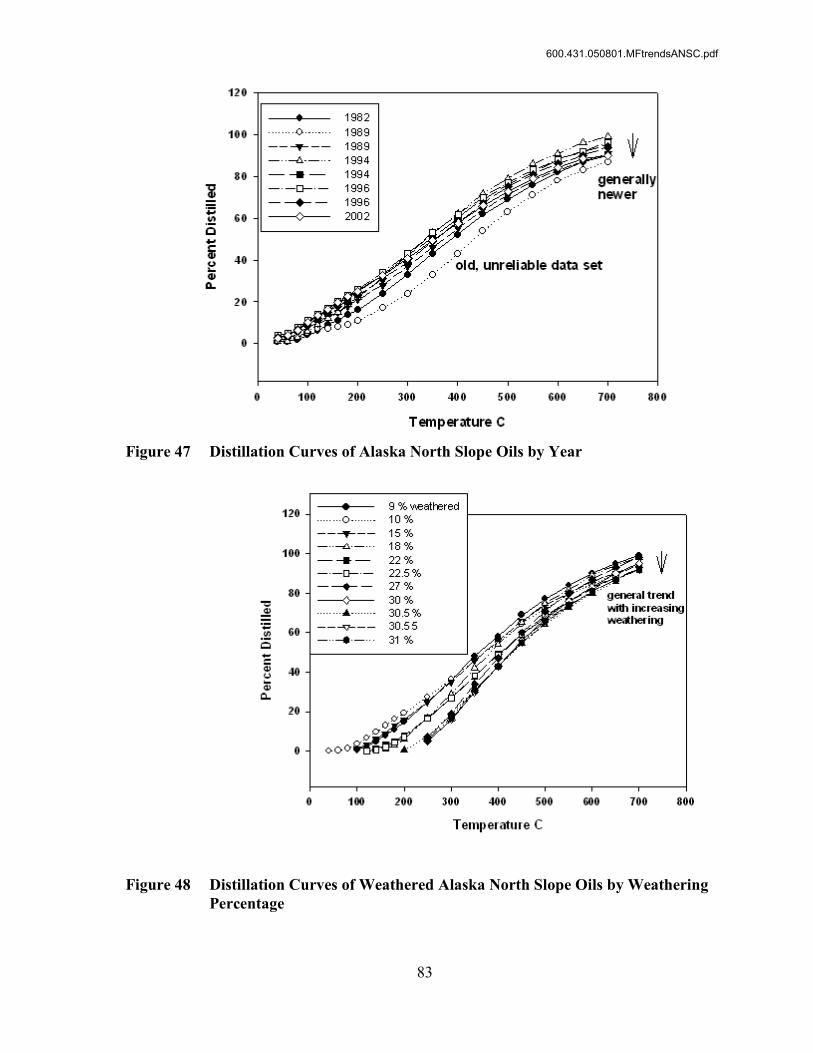
83
Figure 47 Distillation Curves of Alaska North Slope Oils by Year
Figure 48 Distillation Curves of Weathered Alaska North Slope Oils by WeatheringPercentage
600.431.050801.MFtrendsANSC.pdf
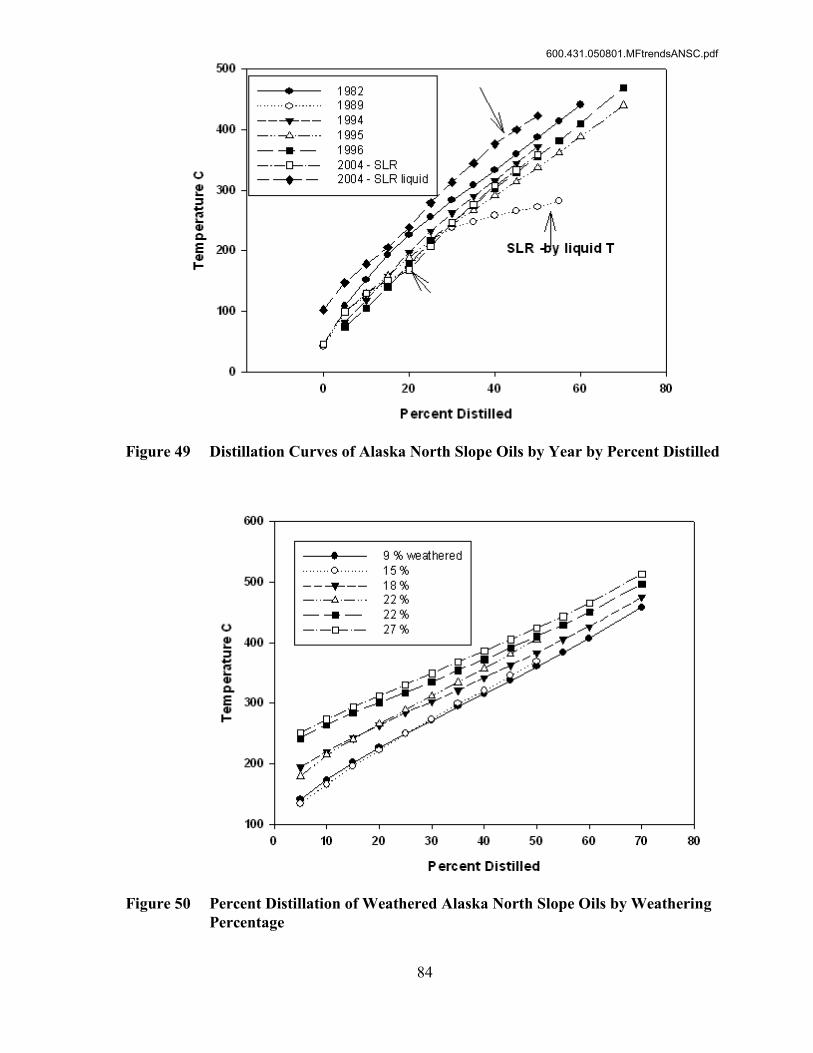
84
Figure 49 Distillation Curves of Alaska North Slope Oils by Year by Percent Distilled
Figure 50 Percent Distillation of Weathered Alaska North Slope Oils by WeatheringPercentage
600.431.050801.MFtrendsANSC.pdf
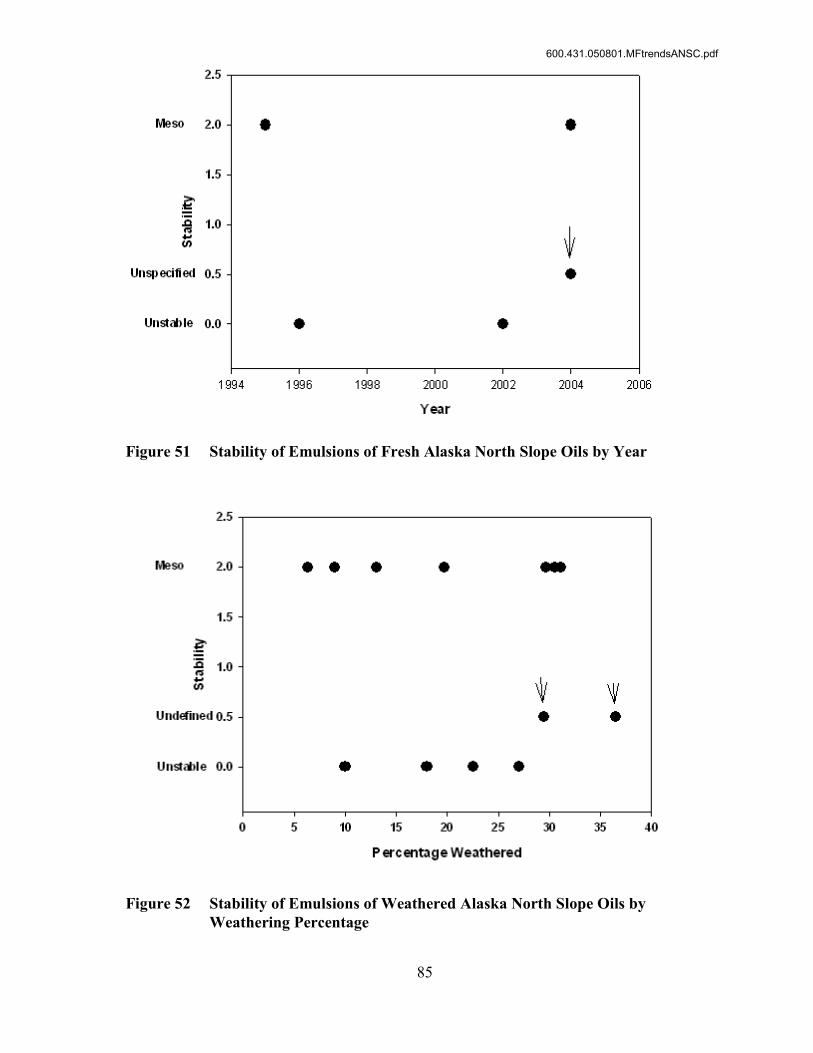
85
Figure 51 Stability of Emulsions of Fresh Alaska North Slope Oils by Year
Figure 52 Stability of Emulsions of Weathered Alaska North Slope Oils byWeathering Percentage
600.431.050801.MFtrendsANSC.pdf
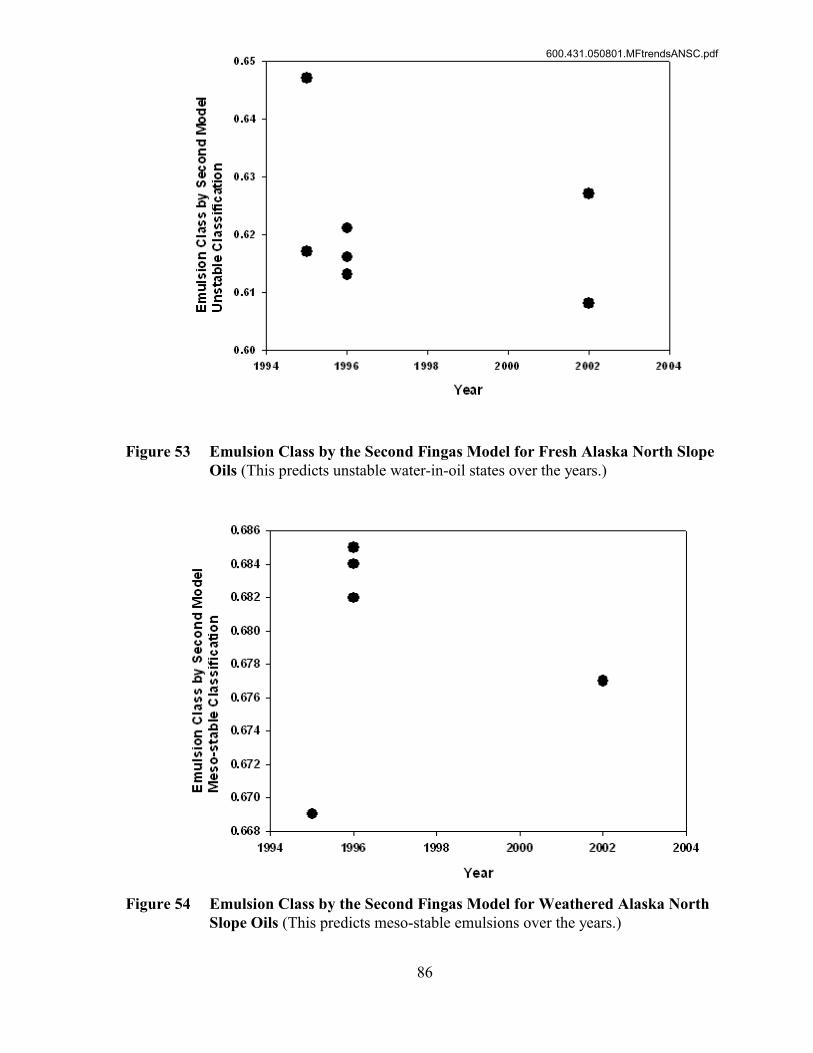
86
Figure 53 Emulsion Class by the Second Fingas Model for Fresh Alaska North SlopeOils (This predicts unstable water-in-oil states over the years.)
Figure 54 Emulsion Class by the Second Fingas Model for Weathered Alaska NorthSlope Oils (This predicts meso-stable emulsions over the years.)
600.431.050801.MFtrendsANSC.pdf

87
Figure 55 Water Content of the Water-in-oil States by Stability
Figure 56 Stability of the Meso-Stable Emulsions by Year (Weathering percentage isnot accounted for.)
600.431.050801.MFtrendsANSC.pdf
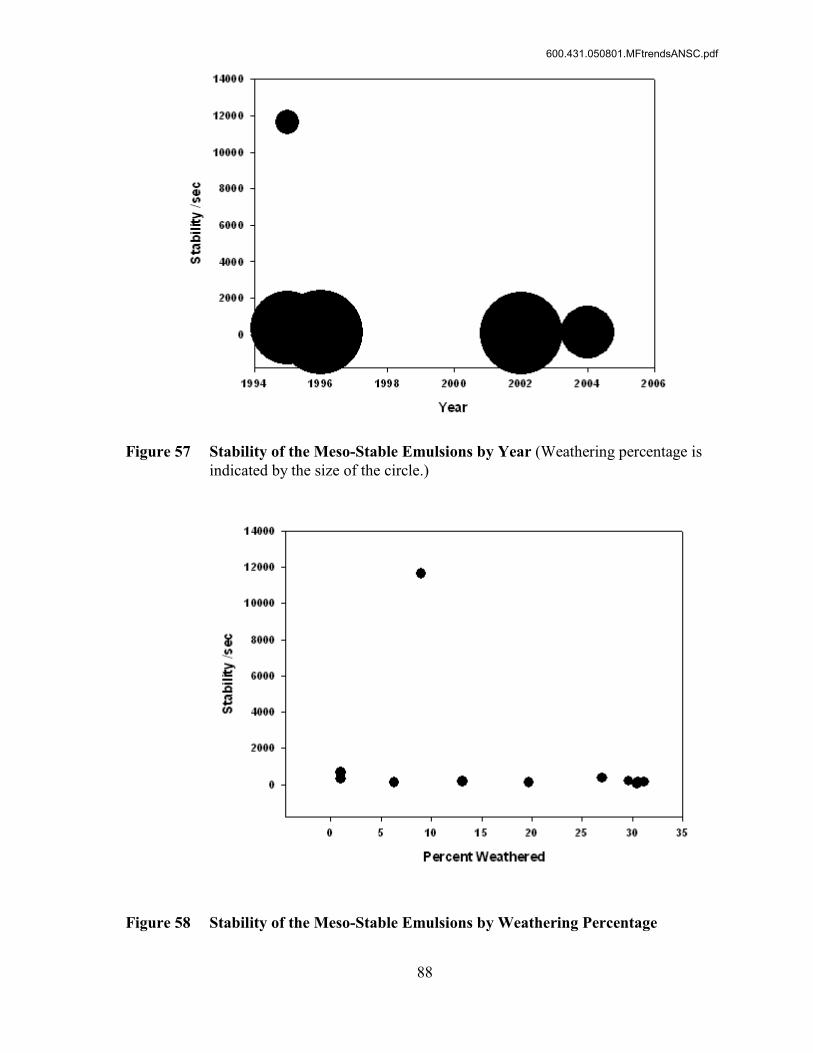
88
Figure 57 Stability of the Meso-Stable Emulsions by Year (Weathering percentage isindicated by the size of the circle.)
Figure 58 Stability of the Meso-Stable Emulsions by Weathering Percentage
600.431.050801.MFtrendsANSC.pdf

89
Figure 59 Asphaltene/Resin Ratio of Fresh Alaska North Slope Oils by Year
Figure 60 Asphaltene/Resin Ratio of Weathered Alaska North Slope Oils byWeathering Percentage
600.431.050801.MFtrendsANSC.pdf