Embed Size (px)
Citation preview
Loughborough UniversityInstitutional Repository
A review of the water barrierproperties of polymer/clayand polymer/graphene
nanocomposites
This item was submitted to Loughborough University's Institutional Repositoryby the/an author.
Citation: TAN, B. and THOMAS, N.L., 2016. A review of the water barrierproperties of polymer/clay and polymer/graphene nanocomposites. Journal ofMembrane Science, 514, pp. 595-612.
Additional Information:
• This paper was accepted for publication in the journal Journal ofMembrane Science and the definitive published version is available athttp://dx.doi.org/10.1016/j.memsci.2016.05.026.
Metadata Record: https://dspace.lboro.ac.uk/2134/21691
Version: Accepted for publication
Publisher: c© Elsevier
Rights: This work is made available according to the conditions of the Cre-ative Commons Attribution-NonCommercial-NoDerivatives 4.0 International(CC BY-NC-ND 4.0) licence. Full details of this licence are available at:https://creativecommons.org/licenses/by-nc-nd/4.0/
Please cite the published version.
1
A Review of the Water Barrier Properties of Polymer/Clay and
Polymer/Graphene Nanocomposites
B Tan and N L Thomas*
Department of Materials, Loughborough University, Ashby Road, Loughborough, Leicestershire, LE11 3TU, UK
*[email protected], Tel. +44(0)1509223334
ABSTRACT
This paper reviews the literature on moisture barrier properties of polymer/clay and
polymer/graphene-based nanocomposites. The various models proposed to predict
the effects of nanofillers in reducing water vapour permeability through polymers are
outlined. These models are based on a range of different factors such as; tortuosity,
geometry, platelet stacking, orientation, polymer chain confinement and plasticization.
Published experimental studies of water vapour permeability in both polymer/clay
and polymer/graphene nanocomposites are then reviewed. The extent to which the
models are validated by the results of these studies is discussed, together with the
degree to which the potential for water barrier improvement in polymer
nanocomposites has been realised.
Key Words: water vapour permeability; nanocomposite; nanoclay; graphene; review
2
Contents1. Introduction ....................................................................................................................................... 2
2. Fundamental Principles .................................................................................................................. 3
2.1 Theory, Definitions and units ................................................................................................... 3
2.2 Fickian and Non-Fickian Diffusion .......................................................................................... 5
3. Modelling of Polymer Nanocomposite Permeability ................................................................... 7
4. Polymer Clay Nanocomposites ................................................................................................... 14
4.1 Introduction to clay-based polymer nanocomposites ......................................................... 14
4.2 Water barrier properties of polymer/clay nanocomposites ................................................ 16
4.2.1 Summary of Studies ......................................................................................................... 16
4.2.2. Filler Type ......................................................................................................................... 18
4.2.3. Preparation Method ........................................................................................................ 20
4.2.4. Aspect Ratio and Filler Concentration ......................................................................... 22
5 Graphene based polymer nanocomposites ................................................................................ 24
5.1 Introduction to polymer/graphene nanocomposites ........................................................... 24
5.2 Water barrier properties of polymer/graphene nanocomposites ...................................... 25
6. Validation of the Models and Anomalous Effects ..................................................................... 30
6.1 Review of Model Validation .................................................................................................... 30
6.2 Water clustering ....................................................................................................................... 32
6.3 Plasticization Effect of Water ................................................................................................. 34
6.4 Agglomeration Effects ............................................................................................................. 36
7. Applications .................................................................................................................................... 40
8. Conclusions .................................................................................................................................... 42
References .......................................................................................................................................... 44
1. Introduction
Studies of the sorption and transport properties of water and water vapour in
polymeric materials are of considerable importance in many industry sectors. These
include diverse applications ranging from packaging materials for consumer products
(e.g. food, pharmaceuticals and micro-electronics) through to damp-proofing
materials, corrosion barrier films and reverse osmosis membranes. In the polymer
packaging industry, especially the food sector, the water vapour barrier property
provided by polymer films is a key factor in determining performance.

3
In recent years a number of interesting new technologies have emerged to enhance
the barrier properties of polymer films. One of these is polymer nanocomposites.
These novel materials contain relatively small amounts (typically less than 5
weight %) of nanometre-sized filler particles, which, if properly dispersed, have been
found to cause significant reductions in both gas and water vapour permeability [1, 2].
The latest development in this field is polymer/graphene nanocomposites [3].
Graphene-based nanofillers have much higher aspect ratios than clay-based
nanofillers, and so these materials have the potential to provide barrier films for very
sensitive applications, such as electronic devices.
The aim of this paper is to outline the various models that have been proposed to
predict and/or to explain the effects of nanofillers in improving polymer barrier
properties, to review the published experimental results of water vapour permeability
in both polymer/clay and polymer/graphene nanocomposites, to review the extent to
which the various models have been validated and also to comment on the extent to
which the potential improvement in water barrier properties of the materials has been
realised.
2. Fundamental Principles
2.1 Theory, Definitions and units
The fundamental principles describing the permeation of gases or vapours through
polymer films have been discussed in numerous publications [4-11]. These principles
underpin the work reviewed in this paper, and therefore will be briefly summarised
below.
Permeation across a polymer film or coating involves both solubilisation of the
penetrant molecule into the polymer matrix and diffusion through it [4, 5].
Fick’s first and second laws describe diffusion in many polymer systems. They are
given in equations (1) and (2) below: -
………………………………..(1)
4
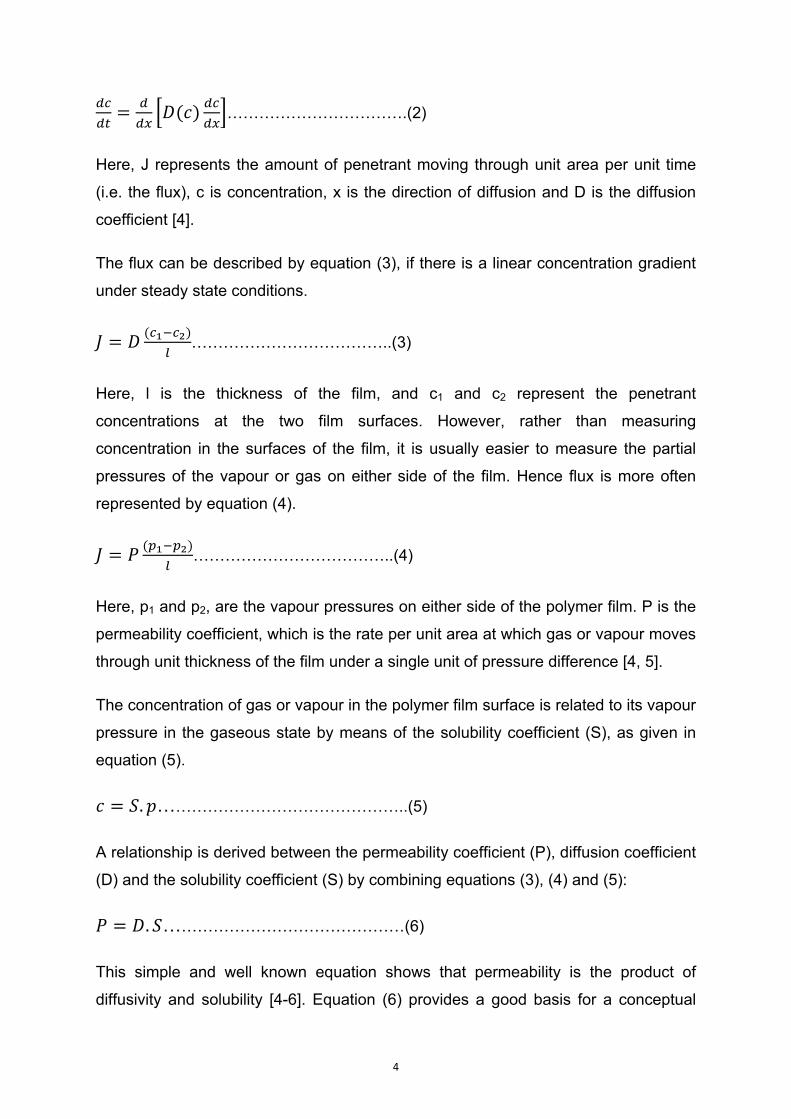
…………………………….(2)
Here, J represents the amount of penetrant moving through unit area per unit time
(i.e. the flux), c is concentration, x is the direction of diffusion and D is the diffusion
coefficient [4].
The flux can be described by equation (3), if there is a linear concentration gradient
under steady state conditions.
………………………………..(3)
Here, l is the thickness of the film, and c1 and c2 represent the penetrant
concentrations at the two film surfaces. However, rather than measuring
concentration in the surfaces of the film, it is usually easier to measure the partial
pressures of the vapour or gas on either side of the film. Hence flux is more often
represented by equation (4).
………………………………..(4)
Here, p1 and p2, are the vapour pressures on either side of the polymer film. P is the
permeability coefficient, which is the rate per unit area at which gas or vapour moves
through unit thickness of the film under a single unit of pressure difference [4, 5].
The concentration of gas or vapour in the polymer film surface is related to its vapour
pressure in the gaseous state by means of the solubility coefficient (S), as given in
equation (5).
. ………………………………………..(5)
A relationship is derived between the permeability coefficient (P), diffusion coefficient
(D) and the solubility coefficient (S) by combining equations (3), (4) and (5):
. ………………………………………(6)
This simple and well known equation shows that permeability is the product of
diffusivity and solubility [4-6]. Equation (6) provides a good basis for a conceptual
5
understanding of the basic principles of permeability through polymer films. Once the
penetrant molecule has adsorbed onto the surface of the polymer, it must dissolve in
the polymer matrix and then diffuse down a concentration gradient through the film,
before desorbing from the opposite surface. Either the diffusivity, D, or the solubility,
S, may be the rate controlling process. Meares [6] first reported that the permeation
of gases, such as CO2 and O2, through polymer films is usually dominated by the
diffusion coefficient. However, it is found that the water permeability through polymer
films is likely to be controlled by the solubility of water in the polymer [5, 7]. Hence,
highly polar polymers have poor water barrier properties because of the high
solubility of water in these polymers. On the other hand, non-polar polymers, like
polyethylene, have very good water barrier properties because water has a low
solubility in hydrophobic polymers.
The units of permeability require some consideration. As defined in equation (4),
permeability has the following dimensions:
This applies to the transport of most gases through most polymer films. However, for
organic vapours and water, permeability can vary with both pressure drop and the
thickness of the film. Hence, in these cases, data are usually expressed in terms of a
transmission rate, Q, which has the dimensions:
It is important to quote both the test temperature and the vapour pressure applied [8].
2.2 Fickian and Non-Fickian Diffusion ‘Ideal’ Fickian behaviour is exhibited by simple gases (e.g. O2, H2 and CO2), which
diffuse by random jumps between the polymer chains. Henry’s law is obeyed and D
is independent of both concentration and time. Water vapour diffusing through
hydrophobic polymers can exhibit ‘ideal’ diffusion behaviour [4, 5].
6
There are many polymer/penetrant systems for which D depends strongly on
concentration. Examples of these involve solvents or organic vapours that need co-
operative movement of a polymer chain segment to create an appropriately-sized
‘hole’. However, if the polymer is above its glass transition temperature (Tg), the
diffusion kinetics may still be Fickian [4, 5]. Below Tg time-dependent non-Fickian
effects occur because polymer chain segments require a finite time for
rearrangement to accommodate the diffusing penetrant molecules.
Alfrey et al [9] were first to classify diffusion behaviour in polymers based on the
comparative rates of polymer segment relaxations and permeant mobility. Fickian
diffusion (categorised as Case I) was found to occur when the permeant mobility was
much slower than the relaxation rate of polymer chain segments. Representing the
quantity of permeant absorbed per unit area at time, t, by (where K and n
are constants), then for Fickian systems, .
These authors [9] went on to define a second limiting form of diffusion, categorised
as Case II diffusion. Here the permeant mobility occurs at a much higher rate than
the polymer chain segment relaxations. In Case II diffusion there is a sharp boundary
between the outer swollen layer and the inner region, which consists of an unswollen
glassy core. The sharp boundary moves into the glassy region at constant velocity.
In the equation , for Case II diffusion 1 . This type of transport
behaviour occurs when there is significant swelling of the polymer by the permeant.
Hence it is not observed with simple gases.
Alfrey et al [9] also defined an intermediate category between the two extremes,
known as ‘anomalous’ diffusion. Here it is found that 1.
The diffusion behaviour of organic solvents and vapours in polymer systems varies
with both temperature and permeant activity. A particular permeant/polymer
combination may show the whole range of different transport phenomena over a
wide enough range of temperatures and/or activities [10]. For diffusion of organic
solvents and vapours in glassy polymers, the rate controlling process is time-
dependent deformation of the glassy polymer responding to a swelling stress. A
theory has been proposed [11] to explain transport behaviour in terms of two basic

7
parameters: diffusivity, D, of the permeant, and the viscous flow rate, 1/η0, of the
polymer glass. By combining these two parameters, it is possible predict a range of
different transport behaviours from Case I (Fickian) diffusion through ‘anomalous’
diffusion behaviour to Case II transport at the other extreme.
Water has a distinctive character that gives rise to certain non-Fickian diffusion and
sorption effects not found with other penetrant molecules [4]. It is well known that
water is a unique substance because of hydrogen bonding. In hydrophobic polymers
without hydrogen bonding sites, clustering of the water molecules can occur due to
the high interaction energies between the water molecules. This causes the diffusion
coefficient to decrease as the water concentration increases [4, 12]. In hydrophilic
polymers, diffusion coefficients will increase with increasing water concentration due
to plasticization effects [4]. These non-Fickian phenomena of water clustering and
plasticization are discussed in detail in section 6.
3. Modelling of Polymer Nanocomposite Permeability
An important success of polymer/clay nanocomposites is the improvement in barrier
properties that can be generated. At relatively low additions of nanoclay, it is
possible to achieve quite dramatic reductions in permeability to both gases and
water vapour. For example, in a study on polyimide-clay nanocomposites, Yano et al.
[13] reported a decrease of 90% in water vapour permeability in a polyimide-mica
composite with only 2 weight % of added mica. These researchers demonstrated
that the longer the filler particle, the better the improvement in permeability.
Nielsen [14] first proposed a model for the permeability of filled polymer systems.
The model is based on the premise that penetrant molecules have an increased
diffusion path because of the presence of impermeable filler particles. Therefore this
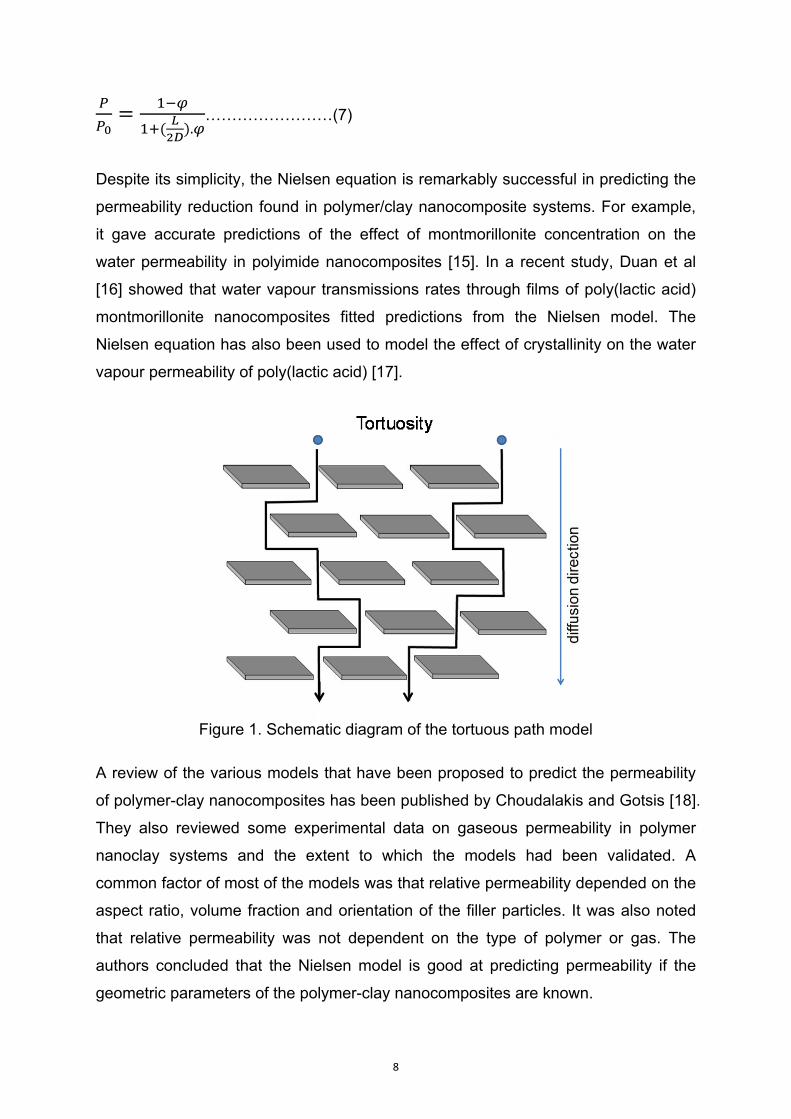
model is often referred to as the ‘tortuous path’ model, as shown in Figure 1. The
assumption is that the filler particles are rectangular platelets that are orientated
perpendicular to the direction of diffusion. The Nielsen model is given in equation (7),
in which P represents the permeability of the polymer composite, P0 represents the
permeability of the unfilled polymer, L/D is the aspect ratio (length/thickness) of the
filler particles and φ is the volume fraction of the filler.
8
.……………………(7)
Despite its simplicity, the Nielsen equation is remarkably successful in predicting the
permeability reduction found in polymer/clay nanocomposite systems. For example,
it gave accurate predictions of the effect of montmorillonite concentration on the
water permeability in polyimide nanocomposites [15]. In a recent study, Duan et al
[16] showed that water vapour transmissions rates through films of poly(lactic acid)
montmorillonite nanocomposites fitted predictions from the Nielsen model. The
Nielsen equation has also been used to model the effect of crystallinity on the water
vapour permeability of poly(lactic acid) [17].
Figure 1. Schematic diagram of the tortuous path model
A review of the various models that have been proposed to predict the permeability
of polymer-clay nanocomposites has been published by Choudalakis and Gotsis [18].
They also reviewed some experimental data on gaseous permeability in polymer
nanoclay systems and the extent to which the models had been validated. A
common factor of most of the models was that relative permeability depended on the
aspect ratio, volume fraction and orientation of the filler particles. It was also noted
that relative permeability was not dependent on the type of polymer or gas. The
authors concluded that the Nielsen model is good at predicting permeability if the
geometric parameters of the polymer-clay nanocomposites are known.
9
In their review, Choudalakis and Gotsis [18] discussed a number of alternatives to
the Nielsen model. Equation (8) is the model due to Cussler et al. [19], who
considered the filler particles (described as flakes) to be arranged in discrete layers
with narrow slits separating the particles within each layer.
1 …………………….(8)
In their paper, Cussler et al. [19] define α as the flake aspect ratio (d/a), where d is
half the flake width and ‘a’ is the flake thickness. Hence α is half the aspect ratio (L/D)
of the Nielsen model. (Note in the paper by Choudalakis and Gotsis [18], the term α
is sometimes used for the aspect ratio L/D and sometimes for the half aspect ratio
d/a, which may be a source of confusion).
Another model is that due to Fredrickson and Bicerano [20]. The notation in this this
paper is similar to that of Cussler et al. [19] in that the aspect ratio, α, is defined as
half the platelet width (which in this case is the platelet radius) divided by thickness.
The Fredrickson-Bicerano model is given in equation (9), where / , and
2 √2 /4 and 2 √2 /4.
………………. (9)
A different approach was taken by Gusev and Lusti [21], who used a finite-element
based methodology to derive the model shown in equation (10).
………..(10)
In equation (10), x = (L/D).φ and x0 and β are constants that can be fitted to the
experimental data.
The models described above all assume that the filler particles are aligned at right
angles to the diffusion direction. However, Bharadwaj [22] has described what would
happen if the filler particles were oriented in different ways with respect to the
diffusion direction. To do this, an order parameter, S, was inserted into the model.
10
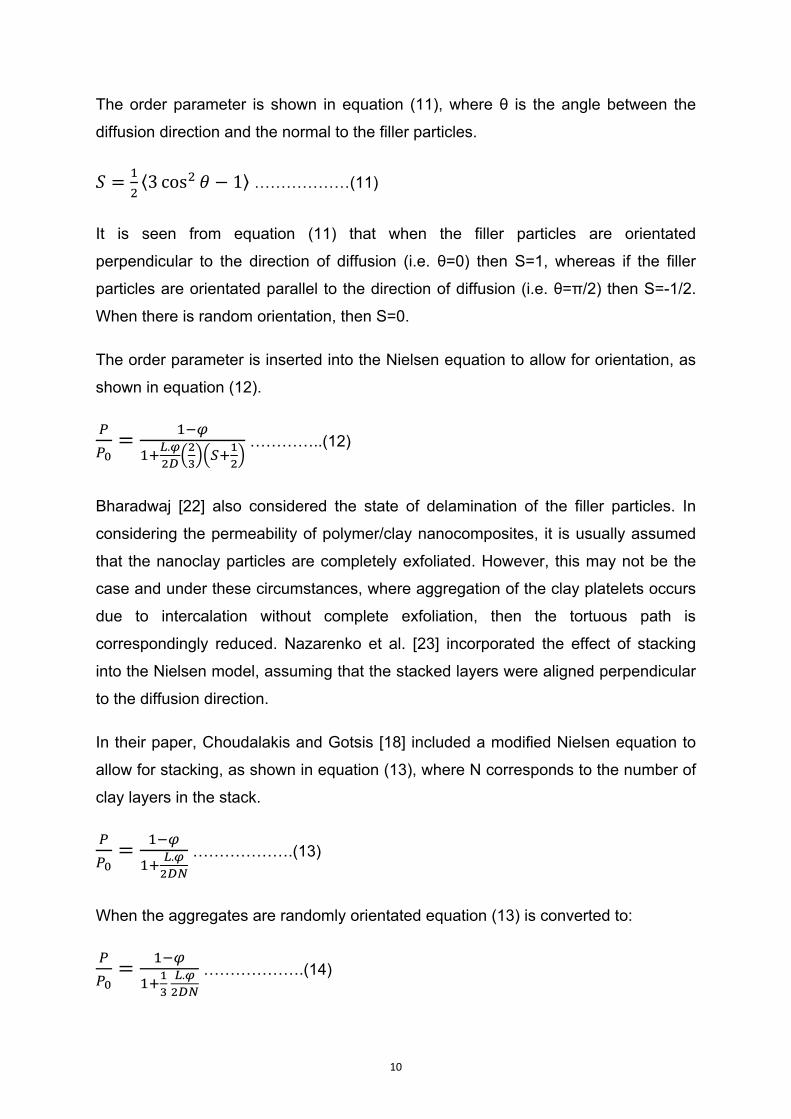
The order parameter is shown in equation (11), where θ is the angle between the
diffusion direction and the normal to the filler particles.
⟨3 cos 1⟩ ………………(11)
It is seen from equation (11) that when the filler particles are orientated
perpendicular to the direction of diffusion (i.e. θ=0) then S=1, whereas if the filler
particles are orientated parallel to the direction of diffusion (i.e. θ=π/2) then S=-1/2.
When there is random orientation, then S=0.
The order parameter is inserted into the Nielsen equation to allow for orientation, as
shown in equation (12).
. …………..(12)
Bharadwaj [22] also considered the state of delamination of the filler particles. In
considering the permeability of polymer/clay nanocomposites, it is usually assumed
that the nanoclay particles are completely exfoliated. However, this may not be the
case and under these circumstances, where aggregation of the clay platelets occurs
due to intercalation without complete exfoliation, then the tortuous path is
correspondingly reduced. Nazarenko et al. [23] incorporated the effect of stacking
into the Nielsen model, assuming that the stacked layers were aligned perpendicular
to the diffusion direction.
In their paper, Choudalakis and Gotsis [18] included a modified Nielsen equation to
allow for stacking, as shown in equation (13), where N corresponds to the number of
clay layers in the stack.
. ……………….(13)
When the aggregates are randomly orientated equation (13) is converted to:
. ……………….(14)
11
Combining equations (12) and (13) it is possible to come up with an expression that
considers the effects of platelet stacking and orientation in addition to the aspect
ratio and volume fraction [18]. That expression is given in equation (15).
. ………………(15)
Another development of the Nielsen equation is that due to Xu et al. [24], who
investigated the effects of clay layers and polymer chain immobility on the barrier
properties of polymer nanocomposites. In their model, there is a chain-segment
immobility factor ( ) to allow for the effect of polymer chain confinement on barrier
properties. This model is given in equation (16), where H is the separation gap
between adjacent clay platelets.
//
/ ………………(16)
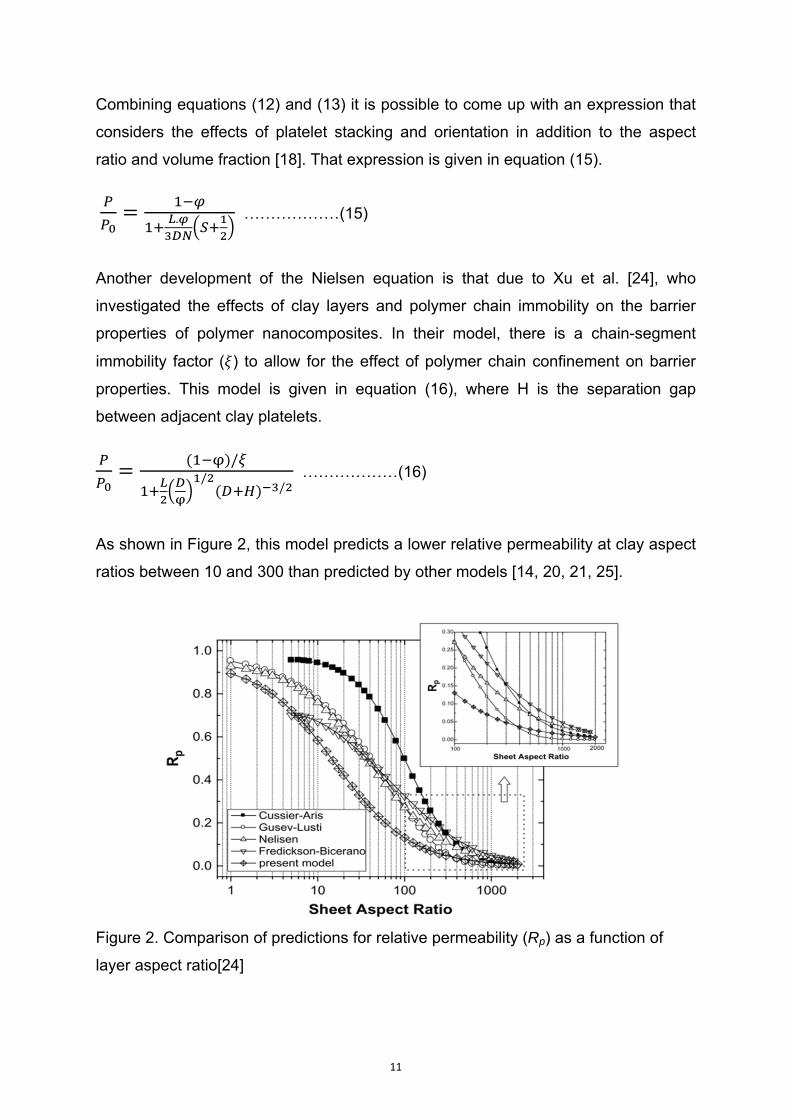
As shown in Figure 2, this model predicts a lower relative permeability at clay aspect
ratios between 10 and 300 than predicted by other models [14, 20, 21, 25].
Figure 2. Comparison of predictions for relative permeability (Rp) as a function of
layer aspect ratio[24]

12
A further development of the Cussler-Aris model [19], is that due to Lape, Nuxoll and
Cussler [26]. In the Cussler-Lape model, the particles are randomly dispersed with
infinite length. The flake thickness D is constant and there is a discrete distribution of
values of the flake width, . The relative permeability is given by equation (17):
/ ∑ ∑ ………………(17)
where is the number of flakes in a particular width category and is one-half of
the intermediate flake width.
Lu and Mai [27] have proposed a model to estimate the critical volume fraction of
clay for minimum permeability in exfoliated nanocomposites. They suggested that in
exfoliated nanocomposites the pathway of gas and liquid molecules is a self-avoiding
random walk, due to the disordered distribution of exfoliated silicate platelets. The
probability ( ) of a cell acting as a barrier to diffusion was determined via a ‘Kadanoff
cell’ simulation. The critical volume fraction (φc) of nanoclay for minimum
permeability was obtained as a function of the probability ( ) and the geometric
parameters of the clay, as given in equation (18), where S is the orientation
parameter of nanoclay platelets as in the Bharadwaj model [22]. Values of were
taken as 0.38 and 0.72 in two- and three-dimensional models respectively.
/ ………………(18)
The prediction of the critical volume fraction was shown to fit with experimental data
of some typical clays (e.g. hectorite, saponite, montmorillonite and mica) from the
literature [15, 24, 28, 29].
A different geometric model was developed by Sorrentino et al [30]. This model is
given in equation (19), where and are the diffusion coefficients of polymer
nanocomposite and neat polymer respectively; and , where and
are the diffusion coefficient and volume fraction of the interface respectively. , L, D
and θ are as previously defined.
13
……………….(19)
When compared with effective diffusivity generated using random walk simulations,
fair agreement was found between predictions from the model and results of
numerical simulations. In addition, there was good agreement between the model
and experimental data of relative diffusivity of water vapour in exfoliated poly(ε-
caprolactone) (PCL) nanocomposites [31, 32]. Compared with other models, this
model was claimed to be more suitable for describing diffusion behaviour in polymer
nanocomposites with high aspect ratio fillers.
Alexandre et al. [33] developed a model for water permeability through certain
polymers in which water has appreciable solubility. They considered plasticization
effects as well as the possibility of adsorption of water vapour at the polymer/filler
interface. This was shown to be relevant for the transport of water through
polyamide12 – based nanocomposite films, where it was found that at higher clay
contents water permeability no longer decreased but started increasing [33].
These authors modified the tortuosity models of Nielsen [14] and Bharadwaj [22] to
take into account not only tortuosity effects (i.e. aspect ratio, crystallinity, immobility
factor, recovery parameter) but also non-Fickian effects by including a solubility
factor and a plasticization factor, because plasticization can give rise to anomalous
behaviour. Additionally, the model allows for a change in aspect ratio as a function of
volume fraction. The model is expressed by equation (20).
………………(20)
In this equation is the solubility factor; is the polymer chain-segment immobility;
and are the velocity of the diffusing molecules in the polymer matrix and that in
the interface zone respectively; and represent the plasticising effect on filled
and unfilled polymer; is the adjustable parameter for the plasticising effect; and
are the crystallinity of filled and unfilled polymer.
14
There are also some computational models. For example, Swannack et al [35] have
carried out Monte Carlo simulations in two and three dimensions to compute the
diffusion coefficients of gas molecules permeating through membranes containing
oriented platelets. They investigated the effects of platelet aspect ratio, relative
separation, loading and spatial dimensions. Flaws in idealized geometries in 3D
models were addressed and a new 3D geometry was presented. The results were
claimed to have particular value for nanocomposite films at low platelet loadings.
Also Chen and Papathanasiou [36] reported a micromechanics-based numerical
method for predicting the factors for improving the barrier of flake-filled membranes.
They conducted numerical calculations in 2D for composite membranes containing
aligned, impermeable platelets using a fast multipole-accelerated boundary element
method. They reviewed a number of theoretical models and compared predictions
from these models with the boundary element calculations.
The extent to which all these various models have been validated by experimental
results on water vapour permeability through polymer nanocomposites is discussed
in section 6 below.
4. Polymer Clay Nanocomposites
4.1 Introduction to clay-based polymer nanocomposites
Polymer/clay nanocomposites are two phase systems, which consist of a polymeric
matrix and nano-fillers dispersed in the matrix. The most frequently used inorganic
fillers in polymer nanocomposites belong to a family of 2:1 phyllosilicates, which
have a sheet silicate structure. Montmorillonite, hectorite and vermiculite are
amongst the most commonly used fillers in polymer-clay nanocomposites [1].
The preparation of a nanocomposite requires good dispersion of the layered silicate
in the polymer matrix at the nanometer scale. The excellent performance of
montmorillonite clay as a reinforcement in the matrix is determined by its high aspect
ratio and the large surface area of the clay particles. Coating with surfactant, such as
quaternary ammonium salts, helps to improve compatibility and hence provide a
15
strong interfacial interaction between the clay and polymer chains, thus contributing
to good reinforcement and hence good barrier properties [2], [37]–[43].
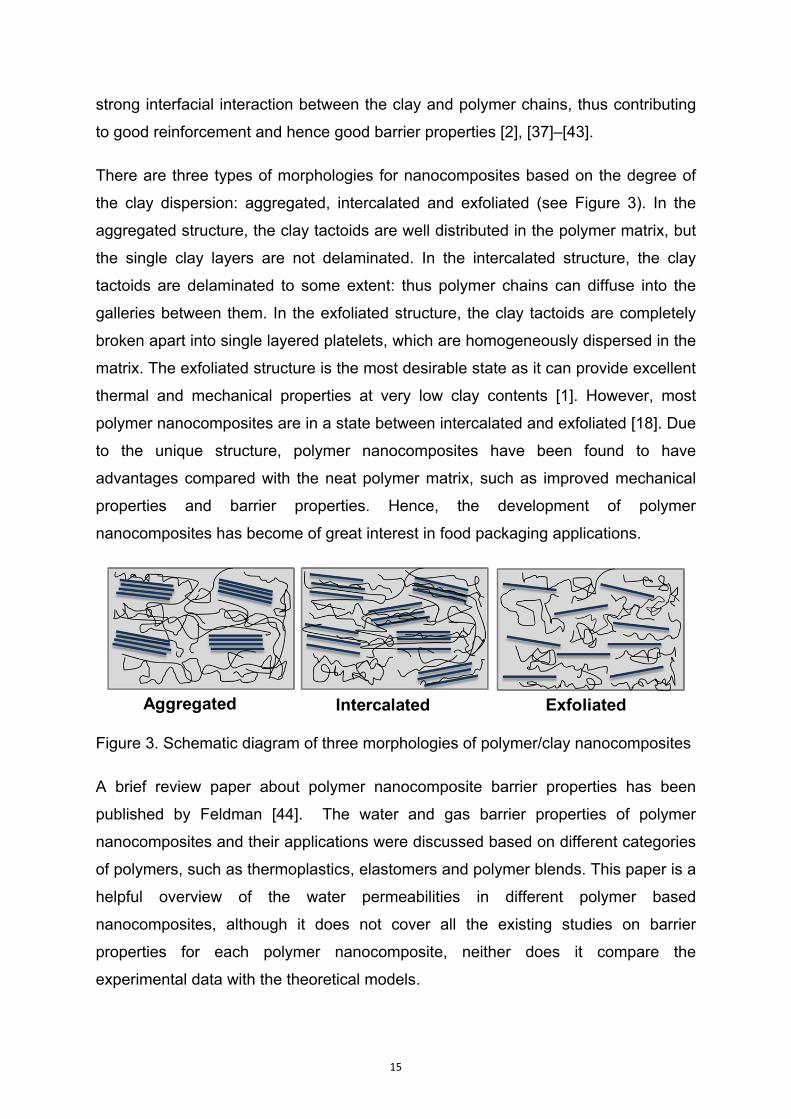
There are three types of morphologies for nanocomposites based on the degree of
the clay dispersion: aggregated, intercalated and exfoliated (see Figure 3). In the
aggregated structure, the clay tactoids are well distributed in the polymer matrix, but
the single clay layers are not delaminated. In the intercalated structure, the clay
tactoids are delaminated to some extent: thus polymer chains can diffuse into the
galleries between them. In the exfoliated structure, the clay tactoids are completely
broken apart into single layered platelets, which are homogeneously dispersed in the
matrix. The exfoliated structure is the most desirable state as it can provide excellent
thermal and mechanical properties at very low clay contents [1]. However, most
polymer nanocomposites are in a state between intercalated and exfoliated [18]. Due
to the unique structure, polymer nanocomposites have been found to have
advantages compared with the neat polymer matrix, such as improved mechanical
properties and barrier properties. Hence, the development of polymer
nanocomposites has become of great interest in food packaging applications.
Figure 3. Schematic diagram of three morphologies of polymer/clay nanocomposites
A brief review paper about polymer nanocomposite barrier properties has been
published by Feldman [44]. The water and gas barrier properties of polymer
nanocomposites and their applications were discussed based on different categories
of polymers, such as thermoplastics, elastomers and polymer blends. This paper is a
helpful overview of the water permeabilities in different polymer based
nanocomposites, although it does not cover all the existing studies on barrier
properties for each polymer nanocomposite, neither does it compare the
experimental data with the theoretical models.
16
4.2 Water barrier properties of polymer/clay nanocomposites
4.2.1 Summary of Studies
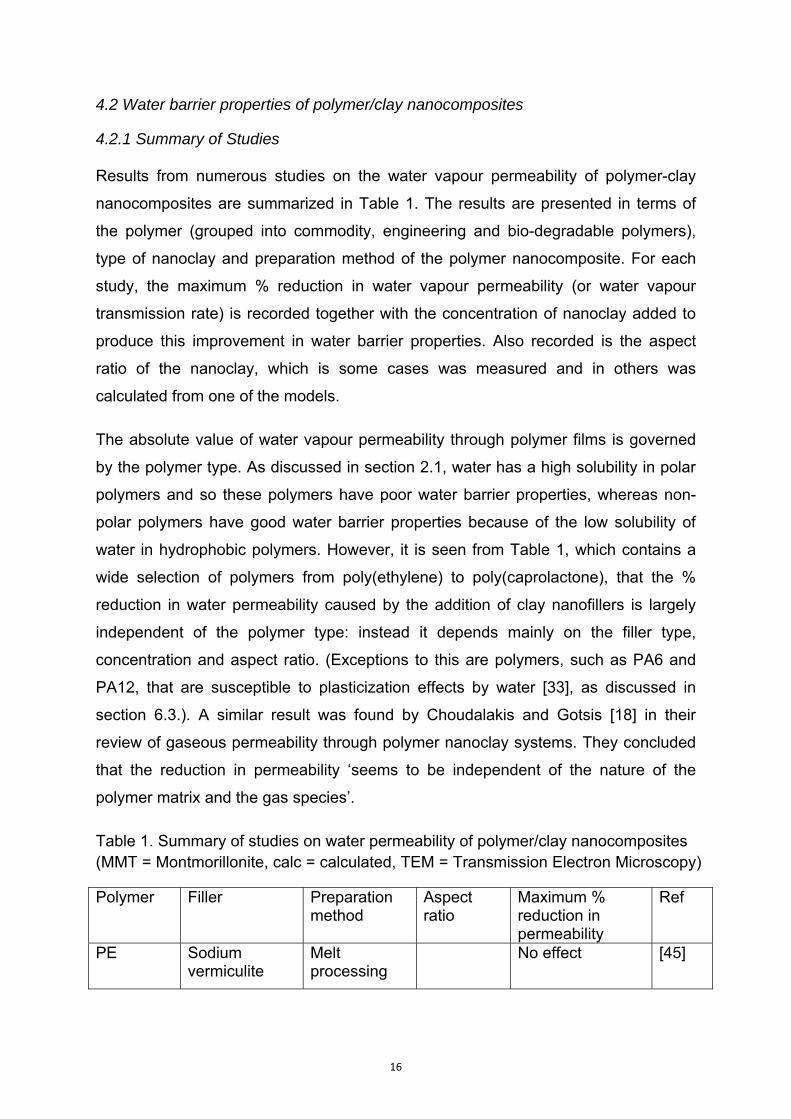
Results from numerous studies on the water vapour permeability of polymer-clay
nanocomposites are summarized in Table 1. The results are presented in terms of
the polymer (grouped into commodity, engineering and bio-degradable polymers),
type of nanoclay and preparation method of the polymer nanocomposite. For each
study, the maximum % reduction in water vapour permeability (or water vapour
transmission rate) is recorded together with the concentration of nanoclay added to
produce this improvement in water barrier properties. Also recorded is the aspect
ratio of the nanoclay, which is some cases was measured and in others was
calculated from one of the models.
The absolute value of water vapour permeability through polymer films is governed
by the polymer type. As discussed in section 2.1, water has a high solubility in polar
polymers and so these polymers have poor water barrier properties, whereas non-
polar polymers have good water barrier properties because of the low solubility of
water in hydrophobic polymers. However, it is seen from Table 1, which contains a
wide selection of polymers from poly(ethylene) to poly(caprolactone), that the %
reduction in water permeability caused by the addition of clay nanofillers is largely
independent of the polymer type: instead it depends mainly on the filler type,
concentration and aspect ratio. (Exceptions to this are polymers, such as PA6 and
PA12, that are susceptible to plasticization effects by water [33], as discussed in
section 6.3.). A similar result was found by Choudalakis and Gotsis [18] in their
review of gaseous permeability through polymer nanoclay systems. They concluded
that the reduction in permeability ‘seems to be independent of the nature of the
polymer matrix and the gas species’.
Table 1. Summary of studies on water permeability of polymer/clay nanocomposites (MMT = Montmorillonite, calc = calculated, TEM = Transmission Electron Microscopy)
Polymer Filler Preparation method
Aspect ratio
Maximum % reduction in permeability
Ref
PE Sodium vermiculite
Melt processing
No effect [45]

17
LLDPE Cloisite 25A Cloisite 93A
Melt processing
79% at 5wt.% 23% at 5wt.%
[46]
PVC MMTNa+ Cloisite 30B
Melt processing
17% at 10wt.% 73% at 10wt.%
[46]
PS MMT Solution casting
70% at 6wt.% [47]
PS MMT Solution casting
54% at 10wt.% [48]
PA12 MMT Melt processing
255 (calc) 2.5 vol.% [33] [49]
PA6 MMT Melt processing
38 (TEM) 133 (calc)
30% at 4 vol.% [50]
PA6 MMT Melt processing
20 (TEM) 17.2 (calc) 25.5(calc)
50% at 18 wt.% [51]
PA6 MMT Melt processing
61% at 13wt.% [52]
Trogamid (PA)
MMT Melt processing
21% at 3 wt.% [53]
PI MMT Solution casting
83% at 8 wt.% [15]
PI synthetic mica
Solution casting
90% 2 wt.% mica [13]
PBI Laponite Magadiite MMT
Solution casting
39 (calc) 247 (calc) 260 (calc)
94% at 30 wt.% 82% at 10wt.% 88% at 10 wt.%
[54]
Epoxy KH-MT Cloisite20A I30P
Solution casting
57% at 5wt.% 66% at 5wt.% 86% at 5wt.%
[28]
PU MMT Solution synthesised
90% at 40wt.% [55]
PVAc MMT Emulsion polymerised and cast
327 (calc) 300 (TEM)
90% at 10wt.% [56]
PLA MMT Melt processing
50% at 5wt.% [57]
PLA MMT Melt processing
92% at 10wt.% [58]
PLA Cloisite Na+ Cloisite 30B Cloisite 20A
Solution casting
------- 5% at 5wt.% 36% at 5wt.%
[59]
PLA Cloisite 30B Melt processing
60% at 5wt.% [60]
PLA MMT Melt processing
58% at 5wt.% [61]
PLA Cloisite 30B Melt processing
95% at 15wt.% [62]
18
PLA Cloisite 30B Melt processing
50 (TEM) 43% at 6wt.% [16]
PLA cellulose Solution casting
10% at 1wt.% but then increases
[63]
PLA cellulose Solution casting
Increased water permeability
[64]
PLA Halloysite Melt processing
55% at 12wt.% [65]
PCL mica Solution casting
70 (calc) 79% at 4.8 vol% [66]
PCL MMT Solution casting
90% at 15wt.% [67]
PCL cellulose Solution casting
Increased water permeability
[68]
PCL Various inorganic nano-hybrids
High Energy Ball Milling
98% at 9wt.% PCL/ZnAl-BzDC
[31]
PHBV cellulose Solution casting
71% at 1wt.% [63]
Pectin MMT Solution casting
41% at 2.5wt.% [69]
Hydroxy-propyl methyl-cellulose
MMT Solution casting
63% at 2.5wt.% [69]
4.2.2. Filler Type
With regard to filler type, it is seen from Table 1 that by far the most common filler to
be used in polymer/clay nanocomposite systems for reducing water barrier
properties is montmorillonite (MMT), often selected as one of the commercially
available, organically modified grades (e.g. Cloisite grades from Southern Clay
Products, Texas, USA). Coating the clay particles with surfactant helps to prevent
agglomeration of the clay particles, improves compatibility with the polymer and thus
aids dispersion in the polymer matrix. The greatest barrier improvements are
expected from fully exfoliated polymer nanocomposites because in this state the clay
platelets will have the highest aspect ratio.
Different commercial grades of organically modified montmorillonite have different
surfactant coatings and hence different interplanar spacings. Cloisite 20A is modified
by dimethyl dehydrogenated tallow quaternary ammonium chloride at a loading of 95
meq/100 g and has a d-spacing of 2.42 nm. Whereas, Cloisite 25A is modified by
dimethyl dehydrogenated tallow 2-ethylhexyl quaternary ammonium at a level of 95
19
meq/100 g, and its d-spacing is 1.86 nm. Cloisite 30B is modified by methyl tallow
bis-2-hydroxyethyl quaternary ammonium chloride at a loading of 90 meq/100 g, and
has d-spacing, 1.85 nm. Finally, Cloisite 93A is modified by methyl dehydrogenated
tallow ammonium at 90 meq/100 g loading, and has a d-spacing of 2.36 nm. The
choice of grade has been found to affect permeability results.
A number of studies compare the efficacy of different filler types in specific polymer
systems. For example, Alena et al [46] found that in LLDPE Cloisite 25A reduced
water permeability more than Cloisite 93A because of better dispersion, whereas
Cloisite 30B increased water permeability due to filler agglomeration. However, in
PVC they found that Cloisite 30B had a very significant improvement over the
unmodified sodium montmorillonite (MMTNa+). This was attributed to agglomeration
of the hydrophilic MMTNa+.
Another study comparing sodium montmorillonite, Cloisite 30B and Cloisite 20A was
carried out by Rhim et al [59] this time with poly(lactic acid) (PLA). At 5 weight %
addition, MMTNa+ was found to increase water permeability by 15%, Cloisite 30B
showed a reduction of 5% and Cloisite 20A a reduction of 36 %. Cloisite 20A was
thought to be more effective than Cloisite 30B because of its greater hydrophobicity.
However, as shown in Table 1, there are a number of other studies where Cloisite
30B has been used very successfully to reduce water vapour permeability in PLA [16,
60-62].
Mica has been used successfully as a barrier filler in a couple of the early studies.
Yano et al [13] synthesized polyimide (PI)-clay nanocomposites from four clay
minerals (montmorillonite, saponite, synthetic mica and hectorite). They observed
that the improvement in water barrier properties depended on the length of the filler
particles. Mica was found to be the most effective clay: the water vapour permeability
coefficient reduced by 90% with the addition of only 2 wt.% mica in polyimide
nanocomposites. Also Messersmith and Giannelis [66] reported that mica was an
effectual filler in reducing water permeability in poly( ε -caprolactone) (PCL)
nanocomposites. A 79% reduction was achieved with a 4.8 volume% of mica.
Some studies have reported a lack of success with certain hydrophilic fillers, which
can create preferential diffusion channels for water. For example, Carvalho et al [45]
20
investigated PE/vermiculite nanocomposites and incorporated a number of different
coupling agents to enhance the compatibility between the clay and the polymer
chains. Although this approach had worked for oxygen permeability, it was
ineffective in the case of water vapour permeability. Another filler found to be
unreliable is cellulose [63, 64, 68]. Increases in water permeability were found in
cellulose composites and were variously attributed to hydrophilicity, aggregation of
cellulose fibres, poor dispersion and low tortuosity.
In connection with filler hydrophilicity and the problems of the filler swelling in water
permeability studies, Picard et al [52] investigated the effect of water activity on the
barrier properties of poly(amide)6 (PA6) nanocomposite films. In the range of water
activity between 0 and 0.9, they found that clay can be considered as impermeable
and that water barrier properties were considerably improved due to the clay content
and its dispersion. However, at higher water activity, the water barrier properties
were found to be dependent much more on the state of clay dispersion, since the
clay aggregates were able to swell when the hydrophilic polymer matrix was
immersed in water and highly swollen. However, the authors pointed out that swollen
clay only occurs in highly hydrophilic polymer matrices. In most polymer
nanocomposite systems, clay is impermeable and does not undergo swelling.
4.2.3. Preparation Method
The two main preparation methods used in these studies for making films or sheets
of polymer/clay nanocomposites are melting and solution casting. Melt processing is
arguably the more practical and realistic process because it is the process suitable
for commercial production of thermoplastic nanocomposites. The drawbacks of this
technique are its dependence on the processing parameters (temperature, screw
speed etc.) and the necessity for favourable interactions between the clay and
polymer. Also most studies show that exfoliated nanocomposites are only achieved
with MMT additions up to 5 weight % [37]. The shear stress exerted during melt
processing is, on the one hand, advantageous in dispersing the clay tactoids but, on
the other hand, may be detrimental in breaking up the clay particles and thus
reducing their aspect ratio.
21
Solution casting is suitable in the laboratory when using small quantities of material
but is challenging for industrial scale-up due to environmental and cost issues
associated with the handling and disposal of solvents. It also has the drawback of
requiring a specific solvent to achieve intercalation or exfoliation. For example,
Giannakas et al [48] produced PS nanocomposites by a solution casting method
using different solvents (C CH ). They reported that samples prepared with
CH showed an intercalated nanocomposite structure, whereas samples prepared
with C were exfoliated. This was reflected in the barrier properties of the materials.
At a clay content of 10 weight %, samples prepared from C showed a decrease in
water vapour permeability of 54%, whereas samples prepared from CH exhibited
a reduction of 44% compared with pure PS samples.
Melt processing and solution casting have been used about equally in the studies
summarised in Table 1. On comparing the relative reductions in water permeability
through polymer/clay nanocomposites prepared by the two different methods, it
transpires that neither method gives significantly better results than the other one.
A third preparation method is in-situ polymerisation. The layered silicate is swollen
within the monomer liquid or a monomer solution before polymerisation is initiated.
The onset of the reaction can cause polymer chains to grow within the clay gallery
and therefore force intercalation or exfoliation to take place [1]. However, this
process suffers from the disadvantage that a suitable monomer is not always
available [38]. Only one of the studies reviewed used in-situ polymerisation as the
nanocomposite preparation method [56]. In this case emulsion polymerisation
followed by solution casting was used and resulted in a 90% reduction in
permeability, albeit at a 10 wt% clay addition level. The filler particles in this
nanocomposite were found to have a very high aspect ratio (see section 4.2.4 below).
Some good results using in-situ polymerisation have also been reported in a recent
review on gas barrier properties of polymer/clay nanocomposites [38]. Dai et al. [70]
prepared epoxy resin / MMT Na+ nanocomposites by in-situ thermal ring-opening
polymerisation and reported that the oxygen permeability reduced by 86% at a clay
loading of 7 wt%. Also, the CO2 permeability of PCL / Cloisite 30B nanocomposites
produced from in-situ polymerisation showed a reduction of 68.5% at a clay loading
of only 3 wt% [71].
22
4.2.4. Aspect Ratio and Filler Concentration
Any theory to explain the barrier properties of polymer nanocomposites based on
tortuosity will incorporate the filler aspect ratio [14, 18-22, 24, 30, 33, 34]. Of the
studies reviewed in Table 1, some have measured the aspect ratio using
transmission electron microscopy (TEM) [16, 50, 51, 56] whereas others have
calculated the value from fitting experimental data to one of the models [33, 50, 51,
54, 56, 66]. Comparing the studies where aspect ratios have been measured,
modest values (of 20, 38 and 52) were reported for samples prepared by melt
processing. On the other hand, in the study [56] in which the nanocomposite was
prepared by emulsion polymerization and solution casting, the aspect ratio was
found to be 300. This suggests that melt shear forces may be responsible for
breaking up the clay particles in addition to exfoliating the clay tactoids. However,
more data would be needed to confirm this supposition.
Measurement of filler aspect ratios allows validation of the theoretical models. For
example, Duan et al [16] investigated water vapour transmission rates (WVTR)
through a series of PLA/MMT melt processed nanocomposite films. The average
filler aspect ratio was determined from TEM images using image analysis software
and was found to be 50 (see Figures 4 (a) and (b)). The authors reported that there
was a decrease in WVTR as the nanoclay content increased up to a value of 5 wt.%.
Predictions from the Nielsen ‘tortuous path’ model were in good agreement with this
data (equation 7) [14], as shown in Figure 4 (c).
23
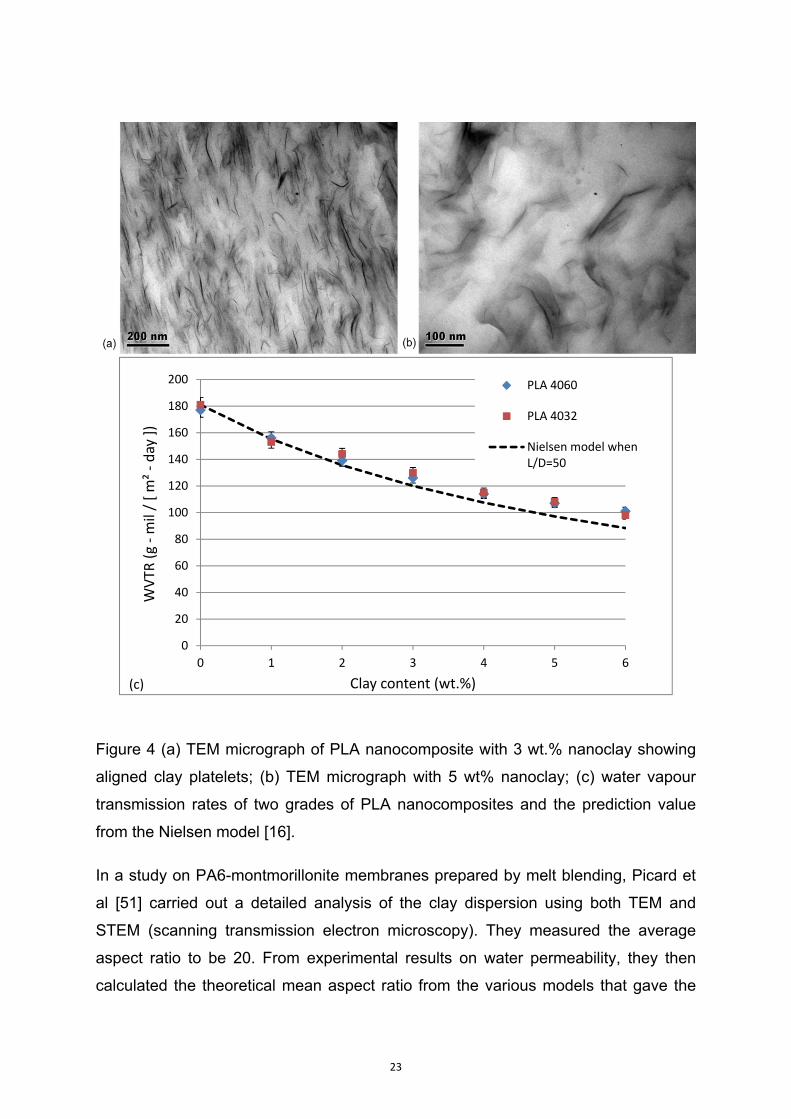
Figure 4 (a) TEM micrograph of PLA nanocomposite with 3 wt.% nanoclay showing
aligned clay platelets; (b) TEM micrograph with 5 wt% nanoclay; (c) water vapour
transmission rates of two grades of PLA nanocomposites and the prediction value
from the Nielsen model [16].
In a study on PA6-montmorillonite membranes prepared by melt blending, Picard et
al [51] carried out a detailed analysis of the clay dispersion using both TEM and
STEM (scanning transmission electron microscopy). They measured the average
aspect ratio to be 20. From experimental results on water permeability, they then
calculated the theoretical mean aspect ratio from the various models that gave the
0
20
40
60
80
100
120
140
160
180
200
0 1 2 3 4 5 6
WVTR
(g ‐mil / [ m² ‐day ])
Clay content (wt.%)
PLA 4060
PLA 4032
Nielsen model whenL/D=50
(c)
24
best fit to their data. The Nielsen model gave a value of 25.5, whereas a somewhat
closer value of 17.2 was predicted from the Cussler-Lape model.
In terms of filler concentration, numerous studies have found that the optimum
nanoclay content is around 5 weight % or below [13, 16, 28, 33, 46, 47, 49, 50, 53,
57, 59-61, 63, 66, 69]. For example, it is seen from Figure 4(c) that reduction in
water vapour transmission rates starts to level off above 5 weight % of added clay.
As discussed by Nguyen and Baird [37], exfoliated nanocomposites are mostly only
achieved with MMT concentrations up to 5 weight %. Above this value,
agglomeration takes place. So although, as seen in Table 1, much higher
concentrations of filler have been used successfully in many studies to reduce water
permeability, it is likely in these cases that the fillers were agglomerated.
5 Graphene based polymer nanocomposites
5.1 Introduction to polymer/graphene nanocomposites
Graphene is a monolayer of sp2-hybridised carbon atoms arranged in a two-
dimensional lattice. It can be produced by the exfoliation of graphite nanosheets [3,
72-76]. The theoretical specific surface area of graphene sheet is 2630-2956 m2g-1
with a large aspect ratio, higher than 2000 [73]. Due to its unique structure, graphene
has been shown to have excellent thermal, mechanical and electrical properties [77-
80]. One of the most promising applications of graphene is incorporation as filler in
polymer nanocomposites. However, this application of graphene is hampered by the
poor solubility of pristine graphene in most common solvents. Also, the large surface
area of graphene results in significant aggregation in a polymer matrix due to large
van der Waals interactions [79]. A challenge is to achieve good dispersion of the
atomically thin sheets of graphene within the polymer matrix.
To fabricate well dispersed graphene based nanocomposites, an appropriate surface
modification has been applied to produce graphene oxide (GO) nanosheets [74, 81-
84]. These are quasi-two-dimensional honeycomb lattice materials with oxygen
containing functional groups (such as hydroxyl, epoxide, carbonyl and carboxyl) on
their basal planes and edges. These functional groups are effective in improving
interfacial bonding between the GO nanosheets and the polymer matrix. Hence,
exfoliation and a uniformly dispersed structure can be achieved [85-88]. Due to
25
excellent barrier properties, graphene based nanocomposites have significant
potential not only in packaging applications but also in sensitive electronic devices,
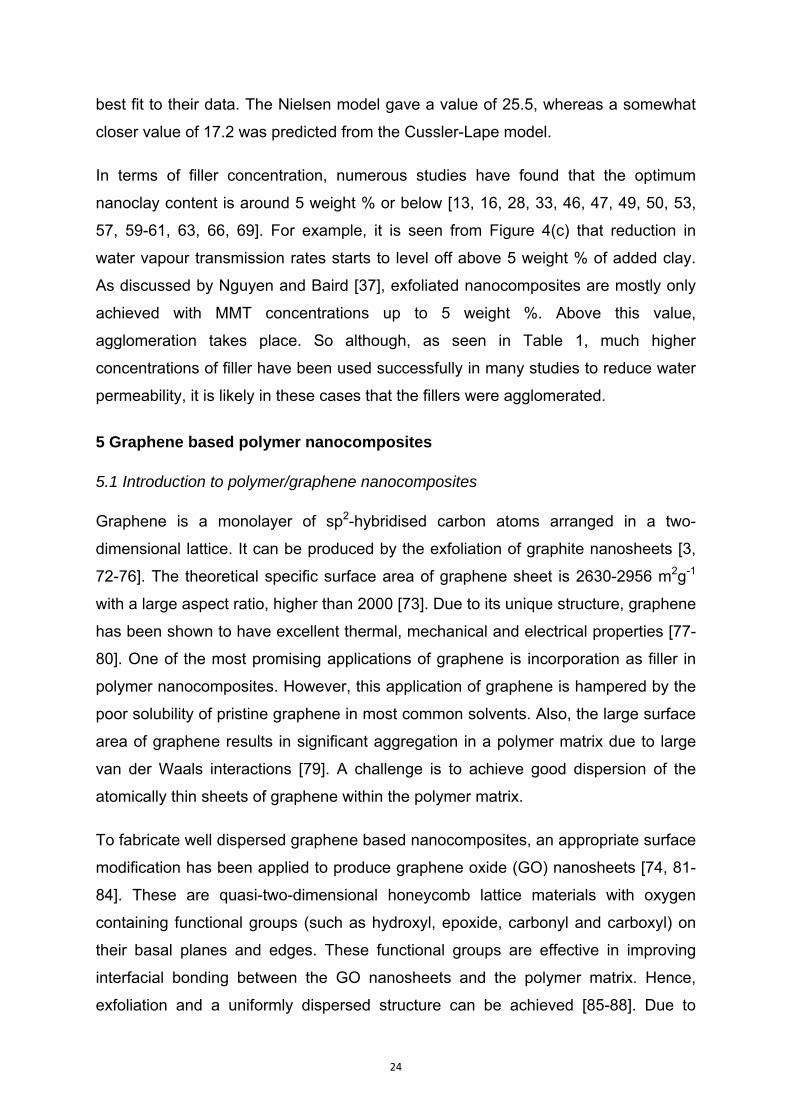
such as organic light emitting diodes (OLEDSs) [89-93]. Figure 5 is a schematic
diagram illustrating permeation through exfoliated graphene based nanocomposites.
Figure 5. Schematic diagram of permeation through graphene based nanocomposite
5.2 Water barrier properties of polymer/graphene nanocomposites
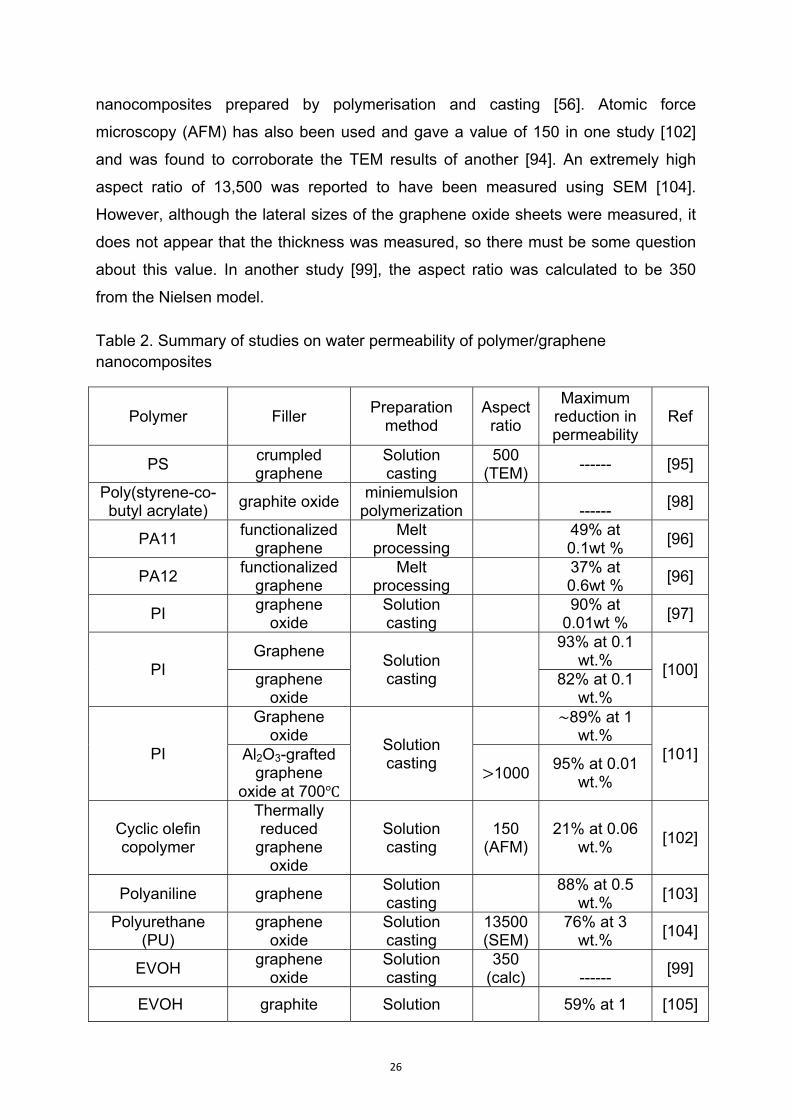
Table 2 summarises the results of studies on graphene based polymer
nanocomposites. These studies cover a range of polymers, graphene types and
preparation methods. Aspect ratios have been measured in a number of the studies
using various techniques. TEM was used in a couple of studies and values of 800
and 500 were reported [94, 95]. These values are at least an order of magnitude
higher than the aspect ratios reported from polymer-clay nanocomposites that were
processed by melt blending [16, 50, 51], although more comparable to polymer/clay
26
nanocomposites prepared by polymerisation and casting [56]. Atomic force
microscopy (AFM) has also been used and gave a value of 150 in one study [102]
and was found to corroborate the TEM results of another [94]. An extremely high
aspect ratio of 13,500 was reported to have been measured using SEM [104].
However, although the lateral sizes of the graphene oxide sheets were measured, it
does not appear that the thickness was measured, so there must be some question
about this value. In another study [99], the aspect ratio was calculated to be 350
from the Nielsen model.
Table 2. Summary of studies on water permeability of polymer/graphene nanocomposites
Polymer Filler Preparation
method Aspect ratio
Maximum reduction in permeability
Ref
PS crumpled graphene
Solution casting
500 (TEM)
------ [95]
Poly(styrene-co-butyl acrylate)
graphite oxide miniemulsion
polymerization
------
[98]
PA11 functionalized
graphene Melt
processing 49% at
0.1wt % [96]
PA12 functionalized
graphene Melt
processing 37% at
0.6wt % [96]
PI graphene
oxide Solution casting
90% at 0.01wt %
[97]
PI Graphene
Solution casting
93% at 0.1 wt.%
[100] graphene
oxide 82% at 0.1
wt.%
PI
Graphene oxide
Solution casting
~89% at 1
wt.% [101] Al2O3-grafted
graphene oxide at 700
1000 95% at 0.01
wt.%
Cyclic olefin copolymer
Thermally reduced
graphene oxide
Solution casting
150 (AFM)
21% at 0.06 wt.%
[102]
Polyaniline graphene Solution casting
88% at 0.5
wt.% [103]
Polyurethane (PU)
graphene oxide
Solution casting
13500 (SEM)
76% at 3 wt.%
[104]
EVOH graphene
oxide Solution casting
350 (calc)
------
[99]
EVOH graphite Solution 59% at 1 [105]
27
casting wt.%
PVA graphene
oxide Solution casting
800 (TEM)
68% at 0.72 vol. %
[94]
PVA graphene
oxide Solution casting
20% at 2
wt.% [106]
PLA graphene
functionalized epoxy
Melt processing
14% at 3 phr [107]
Nanocrystalline cellulose acetate
Graphene oxide
Solution casting
47% at 0.8
wt.% [108]
Plasticized starch
Graphene oxide
Solution casting
44% at 4wt.%
[109] Reduced graphene
oxide 35% at 4wt.%
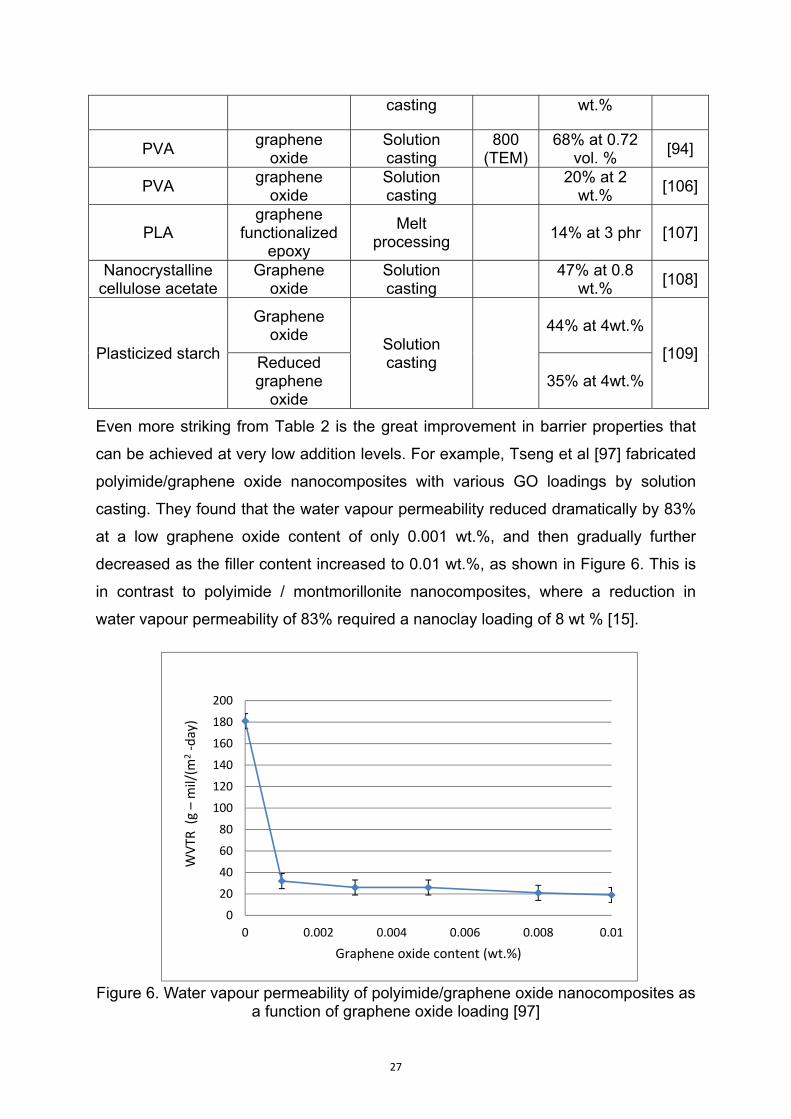
Even more striking from Table 2 is the great improvement in barrier properties that
can be achieved at very low addition levels. For example, Tseng et al [97] fabricated
polyimide/graphene oxide nanocomposites with various GO loadings by solution
casting. They found that the water vapour permeability reduced dramatically by 83%
at a low graphene oxide content of only 0.001 wt.%, and then gradually further
decreased as the filler content increased to 0.01 wt.%, as shown in Figure 6. This is
in contrast to polyimide / montmorillonite nanocomposites, where a reduction in
water vapour permeability of 83% required a nanoclay loading of 8 wt % [15].
Figure 6. Water vapour permeability of polyimide/graphene oxide nanocomposites as a function of graphene oxide loading [97]
0
20
40
60
80
100
120
140
160
180
200
0 0.002 0.004 0.006 0.008 0.01
WVTR
(g –mil/(m
2‐day)
Graphene oxide content (wt.%)
28
Polyimide is of particular interest for use in microelectronics because of its very high
thermal and chemical stability as well as a low dielectric constant. Other studies
have also reported excellent reductions in water vapour permeability of PI on the
addition of very low levels of graphene and modified graphene oxide [100, 101].
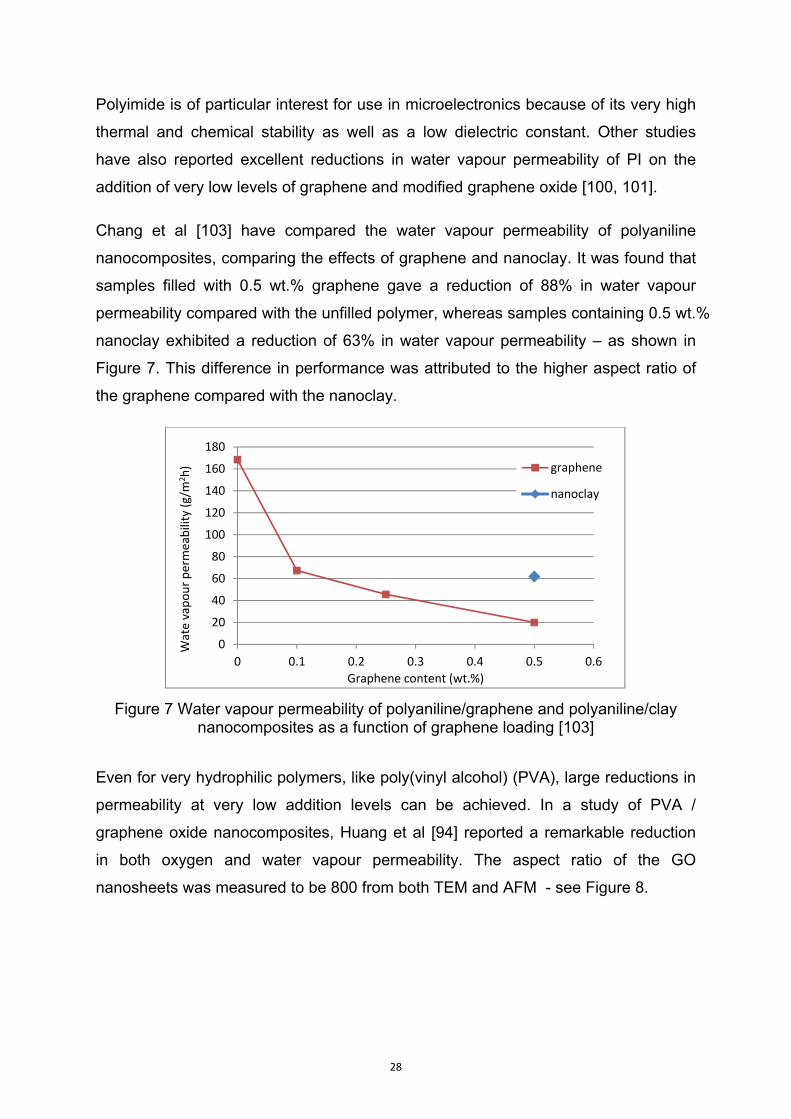
Chang et al [103] have compared the water vapour permeability of polyaniline
nanocomposites, comparing the effects of graphene and nanoclay. It was found that
samples filled with 0.5 wt.% graphene gave a reduction of 88% in water vapour
permeability compared with the unfilled polymer, whereas samples containing 0.5 wt.%
nanoclay exhibited a reduction of 63% in water vapour permeability – as shown in
Figure 7. This difference in performance was attributed to the higher aspect ratio of
the graphene compared with the nanoclay.
Figure 7 Water vapour permeability of polyaniline/graphene and polyaniline/clay nanocomposites as a function of graphene loading [103]
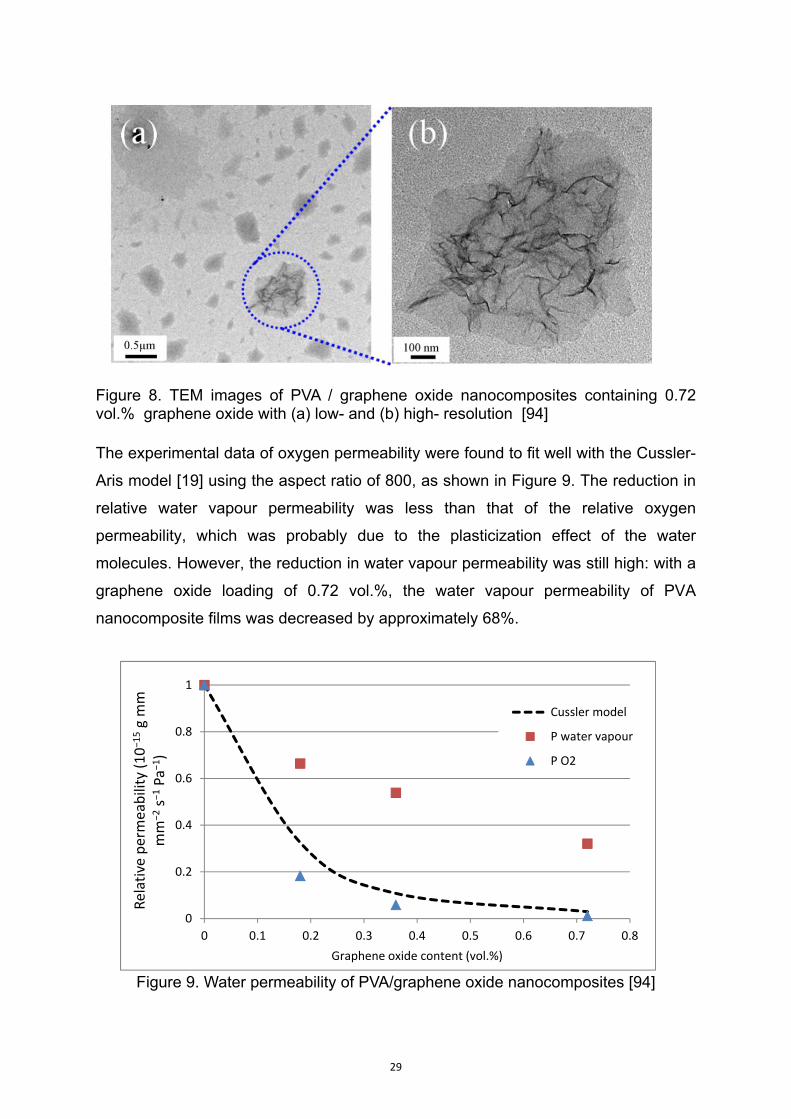
Even for very hydrophilic polymers, like poly(vinyl alcohol) (PVA), large reductions in
permeability at very low addition levels can be achieved. In a study of PVA /
graphene oxide nanocomposites, Huang et al [94] reported a remarkable reduction
in both oxygen and water vapour permeability. The aspect ratio of the GO
nanosheets was measured to be 800 from both TEM and AFM - see Figure 8.
0
20
40
60
80
100
120
140
160
180
0 0.1 0.2 0.3 0.4 0.5 0.6
Wate vapour permeability (g/m
2h)
Graphene content (wt.%)
graphene
nanoclay
29
Figure 8. TEM images of PVA / graphene oxide nanocomposites containing 0.72 vol.% graphene oxide with (a) low- and (b) high- resolution [94]
The experimental data of oxygen permeability were found to fit well with the Cussler-
Aris model [19] using the aspect ratio of 800, as shown in Figure 9. The reduction in
relative water vapour permeability was less than that of the relative oxygen
permeability, which was probably due to the plasticization effect of the water
molecules. However, the reduction in water vapour permeability was still high: with a
graphene oxide loading of 0.72 vol.%, the water vapour permeability of PVA
nanocomposite films was decreased by approximately 68%.
Figure 9. Water permeability of PVA/graphene oxide nanocomposites [94]
0
0.2
0.4
0.6
0.8
1
0 0.1 0.2 0.3 0.4 0.5 0.6 0.7 0.8
Relative permeability (10−15g mm
mm
−2s−
1Pa
−1)
Graphene oxide content (vol.%)
Cussler model
P water vapour
P O2
30
6. Validation of the Models and Anomalous Effects
The extent to which the various models have been validated is reviewed in this
section. Anomalous phenomena associated with water vapour permeation are also
discussed; i.e. water clustering, plasticization and agglomeration effects.
6.1 Review of Model Validation
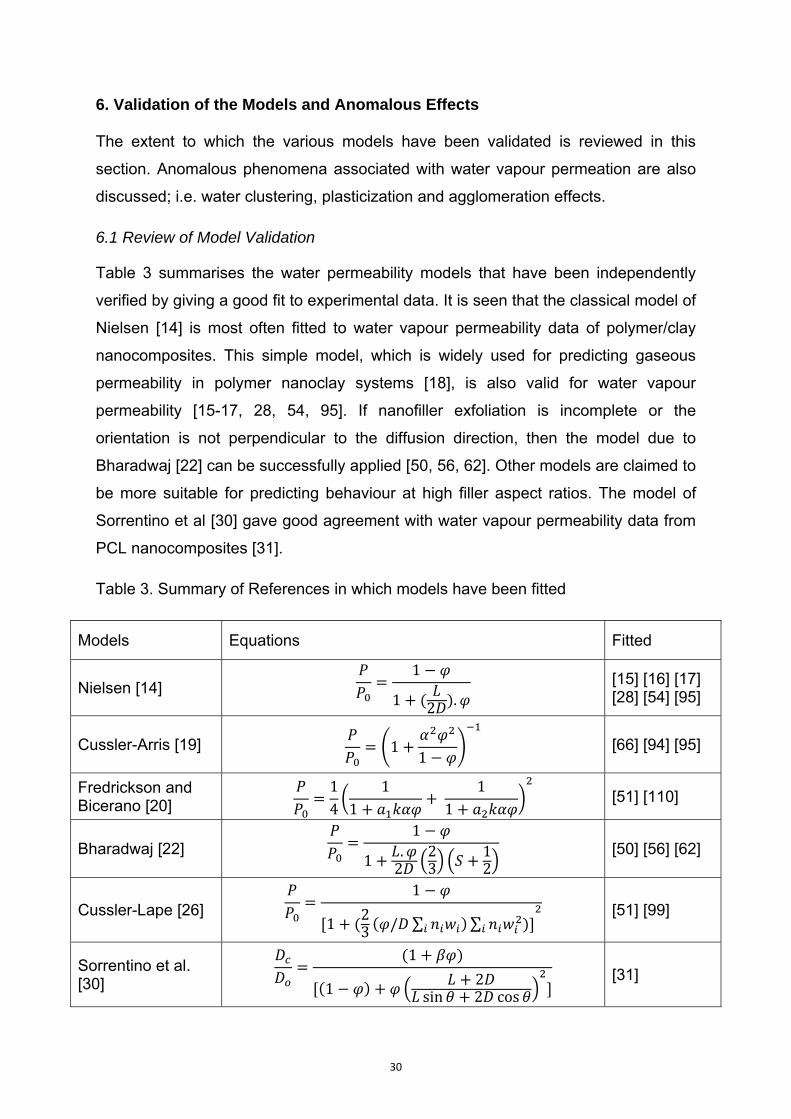
Table 3 summarises the water permeability models that have been independently
verified by giving a good fit to experimental data. It is seen that the classical model of
Nielsen [14] is most often fitted to water vapour permeability data of polymer/clay
nanocomposites. This simple model, which is widely used for predicting gaseous
permeability in polymer nanoclay systems [18], is also valid for water vapour
permeability [15-17, 28, 54, 95]. If nanofiller exfoliation is incomplete or the
orientation is not perpendicular to the diffusion direction, then the model due to
Bharadwaj [22] can be successfully applied [50, 56, 62]. Other models are claimed to
be more suitable for predicting behaviour at high filler aspect ratios. The model of
Sorrentino et al [30] gave good agreement with water vapour permeability data from
PCL nanocomposites [31].
Table 3. Summary of References in which models have been fitted
Models Equations Fitted
Nielsen [14] 1
1 2 . [15] [16] [17]
[28] [54] [95]
Cussler-Arris [19] 11
[66] [94] [95]
Fredrickson and Bicerano [20]
14
11
11
[51] [110]
Bharadwaj [22] 1
1.2
23
12
[50] [56] [62]
Cussler-Lape [26] 1
1 23 / ∑ ∑
[51] [99]
Sorrentino et al. [30]
1
1 2sin 2 cos
[31]
31
For the graphene nanocomposites, there has been some success in fitting to the
models of Cussler-Aris [19], Cussler-Lape [26] and Fredrickson and Bicerano [20],
although very few papers have reported measuring aspect ratios and fitting models.
Lai et al [102] did measure aspect ratio by AFM and reported a value of 150 but
found that their water permeability data was significantly lower than values predicted
from both a modified Nielsen model and the Cusler-Aris model. They attributed this
to ‘rigidification’ of the polymer chains near the graphene oxide particles.
Particularly for the graphene and graphene oxide nanocomposites, where there are
such dramatic drops in permeability at very low volume fractions, the effect of the
nanofiller in reducing polymer chain mobility should be considered. The water
permeability models proposed by Xu et al [24] and Alexandre et al [33] do take this
into account. However, it is very difficult to measure polymer chain confinement and
hence to predict its effect on permeability. Adame and Beall [111] have reported
direct measurement of the constrained polymer region in polyamide/clay
nanocomposites using AFM. They found for polyamide (nylon-MXD6) that there was
a constrained polymer region extending 40 to 50 nm from the clay surface and they
discussed how this might affect gaseous diffusion in these systems.
One parameter that is expected to be affected if the polymer chains are immobilised
by the addition of nanofiller is the glass transition temperature (Tg) of the polymer. Tg
is often reported by researchers and so this data can be reviewed. In their review
paper on graphene-based polymer nanocomposites, Potts et al [77] have reported
that attraction at the polymer-filler interface can give rise to very large increases in Tg.
Increases as high as 35ºC and 40ºC have been reported, although Tg shifts above
20ºC are unusual, and most are between 10 ºC and 20ºC or below.
In terms of papers on moisture permeability of polymer/graphene nanocomposites
cited in this review, a number have reported the effect of adding graphene-based
fillers on the Tg and the results are quite variable. For example, of the papers on PI
[97, 100, 101] none found a significant shift in the Tg of the polymer, although
excellent reductions in permeability were reported. For cyclic olefin/graphene
nanocomposites, a 6ºC increase in Tg was measured [102] and for a study on
PVOH/graphene oxide an increase of 6ºC was observed [94]. However, for another
32
paper on PVOH/GO [112] there was no shift in Tg and neither was any reported for
EVOH/GO [99].
Another important issue to consider is the potential influence of nanofiller
incorporation on crystallinity. This can affect the barrier properties of polymers
because crystallites act as inert fillers that are impermeable to both gas and liquid
penetrants. Hence permeability should decrease as crystallinity increases. Indeed,
the effect of crystallinity on the water vapour permeability of poly(lactic acid) has
been modelled by the Nielsen equation [17].
A number of studies have reported how addition of nanofillers affects crystallinity but,
as in the case of Tg, the results vary. Incorporation of nanoclay has been found to
cause an increase [18, 38] in the degree of crystallinity in semi-crystalline polymers
and even to initiate crystallisation in amorphous polymer matrices [1, 44]. However,
other studies reported a decrease [2] or no change in the crystallinity [16, 51].
Similarly, depending on the identity of the polymer matrix, the incorporation of
graphene-based filler has been found to increase [3, 96, 92], decrease [118] or
cause no change [94] to the degree of crystallinity. Where changes do occur, the
presence of graphene-based nanofillers is thought to affect the rate of crystallisation
by acting as a heterogeneous nucleation site for crystal growth [77].
6.2 Water clustering
The formation of clusters during the penetration of water has been observed in many
polymer systems [4, 12, 41, 52, 53, 62, 68, 113, 114]. The presence of water clusters
often causes a reduction in water diffusivity. For example, Marais et al [41] studied
the diffusion and permeation properties of liquid water through a range of polar and
non-polar polymers and copolymers. They found that water sorption resulted in a
positive plasticization on the water diffusion in polar polymers (such as PA6, PA12,
PET and EVA copolymers with VA contents greater than 19%). However, for
hydrophobic polyolefins (LDPE, PP and EVA with 4.5 wt% VA) there was a negative
plasticization effect. The decrease in water diffusion coefficient was attributed to a
clustering of water molecules in a hydrophobic material.
In relation to polymer/clay nanocomposites, Drozdov et al [114] found that water
transport in the neat resin was Fickian but became non-Fickian with increasing clay

33
content. This was attributed to a water clustering effect. They proposed that clusters
of water molecules mostly form in the neighbourhood of clay platelets. A water
molecule may be immobilized on the hydrophilic surface of a clay particle by one of
the two following ways:
(i) as a single-step event, in which an individual water molecule ‘merges with an
unoccupied site’ on the surface of a clay platelet;
(ii) as a two-step event, when a water molecule splits from a cluster and ‘merges with
an appropriate site’.
At low clay concentrations, the diffusivity is high and water clustering is negligible.
Therefore, the one-step mechanism takes place. As the clay content increases, the
two-step mechanism occurs. As a result there is a noticeable slowing down in the
process of water binding to the clay sheets because additional energy is required to
separate a water molecule from a cluster.
The size of the water cluster is found to be related to the water activity during the
diffusion process. Follain et al. [68] investigated the water vapour sorption of PCL /
cellulose nanocomposites and observed that the size of the water clusters increased
with water activity during the penetration process. The nanocomposites exhibited a
three-stage sorption process that correlated with the water activity: (i) the presence
of strongly bound water at a low water activity range; (ii) weakly bound sorbed water
molecules at a medium water activity range; (iii) large water clusters formed at a high
water activity range.
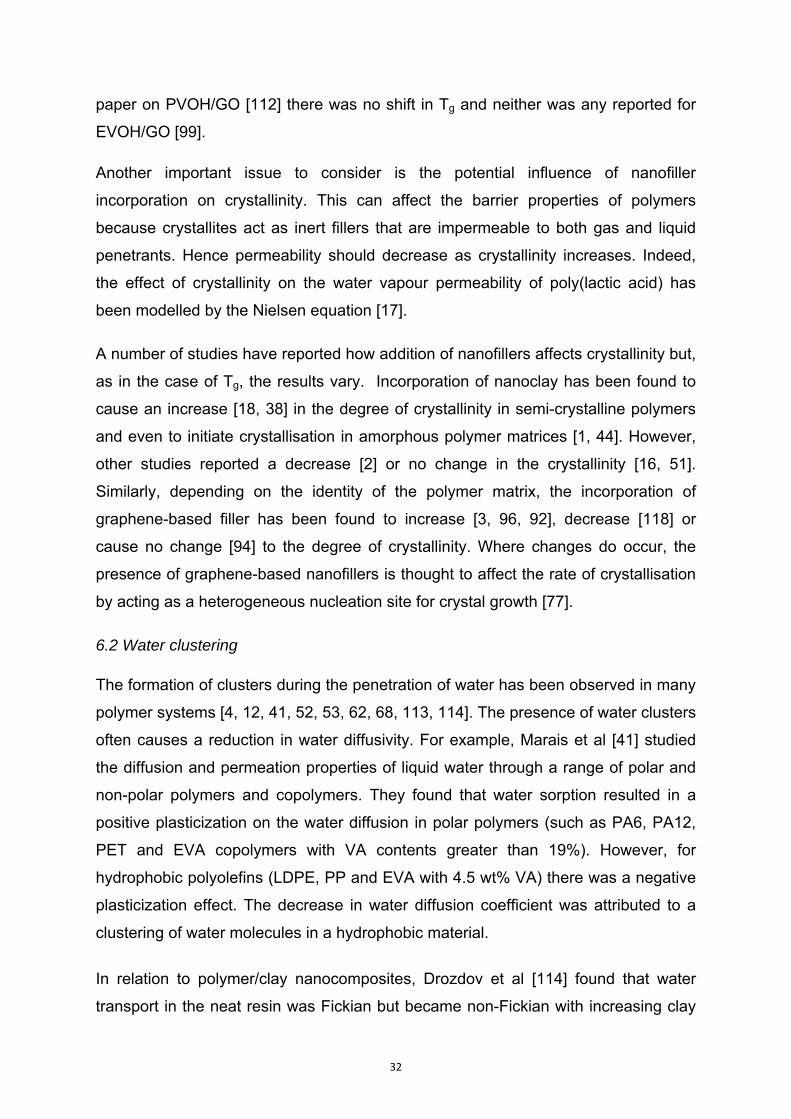
In a study of how water activity affects the barrier properties of PA6 nanocomposite
films, Picard et al [52] investigated how the average number of water molecules in a
cluster varied as a function of water activity. The results are plotted in Figure 10. It is
found that in the activity range between 0 and 0.85, the size of the water cluster is
limited so that it cannot affect the diffusion. As the water activity increases to 1, the
water clusters consist of more than two molecules, and hence the water diffusion
rate can be decreased due to the aggregation of water.
The size of the water aggregates was found to be similar for all films in the series
and corresponded to less than two molecules when activity was close to 0.9. Hence
34
it was concluded that for these nanocomposites, at an activity level below 0.9 there
was no effect of water clustering on the diffusion process.
Figure 10. Average number of water molecules in a cluster as a function of the activity for neat Polyamide (PA) and the nanocomposite films: (□) PA, (-) PA with 10wt% nanoclay and (X) PA with 13wt% nanoclay [52]
6.3 Plasticization Effect of Water
Plasticization can occur in hydrophilic polymers with sorbed water, resulting in an
increase in water diffusivity and permeability. Polymer chain mobility is enhanced
because free volume is increased during the permeation process. Hence the
diffusion coefficient of water is dependent on the water concentration. There is an
exponential dependence of the diffusion coefficient on concentration [115], so the
diffusion coefficient can be expressed by equation (21):
° ………………(21)
Where, ° is the diffusion coefficient at a water concentration of zero; is the
plasticization coefficient and C is the water concentration.
Alexandre et al [33] investigated plasticization effects in polyamide
12/montmorillonite nanocomposite membranes. The extent of plasticization was
35
determined in terms of a plasticization factor [41], which depends on both
equilibrium water concentration during the permeation process and the
plasticization coefficient, , which correlates with the free volume created by the
diffusing molecules within the polymer.
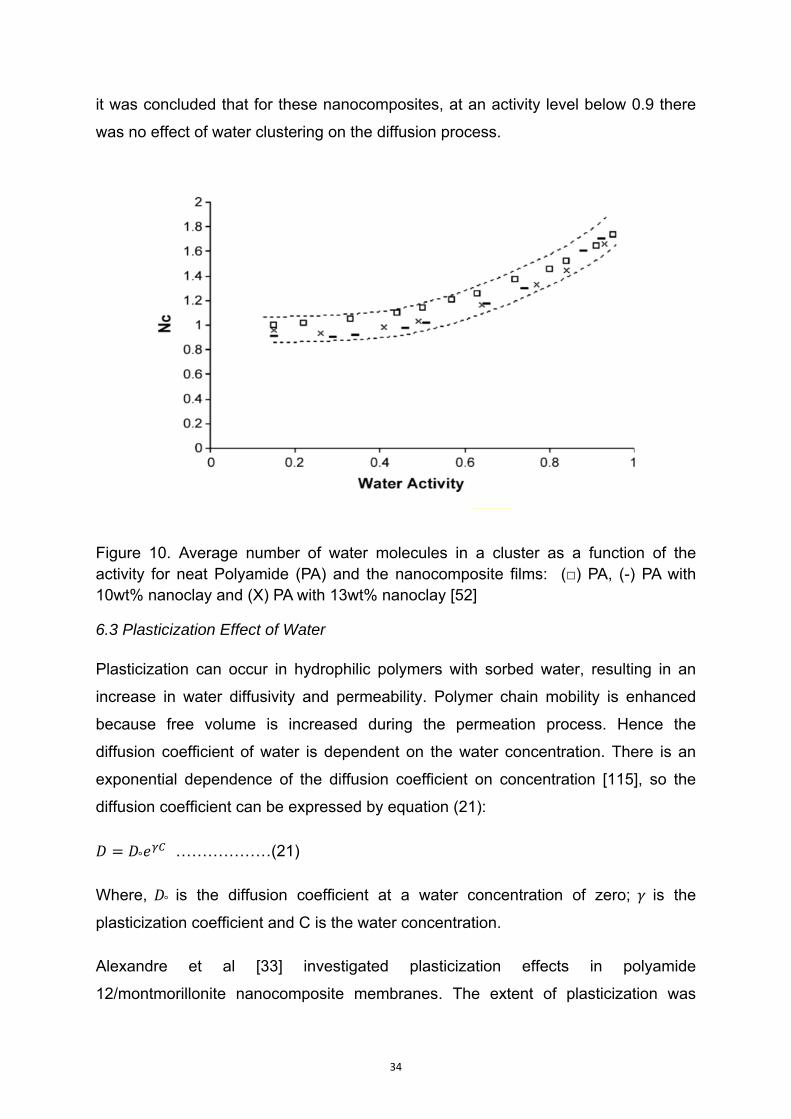
For intercalated polymer clay nanocomposite structures, the plasticization factor is
also associated with the clay content. The dependence of the plasticization factor,
, on volume fraction is shown in Figure 11 for both intercalated and exfoliated
structures [33]. Up to a volume fraction of 4% clay, the plasticization factor depended
weakly on the clay content for both structures. However, the effect was found to be
higher in partially intercalated structures than in partially exfoliated structures. Above
4%, there was a strong decrease in with increasing volume fraction in the case
of partially intercalated nanocomposite films. This result was surprising but was
thought to be due to reduced mobility of polymer chain segments because of the
large number of clay platelets at high clay concentration. Therefore, the authors [33]
concluded that around the filler particles and aggregated filler, there was an
interfacial layer, the properties of which were different from the bulk polymer when
saturated with water. The plasticization factor was taken into account in a new
permeability model (equation 20).
Figure 11. Plasticization factor, versus Closite30B clay volume fraction: (-O-)
partially intercalated and (-□-) partially exfoliated nanocomposites [33].
36
Alix et al [50] found that in PA6 based nanocomposites, the plasticization
phenomenon was greater in the intercalated polymer clay nanocomposite than in the
neat polymer and increased with clay content. This revealed that the sorbed water,
due to the plasticization phenomenon, is associated with the intercalated structure of
the montmorillonite clay in the nanocomposite.
In another study, an increase of water vapour permeability with increasing clay
content was observed for glassy aromatic-aliphatic polyamide (Trogamid) /
montmorillonite nanocomposites [53]. The water permeability of the nanocomposites
containing 3 wt % clay increased by 21% compared with neat polyamide, which was
attributed to the plasticization effect of the absorbed water. In this case, the
absorbed water molecules acted as a plasticizer, which weakened the interactions
between polymer chains, leading to an increase in diffusion. In addition, a water
cluster mechanism was reported to take place during the diffusion process. As the
interactions between water molecules became prevalent, the dissolved water
molecules were aggregated and formed water clusters, in which more water
molecules became trapped and thus the diffusion process was hindered. The two
mechanisms had opposite effects on the diffusion process. However, it was found
that the plasticization effect was predominant.
6.4 Agglomeration Effects
Agglomeration processes that have a deleterious outcome on barrier and other
properties of filled polymer films have been recognised for many years. In paint films
the optimum filler content to reduce barrier properties before a reversal takes place
is known as the critical pigment volume concentration (CPVC) [5].
In polymer nanocomposites, aggregated nanofillers have been shown to give rise to
new pathways for water diffusion at the clay/polymer interfacial zones, and therefore
increase water permeation [33]. Figure 12 illustrates this phenomenon in
polymer/clay nanocomposites. (This effect has aptly been described as a
‘percolation’ phenomenon [33] because interfacial regions can form channels
through the polymer film. However, the word percolation may cause confusion
because other authors [77] refer to a ‘percolating network’ of platelets as providing a
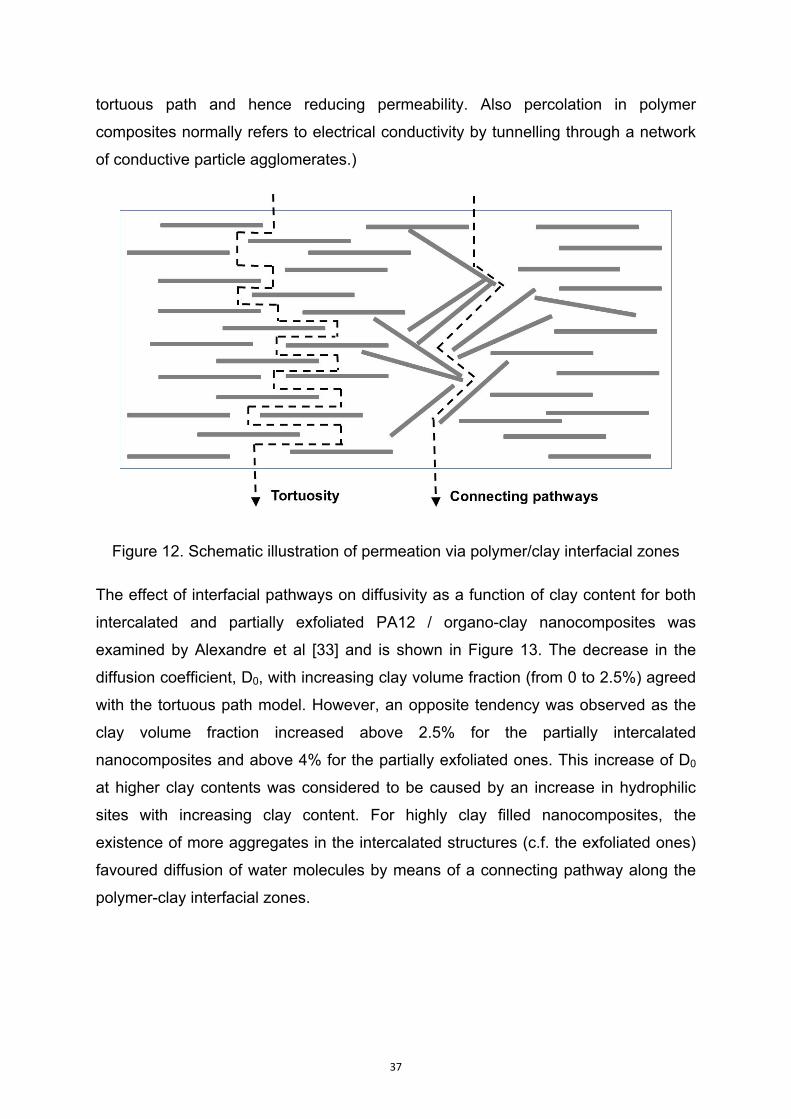
37
tortuous path and hence reducing permeability. Also percolation in polymer
composites normally refers to electrical conductivity by tunnelling through a network
of conductive particle agglomerates.)
Figure 12. Schematic illustration of permeation via polymer/clay interfacial zones
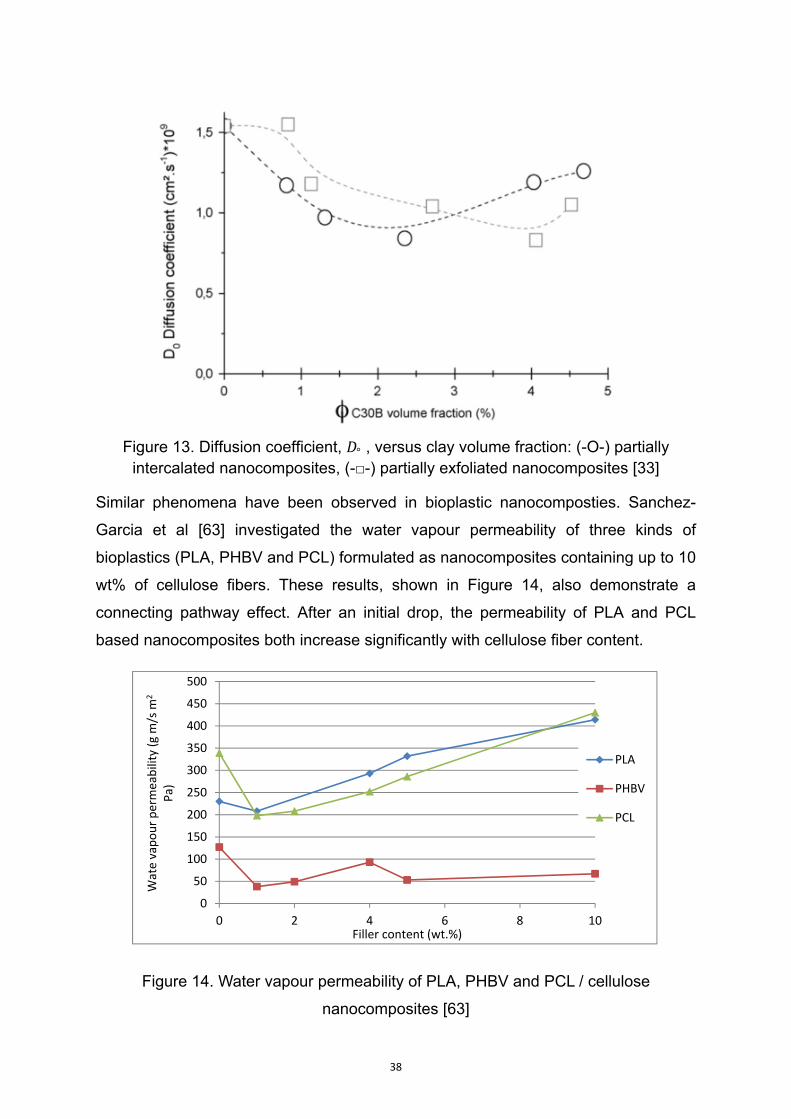
The effect of interfacial pathways on diffusivity as a function of clay content for both
intercalated and partially exfoliated PA12 / organo-clay nanocomposites was
examined by Alexandre et al [33] and is shown in Figure 13. The decrease in the
diffusion coefficient, D0, with increasing clay volume fraction (from 0 to 2.5%) agreed
with the tortuous path model. However, an opposite tendency was observed as the
clay volume fraction increased above 2.5% for the partially intercalated
nanocomposites and above 4% for the partially exfoliated ones. This increase of D0
at higher clay contents was considered to be caused by an increase in hydrophilic
sites with increasing clay content. For highly clay filled nanocomposites, the
existence of more aggregates in the intercalated structures (c.f. the exfoliated ones)
favoured diffusion of water molecules by means of a connecting pathway along the
polymer-clay interfacial zones.
38
Figure 13. Diffusion coefficient, ° , versus clay volume fraction: (-O-) partially intercalated nanocomposites, (-□-) partially exfoliated nanocomposites [33]
Similar phenomena have been observed in bioplastic nanocomposties. Sanchez-
Garcia et al [63] investigated the water vapour permeability of three kinds of
bioplastics (PLA, PHBV and PCL) formulated as nanocomposites containing up to 10
wt% of cellulose fibers. These results, shown in Figure 14, also demonstrate a
connecting pathway effect. After an initial drop, the permeability of PLA and PCL
based nanocomposites both increase significantly with cellulose fiber content.
Figure 14. Water vapour permeability of PLA, PHBV and PCL / cellulose
nanocomposites [63]
0
50
100
150
200
250
300
350
400
450
500
0 2 4 6 8 10
Wate vapour permeability (g m/s m
2
Pa)
Filler content (wt.%)
PLA
PHBV
PCL
39
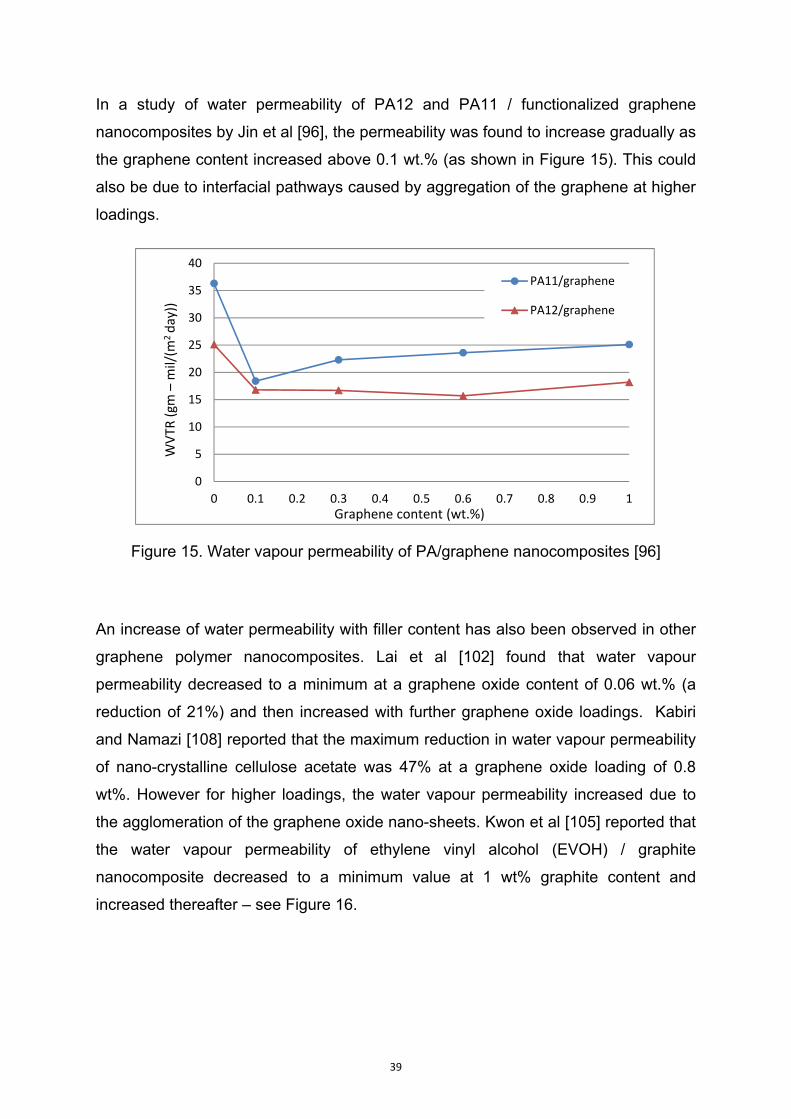
In a study of water permeability of PA12 and PA11 / functionalized graphene
nanocomposites by Jin et al [96], the permeability was found to increase gradually as
the graphene content increased above 0.1 wt.% (as shown in Figure 15). This could
also be due to interfacial pathways caused by aggregation of the graphene at higher
loadings.
Figure 15. Water vapour permeability of PA/graphene nanocomposites [96]
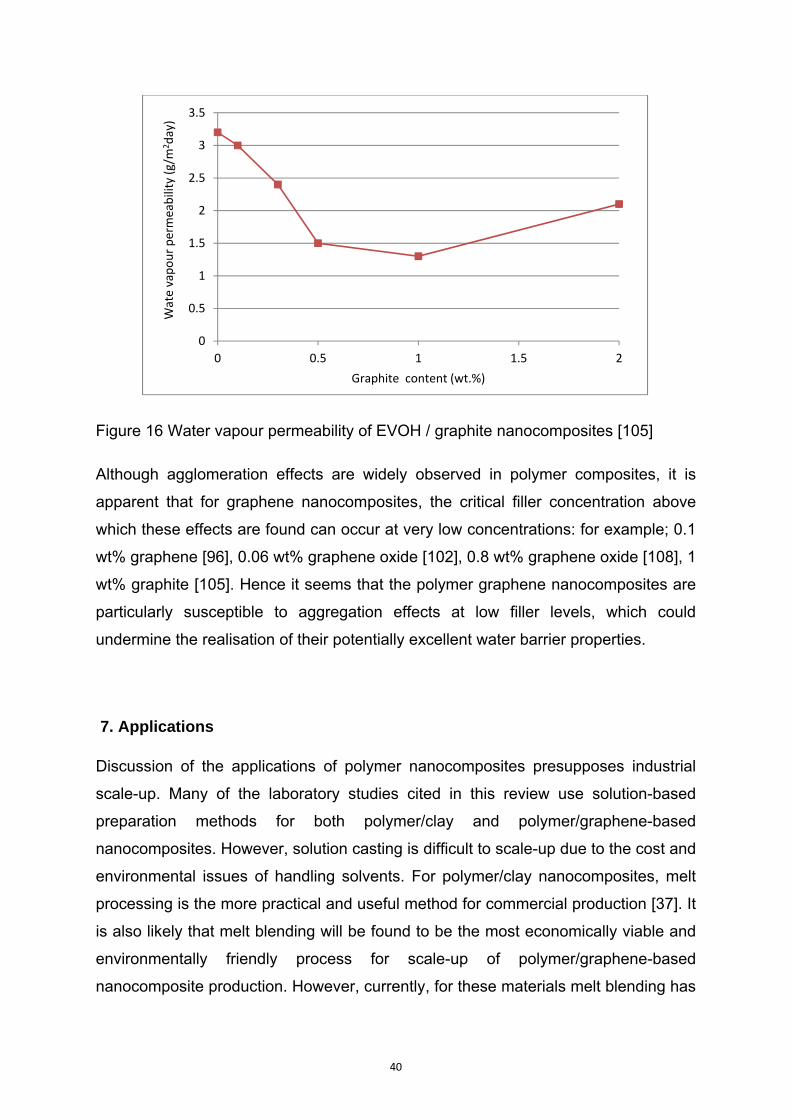
An increase of water permeability with filler content has also been observed in other
graphene polymer nanocomposites. Lai et al [102] found that water vapour
permeability decreased to a minimum at a graphene oxide content of 0.06 wt.% (a
reduction of 21%) and then increased with further graphene oxide loadings. Kabiri
and Namazi [108] reported that the maximum reduction in water vapour permeability
of nano-crystalline cellulose acetate was 47% at a graphene oxide loading of 0.8
wt%. However for higher loadings, the water vapour permeability increased due to
the agglomeration of the graphene oxide nano-sheets. Kwon et al [105] reported that
the water vapour permeability of ethylene vinyl alcohol (EVOH) / graphite
nanocomposite decreased to a minimum value at 1 wt% graphite content and
increased thereafter – see Figure 16.
0
5
10
15
20
25
30
35
40
0 0.1 0.2 0.3 0.4 0.5 0.6 0.7 0.8 0.9 1
WVTR
(gm
–mil/(m
2 day))
Graphene content (wt.%)
PA11/graphene
PA12/graphene
40
Figure 16 Water vapour permeability of EVOH / graphite nanocomposites [105]
Although agglomeration effects are widely observed in polymer composites, it is
apparent that for graphene nanocomposites, the critical filler concentration above
which these effects are found can occur at very low concentrations: for example; 0.1
wt% graphene [96], 0.06 wt% graphene oxide [102], 0.8 wt% graphene oxide [108], 1
wt% graphite [105]. Hence it seems that the polymer graphene nanocomposites are
particularly susceptible to aggregation effects at low filler levels, which could
undermine the realisation of their potentially excellent water barrier properties.
7. Applications
Discussion of the applications of polymer nanocomposites presupposes industrial
scale-up. Many of the laboratory studies cited in this review use solution-based
preparation methods for both polymer/clay and polymer/graphene-based
nanocomposites. However, solution casting is difficult to scale-up due to the cost and
environmental issues of handling solvents. For polymer/clay nanocomposites, melt
processing is the more practical and useful method for commercial production [37]. It
is also likely that melt blending will be found to be the most economically viable and
environmentally friendly process for scale-up of polymer/graphene-based
nanocomposite production. However, currently, for these materials melt blending has
0
0.5
1
1.5
2
2.5
3
3.5
0 0.5 1 1.5 2
Wate vapour permeability (g/m
2day)
Graphite content (wt.%)
41
not given the same level of filler dispersion as solvent mixing or in-situ
polymerisation [77].
Problems of filler dispersion are particularly acute for polymer/graphene and
polymer/GO nanocomposites. Graphene and its derivatives are difficult to formulate
due to the very large surface area and tendency to aggregate. There is a need to
ensure complete exfoliation, dispersion and ways of preventing aggregation of these
platelets in a polymer matrix [91]. Hence commercialisation is likely to be more
successful through the use of pre-stabilised formulations such as polymer master-
batches or inks.
Polymer / clay nanocomposites, such as PE and nylon nanocomposites, are used as
barrier materials in packaging and storage applications [43, 46, 50, 52]. Recently,
biodegradable and bio-based polymer / clay nanocomposites, for example PLA, PCL
and PBS, have been used as packaging, especially for food and also for short shelf-
life products, such as containers, beverage cups and blister packages [16, 57, 63, 65,
66, 116]. Some other potential applications for polymer / clay nanocomposites that
possess good water barrier properties are protective coatings, adhesives, moulding
compounds and dielectric materials for electronic applications, which also require
high thermal stability and good mechanical properties of the polymer [28, 69]. PBI /
clay nanocomposites have been used for membranes, for example, reverse osmosis
membranes in sea and brine water desalination, and also developed for organic
liquid fluid barrier applications [54]. Waterborne polyurethane / clay nanocomposites
are considered as promising materials to be used as water resistant coatings for
wood finishing, glass fibre sizing, automotive topcoats and adhesives to reduce
solvent emissions and retain good barrier properties [117].
Polymer / graphene-based nanocomposites have been shown to exhibit some
remarkable moisture barrier properties (section 5.2) and clearly have great potential
for use as permeation protection materials. Potential applications are food and
pharmaceutical packaging [73, 77, 78, 118] as well as anti-corrosive protective
coatings [119, 120]. Devices, such as liquid crystal displays and organic light-
emitting diodes (OLEDs), are very sensitive to moisture and oxygen. Therefore, with
such excellent barrier properties, graphene-based/polymer nanocomposites have
obvious potential as ultra-barriers for organic electronics [91, 121].
42
Graphene is electrically conducting whereas GO is not, so the choice of graphene-
based filler will depend upon whether electrical conductivity is a requirement of the
polymer nanocomposite. Transparency is another requirement for many of these
applications. However, this can be a difficulty because some polymer/graphene-
based films are opaque [72, 74, 94, 95, 104, 118, 119]. However, where there is very
good dispersion of the graphene or graphene-oxide platelets, then highly transparent,
high barrier films can be produced that have potential for use in electronic devices
such as flexible electronic papers, OLEDs, flexible liquid crystal displays, organic
solar cells and organic thin film transistors [97, 99, 100, 102, 122].
8. Conclusions
One of the important successes of polymer/clay nanocomposites is the improvement
in barrier properties that can be generated. With relatively low concentrations (< 6
wt%) of nanoclay, it is possible to achieve significant reductions in permeability to
both gases and water vapour. Preparation methods for these materials are well
established. Solution casting is a convenient laboratory-scale method, whereas melt
processing is more practical and useful for commercial production [37]. In the
numerous studies reviewed, neither method was found to produce better barrier
properties than the other. It seems that the shear stresses applied in melt processing
give better dispersion of the clay platelets than is obtained from solution casting.
However, these stresses also break up the clay platelets and reduce their aspect
ratio compared with what can be achieved from solution techniques.
There are many applications for polymer/clay nanocomposites including packaging,
storage, protective coatings and dielectric materials for electronic applications.
Polymer/graphene-based nanocomposites are found to give dramatic improvements
in moisture barrier properties. For example, one study [97] on polyimide/graphene
oxide nanocomposites reported an 83% reduction in water vapour permeability with
a low graphene oxide content of only 0.001 wt.%. This is in contrast to polyimide /
montmorillonite nanocomposites, where a reduction in water vapour permeability of
83% required a nanoclay loading of 8 wt % [15]. This difference in performance is
largely attributed to the much higher aspect ratio of the graphene-derived platelets
compared with the nanoclay.
43
To prepare well-dispersed graphene-based nanocomposites, an appropriate surface
modification is often applied to fabricate graphene oxide nano-sheets. These
functionalized sheets enable exfoliation and a well dispersed structure to be
achieved. Due to their outstanding barrier properties, these materials have potential
as ultra-barriers for organic electronics [91, 121].
There are numerous models that have been proposed to predict the effects of
nanofillers in reducing water vapour permeability through polymers. These models
are based on a range of different factors such as; tortuosity, geometry, platelet
stacking, orientation, polymer chain confinement and plasticization. It is found that
the classical model of Nielsen [14] is most often fitted to water vapour permeability
data of polymer/clay nanocomposites. If nanofiller exfoliation is incomplete or the
orientation is not perpendicular to the diffusion direction, then the model due to
Bharadwaj [22] can be successfully applied [50, 56, 62]. Other models are claimed to
be more suitable for predicting behaviour at high filler aspect ratios.
For the graphene-based nanocomposites, there has been some success in fitting to
the models of Cussler-Aris [19], Cussler-Lape [26] and Fredrickson and Bicerano
[20], although very few papers have reported measuring aspect ratios and fitting
models. Apart from the parameters of aspect ratio, filler volume fraction and
orientation, polymer chain confinement is also considered. This would seem to be
particularly important for the graphene and graphene oxide nanocomposites, where
there are such dramatic drops in permeability at very low volume fractions. The glass
transition temperature (Tg) of the polymer is expected to be affected if the polymer
chains are immobilised by the addition of nanofiller. Many papers on graphene-
based polymer nanocomposites do report values of Tg but the results are quite
variable. While some papers did find an increase in Tg, there were many that
reported no change even though excellent barrier properties were found.
A number of other phenomena can occur to influence moisture barrier properties of
polymer nanocomposites and therefore need consideration. These are water
clustering, plasticization and agglomeration effects. Water clustering causes a
reduction in water diffusivity and tends to occur in hydrophobic polymers and in the
neighbourhood of nano-platelets. Plasticization can occur in hydrophilic polymers

44
with sorbed water, resulting in an increase in water diffusivity and permeability.
Agglomeration effects refer to aggregated nanofillers that give rise to new pathways
for water diffusion at the platelet/polymer interfacial zones, and therefore increase
water permeation. This effect has been observed for polymer/clay, polymer/cellulose
and polymer/graphene nanocomposites. Although agglomeration effects are often
observed in polymer composites, it is apparent that for graphene-based
nanocomposites, the critical filler concentration above which these effects are found
can occur at very low values. Hence there is a need to ensure complete exfoliation,
dispersion and ways of preventing aggregation of graphene-based platelets in a
polymer matrix [91] to deliver these exceptional materials to the market place.
Acknowledgements
This work was supported by the Department of Materials, Loughborough University,
UK.
References
[1] S. S. Ray and M. Okamoto, “Polymer/layered silicate nanocomposites: a review from preparation to processing,” Prog. Polym. Sci., vol. 28, no. 11, pp. 1539–1641, 2003.
[2] D. R. Paul and L. M. Robeson, “Polymer nanotechnology: Nanocomposites,” Polymer, vol. 49, no. 15, pp. 3187–3204, 2008.
[3] H. Kim, A. A. Abdala and C. W. Macosko, “Graphene/Polymer Nanocomposites,” Macromolecules, vol. 43, no. 16, pp. 6515–6530, 2010.
[4] J. . Crank and G. S. Park, Diffusion in Polymers. London: Academic Press, 1968.
[5] N. L. Thomas, “The barrier properties of paint coatings,” Prog. Org. Coatings, vol. 19, no. 2, pp. 101–121, 1991.
[6] P. Meares, Polymers: Structure and Bulk Properties. chapter 12. Van Nostrand, 1965.
[7] W. J. Muizebelt and W. J. M. Heuvelsland, Polym. Mater. Sci. Eng., vol. 53, pp. 454–456, 1985.
[8] S. Pauly, Polymer Handbook. section VI, 3rd ed. Wiley Interscience, 1989, p. 435.
45
[9] T. Alfrey, E. F. Gurnee and W. G. Lloyd, “Diffusion in glassy polymers,” J. Polym. Sci. Part C vol. 12, pp. 249–261, 1966.
[10] H. B. Hopfenberg and V. Stannet, The Physics of Glassy Polymers-chapter 9. Applied Science Publishers Ltd., 1973, pp. 504–547.
[11] N. L. Thomas and A. H. Windle, “A theory of Case II diffusion,” Polymer, vol. 23, pp. 529–542, 1982.
[12] G. Pogany, “Anomalous diffusion of water in glassy polymers,” Polymer, vol. 17, no. 8, pp. 690–694, 1976.
[13] K. Yano, A. Usuki and A. Okada, “Synthesis and Properties of Polyimide-Clay Hybrid Films,” J. Polym. Sci. Part A Polym. Chem., vol. 35, no. 11, pp. 2289–2294, 1997.
[14] L. E. Nielsen, “Models for the Permeability of Filled Polymer Systems,” J. Macromol. Sci. Part A - Chem., vol. 1, no. 5, pp. 929–942, 1967.
[15] K. Yano, A. Usuki, A. Okada, T. Kurauchi and O. Kamigaito, “Synthesis and Properties of Polyimide-Clay Hybrid,” J. Polym. Sci. Part A, Polym. Chem. vol. 31, pp. 2493–2498, 1993.
[16] Z. Duan, N. L. Thomas and W. Huang, “Water vapour permeability of poly(lactic acid) nanocomposites,” J. Memb. Sci., vol. 445, pp. 112–118, 2013.
[17] Z. Duan and N. L. Thomas, “Water vapour permeability of poly(lactic acid): Crystallinity and the tortuous path model,” J. Appl. Phys., vol. 115, no. 6, p. 064903, 2014.
[18] G. Choudalakis and A. Gotsis, “Permeability of polymer/clay nanocomposites: a review,” Eur. Polym. J., vol. 45, no. 4, pp. 967–984, Apr. 2009.
[19] E. L. Cussler, S. E. Hughes, W. J. Ward and R. Aris, “Barrier Membranes,” J. Memb. Sci., vol. 38, pp. 161–174, 1988.
[20] G. H. Fredrickson and J. Bicerano, “Barrier properties of oriented disk composites,” J. Chem. Phys., vol. 110, no. 4, p. 2181, 1999.
[21] H. R. Gusev and A. A. Lusti, “Rational Design of Nanocomposites for Barrier Applications,” Adv. Mater., vol. 13, no. 21, pp. 1641–1643, 2001.
[22] R. K. Bharadwaj, “Modeling the Barrier Properties of Polymer-layered Silicate Nanocomposites,” Macromolecules, vol. 34, no. 2, pp. 9189–9192, 2001.
[23] S. Nazarenko, P. Meneghetti, P. Julmon, B. G. Olson and S. Qutubuddin, “Gas barrier of polystyrene montmorillonite clay nanocomposites: Effect of mineral layer aggregation,” J. Polym. Sci. Part B Polym. Phys., vol. 45, no. 13, pp. 1733–1753, 2007.
46
[24] B. Xu, Q. Zheng, Y. Song and Y. Shangguan, “Calculating barrier properties of polymer/clay nanocomposites: Effects of clay layers,” Polymer , vol. 47, no. 8, pp. 2904–2910, 2006.
[25] A. A. Gusev, “Numerical Identification of the Potential of Whisker- and Platelet-Filled Polymers,” Macromolecules, vol. 34, no. 9, pp. 3081–3093, 2001.
[26] N. K. Lape, E. E. Nuxoll, and E. L. Cussler, “Polydisperse flakes in barrier films,” J. Memb. Sci., vol. 236, no. December 2003, pp. 29–37, 2004.
[27] C. Lu and Y.-W. Mai, “Permeability modelling of polymer-layered silicate nanocomposites,” Compos. Sci. Technol., vol. 67, no. 14, pp. 2895–2902, 2007.
[28] J. Kim, C. Hu, R. Woo and M. Sham, “Moisture barrier characteristics of organoclay-epoxy nanocomposites,” Compos. Sci. Technol., vol. 65, no. 5, pp. 805–813, 2005.
[29] S. S. Ray, K. Okamoto and M. Okamoto, “Structure - Property Relationship in Biodegradable Poly ( butylene succinate )/ Layered Silicate Nanocomposites,” Macromolecules, vol. 36, pp. 2355–2367, 2003.
[30] A. Sorrentino, M. Tortora and V. Vittoria, “Diffusion behavior in polymer-clay nanocomposites,” J. Polym. Sci. Part B Polym. Phys., vol. 44, no. 2, pp. 265–274, Jan. 2006.
[31] V. Bugatti, U. Costantino, G. Gorrasi, M. Nocchetti, L. Tammaro and V. Vittoria, “Nano-hybrids incorporation into poly(ε-caprolactone) for multifunctional applications: Mechanical and barrier properties,” Eur. Polym. J., vol. 46, no. 3, pp. 418–427, Mar. 2010.
[32] G. Gorrasi, M. Tortora, V. Vittoria, E. Pollet, B. Lepoittevin, M. Alexandre and P. Dubois, “Vapor barrier properties of polycaprolactone montmorillonite nanocomposites: effect of clay dispersion,” Polymer (Guildf)., vol. 44, no. 8, pp. 2271–2279, Apr. 2003.
[33] B. Alexandre, D. Langevin, P. Médéric, T. Aubry, H. Couderc, Q. T. Nguyen, A. Saiter and S. Marais, “Water barrier properties of polyamide 12/montmorillonite nanocomposite membranes: Structure and volume fraction effects,” J. Memb. Sci., vol. 328, no. 1–2, pp. 186–204, 2009.
[34] C. Lu and Y.-W. Mai, “Influence of aspect ratio on barrier properties of polymer-clay nanocomposites.,” Phys. Rev. Lett., vol. 95, no. 8, p. 088303, Aug. 2005.
[35] C. Swannack, C. Cox, A. Liakos and D. Hirt, "A three-dimensional simulation of barrier properties of nanocomposite films," J. Membr. Sci., 263, pp 47–56, 2005.
47
[36] X. Chen and T. Papathanasiou, "Barrier properties of flake-filled membranes: review and numerical evaluation," J. Plast. Film Sheeting, 23, pp 319–346 2007.
[37] Q. T. Nguyen and D. G. Baird, "Preparation of polymer-clay nanocomposites and their properties," Adv. Polym. Technol., vol 25, no 4, 270-285, 2006.
[38] Y. Cui, S. Kumar, B. R. Konac and D. Van Houckec, " Gas barrier properties of polymer/clay nanocomposites," RSC Adv., vol 5, 63669-90, 2015.
[39] S. Pavlidou and C. D. Papaspyrides, “A review on polymer-layered silicate nanocomposites,” Progress in Polymer Science (Oxford), vol. 33, no. 12. pp. 1119–1198, 2008.
[40] V. Mittal, “Polymer layered silicate nanocomposites: A review,” Materials (Basel)., vol. 2, no. 3, pp. 992–1057, 2009.
[41] S. Marais, Q. T. Nguyen, C. Devallencourt, M. Metayer, T. U. Nguyen, and P. Schaetzel, “Permeation of water through polar and nonpolar polymers and copolymers: determination of the concentration-dependent diffusion coefficient,” J. Polym. Sci. Part B Polym. Phys., vol. 38, pp. 1998–2008, 2000.
[42] M. Alexandre and P. Dubois, “Polymer-layered silicate nanocomposites: Preparation, properties and uses of a new class of materials,” Mater. Sci. Eng. R Reports, vol. 28, no. March, pp. 1–63, 2000.
[43] P. C. Lebaron, Z. Wang, and T. J. Pinnavaia, “Polymer-layered silicate nanocomposites: An overview,” Appl. Clay Sci., vol. 15, pp. 11–29, 1999.
[44] D. Feldman, “Polymer Nanocomposite Barriers,” J. Macromol. Sci. Part A, vol. 50, no. 4, pp. 441–448, 2013.
[45] J. W. C. Carvalho; C. Sarantopoulos; L. H. Innocentini-Mei, “Nanocomposites-Based Polyolefins as Alternative to Improve Barrier Properties,” J. Appl. Polym. Sci., vol. 118, pp. 3695–3700, 2010.
[46] K. Alena, M. Dagmar, G. J. Francois, and S. Miroslav, “Polymer/clay nanocomposites and their gas barrier properties,” Polym. Compos., vol. 34, no. 9, pp. 1418–1424, 2013.
[47] N. Lilichenko, R. D. Maksimov, J. Zicans, R. M. Meri, and E. Plume, “A Biodegradable Polymer Nanocomposite: Mechanical and Barrier Properties,” Mechanics Composite Materials, vol. 44, no. 1, pp. 45–56, 2008.
[48] A. Giannakas, C. G. Spanos, N. Kourkoumelis, T. Vaimakis, and A. Ladavos, “Preparation, characterization and water barrier properties of PS/organo-montmorillonite nanocomposites,” Eur. Polym. J., vol. 44, no. 12, pp. 3915–3921, Dec. 2008.
48
[49] B. Alexandre, S. Marais, D. Langevin, P. Médéric, and T. Aubry, “Nanocomposite-based polyamide 12/montmorillonite: relationships between structures and transport properties,” Desalination, vol. 199, no. 1–3, pp. 164–166, 2006.
[50] S. Alix, N. Follain, N. Tenn, B. Alexandre, S. Bourbigot, J. Soulestin, and S. Marais, “Effect of Highly Exfoliated and Oriented Organoclays on the Barrier Properties of Polyamide 6 Based Nanocomposites,” J. Phys. Chem. C, vol. 116, no. 8, pp. 4937–4947, 2012.
[51] E. Picard, A. Vermogen, J. Gerard, and E. Espuche, “Barrier properties of nylon 6-montmorillonite nanocomposite membranes prepared by melt blending: Influence of the clay content and dispersion stateConsequences on modelling,” J. Memb. Sci., vol. 292, no. 1–2, pp. 133–144, Apr. 2007.
[52] E. Picard, J.-F. Gérard, and E. Espuche, “Water transport properties of polyamide 6 based nanocomposites prepared by melt blending: On the importance of the clay dispersion state on the water transport properties at high water activity,” J. Memb. Sci., vol. 313, no. 1–2, pp. 284–295, 2008.
[53] A. García, S. Eceolaza, M. Iriarte, C. Uriarte, and A. Etxeberria, “Barrier character improvement of an amorphous polyamide (Trogamid) by the addition of a nanoclay,” J. Memb. Sci., vol. 301, no. 1–2, pp. 190–199, 2007.
[54] C. S. Karthikeyan, S. P. Nunes, and K. Schulte, “Barrier Properties of Poly(benzimidazole)-Layered Silicates Nanocomposite Materials,” Adv. Eng. Mater., vol. 8, no. 10, pp. 1010–1015, 2006.
[55] M. Tortora, G. Gorrasi, V. Vittoria, G. Galli, S. Ritrovati, and E. Chiellini, “Structural characterization and transport properties of organically modified montmorillonite / polyurethane nanocomposites,” Polymer , vol. 43, pp. 6147–6157, 2002.
[56] A. Chien and K. Lin, “Morphology and Permeability of Exfoliated PVAc-MMT Nanocomposite Films Cast From Soap-Free Emulsion-Polymerized Latices,” J. Polym. Sci. Part A Polym. Chem., vol. 54, no. 32, pp. 5583–5589, 2007.
[57] C. Thellen, C. Orroth, D. Froio, D. Ziegler, J. Lucciarini, R. Farrell, N. A. D’Souza, and J. A. Ratto, “Influence of montmorillonite layered silicate on plasticized poly(l-lactide) blown films,” Polymer, vol. 46, no. 25, pp. 11716–11727, 2005.
[58] G. Gorrasi, L. Tammaro, V. Vittoria, M. Paul, M. Alexandre, and P. Dubois, “Transport Properties of Water Vapor in Polylactide/Montmorillonite Nanocomposites,” J. Macromol. Sci. Part B, vol. 43, no. 3, pp. 565–575, 2004.
[59] J.-W. Rhim, S.-I. Hong, and C.-S. Ha, “Tensile, water vapor barrier and antimicrobial properties of PLA/nanoclay composite films,” LWT Food Sci. Technol., vol. 42, no. 2, pp. 612–617, 2009.
49
[60] M. Zenkiewicz and J. Richert, “Permeability of polylactide nanocomposite films for water vapour, oxygen and carbon dioxide,” Polym. Test., vol. 27, no. 7, pp. 835–840, 2008.
[61] M. Zenkiewicz, J. Richert, and A. Róański, “Effect of blow moulding ratio on barrier properties of polylactide nanocomposite films,” Polym. Test., vol. 29, no. 2, pp. 251–257, 2010.
[62] N. Tenn, N. Follain, J. Soulestin, R. Crétois, S. Bourbigot, and S. Marais, “Effect of Nanoclay Hydration on Barrier Properties of PLA / Montmorillonite Based Nanocomposites,” J. Phys. Chem. C, vol. 117, pp. 12117–12135, 2013.
[63] M. D. Sanchez-Garcia, E. Gimenez, and J. M. Lagaron, “Morphology and barrier properties of solvent cast composites of thermoplastic biopolymers and purified cellulose fibers,” Carbohydr. Polym., vol. 71, no. 2, pp. 235–244, 2008.
[64] E. Espino-Pérez, J. Bras, V. Ducruet, A. Guinault, A. Dufresne, and S. Domenek, “Influence of chemical surface modification of cellulose nanowhiskers on thermal, mechanical, and barrier properties of poly(lactide) based bionanocomposites,” Eur. Polym. J., vol. 49, no. 10, pp. 3144–3154, 2013.
[65] G. Gorrasi, R. Pantani, M. Murariu, and P. Dubois, “PLA/Halloysite Nanocomposite Films: Water Vapor Barrier Properties and Specific Key Characteristics,” Macromol. Mater. Eng., vol. 299, no. 1, pp. 104–115, 2014.
[66] P. B. Messersmith and E. P. Giannelis, “Synthesis and barrier properties of poly(ɛ-caprolactone)-layered silicate nanocomposites,” J. Polym. Sci. Part A Polym. Chem., vol. 33, no. 7, pp. 1047–1057, 1995.
[67] G. Gorrasi, M. Tortora, V. Vittoria, G. Galli, and E. Chiellini, “Transport and mechanical properties of blends of poly(ε-caprolactone) and a modified montmorillonite- poly(ε-caprolactone) nanocomposite,” J. Polym. Sci. Part B Polym. Phys., vol. 40, no. 11, pp. 1118–1124, 2002.
[68] N. Follain, S. Belbekhouche, J. Bras, G. Siqueira, S. Marais, and A. Dufresne, “Water transport properties of bio-nanocomposites reinforced by Luffa cylindrica cellulose nanocrystals,” J. Memb. Sci., vol. 427, no. 2013, pp. 218–229, 2013.
[69] M. R. de Moura, F. a. Aouada, V. Zucolotto, and L. H. C. Mattoso, “Barrier and Mechanical Properties of Clay-Reinforced Polymeric Nanocomposites,” Polym. Plast. Technol. Eng., vol. 50, no. 13, pp. 1323–1328, 2011.
[70] C. F. Dai, P. R. Li and J. M. Yeh, “Comparative studies for the effect of intercalating agent on the physical properties of epoxy resin-clay based nanocomposite materials”, European Polymer Journal, 44(8), pp. 2439–2447, 2008.
50
[71] O. Gain, E. Espuche, E. Pollet, M. Alexandre, and P. Dubois, “Gas barrier properties of poly(ε-caprolactone)/clay nanocomposites: Influence of the morphology and polymer/clay interactions”, Journal of Polymer Science, Part B: Polymer Physics, 43(2), pp. 205–214, 2005.
[72] M. J. Allen, V. C. Tung, and R. B. Kaner, “Honeycomb carbon: a review of graphene.,” Chem. Rev., vol. 110, no. 1, pp. 132–45, 2010.
[73] Y. Zhu, S. Murali, W. Cai, X. Li, J. W. Suk, J. R. Potts, and R. S. Ruoff, “Graphene and graphene oxide: synthesis, properties, and applications.,” Adv. Mater., vol. 22, no. 35, pp. 3906–24, 2010.
[74] O. C. Compton and S. T. Nguyen, “Graphene oxide, highly reduced graphene oxide, and graphene: versatile building blocks for carbon-based materials.,” Small, vol. 6, no. 6, pp. 711–23, 2010.
[75] J. Liu, L. Tao, W. Yang, D. Li, C. Boyer, R. Wuhrer, F. Braet, and T. P. Davis, “Synthesis, characterization, and multilayer assembly of pH sensitive graphene-polymer nanocomposites,” Langmuir, vol. 26, no. 12, pp. 10068–10075, 2010.
[76] M. Song and D. Cai, “Graphene Functionalization: A Review,” in Polymer- Graphene Nanocomposites, vol. 26, 2012, pp. 1–51.
[77] J. R. Potts, D. R. Dreyer, C. W. Bielawski, and R. S. Ruoff, “Graphene-based polymer nanocomposites,” Polymer (Guildf)., vol. 52, no. 1, pp. 5–25, 2011.
[78] R. Verdejo, M. M. Bernal, L. J. Romasanta, and M. A. Lopez-Manchado, “Graphene filled polymer nanocomposites,” Journal of Materials Chemistry, vol. 21, no. 10. p. 3301, 2011.
[79] T. Kuilla, S. Bhadra, D. Yao, N. H. Kim, S. Bose, and J. H. Lee, “Recent advances in graphene based polymer composites,” Progress in Polymer Science, vol. 35, no. 11. pp. 1350–1375, 2010.
[80] J. Wang, C. Xu, and H. Hu, “Synthesis, mechanical, and barrier properties of LDPE / graphene nanocomposites using vinyl triethoxysilane as a coupling agent,” J Nanopart Res, vol. 13, pp. 869–878, 2011.
[81] V. Loryuenyong, K. Totepvimarn, P. Eimburanapravat, W. Boonchompoo, and A. Buasri, “Preparation and characterization of reduced graphene oxide sheets via water-based exfoliation and reduction methods,” Adv. Mater. Sci. Eng., vol. 2013,.pp. 1-5, 2013
[82] C. Bao, Y. Guo, L. Song, Y. Kan, X. Qian, and Y. Hu, “In situ preparation of functionalized graphene oxide/epoxy nanocomposites with effective reinforcements,” Journal of Materials Chemistry, vol. 21, no. 35. p. 13290, 2011.
51
[83] T. Kuila, S. Bose, A. K. Mishra, P. Khanra, N. H. Kim, and J. H. Lee, “Chemical functionalization of graphene and its applications,” Progress in Materials Science, vol. 57, no. 7. pp. 1061–1105, 2012.
[84] C. Zhu, J. Zhai, D. Wen, and S. Dong, “Graphene oxide/polypyrrole nanocomposites: one-step electrochemical doping, coating and synergistic effect for energy storage,” Journal of Materials Chemistry, vol. 22, no. 13. p. 6300, 2012.
[85] A. Lerf, H. He, M. Forster, and J. Klinowski, “Structure of Graphite Oxide Revisited,” J. Phys. Chem. B, vol. 102, pp. 4477–4482, 1998.
[86] H. He, J. Klinowski, M. Forster, and A. Lerf, “A new structural model for graphite oxide,” Chem. Phys. Lett., vol. 287, pp. 53–56, 1998.
[87] S. William, J. Hummers, and E. O. Richard, “Preparation of Graphitic Oxide,” J. Am. Chem. Soc., vol. 80, p. 1339, 1958.
[88] D. R. Dreyer, S. Park, C. W. Bielawski, and R. S. Ruoff, “The chemistry of graphene oxide.,” Chem. Soc. Rev., vol. 39, no. 1, pp. 228–40, 2010.
[89] J. L. Vickery, A. J. Patil, and S. Mann, “Fabrication of graphene-polymer nanocomposites with higher-order three-dimensional architectures,” Adv. Mater., vol. 21, pp. 2180–2184, 2009.
[90] T. Ramanathan, A. A. Abdala, S. Stankovich, D. A. Dikin, M. Herrera-Alonso, R. D. Piner, D. H. Adamson, H. C. Schniepp, X. Chen, R. S. Ruoff, S. T. Nguyen, I. A. Aksay, R. K. Prud’Homme and L. C. Brinson, “Functionalized graphene sheets for polymer nanocomposites.,” Nat. Nanotechnol., vol. 3, no. 6, pp. 327–331, 2008.
[91] B. M. Yoo, H. J. Shin, H. W. Yoon and H. B. Park, “Graphene and graphene oxide and their uses in barrier polymers,” J. Appl. Polym. Sci., vol 131, 39628, 2014.
[92] K. Hu, D. D. Kulkarni, I. Choi, and V. V. Tsukruk, “Graphene-polymer nanocomposites for structural and functional applications,” Progress in Polymer Science, 2014.
[93] V. Mittal, “Functional polymer nanocomposites with graphene: A review,” Macromolecular Materials and Engineering, vol. 299, no. 8. Wiley-VCH Verlag, pp. 906–931, 2014.
[94] H.-D. Huang, P.-G. Ren, J. Chen, W.-Q. Zhang, X. Ji, and Z.-M. Li, “High barrier graphene oxide nanosheet/poly(vinyl alcohol) nanocomposite films,” J. Memb. Sci., vol. 409–410, no. 2012, pp. 156–163, Aug. 2012.
[95] O. C. Compton, S. Kim, C. Pierre, J. M. Torkelson, and S. T. Nguyen, “Crumpled graphene nanosheets as highly effective barrier property enhancers.,” Adv. Mater., vol. 22, no. 42, pp. 4759–63, Nov. 2010.
52
[96] J. Jin, R. Rafiq, Y. Q. Gill, and M. Song, “Preparation and characterization of high performance of graphene / nylon nanocomposites,” Eur. Polym. J., vol. 49, no. 9, pp. 2617–2626, 2013.
[97] I. Tseng, Y. Liao, J. Chiang, and M. Tsai, “Transparent polyimide / graphene oxide nanocomposite with improved moisture barrier property,” Mater. Chem. Phys., vol. 136, no. 1, pp. 247–253, 2012.
[98] H. M. Etmimi, P. E. Mallon, and R. D. Sanderson, “Polymer / graphite nanocomposites : Effect of reducing the functional groups of graphite oxide on water barrier properties,” Eur. Polym. J., vol. 49, no. 11, pp. 3460–3470, 2013.
[99] H. M. Kim and H. S. Lee, “Water and oxygen permeation through transparent ethylene vinyl alcohol/(graphene oxide) membranes,” Carbon Lett., vol. 15, no. 1, pp. 50–56, Jan. 2014.
[100] M. H. Tsai, C. J. Chang, H. H. Lu, Y. F. Liao, and I. H. Tseng, “Properties of magnetron-sputtered moisture barrier layer on transparent polyimide/graphene nanocomposite film,” Thin Solid Films, vol. 544, pp. 324–330, 2013.
[101] I. Tseng, M. Tsai, and C. Chung, “Flexible and Transparent Polyimide Films Containing Two- Dimensional Alumina Nanosheets Templated by Graphene Oxide for Improved Barrier Property,” ACS Appl. Mater. Interfaces, vol. 6, no. 15, pp. 13098–13105, 2014.
[102] C.-L. Lai, Y.-J. Fu, J.-T. Chen, D.-M. Wang, Y.-M. Sun, S.-H. Huang, W.-S. Hung, C.-C. Hu, and K.-R. Lee, “Composite of cyclic olefin copolymer with low graphene content for transparent water-vapor-barrier films,” Carbon N. Y., vol. 90, pp. 85–93, 2015.
[103] C. H. Chang, T. C. Huang, C. W. Peng, T. C. Yeh, H. I. Lu, W. I. Hung, C. J. Weng, T. I. Yang, and J. M. Yeh, “Novel anticorrosion coatings prepared from polyaniline/graphene composites,” Carbon N. Y., vol. 50, no. 14, pp. 5044–5051, 2012.
[104] N. Yousefi, M. M. Gudarzi, Q. Zheng, X. Lin, X. Shen, J. Jia, F. Sharif, and J. K. Kim, “Highly aligned, ultralarge-size reduced graphene oxide/polyurethane nanocomposites: Mechanical properties and moisture permeability,” Compos. Part A Appl. Sci. Manuf., vol. 49, pp. 42–50, 2013.
[105] H. Kwon, D. Kim, J. Seo, and H. Han, “Enhanced moisture barrier films based on EVOH/exfoliated graphite (EGn) nanocomposite films by solution blending,” Macromol. Res., vol. 21, no. 9, pp. 987–994, 2013.
[106] V. Loryuenyong, C. Saewong, C. Aranchaiya, and A. Buasri, “The Improvement in Mechanical and Barrier Properties of Poly(Vinyl Alcohol)/Graphene Oxide Packaging Films,” Packag. Technol. Sci., 2015.
53
[107] B. S. Bouakaz, I. Pillin, A. Habi, and Y. Grohens, “Synergy between fillers in organomontmorillonite/graphene–PLA nanocomposites,” Appl. Clay Sci., vol. 116–117, pp. 69–77, 2015.
[108] R. Kabiri and H. Namazi, “Nanocrystalline cellulose acetate (NCCA)/graphene oxide (GO) nanocomposites with enhanced mechanical properties and barrier against water vapor,” Cellulose, vol. 21, no. 5, pp. 3527–3539, 2014.
[109] T. Ma, P. R. Chang, P. Zheng, and X. Ma, “The composites based on plasticized starch and graphene oxide/reduced graphene oxide,” Carbohydr. Polym., vol. 94, no. 1, pp. 63–70, 2013.
[110] R. Xu, E. Manias, A. J. Snyder, and J. Runt, “Low permeability biomedical polyurethane nanocomposites,” J. Biomed. Mater. Res. A, vol. 64, no. 1, pp. 114–119, 2003.
[111] D. Adame and G. W. Beall, “Direct measurement of the constrained polmer region in polyamide/clay nanocomposites and the implications for gas diffusion,” Applied Clay Science, vol. 42, pp 545 – 552, 2009.
[112] H. M. Kim, J. K. Lee and H. S. Lee, ‘Transparent and high gas barrier films based on poly(vinyl alcohol)/ graphene oxide composites,” Thin Solid Films, vol 519, pp 7766 – 7771, 2011.
[113] J. Yoon, H. Jung, M. Kim, and E. Park, “Diffusion Coefficient and Equilibrium Solubility of Water Molecules in Biodegradable Polymers,” J. Appl. Polym. Sci. vol. 77, no. 2, pp. 1716–1722, 2000.
[114] A. D. Drozdov, J. Christiansen, R. K. Gupta and A. P. Shah, “Model for Anomalous Moisture Diffusion through a Polymer – Clay Nanocomposite,” J. Polym. Sci.: Part B: Polymer Physics, Vol. 41, pp. 476 – 492, 2003.
[115] R. B. Long, “Liquid Permeation Through Plastic Films,” Ind. Eng. Chem. Fundamen, vol. 4, no. 4, pp. 445–451, 1965.
[116] F. Rafieian, M. Shahedi, J. Keramat, and J. Simonsen, “Mechanical, thermal and barrier properties of nano-biocomposite based on gluten and carboxylated cellulose nanocrystals,” Ind. Crops Prod., vol. 53, no. 2014, pp. 282–288, Feb. 2014.
[117] M. M. Rahman, H. Kim, and W. Lee, “Preparation and Characterization of Waterborne Polyurethane / Clay Nanocomposite : Effect on Water Vapor Permeability.” Journal of Applied Polymer Science, vol. 110, pp. 3697-3705, 2008
[118] J. Yang, L. Bai, G. Feng, X. Yang, M. Lv, C. Zhang, H. Hu, and X. Wang, “Thermal Reduced Graphene Based Poly ( ethylene vinyl alcohol ) Nanocomposites : Enhanced Mechanical Properties , Gas Barrier , Water Resistance , and Thermal Stability,” Ind. Eng. Chem. Res., vol. 52, no. 47, pp 16745–16754, 2013.
54
[119] F. Guo, G. Silverberg, S. Bowers, S. Kim, D. Datta, V. Shenoy, and R. H. Hurt, “Graphene-Based Environmental Barriers,” Environ. Sci. Technol., vol. 46, no. 14, pp. 7717–7724, 2012.
[120] Y. Su, V. G. Kravets, S. L. Wong, J. Waters, A. K. Geim, and R. R. Nair, “Impermeable barrier films and protective coatings based on reduced graphene oxide,” Nat. Commun., vol. 5, p. 4843, 2014.
[121] H. Kim, Y. Miura, and C. W. Macosko, “Graphene/Polyurethane Nanocomposites for Improved Gas Barrier and Electrical Conductivity,” Chem. Mater., vol. 22, no. 11, pp. 3441–3450, Jun. 2010.
[122] H. M. Kim, J. K. Lee, and H. S. Lee, “Transparent and high gas barrier films based on poly(vinyl alcohol)/graphene oxide composites,” Thin Solid Films, vol. 519, no. 22, pp. 7766–7771, 2011.