Embed Size (px)
Citation preview

A REVIEW OF RURAL SPEED LIMITS
IN AUSTRALIA
J.E. COWLEY
Report prepared under contract
to the Office or Road Safety
Commonwealth Department of Transport
January 1980

2rforning Organisation (Name and Address1
J.E. CGWLEY & ASSOCIATES 55 CAMFBELL STREET
VICTORIA, AUSTRALIA, 3150 GLEN WAVERIEY
qwords
Traffic speed; accident stacistics/accident rates; rural; speed 1iri.e; traffic safecy.
bStraCt
The National goad Traffic. Code. is .being.-reviewed by the Advisory Committee on Road Cser Performance and Trqffic Codes (ACRUFTC) , a d during 1978/79 an assessment of speed limit provisions in tie Code was undertaken. The present study was originally performed to contribuce to the ACRUPTC review, but ir; has been subsequently updated to include the cnanges which were. made in late 1379 to the Code provisi0r.s and to State and Territory practice. The study has concentrated upon rural speed limits, as the main differences between Code 2ravisions and Australian practice are in this area. The s27~dy therefore examines local and overseas information on rural free speeds and speed limits in relation to road-traffic safety; this inclxdes recenc Australian speed data obtained from the national survey carrieZ out in 1978/7? mder tne co-ordination of ACRWTC: The report recommends options for absolute and differential SFeed limits for Axstraiian rural roads.

(ii)
ACKNOWLEDGEMENTS
The project required information on vehicle speees,
speed limits and accidents from all States and Territories;
the cooperation and assistance of officers from these Traffic
Authorities, the Australian Bureau of Statistics and the Office
of Road Safety is gratefully acknowledged.
Special acknowledgements are due to J!essrs. W. Callaghan
and G.M.L. Quayle of the Office of Road Safety, for their advice
and assistance throughout the course of the project.

&BBREVIATIONS
ABS
ACRUPTC
ACT
ADR
ARRB
ATAC
DOT
ECE
FMVSS
HCV
HS, LS
MV
NHTSA
NSW
NT
0 RS
PF
QLD
RoSTA
SA
SAA
sv, Mv TARU
Australian Bureau of Statistics.
Advisory Committee on Road User Performance
and Traffic Codes.
Australian Capital Territory.
Australian Design Rules for Motor Vehicle Safety.
Australian Road Research Board.
Australian Transport Advisory Council.
Department of Tramport.
Economic Commission for Europe (vehicle
safety standards).
Federal Motor Vehicle Safety Standards (USA).
Heavy Commercial Vehicle.
Hiqh Speed, Low SpeeS (regions cf a State) .
HS reqion is the region to which a rural speed
limit applies; LS is the complement of the HS
regian.
Motor Vehicle (occupants) - used only in Appendix. National Highway Traffic Safety Administration (USA) I
New South Wales.
Northern Territory.
Off ice of Road Safety (Dept. of Transport) - Prima facie (speed limit) .
Queensland.
Road Safety and Traffic Autkority (Victoria).
South Australia.
Standards Association of Australia.
Single Vehicle, Nuiti-Vehicle (acci-ents) .
Traffic Accident Research Zait (NSW).

TAS - Tasmznia
USA - United States of Anerica
VIC - Victoria
WA - Western Australia

(V)
CONVERSION FACTORS
INPERIAL AND HETRIC SPEEDS
M P H TO KM/H (1.61)
MPH 35 40 45
KM/H 56 64 72
KM/H TO M P H (0.621)
KM/H 50 60 70
MPH 31 31 43
50 55 60 65 70
80 89 97 105 113
80 90 100 110 120
50 56 62 68 75
NORMAL DISTRIBUTION PARAMETERS
DISPERSION TO PERCENTILES
SD ABOVE MEAN 0.5 1.0 1.5 2.0
PERCENTILE 69 84 93 98
PERCENTILES TO DISPERSION
PERCENTILE 80 85 90 95
SD ABOVE MEAN 0.84 1.04 1.28 1.64

(vi)
CONTENTS
ACXNOWLEDGEMEXTS
ABBREVIATIONS
CONVERSION FACTORS
CONTENTS
INTRODUCTION
STUDY AIMS, METHODS AND INFORMATION SOURCES AIMS AND METHODS INFOZ4ATION SOURCES
SPEED LIMIT PROVISIONS IN THE CODE 1972-74 REVIEW 1977-79 REVIEW
SPEED LIMIT PRACTICE IN AUSTRALIA EXISTING SPEED LIMITS RATIONALE BEHIND EXISTING SPEED LIMITS RUFLriL FREE SPEED INFORNATION ACCIi?E?JT/CASUALT'I INFORK%TIOX GENEFLriL ISSUES
GENERAL TRAFFIC SPEED LIMITS IN RURAL AREAS OBJECTIVES AND CRITERIA FOR SPEED LIMITS
THE VICTORIAN 60 MPH/100 KM/H SPEED LIMIT SPEED LIMITS AND ROAD-TRAFFIC SAFETY
THE USA 55 MPH SPEED LIMIT AUSTRALIAN FREE SPEEDS AUSTRALIAN FATALITY RATES A GENERAL TRAFFIC SPEED LINIT FOR AUSTRALIA
DIFFERENTIAL SPEED LIMITS IN XURAL AREAS HEAVY TRUCKS OMNIBUSES VEHICLES TOWING CARAVANS/TPAILERS MOTORCYCLES WITH PASSENGERS NIGHT-TIME SUMMARY
SUMMARY AND RECOlYMENDATIONS
REFERENCES
APPENDIX - FATALITIES BY S>EED PEGIONS
15 14
16
25
26 26 31 34
38 37
41
50 50 56 56 61 62 65
68
71
76

(vii)
LIST OF TABLES
7 - Australian Spend Liinits (!<a,/iI)
I1 Australian Speed Limits (km/h) outside built-up areas - January 1080 in built-up areas - January 1980
111 Vehicle Definitions in Tables 1-11
in Australia (ACRUPTC 1978 Survey) IV Summary of Car and Truck Rural Free Speeds
A1 - A4 Fatality Tables for NSW, Victoria, Queensland and NSW
8
LIST OF FIGURES
PAGE 17 -
18 19
20
78-80
Rural Free Speeds of Cars and Trucks 21
Rural Free Speed Trends of Cars in South Australia, 22 (ACRUPTC 78/79 Survey)
Rural Free Speed Trends of Cars in Victoria, 23
Road Traffic Fatality Rates per 10,000 Motor 1972-79
24 vehicles registered. Vehicles, Persons Injured, Property Damage 47 Involvement Rates - From Solomon (1964) VehicXe Involvement Rates by Accident Type - 48
1967-79
From Solomon (1964) Fatalities and Rural Free Speeds, in Victoria, 49
Victorian Casualty Accident Data for 1969-76 1969-79
for Cars, Rigid Trucks and Semi-Trailers 67
A1 W Occupant Fatalities by Speed Regions a1

1.
INTRODUCTION
>"isirs.iia is a ?az,-2 I "" -,.L~vent divided izto six States . .
and two Territories, with separate Parliaments, Judiciaries and
State and Local Government administrations and procedures. As
a result, road traffic laws and regulations have tended to
differ throughout the country. In particular, Australian rural
speed limits - the subject of this report - are not uniform between various States and Territories.
Guidance on uniform road traffic laws for Australia is
provided by the National Road Traffic Code. The Code was
endorsed in 1962 by the Australian Transport Advisory Council
(ATAC), which is a Council of Ministers with responsibility for
transport and is the forum for discussing transport policies at
the national level. The Code's provisions are under constant
review by the Advisory Committee on Road User Perfcrmance and
Traffic Codes(ACRUPTC), which is responsible to ATAC.
ACRUPTC has recently undertaken a comprehensive review of
the Code and during 1977-79 an important aspect of this review
concerned speed limit provisions. The present study was
originally performed for the Office of Road Safety (ORS) to
contribute to the ACRUPTC review, and a draft report was tabled
at the 23rd ACRUPTC meeting in April 1979; it has now been
updated to January 1980, to take account of changes made in
late 1979 to the Code provisions and to State and Territory
practice.
The st;dy has concentrated upon rural speed iimits, as the
main differences between Code prsvisions and Australian practice

L.
are in this area. Emphasis has been place2 upon the safety
aspects of rural ss2ed limits, so thzt zrmsportation cost
aspects have not been considered in any aetail.
This report therefore examines past and present rural
speed limit provisions in the Code, in relation to the different
speed limits in force on Australian rural roads and to the
findings from local and overseas studies of the safety benefits
of rural speed limits. The report finally recommends options
for new absolute and differential speed limits for Australian
rural roads.

3
STUDY AIXS, METHODS AND 117FOXMATION SOURCES
The overall objective of the study was to review and assess
existing Australian rural speed linits and the National Road
Traffic Code's recommended limits, in relation to local and
overseas information on accidents, speeds and speed limits, to
assist the ACRUPTC review of the Code.
The specific aims of the Study were:-
(1) To summarise and review present Code requirements on
absolute and differential speed limits in rural areas and
their underlying rationale. (This required examination of
ACRU1TC dccuments, and correspondence and discussion with
ACRUPTC representatives.)
(2) To summarise and review existing State and Territory
legislation and practice on absolute and differential speed
limits in rural areas an2 cheir underlying rationale.
(This required examination of existing legislation and
practice using questionnaire and interview methods.)
(3) To evaluare Australian literature and data on vehicle
speeds and speed limits in rilral areas in relation to road-
traffic safety. (This required evalLation of published
lirerature and accisent and speed data made available by
Australian Traffic Authorities. 1
(4) To evaluate overseas literature on vehicle speeds a;?d
speed limits in rural areas in relation to road-traffic
safety.

4.
INFORMATION SOURCES
The major sourcss of infcrmation for =his study, required
for the four specific aims given above, c2.n be summarise6 as
follows : - (1) ACRUPTC meeting records.
(2) State/Territory legislation and practice,
(obtained in replies to questionnaires).
(3) (a) Australian (mainly Victorian) literature on
road safety benefits and effectiveness of
rural speed limits.
(b) Free speed data from a Rural Speed Survey
in late 1978 organised by ACRUPTC through
the ORS.
(c) Special fatality data tables supplied by
Aufhorities in Few South Wales, Victoria,
Queensland and South Australia.
(4) Overseas literature on road safety benefits and
effectiveness of speed limits in rural areas.

No person shall drive a vehicle - (a) in a built-up area at a speed exceeding 60
kilometres per hour, except within a speed zone in which a higher speed is permitted under paragraph (b) of this sub-regulation;
(b) in a speed zone, whether iiithir. a built-up area or r,ot, a? 3 S S Z ~ , ~ e>:cee."rq saeed in kilometres per hour indicated by nurrerals on the restriction sign at tk.e beginning of the speed zone; or
.
(c) elsewhere at a speed exceeding 110 kilometres per hour.
Notwithstan6ing the foregoing provisions, no person shall - (a) drive a qoods vehicle the weight of which together
with any tzailer attached inclueing the total load
at a speed exceeding 80 kilometres per hocr; carried (if any) exceeds four and one half tonnes
(b) drive at a speed exceedinc; 80 kilometres per hour
attached if the weight of the trailer or other any vehicle to which a trailer or other vehicle is
vehicle including any load exceeds 750 kilograms; or
(c) drive any vehicle licensed for the carriage of nine or more passencers at a speed exceeding 90 kilometres per hour.
The foregoing provisions of this Requlation shall not apply to the driver of an emergency vehicle.
Nothing in this Regulation snall be construed to
which - ~ustify the driver of a vehicle 2rivinq at a speea
(a) may constituze dri::ing ,zarelessly, rec:ulessly or at a speed or in a nanner whizh is dangerous to tne p.alic having regars to all the circumsrances; or
(b) excee2s any maximm speed applicable to the vehicle and fixed 51; or under any Act or Regulatior..
In this kqulation 'qooes :?ehicle' reans any vehicle other than a vehicle designed ane 2r:inaril:i csed primarily for the carriage of passengers.'

6.
The Code~does not contain reconmended speed limits for
probatlonary/provisional licensed drivers/riders, learilrr
driversjriders, night-time driving, weekena/recreational traffic
or adverse environmental conditions.
Two detailed reviews of the speed limit provisions in the
, Code were carried out in the 1970's. The first review took place
during 1972-74 and took account of the Australian change from
imperial to metric units, which was implemented in mid-1974. The
second review took place during 1977-79, as mentioned in the
Introduction. The two reviews are discussec? in more detail below,
but Code speed limit provisions during the 1970's for general
! traffic can be summarised as follows:-
Pre 1972-74 Pre 1977-79 Region Review Review Current
(1) Built-up area 35 mph (56 km/h) 60 kmjh 60 km/h
(2) Speed Zone Signed speed Signed speed Signed speed
(3) Elsewhere 60 mph (97 km/h) 110 km/h 110 km/h
Similarly, differential limits for certain vehicle classes can be
summarised as follows:
Pre 1972-74 Pre 1977-79 Vehicle Review Review Current
(4) Heavy Trucks 40 mph (64 km/h) 80 km/h 80 km/h
in 1969) (An additional limit of 30 mph in built-up areas was abolished
(5) Omnibuses 50 mph (80 km/h) 90 km/h 90 km/h
(6) Heavy Trailers 45 mph (72 km/h) 80 km/h) 80 km/h
(7) Hotor Cycles with Pillion/Other Passengers
40 mpn (64 km/h) 70 kmjh 110 km/h [ i .e. general speed limit)

7.
1972-74 REVIEW
Ths ACRUPTC sub-comnittse ?;hich Endertook t:"s 1972-7-1 review
was fornee at the 5th ACRlSTC meeting (May 1972) and first
reported to the 8th ACRUPTC meeting, (December 1972). At that
meeting ACRUPTC endorsed the sub-committee recommendation for a
100 km/h general traffic limit outside built-up areas, which was
the agreed conversion of the pre-metric limit of 60 mph. However,
the 5th ACRUPTC meeting (June 1973) recommen6ed this be changed to
l10 or 120 km/h, (mainly on the basis of Tiictorian information),
and the former value was selected b:! ATAC at its July 1573 meeting.
It is apparent, therefore, that there was s0r.e variation of
opinion on the most suitable rural speed limit for general traffic.
A variation of opinion also existed regarding differential
speed limits fcr heavy trucks and fcr vehicles towing heavy
%railers; KCRU?TC recommenLed liaits of 90 h / h for both vehicle
classes, but ATAC in October 1973 altered these to 80 km/h.
The ACRUPTC recommended speed limit of 90 km/h for omnibuses
was endorsed by ATAC.
With regard to speed limits for motorcyclists, ACRUPTC
recommended 70 km/h for motorcycles carrying ?illion passengers and
for learner riders, and the former recommendation was endorsed by
ATAC in October 1973. It should be noted that at two subsequent
meetings of ACRUPTC - the 15th in >fay 1575 ar.d 20th in October
1977 - the Committee recorrmended removal of the 70 km/h differential limit on notor cycles carrying pillion passengers,
but these recommendstions were Rot en2orseS by ATAC.

8.
At its 8th meeting in December 1972, ACRUPTC expressed
support for absolute speed linits rather than prima facie sseed
limits. The 8th ACRUPTC meeting also expressed support for speed
zoning both above and below the general traffic speed limits.
This can be compared with, for example, the United States Uniform
Vehicle Code, National Committee on Uniform Traffic Laws and
Ordinance (19681, which proposed urban and rural general limits
(for daytime) of 30 and 60 mph respectively and supported speed
zoning within, but not outside, these limits.
1977-79 REVIEW
The second major review of speed limit provisions in the Code
began at the 19th ACRUPTC meeting in 1977, when Committee members
drew attention to the lack of Australian data on vehicle speeds and
effectiveness of speed limits. At the 20th ACRUPTC meeting (October
1977), it was agreed that vehicle free speeds on rural roads should
be measured by all Traffic Authorities and the ORS undertook to
coordinate such a survey. This free speed survey was carried out
in late 1978/early 1979, drawing on the experience gained in the
1978 Victorian Heavy Commercial Vehicle Operational Safety Study,
Thompson T.W. (1978), and the results are documented in Office cf
Road Safety (1979). This ORS report, together with an earlier
version of the present (consultant) report, forme2 the main inputs
to the ACRUPTC review and were discussed at the 23rd meeting in
April 1979.
At the 23rd ACRUPTC meeting, the Committee recommended two
changes to the then existing Code provisions:-
(a) a decrease in the rural general traffic limit from 110
to 100 km/h, and

9
(b) removal of the 70 km/h differentizl limit for motorcycles
carrying passengers.
At its meeting in July 1979, ATAC endorsed only t.he latt.er
recommendation, so that current Code speed limits (as summarised
earlier in this Section) are little different from those existing
prior to the 1977-79 review.
At ?.he 23rd ACF.UPTC meeting, the Committee again supported
the principle of speed zoning, above and below the 2roposed general
limits, as in the earlier ACRUPTC review of speed limits.

STEED LIMIT PrWCTICE IN AUST'RALIA
Information relating ti~ currezt speed limit przctice in
the six States and two Territories was obtained from questionnaires
sent out to Traffic Authorities in late 1978 and completed at
subsequent discussions with officers of these Authorities in
early 1979.
The main points covered by these questionnaires were as
follows: - (a) existing speed limits - absolute and differential
limits, speed zoning, signing standards, major changes
in speed limits and their application during the last
ten years,
(b) rationale behind these speed limits - methods and warrants used to set speed zones, specific studies
carried out to support current limits or analyse
effectiveness of limits, current and future policy an?
strategy on speed limits,
(c) free speec infornation, for effectiveness studies of
speed limits,
(d) accident/casualty information, for effectiveness studies
of speed limits,
(e) general issues - opinion and information on:- (i) special limits for niynt-time, etc.,
(ii) effectiveness of enforcement, education and
publicity, and
(iii) accident exposure, vehicle occupancy, etc.
The main findings from this questionnaire - interview survey are

11 .
given below under these five main headings, and have been
updated, ,&herever possibl?, to January 1980.
EXISTING SPEED LIMITS
Current speed limits in Australia are summarised in Tables
I and 11, for rural and urban conditions respectively. The
tables show general limits, differential limits and speed zoning
employed in the States and Territories; equivalent figures from
the current Code are given for comparison.
General rural limits in the six States are absolute limits
of either 100 km/h, in New South Wales, Victoria and Queensland,
or 110 km/h in South Australia, Western Australia and Tasmania,
compared with the Coae figure of 110 km/h. The current 100 h/h
limit in New South Wales (MSW) was introduced in July 1979; at the
time of the review in early 1979, NSW had an 80 km/h prima facie
limit, although many NSW highways (mainly east of the Dividing
Range) were speed zoned at 100 km/h.
The Northern Territory (NT) and the Australian Capital
Territory (ACT) do not have general rural limits. However it
should be noted that the ACT employs 100 km/h speed zoning on all
major rural roads, which is compatible with the speed limit on
adjacent NSW roads.
Table I also summarises rural speed signing and it can be
seen that many States employ the derestriction sign. However,
Queensland employs numerical signing of 100 km/h, and Western
Australia (WA) and South Australia (SA) employ both derestriction
and numerical signs (where the sign on exit from a built-up area

1:.
is governed by highway alignment and standard). NSW now has
both types of sign following the July 1979 chanqeover ro an
absolute limit.
Differential speed limits vary amongst the States and
Territories, ranging from seven types in Victoria to none in
Queensland. The Code contains three recommended differential
limits, for heavy trucks, omnibuses and heavy trailers.
Speed zoning is not er-ployed to any great extent at present
on rural roads.
RATIONALE BEHIND EXISTING SPEED LIMITS
In the discussions with Traffic Authorities during early
1979 very little doc-umented information ivas obtained relating
specifically to optimisation or effectiveness of the current
general speed limits employed throughout Australia. The only
report available on effectiveness of rural general limits is a
Victorian study of the current 100 km/h limit, Cowley (1977).
This was done for the Road Safety and Traffic Authority (RoSTA)
to examine the effectiveness of the speed limit change from 70
mph to 60 mph/100 km/h, implemented in late 1973. The findings
from this study are referred to in the next Section on general speed
limits. A considerable amount of Australian information is,
however, available relatinc to rural 2ifferential limits for truc:us
and for vehicles towilg caravans/trailers, as outlinec below.
The important subject of differential limits for trucks has
been examined recently in the l978 XoSTA Heavy Commercial Vehicle
(HCV) Operational Safety Study, where emphasis was placed upon

13.
rural speed limits in Victoria. This study is documented in tWO
main reports, RcST.4 (1978! and Thcmpson J.E. i1978), supplemented
by three reports on accidsnts, brakmg and speeds, Cowley (19781,
MacKay (1978) and Thompson T.W. (1978), and three other task
reports, Bishop (19781, Pearson (1978) and Wood (1978). Truck
sped limits have also been examined in two Traffic Accident
Research Unit (TARU) reports from NSW, Croft (1972) and Messiter
(1971). These findings are referred to in the next two Sections
on general and differential speed limits.
; ,
Rural differential limits for vehicles towing caravans and
trailers have been examined for Queensland and NSW, Boughton (1979)
and Vaughan (1974). These findings are referred , to in the later
Section on differential speed limits.
Road and Traffic Authorities in Australia employ very similar
methods and warrants for selection of speed zones on given roads
or highways, which are based upon:-
(a) a high percentile (generally the 85th percentile) of
the free speed distribution on the road,
(b) land use and development alongside the road, and
(c) accident history for the road,
and it is understood that most decisions employ a balanced
engineering judgement using mainly (a) and (b).
During the 1970's the main changes in policy and application
of rural speed limits in Australia have been the replacement of
prima facie limits by absolute limits in Victoria in 1971, SA in
1974 and NSW in 1979.

14
RURAL FREE SPEED 1NFOE.IATION
Most States have carries out recent (late lji78/early 1979)
rural free speed surveys - originated by ACRUPTC through the ORS - and the results are presented in the report to ACRUPTC, Office
of Road Safety (1979). Results from tne survey are summarised
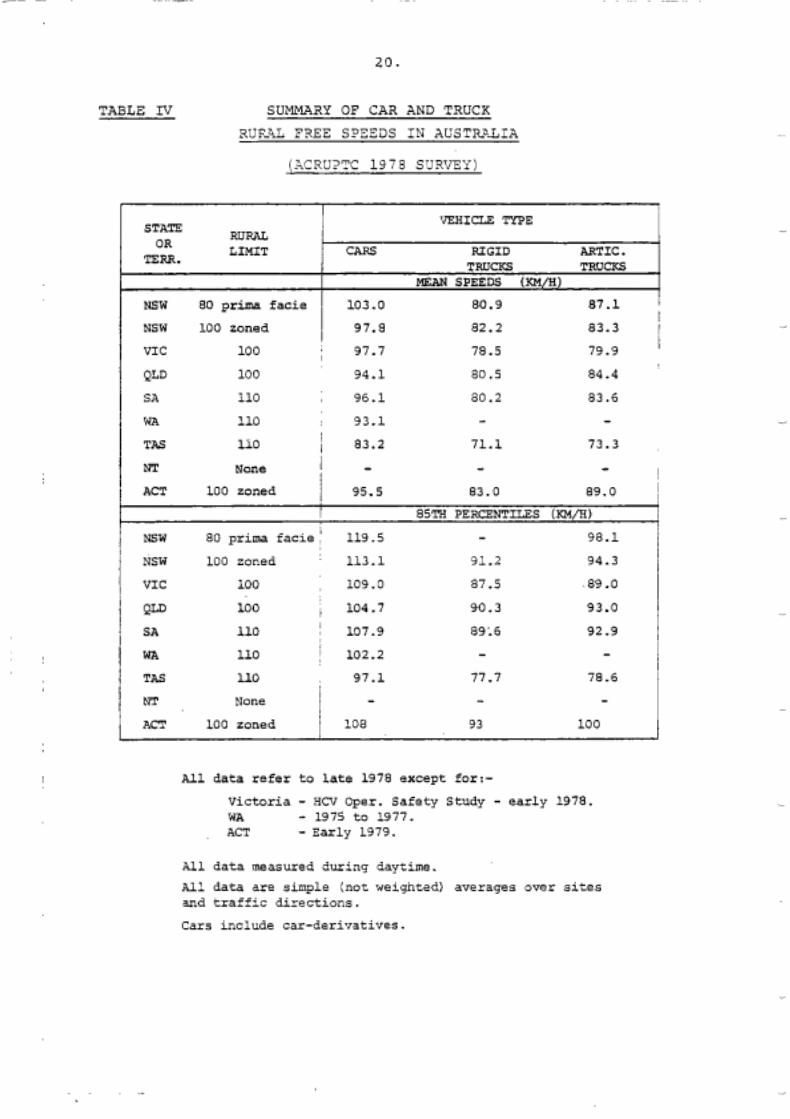
for the three main vehicle classes - cars and car derivatives, rigid trucks and articulated trucks - in Table IV; other vehicle classes are included in the ORS report. The NSW data are shown
separately for the prima facie (PF) and zoned limits which were
in force at tn? time of the survey.
This free speed information is valuable, as it permits a
direct comparison to be made across the States of rural free
speeds in the presence of different rural speed limits. From
Table IV it can be seen that rigid and articulated truck speeds
are similar, so they have been aggregated in Fig. 1, which c@mpares
car and truck mean and 85th percentile free speeds, including
the within-State ranges of these parameters, across Australia.
A broad interpretation of Fig. 1 is that speed limits in
rural regions of mainland Australia have little effect on actual
free speeds. Free speeds in Tasmania are substantially lower than
those on the mainland.
At present three States measuze rural free speeds on an
annual basis - South Australia (SA) has been qathering such information since the mid 1960's, Victoria since 1972 and Tasmania
since 1976. The SA ar.d Victorian data are "iscussed below.

15.
The SA data (which refer to cars and car derivatives,
measured at the sane 33 rural hiqhway sites every year) are
summarised for 1967-79 in Fig.2. It should be noted that the
ACRUPTC speed data for late 1978, given in Table IV and Fig.1,
are not included in the speed trend data graphed in Fig.2, as
the ACRUPTC survey sites were different from those used in the
SA annual surveys.
The Victorian data (which refer to cars and car derivatives,
measured at the same 11 rural highway sites every year) are
summarised for 1972-79 in Fig.3 and show the effect of the
introduction of the 60 mph (97 km/h) speed limit in December
1473, converted to 100 !m/h in mid 1974. Again, it should be
noted that the ACRUPTC speed data for early 1978, given in Table
IV and Fig.1, are not included in the speed trend data graphed
in Fig.3, as the ACRUPTC survey sites were different.
ACCIDENT/CASUALTY INFORMATION
As discussed with the Traffic Authorities, it is important
to attempt a comparative analysis of accident/casualty rates between
States, to see whether different rural speed limits are associated
with different accident rates. Road traffic accident fatality
rates have therefore been examined in this study: injury rates have
not been included because of the differing reporting criteria in
use across Australia.
Fi9.4 shows overall fatality rates for the six Australian
States, computed from fatality and motor vehicle registration data
published by the Australian Bureau of Statistics iABS), for the
period 1965-79. It can be seen that Fig.4 only allows a broad

16.
comparison to be made between States, as no consistent urSan/rural
break-;crm $3 fatalities is phlishsd. For this rezscn four Skates - NSW, Victoria, Queensland and SA - have provided special fatality tables, divided into speed limit zones, and this permits a
comparative evaluation to be made between these States, by
consistent 'urban' and 'rural' regions. The results of this
analysis are given in the Appendix and discussed in the next
Section on general speed limits.
GENEWL ISSUES
In the discussion with Traffic Authorities, little or no
support was received for a differential limit for night-time
driving, although a later Section shows that there is some evidence
for considering such a limit. Arquments against a lower night-time
limit included improvements in rural road design, vehicle lighting
and the greater use of delineators and pavement linemarking in
recent years.
No State or Territory has been able to measure the
effectiveness of enforcement or publicity on speed limits.
However, it is of interest to note that some Police Departments
are working in conjunction with Traffic Authorities to concentrate
enforcement of speee limits at locations, or on routes, with high
accident rates.

L /
TABLE i AUSTRALIAN SPEED LiMITS (RM/H) CUTSIDE BUILT-UP ARZ'AS - JANUARY l92C
j MAT. , R.T.
1. C,E>ERAL LIMIT - Derestriction OK Numerical Signing General Traffic 101: 100 100 110 110 110 - Main type of Siqn j D,N
D N D.N D,N D - N -
2. DIFFEE3ENTIAL LIHIT - Not signet? Light Trucks
Heavy Trucks
Omnibuses ~ 90
Light Trailers
Heavy Trailers
Prov.Licence Holders
Learner Drivers/hiders - M/C & Pillion Pass. l- Buses L L. Trailers I - Buses L H. Trailers I - I
l
70
75
a0
90
100
) = Occasional use only.
* = Freeways on>?-. T = Legislation to remove this llrnir has been ~ K G ~ C S ~ .
NS:i & PLC also have some 60 speea zoning on some rural roads.

NAT .
CODE R.T. NSW VIC QLLI SA WA TAS NT ACT
1. GENERAL LIMIT - Signed at entry to B.U. Area
General Traffic 60 60 60 60 60 60 60 60 60
2. DIFFERENTIAL LIMIT - Not signed l
Lig’ht Trucks l - - - Heavy Trucks Omnibuses
- , - 50 -
Buses H. Trailers I - j - - - l - - - Buses &‘L. Trailers
- 1 - - - M/C & Pillion Pass.
- j - - - Learner Drivers/Riders - 1 - Prov.Licence Holders
- 8 - - Heavy Trailers
- - - Light Trailers
- - - - - - ! 1 I
! - - - - 40,50 i !
- , - 50 - - - - - - l l - - - - -
l -
- - - - - - 1 I l - - - - - - - i - - - - - i
I j j
- - - - - I
- - - - - - - - - - - !
l
( 1 = Occasional use only * = Freeways only
QLD also has occasional 40 speed zoning on some urban roads.
See Table I11 for vehicle definitions.

19.
TABLE 111 VEHICLZ DEFINITIONS IN TABLES 1-11
Three zateq-srigs c? "hsa~y' -vTP-:?icle" are givsn in Tables 1-11, namely, Heavy Trucks, Omnibuses and Heavy Trailers. Current (January 1980) definitions of these categories are given below. Light Trucks and Trailers are complementary to Heavy Trucks and Trailers.
HEAVY TRUCKS Code - exceeding 4.5 tonnes (all-up weight) . NSW, WA, Tasmania - agree with Code. Victoria - P-xceeding 3.0 tonnes. SA - exceeding 4.0 tcn~es. ACT - (l) exceeding 3.0 tonnes but not 7.0 tonnes,
(2) exceecing 7.0 tonnes but not 13.0 tonnes, (3) exceeding 13.0 tonnes.
Urban and Rural speed limits for the ACT ranges are respectively:- (1) 50 and 80, (2) 40 and 60 and (3) 40 and 50 km/h.
OMNIBUSES Code - 9 or more passengers. All States agree with the Code, (provided "passengers" includes the driver). In Victoria the differential limit applies to all licensed passenger carrying vehicles; a separate Victorian Omnibus definition is unrelated to speed limits.
HEAVY TRAILERS Code - exceeding 0.75 tonne. NSW, WA - agree with Code. Victoria - exceeding 1.0 tonne. In Tasmania, legislation to differentiate between light and heavy trailers has been proposed.
20.
TABLE IV
STATE OR mm.
VEHICLE TYPE RURAL LIMIT CARS RTGID
TRUCKS ARTIC. TRUCXS
I
NSW 80 prima facie I 103.0 80.9 87 .l ~
I
l 97.8 82.2 83.3 l 97.7 78.5 79.9 l 94.1 ao .5 a4.4
NSW 100 zoned VI c 100
QLD 100
sa 110
WA 110
TAS lio
NT None ACT 100 zoned
36.1 ao.2 83.6
33.1 - - 83.2 71.1 73.3 - ~ - 95.5 83.0 83.0
NSW 100 zoned 113.1 91.2 94.3
VIC 100
QD 100 SA l10
WA 110
TAS 110
NT None ACT 100 zoned
103.0 87.5 .83.0
104.7 30.3 93.0
107.9 89;6 92.9
102.2 - - 97.1 77.7 78.6 - - -
l08 93 100
All data refer to late 1978 except for:- Victoria - HCV Oper. Safety Study - early 1978. ACT WA - 1975 to 1977. - Early 1379.
All data measured during daytime. All data are simple (not weignted) averages over sites and traffic directions. Cars include car-derivatives.

21.
A
3
0
4
r
*
m
Ln
Y v 3 II: c
l

22.
FREE SPEEDS (KMHI) I
J 85th PERCENTILE
100 - MEAN -
- - JJ 110 KM&
90 - 0 1 I I I I I I I I I I I I I 1965 1970 1975 1980
INTRODUCTION OF ABSOLUTE SPEED LIMIT SHOWN BY ARROWS. ACRUPTC 1978 DATA (FIG 1 ) NOT INCLUDED ABOVE
FIG. 2 - RURAL FREE SPEED TXENDS OF CARS IN SOUTH AUSTRALIA, 1967 . 79

O J ' 1970' ' 1972' I 1974' 1976' ' 1978' ' 1980' Z
100,
0-1 l ' 1970' ' 1972' ' 1974' I 1976' ' 1978' ' 1980' INTRODUCT!ON OF ABSOLUTE SPEED LIMITS SHOWN BY ARROWS. ACRUPTC 1978 DATA (FIG 1 ) NOT INCLUDED A B O V E
FIG. 3 - RURAL FREE SPEED TRENDS OF CARS IN VICTORIA, 1972-79

U
0
t
U
E 5
Ln
W
-1 U = I + 3 0 I U Z Ln
0
m
I m c
m 0
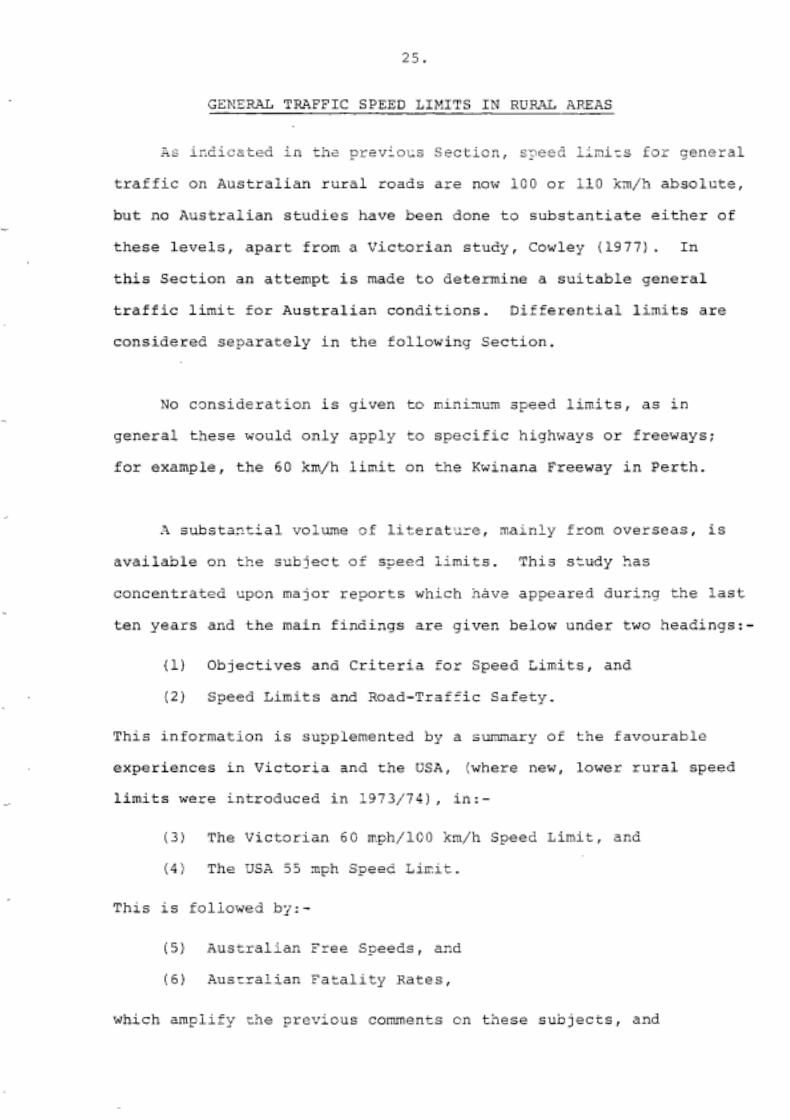
25.
GENERAL TRAFFIC SPEED LIMITS IN RURU, AREAS
As irdiza~ked in ths prevlccs Section, qeed iinirs for general
traffic on Australian rural roads are now 100 or 110 km/h absolute,
but no Australian studies have been done to substantiate either of
these levels, apart from a Victorian study, Cowley (1977). In
this Section an attempt is made to determine a suitable general
traffic limit for Australian conditions. Differential limits are
considered separately in the following Section.
No consideration is given tc minirnum speed limits, as in
general these would only apply to specific highways or freeways;
for example, the 60 km/h limit on the Xwinana Freeway in Perth.
A substaztial volume of literature, mainly from overseas, is
available on the subject of speec? iimits. This study has
concentrated upon major reports which nave appeared during the last
ten years and the main findings are given below under two headings:-
(1) Objectives and Criteria for Speed Limits, and
(2) Speed Limits and Road-Traffic Safety.
This information is supplemented by a summary of the favourable
experiences in Victoria and the USA, (where new, lower rural speed
limits were introduced in 1973/74), in:-
(3) The Victorian 60 mph/100 km/h Speed Limit, and
(4) The USA 55 rnph Speed Lipit.
This is followed by:-
(5) Australian Free Speeds, and
(6) Ausrralian Fatality Rates,
which amplify rhe previous comments cn these subjects, and

26.
discuss whether rural speed limits have an appreciable effect on
rural safety. Finally, in:-
(71 A General Traffic Speed Limit for Australia,
the advantages and disadvantages of various possible speed limits
are discussed.
OBJECTIVES AND CRITERIA FOR SPEED LIMITS
The literature shows that in the past the main objective of
speed limits has been to increase safety, by reducing the number
of excessively fast vehicles in the traffic stream and thereby
reducing the variance of speeds within the traffic stream. This
change in traffic speed distribution improves:-
(a) primary safety, as the risk of accident ,involvement
increases at speeds above the mean traffic speed, and
(b) secondary safety, as the severity of accidents increases
steadily with speed,
as shown in Solomon (1964) and some other reports, discussed later.
During the 1970's energy conservation became important, so
that a current objective of speed limits is to reduce highway fuel
consumption; indeed, the USA and New Zealand introduced new absolute
speed limits, of 55 and 50 mph respectively, in L973/74 mainly
for this reason.
In conflict with these objectives is the reduction in mobility
which results from reduced traffic speeds. This leads to:-
(a) increased journey times and, perhaps, costs, (particularly
for commercial traffic), and

27.
(b) a lack of respect by motorists fox speed limits which are
perceived to be unreasonably law, for the prevailing road
conditions.
For these reasons, there is now increasing emphasis on economic
studies in which the objective is to minimise overall transportation
cost - i.e. the sum of accident/casualty costs, vehicle operating costs and driver/occupant costs, Castle (1976), European Conference
of Ministers of Transport (1978) and Nilsson and Roosmark (1977) ~
There is little consensus of opinion on criteria for setting
speed limits. Before energy considerations became important,
speed limits were generally recommended to be set at or slightly
below the 85th percentile of vehicle free speeds, Joscelyn et a1
(1970) and Ministry of Transport (1968). The extensive study by
Josceiyn et a1 conclude2 that such a limit is:-
(a) fundamentally fair in the context of the Traffic Law
System,
(b) related to risk of dysfunction in the Surface Road
Transportation System,
(c) accepted as reasonable by drivers,
(d) applicable to a wide range of highways, and
(e) capable of implementaticn with existing resources.
However, energy considerations and moves to re2uce accident
severity have led to consideration of speed limits equivalent to
lower percentiles of the free speed distribution.
The optinal criterion for a nlral speed limit is probably chat
which results in traffic speeds which miniaise overall transpcrtaticn
cost. However, such a criterion would be difficult to apply, due to

28.
problems in calculating: - (a) cornpliar.ce with the speed limit, particularly in the
long term.
(b) fuel savings from lower speeds, and
(c) costs associated with time lost.
SPEED LIMITS AND ROAD-TRAFFIC SAFETY
The Department of Transport's 1973 national review of speed
control in relation to road safety examines this s?ubject, Cumming
and Croft (1973). Major findings from this review in relation to
rural speed limits are:-
(1) prima facie limits are unsuitable in comparison with
absolute limits, because they are not restrictive and
are virtually impossible to enforce,
(2) the imposition of an absolute limit, or the lowering of
an existing absolute limit, generally results in a
decrease in accident/casualty rate,
( 3 ) ~ the raising of an absolute limit generally results in an
increase in accident/casualty rate,
(4) there is a wide variation in the reported effectiveness
of (2) and (31, (particularly regarding rural limits),
and a lack of data on long term benefits,
(5) the purpose of a maximum speed limit is to reduce the
number of vehicles travelling at excessively high speeds,
(6) accident/casualty rates increase rapidly above 100 to
110 km/h, particularly at night-time,
(7) accident severity increases monotonically with speed, and

29.
(8) control/reduction of the variance of speeds in the
traffic stream. is very important.
The importance of the relationship between speeds of the
traffic stream and rural accident/casualty involvement rates was
demonstrated in Solomon (1964), which analysed a large amount of
USA travel-speed and accident-speed data for the late 1950's. The
main results of Solomon's work are summarised in Figs.5 and 6.
Some caution must be used in applying his findings to Australian
conditions, not only because they refer to daca which is 20 years
old, but also because the USA accident patterns differ in having
a large proportion of rear-end collisions and a small proportion
of single-vehicle accidents. (Note that accident-involvement rates
can be obtained fram the vehicle-involvement rates in Fig.6 by
approximately halving the rates shown).
Solomon's findings are supported in Research Triangle
Institute (1970) which analysed a smdler sample of travel-speed
and accident-speed data from Indiana in the late 1960's. Even
after accidents involving vehicle-turnin9 manoeuvres were excluded,
the authors obtained a U-shaped curve of vehicle involvement rate,
although the relationship was weaker than Solomon's.
These U-shaped accident involvement rate curves are also
supported by some Yheoretical work in Hauer (1971), which relates
accident involvement rate to overtaking rate and concludes that on
highways with both lower as well as upper speed limits, the lower
limit could be more effective.
Solomon's results are also confirmed to some degree in Newby
(1970) which quotes figures for USA toll roads:-

30.
Speed limit (mph) 60 65 70 a0
Accident irate 95 117 113 152
Fatality rate 1.7 2.2 2.7 7.1
where rates refer to 100 million vehicle miles. The sharp
increase in rates for speed limits above 70 mph is noticeable.
Joksch and Wuerdemann (1973) states that there is strong
evidence from a number of studies that the relative speed of a
vehicle to the average speed of traffic, rather than its absolute
speed, is related to accident involvement. Thus Solomon's
findings of the late 1950's could still be applicable today. If
this is correct, then Figs.5 and 6 show that involvement rates of
vehicles and persons injured during daylight hours remain fairly
constant between 90 and 110 km/h (56 and 68 mph); however night-
time rates rise sharply above 90 to 100 km/h (56 to 62 rnph) .
These points are important to the consideration of an absolute
speed limit, and a differential speed limit for night-time.
As mentioned earlier, Joscelyn et a1 (1970) recommends setting
a speed limit at the 85th percentile of the free speed distribution.
Unfortunately, there appears to be no logical method for choosing
between, say, ?%h, 85th and 95th percentiles, although Joscelyn
et a1 argue against choosing percentiles higher than the 85th because
of the rapid increase in vehicle/casualty involvement rate above
this level, and the problem of enforcement when allowance is made
for enforcement tolerances.
It is not clear from the literature whetr?r zn5rcenent c:
speed limits is effective or not, nor whether this facror can Se
separated from the publicity factor associated with the introduction

of a new speed limit. For example, Council (1970) showed that
static (or noving) police cars in a traffic strear. affect vehicle
speecs; Reinfurt et a1 (1973) found a similar effect with police
operated radar. Both studies cast doubt on long terzn effects and
the latter report emphasised the importance of media publicity.
A novel method for choosing a speed limit was put forward by
Vaughan (1970) which proposed, inter alia, that 'the chances of
booking a safe driver for speeding must be the same as the chances
of an unsafe driver travelling slower than tne speed limit'. A
brief check of this hypothesis using data from Solomon (1964)
yields a speed limit value close to or below the mean free speed.
Rural free speed distributions tena to Se Normal or have
slight positive skewness. A nunber of adthors have examines the
shapes of speed distributions, and this work is summarised ir. an
internal TARU report, Croft (1972). There is evidence that the
accident rate on a given road is related to the skewness of the
speed distribution. Further, the imposition of an absolute speed
limit is usually associated with a reduction in the number of
excessively fast vehicles, thereby reducing the degree of skewness.
THE VICTORIAN 60 MPH/100 KX/H SPEED LIMIT
Until 1971, Victoria had a prima facie rural speed limit of
50 mph (80 h/h) and this was changed in Decerrber 1971 to a
70 mph (113 km/h) absolute speed linit on a trial basis. In
December 1973 the lirnit was reduced to 60 mph (97 krn/h) and
converted in mid l974 to 100 km/h.
The first change - from prima facie to absolure - was mace

32.
after an extensive study reported in Victorian. Parliamentary
joint Se!.ect Cormittee on Road Safety (1371) . The report reconrr.ended
an absolute daytime speed limit of 70 mph (113 km/h) and a
differential night-time limit of 65 mph (105 km/h), but the latter
was not introduced in December 1971. Reasons for the second change - from 70 mph (113 km/h) to 60 mph (97 h/h) - have not been published.
The former change in limits had no noticeable effect on
Victorian casualties, but the second appeared to, as Victorian
casualties in 1974 fell sharply by comparison with 1973,
fatalities by 14% and persons injured by 12%. These falls were
comparable with those obtained three years earlier as a result of
seat-belt wearing legislation.
An investigation of the 1973/74 reduction in fatalities
(fatality trends up to 1977 are shown in Fig.7), using 1969-75
data, in Cowley (1977) showed that:-
(a) it occurred mainly in the 'high speed' (HS) region - defined as the region to which the maximum speed limit
applies - compared with the 'low speed' (LS) region (the complement of the HS region), and
(b) it involved mainly motor vehicle occupants, passengers
particularly,
and the same factors were associated with the subsequent upturn
in fatalities in 1975, to the pre-1974 level. Further, a substantial
part of the HS region downtuxn occurred on the more heavily
trafficked roads close to Melbourne. Rural free speeds (Figs.3, 7)
showed a similar pattern, but with a slower return towards the
pre-speed limit levels. It was concluded that the new 100 km/h

33.
speed limit was an important causal factor in the 1973/74
downturn in fatalities, but :hat it had short tern effectiveness.
Examination of the high speed region fatality data, Cowley
(1977), showed that:-
(a) the data had a high variance - compared with the low speed region data - so that the 1973/74 downturn was not significant, and
(b) the 1970 seat-belt wearing legislation probably had
little effect in this region - compared with the low speed region - but firm conclusions would have required additional pre-legislation data, with a high speed/low
speed regional split.
Subsequent work in the RoSTA XCV Operational Safety Study,
Cowley (1978), snowed that car-truck collisions accounted for a
substantial proportion of the 1973/74 fatality downturn, as shown
in Fig.8. It might be inferred that the reduction in car speeds,
in association with (probably) no reduction in truck speeds, led
to a reduction in the speed variance of the traffic stream and
therefore a lower accident/casualty rate; however, there is
insufficient truck speed information to check this supposition.
In summary, the Victorian experience from an analysis of
1969-75 data in2icates that an absolute speed limit of 100 km/h,
imposed upon a rural vehicle population travelling at about 100
km/h mean, 110-115 kn/h 85th percentile, resulted in free speeds
reducing by 4 to 8 kx/h (Fiq.3). an2 returning towarc3 previous
levels in 2 to 4 years, and in fatalities reducing by l4%, and
returning to previous levels in one year, Figs.3,7. Changes in

34.
car-truck collisions contributed to this fatality pattern.
In comparison with the fatality data, analysis of data on
persons-injured was inconclusive: indeed, Cowley (1977) stated
that there is some evidence to indicate that the steady reduction
in Victorian injury statistics during the 1970's might be partly
due to changes in accident reporting procedures.
THE USA 55 MPH SPEED LIMIT
Beginning in late 1973 the USA experienced an 'energy crisis'
which led to restrictions in petrol sales, increases in petrol
prices and the introduction of a nationwide maximum speed limit
on all roads and freeways of 55 mph (89 km/h). Many reports have
been written examining the manr'er in which these measures affected
fuel consumption and road-traffic safety, the latest available
being National Highway Traffic Safety Administration (1978). Many
of the findings given below are taken from this source. Prior to
the energy crisis, speed limits in the USA varied considerably from
one State to another: for example, an earlier report, National
Highway Safety Bureau (19691, quoted absolute limits between 45
and 80 mph, although the majority lay between 60 and 70 mph, (97
and 113 km/h) .
It would be of interest to compare USA findings with those of
New Zealand where a 50 mph (80 km/h) speed limit was introsuced at
the same time for the same reason: however, a literature search
did not reveal any published work on evaluation of the effectiveness
of the lower New Zealand limit.
The main results from the USA can be summarised by the

35.
following changes between 1973 and 1974:-
a 16% drop in fatalities;
an 8% drop in average rural free speeds, i.e. about
5 mph ( 8 h/h) ,
about 10% drop in total vehicle-travel, in both rural
and urban areas;
about 15% drop in fatality rate (per vehicle distance),
a drop in highway fuel consumption of between 1 and 35
approximately, due to the speed limit, per se.
The 8% speed drop (from 1973 to 1974) of 60 to 55 mph - item (b) above - refers to 'main rural roads', but the NHTSA report quotes an 11% decrease from 65 to 58 mph on 'rural and Interstate
highways'.
NHTSA (1978) states that more than half of the 1974 fatality
reduction could be attributed to the new speed limit, (with the
remainder being attributed to a decrease in vehicle-travel, changes
in travel patterns, etc.). However, a study by The Pennsylvania
State University, Heckard et a1 (19761, was more cautious,
concluding that l... fatalities per hundred million vehicle miles
of travel have been reduced by the enactqent of the speed limit,
but injuries per hundred million vehicle miles of travel have not.
The data do not, however, permit a precise numerical estimate of
how much of the reduction in the fatality rate is due to the speed
reduction'.
As a result of the introduction of the 55 mph limit, the
previous car/truck and day/niqht differential limits have been
abolished in practically all States.

36
The fuel consunption benefits resulting from the speed
limit introd-ced in th2 'energy crisis' appear to be small. The
figure quoted earlier, of about 10% reduction in vehicle travel,
would imply an overall transportation fuel reduction of at least
10%; however, the decrease in fuel consumption due to the speed
limit itself is estimated to be 1 to 3%.
The cost effectiveness of the lower speed limit is difficult
to establish, as it depends upon the costing of time lost on rural
trips. it is not clear whether costing lost time (particularly for
non-commercial traffic) is valid or not, Castle (1976) and
European Conference of Ministers (1978).
With the easing of the 'energy crisis', the 55 mph speed
limit has been questioned,in the USA. The NHTSA data for 1976-77
shows that the limit was not being respected by the majority of
drivers. in addition, a number of States (mainly in the West) were
considering increasing the limit, (thus potentially foregoing
considerable amounts of Federal aid monies), but the 1979 fall in
Iranian fuel production was affecting these considerations,
institute of Transportation Engineers (1977a, 1977b).
In summary, the USA experience from the 'energy crisis'
measures, including the introduction of the 55 mph limit, is:-
(a) fairly large reductions in vehicle-travel,
(b) small reductions in highway fuel consumption due to the
speed limit itself, and
(c) large reductions in fatalities and fatality rates.

AUSTRALIAN FREE SPEEDS
Free speeds of cars and car derivatives in Australian rural
regions, measured in the ACXUPTC survey in late 1978, Office of
Road Safety (1979), are summarised in Table IV and Fig.1. For
mainland Australia, statewide means can be summarised by a range
of 84 to 112, with an average of 97 km/h; corresponding figures
for statewide 85th percentiles are:- range 93 to 128, average 109
km/h. In general, standard deviations are between 10 and 15 kmih.
Tasmanian figures are as follows:- mean: range 80 to 86, average
83 km/h, and 35th percentile:- ranqe 92 to 101, average 97 km/h,
which are 12 to 15 km/h lower than those on the mainland. The
lower values for Tasmania are most likely influenced by its more
difficult terrain and, possibly, smaller trip distances,
Commonwealth Bureau of Census and Statistics (1973) and Australian
Bureau of Statistics (1978). This point is reinforced by observing
that car/truck differential speeds in Tasmania are of the same
order as those on the mainland.
A broad interpretation of Fig.1 is that free speeds of cars
are independent of the rural speed limits in force; indeed, the
correlation between speeds and speed limits appears to be negative,
not positive.
The trends in car free speeds for SA given in Fig.2 are
difficult to interpret; they might be showinc a general upward
trend and they might be consister-t with a recent levelling-off
of speeds. McLean (1978) concludes that for the period 1967 to
1976 the lower rate of increase in the 85th percentiles, 0.35 km/h
per year, compared with 0.92 km/h per year for the means, implies
that the coefficient of variation is cecreasing with time and he
38
found this to be statistically significant. There is a slight
indication in Fig.2 that the changecver at metrication in mid-l974
from a 60 mph (97 km/h) prima facie limit to a 110 km/h absolute
limit led to a reduction in upward speed trends.
The Victorian speed data shown in Fig.3 were noticeably
affected by the introduction of the new 60 mph/100 km/h absolute
limit in 1973/74; the limit affected all the parameters shown.
During 1975 and 1976 speeds returned towards the pre-1974 levels;
this is analysed in Cowley (1977) on the effectiveness of the
speed limit.
In summary, current free speeds of cars do not appear to be
related to current speed limits, and it is impossible to draw firm
conclusions regarding upward speed trends. In the mainland
States, mean and 85th percentile speeds are approximately 100 and
110 km/h, but there is a wide variation about these figures.
AUSTRALIAN FATALITY RATES
In a study which aims to recommend rural speed limits for
Australia, it is important to compare accident statistics across
the States, particularly to see whether different speed limits
are associated with different accident/casualty rates. Fatality
rates are,briefly examined below: injury rates are not examined
because of the differing reporting criteria in use ac- LOSS
Australia.
Fig.4 shows overall fatality rates for the six States,
computed from fatality and motor vehicle registration data published
regularly by the ABS. The period 1965-78 has been chosen to cover

39.
similar time spans pre- and post-legislation on seat belt
wearing, introduced in 'victoria in December l970 anc in other
States and Territories 9 to 12 r.onths later. The fatality data
have been divided into:-
(a) motor vehicle occapants, eefined as drivers of motor
vehicles excluding motor cycles, plus passengers of
motor vehicles including .motor cycles, (in accordance
with ABS publications), and
(b) non-occupants, defined as the complement of occupants.
The fatality rates in Fig.4 have been computed for each State
by dividing the three fatality curves, for all road users,
occupants and non-occupants, by the number of motor vehicles
registered at mid-year, (where motor vehicles include motor cycles).
The peaks and troughs in the fatality rate curves generally
reflect equivalent changes in the fatality curves, because the
vehicle registration curves are reasonably smooth.
Some noticeable features of Fig.4 are:-
(a) the generally high rates in Queensland and WA
particularly in the 1960's,
(b) the rapid decline in rates in Queensland and WA
during the 1970' S, and
(c) the generally low rates In SA
Seat belt wearing legislation appears to have been
effective in all States - in terms of decreasing the gradients of occupant fatality rate curves - and zarticularly so in NSW,

Victoria and Tasmania, where step-function changes in seat-belt
wearing rates apparently occurred.
The fatality rates in Fig.4 effectively assume equal
average vehicle distances in all States; but some account can be
taken of different vehicle distances by using data from the ABS
vehicle-usage surveys carried out in 1971 and 1976, Commonwealth
Bureau of Census and Statistics (1973) and Australian Bureau of
Statistics (1978). Average vehicle distances for the six
States, relative to Australia as a whole, can be summarised as
follows:
NSW VI c QLD SA WA TAS
1971 +l% +3% -8% 0 +6% -11%
1976 0 +3% -6% -3% +3% -10%
When these figures are used in conjunction with the occupant
fatality rates (per vehicles registered) from Fig.4, for the
period following seat-belt wearing legislation, it can be
inferred that occupant fatality rates (per vehicle-distance) are
'low' in Victoria and SA, and 'high' in Queensland and Tasmania.
It would be of interest to find reasons for these differences
between States; a possible reason could be different relative
magnitudes of urban and rural travel.
One way of examining this problem is to use data from the
ABS vehicle-usage surveys,mentioned earlier. These surveys show
that the proportion of urban travel varies from as low as 41'5
(Tasmania, 1971) to as high as 66% (NSW, 1971) compared with a
figure Of 61 to 62% for the whole of Australia. However, ic
should be noted that the ABS definition of urban travel is an
over-estimate, as it includes the high-speed roads of the ABS-
41
defined capital city areas (Statistical Divisions), but also
an under-estimate, as it does not include travel in towns with
populations of under 40,000 persons. An alternative way of
examining the problem is to use accident data broken down into
consistent high-speed (HS) and low-speed (5s) regions. For
this reason, four States - NSW, Victoria, Queensland and SA - have produced special tables of motor vehicle occupant and non-
occupant fatalities, divided into speed limit zones, from which
a HS/LS regional split can be obtained. This information is
summarised in the Appendix.
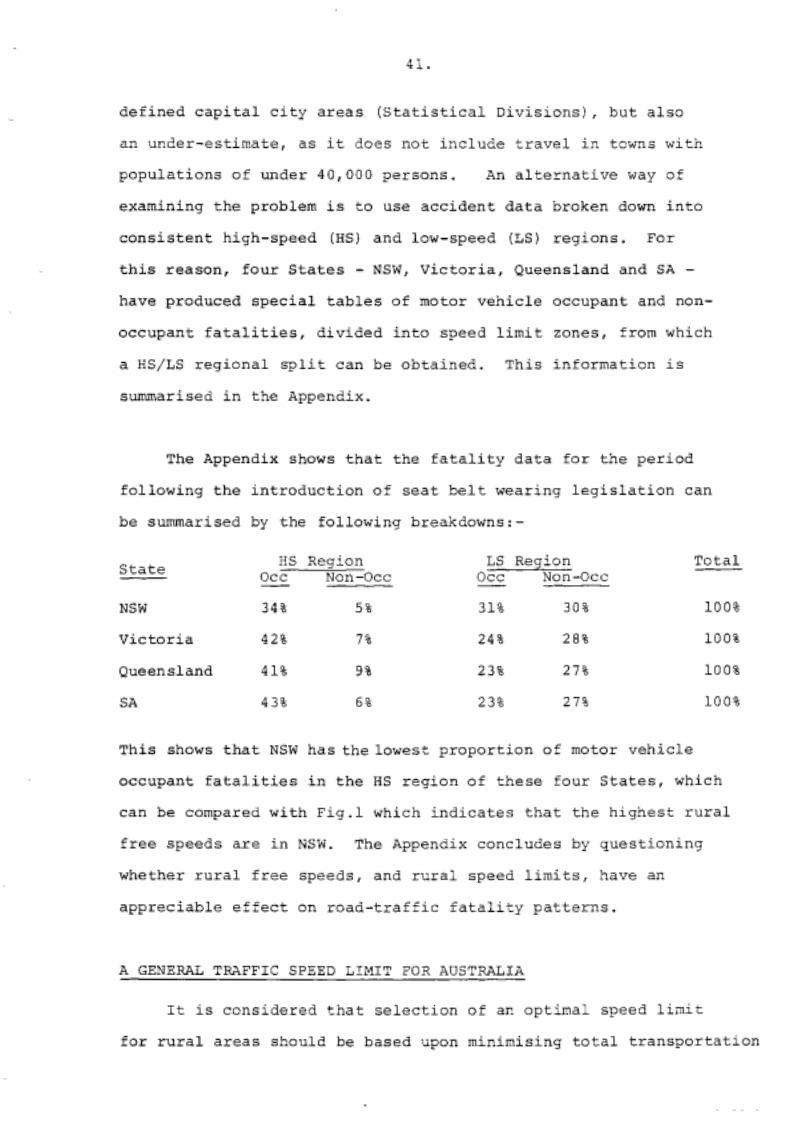
The Appendix shows that the fatality data for the period
following the introduction of seat belt wearing legislation can
be summarised by the following breakdowns:-
State I_ oc c Non-Occ
HS Region - occ Non-Occ
LS Region -
Total - NSW 34% 5% 31% 30% 100%
Victoria 42% 7% 24% 28% 100%
Queensland 41% 9% 23% 21% 100%
SA 43% 6% 23% 274 100%
This shows that NSW has thelowest proportion of motor vehicle
occupant fatalities in the HS region of these four States, which
can be compared with Fig.1 which indicates that the highest rural
free speeds are in NSW. The Appendix concludes by questioning
whether rural free speeds, and rural speed limits, have an
appreciable effect on road-traffic fatality patterns.
A GENERAL TRAFFIC SPEED LIMIT FOR AUSTRALIA
It is considered that selection of ar? optimal speed limit
for rural areas should be based upon minimising total transportation

42.
costs - comprising the sum of accident/casualty costs, vehicle operating costs and driver/occupant costs - as stated earlier. However, there appear to be insufficient data available to
calculate all of these factors. For this reason, the arguments
given below only consider the likely safety benefits of various
absolute speed limits.
All States now have rural speed limits of 100 or 110 km/h,
but there is little documented evidence to support either of these
levels. Consideration of a speed limit for the National Road
Traffic Code should take account of these existing limits, and,
possibly, limits as low as 90 km/h (close to the current USA level)
and as high as 120 km/h. Four options are therefore presented
below, assuming that general speed limits should be restricted to
multiples of 10 km/h.
The selection of a suitable limit within this 90 to 120 km/h
range is difficult, when all factors are taken into consideration.
As a recent report, European Conference of Ministers of Transport
(1978), says:-
to threshold effects. If the maximum permitted speed is set "Choice of threshold - speed limits are undoubtedly subject too high, there will be no truly significant effects. The limit must be set at a level which is fairly constraining and seen to be so. But speed limits must not be chosen without regard for the problem of compliance and the corresponding provisions for monitoring and enforcement. It is essential to have the support of drivers and of public opinion for, if not, the cost of enforcement could well become prohibitive."
A speed limit of 90 km/h in a country as large as Australia
would be unlikely to be effective for the following reasons :-
(a) it represents a current free speed percentile (for
mainland States) in the range of 20 to 309 on average,
Office of Road Safety (19791, and
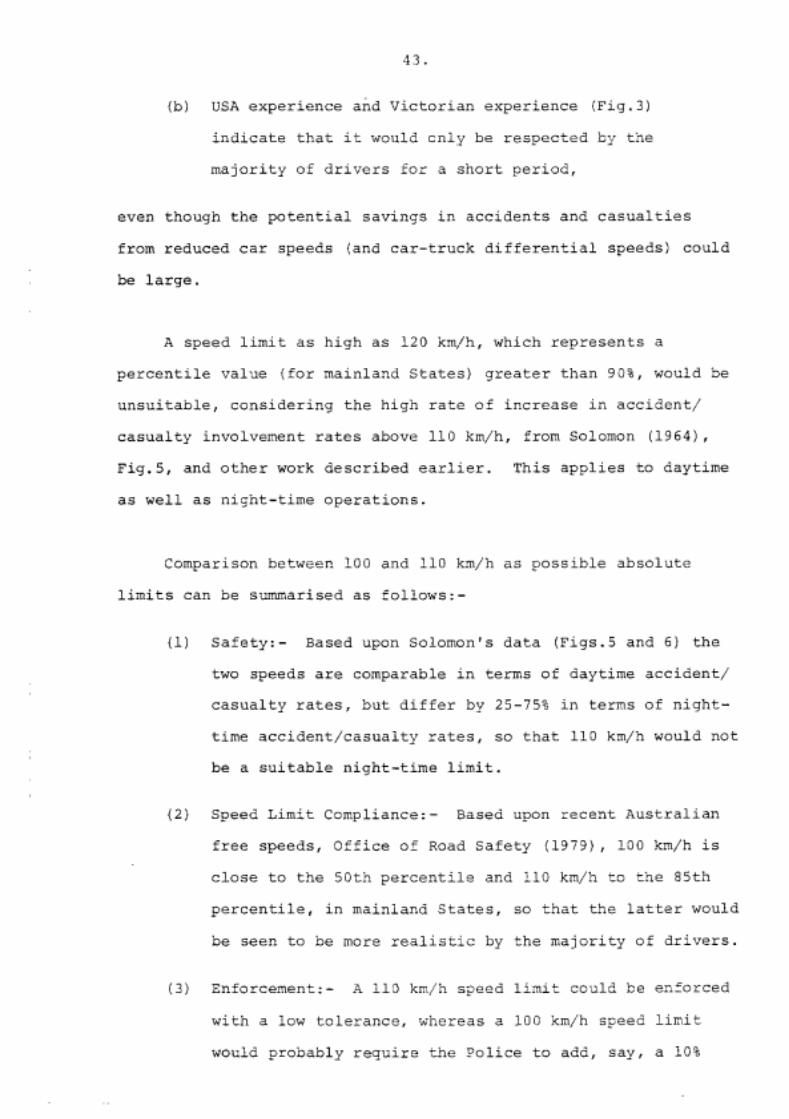
(b) USA experience and Victorian experience (Fig.3)
indicate that it would cnly be respected by tne
majority of drivers fox a short period,
even though the potential savings in accidents and casualties
from reduced car speeds (and car-truck differential speeds) could
be large.
A speed limit as high as l20 km/h, which represents a
percentile value (for mainland States) greater than 90%, would be
unsuitable, considering the high rate of increase in accident/
casualty involvement rates above 110 km/h, from Solomon (1964),
Fig.5, and other work described earlier. This applies to daytime
as well as night-time operations.
Comparison between 100 and 110 km/h as possible absolute
limits can be summarised as follows:-
Safety:- Based upon Solomon's data (Figs.5 and 6) the
two speeds are comparable in terms of daytime accident/
casualty rates, but differ by 25-75% in terms of night-
time accident/casualty rates, so that 110 km/h would not
be a suitable night-time limit.
Speed Limit Compliance:- Based upon recent Australian
free speeds, Office of Road Safety (1979), 100 km/h is
close to the 50th percentile and 110 km/h to the 85th
percentile, in mainlanci States, so that the latter would
be seen to be more realistic by the majority of drivers.
Enforcement:- K 110 kmjh s?eed limit could be enforced
with a low tolerance, whereas a 100 km/h sFeed limit
would probably require the Police to add, say, a 10%

44
tolerance to keep enforcement effort to a reasonable
level.
The only Australian data available to assist in the choice
between 100 and 110 km/h comes from the Victorian experience 0 5
reducing the limit from 70 mph (113 km/h) to 60 mph (97 km/h) in
late 1973, and subsequently converting it to 100 km/h in mid 1974,
as summarised in Figs.3 and 7. On the basis of this experience,
it could be predicted that the introduction of a 100 km/h limit
in the mainland States of SA and WA would yield only short term ,
safety benefits.
There is no Australian information available f,or predicting
the outcome of introducing a 110 km/h limit in the Eastern
States of NSW, Victoria and Queensland; however, in terms of
road-traffic safety, it would be seen to be a retrograde step,
and such a limit would probably need to be rigidly enforced, i.e.
with minimal tolerance.
Thus there is insufficient information available to allow
a choice to be made between 100 and 110 km/h in a wholly objective
manner. The main points for and against either level can be
summarised as given below; these points do not take into account
the possible influence of differential limits for various vehicle
classes - e.g. trucks - as discussed in the next Section.
100 km/h General Limit
For : - (1) 'safe' and in line with worl2wide trends.
(2) restrictive, as suggested in European Conference
of Ministers of Transport (1978).

Against: - (4) (5)
probably suitable for both day and night driving.
safety jensfits possibly short-term only,
probably requires an enforcement tolerance of,
say, 10%,
high standard roads and freeways might require to
be zoned (at, say, 110 km/h) above the general
limit.
110 h/h General Limit
'realistic' in terms of driver compliance,
realistic in terms of enforcement,
would not require speed zoning at higher levels,
on high standard roads and freeways,
not restrictive nor in line with worldwide trends,
probably no safety benefits,
probably requires a (lower) differential limit
for night-time driving.
Therefore, on safety grounds, neither level of general speed
limit has a clear advantage over the other. It is the author's
opinion that the more realistic limit of 110 km/h should be
selected for Australian rural roads.
An additional consideration in support of a 110 km/:? limit
is that, in being closer to the 85th percentile of free speeds
than the 50th percentile, selection of this general limit would
be more consistent with current spee? zoning practice. It coulc
be argued that the ultimate speec limit structure for Australia

46.
would be obtained by speed zoning all (through traffic) roads
by a consistent set of criteria, such as those employed now.
Adoption of a 110 kn/h general limit - followed by progressive speed zoning of lower standard and heavily trafficked rural
roads at, say, 90 km/h (assuming a basic structure or hierarchy
of speed limits in steps of 20 km/h), could be seen as a first
step towards a consistent speed limit strategy.

. 1 5 0 0 - \
47.
\ \ \ \
VEHICLES 1000 -
INVOLVED
PER 10'
7 NIGHT
VEHICLE MO - I .""a MILES
\ MEANS \ . \.- *. *- -
DAY
0 0 20 40~ 60 80 MPH
1000 - NIGHT
PERSONS I I
INJURED
PER 10'
I
500-
VEHICLE MEANS ""B
MILES -
0 I I 8 I I
0 20 40 60 EO MPH
500 - PROPERTY - DAMAGE
PER 108
0 - 9 Q
X - VEHICLE - MILES
. NIGHT
DAY I
L DAY L*- - .' It- - -t MEANS
0 1 I I 1 I I 0 20 40 60 80 MPH ARROWS DEPICT (LEFT TO RIGHT) PERCENTILES OF TRAVEL SPEEDS - 50th, aSth, ?0th, 95th.
FIG. 5 - VEHICLES, PERSONS INJURED, PROPERTY DAMAGE INVOLVEMENT RATES - FROM SOLOMON (1964)

X 0 c
r- 0 6
I 0 :: 0 -
S 0 N 0 0
0 5:
0

49.
1200 r
ROAD-TRAFFIC FATALITIES - loo0 -
- ALL ROADS
800 - -
600 - c--, URBAN ROADS (LS REGION) \ \ , - . . <l- - _."""
/ ~
400-
- RURAL SPEED LIMITS
0 - I I I I I I I l I I I l 1 1970 1975 1980
120 RURAL FREE SPEEDS
85th PERCENTILES -
100
- MEANS I 90
- -
70 MPH 60 MPH / 100 KM,% RURAL SPEED LIMITS
0 I I I I I I I I l I I I 1 1970 1975 1980
FIG. 7 - FATALITIES AND RURAL FREE SPEEDS IN VICTORIA, 1969-79

50.
DIFFERENTIAL SPEED LIMITS IN RURAL AREAS
The previous Section examines absolute limits for qeneral
traffic in rural areas. Possible differential limits are
considered in this Section, under the following subject headings:-
(1) Heavy trucks.
(2) Omnibuses.
(3) Vehicles towing caravans/trailers
(4) Motorcycles with passengers.
(5) Night-time.
Prior to the ACRUPTC review of the Code in 1977-79, the Code
contained differential speed limit provisions of 80, 90, 80 and
70 km/h respectively for the four vehicle classes given above;
however the motorcycle limit was removed from the Code in 1979, as
described in an earlier Section.
A possible differential limit for night-time driving is
examined because of two points arising from the previous Section,
namely: - (a) the large differences between daytime and night-time
accident and casualty rates in Solomon (1964), see
Figs.5 and 6, and
(b) the preference given to an absolute (daytime) limit
of 110 km/h instead of 100 km/h.
HEAVY TRUCKS
All States except Queensland have a differential speed limit
of E O km/h on heavy trucks, as shown in Table I; ACT retains a
more complex structure of limits between 50 and 80 km/h, based

upon different vehicle masses. Thus most States enploy a
differential limit for trucks which agrees with the current Code
provision (Table I) .
The recent study of free speeds, Office of Road Safety (1979),
obtained good truck samples from five States and this information
is summarised in Table IV and Fig.1, from which it can be stated
that for four mainland States:-
(a) nean and 85th percentile free speeds are approximately
80 and 90 km/h respectively, (although the 85th
percentile for trucks is higher on some NSW roads),
(b) truck speeds in Queensland (100 km/h truck limit) are
not significantly higher than in NSW, Victoria or SA,
(c) semi-trailers travel faster than rigid trucks by about
3 km/h on ave,rage, (but with considerable variation about
this figure) ,
(d) to the nearest 5 km/h, trucks on average are 15 to 20
kn/h slower than cars,
and for Tasmania:-
(e) truck speeds are about 10 km/h below those on the
mainland, and
(f) to the nearest 5 km/h, truck means and 85th percentiles
are respectively 10 and 20 km/h below those for cars.
On the basis of an 85th percentile free speed criterion, a
suitable Australian truck speed limit would therefore be 90 km/h.
The RoSTA HCV Operational Safety Study, carried out in early

52.
1978, was a comprehensive investigation of truck safety, which
originated mainly from a request to raise Victoria's E5 km/h
rural limit for trucks, but which covered many aspects of
truck safety. As a result of this study, this rural limit has now
been raised to 80 km/h, although the Study Team's recommendation
was for a truck speed limit of 90 km/h, RoSTA (1978).
The following seven findings on truck safety are taken from
the Accident Analysis Task Report, Cowley (19781, and Vehicle
Braking Task Report, MacKay (1978) , prepared for the RoSTA study.
The main findings of other truck safety studies - such as Messiter (1971), Croft (1972) and Pak-Poy (1971) - were confirmed in the RoSTA report on accident analysis. Car and truck free speeds
measured in the RoSTA study are the Victorian data shown in Table
IV and Fig.1.
(1) Car and truck casualty accident trends in Victoria
during 1969-76 (shown in Fig.8) can be summarised as
5 to 6% per year declines in car and rigid truck
casualty accidents and 0 to 4% per year declines in
semi-trailer casualty accidents. There is little
doubt that car safety measures (such as seat-belt
wearing legislation and Australian Design Rules (ADR))
contributed to these declining trends, because most
casualties in car-truck collisions are car occupants;
however, other safety measures (such as improvements in
traffic management, road design, truck design, etc.) would
be required to explain the fast decline in rigid truck
single vehicle casualty accident data. (It should be
noted that Victorian accident forms do not distinguish
between light and heavy trucks).

53
(2) Victorian casualty accident patterns - by vehicle type, accident type and by high-speed (HS) and lo,w-speed (LS)
regions - were also examined for the same 8-year period. This analysis showed that many of these trends were
'stable' or decreasing, but a noticeable exception was
a rising trend in semi-trailer ran-off-road. type
accidents in the HS region. It is possible that this is
mainly a night-time problem, but this was not examined
in the Study. This trend might reflect increasing
exposure, but without further information it would seem
undesirable to allow semi-trailers to be driven above
current speeds.
(3) Estimated casualty accident rates (in terms of vehicle-
distances travelled) for Victorian cars and trucks halved
approximately during 1969-76. A comparison of single-
vehicle (SV) and multi-vehicle (LW) accident rates showed
that: - (a) SV rates are lower than MV rates,
(b) SV truck rates are lower than SV car rates,
(c) truck-car rates are higher than car-car rates, and
(d) rigid truck rates are lower than semi-trailer rates.
However, a preliminary analysis of accident rate models
showed that the mechanism of car-truck collisions, in
relation to car-car collisions, single vehicle accidents
and exposure, is not fully understood. In particular,
conclusion (c) above could be invalid, as car-truck
rates could be consistent with car-car rates.
54.
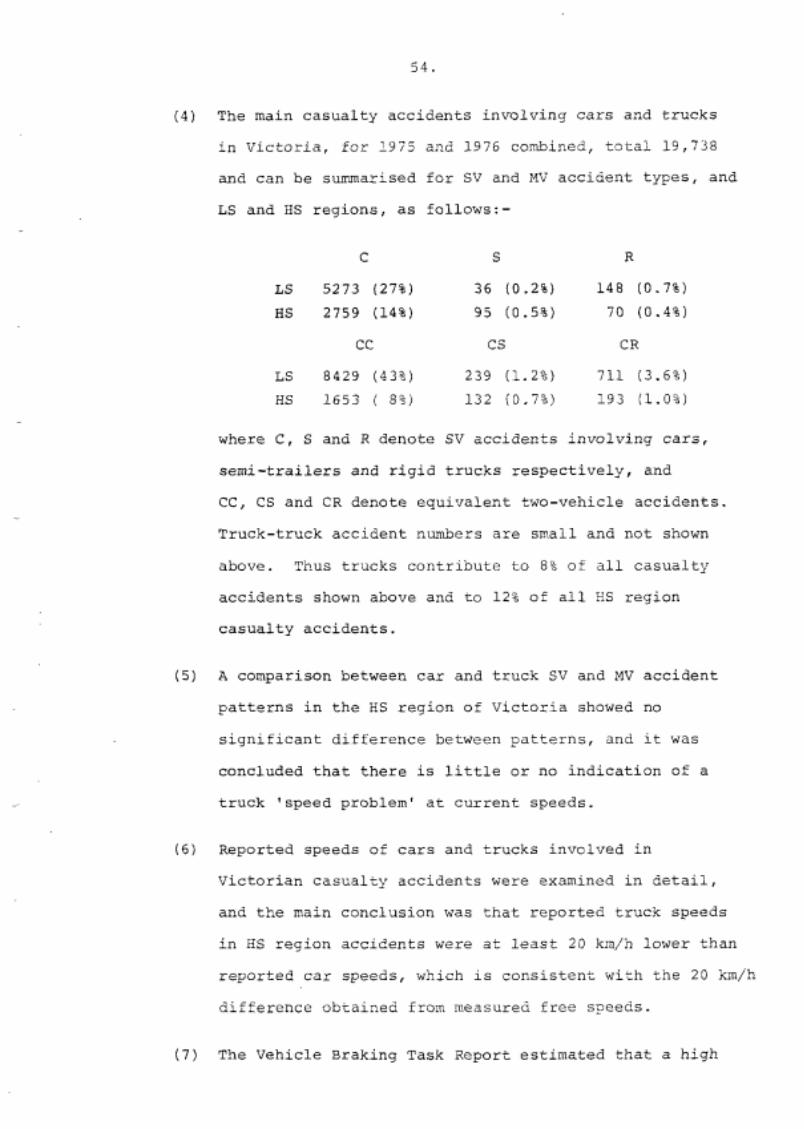
(4) The main casualty accidents involving cars and trucks
in Victoria, for 1975 and 1975 combined, total 19,738
and can be summarised for SV and MV acciaent types, and
LS and HS regions, as follows:-
C S R
LS 5273 (27%) 36 (0.2%) 148 (0.7%)
HS 2759 (14%) 95 (0.55) 70 (0.45)
cc CS CR
LS 8429 (43%) 239 (1.2%) 711 (3.6%) HS 1653 ( 8%) 1 3 2 (0.7%) 193 (1.0%)
where C, S and R denote SV accidents involving cars,
semi-trailers and rigid trucks respectively, and
CC, CS and CR denote equivalent two-vehicle accidents.
Truck-truck accident numbers are small and not shown
above. Thus trucks contribute to 8% of all casualty
accidents shown above and to 12% of all HS region
casualty accidents.
(5) A comparison between car and truck SV and MV accident
patterns in the HS region of Victoria showed no
significant difference between patterns, and it was
concluded that there is little or no indication of a
truck 'speed problem' at current speeds.
(6) Reported speeds of cars and trucks involved in
Victorian casualty accidents were examined in detail,
and the main conclusion was that reported truck speeds
in HS region accisents were at least 20 km/h lower than
reported car speeds, which is consistent with the 20 km/h
difference obtained from measure6 free s?eeds.
( 7 ) The Vehicle Braking Task Report estimated that a high

55.
proportion of trucks (certainly most modern trucks)
would meet the requirements of ECZ 13/ADR 35 Regulations - approximately 4 metres/sec2 of deceleration - and that a high proportion of cars would meet the requirements of
FMVSS 105 Regulations - approximately 5.6 metres/sec2
deceleration. When the free speed distributions of
cars and trucks are combined with these braking curves,
it can be shown that the distributions of braking
distances are comparable for cars and trucks.
In summary, the Victorian truck accident problem is fairly
small, truck accident rates are comparable with or lower than car
rates, and car and truck braking distances are comparable; however,
a safety problem might arise if truck (particularly semi-trailer)
speeds were allowed to rise on rural roads.
Table IV and Fig.1 show that Victorian car and truck rural
free speeds can be summarised (to the nearest 10 km/h) by:-
Mean 85th Percentile
Cars 100 Trucks 80
110 90
where all measurements were taken in daylight hours.
On the basis of this information, the RoST4 Study Team
recommended that the rural speed limit for trucks be set at 90
km/h, RoSTA (1978).
A comparison between,Victoria and Queensland would be of
interest, because the latter State imposes no differential speed
limit on trucks (Table I). Table IV and Fig.1 show that the
56.
free speed difference between cars and trucks is some 7 km/h
smaller in Queensland (than in Victoria) &de to slower cars an2
faster trucks. There are indications from r"ig.4 and Cowiey (1978)
that casualty/accident rates in Queensland are comparable with, or
higher than, those in Victoria. However, a detailed study of
Queensland car/truck accident patterns and rates would be necessary
for accurate comparison with the Victorian findings; without such
a study, it is impossible to form conclusions regarding the different
rural speed limit systems employed in Victoria and Queensland.
On the basis of the information presented above, it is
recommended that the rural speed limit for trucks in the Code be
set at 90 km/h. This recommendation is conditional upon a general
traffic (daytime) limit of 110 km/h being adopted, as recommended
in the previous Section. If, however, 2 general traffic limit of
100 h/h was selected instead, it might be difficult to justify
a truck differential limit which is only 10 km/h lower, although
the evidence for a truck limit of 90 km/h is substantial.
OMNIBUSES
Table I shows that five States and Territories employ
differential limits for omnibuses, four of which are set at
90 km/h, in agreement with the current Code provision.
From the recent study of rural free speeds, Office of Road
Safety (1979), two mainland States, Queensland and SA, recorded
reasonable overall sample sizes for rural free speeds for buses,
namely 57 and 11s respectively. These States recorded mean speeds
of 87 km/h, and the average 85th percentiles were 93 and 96 km/h
respectively. Comparison wirh equivalent data (for these two

57.
States) for cars and trucks shows that, to the nearest 5 km/h,
buses are 10 %m/h slower than cars and 5 Xm/h faster than trucks.
On the basis of an 85th percencile free speed criterion, a
suitable rural limit for buses would therefore be 90 km/h.
The small sample sizes obtained in Office of Road Safety
(1979) are an indication of the low rural vehicle-distances
covered by buses. It can therefore, be expected that the rural
bus accident problem is small; this is supported in Australian
Road Research Board/Department of Transport (1976), which shows
that accident and casualty rates per vehicle-distance or occupant-
distance are, overall, generally lower for buses than for other
road vehicles. This is also mentioned in Advisory Committee on
Safety in Vehicle Design (1974), which emphasises that the bus
accident situation is essentially an urban problem, with no
association with high speeds. The latter point is also supported
by a study of bus accidents in Victoria, Pak Poy (1971).
The Accident Analysis Task Report, Cowley (19781, in the
RoSTA HCV Operational Safety Study showed that for Victoria, during
1969-1976, bus and car-bus casualty accidents totalled approximately
80 per annum, resulting in 140 casualties (including 5 fatalities).
An analysis of 1975-76 data showed that bus and car-bus casualty
accidents for this period were divided into urban and rural
regions in the ratio of 135311; thus the Victorian rural acci2ent
problem for buses is very small. The RoSTA Stuay Team subsequently
recommended that ECV speed limits should be based upon a common
philosophy, oriented to all HCV classes, includinq buses.
The limited evidence available therefore shows that Suses
operating in rural areas are relatively safe and appear to travel

58.
about 10 km/h slower than cars and 5 km/h faster than trucks. It
is not know.. whether bus accidents would increase 3r not if their
speeds were allowed to rise. Therefore it is conservatively
recommended that the rural speed limit for buses be set at
90 h/h, as for trucks, in line with the current Code provision.
This recommendation is conditional upon a general traffic (daytime)
limit of 110 km/h being selected; if 100 km/h were selected
instead, there would appear to be little evidence to support a
differential limit for buses.
VEHICLES TOWING CAaVANS/TRAILERS
Office of Road Safety (1979) includes free speed data from
three States, NSW, SA and Queensland, on these vehicle combinations.
The agreement between these free speeds is good, as shown by the
following:-
Mean (km/h) 85th Percentile (km/hl
NSW (80 PF limit) 8 8 - NSW (100 zone limit) 85 97 SA a5 96
(LLD 83 93
Table I shows that NSW, Victoria, WA and Tasmania all have
differential limits of 80 km/h for vehicles-towing, in agreement
with the Code. Thus of the three States given in the table above,
only NSW has such a limit.
These figures indicate that a differential limit has little
or no effect on free speec?s; indeed, on tke basis of an 85th
percentile free speed criterion, a suitable rural limit would be
90 km/h.

59.
Comparison with the equivalent data from NSX, SA and
Queezsland for cars-only and trucks shows that (to the nearest 5
km/h) the free speeds of cars-towing are:-
10 to 15 km/h below cars-only, and
0 to 5 km/h above trucks.
Thus it can be inferred that the speed characteristics of
cars-towing are slightly above those of trucks, but considerably
below those of cars-only.
Two Australian reports are available on accidents involving
vehicles-towing, Vaughan (1974) on cars towing caravans and
Boughton (1979) on vehicles towing caravans and trailers. The
former is an analysis of one year's data (1972/73) in NSW, which
at that time had a 45 mph vehicle-towing limit, and the latter
covers three years' data (1974/75 to 1976/77) in Queensland, which
has no differential limit. (Queensland abolished this limit some
years ago as a result of rural traffic congestion.)
The NSW study found that accidents involving cars towing
caravans constituted 0.35% of all reported accidents and 0.18% of
all casualty accidents; no exposure data was available to compute
accident rates. About three-quarters of the caravan accidents
occurred on rural roads. The largest single characteristic
(nearly one quarter) of the accidents was overturning on the road.
In almost half of the accidents, stability of the combinarion
appeared to have been a causal factor. As a result, Vaughan
(1974) recommended that the then NSW speed limit for these
combinations of 45 mph (72 km/h) Se raised to 80 km/h, in
accordance with the proposed metric conversion of this limit,
and this was implemented at metrication in mid-1914.

The study of Queensland ciata found that accidents involving
all vehicles-towing constitutsd 3.4% of all reported accidents
and 2.8% of all casualty accidents; of these, about half were
cars (including car derivatives) towing trailers and a quarter
were cars towing caravans. Thus the accident involvement of
car-caravan combinations in Queensland was 2 to 4 times higher
than that in NSW; however, it was argued that differences in
accident reporting criteria, and numbers of caravans registered,
were sufficient to cast doubt on this apparent over-involvement.
Rural roads accounted for about three-quarters of car-caravan
accidents - in agreement with the NSW results - and about half of all towing accidents. Boughton (1979) concluded that implementation
of a special vehicle-towing limit for Queensland, below the general
traffic limit of 100 km/h, could not be justified on the available
data.
The two studies differed regarding overturning accidents,
as the Queensland proportions were 24% of all accidents and 18%
of casualty accidents, compared with the corresponding NSW figures
of 22% and only 6%. However, the overturning problem is large;
for this reason and because of the general over-involvement of
towing accidents on straight and level roads, there does appear to
be a stability problem. The apparent stability problem would
become worse if speeds were permitted to increase, so that a speed
limit close to existing free speeds is warranted.
On the basis of this information, it is recommendeci tkat
vehicles towing caravans and trailers be limited to 90 km/h, as
recommended earlier for trucks. This assurnes that the qeneral
traffic limit adopted is 110 kn/h. If however a general limit

61.
of 100 km/h were'chosen, it might be difficult to support a
lower limit for vehicles-towing.
MOTORCYCLES WITH PASSENGERS
No States or Territories impose rural differential speed
limits on motorcycles, but prior to the recent ACRUPTC review
both Victoria and ACT had limits for motorcycles carrying pillion
passengers, of 80 and 70 km/h respectively, (the latter being in
agreement with the Code provision at that time). Following the
recent ACRUPTC review, the Code provision has been removed and
only ACT now has a differential limit for motorcycles carrying
pillion passengers (Table I); it is understood that legislation
has been proposed to remove this limit in the ACT.
The recent free speed report, Office of Road Safety [l979),
shows that Queensland and SA recorded reasonable overall sample
sizes for motorcycles, of 58 and 8,3 respectively; these States
recorded mean speeds of 96 and 92 km/h respectively, and 85th
percentile speeds of 107 and 104 km/h respectively. Comparison
with car free speed parameters in Table IV shows that motorcycle
free speeds are comparable. Sample sizes for motorcycles carrying
pillion passengers were too small for analysis purposes.
The literature on motor cycle safety is growing rapidly and
much of this is recorded in Australian Road Research Soard/
Department of Transport (1976) and House of Representatives Standing
Committee on Road Safety (1978). This literature summarises the
motorcycle accident situation as essentially an urban, high
severity, high accident-rate, motorcycle-conspicuity problem, with
a strong association with young, 'inexperienced riders and motorcycles

62.
with large capacity engines. There appears to be no evidence
of high speeds being a more serious factor in accident causation
for motorcycles than for drivezs of motor vehicles.
It is not clear why differential limits came into being for
motorcyclists carrying pillion passengers. The House of
Representatives report states that user groups argued that
motorcycles are designed to carry pillion passengers safely. The
double occupancy of such combinations approximately doubles the
chance of a person being injured, given that an acci6ent does
occur; however a NSW study in 1975, quotee in the above reference,
found that only 10% of motorcyclist casualties are pillion
passengers, so that the rider plus passenger accident problem is
small in comparison with the rider-only problem.
On the basis of the iimited available evidence it appears
that no differential limit is required for motorcycles carrying
pillion passengers; this is in line with the current provisions
in the Code.
NIGHT-TIME
As stated earlier in this report, the subject of a special
limit for night-time was discussed with Traffic Authorities in
early 1979 and little support was received for such a limit. The
main arguments againsc a lower night-time limit incluced
improvements in rural road design (involving greater use of
delineators and pavement line marking) and vehicle lighting in
recent years.
The majority of accident publications include the time of

63.
day factor, but few contain a light/dark split to illustrate
the magnitude 0: the nignt-time accident problem. In addition,
very little information is zvailable on vehicle-exposure to
compute night-time rates, and few comparisons have been made of
night versus day free speeds. The limited information available on
Australian free speeds - unpublished data from NSW, Victoria, WA
and Tasmania - shows that night and day speeds are comparable, with some evidence from Victoria (early 1970's) that trucks travel
a little faster at night.
Figs.5 and 6 t&en from Solomon (1964) show clearly that
night-time rates were approximately twice daytime rates and that
the night-time rate increases much faster than the daytime rate at
high speeds. The approximate speed percentiles in Fi9.S show that
night-time speeds were only 2 to 3 mph below daytime speeds. Of
the 27 two-lane sites studied by Solomon, 10 had day/night
differential limits of 10 mph, 3 had 5 mph and 9 had no
differential; the remainder had various mixtures of subjective
limits.
National Highway Safety Bureau (1969) quotes the following
limits of visibility - (l) S30 ft
(2) 270 ft
glare,
(160 m) for high beam headlights with no glare,
(80 m) for high beam versus high beam, i.e. with
(3) 200 ft (60 m) for low beam versus low beam, i.e. with
glare.
It is not known whether the advent of quartz halogen lights has
changed these figures significantly or not. The corresponding

64.
speeds for stopping distances equal to these limits of
visibility, on dry (new concrete) pavemencs asswining 1 or 2
second reaction times, are as foliows (to the nearest 13 k;n/:lj :-
2 seconds 1 second
13 0 15 0
80 100
60 80
Thus although headlight performance appears to be adequate in
the high-beam, no glare situation, the 'with glare' situation
would require safe speeds to be in the racge of 60 to 100 km/h.
The Accident Analysis Task in the RoSTA HCV Operational
Safety Study, Cowley (1978),examined day versus night casualty
accidents in Victoria for car, semi-trailer and ricid truck
single vehicle accidents (C, S and R respectively) and car-car,
car-semi-trailer and car-rigid truck two-vehicle accidents (CC, CS
and CR respectively) . The following table covers 19,738 casualty
accidents, for 1975 an6 1976 combined, divided into light and
dark (includizg dusk and dawn), and into high-speed (HS) and low-
speed (LS) regions.
C S R Total LS Light 2123 24 120 2867
Dark 2550 (48%) 12 (33%) 28 (19%) 2590 (47%)
IIS Light 1277 34 48 1359 Dark 1482 (54%) 61 (64%) 22 (31%) 1565 (54%)
cc CS CR Total LS Light 4961 165 513 5639
Dark 3468 (41%) 71 (31%) 198 (28%) 3743 (40%)
HS Light 111 & 86 l36 1340 Dark 535 (32%) 46 (35%) 57 (30%) 638 132%)

65.
Thus in the HS region one-half of single vehicle accidents
and one-thid of multi-vehicle accidents occur at night (including
dusk and dawn). It is possible that the headlight limitations
on 'safe' speeds discussed earlier would affect the (smaller)
number of multi-vehicle accidents more than the single vehicle
accidents - although our knowledge of night-time accidents is limited - but it could be argued that lowering speeds might be beneficial in the HS region.
It would appear that further work would be necessary to define
more clearly the likely benefits of a niqht-time limit. However
on the basis of the information above it is recommended that
consideration be given to a night-time differential limit,
particularly in view of the preference given in the previous
Section, for sn absolute limit for general traffic of 110 km/h.
On the basis of the 'with glare' speeds given earlier, an appropriate
differential limit for night-time might be 90 km/h. If however,
a general traffic limit of 100 km/h were selected, it might be
difficult to justify a lower limit for night-time.
SUMMARY
This Section has examined rural differential speed limits
for a number of vehicle classes and for night-time driving.
Recommended differential speed limits (km/h) are:-
Heavy Trucks 90
Omnibuses 90
Vehicles towing Caravans/Trailers 90
Motorcycles (with/'without Passengers) None (i.e. general limit)
Night-time Driving 90 (subject to further research)

66.
The recommendations are conditional upon selection of a
110 km/h absolute limit for ceneral traffic. The recorrmended
speed limit for trucks is based upon substantial evieence, whereas
those for the remaining categories are not. Further research
would be necessary to reach firmer conclusions in some cases; in
particular, it is considered that night-time accidents and speed
behaviour should be investigated further, as Australian data in
this area is very limited.
If an absolute limit of 100 km/h were selected instead of
110 km/h, it is considered that there would be little justification
for imposing any differential limits, with the possible exception
of heavy trucks, where the evidence in support of a limit of
90 km/h is substantial.

67.
1 CAR ONLY -* -. 1970 1975
.- . ', CAR ONLY
400
1970 1975
W a *"'% CAR ONLY
1, z K 6000
9-. . X,-.-.
1970 1975
RIGID X CAR
400
RIGID ONLY U-*-..
*.,A4 . 1970 1975
M -
40 - 30 - 20 - 10 -
RIGID X CAR
f.
0 1970 1975
RIGID X CAR
600
400 RIGID ONLY
l970 1975
l000
800
600
4oo i SEMI X CAR
1970 1975
SEMI ONLY, *\ \ I C.-.-*f
0 1970 1975
l o o 0 l 800 600 1
200 SEMI c ONLY
0 1970 1975
CARS INCLUDE CAR DERIVATIVES. DATA SHOWN CONSTITUTE APPROXIMATELY 70-90% OF TOTAL CASUALTY/ACCIDENT DATA.
FIG. 8 - VICTORIAN CASUALTY ACCIDENT DATA FOR 1969-76 FOR CARS. RlGlD TRUCKS 8 SEMCTRAILERS

68
SUMMARY AND RECOYWENDATIONS
The National Road Traffic Code is being reviewed by the
Advisory Committee on Road User Performance and Traffic Codes
(ACRUPTC), and during 1978/79 an assessment of speed limit
provisions in the Code was undertaken. The present study was
originally performed to contribute to the ACRUPTC review, but it
has been subsequently updated to include changes made in late 1979
to the Code provisions and to State and Territory practice.
?he study has concentrated upon rural speed limits, as the
main differences between Code provisions and Australian practice
are in this area, (Tables 1-111). The study therefore examines
local and overseas information on rural speed limits in relation
to road-traffic safety; this includes recent Australian free speed
data obtained from the 1978/79 national survey carried out under
the coordination of ACRUPTC, (Table IV, Fig.1).
Current Australian speed limits for general traffic on rural
roads are either 100 or 110 km/h, (Table I). Speed zoning is not
cmploycd to any grcdiC cxtenl on rur;:l roads. I'rec spccils or cars
and car derivatives from the 1978/79 survey can be broadly
described by:-
Means : 90 to 100 km/h
85th Percentiles: 100 to 110 km/h
for mainland Australia (Table IV, Fig.l), although there is
considerable variation in the data. There appears to be no
meaningful relationship (correlation) between these free speed
parameters and the speed limit values.

69.
The study finds that a suitable absolute speed limit for
Australia would be 130 or 110 km/h, 2nd that there appears to be
no clear advantage for either level, for daytime operation. Of
the two, the preferred limit is 110 km/h, as it is representative
of current free speeds of most cars in mainland States, would
probably not adversely affect current rural safety, would command
the respect of most car drivers for this speed limit (and other
speed limits determined by current speed zoning practice) and
could be realistically enforced, i.e. with minimal tolerances.
Differential limits for Australian rural roads vary from
seven types in Victoria to none in Queensland: three differential
limits are included in the Code provisions (Table I).
The study examines differential limits for four vehicle
classes - heavy trucks, omnib,uses, vehicles-towing and motorcycles with passengers - and recommends 90 km/h limits for the first three and no differential limit for motorcycles with passengers.
In addition, a 90 km/h differential limit is suggested for night-
time operation, although this requires further research. In all
cases, these recommendations are conditional upon 110 km/h being
selected as the (daytime) general traffic limit. Indeed, it is
considered that if 100 km/h is selected as the general traffic
limit instead, there would be little justification for imposing
any differential limits - which is the situation in Queensland - although a possible exception concerns heavy trucks, where the
evidence supporting a 90 km/h limit is substantial.
The recommended rural speed limits for the Code are summarised
below as (1) preferred limits, based upon selection of a 110 km/h
general limit, and (2) alternative limits, based upon 100 km/h

70.
being selected instead. Current Code figures are shown for
comparison. All units are km/h.
VEHICLE CLASS OR i PREFERRED ALTERNATIVE ENVIRONMENTAL CONDITION j
! LIMITS LIMITS ~~
General Traffic 110 100
Heavy Trucks 90 90 or 100
Omnibuses j 90 100
Towed Caravans/Trailers ~ 90 100
Night-Time Driving ! 90 100 (subject to research) ~
l !
I
F 1 i l I I I l
LIMITS CODE
110
80
90 80
-
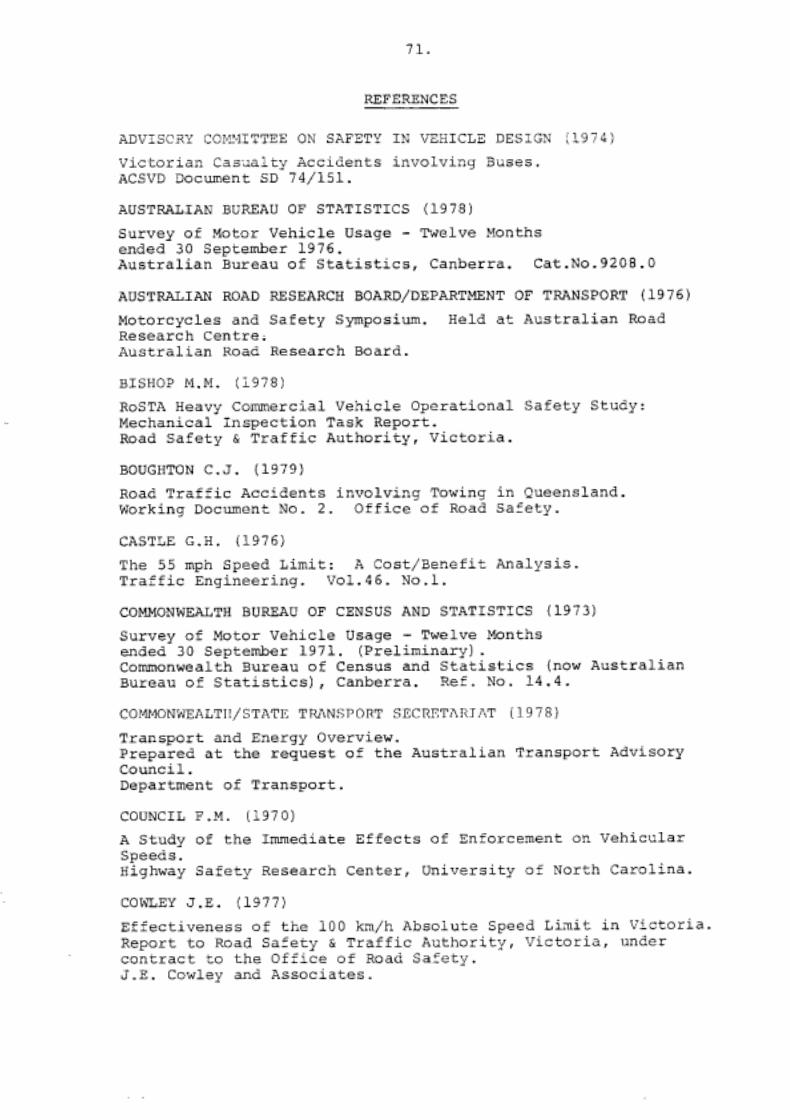
71.
REFERENCES
ADVISC3Y COE4ITTEE ON SAFETY IN VEBICLE DESIGN (1974)
ACSVD Document SD 74/151. Victorian Cas-Jalty Accidents involving 3uses.
AUSTRALIAN BUREAU OF STATISTICS (1978) Survey of Motor Vehicle Usage - Twelve Eonths ended 30 September 1976. Australian Bureau of Statistics, Canberra. Cat.No.9208.0
AUSTRALIAN ROAD RESEARCH BOARD/DEPARTMENT OF TRANSPORT (1976) Motorcycles and Safety Symposium. Held at Australian Road
Australian Road Research Board. Research Centre;
BISHOP M.M. (i378) RoSTA Heavy Commercial Vehicle Operational Safety Study: Mechanical Inspection Task Report. Road Safety L Traffic Authority, Victoria.
BOUGHTON C.J. (1979)
Road Traffic Accidents involving Towing in Queensland. Working Document No. 2. Office of Road Safety.
CASTLE G.H. (1976)
The 55 mph Speed Limit: A Cost/aenefit Analysis. Traffic Engineering. Vo1.46. No.1.
COMMONWEALTH BUREAU OF CENSUS AND STATISTICS (1973) Survey of Motor Vehicle Usage - Twelve Months Commonwealth Bureau of Census and Statistics (now Australian ended 30 September 1971. (Preliminary).
Bureau of Statistics), Canberra. Ref. No. 14.4.
COMMONWEALTI!/STATE TRANSPORT SECRETARIAT (1~978) Transport and Energy Overview. Prepared at the request of the Australian Transport Advisory Council. Department of Transport.
COUNCIL F.M. (1970) A Study of the Immediate Effects of Enforcement on Vehicular
Highway Safety Research Center, University of North Carolina. Speeds.
COWLEY J.E. (1377)
Effectiveness of the 100 km/h Absolute Speed Linit in Victoria. Report to Road Safety & Traffic Authority, Victoria, under contract to the Office of Road Safety. J.E. Cowley and Associates.
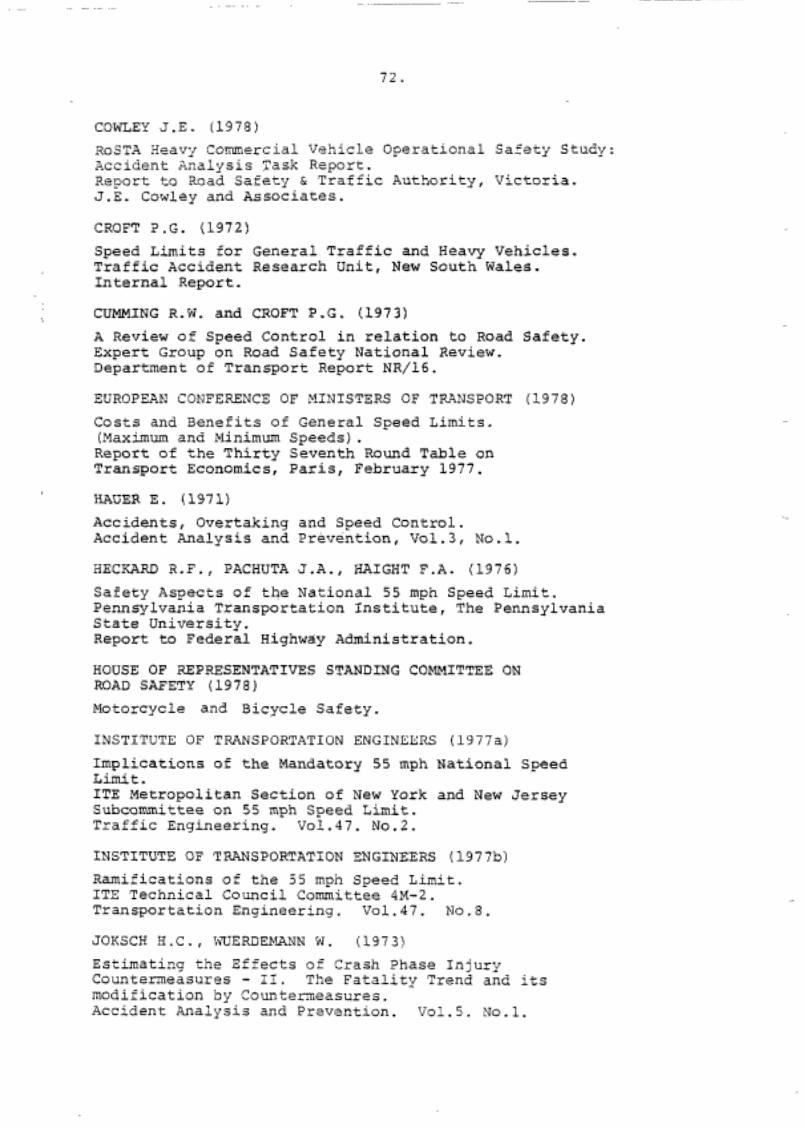
72.
COWLEY J.E. (1978) RoSTA Heavy Com.ercia1 Vehicle Operational Safety Study: Accident Analysis Task Report.
J.E. Cowley and Associates. Report to Road Safety & Traffic Authority, Victoria.
CROFT P.G. (1972) Speed Limits for General Traffic and Heavy Vehicles. Traffic Accident Research Unit, New South Wales. Internal Report.
CUMMING R.W. and CROFT P.G. (1973) A Review of Speed Control in relation to Road Safety Expert Group on Road Safety National Review. Department of Transport Report NR/16.
EUROPEAN CONFERENCE OF MINISTERS OF TRANSPORT (1978) Costs and Benefits of General Speed Limits. (Maximum and Minimum Speeds) . Report of the Thirty Seventh Round Table on Transport Economics, Paris, February 1977.
HAUER E. (1971) Accidents, Overtaking and Speed Control. Accident Analysis and Prevention, Vo1.3, No.1.
HECKARD R.F., PACHUTA J.A., HAIGHT F.A. (1976) Safety Aspects of the National 55 mph Speed Limit. Pennsylvania Transportation Institute, The Pennsylvania State University. Report to Federal Highway Administration.
HOUSE OF REPRESENTATIVES STANDING COMMITTEE ON ROAD SAFETY (1978) Motorcycle and Bicycle Safety.
INSTITUTE OF TRANSPORTATION ENGINEERS (1977a) Implications of the Mandatory 55 mph National Speed Limit . ITE Metropolitan Section of New York and New Jersey Subcommittee on 55 mph Speed Limit. Traffic Engineering. Vo1.47. No.2.
INSTITUTE OF TRANSPORTATION ENGINEEXS (197713) Ramifications of the 55 mph Speed Limit. ITE Technical Council Committee 4M-2. Transportation Engineering. Vo1.47. No.8.
JOKSCH H.C., WERDEMANN W. (1973) Estimating the Effects of Crash Phase Injury Countermeasures - 11. The Fatality Trend and its modification by Countermeasures. Accident Analysis and Prevention. Vol.5. ~0.1.

73
JOSCELYN K.B. ET AL (1970) Maximum Speed Limits. Vol. I - A Study for the Selection of Maximm Speed Lin5ts. Prepared for National Highway Traffic Safety Administration, InstiLute for Research in Public Safety, Indiana University.
Washington.
MacKAY J.G. (1978) RoSTA Heavy Commercial Vehicle Operational Safety Study: Vehicle Braking Task Report. Report to Road Safety & Traffic Authority, Victoria. Bellmy-MacKay Associates.
McLEAN J.R. (1978) Observed Speed Distributions and Rural Road Traffic Operations. Australian iioad Research Board. Ninth Conference.
MESSITER G.F. (1971) Speed Limits for Heavy Vehicles. Traffic Accident Research Unit, New South Wales. Internal Report.
MINISTRY OF TRANSPORT (1968) HOW Fast? A Paper for Discussion. Her Majesty's Stationery Office, London.
NATIONAL COMMITTEE OK UNIFOW~I TRAFFIC LAWS AND ORDINANCE (1968) Uniform Vehicle Code. TheMitchieCompany, Charlottesville, Virginia.
NATIONAL HIGHWAY SAFETY BUREAU (1969) Maximum Safe Speed for Motor Vehicles, Federal Highway Administration, washington.
NATIONAL HIGHWAY TRAFFIC SAFETY ADMINISTMTION !1976)
Federal Highway Administration, Washington. 55 mph Fact Book.
NEWBY R.F. (1970)
Notorways. Effectiveness of Speed Limits on Rural Roads and
Engineering. Rotterdam. 10th International Study Week in Trafcic and Safety
NILSSON G., ROOSlYARK P. 11977) Objectives and Criteria for Speed Limit Systems. National Road & Traffic Research Iastitute, Sweden. Report No. 116A.
OFFICE OF ROAD SAFETY (1979) Survey of Rural Speeds in Australia. Working Document 110.4. Office of Road Safety.

PEARSON R.A. (1978) RoSTA Heavy Comnercial Vehicle Operational Safety Study. General Requirements Task Report.
Country RDads Board, Victoria. Repurt to Road Safety & Traffic Authority, Victoria.
PAX POY (1971) Report on Truck and Bus Accidents - Victoria. P.G. Pak Poy & Associates. Report 71/40.
REXNFURT D.W., LEVINE D.N., SOHNSON W.D. (1973) Radar as a Speed Deterrent: An Evaluation. Highway Safety Research Center. University of North Carolina.
RESEARCH TRIANGLE INSTITUTE (1970) Speed and Accidents. Research Triangle Institute. Durham, North Carolina. Prepared for National Highway Safety Bureau, Washington.
ROSTA (1978) RoSTA Heavy Commercial Vehicle Operational Safety Study: Summary and Recommendations Report. Report to Road Safety & Traffic Authority, Victoria.
SOLOMON D. (1964) Accidents on Main Rural Highways related to Speed, Driver and Vehicle. Bureau of Public Roads, Washington.
THOMPSON J.E. (1978)
Comprehensive Final Report. RoSTA Heavy Commercial Vehicle Operational Safety Study:
Wilbur Smith & Associates. Report to Road Safety & Traffic Authority, Victoria.
THOMPSON T.W. (1978)
RoSTA Heavy Commercial Vehicle Operational Safety Study: Vehicle Speeds Task Report. Report to Road Safety & Traffic Authority, Victoria. Wilbur Smith & Associates.
VAUGHAN R.G. (1974)
Traffic Accident Research Unit, New South Wales. Caravans in Traffic Crashes.
Report 5/74.
VAUGHAN R.J. (1970)
Australian Road Research, Vo1.4, No.3. Speed and Accidents on Rural Roads.
VICTORIAN PARLIAMENTARY JOINT SELECT COI"IM1TTEE ON ROAD SAFETY (1971) Absolute Speed Limits, Prima Facie Speed Limits and Speed Zones. Zighth Progress Report.

WOOD H.T. (1978)
RoSTA Heavy Commercial Vehicle Operational Safety- Study: Driver Related Features Task Report. Road Safety & Traffic Authority, Victoria.
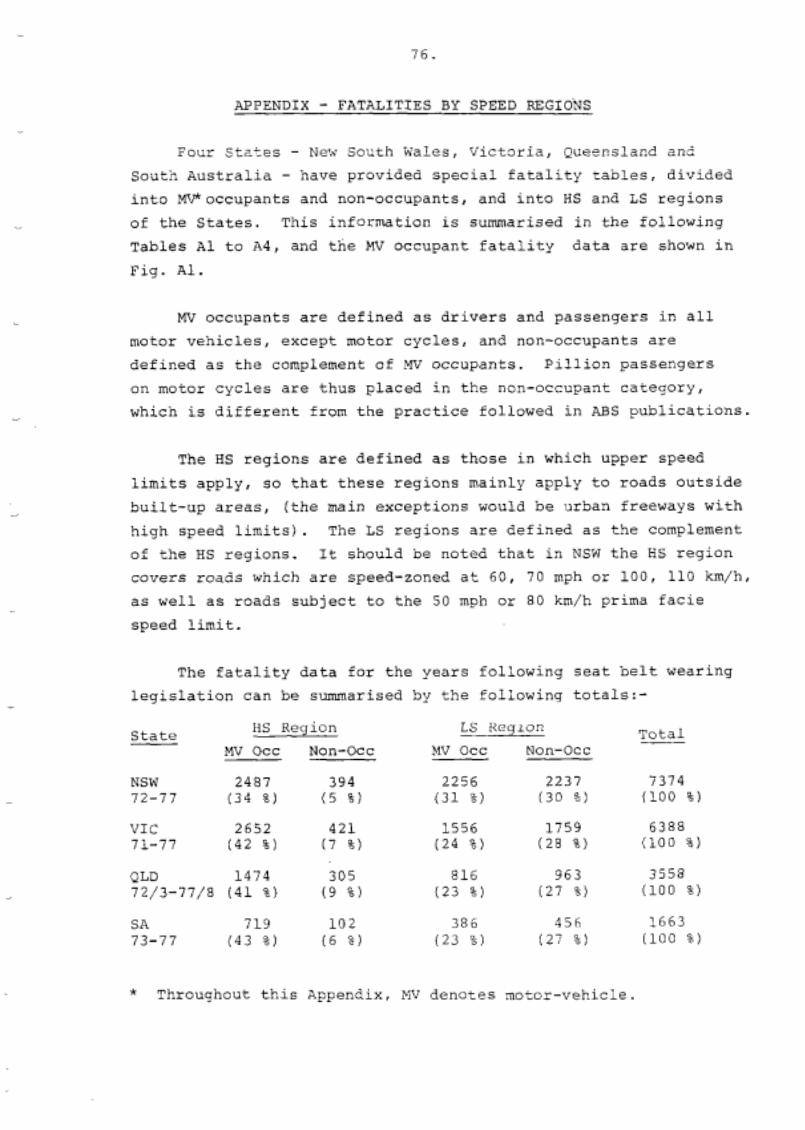
76.
AE'PENDIX - FATALITIES BY SPEED REGIONS Four Stztes - New South Wales, Victoria, Qtieensland an<
South Australia - have provided special fatality tables, divided into MVoccupants and non-occupants, and into HS and LS regions of the States. This information is summarised in the following Tables A1 to A4, and the MV occupant fatality data are shown in Fig. Al.
MV occupants are defined as drivers and passengers in all motor vehicles, except motor cycles, and non-occupants are defined as the complement of "V occupants. Pillion passengers on motor cycles are thus placed in the non-occupant category, which is different from the practice followed in ABS publications.
The HS regions are defined as those in which upper speed limits apply, so that these regions mainly apply to roads outside built-up areas, (the main exceptions would be urban freeways with high speed limits). The LS regions are defined as the complement of the HS regions. It should be noted that in NSW the HS region covers roads which are speed-zoned at 60, 70 mph or 100, 110 km/h, as well as roads subject to the 50 mph or 80 km/h prima facie speed limit
The fatality data for the years following seat belt wearing legislation can be summarised by the following totals:-
State EIS Region Ls IiegLOR Total - __ MU Occ Non-Occ MV Occ Non-Occ
394 2256 2231 7374 5 9) (31 %) (30 %) (100 %)
7 9) (24 %) (28 %) (100 %)
9 %) (23 %) (27 %) (100 %)
10 2 38 6 456 1663
421 1556 1759 6388
305 816 963 3558
73-77 (43 %) (6 %) (23 %) (27 9) (100 %)
* Throughout this Appendix, MV denotes motor-vehicle.

77
The fatality patterns for Victoria, Queensland and SA are reasonably consistent, whereas that for NSW differs by having sinilar nmbers =f W J occupant fatalities in both EIS and LS regions.
Possible reasons for the similarities and differences between these States would include geographical and demographical factors, as well as road and traffic factors, and further research would be necessary to establish relationships between such factors and these fatality patterns.
It is of interest to note that NSW, which recorded the highest rural free speeds in the recent ACRUPTC Survey (Fig. l), appears to have the lowest proportion of HS region fatalities amongst Mv occupants. One therefore questions whether current rural free speeds (and rural speed limits) have an appreciable effect on road-traffic fatality patterns, compared with other safety measures.

78.
TABLE A1 - FATALITY TAELES FOR NSW
- YEAR
1968
1969
1970
1971
1972
1973
- 1974
1975
1976
1977
3s REGION LS REGION
W occ Non-Occ Mv occ Non-Occ
436 (34)
48
(1)
362 350
455
(39)
321 351
440
(71)
47 ( 8 )
422 381
31 (3)
397 358
TOTAL
1196 *
1176 *
1290 *
1237 *
i
383 52 3 10 339 1084 *
1207 *
1266 *
1285 *
~~
1264
1268
SOURCE: TARU SPECIAL TABLES * Totals differ slightly from A B S Publications Figures in parentheses refer to rdral highways speed-zoned
HS Region figures also include those subject to the 50 mph or at 60, 70 mph or 100, 110 km/h (absolute limit), whereas
80 km/h prima facie limit.

TAB - L E A 2 - F ATA -
.~
79.
LITY TABLES FOR VICTOR1 - A
HS REGION LS REGION ~ ~ ~~~~~~ I
TOTAL Mv occ Non-Occ Mv occ Non-Occ I I
I 383 35 312 281
1 1 1011 I
l I t 1 1970 i 427 45 316 273 , ~ 1061
I ! l
l j
1971
! I 1972
i 1974 - i
I i
1 1976
1 1977
SOURCE :
362 47 254 260 ! ~ 923
413 45 192 265 i 915 ! ! 1 i
401 62 215 - 257 i 935
306 60 211 229 1 806
1
395 67 224 224 S 910 l
317 78 234 251 i 940 * 1 i
398 62 226 213 959 *
ABS(V1C) &VD RoSTA SPECIAL TABLES * Totals differ slightly from ABS Publications

80.
TABLE A3 - FATALITY TABLES FOR QUEENSLAND
I YEAR - ~ 1972/3
~ 1973/4 - ' 1974/5 !
! 1975/6
1977/8
HS REGION LS REGION i TOTAL ~
j
1 Mv occ Non-Occ Mv occ Non-Occ ~
l 268 55 139 16 3 i 625 j
I
256 53 13 0 164 1 603 j
249 42 131 16 1 ! ! 583 j
228 46 l55 171 j 600 i
251 55 128 153 : 587
222 54 133 151 1 560
SOURCE: ABS (QLD) SPECIAL TABLES
TABLE €4 - FATALITY TABLES FOR SA
YEAR ~
i HS REGION LS REGION TOTAL i I
I Mv occ Non-Occ *W occ Non-Occ I I l i ! 1973 I 145 21 80 93 ~
! I !
~ 329 j
23 86 104 ,' 382
1 1975 1 149 22 79 89 339 !
I j 1976 122 18 78 89 307 i
~ 1 1977 1 134 18 63 91 306 l I !
I SOURCE ; HIGHWAYS DETT. (SA) SPECIAL TABLES
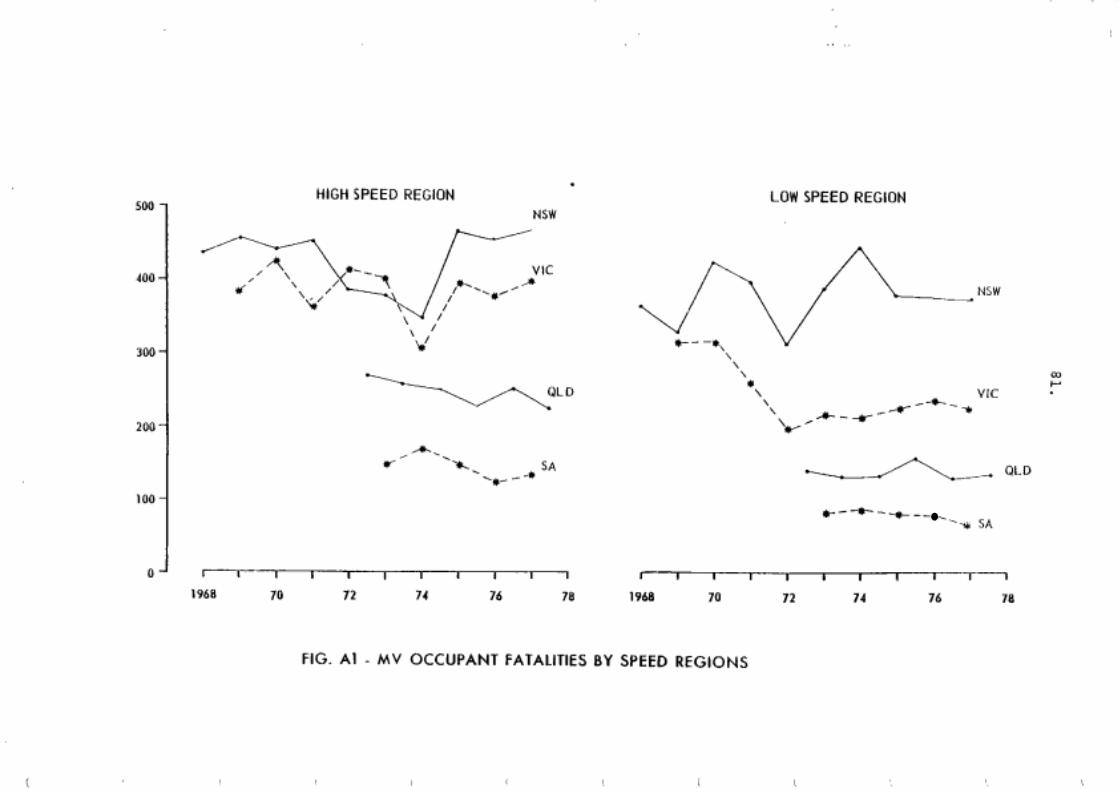
81.
0
J
I i l
c
a