Embed Size (px)
Citation preview
Citation: Heather, Nick and Honekopp, Johannes (2008) A revised edition of the readiness to change questionnaire (treatment version). Addiction Research & Theory, 16 (5). pp. 421-433. ISSN 1606-6359
Published by: Informa
URL: http://dx.doi.org/10.1080/16066350801900321 <http://dx.doi.org/10.1080/16066350801900321>
This version was downloaded from Northumbria Research Link: http://nrl.northumbria.ac.uk/149/
Northumbria University has developed Northumbria Research Link (NRL) to enable users to access the University’s research output. Copyright © and moral rights for items on NRL are retained by the individual author(s) and/or other copyright owners. Single copies of full items can be reproduced, displayed or performed, and given to third parties in any format or medium for personal research or study, educational, or not-for-profit purposes without prior permission or charge, provided the authors, title and full bibliographic details are given, as well as a hyperlink and/or URL to the original metadata page. The content must not be changed in any way. Full items must not be sold commercially in any format or medium without formal permission of the copyright holder. The full policy is available online: http://nrl.northumbria.ac.uk/policies.html
This document may differ from the final, published version of the research and has been made available online in accordance with publisher policies. To read and/or cite from the published version of the research, please visit the publisher’s website (a subscription may be required.)
A REVISED EDITION OF THE READINESS TO CHANGE
QUESTIONNAIRE [TREATMENT VERSION]
Nick Heather
&
Johannes Hönekopp
in collaboration with the UKATT Research Team
Division of Psychology,
School of Psychology & Sport Sciences,
Northumbria University,
Newcastle upon Tyne, UK
Running title: Revised RCQ[TV]
Correspondence concerning this article should be addressed to Nick Heather, Division
of Psychology, Northumbria University, Newcastle upon Tyne, NE1 8ST (tel: +44
191 227 4521; fax: +44 191 227 3190; email: [email protected])
2
Abstract
The UK Alcohol Treatment Trial provided an opportunity to examine the factor
structure of the Readiness to Change Questionnaire – Treatment Version (RCQ[TV])
in a large sample (N=742) of individuals in treatment for alcohol problems who were
given the RCQ[TV] at baseline, 3-months and 12-months follow-up. Confirmatory
factor analysis of the previously reported factor structure (5 items for each of
Precontemplation, Contemplation and Action scales) resulted in a relatively poor fit to
the data. Removal of one item from each of the scales resulted in a 12-item instrument
for which goodness-of-fit indices were improved, without loss of internal consistency
of the 3 scales, on all 3 measurement occasions. Inspection of relationships between
stage allocation by the new instrument and negative alcohol outcome expectancies
provided evidence of improved construct validity for the revised edition of the
RCQ[TV]. There was also a strong relationship between stage allocation at 3-months
follow-up and outcome of treatment at 12 months. The revised edition of the
RCQ[TV] offers researchers and clinicians a shorter and improved measurement of
stage of change in the alcohol treatment population.
Keywords: Alcohol problems/ Treatment/ Readiness to change/ Stages of change/
Transtheoretical Model/ RCQ[TV]
3
Introduction
Based on the Transtheoretical Model (Prochaska, DiClemente & Norcross, 1992), the
original Readiness to Change Questionnaire (RCQ: Rollnick et al., 1992) was
explicitly intended for use among hazardous and harmful drinkers not seeking
treatment for alcohol problems. However, because of inappropriate use of the RCQ in
treatment samples of drinkers with alcohol use disorders (see McMahon & Jones,
1996; Gavin, Sobell & Sobell, 1998), it was decided to develop an alternative version
of the instrument for measuring readiness to change in the alcohol treatment-seeking
population – the Readiness to Change Questionnaire [Treatment Version]: RCQ[TV].
One obvious difference between the two instruments is that relevant items in the
original RCQ refer only to reducing drinking whereas those in the RCQ[TV] refer
both to reducing drinking and abstaining from alcohol (see Heather et al., 1999).
The Transtheoretical Model, and in particular the concept of stages of change which
the RCQ[TV] seeks to measure, has been criticised in various ways (Davidson, 1992,
1998; Sutton, 1996, 2001; West, 2005). Despite these criticisms, however, the model
seems to have retained its popularity among researchers and practitioners in the
addictions field and elsewhere.
The development of the 15-item RCQ[TV] was described by Heather et al. (1999). In
the psychometric analysis it was not found possible to include Preparation or
Maintenance stages in the instrument and stage allocation was therefore confined to
Precontemplation (PC), Contemplation (C) and Action (A) stages, each assessed by
five items. The respondent’s highest score among the three scale scores was regarded
as the current stage of change, with ties being decided in favour of the stage farthest
4
along the change continuum. It was reasoned that the three stages of change in
question were those most relevant to clinical decision-making at the outset of
treatment. While measures of reliability and validity of the new instrument were
shown to be satisfactory for research and clinical purposes, it was noted that the
internal consistency of the C scale was relatively weak and that further research was
needed to strengthen it.
The present paper arises from an opportunity to conduct further analyses of the factor
structure of the RCQ[TV] among a large sample of drinkers attending for treatment in
the course of a multi-centre randomised, controlled trial of treatment for alcohol
problems - the United Kingdom Alcohol Treatment Trial (UKATT: UKATT
Research Team, 2001; 2005a,b). In this trial, the RCQ[TV] was given at baseline
assessment and also at 3- and 12-month follow-up assessments, thus affording the
opportunity to check any findings emerging from an analysis of baseline RCQ[TV]
data with those from follow-up data. The objectives of this analysis were: (i) to
determine whether the factor structure of the RCQ[TV] could be confirmed in a large
sample of problem drinkers in treatment; (ii) to see whether improvements to the
psychometric properties of the instrument could be made.
Method
Recruitment of participants
UKATT was a randomised, controlled trial of treatment for alcohol problems carried
out at seven treatment sites around Birmingham, Cardiff and Leeds. Two treatments
were compared: Social Behaviour and Network Therapy (SBNT), a novel treatment
developed for UKATT (Copello et al., 2002) and Motivational Enhancement Therapy
5
(MET), an established treatment, adapted from Miller et al. (2002), against which the
effectiveness and cost-effectiveness of SBNT were compared. The rationale and main
features of the trial are described in UKATT Research Team (2001), the main
treatment outcomes in UKATT Research Team (2005a) and the economic evaluation
in UKATT Research Team (2005b).
The main criterion for entry to this pragmatic trial was that a client seeking help for an
alcohol problem would normally have received an offer of treatment from the
treatment service in question. Clients were excluded if they: a) were under 16 years of
age, b) stated that alcohol was not the main problem for which help was being sought,
c) stated an intention to leave the area within the next year, d) were unable to name a
trace contact, e) suffered from an uncontrolled psychotic illness or severe cognitive
impairment; f) had poor English; g) were already receiving treatment for an alcohol
problem.
Assessment
All eligible clients took part in a Trial Entry Interview and a Pre-treatment
Assessment lasting together up to three hours. The RCQ[TV] was given as part of the
assessment, and was included both as a prognostic variable and to test a specific
hypothesis regarding matching of client characteristics to differential treatment effects
(see UKATT Research Team, 2001). Assessment also included interviewer-led
recording of socio-demographic information and alcohol consumption by means of
Form 90I (Miller, 1996) which permitted the calculation of the primary outcome
variables, percent days abstinent (PDA) to record frequency of drinking and drinks
per drinking day (DDD) to record intensity of drinking. The self-completion Alcohol
6
Problems Questionnaire (APQ: Drummond, 1990) was included as a measure of
alcohol-related problems and the Negative Alcohol Expectancy Questionnaire
(NAEQ: McMahon & Jones, 1993) as a measure of alcohol outcome expectancies.
The RCQ[TV], together with Form 90I, APQ, NAEQ and other instruments given at
baseline, was repeated at three- and 12-month follow-up points.
Results
Sample characteristics
Characteristics of the sample at baseline were given in UKATT Research Team
(2005a). Briefly, 742 clients entered the trial (MET = 422; SBNT = 320) of whom
74.1% were male and 95.6% of “White” ethnic origin. Mean age was 41.6 years (sd =
10.1). Ten per cent (10.0%) had a university degree or equivalent, 35.7% had no
qualifications of any kind, 34.8% were in full-time employment, and 54.1% were
either married and living with a partner, or single and in a current relationship. Mean
score on the Leeds Dependence Questionnaire (Raistrick et al., 1994) was 17.0 (95%
CI = 15.9-18.2), indicating a moderate to severe level of dependence in the sample as
a whole (see Heather et al., 2001). Mean score on the APQ was 12.3 (95% CI = 11.7-
=12.9), indicating a slightly above average level of alcohol-related problems for a
British treatment sample (Drummond, 1990).
Follow-up
Follow-up was carried out at three (open) and twelve months (blind) after entry to the
trial, with rates of successful contact of 93% and 83% respectively. This left 689
available for analysis at the 3-month follow-up point and 617 at the 12-month point.
7
Those lost to follow up at 12 months were younger (mean = 39.6 vs. 42.0 years, p =
0.02) and had higher APQ scores (mean = 12.0 vs. 10.9, p = 0.03) than those retained
for follow-up.
Confirmatory factor analysis
Baseline data: Using EQS 6.1, a confirmatory factor analysis on the baseline data was
run in an attempt to validate the three-factor structure of the RCQ[TV] described by
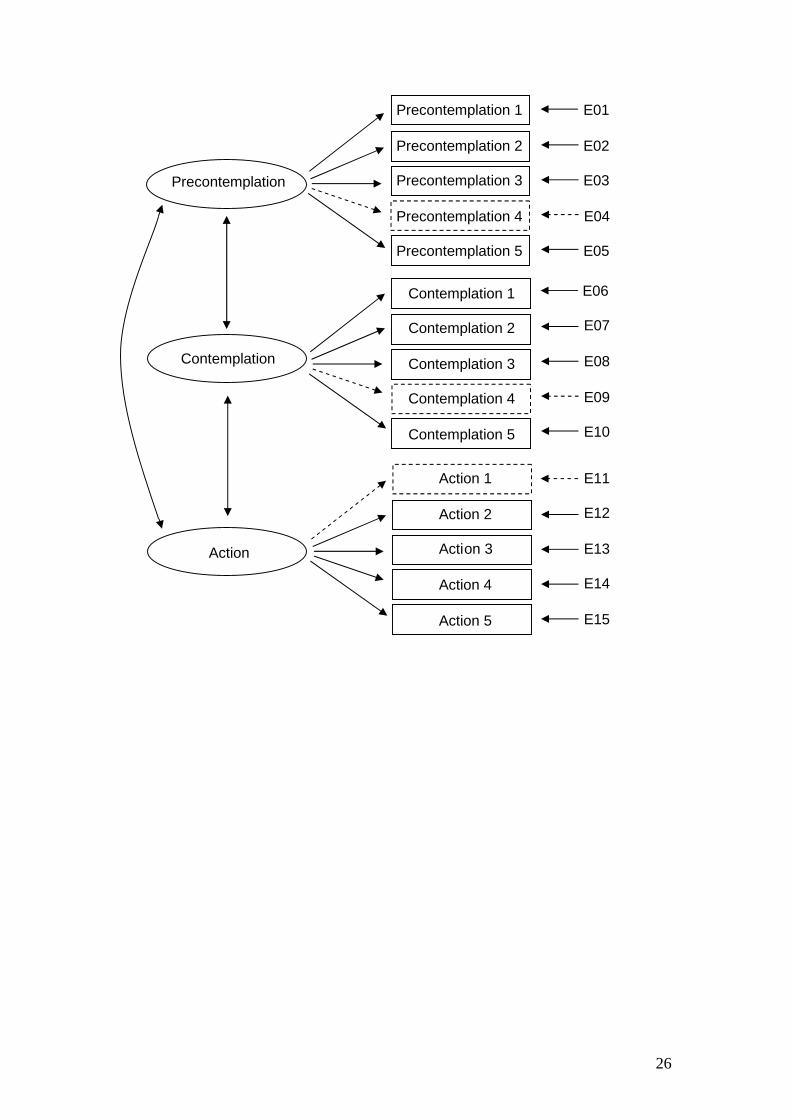
Heather et al. (1999) . The tested measurement model was defined such that each of
the three stages of change was measured by five items, each of which was assumed to
measure exclusively one stage, but scores for the three stages were free to correlate
with each other. Figure 1 depicts this measurement model (solid and dotted lines and
elements). The analysis was carried out on the 673 participants who provided
complete data at baseline (i.e. those with a score for each of the 15 RCQ[TV] items).
FIGURE 1 ABOUT HERE
All parameters could be estimated. The Comparative Fit Index (CFI) and the Root
Mean Square Error of Approximation (RMSEA) were used to judge the goodness-of-
fit of the model. The CFI reflects the increment of the tested model over the null
model (i.e., the model that specifies all relationships as zero) in reproducing the
empirical covariance matrix. CFI can take values from 0 to 1, and values of about .95
or larger are considered to represent a good fit (Byrne, 2006). RMSEA reflects lack of
fit per degree of freedom; values between .05 and .08 represent reasonable errors and
RMSEA < .05 is considered a good fit (Byrne, 2006). For our measurement model,
CFI = .899 and RMSEA = .067, which represents a rather poor fit. The resulting
reliabilities (Cronbach’s α) were .69 for the PC scale, .64 for the C scale and .84 for
the A scale.
8
One C item (“I am weighing up the advantages and disadvantages of my present
drinking habits”) tended to produce especially large residuals. Moreover, the loading
of this item on the factor was low (r = .28). Both findings suggest that this item was of
poor quality. The possibility was therefore investigated that a revised edition of the
RCQ[TV] that excluded this item might yield a better model fit. However, measuring
the three stages of change with different numbers of items (i.e., C with four items but
PC and A with five items each) would be undesirable because such an unbalanced
questionnaire would make it less convenient to assign a stage of change to any
participant when time was short. Thus, to examine the merits of a balanced 12-item
questionnaire (with four items for each stage of change), the factor loadings for the
PC and the A items were scrutinised and the item with the lowest loading was
dropped from each scale. This applied to the PC item, “Giving up or drinking less
alcohol would be pointless for me” (loading = .47) and to the A item, “I am trying to
stop drinking or drink less than I used to” (loading = .49). The resulting 12-item
questionnaire using the measurement model depicted in Figure 1 (solid lines and
elements only) was then tested.
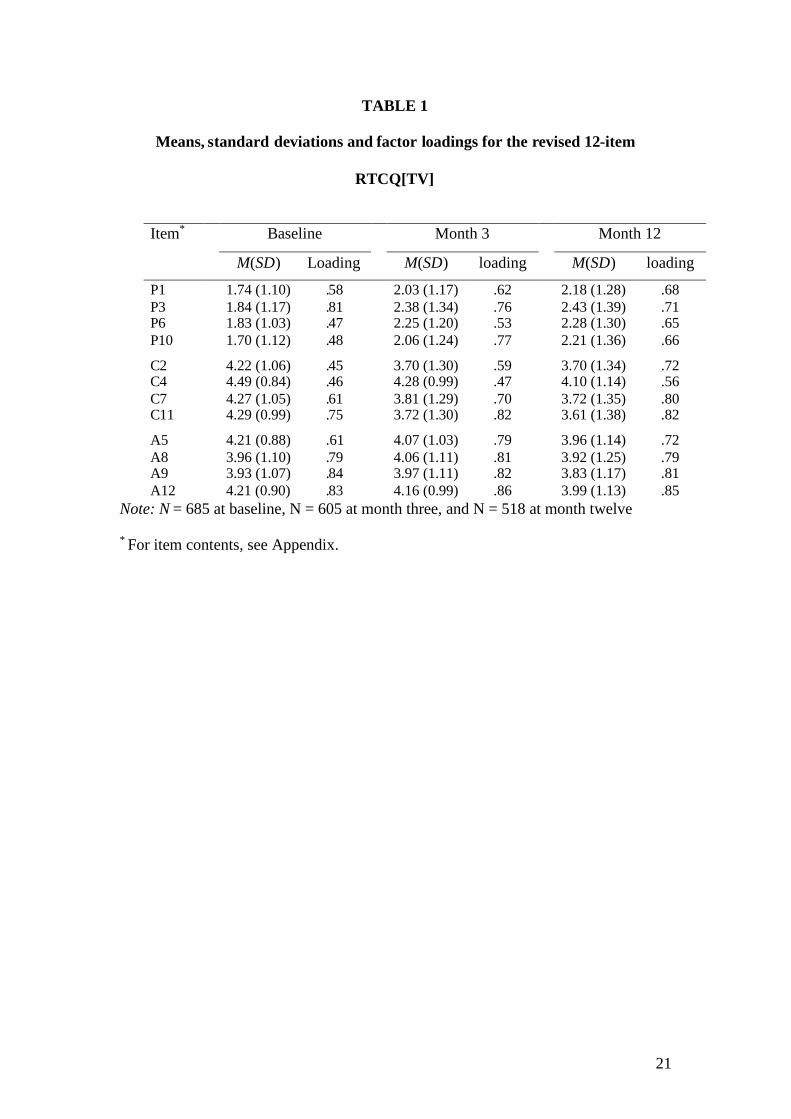
The analysis included 685 participants who had answered all 12 relevant items.
Again, all parameters could be estimated. The model fit proved to be good, with CFI
= .966 and RMSEA = .045. The reliabilities (Cronbach’s α) for the three scales were
.66 for PC, .66 for C, and .85 for A. Thus, overall the internal consistency of the 12-
item edition of the RCQ[TV] proved to be as high as that of the full 15-item
questionnaire. Descriptive statistics for the 12 items as well as the loading of each
9
item on its factor can be found in Table 1. The three stages of change correlated with
each other as follows: PC and C, r = -.45; PC and A, r = .00; C and A, r = .09.
TABLE 1 ABOUT HERE
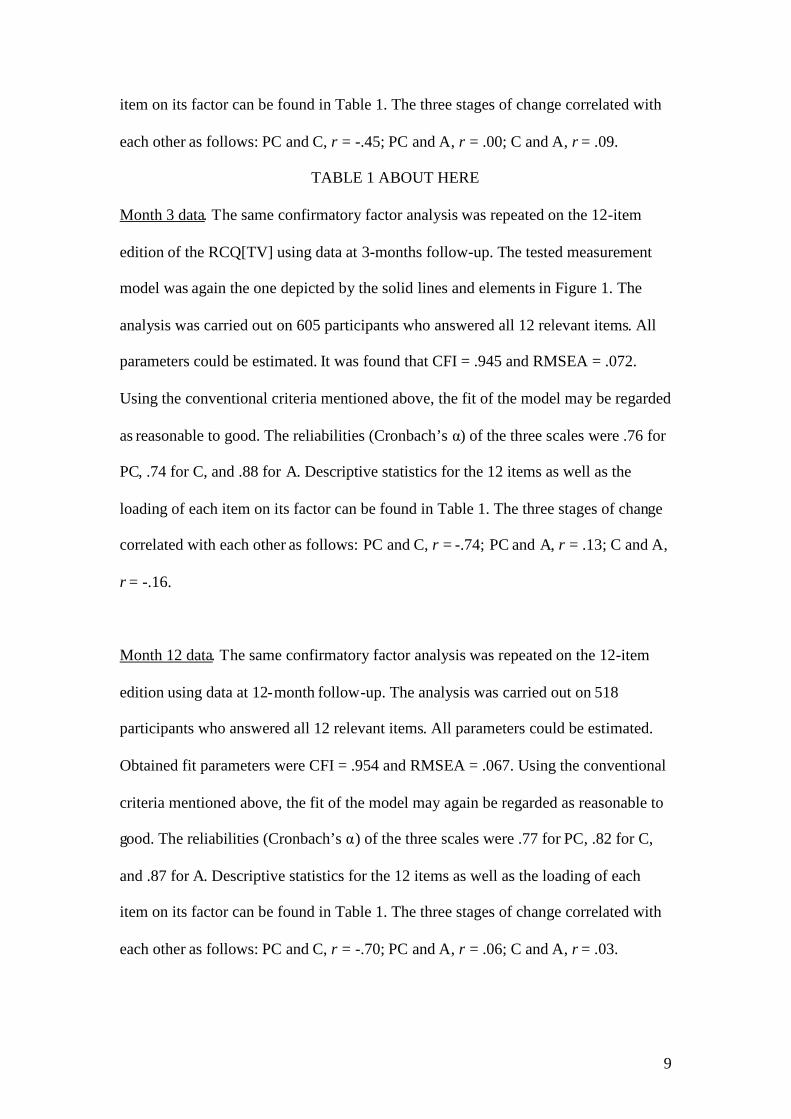
Month 3 data. The same confirmatory factor analysis was repeated on the 12-item
edition of the RCQ[TV] using data at 3-months follow-up. The tested measurement
model was again the one depicted by the solid lines and elements in Figure 1. The
analysis was carried out on 605 participants who answered all 12 relevant items. All
parameters could be estimated. It was found that CFI = .945 and RMSEA = .072.
Using the conventional criteria mentioned above, the fit of the model may be regarded
as reasonable to good. The reliabilities (Cronbach’s α) of the three scales were .76 for
PC, .74 for C, and .88 for A. Descriptive statistics for the 12 items as well as the
loading of each item on its factor can be found in Table 1. The three stages of change
correlated with each other as follows: PC and C, r = -.74; PC and A, r = .13; C and A,
r = -.16.
Month 12 data. The same confirmatory factor analysis was repeated on the 12-item
edition using data at 12-month follow-up. The analysis was carried out on 518
participants who answered all 12 relevant items. All parameters could be estimated.
Obtained fit parameters were CFI = .954 and RMSEA = .067. Using the conventional
criteria mentioned above, the fit of the model may again be regarded as reasonable to
good. The reliabilities (Cronbach’s α) of the three scales were .77 for PC, .82 for C,
and .87 for A. Descriptive statistics for the 12 items as well as the loading of each
item on its factor can be found in Table 1. The three stages of change correlated with
each other as follows: PC and C, r = -.70; PC and A, r = .06; C and A, r = .03.
10
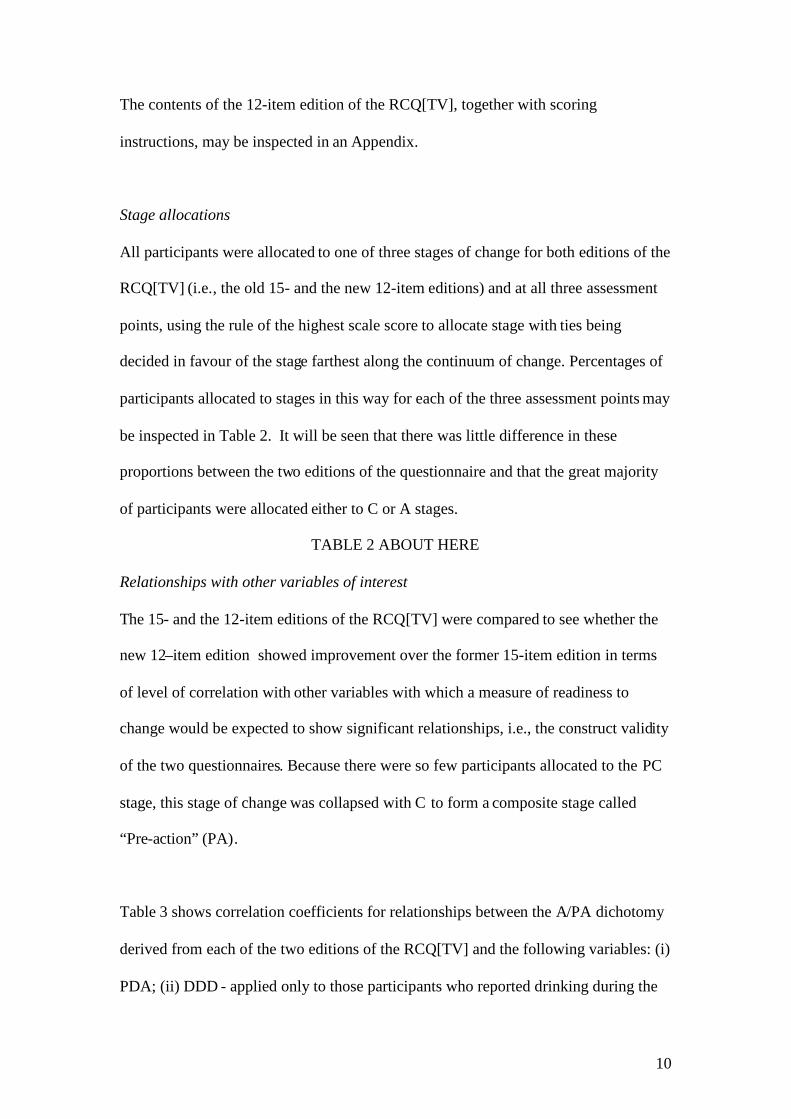
The contents of the 12-item edition of the RCQ[TV], together with scoring
instructions, may be inspected in an Appendix.
Stage allocations
All participants were allocated to one of three stages of change for both editions of the
RCQ[TV] (i.e., the old 15- and the new 12-item editions) and at all three assessment
points, using the rule of the highest scale score to allocate stage with ties being
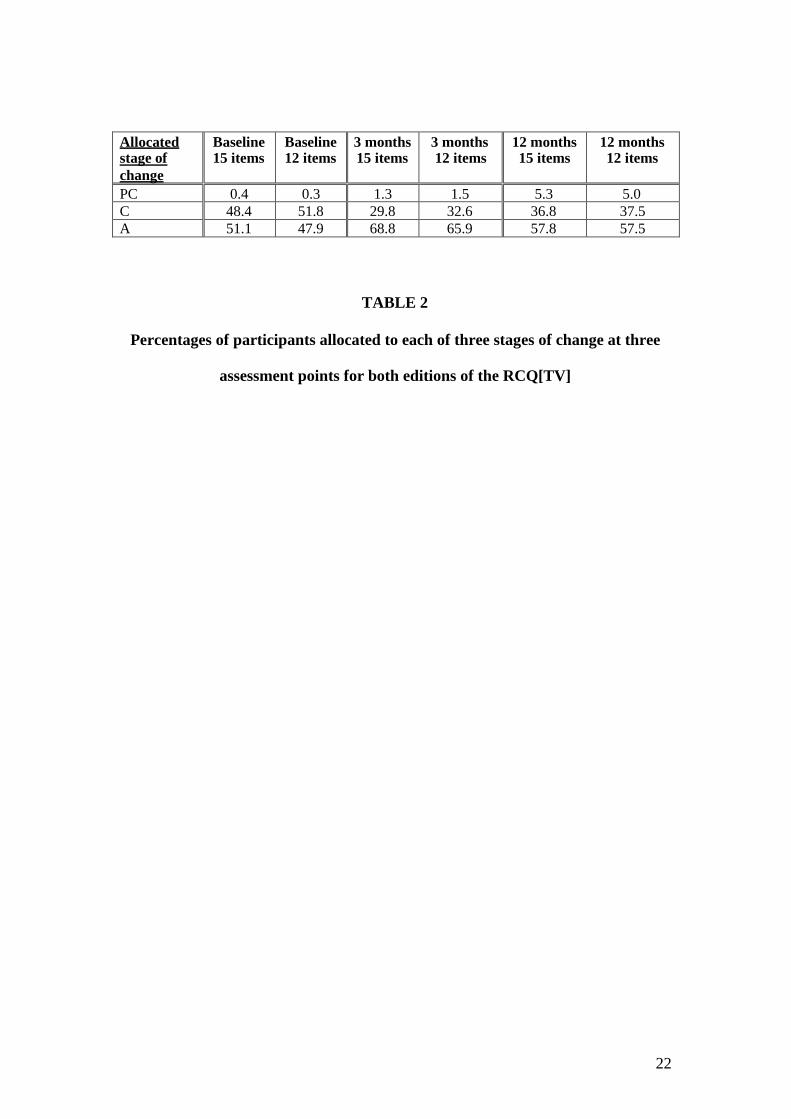
decided in favour of the stage farthest along the continuum of change. Percentages of
participants allocated to stages in this way for each of the three assessment points may
be inspected in Table 2. It will be seen that there was little difference in these
proportions between the two editions of the questionnaire and that the great majority
of participants were allocated either to C or A stages.
TABLE 2 ABOUT HERE
Relationships with other variables of interest
The 15- and the 12-item editions of the RCQ[TV] were compared to see whether the
new 12–item edition showed improvement over the former 15-item edition in terms
of level of correlation with other variables with which a measure of readiness to
change would be expected to show significant relationships, i.e., the construct validity
of the two questionnaires. Because there were so few participants allocated to the PC
stage, this stage of change was collapsed with C to form a composite stage called
“Pre-action” (PA).
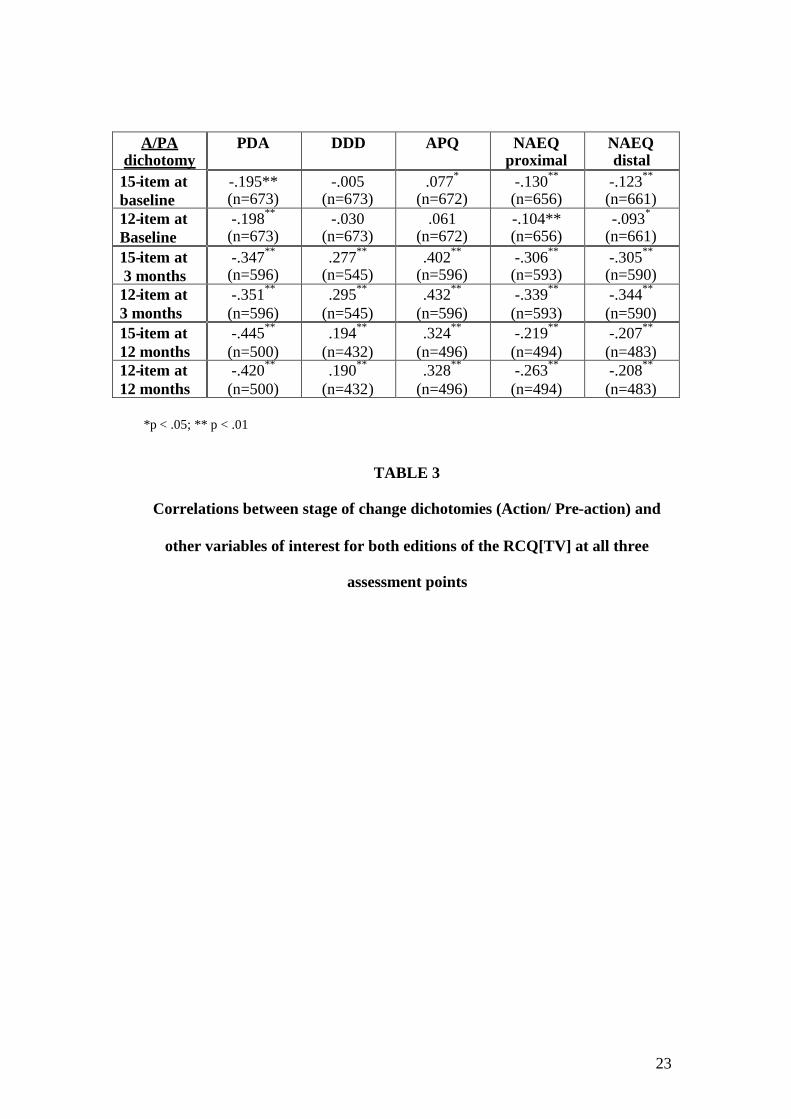
Table 3 shows correlation coefficients for relationships between the A/PA dichotomy
derived from each of the two editions of the RCQ[TV] and the following variables: (i)
PDA; (ii) DDD - applied only to those participants who reported drinking during the
11
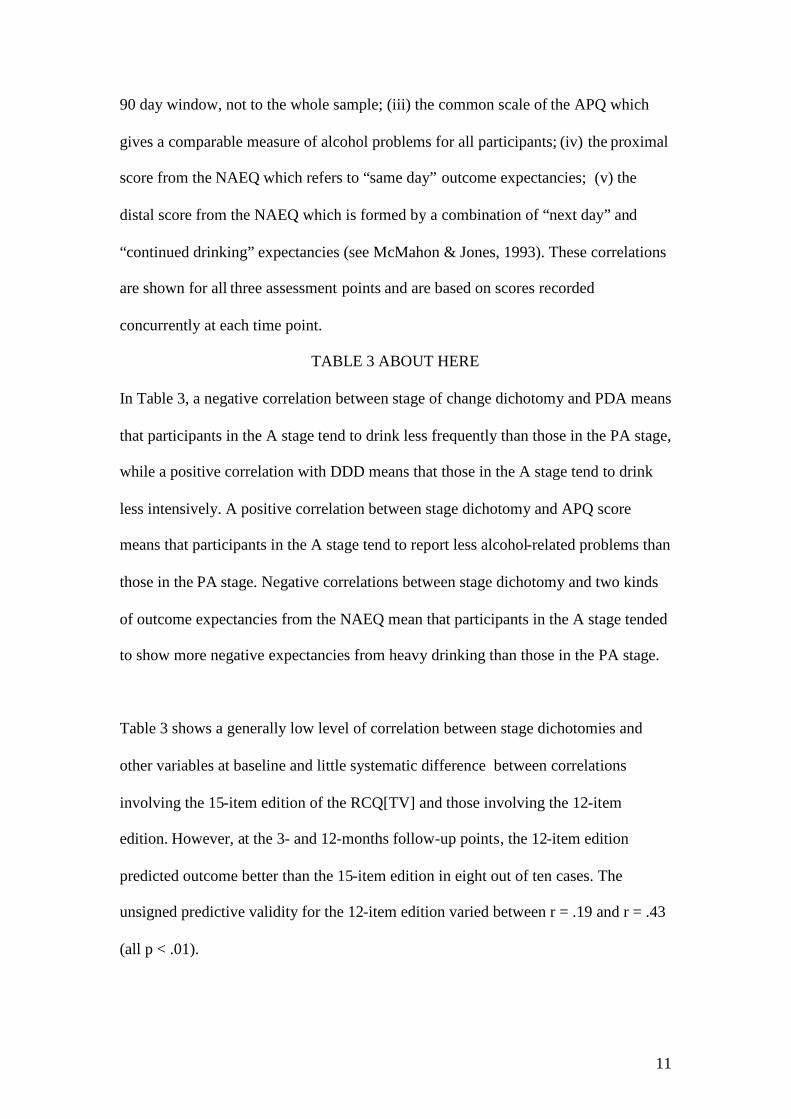
90 day window, not to the whole sample; (iii) the common scale of the APQ which
gives a comparable measure of alcohol problems for all participants; (iv) the proximal
score from the NAEQ which refers to “same day” outcome expectancies; (v) the
distal score from the NAEQ which is formed by a combination of “next day” and
“continued drinking” expectancies (see McMahon & Jones, 1993). These correlations
are shown for all three assessment points and are based on scores recorded
concurrently at each time point.
TABLE 3 ABOUT HERE
In Table 3, a negative correlation between stage of change dichotomy and PDA means
that participants in the A stage tend to drink less frequently than those in the PA stage,
while a positive correlation with DDD means that those in the A stage tend to drink
less intensively. A positive correlation between stage dichotomy and APQ score
means that participants in the A stage tend to report less alcohol-related problems than
those in the PA stage. Negative correlations between stage dichotomy and two kinds
of outcome expectancies from the NAEQ mean that participants in the A stage tended
to show more negative expectancies from heavy drinking than those in the PA stage.
Table 3 shows a generally low level of correlation between stage dichotomies and
other variables at baseline and little systematic difference between correlations
involving the 15-item edition of the RCQ[TV] and those involving the 12-item
edition. However, at the 3- and 12-months follow-up points, the 12-item edition
predicted outcome better than the 15-item edition in eight out of ten cases. The
unsigned predictive validity for the 12-item edition varied between r = .19 and r = .43
(all p < .01).
12
Pairs of correlations in Table 3 (i.e., correlations between the 15-item A/PA
dichotomy and variable x and between the 12-item A/PA dichotomy and variable x at
the same assessment point) were tested for the significance of the differences between
them. The only pairs to show a significant difference were those involving NAEQ
distal at the 3 month assessment (-.305 vs. -.344; t = -2.27, d.f.= 587, p = .023, 2-tailed)
and those involving NAEQ proximal at the 12-month assessment (-.219 vs. -.263; t =
-2.06, d.f. = 491, p = .0402-tailed). The difference between the pair of correlations
involving NAEQ proximal at 3-month assessment approached significance (-.306 vs.
.339; t = -1.89, d.f. = 590, p = .0602-tailed). In testing differences between the 15 pairs
of correlations shown in Table 3 there is a danger of spurious findings of significance
because of multiple testing. However, the fact that the only significant differences
found involved the NAEQ and that all differences between correlations involving the
NAEQ were in the same direction (i.e., suggesting a higher level of correlation for
stages of change derived from the revised 12-item edition of the RCQ[TV]) increases
confidence that these findings were not due to chance.
Relationships with treatment outcome
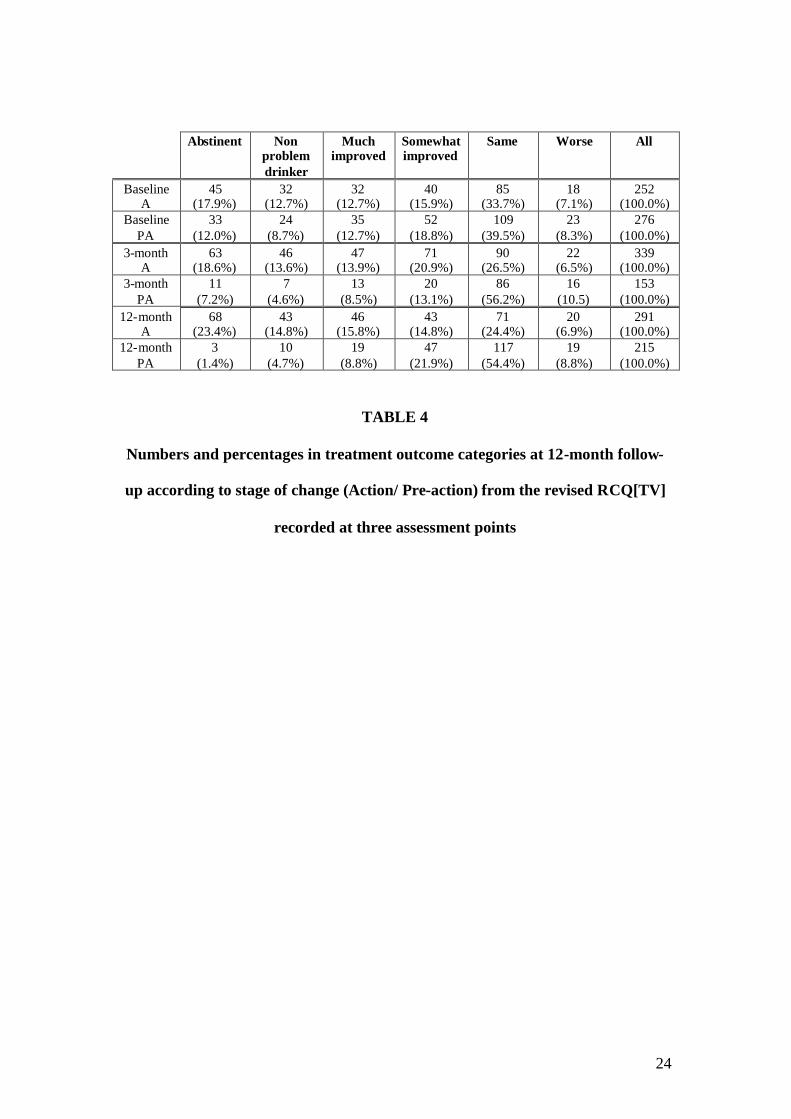
Table 4 shows numbers and percentages of clients classified into categories of
treatment outcome at 12-month follow-up according to whether they were allocated to
A or PA stages of change at baseline, 3-month follow-up and 12-month follow-up.
Outcome categories in Table 4 are based on a scheme developed by Heather and
Tebbutt (1989) focussing primarily on changes in the extent of alcohol-related
problems from treatment entry to follow-up. The categories making up this scheme
are: Abstinent - no alcohol consumption during the assessment window (i.e., 90 days);
Nonproblem Drinking – drinking within the window but with a score of zero on the
13
APQ; Much Improved – drinking together with a positive APQ score but with a
reduction on the APQ from baseline to follow-up of at least two-thirds; Somewhat
Improved – reduction in APQ score of one third or more but less than two-thirds;
Unimproved – reduction in APQ score of less than one third or increase in APQ score
of less than one third; Worse – increase in APQ score of more than one-third.
TABLE 4 ABOUT HERE
When the outcomes shown in Table 4 were coded from 6 (Abstinent) to 1 (Worse)
and the stages of change as 2 and 1 (A and PA, respectively), the relationship between
outcome and stage of change at baseline was r = .107 (p = .014), the same relationship
at 3-month assessment was r = .279 (p < .001), and at 12-month assessment was r =
.403 (p < .001). It is also noteworthy that, at both follow-up points, over 60% of
clients in the PA stage show no improvement over baseline alcohol problems.
Discussion
The first aim of this study was to determine whether the factor structure of the
RCQ[TV] described in the development of the instrument (Heather et al., 1999) could
be replicated in data from a larger sample of individuals undergoing treatment for
alcohol use disorders. In the course of doing so, a revised and shorter edition of the
questionnaire emerged that corrected a psychometric weakness of the previous edition
and improved on it in several other respects.
First, measures of goodness-of-fit of the 12-item edition were improved to a
satisfactory level. Although the internal consistencies of the three stage of change
scales (PC, C and A) in the baseline data were not improved in the 12-item compared
with the 15-item edition, the decrease in alpha that would normally be expected from
14
scales containing fewer items was not observed. The internal consistencies of the
three scales in the revised edition at 3-months and 12-months follow-up were all
above .7 and therefore good according to Nunnally (1978).
In terms of construct validity, it might be expected that clients who had reached the
Action stage of change would already have taken steps to reduce drinking and
alcohol-related problems, while those in Pre-action stages would be less likely to have
done so. Both editions of the RCQ[TV] showed significant relationships with PDA,
DDD and APQ scores in the expected direction, although these relationships were
much stronger in the 3-month and 12-month follow-up data than in the baseline data.
However, there appeared to be no systematic difference between the two editions of
the questionnaire in the overall level of correlation with alcohol consumption and
problem variables at baseline.
A stronger test of the construct validity of stage of change designation from the
RCQ[TV] is to examine relationships with outcome expectancies, since the
Transtheoretical Model must predict that individuals in the A stage of change would
have stronger expectations of benefits from quitting or reducing drinking than those in
PA stages. There is evidence that negative expectancies measured by the NAEQ are a
more reliable predictor of treatment outcome than measures of positive alcohol
expectancies (Jones & McMahon, 1998). In our data there were significant
correlations in the predicted direction between stages of change and concurrent
measures of negative alcohol expectancies. There was also a suggestion of a
significantly higher level of correlation with negative expectancies involving the
revised edition of the RCQ[TV] compared with the former edition. This represents
15
some evidence that the revised RCQ[TV] improves the construct validity of the
instrument compared with the 15-item edition.
With regard to the predictive ability of the revised questionnaire, and specifically its
ability to predict outcome of treatment at the 12-month follow-up, there was a weak
relationship between the stage of change dichotomy (A/PA) recorded at baseline and
outcome categories at follow-up (see Table 4). However, there were highly significant
relationships with outcome for the stage dichotomy recorded at 3- and 12-month
follow-ups (r = .28 and r = .40, respectively). While the concurrent prediction of
outcome from the 12-month stage of change might be expected, the prediction of
outcome from 3-month stage of change, which for those clients who completed
treatment coincided with the end of treatment, is further evidence of predictive
validity of the RCQ[TV]. The implications of these findings for understanding the
role of readiness to change in the process of treatment, together with an examination
of the stability of stage of change designations across time, will be explored
elsewhere.
Very few clients were allocated to the Precontemplation stage of change (see Table 2)
and for the purposes of analysis these clients were merged with those in the
Contemplation stage to form a new Pre-action category. It might then be asked why it
is necessary to persist with the Precontemplation stage in the measurement of
readiness to change in clinical samples, when confining categorisation to
Contemplation and Action stages would capture the great majority of clients in
treatment and arguably be more clinically meaningful. An 8-item scale constructed
along these lines would be easier for clients to complete and clinicians to compute.
16
There are at least three reasons why the retention of a Precontemplation stage is
necessary. First, there may be clinical samples where the proportion of clients in
Precontemplation would be substantially higher than in the UKATT sample, for
example, those in which more clients have been coerced into accepting treatment,
either by court order of more informally through pressure from relatives, employers or
others. Secondly, the presence of the Precontemplation stage in the RCQ[TV} permits
comparisons to be made with proportions of precontemplators assessed by the original
RCQ in non-clinical samples; although items in the two questionnaires are different,
such comparisons are nevertheless meaningful and potentially useful for research and
policy purposes. Thirdly, Table 2 shows that the proportion of the present sample
allocated to Precontemplation increased over time until it reached 5% (N=26) at the
12-month follow-up point. It may be that, for a few clients, the experience of
treatment led them to revise their initial view that they had an alcohol problem. The
implications of this findings will be discussed at greater length in another paper but
here it may merely be observed that this phenomenon would have been missed in the
analysis had omitted the Precontemplation stage.
A criticism of the Transtheoretical Model concerns the illegitimacy of regarding the
stages of change described in the model as true stages rather than as arbitrary
divisions on a continuum (Sutton, 1996, 2001; West, 2005). Budd and Rollnick
(1996), using structural equation modelling, adduced evidence purporting to show that
a dimensional model of readiness to change gives a better fit to relevant data than a
sequence of stages. The implications for this debate of the UKATT data on readiness
to change will be returned to in another paper. Meanwhile, a revised, shorter and
17
improved edition of the RCQ[TV] is now available to researchers and clinicians who
wish to apply stages of change to the treatment of alcohol problems.
Acknowledgements
The United Kingdom Alcohol Treatment Trial was funded by the Medical Research
Council (Project Grant G9700729). The authors are extremely grateful to all the
clients of alcohol treatment services who agreed to take part in the trial.
18
References
Budd, R., & Rollnick, S. (1996). The structure of the Readiness to Change
Questionnaire: a test of Prochaska and DiClemente's transtheoretical model.
British Journal of Health Psychology, 1, 365-376.
Byrne, B. (2006). Structural equation modelling with EQS. Mahwah, NJ: Lawrence
Erlbaum.
Copello, A., Orford, J., Hodgson, R., Tober, G., & Barrett, C. on behalf of the
UKATT Research Team (2002). Social behaviour and network therapy: basic
principles and early experiences. Addictive Behaviors, 27, 354-366.
Davidson, R. (1992). Prochaska and DiClemente's model of change: a case study?
British Journal of Addiction, 87, 821-822.
Davidson, R. (1998). The Transtheoretical Model: a critical overview. In W.R. Miller
& N. Heather (Eds.), Treating addictive behaviors (2nd ed., pp. 25-38). New
York: Plenum.
Drummond, D. C. (1990). The relationship between alcohol dependence and alcohol-
related problems in a clinical population. British Journal of Addiction, 85,
357-366.
Gavin, D., Sobell, L. C., & Sobell, M. (1998). Evaluation of the Readiness to Change
Questionnaire with problem drinkers in treatment. Journal of Substance
Abuse, 10, 53-58.
Heather, N., & Tebbutt, J. (1989). Definitions of nonabstinent and abstinent
categories in alcoholism treatment outcome classifications. Drug & Alcohol
Dependence, 24, 83-93.
19
Heather, N., Luce, A., Peck, D. Dunbar, B., & James, I. (1999). Development of a
treatment version of the Readiness to Change Questionnaire. Addiction
Research, 7, 63-68.
Heather, N., Raistrick, D., Tober, G., Godfrey, C., & Parrott, S. (2001). Leeds
Dependence Questionnaire: new data from a large sample of clinic attenders.
Addiction Research & Theory, 9, 253-269.
Jones, B.T., & McMahon, J. (1998). Alcohol motivations as outcome expectancies. In
W.R. Miller, & N. Heather, N. (Eds.), Treating addictive behaviors (2nd ed.,
pp. 75-92). New York: Plenum.
McMahon, J., & Jones, B. (1993). The Negative Alcohol Expectancy Questionnaire.
Journal of the Association of Nurses in Substance Abuse, 1, 12-17.
Miller, W.R. (1996). Form 90: A structured assessment interview for drinking and
related behaviors. Project MATCH Monograph Series, vol. 5. Rockville MD:
National Institute on Alcohol Abuse & Alcoholism.
Miller, W.R., Zweben, A., DiClemente, C., & Rychtarik, R. (1992). Motivational
Enhancement Therapy: A clinical research guide for therapists treating
individuals with alcohol abuse and dependence. Project MATCH Monograph
Series, vol. 2, DHHS Pub. No. (ADM) 92-1894. Washington DC: Department
of Health and Human Services.
Nunnally, J. (1978). Psychometric theory. New York: McGraw Hill.
Prochaska, J. O., DiClemente, C. C., & Norcross J. C. (1992). In search of how people
change: Applications to addictive behaviour. American Psychologist, 47,
1102-1114.
Raistrick, D., Bradshaw, J., Tober, G., Weiner, J., Allison, J., & Healey, C. (1994).
Development of the Leeds Dependence Questionnaire (LDQ): a
20
questionnaire to measure alcohol and opiate dependence in the context of a
treatment evaluation package. Addiction, 89, 563-572.
Rollnick, S., Heather, N., Gold, R., & Hall, W. (1992). Development of a short
'readiness to change' questionnaire for use in brief, opportunistic interventions
among excessive drinkers. British Journal of Addiction, 87, 743-754.
Sutton, S. (1996). Can 'stages of change' provide guidance in the treatment of
addictions? In G. Edwards & C. Dare (Eds.), Psychotherapy, psychological
treatments and the addictions (pp. 189-205). Cambridge UK: Cambridge
University Press.
Sutton, S. (2001). Back to the drawing board? A review of applications of the
transtheoretical model to substance use. Addiction, 96 (Special Issue: Theories
of Addiction), 175-186.
UKATT Research Team (2001). United Kingdom Alcohol Treatment Trial:
hypotheses, design and methods. Alcohol & Alcoholism, 36, 11-21.
UKATT Research Team (2005). Effectiveness of treatment for alcohol problems:
findings of the randomised UK Alcohol Treatment Trial (UKATT). British
Medical Journal, 351, 541-544.
UKATT Research Team (2005). Cost-effectiveness of treatment for alcohol problems:
findings of the randomised UK Alcohol Treatment Trial (UKATT). British
Medical Journal, 351, 544-548.
West, R. (2005). Time for a change: Putting the Transtheoretical (Stages of Change)
Model to rest. Addiction, 100, 1036-1039.
21
TABLE 1
Means, standard deviations and factor loadings for the revised 12-item
RTCQ[TV]
Item* Baseline Month 3 Month 12
M(SD) Loading M(SD) loading M(SD) loading
P1P3P6P10
C2C4C7C11
A5A8A9A12
1.74 (1.10)1.84 (1.17)1.83 (1.03)1.70 (1.12)
4.22 (1.06)4.49 (0.84)4.27 (1.05)4.29 (0.99)
4.21 (0.88)3.96 (1.10)3.93 (1.07)4.21 (0.90)
.58
.81
.47
.48
.45
.46
.61
.75
.61
.79
.84
.83
2.03 (1.17)2.38 (1.34)2.25 (1.20)2.06 (1.24)
3.70 (1.30)4.28 (0.99)3.81 (1.29)3.72 (1.30)
4.07 (1.03)4.06 (1.11)3.97 (1.11)4.16 (0.99)
.62
.76
.53
.77
.59
.47
.70
.82
.79
.81
.82
.86
2.18 (1.28)2.43 (1.39)2.28 (1.30)2.21 (1.36)
3.70 (1.34)4.10 (1.14)3.72 (1.35)3.61 (1.38)
3.96 (1.14)3.92 (1.25)3.83 (1.17)3.99 (1.13)
.68
.71
.65
.66
.72
.56
.80
.82
.72
.79
.81
.85Note: N = 685 at baseline, N = 605 at month three, and N = 518 at month twelve
* For item contents, see Appendix.
22
Allocatedstage ofchange
Baseline15 items
Baseline12 items
3 months15 items
3 months12 items
12 months15 items
12 months12 items
PC 0.4 0.3 1.3 1.5 5.3 5.0C 48.4 51.8 29.8 32.6 36.8 37.5A 51.1 47.9 68.8 65.9 57.8 57.5
TABLE 2
Percentages of participants allocated to each of three stages of change at three
assessment points for both editions of the RCQ[TV]
23
A/PAdichotomy
PDA DDD APQ NAEQproximal
NAEQdistal
15-item atbaseline
-.195**(n=673)
-.005(n=673)
.077*
(n=672)-.130**
(n=656)-.123**
(n=661)12-item atBaseline
-.198**
(n=673)-.030
(n=673).061
(n=672)-.104**(n=656)
-.093*
(n=661)15-item at3 months
-.347**
(n=596).277**
(n=545).402**
(n=596)-.306**
(n=593)-.305**
(n=590)12-item at3 months
-.351**
(n=596).295**
(n=545).432**
(n=596)-.339**
(n=593)-.344**
(n=590)15-item at12 months
-.445**
(n=500).194**
(n=432).324**
(n=496)-.219**
(n=494)-.207**
(n=483)12-item at12 months
-.420**
(n=500).190**
(n=432).328**
(n=496)-.263**
(n=494)-.208**
(n=483)
*p < .05; ** p < .01
TABLE 3
Correlations between stage of change dichotomies (Action/ Pre-action) and
other variables of interest for both editions of the RCQ[TV] at all three
assessment points
24
Abstinent Nonproblemdrinker
Muchimproved
Somewhatimproved
Same Worse All
BaselineA
45(17.9%)
32(12.7%)
32(12.7%)
40(15.9%)
85(33.7%)
18(7.1%)
252(100.0%)
BaselinePA
33(12.0%)
24(8.7%)
35(12.7%)
52(18.8%)
109(39.5%)
23(8.3%)
276(100.0%)
3-monthA
63(18.6%)
46(13.6%)
47(13.9%)
71(20.9%)
90(26.5%)
22(6.5%)
339(100.0%)
3-monthPA
11(7.2%)
7(4.6%)
13(8.5%)
20(13.1%)
86(56.2%)
16(10.5)
153(100.0%)
12-monthA
68(23.4%)
43(14.8%)
46(15.8%)
43(14.8%)
71(24.4%)
20(6.9%)
291(100.0%)
12-monthPA
3(1.4%)
10(4.7%)
19(8.8%)
47(21.9%)
117(54.4%)
19(8.8%)
215(100.0%)
TABLE 4
Numbers and percentages in treatment outcome categories at 12-month follow-
up according to stage of change (Action/ Pre-action) from the revised RCQ[TV]
recorded at three assessment points
25
FIGURE 1
Figure caption
Measurement model tested in the confirmatory factor analyses. Solid and dotted lines
and elements represent the model for the original 15-item version of the RTCQ[TV].
Solid lines and elements represent the model for the revised 12-item version.
26
Precontemplation
Contemplation
Action
Precontemplation 1 E01
Precontemplation 2 E02
Precontemplation 3 E03
Precontemplation 4 E04
Precontemplation 5 E05
E06
E07
E08
E09
E10
E11
E12
E13
E14
E15
Contemplation 1
Contemplation 2
Contemplation 3
Contemplation 4
Contemplation 5
Action 1
Action 2
Action 3
Action 4
Action 5
27
APPENDIX
Readiness to Change Questionnaire [Treatment Version]
Revised Edition 2007 (with scoring instructions)
28
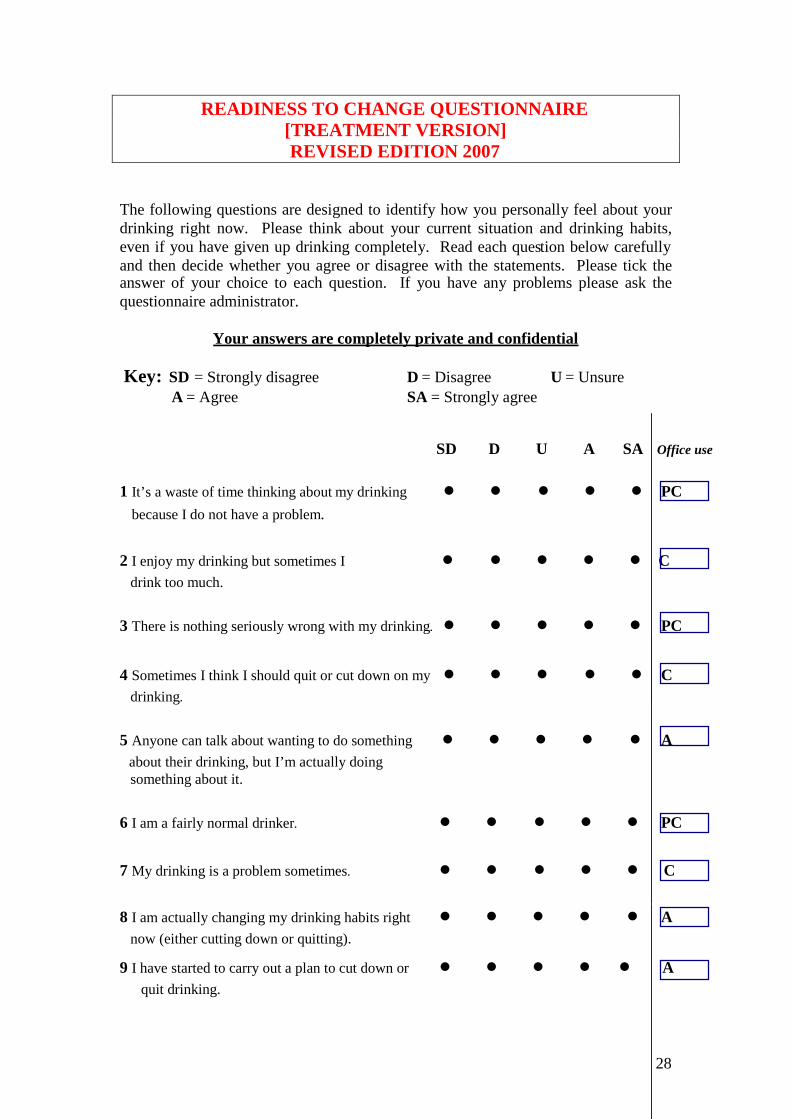
READINESS TO CHANGE QUESTIONNAIRE[TREATMENT VERSION]REVISED EDITION 2007
The following questions are designed to identify how you personally feel about yourdrinking right now. Please think about your current situation and drinking habits,even if you have given up drinking completely. Read each question below carefullyand then decide whether you agree or disagree with the statements. Please tick theanswer of your choice to each question. If you have any problems please ask thequestionnaire administrator.
Your answers are completely private and confidential
Key: SD = Strongly disagree D = Disagree U = UnsureA = Agree SA = Strongly agree
SD D U A SA Office use
1 It’s a waste of time thinking about my drinking • • • • • PCbecause I do not have a problem.
2 I enjoy my drinking but sometimes I • • • • • Cdrink too much.
3 There is nothing seriously wrong with my drinking. • • • • • PC
4 Sometimes I think I should quit or cut down on my • • • • • Cdrinking.
5 Anyone can talk about wanting to do something • • • • • Aabout their drinking, but I’m actually doingsomething about it.
6 I am a fairly normal drinker. • • • • • PC
7 My drinking is a problem sometimes. • • • • • C
8 I am actually changing my drinking habits right • • • • • Anow (either cutting down or quitting).
9 I have started to carry out a plan to cut down or • • • • • Aquit drinking.
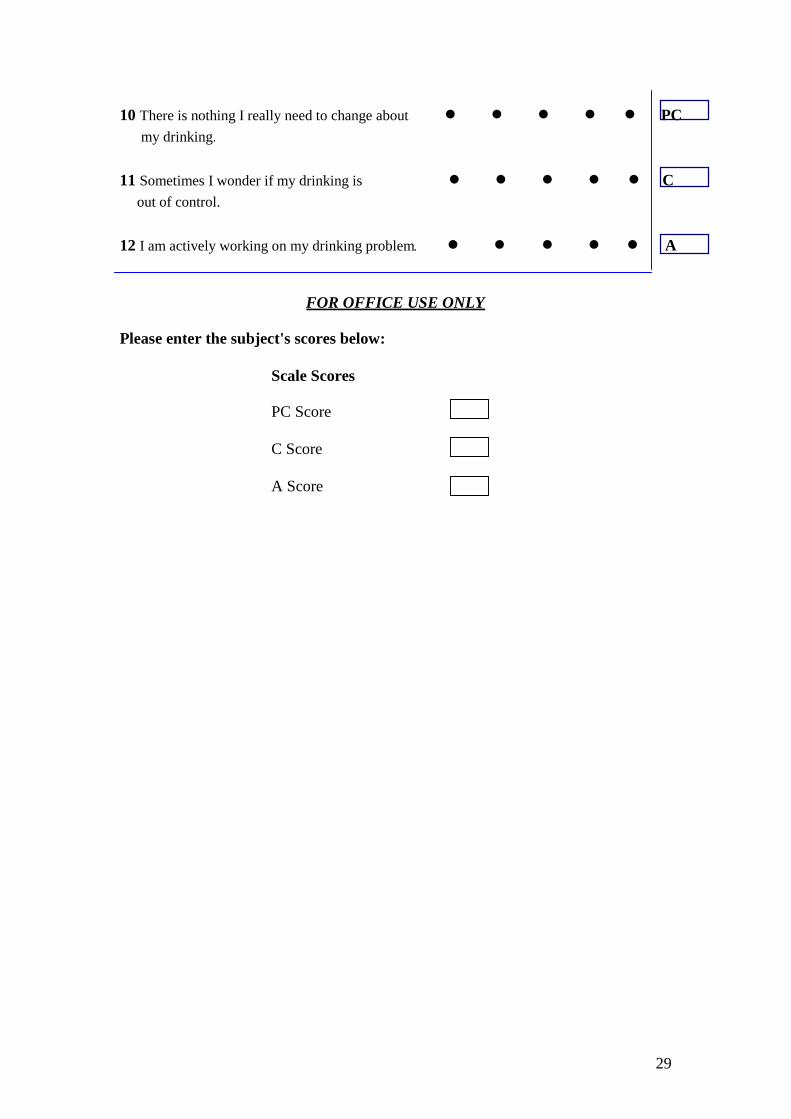
29
10 There is nothing I really need to change about • • • • • PCmy drinking.
11 Sometimes I wonder if my drinking is • • • • • Cout of control.
12 I am actively working on my drinking problem. • • • • • A
FOR OFFICE USE ONLY
Please enter the subject's scores below:
Scale Scores
PC Score
C Score
A Score
30
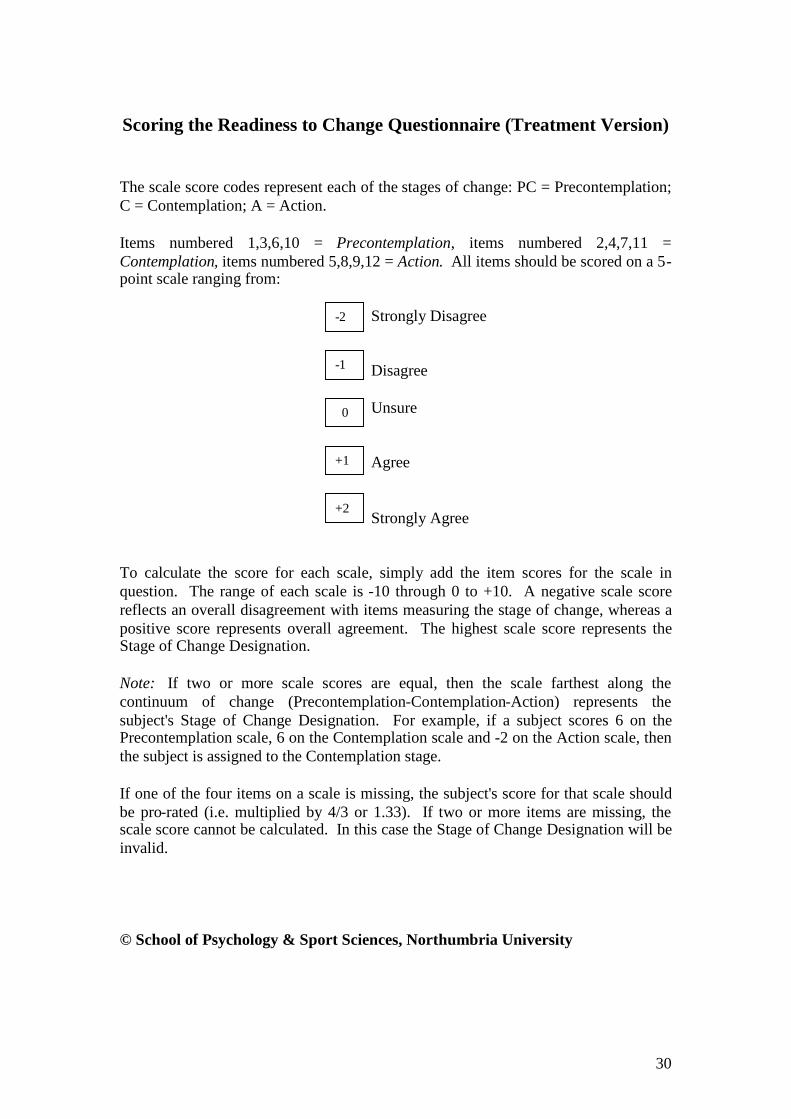
Scoring the Readiness to Change Questionnaire (Treatment Version)
The scale score codes represent each of the stages of change: PC = Precontemplation;C = Contemplation; A = Action.
Items numbered 1,3,6,10 = Precontemplation, items numbered 2,4,7,11 =Contemplation, items numbered 5,8,9,12 = Action. All items should be scored on a 5-point scale ranging from:
Strongly Disagree
Disagree
Unsure
Agree
Strongly Agree
To calculate the score for each scale, simply add the item scores for the scale inquestion. The range of each scale is -10 through 0 to +10. A negative scale scorereflects an overall disagreement with items measuring the stage of change, whereas apositive score represents overall agreement. The highest scale score represents theStage of Change Designation.
Note: If two or more scale scores are equal, then the scale farthest along thecontinuum of change (Precontemplation-Contemplation-Action) represents thesubject's Stage of Change Designation. For example, if a subject scores 6 on thePrecontemplation scale, 6 on the Contemplation scale and -2 on the Action scale, thenthe subject is assigned to the Contemplation stage.
If one of the four items on a scale is missing, the subject's score for that scale shouldbe pro-rated (i.e. multiplied by 4/3 or 1.33). If two or more items are missing, thescale score cannot be calculated. In this case the Stage of Change Designation will beinvalid.
© School of Psychology & Sport Sciences, Northumbria University
-2
-1
0
+1
+2


![Islam~ [Revised Edition]](https://img.pdfslide.net/doc/110x75/577cdf5a1a28ab9e78b1077c/islam-revised-edition.jpg)