Embed Size (px)
Citation preview
A Risk Management System
Founded on Quality Tools
Scott Laman
Teleflex, Inc.
Lehigh Valley ASQ Section March 20, 2014
Teleflex
• Corporate HQ – Limerick, PA
• 12,000 global employees
• In 130 countries
• Class I, II and III devices
• Businesses: Vascular, Respiratory,
Anesthesia, Urology, Dialysis, Surgical,
Cardiac
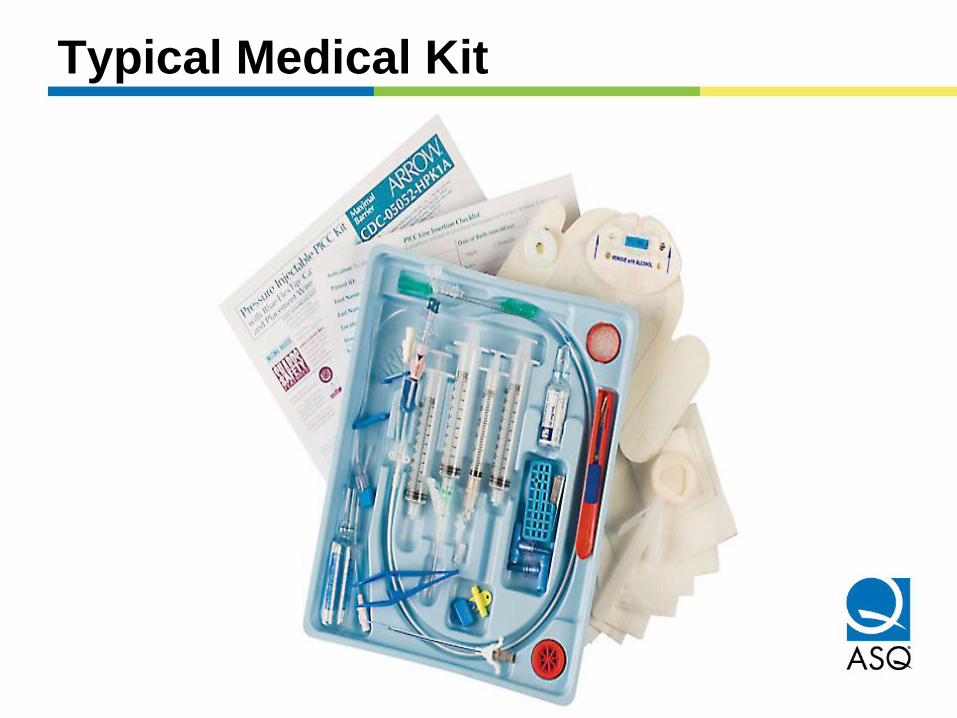
Typical Medical Kit
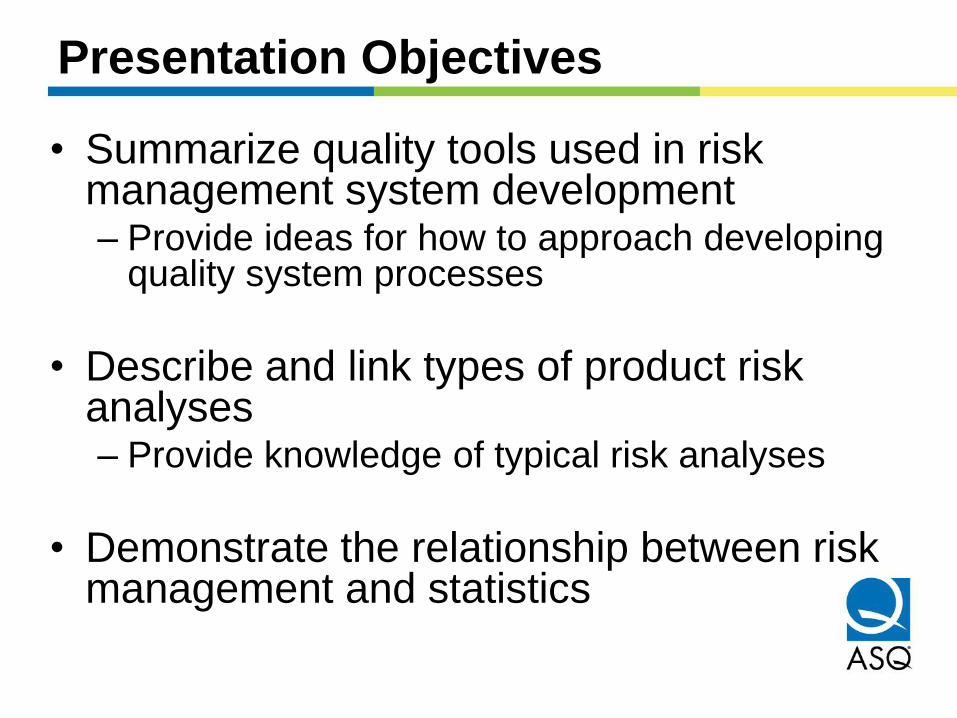
Presentation Objectives
• Summarize quality tools used in risk management system development – Provide ideas for how to approach developing
quality system processes
• Describe and link types of product risk analyses – Provide knowledge of typical risk analyses
• Demonstrate the relationship between risk management and statistics
Example of Risk Management
• What is the highest-risk
animal in Pennsylvania?
• How do you evaluate
risk?
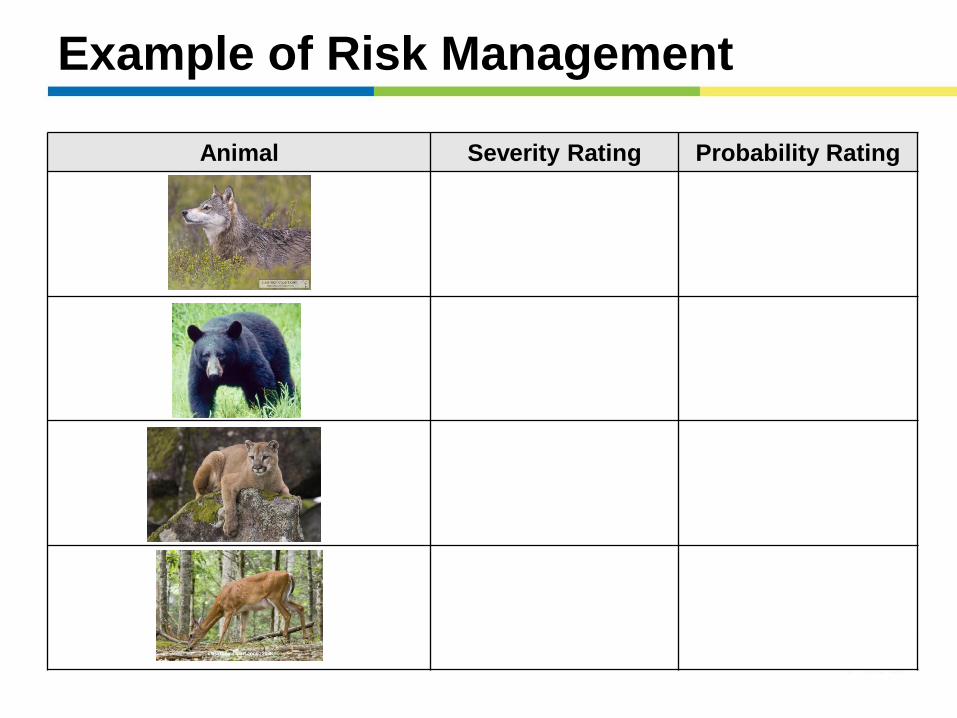
Example of Risk Management
Animal Severity Rating Probability Rating
Medical Risk Management Objectives
• Safe and effective products
– Minimize the patient/user risks
• Compliance with internal and external standards
– Minimize the Regulatory risk
• Stay in business so products remain available
– Minimize the business risk
ISO 14971 Risk Management
Risk Management is the systematic application
of management policies, procedures and
practices
to the tasks of
analyzing, evaluating and controlling
(mitigating and monitoring) risk
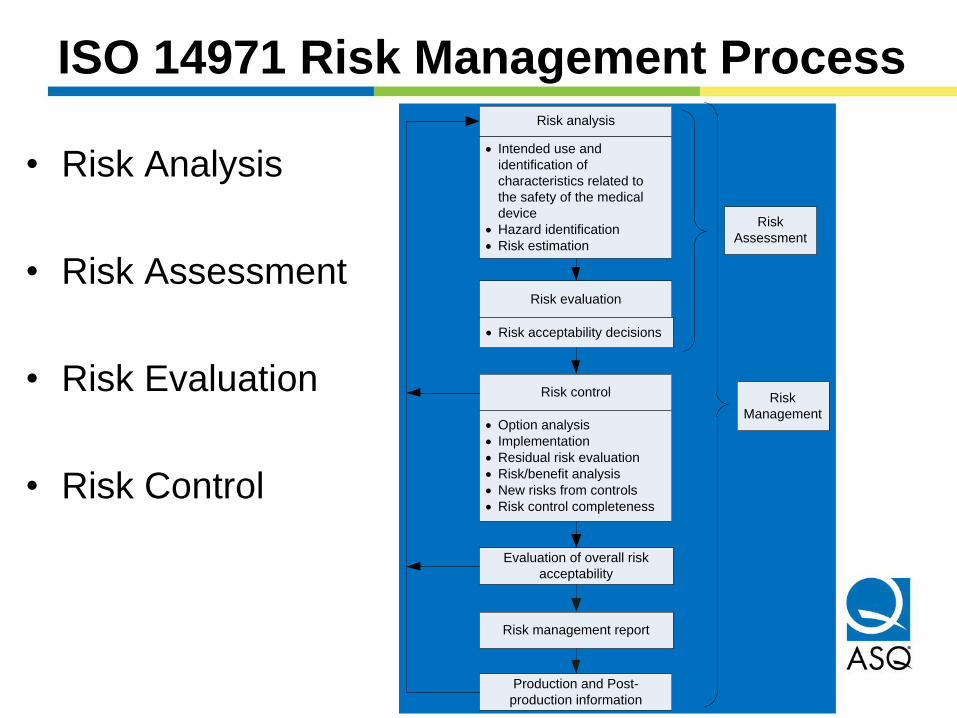
ISO 14971 Risk Management Process
• Risk Analysis
• Risk Assessment
• Risk Evaluation
• Risk Control
· Intended use and
identification of
characteristics related to
the safety of the medical
device
· Hazard identification
· Risk estimation
Risk analysis
Risk evaluation
· Option analysis
· Implementation
· Residual risk evaluation
· Risk/benefit analysis
· New risks from controls
· Risk control completeness
Risk control
Production and Post-
production information
Evaluation of overall risk
acceptability
Risk management report
· Risk acceptability decisions
Risk
Assessment
Risk
Management
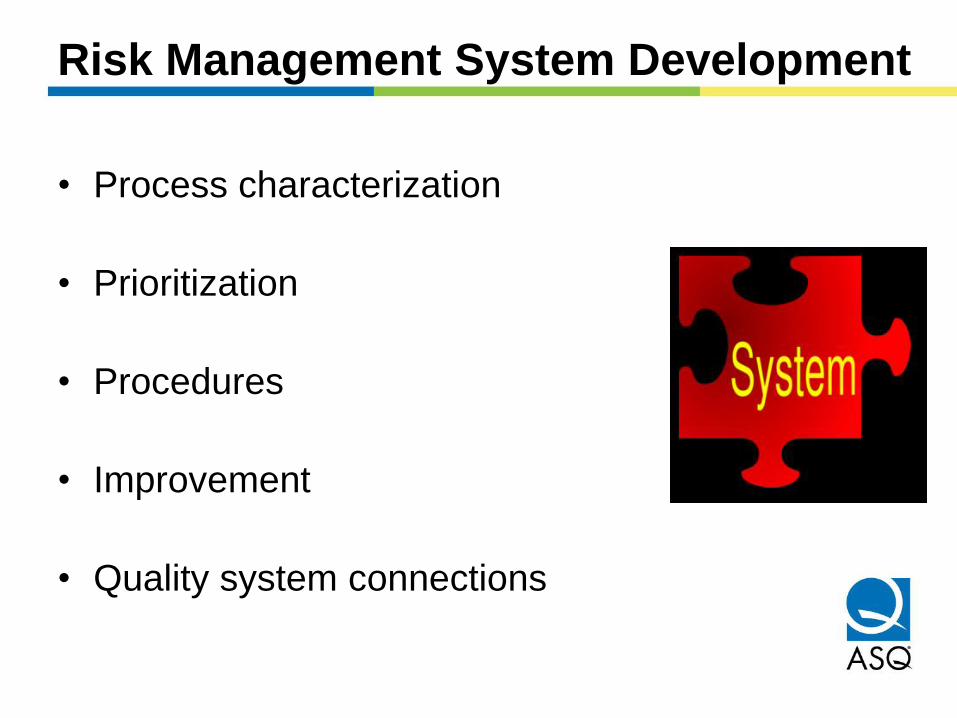
Risk Management System Development
• Process characterization
• Prioritization
• Procedures
• Improvement
• Quality system connections
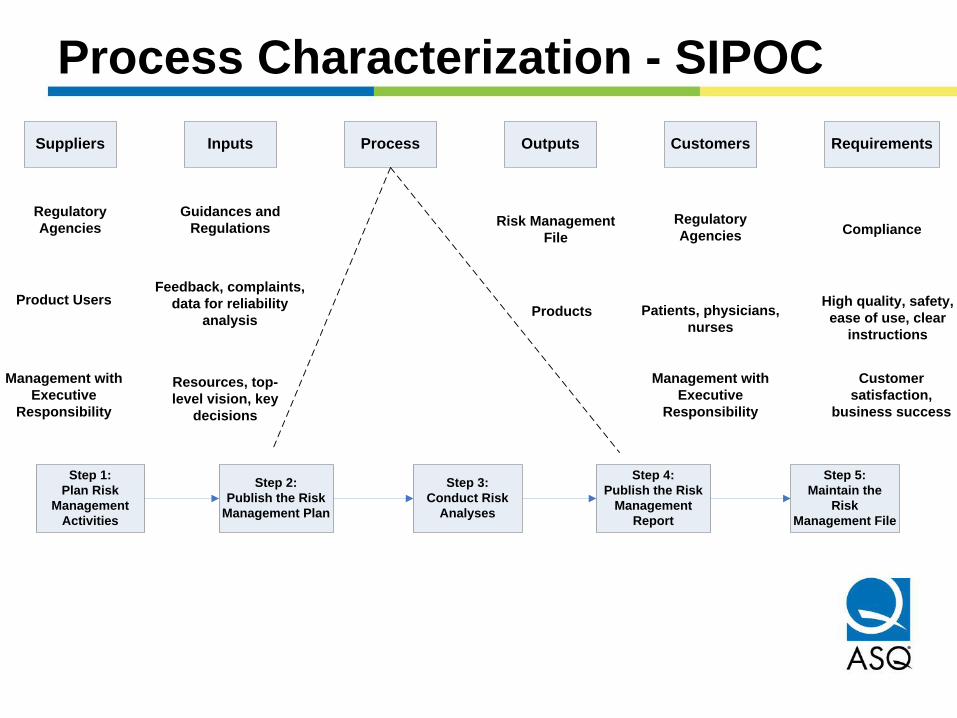
Process Characterization - SIPOC
Suppliers Inputs Process Outputs Customers Requirements
Step 1:
Plan Risk
Management
Activities
Step 2:
Publish the Risk
Management Plan
Step 3:
Conduct Risk
Analyses
Step 4:
Publish the Risk
Management
Report
Step 5:
Maintain the
Risk
Management File
Regulatory
Agencies
Guidances and
RegulationsRisk Management
File
Regulatory
Agencies Compliance
Product UsersFeedback, complaints,
data for reliability
analysisProducts Patients, physicians,
nurses
High quality, safety,
ease of use, clear
instructions
Management with
Executive
Responsibility
Resources, top-
level vision, key
decisions
Management with
Executive
Responsibility
Customer
satisfaction,
business success
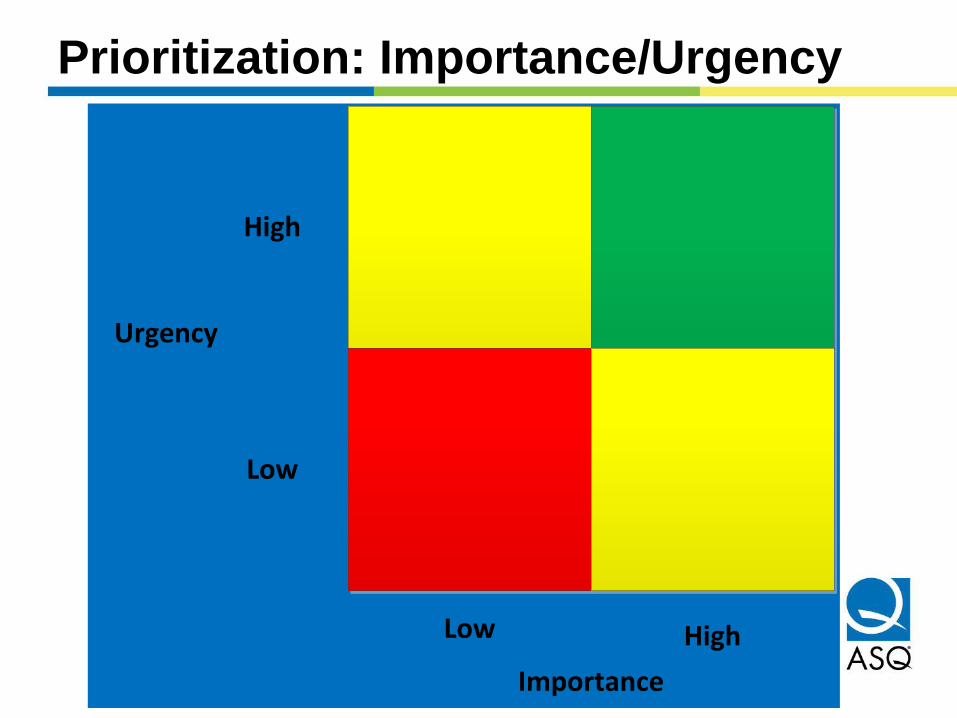
Prioritization: Importance/Urgency
High
Low
HighLow
Importance
Urgency
Procedures – Seeing the Same Way
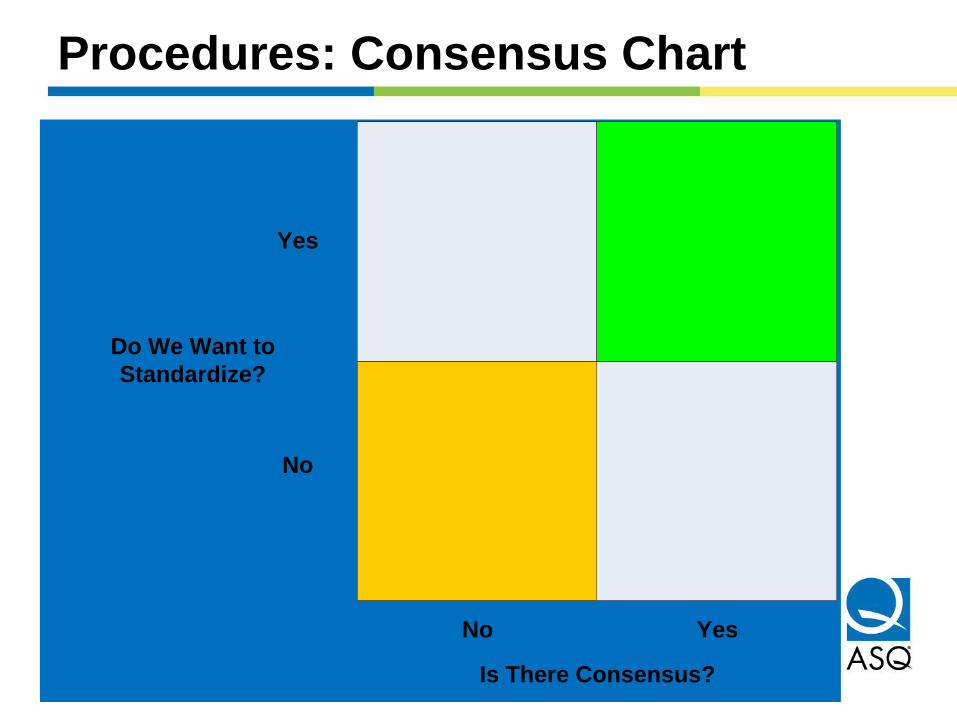
Procedures: Consensus Chart
Do We Want to
Standardize?
Is There Consensus?
No
Yes
Yes
No
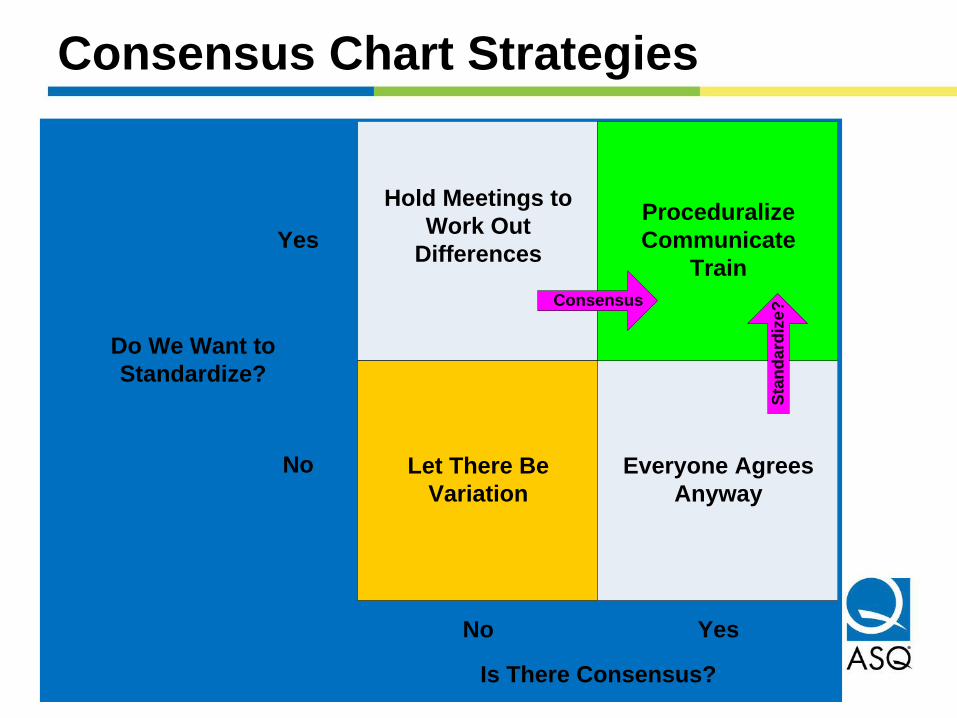
Consensus Chart Strategies
Do We Want to
Standardize?
Hold Meetings to
Work Out
Differences
Everyone Agrees
Anyway
Let There Be
Variation
Proceduralize
Communicate
Train
Is There Consensus?
No
Yes
Yes
No
Consensus
Sta
nd
ard
ize
?
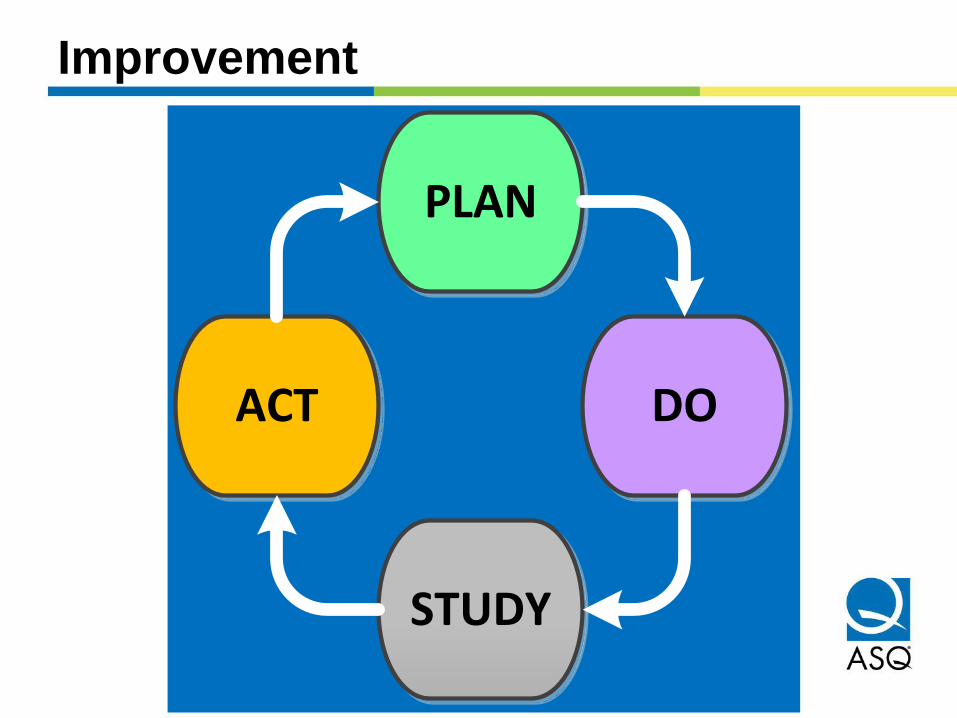
PLAN
DOACT
STUDY
Improvement
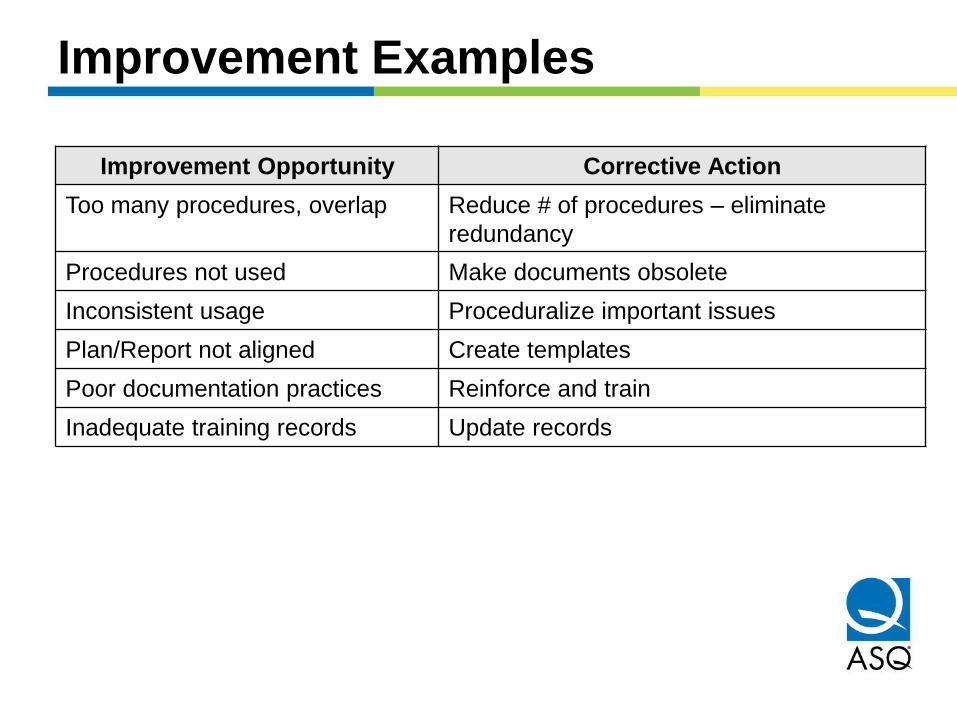
Improvement Examples
Improvement Opportunity Corrective Action
Too many procedures, overlap Reduce # of procedures – eliminate
redundancy
Procedures not used Make documents obsolete
Inconsistent usage Proceduralize important issues
Plan/Report not aligned Create templates
Poor documentation practices Reinforce and train
Inadequate training records Update records
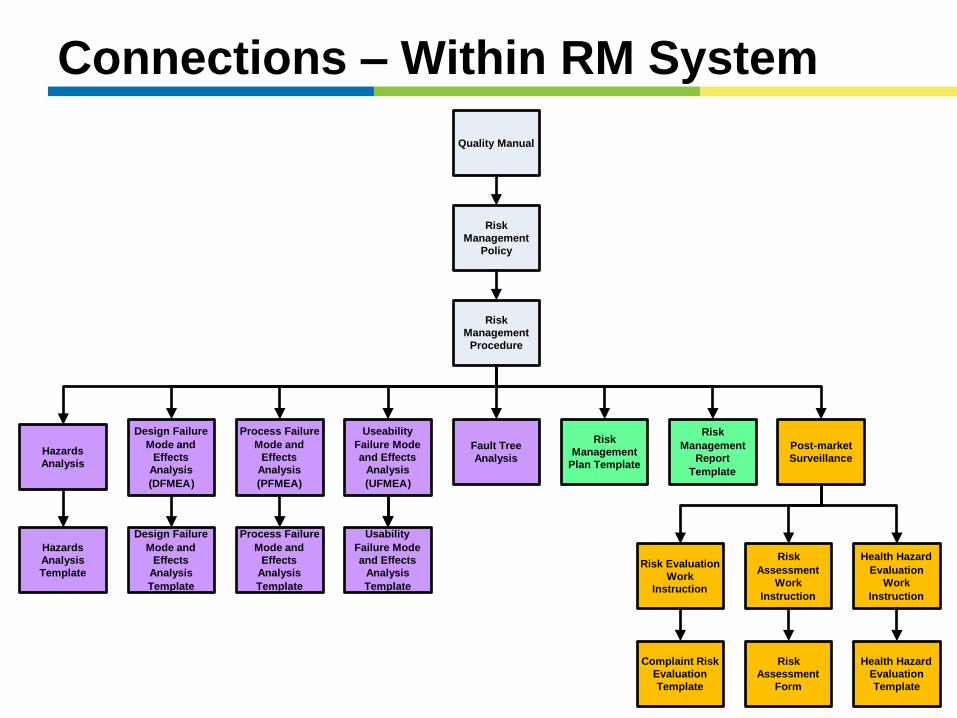
Connections – Within RM System
Quality Manual
Risk
Management
Procedure
Risk
Management
Policy
Risk
Management
Report
Template
Health Hazard
Evaluation
Work
Instruction
Risk
Management
Plan Template
Post - market
Surveillance
Hazards
Analysis
Template
Design Failure
Mode and
Effects
Analysis
Template
Process Failure
Mode and
Effects
Analysis
Template
Hazards
Analysis
Design Failure
Mode and
Effects
Analysis
( DFMEA )
Process Failure
Mode and
Effects
Analysis
( PFMEA )
Useability
Failure Mode
and Effects
Analysis
( UFMEA )
Usability
Failure Mode
and Effects
Analysis
Template
Risk Evaluation
Work Instruction
Complaint Risk
Evaluation
Template
Health Hazard
Evaluation
Template
Risk
Assessment
Work
Instruction
Risk
Assessment
Form
Fault Tree
Analysis
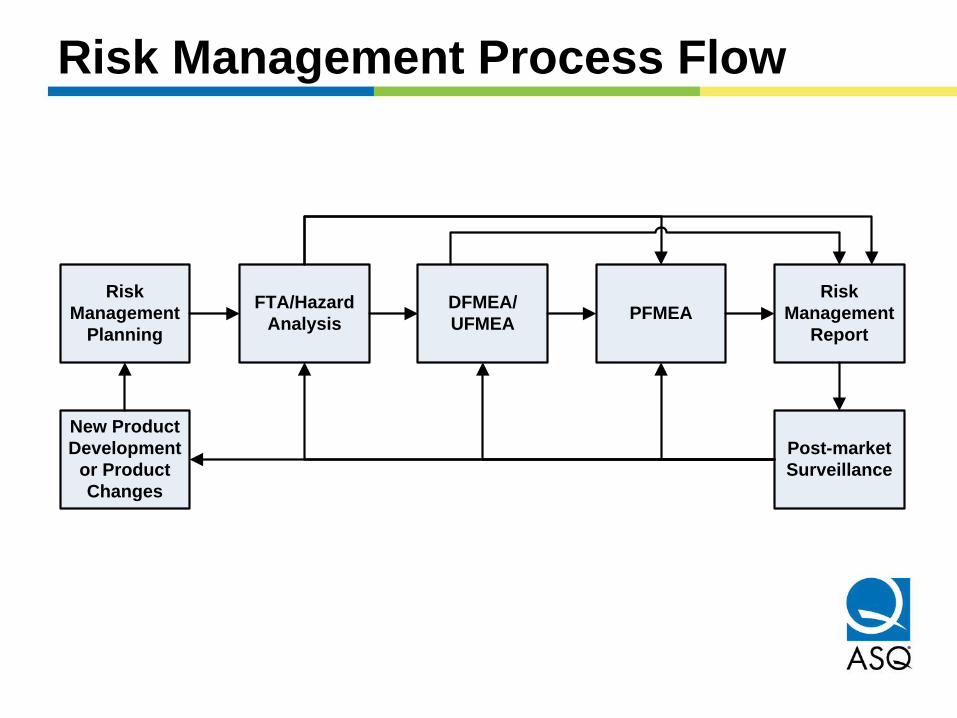
Risk Management Process Flow
FTA/Hazard
Analysis
DFMEA/
UFMEAPFMEA
Risk
Management
Report
Risk
Management
Planning
Post-market
Surveillance
New Product
Development
or Product
Changes
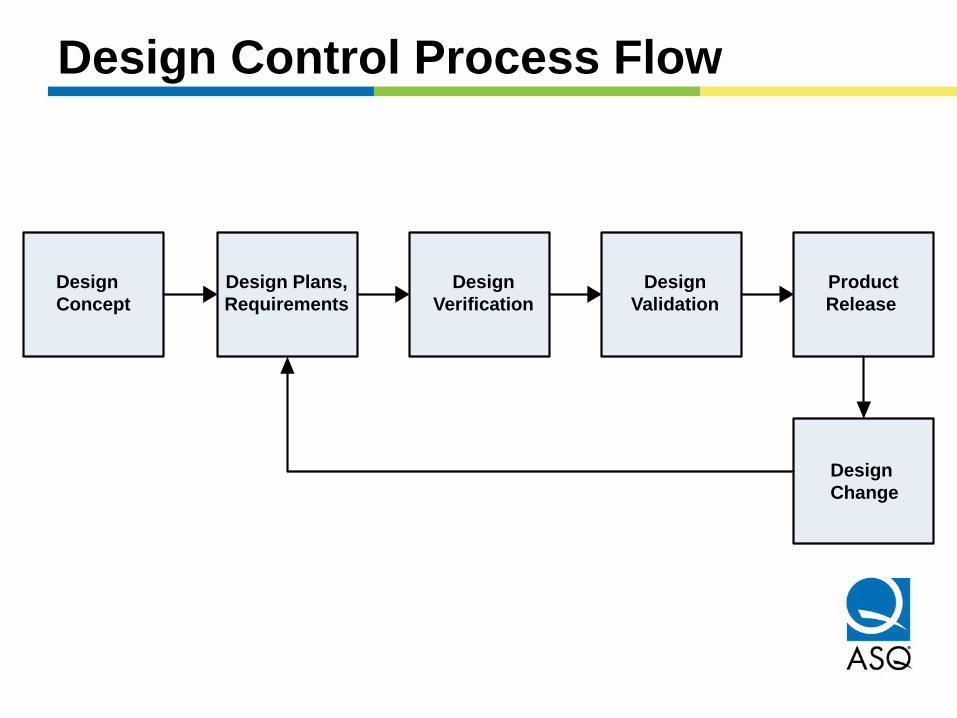
Design Plans,
Requirements
Design
Verification
Design
Validation
Product
Release
Design
Concept
Design
Change
Design Control Process Flow
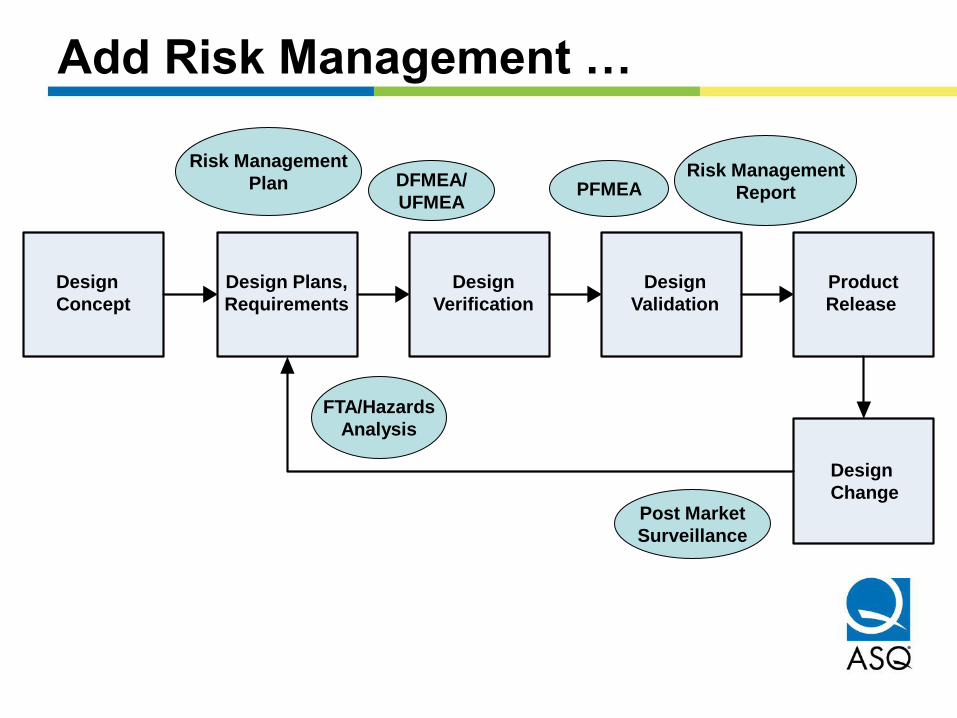
Add Risk Management …
Design Plans,
Requirements
Design
Verification
Design
Validation
Product
Release
Design
Concept
Design
Change
Risk Management
Plan
FTA/Hazards
Analysis
DFMEA/
UFMEA PFMEA
Risk Management
Report
Post Market
Surveillance
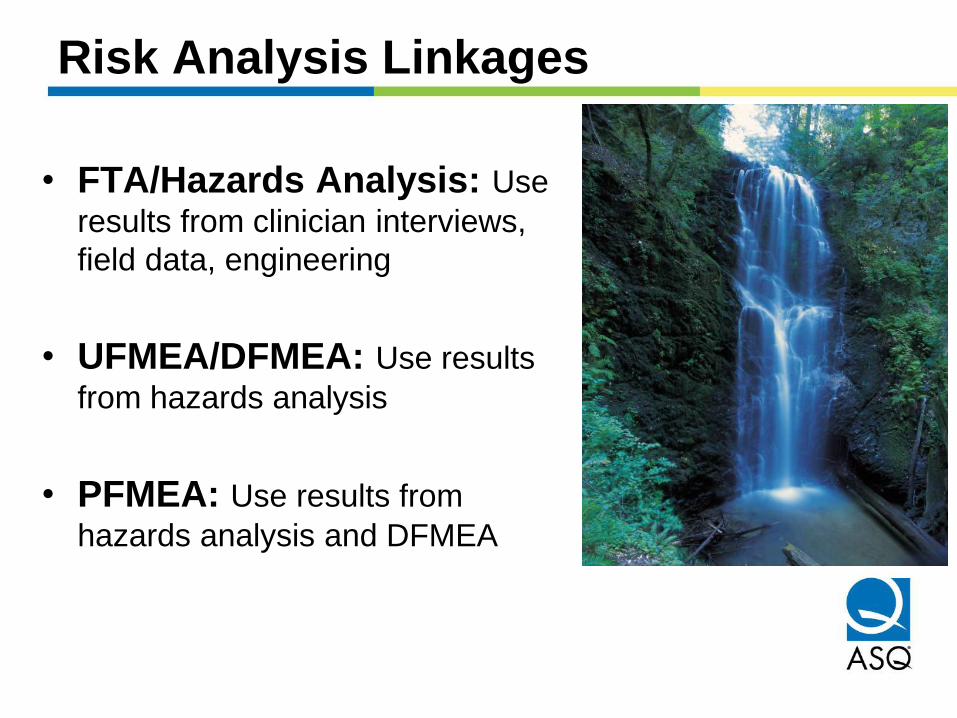
Risk Analysis Linkages
• FTA/Hazards Analysis: Use
results from clinician interviews,
field data, engineering
• UFMEA/DFMEA: Use results
from hazards analysis
• PFMEA: Use results from
hazards analysis and DFMEA

The Tree of Potential Harm
Patient Harm
Hazardous
Situation
Reasonable ,
Foreseeable
Misuse
Product Failure
Design
Failure
Process
Failure
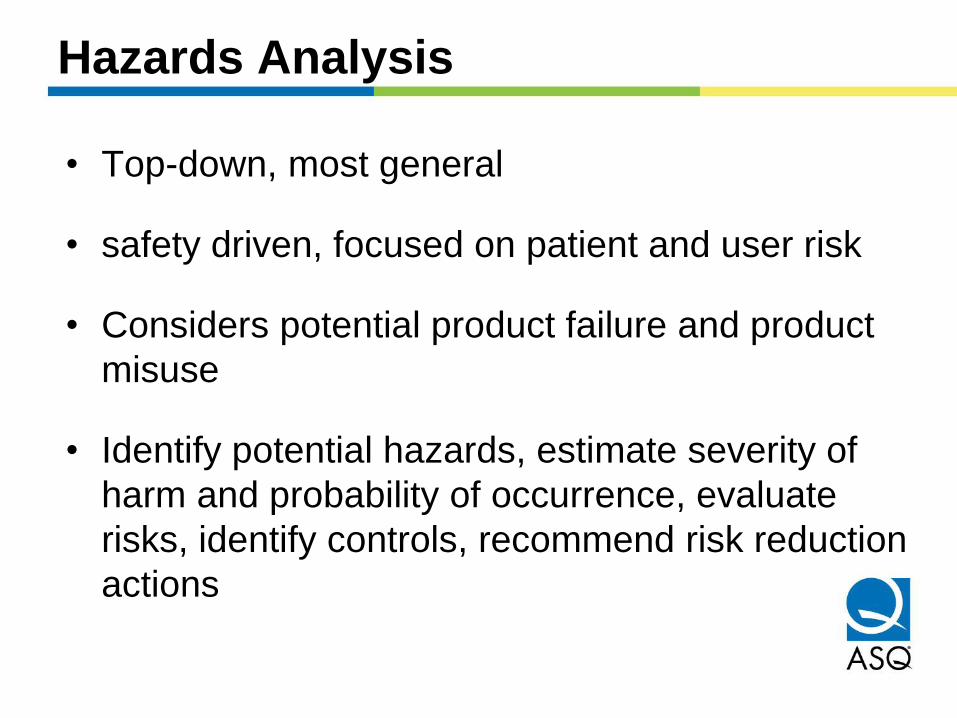
Hazards Analysis
• Top-down, most general
• safety driven, focused on patient and user risk
• Considers potential product failure and product
misuse
• Identify potential hazards, estimate severity of
harm and probability of occurrence, evaluate
risks, identify controls, recommend risk reduction
actions
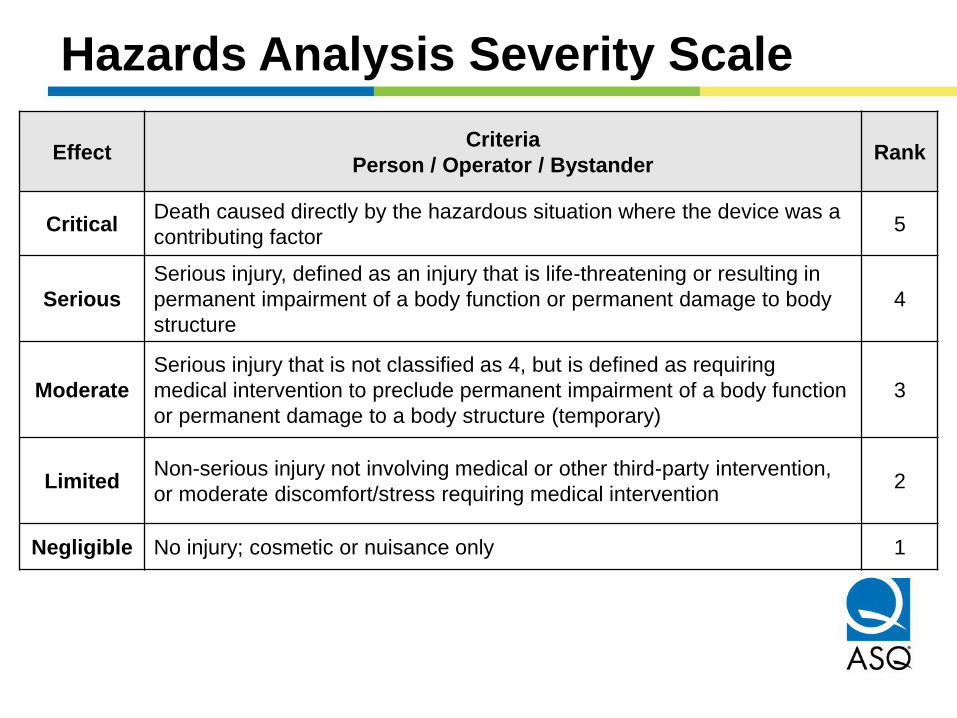
Hazards Analysis Severity Scale
Effect Criteria
Person / Operator / Bystander Rank
Critical Death caused directly by the hazardous situation where the device was a
contributing factor 5
Serious
Serious injury, defined as an injury that is life-threatening or resulting in
permanent impairment of a body function or permanent damage to body
structure
4
Moderate
Serious injury that is not classified as 4, but is defined as requiring
medical intervention to preclude permanent impairment of a body function
or permanent damage to a body structure (temporary)
3
Limited Non-serious injury not involving medical or other third-party intervention,
or moderate discomfort/stress requiring medical intervention 2
Negligible No injury; cosmetic or nuisance only 1
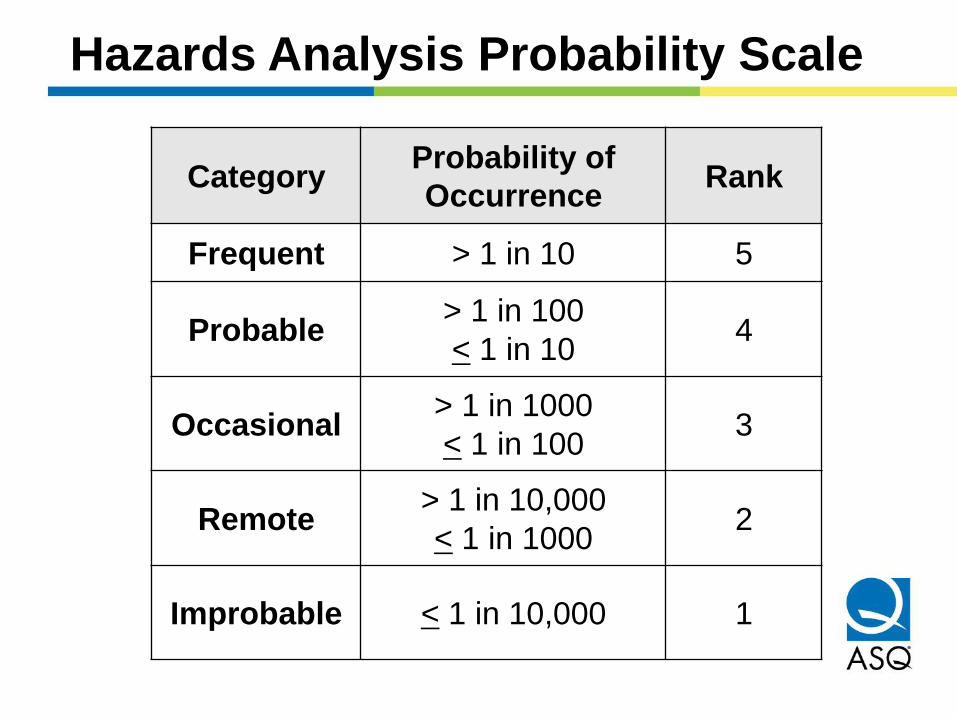
Hazards Analysis Probability Scale
Category Probability of
Occurrence Rank
Frequent > 1 in 10 5
Probable > 1 in 100
< 1 in 10 4
Occasional > 1 in 1000
< 1 in 100 3
Remote > 1 in 10,000
< 1 in 1000 2
Improbable < 1 in 10,000 1
Fault Tree Analysis
• Supplemental tool to HA or FMEAs
• Top-down approach, single failure mode focus
• Analysis diagram utilizing AND and OR gates
(similar to a reliability diagram)
• Often used on highest risk failure modes from an
FMEA
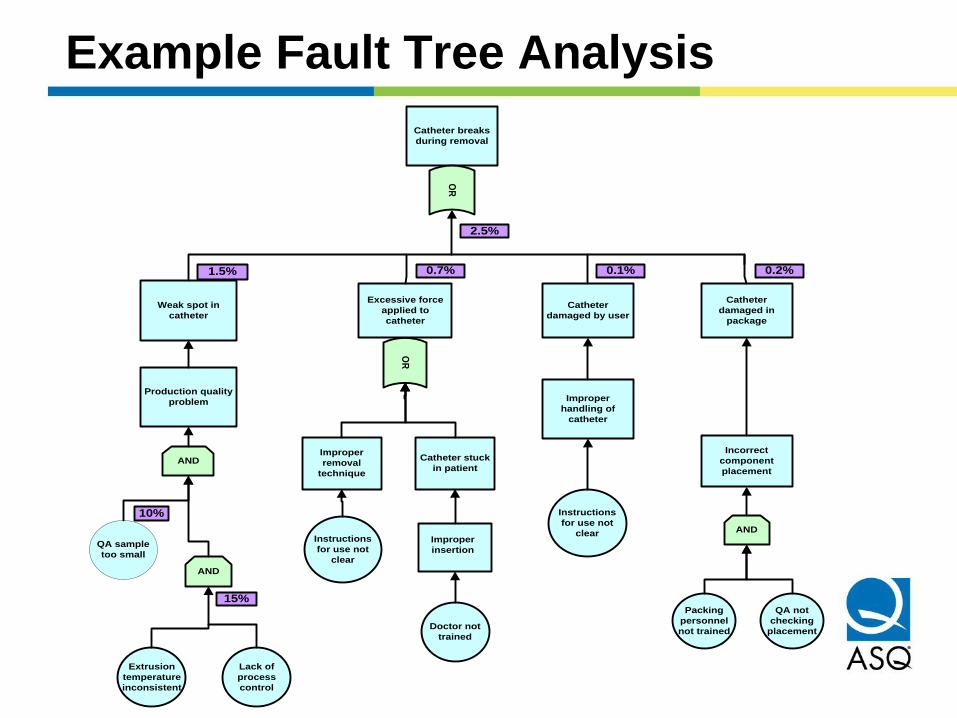
Catheter breaks
during removal
Excessive force
applied to
catheter
Catheter
damaged by user
Catheter
damaged in
package
OR
Weak spot in
catheter
Production quality
problem
AND
QA sample
too small
Extrusion
temperature
inconsistent
2.5%
Improper
removal
technique
OR
Improper
handling of
catheter
Instructions
for use not
clear
Catheter stuck
in patient
Instructions
for use not
clear
Improper
insertion
Doctor not
trained
Incorrect
component
placement
Packing
personnel
not trained
QA not
checking
placement
AND
Lack of
process
control
AND
1.5%
10%
15%
0.7% 0.1% 0.2%
Example Fault Tree Analysis
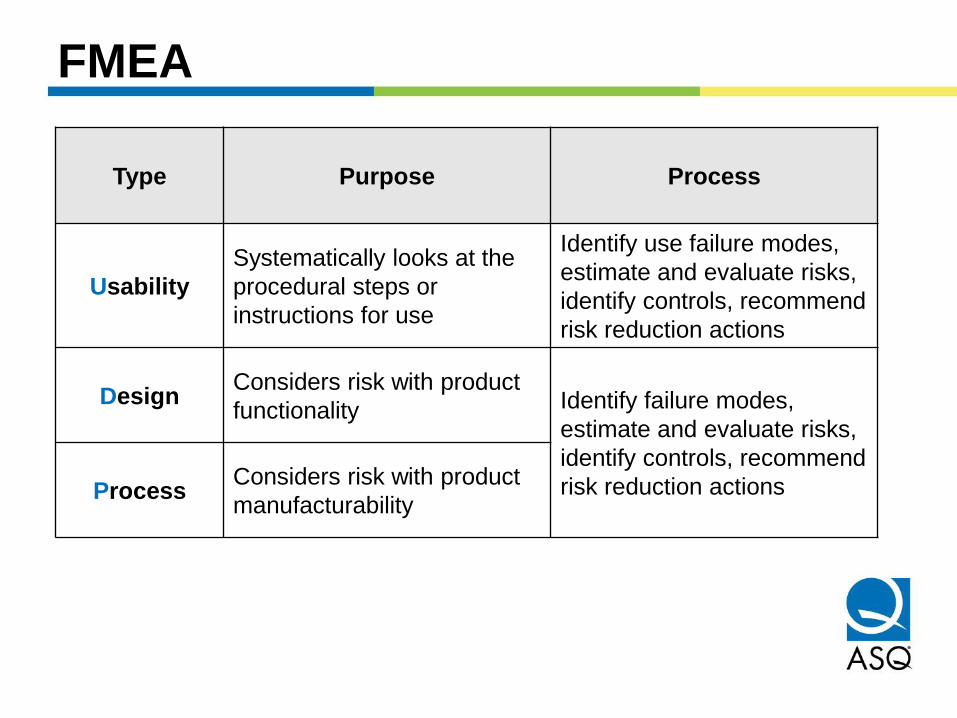
FMEA
Type Purpose Process
Usability
Systematically looks at the
procedural steps or
instructions for use
Identify use failure modes,
estimate and evaluate risks,
identify controls, recommend
risk reduction actions
Design Considers risk with product
functionality Identify failure modes,
estimate and evaluate risks,
identify controls, recommend
risk reduction actions Process Considers risk with product
manufacturability
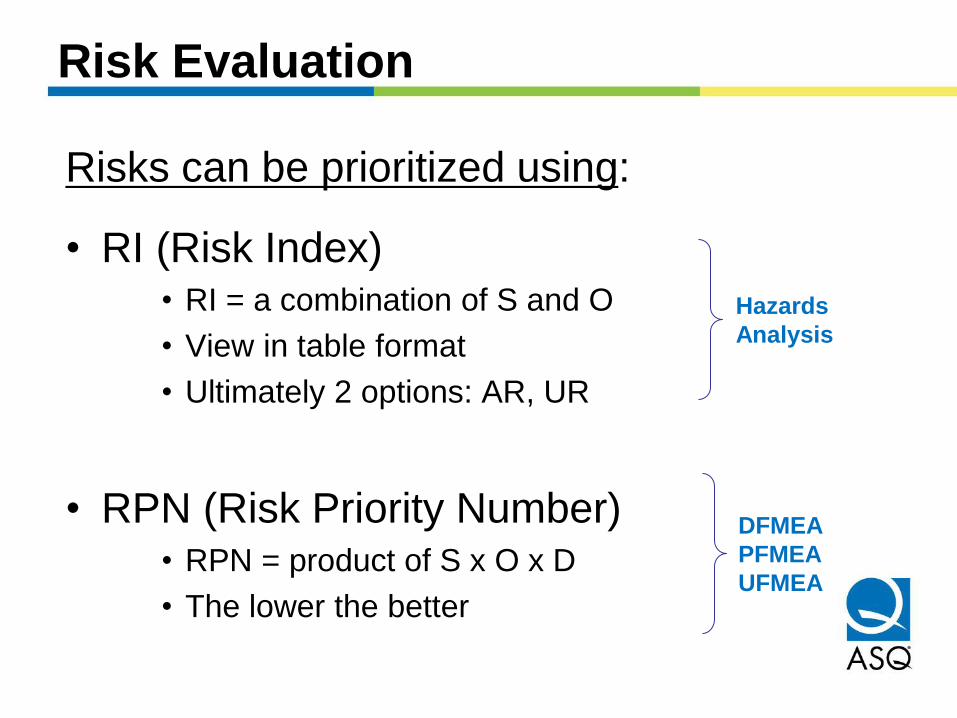
Risk Evaluation
Risks can be prioritized using:
• RI (Risk Index) • RI = a combination of S and O
• View in table format
• Ultimately 2 options: AR, UR
• RPN (Risk Priority Number) • RPN = product of S x O x D
• The lower the better
DFMEA
PFMEA
UFMEA
Hazards
Analysis
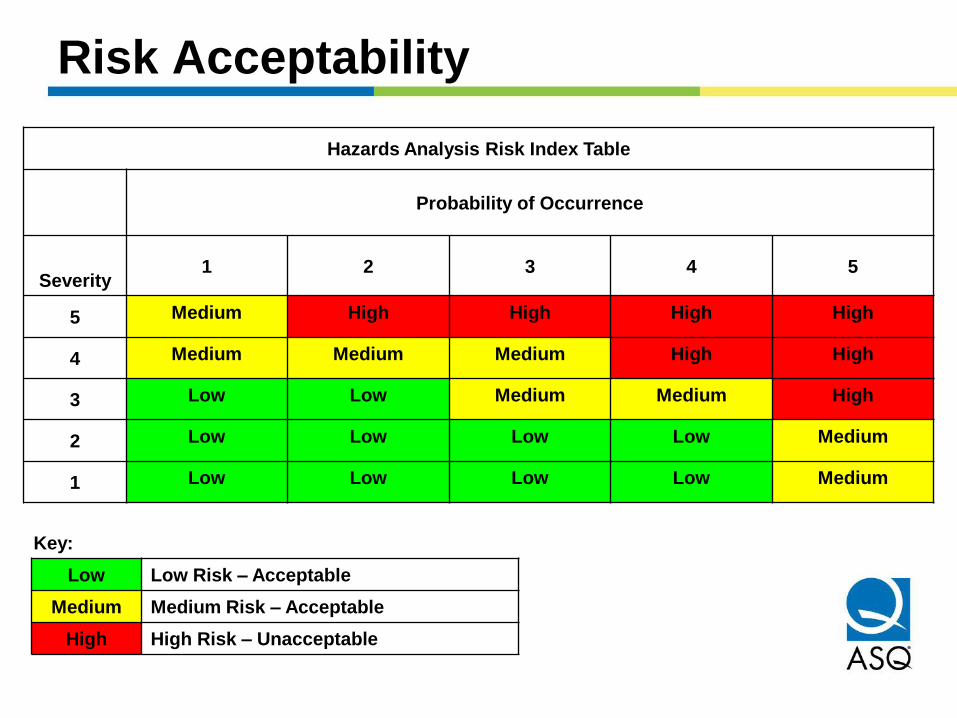
Risk Acceptability
Hazards Analysis Risk Index Table
Probability of Occurrence
Severity 1 2 3 4 5
5 Medium High High High High
4 Medium Medium Medium High High
3 Low Low Medium Medium High
2 Low Low Low Low Medium
1 Low Low Low Low Medium
Key:
Low Low Risk – Acceptable
Medium Medium Risk – Acceptable
High High Risk – Unacceptable
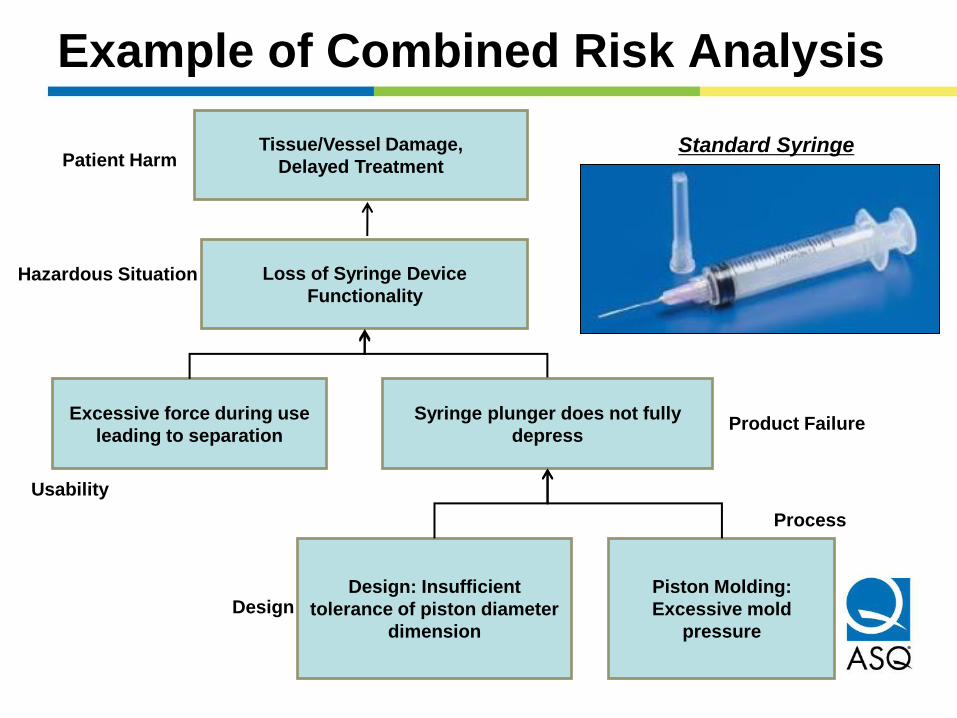
Example of Combined Risk Analysis
Tissue/Vessel Damage,
Delayed Treatment
Loss of Syringe Device
Functionality
Excessive force during use
leading to separation
Syringe plunger does not fully
depress
Design: Insufficient
tolerance of piston diameter
dimension
Piston Molding:
Excessive mold
pressure
Patient Harm
Hazardous Situation
Usability
Product Failure
Process
Design
Standard Syringe
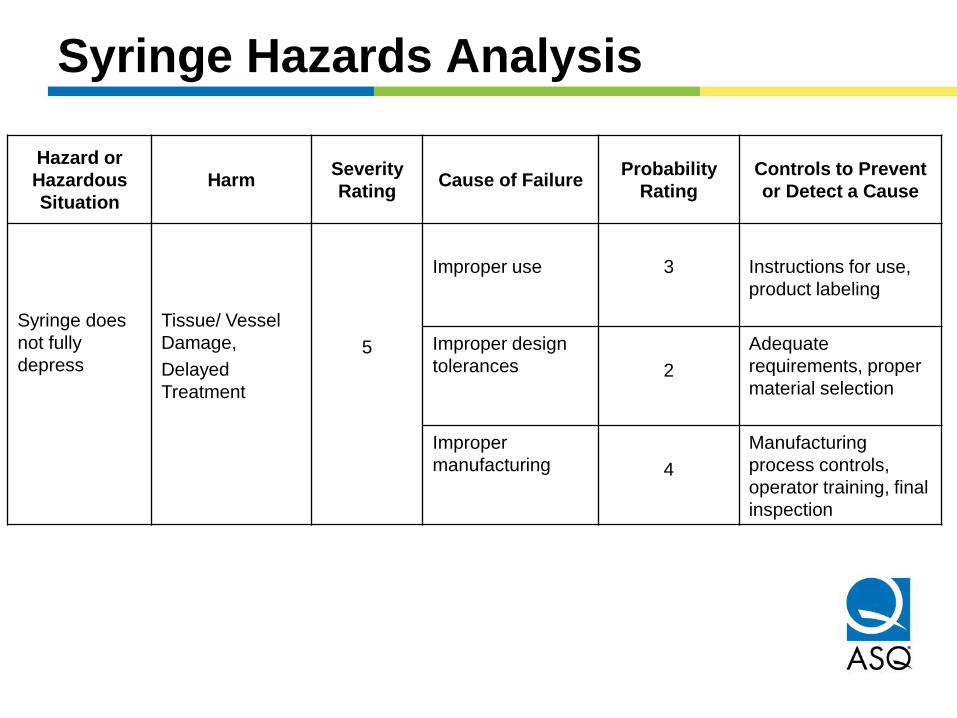
Syringe Hazards Analysis
Hazard or
Hazardous
Situation
Harm Severity
Rating Cause of Failure
Probability
Rating
Controls to Prevent
or Detect a Cause
Syringe does
not fully
depress
Tissue/ Vessel
Damage,
Delayed
Treatment
5
Improper use
3
Instructions for use,
product labeling
Improper design
tolerances
2
Adequate
requirements, proper
material selection
Improper
manufacturing
4
Manufacturing
process controls,
operator training, final
inspection
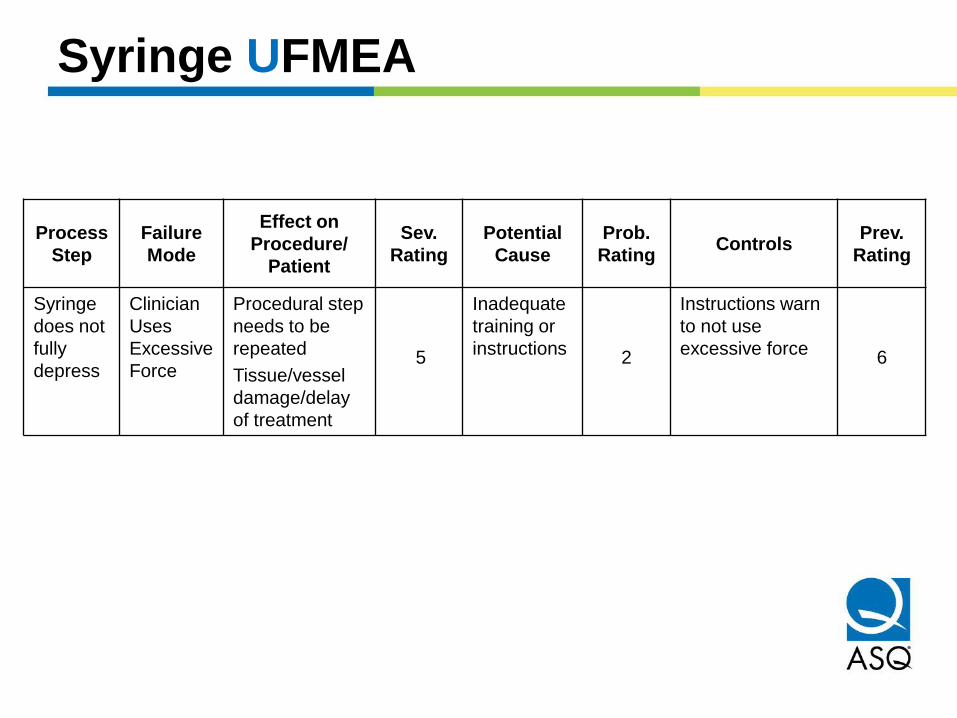
Syringe UFMEA
Process
Step
Failure
Mode
Effect on
Procedure/
Patient
Sev.
Rating
Potential
Cause
Prob.
Rating Controls
Prev.
Rating
Syringe
does not
fully
depress
Clinician
Uses
Excessive
Force
Procedural step
needs to be
repeated
Tissue/vessel
damage/delay
of treatment
5
Inadequate
training or
instructions
2
Instructions warn
to not use
excessive force
6
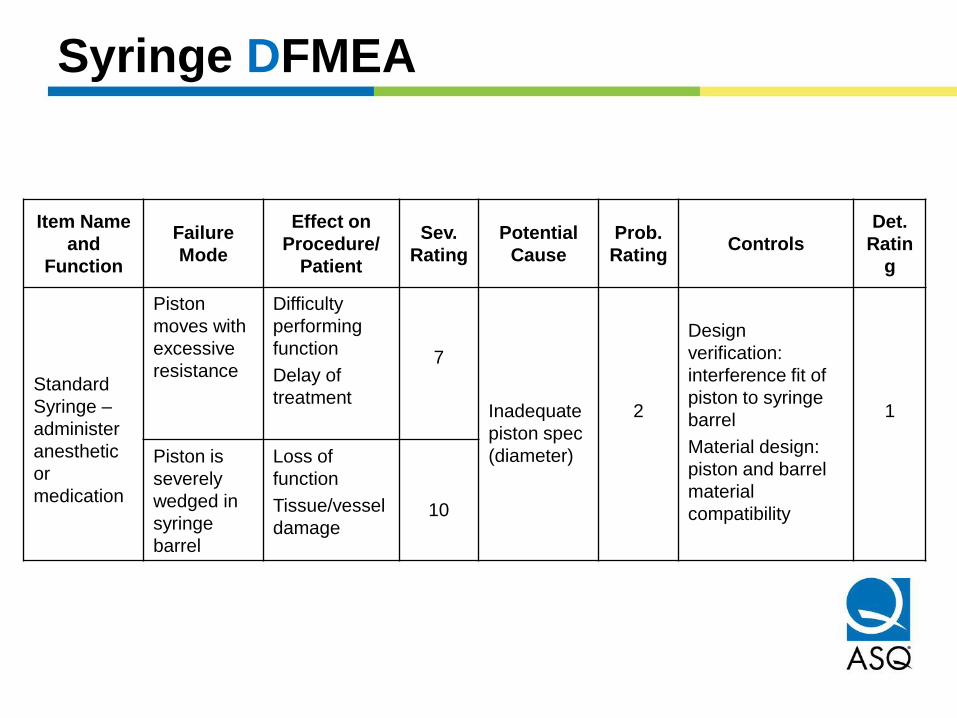
Syringe DFMEA
Item Name
and
Function
Failure
Mode
Effect on
Procedure/
Patient
Sev.
Rating
Potential
Cause
Prob.
Rating Controls
Det.
Ratin
g
Standard
Syringe –
administer
anesthetic
or
medication
Piston
moves with
excessive
resistance
Difficulty
performing
function
Delay of
treatment
7
Inadequate
piston spec
(diameter)
2
Design
verification:
interference fit of
piston to syringe
barrel
Material design:
piston and barrel
material
compatibility
1
Piston is
severely
wedged in
syringe
barrel
Loss of
function
Tissue/vessel
damage
10
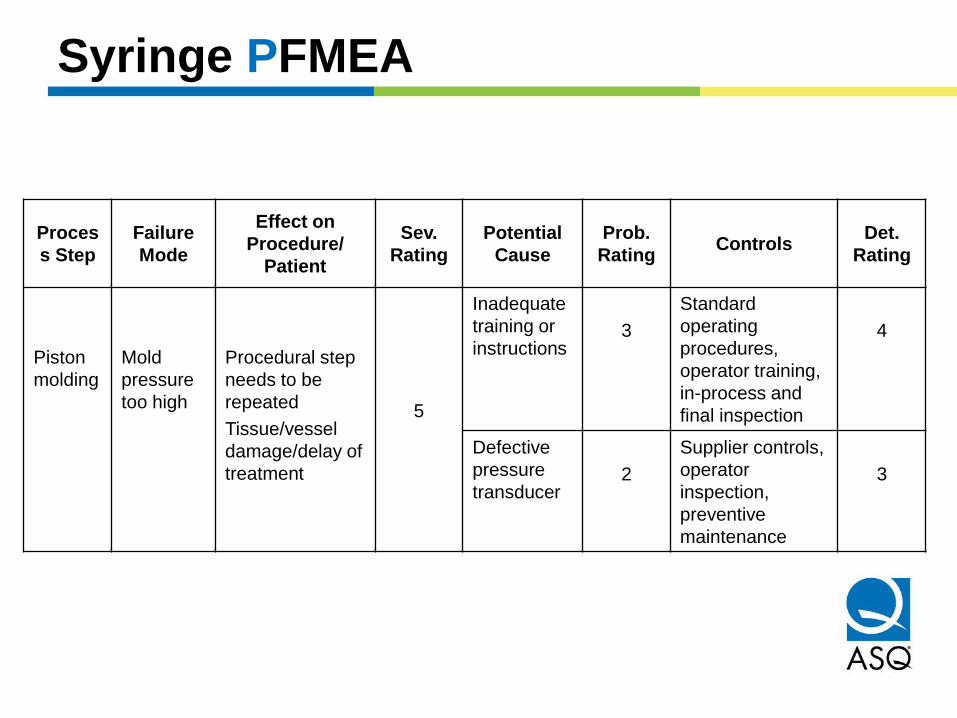
Syringe PFMEA
Proces
s Step
Failure
Mode
Effect on
Procedure/
Patient
Sev.
Rating
Potential
Cause
Prob.
Rating Controls
Det.
Rating
Piston
molding
Mold
pressure
too high
Procedural step
needs to be
repeated
Tissue/vessel
damage/delay of
treatment
5
Inadequate
training or
instructions
3
Standard
operating
procedures,
operator training,
in-process and
final inspection
4
Defective
pressure
transducer
2
Supplier controls,
operator
inspection,
preventive
maintenance
3
Statistical Techniques Opportunities
• Design verification and validation
• Process validation
• Post-market clinical follow-up/surveys
• Specific tasks
– Sample size determination
– Acceptance criteria
– Analysis of data
Design V&V Sample Sizes
• Consider the type of data
– Attribute
– Variable
• Use the risk analysis
• Perform statistical analysis
Attribute Data Analysis
• Minimum sample size
– No failures allowed
• Larger sample sizes
– May allow failures
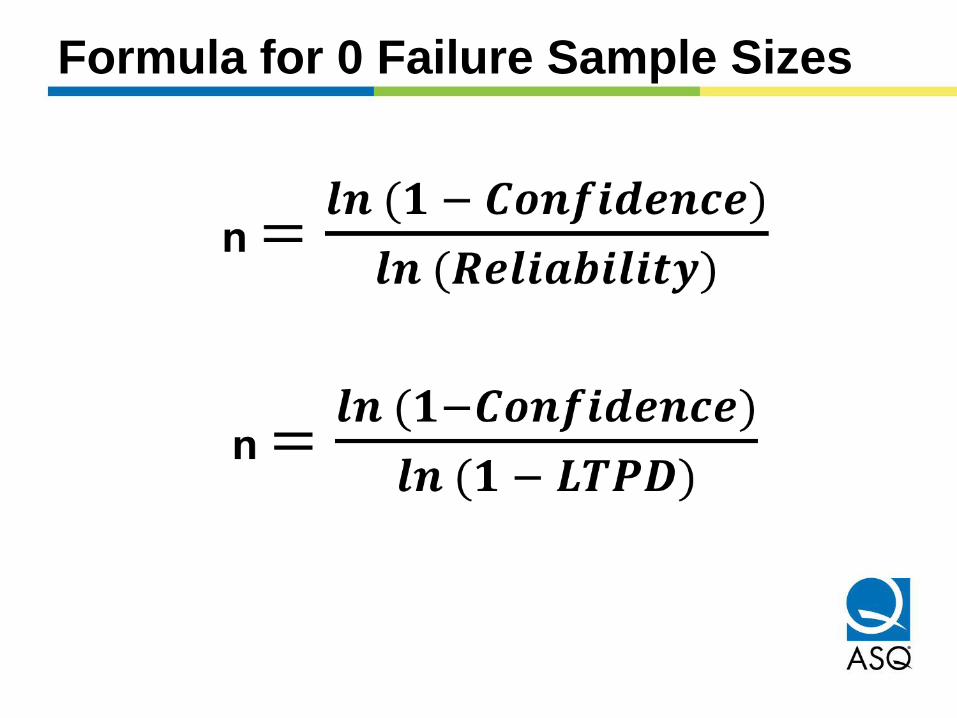
Formula for 0 Failure Sample Sizes
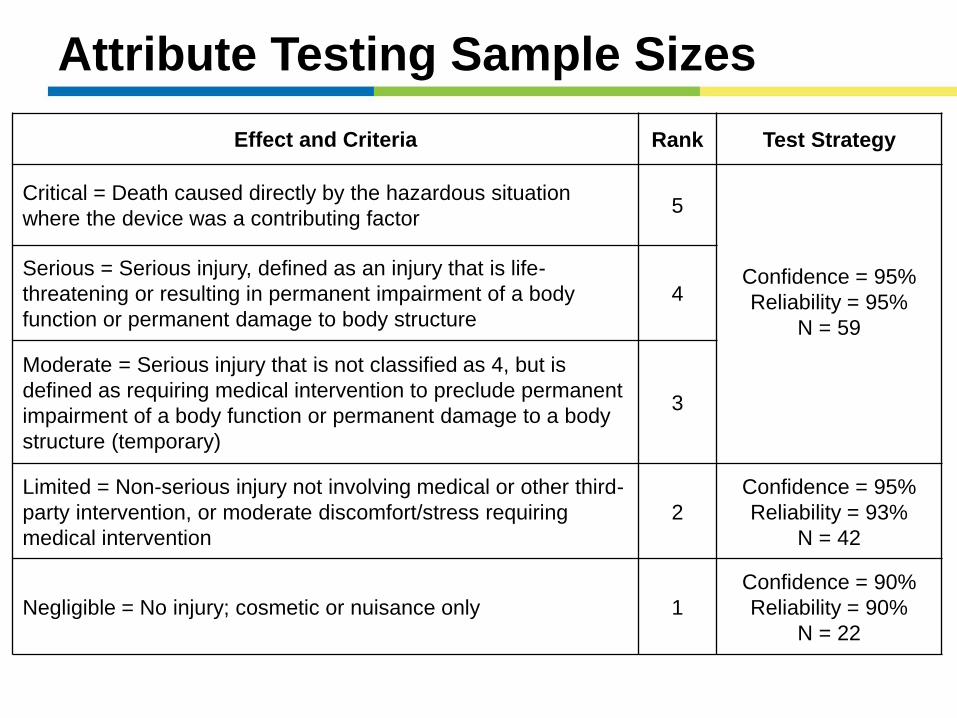
Attribute Testing Sample Sizes
Effect and Criteria Rank Test Strategy
Critical = Death caused directly by the hazardous situation
where the device was a contributing factor 5
Confidence = 95%
Reliability = 95%
N = 59
Serious = Serious injury, defined as an injury that is life-
threatening or resulting in permanent impairment of a body
function or permanent damage to body structure
4
Moderate = Serious injury that is not classified as 4, but is
defined as requiring medical intervention to preclude permanent
impairment of a body function or permanent damage to a body
structure (temporary)
3
Limited = Non-serious injury not involving medical or other third-
party intervention, or moderate discomfort/stress requiring
medical intervention
2
Confidence = 95%
Reliability = 93%
N = 42
Negligible = No injury; cosmetic or nuisance only 1
Confidence = 90%
Reliability = 90%
N = 22
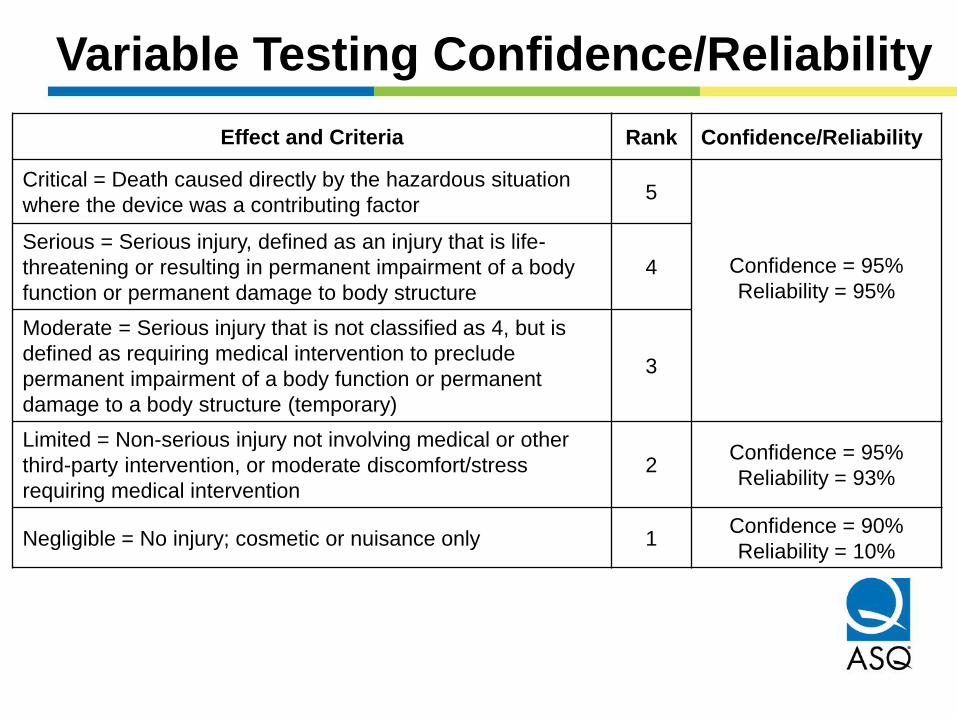
Variable Testing Confidence/Reliability
Effect and Criteria Rank Confidence/Reliability
Critical = Death caused directly by the hazardous situation
where the device was a contributing factor 5
Confidence = 95%
Reliability = 95%
Serious = Serious injury, defined as an injury that is life-
threatening or resulting in permanent impairment of a body
function or permanent damage to body structure
4
Moderate = Serious injury that is not classified as 4, but is
defined as requiring medical intervention to preclude
permanent impairment of a body function or permanent
damage to a body structure (temporary)
3
Limited = Non-serious injury not involving medical or other
third-party intervention, or moderate discomfort/stress
requiring medical intervention
2 Confidence = 95%
Reliability = 93%
Negligible = No injury; cosmetic or nuisance only 1 Confidence = 90%
Reliability = 10%
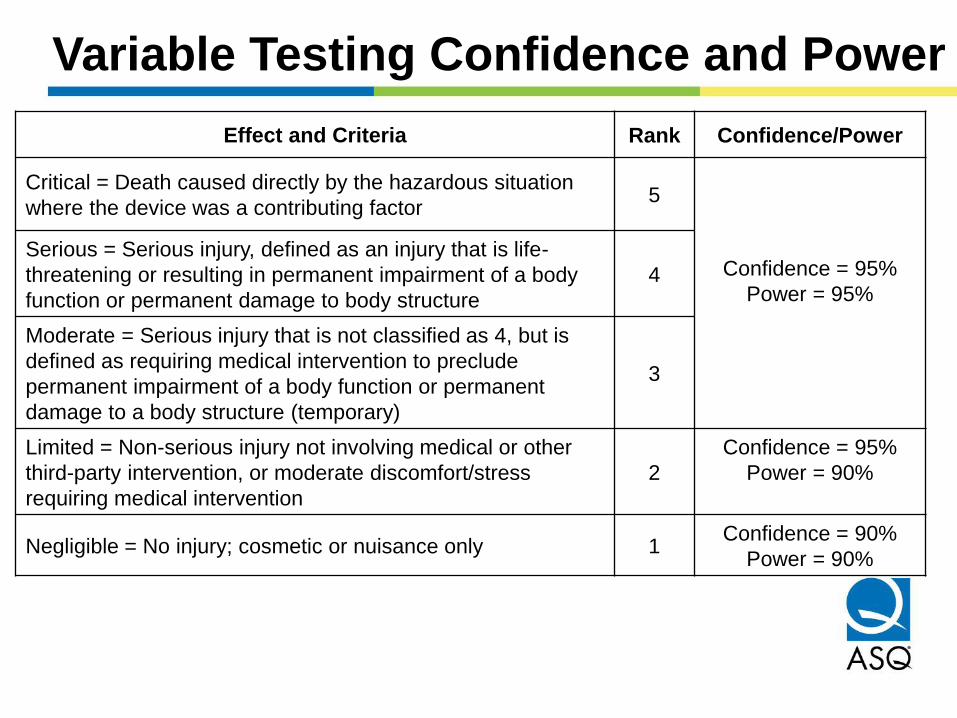
Variable Testing Confidence and Power
Effect and Criteria Rank Confidence/Power
Critical = Death caused directly by the hazardous situation
where the device was a contributing factor 5
Confidence = 95%
Power = 95%
Serious = Serious injury, defined as an injury that is life-
threatening or resulting in permanent impairment of a body
function or permanent damage to body structure
4
Moderate = Serious injury that is not classified as 4, but is
defined as requiring medical intervention to preclude
permanent impairment of a body function or permanent
damage to a body structure (temporary)
3
Limited = Non-serious injury not involving medical or other
third-party intervention, or moderate discomfort/stress
requiring medical intervention
2
Confidence = 95%
Power = 90%
Negligible = No injury; cosmetic or nuisance only 1 Confidence = 90%
Power = 90%
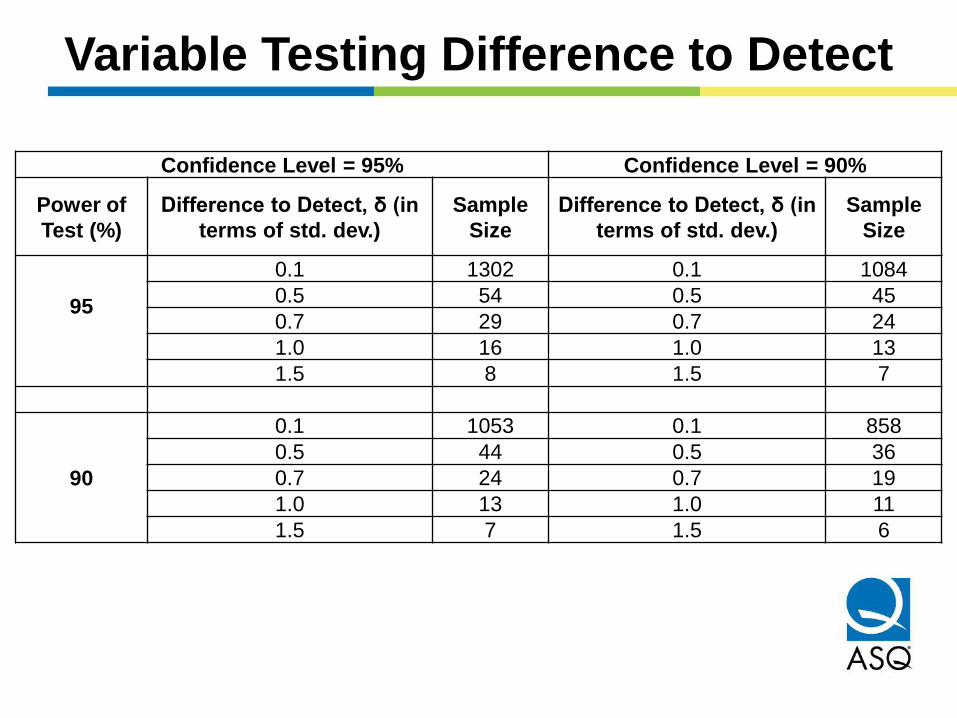
Variable Testing Difference to Detect
Confidence Level = 95% Confidence Level = 90%
Power of
Test (%)
Difference to Detect, δ (in
terms of std. dev.)
Sample
Size
Difference to Detect, δ (in
terms of std. dev.)
Sample
Size
95
0.1 1302 0.1 1084
0.5 54 0.5 45
0.7 29 0.7 24
1.0 16 1.0 13
1.5 8 1.5 7
90
0.1 1053 0.1 858
0.5 44 0.5 36
0.7 24 0.7 19
1.0 13 1.0 11
1.5 7 1.5 6
Conclusions
• Quality tools and techniques significantly help in risk management system development.
• The risk management system is connected to many other quality system processes.
• Product risk analyses are also interconnected. Different techniques applied together are needed to comprehensively assess risk.
THANK YOU FOR ATTENDING!