Embed Size (px)
Citation preview

www.elsevier.com/locate/ynimg
NeuroImage 29 (2006) 1212 – 1223
A rotation-invariant spherical harmonic decomposition method
for mapping intravoxel multiple fiber structures
Wang Zhan, Elliot A. Stein, and Yihong Yang*
Neuroimaging Research Branch, Intramural Research Program, National Institute on Drug Abuse,
National Institutes of Health, Nathan Shock Dr. Room 383, Baltimore, MD 21224, USA
Received 18 February 2005; revised 23 August 2005; accepted 31 August 2005
Available online 12 October 2005
A new rotation-invariant spherical harmonic decomposition (SHD)
method is proposed in this paper for analyzing high angular resolution
diffusion (HARD) imaging. Regular SHD methods have been used to
characterize the features of the apparent diffusion coefficient (ADC)
profile measured by the HARD technique. However, these regular SHD
methods are rotation-variant, i.e., the magnitude and/or the phase of
the harmonic components changes with the rotation of the ADC profile.
We propose a new rotation-invariant SHD (RI-SHD) method based on
the rotation-invariant property of a diffusion tensor model. The basic
idea of the proposed method is to reorient the measured ADC profile
into a local coordinate system determined by the three eigenvectors of
the diffusion tensor in each imaging voxel, and then apply a SHD to the
ADC profile. Both simulations and in vivo experiments were carried
out to validate the method. Comparisons were made between the
component maps from a regular SHD method, diffusion circular
spectrum mapping (DCSM) method and the proposed RI-SHD method.
The results indicate that the regular SHD maps vary significantly with
the rotation of the diffusion-encoding scheme, whereas the maps of the
DCSM and the proposed method remain unchanged. In particular, the
(0,0)-th, (2,2)-th and (4,4)-th component maps from the RI-SHD
method exhibited good consistency with the 0th, 2nd and 4th order
maps of the DCSM method, respectively. Compared with the regular
SHD methods used in HARD imaging, the proposed RI-SHD method is
superior in characterizing the diffusion patterns of multiple fiber
structures between different brain regions or across subjects.
D 2005 Elsevier Inc. All rights reserved.
Keywords: Diffusion MRI; Diffusion tensor imaging; Fiber crossing; High
angular resolution diffusion; Rotation-invariant; Spherical harmonic
decomposition
Introduction
Diffusion tensor imaging (DTI) has been established as a
powerful tool to non-invasively investigate white matter struc-
1053-8119/$ - see front matter D 2005 Elsevier Inc. All rights reserved.
doi:10.1016/j.neuroimage.2005.08.045
* Corresponding author. Fax: +1 410 550 1441.
E-mail address: [email protected] (Y. Yang).
Available online on ScienceDirect (www.sciencedirect.com).
tures in vivo (Basser et al., 1994; Le Bihan et al., 2001). An
important advantage of DTI over traditional diffusion-weighted
imaging (DWI) is that the diffusion tensor offers a rotation-
invariant model that justifies the quantitative comparison of
diffusion structures between different parts of the brain or across
different subjects (Basser and Pierpaoli, 1996). Tractography
techniques have also been developed to delineate neural pathways
based on the assumption that the major eigenvector of the
diffusion tensor should be oriented parallel with local white
matter fibers (Basser et al., 2000; Mori et al., 2002; Poupon et al.,
2000). However, the validity of the tractography reconstructed
from DTI is confounded by the fact that the tensor model is only
a 2nd order approximation of a possible complex diffusion
pattern (Basser, 2002), and that the primary eigenvector of the
diffusion tensor may be seriously biased from the actual fiber
direction if multiple fibers share a single voxel (Alexander et al.,
2001; Basser et al., 2000). To resolve the problem caused by
intravoxel multiple fibers, more elaborate acquisition and analysis
strategies beyond the tensor model are generally needed.
One strategy of characterizing intravoxel multiple fibers is to
calculate the probability distribution function (PDF) of the diffusion
process in each voxel based on the Fourier transform relationship
between the PDF of diffusion displacement and the diffusion-
weighted signal attenuation in q-space (Assaf and Cohen, 2000).
Wedeen et al. (2000) proposed the idea of diffusion spectrum
imaging (DSI) that probes complex white matter structures by
calculating the 3-D diffusion displacement PDF from a large number
of data acquisitions in q-space. Theoretically, the q-space Fourier
relationship is strictly held when the diffusion-weighting gradients
have infinitely narrow width and infinitely high amplitude (Call-
aghan, 1990). However, there is growing evidence that despite the
pulse width violation, it is still a reasonable description of local
diffusion and microstructural organization in brain tissues (Assaf et
al., 2004). Lin et al. (2003) performed experiments on phantoms
and animal models to assess the accuracy of DSI in practical MRI
settings. As a modified version of DSI, a ‘‘q-ball imaging’’ (QBI)
technique was proposed to acquire q-space data only on a spherical
surface (Tuch et al., 2003). In general, the relatively high diffusion
gradient requirements and the large acquisition numbers are still
W. Zhan et al. / NeuroImage 29 (2006) 1212–1223 1213
the major barriers of q-space imaging techniques for clinical
implementation.
Another strategy is to directly characterize the measured high
angular resolution diffusion (HARD) profile in each voxel,
although how to effectively quantify the HARD information
remains an open question (Frank, 2001). Alexander et al. (2002)
and Frank (2002) proposed the idea of using spherical harmonic
decomposition (SHD) to characterize the 3-D apparent diffusion
coefficient (ADC) profile measured by HARD imaging.
Recently, SHD method was also employed to direct estimate
the orientation density function (ODF) of a diffusion pattern
(Tournier et al., 2004). In general, the lower order (0th or 2nd)
spherical harmonics (SH) obtained by SHD represent the
isotropic diffusion or single fiber diffusion patterns, whereas
the higher orders (4th or higher) represent non-Gaussian patterns
associated with intravoxel multiple fiber components. However,
compared with DTI, a major disadvantage of the SHD method
is that the calculated SHs are actually rotation-variant, i.e., the
magnitude and the phase value of the decomposed SH (1st
order or higher) change with the rotation of the diffusion profile
with respect to the coordinate system. This drawback was
indicated by a simulation presented by Frank (2002) but has not
yet been explicitly addressed. A ‘‘grouped’’ index from the
different order harmonics, e.g., the sum of the squared harmonic
magnitudes, as suggested by Goldberg-Zimring et al. (2004), is
less sensitive to the imaging objects’ rotation. However, the
information of individual SHD maps is mixed up within the
grouped index. As a result, the SHD maps calculated from the
existing SHD methods cannot be used individually to ensure
rotation-invariant comparisons between different brain regions or
across subjects.
Zhan et al. (2003) proposed an alternative method named
‘‘diffusion circular spectrum mapping’’ (DCSM) for characteriz-
ing the HARD profiles of multiple fiber components. DCSM
only examines the ADC distribution along the circle spanned by
the major and medium eigenvectors and applies a 1-D Fourier
transform onto this circular ADC distribution. It has been
demonstrated that the 0th, 2nd and 4th order circular harmonics
are associated with isotropic, single fiber and orthogonal fiber
crossing diffusion patterns, respectively. Recently, the DCSM
method was further extended to identify not only the existence
but also the orientation of intravoxel fiber crossings by using
the phase information of the circular harmonics (Zhan et al.,
2004). Unlike the regular SHD method mentioned above, the
DCSM components can be used as rotation-invariant maps as
DTI-based indices such as factional anisotropy (FA) and mean
diffusivity (MD).
In this paper, a new rotation-invariant SHD (RI-SHD)
technique is presented based on the rotation-invariant property
of DTI. The basic idea of this method is to reorient the
measured diffusion profile according to the eigen-system of the
diffusion tensor in each voxel, and then apply a SHD algorithm
to the reoriented ADC profile. Computer simulations and in
vivo experiments were performed to validate this method by
using an equivalent rotation created by different diffusion
encoding schemes. Results are compared between the regular
SHD method and the proposed method, indicating that while the
regular SHD maps vary significantly with rotation, the
corresponding maps of proposed method remain unchanged. In
particular, the (0,0)-th, (2,2)-th and (4,4)-th harmonic component
maps obtained from the RI-SHD method exhibited good
consistency with the 0th, 2nd and 4th order maps from the
DCSM method, respectively. Compared with regular SHD
methods, the proposed RI-SHD method is superior in character-
izing intravoxel multiple fibers in different brain regions or
across subjects.
Theory
For an arbitrary imaging voxel, let Dapp(h, /) (0 � h � p,0 < / � 2p) be the ADC profile measured by a HARD
technique, where (h, /) denotes the polar and azimuths angles
respectively of the spherical coordinate system of the measure-
ment. The spherical harmonic decomposition (SHD) is regularly
performed such that
alm ¼Z 2p
0
Z p
0
Dapp h;/ð ÞYml h;/ð Þsin hð Þdhd/ ð1Þ
where alm is generally a complex coefficient representing the
m-th degree of the l-th (�l � m � l) order spherical harmonic
(i.e., abbreviated as (l,m)-th SHD component), whereas Ylm(h,
/) is the corresponding SH kernel function given by
Yml h;/ð Þ ¼ 2l þ 1ð Þ l � mð Þ!
4p l þ mð Þ!
�� 1=2
Pml coshð Þexp � jm/ð Þ ð2Þ
where Plm(I) denotes the m-th degree of the l-th order associated
Legendre function. In the context of the SHD defined above,
the ADC profile can be written as an expansion of the Laplace
series up to an infinite order, i.e.,
Dapp h;/ð Þ ¼XVl¼ 0
Xlm ¼�l
almYml h;/ð Þ ð3Þ
According to the Parseval’s theorem (Champeney, 1989) of the
spherical Fourier transform, we have
Z 2p
0
Z p
0
jDapp h;/ð Þj2sin hð Þdhd/ ¼XVl¼ 0
Xlm ¼�l
j alm j2 ð4Þ
Eq. (4) implies that the sum of squared magnitude of all SHD
components is strictly rotation-invariant, although the specificity
of individual SHD components is lost in the sum.
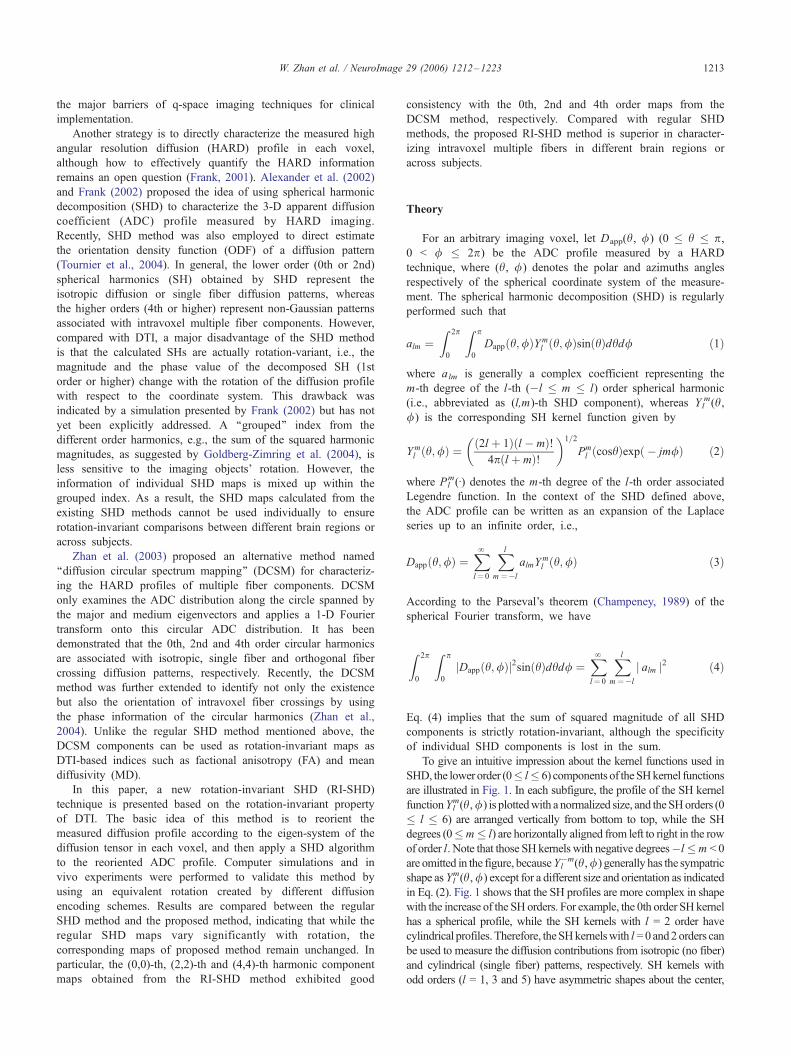
To give an intuitive impression about the kernel functions used in
SHD, the lower order (0� l� 6) components of theSHkernel functions
are illustrated in Fig. 1. In each subfigure, the profile of the SH kernel
functionYlm(h,/) is plottedwith a normalized size, and theSHorders (0
� l � 6) are arranged vertically from bottom to top, while the SH
degrees (0�m� l) are horizontally aligned from left to right in the row
of order l. Note that those SH kernels with negative degrees�l�m < 0
are omitted in the figure, becauseYl�m(h,/) generally has the sympatric
shape asYlm(h,/) except for a different size and orientation as indicated
in Eq. (2). Fig. 1 shows that the SH profiles are more complex in shape
with the increase of the SH orders. For example, the 0th order SH kernel
has a spherical profile, while the SH kernels with l = 2 order have
cylindrical profiles. Therefore, theSHkernelswith l =0and2orders can
be used to measure the diffusion contributions from isotropic (no fiber)
and cylindrical (single fiber) patterns, respectively. SH kernels with
odd orders (l = 1, 3 and 5) have asymmetric shapes about the center,

Fig. 1. The profiles of lower order SH kernel functions are arranged in a triangle array and normalized in size. The number of order (0 � l � 6) increases from
bottom to top and the number of degree (0 � m � l) is arranged horizontally from left to right. The SH kernels with a negative number of degree have the same
shape as the positive degree counterparts. The 0th order profile is an isotropic sphere, the 2nd order components have a cylindrical shape, and the 4th and 6th
order components have increasingly complex profile shapes. The enlarged profile in the bottom-right corner corresponds to the (4,4)-th SH kernel function that
has a four-leaf profile similar to an ADC profile of an orthogonal fiber crossing.
Fig. 2. The digital phantom includes spherical object I (isotropic diffusion),
spherical object II (planar diffusion), cylindrical object III (linear diffusion
parallel to its axis), curved cylindrical objects IV and V (linear diffusion
patterns) and cylindrical object VI (linear diffusion) placed perpendicular to
the slice. In areas (A–D), fiber crossings were simulated with various
intersection angles.
W. Zhan et al. / NeuroImage 29 (2006) 1212–12231214
and thus may only reflect imaging noises and/or artifacts rather than
real diffusion patterns (Frank, 2002). The SH kernel profiles with an
order l = 4 or 6 have shapes with multiple maxima, and thus may be
used to characterize the complex diffusion patterns of multiple fibers.
In particular, the (4,4)-th SH kernel component (i.e., l = 4 and m = 4)
has a four-leaf shape similar to the ADC profile of an idea
orthogonal fiber crossing, and therefore the (4,4)-th SHD component
could be used to provide an intravoxel fiber crossing map. Due to the
anisotropic profiles of the SH kernels (except the 0th order), the
rotation of any anisotropic ADC profile with respect to the spherical
coordinate system may lead to the change of corresponding SHD
coefficients, resulting in the rotation-variant property of the regular
SHD method.
The proposed RI-SHD method is based on the rotation-invariant
property of the diffusion tensor model. Let D be the diffusion tensor
estimated from the spherical ADC distribution Dapp(h, /). In our
method, a rotation manipulation is performed in each voxel on the
Dapp(h, /) from the laboratorial coordinate system (h, /) to a
‘‘local’’ coordinate system (hV,/V) that is determined byD, such that
DappV hV/Vð Þ ¼ V1V2V3½ Dapp h;/ð Þ ð5Þ
whereV1,V2, andV3 are the major, medium andminor eigenvectors
of the tensor D associated with the corresponding eigenvalues k1 k2 k3, respectively. In Eq. (5), the ADC profiles Dapp(h, /) and
DappV (hV, /V) should be written in a form of 3� N matrix, in which
each column corresponds to the vector of a diffusion weighting on
the ADC profile and N is the number of all measurements. The
rotation matrix [V1 V2 V3] can be alternatively written as a function
of the rotation angles, i.e.,
V1V2V3½ ¼ Rx að ÞRy bð ÞRz cð Þ ð6Þ
where a, b and c are the rotation angles about x-, y- and z- coordinateaxis, respectively, andRx(a),Ry(b), andRz(c) are the matrix factors
of the rotation angle a, b and c, respectively, such that

W. Zhan et al. / NeuroImage 29 (2006) 1212–1223 1215
Rx að Þ ¼1 0 0
0 cosa sina0 � sina cosa
35
24
Ry bð Þ ¼cosb 0 � sinb0 1 0
sinb 0 cosb
35
24 and
Rz cð Þ ¼cosc sinc 0
� sinc cosc 0
0 0 1
35
24 ð7Þ
Thus, reorientation manipulation can be regarded as to rotate the
profileDapp(h,/) of angle (a, b, c) such that themajor, medium, and
minor eigenvectors of the orientated diffusion tensor are parallel
with the x-, y- and z-coordinate axis, respectively. The proposed RI-
SHD is obtained by applying a SHD to the reoriented ADC profile
DappV (hV, /V), i.e.
a Vlm ¼Z 2p
0
Z p
0
DappV hV;/Vð ÞYml hV;/Vð Þsin hVð ÞdhVd/V ð8Þ
where almV is the calculated RI-SHD coefficient with them-th degree
of the l-th order. Due to the fact thatDappV (hV,/V) has been reorientedaccording to the eigenvectors of the local diffusion tensor D, the
magnitude |almV | would be insensitive to the orientation of the
diffusion tensor, i.e., they have similar rotation-invariant property as
Fig. 3. The original diffusion encoding scheme E1 and its reoriented diffusion en
scheme, 256 points are approximately equally distributed on the unit sphere, and
with b value of 2500 (MM./cm) in diffusion-weighted MRI simulations or experim
c = k/2, c = k/4) about x-, y- and z-axis, respectively, as shown in c. A diffusion-w
dataset acquired with scheme E1 while the imaging objects were equivalently rot
those DTI-based indices calculated directly from the tensor eigen-
system.
Methods
Simulation study
For the convenience of comparison, we used a digital
phantom with the same structures as in our previous studies
(Zhan et al., 2003, 2004) to validate the rotation-invariant SHD
method described above. As shown in Fig. 2, objects I and II
were used to simulate tissues with isotropic and planar diffusion
patterns, with tensor eigenvalue ratios of 1:0.95:0.9 and
1:0.95:0.1, respectively. Objects III, IV, V and VI simulated
linear diffusion patterns, with an eigenvalue ratio of 1:0.1:0.1,
and the major eigenvector placed parallel to the object’s axis.
For object VI, the axis was perpendicular to the imaging slice.
Fiber intersection and ‘‘kissing’’ were simulated in areas (A),
(B), (C) and (D). In each fiber-crossing voxel, signal
contributions from individual fiber compartments were assumed
to be equal. The maximal ADC was corresponding to 1 � 10�3
(mm2/s). The in-plane matrix size was 128 � 128. Diffusion-
weighted MRI was simulated with 256 diffusion-encoding
directions approximately equally spaced on a spherical surface
with a b value of 2500 (s/mm2). An image without diffusion
coding scheme E2 is illustrated in subfigures a and b, respectively. In each
each point represents a direction to apply the diffusion weighting gradients
ents. The encoding scheme E2 is obtained by rotating E1 with angles (a = 0,
eighted dataset acquired with scheme E2 could be regarded as an equivalent
ated with angles (a = 0, c = k/2, c = k/4).

W. Zhan et al. / NeuroImage 29 (2006) 1212–12231216

Fig. 5. The 0th, 2nd and 4th order DCSM maps and the fractional
anisotropy (FA) map of the digital phantom acquired with encoding scheme
E1. No difference is detected between the maps before and after the
rotation, indicating that the DTI and DCSM methods are rotation-invariant.
In the 4th order DCSM maps, all the fiber crossing areas (A–D) are
identified.
W. Zhan et al. / NeuroImage 29 (2006) 1212–1223 1217
weighting (b = 0) was also generated. The simulations were
performed in a noisy environment with a signal-to-noise ratio
(SNR) of 200.
To assess the effects of object rotation, two rotation-related
diffusion encoding schemes were used to perform simulations
on the above digital phantom, simulating the diffusion-weighted
MRI experiments before and after phantom rotation, respec-
tively. Let two 3 � 256 matrixes E1 and E2 denote the two
diffusion encoding schemes with each column representing the
vector of one encoding direction (Fig. 3). The rotation
relationship between the two schemes can be written as
E2 ¼ Rx að ÞRy bð ÞRz cð Þ ð9Þ
That is, the second diffusion encoding scheme E2 can be
obtained by rotating the first scheme E1 with angles a, b and cabout the x-, y- and z-axis respectively. It is noted that, for the
diffusion-weighted MRI experiments on a static phantom, the
rotation of a diffusion encoding scheme at angles (a, b, c) can
be alternatively interpreted as an equivalent rotation of the
phantom at angles (-a, -b, -c) while the diffusion encoding
scheme remains unchanged. The obvious advantage of this
strategy for generating an equivalent phantom rotation is to
avoid the difficulties of repositioning the imaging slice(s).
In the present study, the rotation angles were set as (a = 0, c =
k/2, c = k/4). Therefore, the fiber crossings in areas (A), (B) and
(C) are reoriented to a plane approximately perpendicular to the
x –y plane, while the fiber crossings in area (D) are reoriented to
a plane approximately parallel to the x –y plane.
In vivo experiments
MRI experiments were performed on five normal human
subjects (2 males and 3 females, all right handed, aged 22–39)
on a 3T Siemens Allegra scanner. Informed consents were
obtained in accordance with the guidelines of the Institutional
Review Board at the National Institute on Drug Abuse. For each
subject, diffusion-weighted images were acquired using a
modified spin-echo EPI pulse sequence with the same b value
and diffusion-encoding scheme as those used in the digital
phantom simulations. The sampling bandwidth was 752 (Hz/
pixel) and the in-plane image matrix was 128 � 128. Ear plugs
were used to reduce noise, and foam packs were applied to
restrict head motion. Other basic imaging parameters were: TR =
1.3 s, TE = 136 ms, FOV = 24 � 24 cm2. Two coronal imaging
slices (4 mm thickness and 1 mm gap) were acquired
approximately parallel to the extension of the brain stem covering
the pons region. The acquisition was repeated 4 times to ensure
an enhanced signal-to-noise ratio (SNR) of about 70 and 15 for
the reference (b = 0) and the diffusion-weighted images,
respectively. The SNR was estimated by the ratio of the mean
intensity of a foreground region (e.g., the temporal lobe gray
matter) and the stander deviation of the image background region
Fig. 4. The lower order (0 � l � 6) SHD components magnitude maps of the dig
subfigures a and b for the diffusion-weighted datasets acquired with encoding sc
normalized in grayscale, and the SHD maps are displayed with the same arrangeme
in a and b indicate that the regular SHD method is rotation-variant. (a) The regul
dataset acquired with encoding scheme E1. In the enlarged map showing the (4,4)-
highlighted, but area (D) is not. (b) The regular SHD component maps of the digi
encoding scheme E2. Compared with the maps shown in a, the rotation-variant pr
fiber crossing area (D) is highlighted but other crossing areas (A–C) are not.
(e.g., at an image corner outside the brain). For the purpose of
correcting geometric distortion in the EPI images, field maps at
the imaging locations were acquired by using a fast dual gradient
echo sequence. An anatomical image corresponding to each
imaging slice was also obtained using a T1 weighted spin echo
sequence.
Similar to the digital phantom simulations, the diffusion-
weighted MRI experiments were performed twice on each subject
with the diffusion encoding schemes E1 and E2, respectively. By
comparing the original scheme E1 and its reoriented scheme E2, an
equivalent rotation at angles (a = 0, b = �p/2, c = �p/4) of thehead were generated without actually repositioning the subject and/
or the imaging slices. The total acquisition time was about 38 min
for the diffusion-weighted imaging on each subject.
Data processing
For each diffusion-weighted dataset acquired with a diffusion
encoding scheme, the following data processing procedures were
performed: (i) a procedure to correct the geometrical distortion due
to the susceptibility-induced field inhomogeneities (Jezzard and
Balaban, 1995) on the in vivo EPI images; (ii) the reference and
diffusion-weighted images were used to calculate the diffusion
ital phantom are calculated from the regular SHD method and illustrated in
heme E1 and E2, respectively. The SHD component maps are individually
nt as in Fig. 1. The differences between the corresponding SHD maps shown
ar SHD component maps of the digital phantom for the diffusion-weighted
th SHD component, the fiber crossings in phantom areas (A), (B and C) are
tal phantom for the diffusion-weighted dataset acquired with the reoriented
operty of the regular SHD method is clearly. In the (4,4)-th SHD map, the
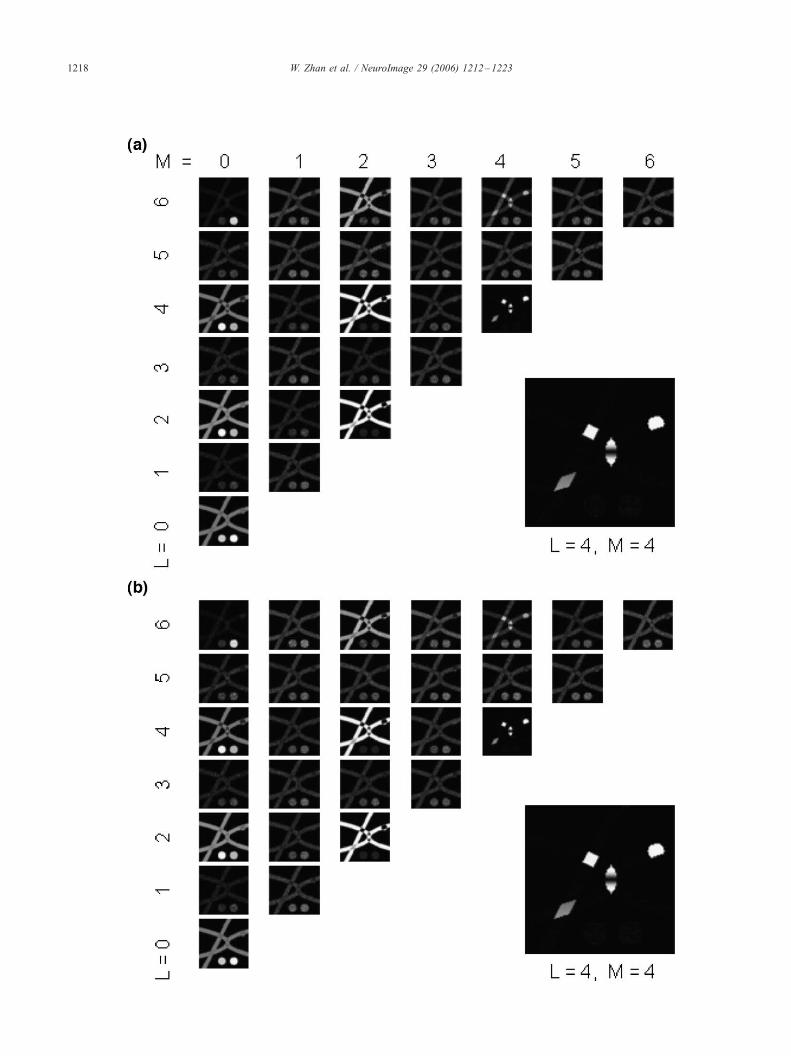
W. Zhan et al. / NeuroImage 29 (2006) 1212–12231218

W. Zhan et al. / NeuroImage 29 (2006) 1212–1223 1219
tensor eigen-system for each voxel (using a singular value
decomposition (SVD) algorithm), and DTI-based indices mean
diffusivity (MD) and fractional anisotropy (FA), etc.; (iii) the
diffusion circular spectrum mapping (DCSM) method (Zhan et al.,
2003) was performed to calculate the 0th, 2nd and 4th order
circular harmonic maps by using the same procedure as described
in our previous papers, except for the different number of diffusion
encoding directions; (iv) the regular SHD method was used to
calculate the lower order (l � 6) SHD maps according to Eqs. (1)
and (2); and (v) the proposed RI-SHD method was used to
calculate the RI-SHD maps with the lower orders (l � 6) according
to Eqs. (5) and (8).
It should be noted that data were processed according to
diffusion encoding scheme E1 in procedures (ii) through (v) for all
datasets acquired by either E1 or E2. As explained in the phantom
simulation method, the diffusion-weighted images acquired with
scheme E2 can be regarded as an equivalent dataset acquired with
scheme E1 while the objects were correspondingly rotated with
angles (a = 0, b = �p/2, c = �p/4).
Results
Phantom simulations
The magnitude SHD component maps of the digital phantom
calculated from the regular SHD method are plotted in Figs. 4a
and b for the diffusion dataset generated by the diffusion
encoding scheme E1 and E2, respectively. In each subfigure, the
lower order SHD component maps are aligned in a similar
triangle array as that of Fig. 2, and the grayscale of each SHD
component is individually normalized. As a comparison, DTI-
based FA map and the 0th, 2nd and 4th order DCSM maps are
illustrated in Fig. 5 for the original (E1) diffusion dataset, and
the results for the rotated (E2) diffusion dataset are essentially
identical (data not shown). After the equivalent rotation of the
digital phantom, however, the SHD component maps calculated
from the regular SHD method change significantly with the
rotation, except for the 0th order SHD map that indicates the
isotropic diffusion pattern (e.g., in the object I of the phantom).
In Fig. 4, the SHD components of the odd orders (l = 1, 3 and
5) are much more noisy than the even orders (l = 0, 2, 4 and
6), indicating that odd-order SHD components reflect noise and/
or image artifacts due to their asymmetric structures. It is
interesting to examine the maps of the (4,4)-th SHD component
(i.e., l = 4, m = 4) before and after the rotation and compare
them with the 4th order DCSM maps shown in Fig. 5. In Fig.
4a, the (4,4,)-th SHD map highlights fiber crossings in areas
(A), (B) and (C) where the fiber crossings lie parallel with the
imaging slice, but it fails to identify the crossing area (D) where
fiber crossings are embedded in the plane perpendicular to the
imaging slice. In Fig. 4b, however, the (4,4)-th SHD map
highlights the area (D) but does not highlight the areas (A), (B)
and (C) after the rotation.
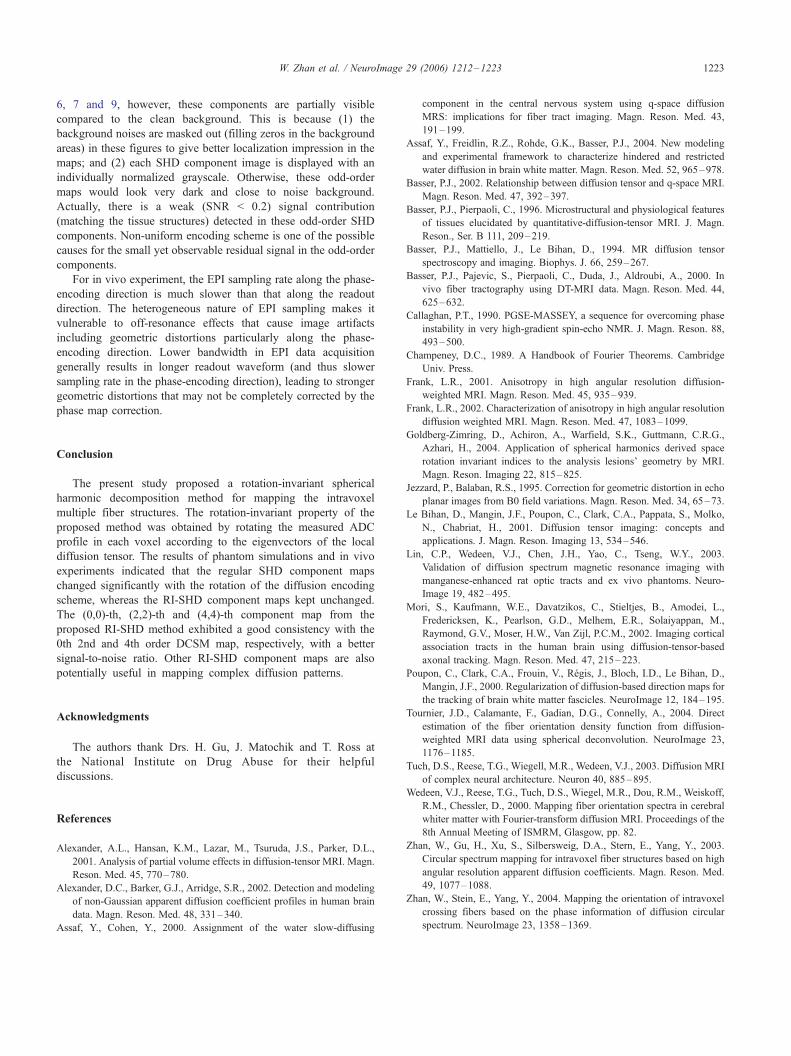
Fig. 6. The lower order (0 � l � 6) magnitude maps of RI-SHD components of the
with encoding scheme E1 and E2, respectively. The consistency between the corres
is rotation-invariant. Compared with Fig. 5, the (0.0)-th, (2,2)-th and (4,4)-th RI-S
order DCSM maps, respectively. In the enlarged (4,4)-th RI-SHD component ma
In contrast, the magnitude maps calculated from the
proposed RI-SHD method are illustrated in Figs. 6a and b for
the diffusion dataset before and after the rotation, respectively.
Clearly, the RI-SHD components exhibit the rotation-invariant
property. Rotation does not result in any recognizable change in
the displayed component maps. In particular, the (4,4)-th
component map in Fig. 6 successfully identifies all fiber
crossings in areas (A) (B) (C) and (D). The (0,0)-th, (2,2)-th
and (4,4)-th RI-SHD component maps in Fig. 6 are in excellent
agreement with the 0th , 2nd and 4th order DCSM maps shown
in Fig. 5, respectively. Compared with the corresponding 4th
order DCSM map (SNR � 80), the (4,4)-th RI-SHD component
map is less noisy (SNR � 120), suggesting its better noise-
suppression ability for identifying fiber crossings. Fig. 6 also
illustrates that the even-order (i.e., l = 2, 4,. . .) SHD component
maps with an odd-degree number (i.e., m = 1, 3,. . .) are
relatively noisier (SNR � 40) than the same order maps with an
even degree number (i.e. m = 0, 2, 4,. . .). The SNR of SHD
maps is defined in the same way as that the MRI images (see
Methods), except for one difference that the standard deviation
of noise in the background region should be calculated before
the background being clear out for display.
In vivo experiments
A typical coronal slice from one subject is used to illustrate
results of the in vivo experiments, as the data well consistent
across both subjects and brain slices. For the regular SHD
method, the magnitude maps of the lower order SHD
components are illustrated in Figs. 7a and b for the dataset
acquired by diffusion encoding scheme E1 and E2, respectively.
Similar to the simulation results, the SHD component maps
change significantly with the equivalent rotation of the
diffusion-encoding scheme, indicating again that the regular
SHD method is rotation-variant. Similar to Fig. 5, the FA map
and the 0th, 2nd and 4th order DCSM maps of the same slice
are shown in Fig. 8 for the original (E1) diffusion dataset, and
the results for the rotated (E2) diffusion dataset are essentially
identical (data not shown). Comparing the DCSM maps in Fig.
8 with the (0,0)-th, (2,2)-th and (4,4)-th SHD component maps
shown in Fig. 7 illustrate the rotation-invariant property the
DCSM method for the in vivo data. For example, the (4,4)-th
SHD component map in Fig. 7a fails to identify the fiber
crossing in the pons area, whereas the corresponding map in
Fig. 7b does not highlight the fiber crossings in the corpus
callosum and the cingulum bundle.
For the proposed RI-SHD method, the calculated maps
illustrated in Figs. 9a and b are calculated from the diffusion
dataset acquired before and after the equivalent rotation. The
rotation-invariant property of the proposed method is clearly
demonstrated. Compared with the DCSM maps shown in Fig. 8,
very little differences are found between the (0,0)-th, (2,2)-th
and (4,4)-th SHD component maps and the 0th, 2nd and 4th
order DCSM maps, respectively. Again, the (4,4)-th SHD
digital phantom are illustrated in subfigures a and b for the datasets acquired
ponding maps shown in a and b indicates that the proposed RI-SHD method
HD component maps exhibit a clear consistency with the 0th, 2nd and 4th
p, all the fiber crossings areas (A) (B) (C) and (D) are highlighted.

Fig. 7. A typical coronal imaging slice from one subject is used to illustrate the results of the in vivo MRI experiments. The regular SHD components maps of
the slice are illustrated in subfigures (a and b) for the diffusion-weighted datasets acquired with encoding scheme E1 and E2, respectively. The SHD component
maps are individually normalized in grayscale, and displayed in the same arrangement as used in Fig. 1. The differences between the corresponding maps
shown in (a and b) indicate that the regular SHD method is rotation-variant. (a) The regular SHD component maps of the coronal slice for the diffusion-
weighted dataset acquired with encoding scheme E1. In the enlarged map showing the (4,4)-th SHD component, the fiber crossings in the pons region (see the
4th order DCSM map shown in Fig. 8) are not identified. (b) The regular SHD component maps of the coronal slice for the diffusion-weighted dataset acquired
with the reoriented encoding scheme E2. In the (4,4)-th SHD map, the fiber crossings in the corpus callosum and fornix are not identified.
W. Zhan et al. / NeuroImage 29 (2006) 1212–12231220

Fig. 8. The 0th, 2nd and 4th order DCSM maps and the fractional
anisotropy (FA) of the coronal imaging slice of the brain acquired with
encoding scheme E1. No difference is detected between the maps before
and after the rotation. In the 4th order DCSM maps, all the fiber crossing
areas (A–D) are identified.
W. Zhan et al. / NeuroImage 29 (2006) 1212–1223 1221
component map exhibits a higher signal-to-noise ratio (SNR �50) than that of the 4th order DCSM map (SNR � 30).
Compared with the simulation results, the SNR difference
between the odd- and even-degree SHD components (both with
an even order) for the in vivo datasets is less significant.
Discussion
We have demonstrated the differences between the component
maps calculated from the regular SHD method and the proposed
RI-SHD method, while the imaging objects experienced an
equivalent rotation with respect to the diffusion encoding scheme.
Due to its rotation-invariant property, the proposed RI-SHD
method possesses an advantage over regular SHD method similar
to DTI’s advantage over previous techniques in characterizing
diffusion anisotropies. Although the rotation-variant drawback of
the regular SHD method was depicted by the simulation examples
in (Frank, 2002), it has not been explicitly stated that these SHD
components cannot be used as quantitative maps to ensure fair
comparisons between different brain regions or across subjects.
Some ‘‘energy’’ indices were usually used in the regular SHD
studies (Goldberg-Zimring et al., 2004; Frank, 2002), by summing
up the squared magnitude of the SHD components at different
orders to provide a certain degree of rotation-invariant property.
However, these indices were unable to provide the rotation-
invariant maps for individual SHD components.
It is worth noting that the rotation-invariant property of the
DCSM method and the proposed RI-SHD method are based on an
equivalent manipulation of the ADC profile reorientation accord-
ing to the diffusion tensor eigenvectors. In the DCSM method
described in (Zhan et al., 2003), the circular harmonic decom-
position is performed on the circle spanned by the major and
medium eigenvectors of the diffusion tensor. The DCSM algorithm
is equivalent to the following two calculation steps: (1) to rotate the
ADC profile into a new local coordinate system where the
reoriented major, medium and minor eigenvector of the reoriented
diffusion tensor is parallel with the x-, y- and z-axis, respectively;
and (2) to perform the circular harmonic decomposition along the
circle embedded in the x –y plane. For the proposed RI-SHD
method, the first step of ADC profile reorientation is the same as
that in the DCSM, whereas the second step is alternatively to
perform a spherical harmonic decomposition. Therefore, the
rotation-invariant property of both methods is introduced by the
reorientation procedure according to the diffusion tensor, i.e.,
depending on the rotation-invariant property of the diffusion
tensor. Due to the fact that the diffusion tensor model is only a
2nd order approximation to the actual diffusion process, it is
generally less sensitive to noise or artifacts compared with higher
order statistics, thus the estimated tensor eigenvectors provide a
relatively noise-robust yet rotation-invariant basis for estimating
higher order indices. Empirically, the proposed RI-SHD method
exhibited good robustness against the decrease of the encoding
directions (NE) and the SNR within a reasonable range. In the
described experimental settings, the RI-SHD decomposition results
of up to the 4th order kept a clear consistency when NE 90 and
SNR 60 for the reference image. The observed robust
components rose up to the 6th order while the NE and SNR were
increased to 128 and 80, respectively.
The consistency between the (4,4)-th component map of the
proposed RI-SHD method and the 4-th order DCSM map
suggests that the (4,4)-th RI-SHD component map can be used
to identify intravoxel orthogonal fiber crossings, since the 4-th
order DCSM map has been validated to do so in our previous
studies (Zhan et al., 2003, 2004). Similarly, the (0,0)-th and
(2,2)-th RI-SHD maps can also be used for identifying isotropic
and linear diffusion patterns, respectively. This can be explained
by the similarity between their SH kernel functions and the
corresponding ADC profiles of the isotropic, single fiber and
orthogonal fiber crossing diffusion patterns. Compared with the
4th order DCSM map, the (4,4)-th RI-SHD component map
exhibits a higher signal-to-noise ratio, especially for relatively
noisier diffusion-weighted datasets. This observed SNR advant-
age of the rotation-invariant SHD method can be explained by
the fact that the DCSM method uses only the ADC information
along the decomposition circle, leading to fewer diffusion
acquisition points (only those close to the circle) being
considered in the circular spectrum estimation.
Since the proposed RI-SHD method is rotation-invariant, its
individual components can be useful for mapping various diffusion
patterns. Besides the abovementioned (0,0)-th, (2,2)-th and (4,4)-th
SHD maps, other even-order maps might be used to identify
specific ADC profiles according to the SH kernel functions as
shown in Fig. 1. For example, the (4,0)-th component map might
be used to identify the diffusion of ‘‘a planar plus a perpendicular
linear’’ pattern. In Fig. 9, this (4,0)-th SHD component map
highlights gray matter areas, suggesting that there might exist a
linear diffusion compartment (single fiber) perpendicular to the
cortical surface coexisting with a planar structure lying in the
cortical surface in those voxels.
The odd-order components of the RI-SHD are supposed to
reflect the noise and/or artifacts of the imaging system. In Figs. 4,

Fig. 9. The RI-SHD component maps of the coronal slice are illustrated in subfigures (a and b) for the diffusion-weighted datasets acquired with encoding
scheme E1 and E2, respectively. The clear consistency between the corresponding maps shown in (a and b) indicates again that the proposed RI-SHD method is
rotation-invariant. Compared with Fig. 8, the (0.0)-th, (2,2)-th and (4,4)-th SHD component maps exhibit a clear consistency with the 0th, 2nd and 4th order
DCSM maps, respectively.
W. Zhan et al. / NeuroImage 29 (2006) 1212–12231222
W. Zhan et al. / NeuroImage 29 (2006) 1212–1223 1223
6, 7 and 9, however, these components are partially visible
compared to the clean background. This is because (1) the
background noises are masked out (filling zeros in the background
areas) in these figures to give better localization impression in the
maps; and (2) each SHD component image is displayed with an
individually normalized grayscale. Otherwise, these odd-order
maps would look very dark and close to noise background.
Actually, there is a weak (SNR < 0.2) signal contribution
(matching the tissue structures) detected in these odd-order SHD
components. Non-uniform encoding scheme is one of the possible
causes for the small yet observable residual signal in the odd-order
components.
For in vivo experiment, the EPI sampling rate along the phase-
encoding direction is much slower than that along the readout
direction. The heterogeneous nature of EPI sampling makes it
vulnerable to off-resonance effects that cause image artifacts
including geometric distortions particularly along the phase-
encoding direction. Lower bandwidth in EPI data acquisition
generally results in longer readout waveform (and thus slower
sampling rate in the phase-encoding direction), leading to stronger
geometric distortions that may not be completely corrected by the
phase map correction.
Conclusion
The present study proposed a rotation-invariant spherical
harmonic decomposition method for mapping the intravoxel
multiple fiber structures. The rotation-invariant property of the
proposed method was obtained by rotating the measured ADC
profile in each voxel according to the eigenvectors of the local
diffusion tensor. The results of phantom simulations and in vivo
experiments indicated that the regular SHD component maps
changed significantly with the rotation of the diffusion encoding
scheme, whereas the RI-SHD component maps kept unchanged.
The (0,0)-th, (2,2)-th and (4,4)-th component map from the
proposed RI-SHD method exhibited a good consistency with the
0th 2nd and 4th order DCSM map, respectively, with a better
signal-to-noise ratio. Other RI-SHD component maps are also
potentially useful in mapping complex diffusion patterns.
Acknowledgments
The authors thank Drs. H. Gu, J. Matochik and T. Ross at
the National Institute on Drug Abuse for their helpful
discussions.
References
Alexander, A.L., Hansan, K.M., Lazar, M., Tsuruda, J.S., Parker, D.L.,
2001. Analysis of partial volume effects in diffusion-tensor MRI. Magn.
Reson. Med. 45, 770–780.
Alexander, D.C., Barker, G.J., Arridge, S.R., 2002. Detection and modeling
of non-Gaussian apparent diffusion coefficient profiles in human brain
data. Magn. Reson. Med. 48, 331–340.
Assaf, Y., Cohen, Y., 2000. Assignment of the water slow-diffusing
component in the central nervous system using q-space diffusion
MRS: implications for fiber tract imaging. Magn. Reson. Med. 43,
191–199.
Assaf, Y., Freidlin, R.Z., Rohde, G.K., Basser, P.J., 2004. New modeling
and experimental framework to characterize hindered and restricted
water diffusion in brain white matter. Magn. Reson. Med. 52, 965–978.
Basser, P.J., 2002. Relationship between diffusion tensor and q-space MRI.
Magn. Reson. Med. 47, 392–397.
Basser, P.J., Pierpaoli, C., 1996. Microstructural and physiological features
of tissues elucidated by quantitative-diffusion-tensor MRI. J. Magn.
Reson., Ser. B 111, 209–219.
Basser, P.J., Mattiello, J., Le Bihan, D., 1994. MR diffusion tensor
spectroscopy and imaging. Biophys. J. 66, 259–267.
Basser, P.J., Pajevic, S., Pierpaoli, C., Duda, J., Aldroubi, A., 2000. In
vivo fiber tractography using DT-MRI data. Magn. Reson. Med. 44,
625–632.
Callaghan, P.T., 1990. PGSE-MASSEY, a sequence for overcoming phase
instability in very high-gradient spin-echo NMR. J. Magn. Reson. 88,
493–500.
Champeney, D.C., 1989. A Handbook of Fourier Theorems. Cambridge
Univ. Press.
Frank, L.R., 2001. Anisotropy in high angular resolution diffusion-
weighted MRI. Magn. Reson. Med. 45, 935–939.
Frank, L.R., 2002. Characterization of anisotropy in high angular resolution
diffusion weighted MRI. Magn. Reson. Med. 47, 1083–1099.
Goldberg-Zimring, D., Achiron, A., Warfield, S.K., Guttmann, C.R.G.,
Azhari, H., 2004. Application of spherical harmonics derived space
rotation invariant indices to the analysis lesions’ geometry by MRI.
Magn. Reson. Imaging 22, 815–825.
Jezzard, P., Balaban, R.S., 1995. Correction for geometric distortion in echo
planar images from B0 field variations. Magn. Reson. Med. 34, 65–73.
Le Bihan, D., Mangin, J.F., Poupon, C., Clark, C.A., Pappata, S., Molko,
N., Chabriat, H., 2001. Diffusion tensor imaging: concepts and
applications. J. Magn. Reson. Imaging 13, 534–546.
Lin, C.P., Wedeen, V.J., Chen, J.H., Yao, C., Tseng, W.Y., 2003.
Validation of diffusion spectrum magnetic resonance imaging with
manganese-enhanced rat optic tracts and ex vivo phantoms. Neuro-
Image 19, 482–495.
Mori, S., Kaufmann, W.E., Davatzikos, C., Stieltjes, B., Amodei, L.,
Fredericksen, K., Pearlson, G.D., Melhem, E.R., Solaiyappan, M.,
Raymond, G.V., Moser, H.W., Van Zijl, P.C.M., 2002. Imaging cortical
association tracts in the human brain using diffusion-tensor-based
axonal tracking. Magn. Reson. Med. 47, 215–223.
Poupon, C., Clark, C.A., Frouin, V., Regis, J., Bloch, I.D., Le Bihan, D.,
Mangin, J.F., 2000. Regularization of diffusion-based direction maps for
the tracking of brain white matter fascicles. NeuroImage 12, 184–195.
Tournier, J.D., Calamante, F., Gadian, D.G., Connelly, A., 2004. Direct
estimation of the fiber orientation density function from diffusion-
weighted MRI data using spherical deconvolution. NeuroImage 23,
1176–1185.
Tuch, D.S., Reese, T.G., Wiegell, M.R., Wedeen, V.J., 2003. Diffusion MRI
of complex neural architecture. Neuron 40, 885–895.
Wedeen, V.J., Reese, T.G., Tuch, D.S., Wiegel, M.R., Dou, R.M., Weiskoff,
R.M., Chessler, D., 2000. Mapping fiber orientation spectra in cerebral
whiter matter with Fourier-transform diffusion MRI. Proceedings of the
8th Annual Meeting of ISMRM, Glasgow, pp. 82.
Zhan, W., Gu, H., Xu, S., Silbersweig, D.A., Stern, E., Yang, Y., 2003.
Circular spectrum mapping for intravoxel fiber structures based on high
angular resolution apparent diffusion coefficients. Magn. Reson. Med.
49, 1077–1088.
Zhan, W., Stein, E., Yang, Y., 2004. Mapping the orientation of intravoxel
crossing fibers based on the phase information of diffusion circular
spectrum. NeuroImage 23, 1358–1369.