Embed Size (px)
Citation preview

A S C E N S I O N
C O N S O L I D A T E D I N T E R I M F I N A N C I A L S T A T E M E N T S
A N D S U P P L E M E N T A R Y I N F O R M A T I O N ( U N A U D I T E D )
For the Quarters Ended September 30, 2019 and 2018

Ascension
Consolidated Financial Statements
and Supplementary Information
Quarters Ended September 30, 2019 and 2018
Contents
Consolidated Financial Statements
Consolidated Balance Sheets ...........................................................................................................3
Consolidated Statements of Operations and Changes in Net Assets ...............................................5
Consolidated Statements of Cash Flows ..........................................................................................7
Notes to Consolidated Financial Statements....................................................................................9
Supplementary Information
Schedule of Net Cost of Providing Care of Persons
Living in Poverty and Other Community Benefit Programs ......................................................42

Ascension
Consolidated Balance Sheets (Dollars in Thousands)
3
September 30, June 30,
2019 2019
Assets
Current assets:
Cash and cash equivalents 1,162,679$ 896,262$
Short-term investments 104,643 92,072
Accounts receivable 3,210,236 3,172,747
Inventories 415,889 409,129
Due from brokers (see Notes 4 and 5) 93,840 324,977
Estimated third-party payor settlements 158,405 178,556
Other (see Notes 4 and 5) 997,835 959,477
Total current assets 6,143,527 6,033,220
Long-term investments (see Notes 4 and 5) 19,172,286 19,786,061
Property and equipment, net 10,684,268 10,851,422
Other assets:
Right-of-use assets - leases 1,471,349 -
Investment in unconsolidated entities 1,232,008 1,233,209
Capitalized software costs, net 602,759 641,533
Other (see Notes 4 and 5) 1,145,994 1,173,051
Total other assets 4,452,110 3,047,793
Total assets 40,452,191$ 39,718,496$
Continued on next page.

Ascension
Consolidated Balance Sheets (Dollars in Thousands)
4
September 30, June 30,
2019 2019
Liabilities and net assets
Current liabilities:
Current portion of long-term debt 106,482$ 125,577$
Long-term debt subject to short-term remarketing arrangements* 949,295 1,043,150
Current portion of lease obligations 270,940 -
Accounts payable and accrued liabilities (see Notes 4 and 5) 2,522,268 2,951,322
Estimated third-party payor settlements 582,319 599,959
Due to brokers (see Notes 4 and 5) 332,105 369,213
Current portion of self-insurance liabilities 272,044 269,561
Other 753,201 465,499
Total current liabilities 5,788,654 5,824,281
Noncurrent liabilities:
Long-term debt (senior and subordinated) 6,645,908 6,760,464
Lease obligations, less current portion 1,204,607 -
Self-insurance liabilities 685,861 675,860
Pension and other postretirement liabilities 1,494,127 1,580,867
Other (see Notes 4 and 5) 1,314,359 1,352,740
Total noncurrent liabilities 11,344,862 10,369,931
Total liabilities 17,133,516 16,194,212
Net assets:
Without donor restrictions:
Controlling interest 20,574,931 20,776,747
Noncontrolling interests 1,979,794 1,988,121
Total net assets without donor restrictions 22,554,725 22,764,868
Net assets with donor restrictions 763,950 759,416
Total net assets 23,318,675 23,524,284
Total liabilities and net assets 40,452,191$ 39,718,496$
The accompanying notes are an integral part of the consolidated financial statements.
*Co ns is ts o f variable ra te demand bo nds with put o ptio ns tha t may be exerc is ed a t the o ptio n o f the bo ndho lders , with s ta ted repayment
ins ta llments thro ugh 2047, as well as certa in s eria l mo de bo nds with s cheduled remarke ting/mandato ry tender da tes o ccurring prio r to J une 30,
2020. In the event tha t bo nds are no t remarke ted upo n the exerc is e o f put o ptio ns o r the s cheduled mandato ry tenders , management wo uld
utilize o ther s o urces to acces s the neces s ary liquidity. P o tentia l s o urces inc lude liquida ting inves tments , a draw o n the line o f credit to ta ling $ 1
billio n, and is s uing co mmerc ia l paper. The co mmerc ia l paper pro gram is s uppo rted by $ 300 millio n o f the $ 1 billio n line o f c redit.

Ascension
Consolidated Statements of Operations
and Changes in Net Assets (Dollars in Thousands)
5
2019 2018
Operating revenue:
Net patient service revenue 6,058,923$ 5,729,054
Other revenue 404,082 429,128
Total operating revenue 6,463,005 6,158,182
Operating expenses:
Salaries and wages 2,591,997 2,517,490
Employee benefits 555,521 558,620
Purchased services 729,919 641,306
Professional fees 332,139 314,139
Supplies 970,847 889,207
Insurance 71,054 71,880
Interest 65,837 67,584
Provider tax 164,354 160,198
Depreciation and amortization 319,423 303,135
Other 653,792 655,014
Total operating expenses before impairment, restructuring and
nonrecurring losses, net 6,454,883 6,178,573
Income (loss) from operations before self-insurance trust fund investment
return and impairment, restructuring and nonrecurring losses, net 8,122 (20,391)
Self-insurance trust fund investment return 3,752 9,482
Income (loss) from recurring operations 11,874 (10,909)
Impairment, restructuring and nonrecurring losses, net (34,990) (17,072)
Loss from operations (23,116) (27,981)
Nonoperating gains (losses):
Investment return (loss), net (203,809) 421,999
Other 17,340 64,873
Total nonoperating gains (losses), net (186,469) 486,872
Excess (deficit) of revenues and gains over expenses and losses (209,585) 458,891
Less noncontrolling interests 25,104 43,960
Excess (deficit) of revenues and gains over expenses and losses
attributable to controlling interest (234,689) 414,931
Continued on next page.
The three months ended
September 30,
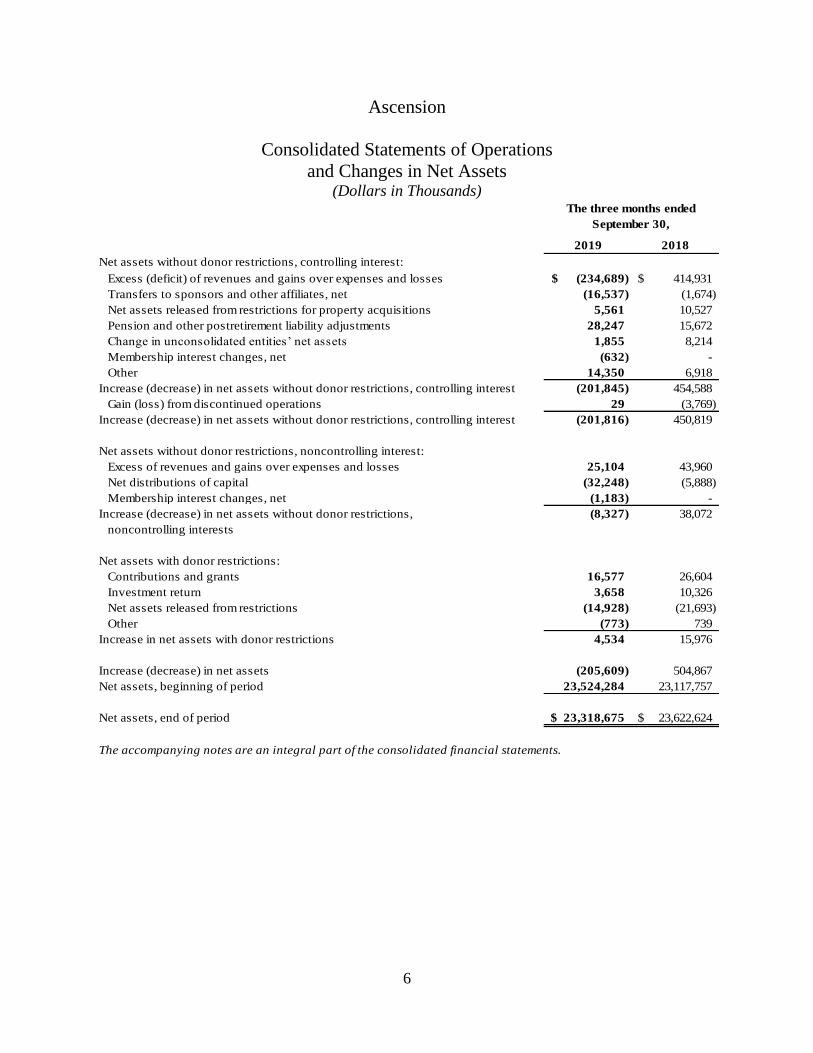
Ascension
Consolidated Statements of Operations
and Changes in Net Assets (Dollars in Thousands)
6
2019 2018
Net assets without donor restrictions, controlling interest:
Excess (deficit) of revenues and gains over expenses and losses (234,689)$ 414,931$
Transfers to sponsors and other affiliates, net (16,537) (1,674)
Net assets released from restrictions for property acquisitions 5,561 10,527
Pension and other postretirement liability adjustments 28,247 15,672
Change in unconsolidated entities’ net assets 1,855 8,214
Membership interest changes, net (632) -
Other 14,350 6,918
Increase (decrease) in net assets without donor restrictions, controlling interest (201,845) 454,588
Gain (loss) from discontinued operations 29 (3,769)
Increase (decrease) in net assets without donor restrictions, controlling interest (201,816) 450,819
Net assets without donor restrictions, noncontrolling interest:
Excess of revenues and gains over expenses and losses 25,104 43,960
Net distributions of capital (32,248) (5,888)
Membership interest changes, net (1,183) -
Increase (decrease) in net assets without donor restrictions,
noncontrolling interests
(8,327) 38,072
Net assets with donor restrictions:
Contributions and grants 16,577 26,604
Investment return 3,658 10,326
Net assets released from restrictions (14,928) (21,693)
Other (773) 739
Increase in net assets with donor restrictions 4,534 15,976
Increase (decrease) in net assets (205,609) 504,867
Net assets, beginning of period 23,524,284 23,117,757
Net assets, end of period 23,318,675$ 23,622,624$
The accompanying notes are an integral part of the consolidated financial statements.
The three months ended
September 30,

Ascension
Consolidated Statements of Cash Flows (continued) (Dollars in Thousands)
7
2019 2018
Operating activities
Increase (decrease) in net assets (205,609)$ 504,867$
Adjustments to reconcile increase (decrease) in net assets to net
cash provided by operating activities:
Depreciation and amortization 319,423 303,135
Amortization of bond premiums and debt issuance costs (5,657) (6,147)
Loss on extinguishment of debt (220) 55
Pension and other postretirement liability adjustments (28,247) (15,672)
Unrealized (gains) losses on investments, net 692,387 (222,834)
Change in fair value of interest rate swaps 10,504 (10,267)
Change in equity of unconsolidated entities (39,920) (41,053)
Loss (gain) on sale of assets, net 441 (25,311)
Impairment and nonrecurring expenses 1,633 483
Transfers to sponsor and other affiliates, net 16,537 1,674
Donor restricted contributions, investment return and other (20,450) (30,660)
Other restricted activity (875) (5,650)
Distributions of noncontrolling interest, net 32,248 5,888
Other 10,432 (70)
Increase (decrease) in:
Short-term investments (12,570) 3,389
Accounts receivable (27,457) 38,971
Inventories and other current assets (43,540) (35,531)
Due from brokers 231,137 (95,757)
Investments classified as trading (75,808) (211,840)
Other assets (2,137) (24,508)
Increase (decrease) in:
Accounts payable and accrued liabilities (434,386) (287,865)
Estimated third-party payor settlements, net (2,065) (36,403)
Due to brokers (37,108) 239,589
Other current liabilities 291,772 78,010
Self-insurance liabilities 12,484 (42,446)
Other noncurrent liabilities (80,304) (10,463)
Net cash provided by continuing operating activities 602,645 73,584
Net cash provided by (used in) discontinued operations 5,656 (3,568)
Net cash provided by operating activities 608,301 70,016
Continued on next page.
The three months ended
September 30,
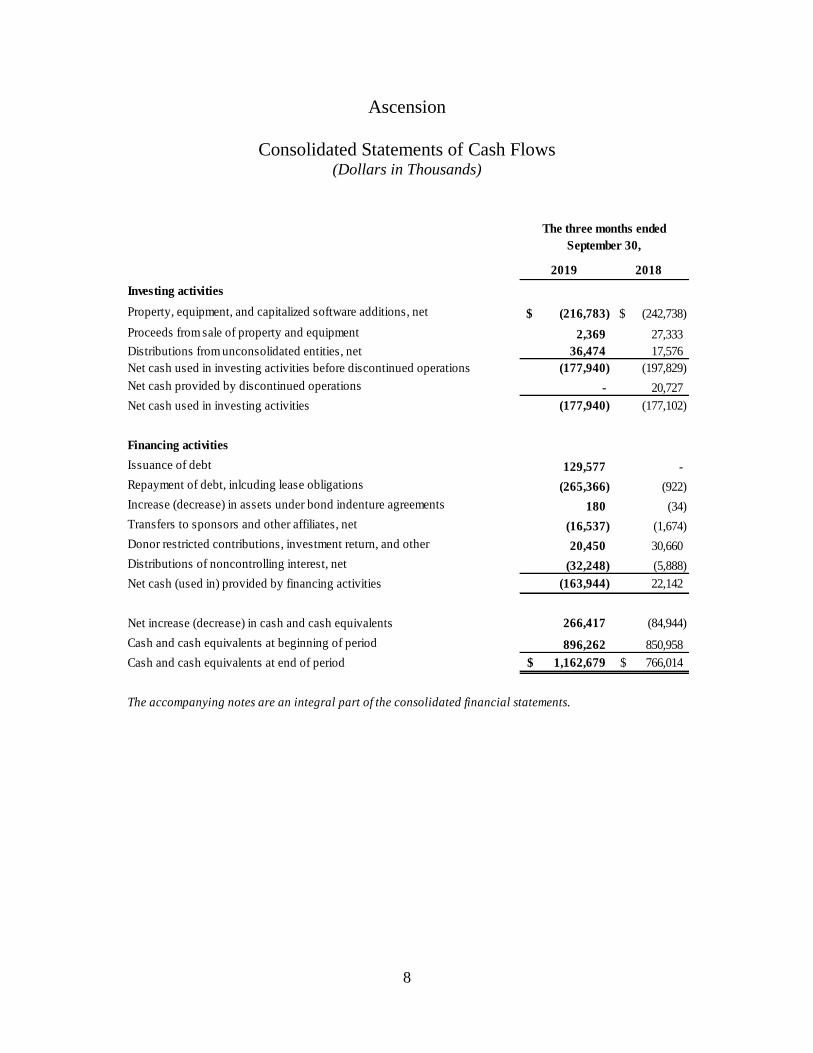
Ascension
Consolidated Statements of Cash Flows (Dollars in Thousands)
8
2019 2018
Investing activities
Property, equipment, and capitalized software additions, net (216,783)$ (242,738)$
Proceeds from sale of property and equipment 2,369 27,333
Distributions from unconsolidated entities, net 36,474 17,576
Net cash used in investing activities before discontinued operations (177,940) (197,829)
Net cash provided by discontinued operations - 20,727
Net cash used in investing activities (177,940) (177,102)
Financing activities
Issuance of debt 129,577 -
Repayment of debt, inlcuding lease obligations (265,366) (922)
Increase (decrease) in assets under bond indenture agreements 180 (34)
Transfers to sponsors and other affiliates, net (16,537) (1,674)
Donor restricted contributions, investment return, and other 20,450 30,660
Distributions of noncontrolling interest, net (32,248) (5,888)
Net cash (used in) provided by financing activities (163,944) 22,142
Net increase (decrease) in cash and cash equivalents 266,417 (84,944)
Cash and cash equivalents at beginning of period 896,262 850,958
Cash and cash equivalents at end of period 1,162,679$ 766,014$
The accompanying notes are an integral part of the consolidated financial statements.
The three months ended
September 30,
Ascension
Notes to Consolidated Financial Statements (continued) (Dollars in Thousands)
9
1. Organization and Mission
Organizational Structure
Ascension Health Alliance, d/b/a Ascension (Ascension), is a Missouri nonprofit corporation
formed on September 13, 2011. Ascension is a Catholic national health system consisting
primarily of nonprofit corporations that own and operate local healthcare facilities, or Ministry
Markets, located in 21 states and the District of Columbia. Ascension also serves as the member
or shareholder of various subsidiaries including, but not limited to:
• Ascension Care Management
• AscensionConnect
• Ascension Global Mission
• Ascension Holdings
• Ascension Leadership Academy
• Ascension Ministry Service Center
• Ascension Technologies
• Ascension Capital
o Ascension Investment Management (AIM)
o AV Holding Company
o Ascension Ventures (AV)
• The Resource Group
• Smart Health Solutions
Ascension is also the majority investor in Ascension Alpha Fund, LLC (Alpha Fund) as discussed
in the Pooled Investment Fund note. Ascension and its member organizations are hereafter referred
to collectively as the System.
Sponsorship
Ascension is sponsored by Ascension Sponsor, a Public Juridic Person. The Participating Entities
of Ascension Sponsor are the Daughters of Charity of St. Vincent de Paul, St. Louise Province;
the Congregation of St. Joseph; the Congregation of the Sisters of St. Joseph of Carondelet; the
Congregation of Alexian Brothers of the Immaculate Conception Province, Inc. – American
Province; and the Sisters of the Sorrowful Mother of the Third Order of St. Francis of Assisi –
US/Caribbean Province.

Ascension
Notes to Consolidated Financial Statements (continued) (Dollars in Thousands)
10
1. Organization and Mission (continued)
Mission
The System directs its governance and management activities toward strong, vibrant, Catholic
Ministries united in service and healing, and dedicates its resources to spiritually centered care
which sustains and improves the health of the individuals and communities it serves. In accordance
with the System’s mission of service to those persons living in poverty and other vulnerable
persons, each Ministry Market accepts patients regardless of their ability to pay. The System uses
four categories to identify the resources utilized for the care of persons living in poverty and
community benefit programs:
• Traditional charity care includes the cost of services provided to persons who cannot afford
healthcare because of inadequate resources and/or who are uninsured
or underinsured.
• Unpaid cost of public programs, excluding Medicare, represents the unpaid cost of services
provided to persons covered by public programs for persons living in poverty and other
vulnerable persons.
• Cost of other programs for persons living in poverty and other vulnerable persons includes
unreimbursed costs of programs intentionally designed to serve the persons living in poverty
and other vulnerable persons of the community, including substance abusers, the homeless,
victims of child abuse, and persons with acquired immune deficiency syndrome.
• Community benefit consists of the unreimbursed costs of community benefit programs and
services for the general community, not solely for the persons living in poverty, including
health promotion and education, health clinics and screenings, and medical research.
Discounts are provided to all uninsured and underinsured patients, including those with the means
to pay. Discounts provided to those patients who did not qualify for financial assistance are not
included in the cost of providing care of persons living in poverty and other community benefit
programs. The cost of providing care to persons living in poverty and other community benefit
programs is estimated by reducing charges forgone by a factor derived from the ratio of each
entity’s total operating expenses to the entity’s billed charges for patient care. Certain costs such
as graduate medical education and certain other activities are excluded from total operating
expenses for purposes of this computation.

Ascension
Notes to Consolidated Financial Statements (continued) (Dollars in Thousands)
11
1. Organization and Mission (continued)
The amount of traditional charity care provided, determined on the basis of cost, was $191,723
and $137,543 for the three months ended September 30, 2019 and 2018, respectively. The amount
of unpaid cost of public programs, cost of other programs for persons living in poverty and other
vulnerable persons, and community benefit cost is reported in the accompanying supplementary
information.
2. Significant Accounting Policies
Principles of Consolidation
All corporations and other entities for which operating control is exercised by the System or one
of its member corporations are consolidated, and all significant inter-entity transactions have been
eliminated in consolidation. Investments in entities where the System does not have operating
control are recorded under the equity or cost method of accounting. Income from unconsolidated
entities is included in consolidated excess of revenues and gains over expenses and losses in the
accompanying Consolidated Statements of Operations and Changes in Net Assets as follows:
2019 2018
Other revenue 38,438$ 20,005$
Nonoperating gains (504) 2,575
Three Months Ended
September 30,
Use of Estimates
Management has made estimates and assumptions that affect the reported amounts of certain
assets, liabilities, revenues, and expenses. Actual results could differ from those estimates.
Fair Value of Financial Instruments
Carrying values of financial instruments classified as current assets and current liabilities
approximate fair value. The fair values of financial instruments measured at fair value are disclosed
in the Fair Value Measurements note.

Ascension
Notes to Consolidated Financial Statements (continued) (Dollars in Thousands)
12
2. Significant Accounting Policies (continued)
New Accounting Standards Adopted
The System adopted Financial Accounting Standards Board (FASB) Accounting Standard Update
(ASU) No. 2016-02, Leases (Topic 842) on July 1, 2019. See the Leases footnote for additional
information.
The system adopted the FASB ASU 2017-07, Compensation – Retirement Benefits (Topic 715)
using the full retrospective method of application, and our accounting policies related to the cost
of benefits were revised accordingly effective July 1, 2019, as discussed below. The most
significant impact of adopting the new standard is to the presentation of the System’s Consolidated
Statement of Operations and Changes in Net Assets for employers that sponsor defined benefit
pension and post-retirement benefit plans, where the service cost component of net periodic benefit
cost related to these plans is now reported in the same financial statement line as other
compensation costs arising from services rendered during the period. The other components of net
periodic benefit cost are required to be presented separately from service cost and outside of
operating income. The prior period consolidated financial statements presented were adjusted
accordingly.
Cash and Cash Equivalents
Cash and cash equivalents consist of cash and interest-bearing deposits with original maturities of
three months or less.
Short-Term Investments
Short-term investments consist of investments with original maturities exceeding three months and
up to one year.
Inventories
Inventories, consisting primarily of medical supplies and pharmaceuticals, are stated at the lower
of cost or market value using first-in, first-out (FIFO) or a methodology that closely approximates
FIFO.
Ascension
Notes to Consolidated Financial Statements (continued) (Dollars in Thousands)
13
2. Significant Accounting Policies (continued)
Long-Term Investments and Investment Return
Investments, excluding investments in unconsolidated entities, are measured at fair value, are
classified as trading securities, and include pooled short-term investment funds; U.S. government,
state, municipal and agency obligations; corporate and foreign fixed income securities; asset-
backed securities; and equity securities. Investments also include alternative investments and other
investments which are valued based on the net asset value of the investments, as further discussed
in the Fair Value Measurements note. Investments also include derivatives held by the Alpha Fund,
also measured at fair value, as discussed in the Pooled Investment Fund note.
Long-term investments include assets limited as to use of approximately $1,354,000 and
$1,343,000 at September 30, 2019 and June 30, 2019, respectively, comprised primarily of
investments placed in trust and held by captive insurance companies for the payment of self-
insured claims and investments which are limited as to use, as designated by donors.
Purchases and sales of investments are accounted for on a trade-date basis. Investment returns
consist of dividends, interest, and gains and losses. The cost of substantially all securities sold is
based on the FIFO method. Investment returns, excluding returns of self-insurance trust funds, are
reported as nonoperating gains (losses) in the Consolidated Statements of Operations and Changes
in Net Assets, unless the return is restricted by donor or law. Investment returns of self-insurance
trust funds are reported as a separate component of income from operations in the Consolidated
Statements of Operations and Changes in Net Assets.
Property and Equipment
Property and equipment are stated at cost or, if donated, at fair market value at the date of the gift.
Depreciation is determined on a straight-line basis over the estimated useful lives of the related
assets. The range of estimated useful lives used in computing depreciation is as follows: buildings
and leasehold improvements, 2 to 40 years; and equipment, 2 to 20 years. Depreciation expense
for the three months ended September 30, 2019 and 2018 was $264,234 and $246,249,
respectively.

Ascension
Notes to Consolidated Financial Statements (continued) (Dollars in Thousands)
14
2. Significant Accounting Policies (continued)
A summary of property and equipment is as follows:
September 30, June 30,
2019 2019
Land and improvements 1,265,454$ 1,256,944$
Buildings and equipment 19,670,639 19,309,205
20,936,093 20,566,149
Less accumulated depreciation 10,863,079 10,605,708
10,073,014 9,960,441
Construction in progress 611,254 890,981
Total property and equipment, net 10,684,268$ 10,851,422$
Several capital projects have remaining construction and related equipment purchase commitments
of approximately $519,560 as of September 30, 2019.
Intangible Assets
Intangible assets primarily consist of goodwill and capitalized computer software costs, including
internally developed software. Costs incurred in the development and installation of internal use
software are expensed or capitalized depending on whether they are incurred in the preliminary
project stage, application development stage, or post-implementation stage, and the nature of the
costs. Intangible assets are included in the Consolidated Balance Sheets as presented in the table
that follows.
Capitalized software costs in the following table include software in progress of $82,461 and
$96,717 at September 30, 2019 and June 30, 2019, respectively:
September 30, June 30,
2019 2019
Capitalized software costs 2,348,533$ 2,342,789$
Less accumulated amortization 1,745,774 1,701,256
Capitalized software costs, net 602,759 641,533
Goodwill 258,317 255,581
Other, net 43,189 44,319
Intangible assets included in other assets 301,506 299,900
Total intangible assets, net 904,265$ 941,433$

Ascension
Notes to Consolidated Financial Statements (continued) (Dollars in Thousands)
15
2. Significant Accounting Policies (continued)
Intangible assets whose lives are indefinite, primarily goodwill, are not amortized and are
evaluated for impairment at least annually or when circumstances indicate a possible impairment
may exist, while intangible assets with definite lives, primarily capitalized computer software
costs, are amortized over their expected useful lives. Amortization expense for these intangible
assets for the three months ended September 30, 2019 and 2018 was $55,189 and $56,886,
respectively.
The System is substantially complete with a significant multi-year, System-wide enterprise
resource planning project (Symphony). Capitalized costs of Symphony were approximately
$363,000 at both September 30, 2019 and June 30, 2019 and are being amortized on a straight-line
basis over the expected useful life of the software. Accumulated amortization of Symphony was
approximately $245,000 and $235,000 at September 30, 2019 and June 30, 2019, respectively. See
the Impairment, Restructuring, and Nonrecurring Losses discussion below for additional
information about costs associated with Symphony.
Noncontrolling Interests
The consolidated financial statements include all assets, liabilities, revenues, and expenses of
entities that are controlled by the System and therefore consolidated. Noncontrolling interests in
the Consolidated Balance Sheets represent the portion of net assets owned by entities outside the
System, for those entities in which the System’s ownership interest is less than 100%.
Net Assets
Net Assets Without Donor Restrictions
Net assets without donor restrictions are those whose use by the System has not been limited by
donors and are available for general operating use.
Net Assets With Donor Restrictions
Net assets with donor restrictions include those whose use by the System has been limited by
donors for a specific time period or purpose, primarily for patient care, operations, and property
and equipment. This category also includes net assets restricted by donors to be maintained in
perpetuity, which include endowment funds.

Ascension
Notes to Consolidated Financial Statements (continued) (Dollars in Thousands)
16
2. Significant Accounting Policies (continued)
The income from these funds is used primarily to purchase equipment and to provide charity care
and other health and educational services. Contributions with donor-imposed restrictions that are
met in the same reporting period are reported as net assets without donor restrictions. Net assets
with donor restrictions consist solely of controlling interests of the System.
Performance Indicator
The performance indicator is the excess of revenues and gains over expenses and losses. Changes
in net assets without donor restrictions that are excluded from the performance indicator primarily
include pension and other postretirement liability adjustments, transfers to or from sponsors and
other affiliates, net assets released from restrictions for property acquisitions, and change in
unconsolidated entities’ net assets.
Operating and Nonoperating Activities
The System’s primary mission is to meet the healthcare needs in its market areas through a broad
range of general and specialized healthcare services, including inpatient acute care, outpatient
services, long-term care, and other healthcare services. Activities directly associated with the
furtherance of this purpose are considered to be operating activities. Other activities that result in
gains or losses peripheral to the System’s primary mission are considered to be nonoperating.
Net Patient Service Revenue and Accounts Receivable
Net patient service revenue relates to contracts with patients and in most cases involve a third-
party payor (Medicare, Medicaid, commercial and other managed care insurance companies) in
which the System’s performance obligations are to provide health care services. Net patient service
revenues are recorded at expected collectible amounts over the time in which obligations to provide
health care services are satisfied. Revenue is accrued to estimate the amount of revenue earned to
date for patients who have not been discharged and whose care services are not complete as of the
reporting period. Substantially all the System’s performance obligations are satisfied in one year.
The transaction price is determined based on gross charges for services provided, reduced by
contractual adjustments provided to third-party payers, discounts provided to uninsured patients
in accordance with our charity care policy, and implicit price concessions provided primarily to
uninsured patients. Patients who have health care insurance may also have discounts applied
related to their copayment or deductible. Implicit price concessions are recorded as a direct
reduction to net patient service revenue and are based primarily on historical collection experience.

Ascension
Notes to Consolidated Financial Statements (continued) (Dollars in Thousands)
17
2. Significant Accounting Policies (continued)
Estimates of contractual adjustments and discounts are determined by major payor classes for
inpatient and outpatient revenues based on contractual agreements, discount policies and historical
experience. Management continually reviews the contractual estimation process to consider and
incorporate updates to laws and regulations and frequent changes in commercial and managed care
contractual terms resulting from contract renegotiations and renewals.
Laws and regulations governing the Medicare and Medicaid programs are complex and subject to
interpretation. As a result, there is at least a reasonable possibility that recorded estimates will
change by a material amount in the near term. Adjustments to revenue related to prior periods
increased net patient service revenue by $16,121 and $11,128 for the three months ended
September 30, 2019 and 2018, respectively.
Settlements with third-party payers for retroactive revenue adjustments due to audits, reviews or
investigations are considered variable consideration and are included in the determination of the
estimated transaction price for providing patient care. Such estimates are determined through either
a probability-weighted estimate or an estimate of the most likely amount, depending on the
circumstances related to a given estimated settlement item.
These settlements are estimated based on the terms of the payment agreement with the payer,
correspondence from the payer and our historical settlement activity, including an assessment to
ensure that it is probable that a significant reversal in the amount of cumulative revenue recognized
will not occur when the uncertainty associated with the retroactive adjustment is subsequently
resolved. Estimated settlements are adjusted in future periods as adjustments become known, or
as years are settled or are no longer subject to such audits, reviews and investigations.
Net patient service revenue earned for the three months ended September 30, 2019 and 2018, is as
follows:
2019 2018
Inpatient care 2,890,114$ 2,727,713$
Ambulatory care 2,349,353 2,240,887
Physician practices 688,789 640,742
Long-term care 130,667 119,712
Total net patient service revenue $ 6,058,923 $ 5,729,054
Three months ended
September 30,

Ascension
Notes to Consolidated Financial Statements (continued) (Dollars in Thousands)
18
2. Significant Accounting Policies (continued)
The System grants credit without collateral to its patients. Net patient service revenues earned by
payor and significant concentrations of accounts receivable are as follows:
Medicare - traditional and managed 36 % 35 % 28 % 28 %
Medicaid - traditional and managed 13 14 11 11
Other commercial and managed care 44 43 41 41
Self-Pay and other 7 8 20 20
100 % 100 % 100 % 100 %
Net Patient
Service Revenue
Accounts
Receivable
2019 2019
September 30,
2019 2018
September 30, June 30,
Deductibles, copayments, and coinsurance under third-party payment programs which are the
patient’s responsibility are included within the primary payor category in the preceding table.
The primary collection risks relate to uninsured patient accounts, including patient accounts for
which the primary insurance carrier has paid the amounts covered by the applicable agreement,
but patient deductibles and copayments remain outstanding.
Implicit price concessions relate primarily to amounts due directly from patients. Estimated
implicit price concessions are recorded for all uninsured accounts, regardless of the aging of those
accounts. Accounts are written off when all reasonable internal and external collection efforts have
been performed.
The estimates for implicit price concessions are based upon management’s assessment of historical
write-offs and expected net collections, business and economic conditions, trends in federal, state
and private employer health care coverage and other collection indicators. Management relies on
the results of detailed reviews of historical write-offs and collections of revenues and accounts
receivable as a primary source of information in estimating the collectability of our accounts
receivable. Management updates the hindsight analysis at least quarterly, using primarily a rolling
twelve-month collection history and write-off data. These routine, quarterly changes in estimates
have not resulted in material adjustments to the valuations of accounts receivable or period-to-
period comparisons of results of operations.

Ascension
Notes to Consolidated Financial Statements (continued) (Dollars in Thousands)
19
2. Significant Accounting Policies (continued)
Other Operating Revenue
Other operating revenues are recorded at amounts the System expects to collect in exchange for
providing goods or services not directly associated with patient care and recorded over the time in
which obligations to provide goods or services are satisfied. The amounts recognized reflect
consideration due from customers, third party payors, and others.
Impairment, Restructuring, and Nonrecurring Losses
Long-lived assets are reviewed for impairment whenever events or business conditions indicate
the carrying amount of such assets may not be fully recoverable. Initial assessments of
recoverability are based on estimates of undiscounted future net cash flows associated with an
asset or group of assets.
Where impairment is indicated, the carrying amount of these long-lived assets is reduced to fair
value based on future discounted net cash flows or other estimates of fair value.
Nonrecurring expenses associated with Symphony primarily include deployment costs to
implement Symphony in certain Health Ministries.
During the three months ended September 30, 2019, the System recorded total impairment,
restructuring, and nonrecurring losses, net of $34,990. This amount was comprised primarily of
$6,373 of nonrecurring expenses associated with Symphony, one-time termination benefits and
other restructuring expenses of $23,945, and other nonrecurring expenses of $4,672.
During the three months ended September 30, 2018, the System recorded total impairment,
restructuring, and nonrecurring losses, net of $17,072. This amount was comprised primarily of
$185 of nonrecurring expenses associated with Symphony, one-time termination benefits and other
restructuring expenses of $13,063, and other nonrecurring expenses of $3,824.
Amortization
Bond issuance costs, discounts, and premiums are amortized over the term of the bonds using a
method approximating the effective interest method.
Capitalized software, including internally developed software, is amortized on a straight-line basis
over the expected useful life of the software.

Ascension
Notes to Consolidated Financial Statements (continued) (Dollars in Thousands)
20
2. Significant Accounting Policies (continued)
Income Taxes
The member healthcare entities of the System are primarily tax-exempt organizations under
Internal Revenue Code Section 501(c)(3) or Section 501(c)(2), and their related income is exempt
from federal income tax under Section 501(a). The System accounts for uncertainty in income tax
positions by applying a recognition threshold and measurement attribute for financial statement
recognition and measurement of a tax position taken or expected to be taken in a tax return. The
System has determined that no material unrecognized tax benefits or liabilities exist as of
September 30, 2019.
Regulatory Compliance
Ascension periodically undergoes investigations or audits by federal, state and local agencies
involving compliance with a variety of laws and regulations. These investigations seek to
determine compliance with, among other things, laws and regulations relating to Medicare and
Medicaid reimbursement, including billing practice for certain services. While no assurance can
be given concerning the outcome of any current investigation, management believes that adequate
reserves have been established, when available information indicates that a loss is probable and
the range of loss can be reasonably estimated, and the outcome of any current investigations will
not have a material effect on the accompanying consolidated financial statements of the System.
Reclassifications
Certain reclassifications were made to the accompanying September 30, 2018 consolidated
financial statements to conform to the September 30, 2019 presentation.
Subsequent Events
The System evaluates the impact of subsequent events, which are events that occur after the
Consolidated Balance Sheet date but before the consolidated financial statements are issued, for
potential recognition or disclosure in the consolidated financial statements as of the Consolidated
Balance Sheet date. For the three months ended September 30, 2019, the System evaluated
subsequent events through November 18, 2019, representing the date on which the accompanying
consolidated financial statements were issued.

Ascension
Notes to Consolidated Financial Statements (continued) (Dollars in Thousands)
21
3. Organizational Changes
Business Combinations
Bay County Health System, LLC – Florida
Effective March 14, 2019, Sacred Heart Health System, Inc. (Sacred Heart), a subsidiary of
Ascension, acquired the remaining interest in a joint venture previously owned by LHP Bay
County, LLC and Sacred Heart.
Divestitures
During the three months ended September 30, 2019 and 2018, Ascension, including certain of its
wholly owned subsidiaries, completed the sale of, or undertook actions to sell or transfer
ownership of, certain assets and liabilities.
Assets Held for Sale
On September 28, 2018, Ascension entered into an asset sale agreement to sell certain assets and
liabilities and substantially all related operations of St. Vincent’s Medical Center, an Ascension
subsidiary located in Bridgeport, Connecticut, to Hartford HealthCare Corporation. Assets and
liabilities held for sale at September 30, 2019 were $265,138 and $31,683,
respectively, and are included in other current assets and other current liabilities in the
accompanying Consolidated Balance Sheet. Assets and liabilities held for sale at June 30, 2019
were $265,816 and $39,938, respectively. The sale was completed on October 1, 2019.
Discontinued Operations
On September 1, 2018, Ascension completed the sale of substantially all assets and certain
liabilities of Our Lady of Lourdes Hospital at Pasco in Pasco, Washington, d/b/a Lourdes Health
Network, to RCCH HealthCare Partners.
The loss from discontinued operations was $3,769 for the three months ended September 30, 2018.

Ascension
Notes to Consolidated Financial Statements (continued) (Dollars in Thousands)
22
4. Pooled Investment Fund
At September 30, 2019 and June 30, 2019, a significant portion of the System’s investments
consists of the System’s interest in the Alpha Fund, a limited liability company organized in the
state of Delaware. Certain System investments, including some held by the Health Ministries and
their consolidated foundations, are managed outside of the Alpha Fund.
The Alpha Fund includes the investment interests of the System and other Alpha Fund members.
AIM, a wholly owned subsidiary of the System, serves as the manager and primary investment
advisor of the Alpha Fund, overseeing the investment strategies offered to the Alpha Fund’s
members.
AIM provides expertise in the areas of asset allocation, selection and monitoring of outside
investment managers, and risk management. The Alpha Fund is consolidated in the System’s
financial statements.
Ascension and the Alpha Fund invests in certain alternative investment funds which include
contractual commitments to provide capital contributions during the investment period, which is
typically five years and can extend to the end of the fund term. During these contractual periods,
investment managers may require investment in accordance with the terms of the agreement.
Commitments not funded during the investment period will expire and remain unfunded. As of
September 30, 2019, contractual agreements expire between October 2019 and September 2029.
The remaining unfunded capital commitments total approximately $1,661,000 for 219 individual
funds as of September 30, 2019. Due to the uncertainty surrounding whether the contractual
commitments will require funding during the contractual period, future minimum payments to
meet these commitments cannot be reasonably estimated. These committed amounts are expected
to be primarily satisfied by the liquidation of existing investments in the Alpha Fund.
In the normal course of business, the Fund enters into derivative contracts (derivatives) for trading
purposes following Fund guidelines. Derivatives in which the Fund may invest include options,
futures contracts, swaps, forward settling mortgage-backed securities, and index-based
instruments. Advisers selected by AIM to manage the Fund’s assets may actively trade futures
contracts, options, and foreign currency forward contracts. AIM may direct these advisers to
execute derivative transactions. These transactions are used to hedge against changes in the interest
rates, security prices, currency fluctuations, and other market developments to manage risk or for
the purposes of earning additional income. Derivatives are either exchange-traded or over the
counter contracts. Exchange-traded derivatives are standard contracts traded on a regulated
exchange. Over the counter contracts are private contracts negotiated with counterparties.
Ascension
Notes to Consolidated Financial Statements (continued) (Dollars in Thousands)
23
4. Pooled Investment Fund (continued)
See the Fair Value Measurements note for a discussion of how fair value for the Alpha Fund’s
derivatives is determined. At September 30, 2019 and June 30, 2019, the gross notional value of
Alpha Fund derivatives outstanding was approximately $8,174,000 and $9,347,000, respectively.
The fair value of Alpha Fund derivatives in an asset position was $47,104 and $75,647 at
September 30, 2019 and June 30, 2019, respectively, while the fair value of Alpha Fund derivatives
in a liability position was $86,279 and $57,771 at September 30, 2019 and June 30, 2019,
respectively. These derivatives are included in long-term investments in the accompanying
Consolidated Balance Sheets at September 30, 2019 and June 30, 2019.
The Alpha Fund also participates in a securities lending program, whereby a portion of the Alpha
Fund’s investments are loaned to selected established brokerage firms in return for securities from
the brokers as collateral for the investments loaned, usually on a short-term basis. The fair value
of collateral held by the Alpha Fund associated with such lending agreements amounts to $446,570
at September 30, 2019.
Due from brokers and due to brokers on the Consolidated Balance Sheets at September 30, 2019
and June 30, 2019, represent the Alpha Fund’s positions and amounts due from or to various
brokers, primarily for security transactions not yet settled, and cash held by brokers for securities
sold, not yet purchased.
5. Cash and Investments
The System’s cash and investments are reported in the Consolidated Balance Sheets as presented
in the table that follows. Total cash and investments, net, includes both the System’s membership
interest in the Alpha Fund and the noncontrolling interests held by other Alpha Fund members.
System unrestricted cash and investments, net, represent the System’s cash and investments
excluding the noncontrolling interests held by other Alpha Fund members and assets limited as to
use.

Ascension
Notes to Consolidated Financial Statements (continued) (Dollars in Thousands)
24
5. Cash and Investments (continued)
September 30, June 30,
2019 2019
Cash and cash equivalents 1,162,679$ 896,262$
Short-term investments 104,643 92,072
Long-term investments 19,172,286 19,786,061
Subtotal 20,439,608 20,774,395
Other Alpha Fund assets and liabilities:
In other current assets 44,365 41,461
In accounts payable and other accrued liabilities (10,148) (11,542)
In other noncurrent liabilities (282) (20)
Due (to) from brokers, net (238,265) (44,236)
Total cash and investments, net 20,235,278 20,760,058
Less noncontrolling interests of Alpha Fund 1,752,188 1,755,068
System cash and investments, including assets limited as to use 18,483,090 19,004,990
Less assets limited as to use:
Under bond indenture agreement 859 1,039
Self-insurance trust funds 644,392 639,006
With donor restrictions 709,135 703,017
Total assets limited as to use 1,354,386 1,343,062
System unrestricted cash and investments, net 17,128,704$ 17,661,928$
The composition of cash and cash equivalents, short-term investments and long-term investments,
which include certain assets limited as to use, is summarized as follows.
September 30, June 30,
2019 2019
Cash and cash equivalents and short-term investments 1,997,112$ 1,089,466$
Pooled short-term investment funds 197,495 728,104
U.S. government, state, municipal and agency obligations 2,314,863 2,741,689
Corporate and foreign fixed income securities 1,692,436 1,675,874
Asset-backed securities 3,087,861 3,078,928
Equity securities 5,070,609 5,358,824
Alternative investments and other investments:
Private equity and real estate funds 2,827,409 2,768,605
Hedge funds 1,808,092 1,839,334
Commodities funds and other investments 1,443,731 1,493,571
Total alternative investments and other investments 6,079,232 6,101,510
Total cash and cash equivalents, short-term investments,
and long-term investments 20,439,608$ 20,774,395$

Ascension
Notes to Consolidated Financial Statements (continued) (Dollars in Thousands)
25
5. Cash and Investments (continued)
Investment return recognized by the System for the three months ended September 30, 2019 and
2018, is summarized in the following table. Total investment return includes the System’s return
on certain investments held and managed outside the Alpha Fund and the investment return of the
Alpha Fund. System investment return represents the System’s total investment return, net of the
investment return earned by the noncontrolling interests of other Alpha Fund members.
2019 2018
Interest and dividends 76,048$ 69,973$
Net gain (loss) on investments reported at fair value (276,105) 361,508
Restricted investment return and unrealized gains, net 3,658 10,326
Investment return (loss), net (196,399) 441,807
Less return earned by noncontrolling interests of Alpha Fund 9,712 29,946
System investment return (loss), net (206,111)$ 411,861$
Three months ended
September 30,
Investment return is reduced by external and direct internal investment expenses.

Ascension
Notes to Consolidated Financial Statements (continued) (Dollars in Thousands)
26
6. Financial Assets and Liquidity Resources
As of September 30, 2019, financial assets and liquidity resources available within one year for
general expenditure, such as operating expenses, principal payments on debt, and capital
expenditures not financed with debt, are as follows: September 30,
2019
Financial assets:
Cash and cash equivalents 1,162,679$
Short term investments 104,643
Accounts receivable 3,210,236
Due from brokers 93,840
Other current assets 997,835
Long term investments 19,172,286
Total financial assets 24,741,519
Less:
Assets limited as to use and other restricted funds (1,463,649)
Noncontrolling interests of Alpha Fund (1,752,188)
Investments with liquidity more than one year (3,558,367)
Total financial assets available within one year 17,967,315
Liquidity resources:
Unused lines of credit 1,000,000
Total financial assets and liquidity resources available within one year 18,967,315$
As part of the System’s investment policy, highly liquid investments are held to enhance the
System’s ability to satisfy liquidity. The System also maintains lines of credit as further discussed
in the Long-Term Debt note.

Ascension
Notes to Consolidated Financial Statements (continued) (Dollars in Thousands)
27
7. Fair Value Measurements
The System measures the fair value of assets and liabilities in accordance with FASB ASC 820,
Fair Value Measurement. Under ASC 820, fair value is defined as the price that would be received
to sell an asset or paid to transfer a liability at the measurement date. Assets and liabilities reported
at fair value are classified and disclosed in one of the following four categories:
Level 1 – Quoted prices (unadjusted) that are readily available in active markets/exchanges for
identical assets or liabilities.
Level 2 – Pricing inputs other than quoted prices included in Level 1 that are observable for
the asset or liability, either directly or indirectly. Level 2 pricing inputs include prices quoted
for similar assets and liabilities in active markets/exchanges or prices quoted for identical or
similar assets and liabilities in markets that are not active. If the asset or liability has a specified
(contractual) term, a Level 2 input must be observable for substantially the full term of the
asset or liability.
Level 3 – Significant pricing inputs that are unobservable for the asset or liability, including
assets or liabilities for which there is little, if any, market activity for such asset or liability.
Inputs to determine the fair value of Level 3 assets and liabilities require management
judgment and estimation.
Net Asset Value – Values are based on the calculated net asset value. The calculated net asset
values for underlying investments are fair value estimates determined by an external fund
manager and other sources based on quoted market prices, operating results, balance sheet
stability, growth, and other business and market sector factors.
The System categorizes, for disclosure purposes, assets and liabilities measured at fair value in the
consolidated financial statements based upon whether the inputs used to determine their fair values
are observable or unobservable. Observable inputs are inputs that are based on market data
obtained from sources independent of the reporting entity. Unobservable inputs are inputs that
reflect the reporting entity’s own assumptions about pricing the asset or liability based on the best
information available in the circumstances.
In certain cases, the inputs used to measure fair value may fall into different levels of the fair value
hierarchy. In such cases, an asset’s or liability’s level within the fair value hierarchy is based on
the lowest level of input that is significant to the fair value measurement of the asset or liability.
The System’s assessment of the significance of a particular input to the fair value measurement in
its entirety requires judgment and considers factors specific to the asset or liability.

Ascension
Notes to Consolidated Financial Statements (continued) (Dollars in Thousands)
28
7. Fair Value Measurements (continued)
There were no significant transfers between Levels 1 and 2 during the three months ended
September 30, 2019 and September 30, 2018.
As of September 30, 2019, and June 30, 2019, the assets and liabilities listed in the fair value
hierarchy tables below use the following valuation techniques and inputs:
Cash and Cash Equivalents and Short-Term Investments
Cash and cash equivalents and certain short-term investments include certificates of deposit, whose
fair value is based on cost plus accrued interest. Significant observable inputs include security cost,
maturity, and relevant short-term interest rates. Other short-term investments designated as Level 2
investments primarily consist of commercial paper, whose fair value is based on the income
approach. Significant observable inputs include security cost, maturity, credit rating, interest rate,
and par value.
Pooled Short-term Investment Fund
The pooled short-term investment fund is a short-term exchange traded money market fund
primarily invested in treasury securities.
U S. Government, State, Municipal, and Agency Obligations
The fair value of investments in U.S. government, state, municipal, and agency obligations is
primarily determined using techniques consistent with the income approach. Significant
observable inputs include benchmark yields, reported trades, observable broker/dealer quotes, and
issuer spreads.
Corporate and Foreign Fixed Income Securities
The fair value of investments in U.S. and international corporate bonds and foreign government
bonds is primarily determined using techniques that are consistent with the market approach.
Significant observable inputs include benchmark yields, reported trades, observable broker/dealer
quotes, issuer spreads, and security-specific characteristics (e.g., such as early redemption
options).

Ascension
Notes to Consolidated Financial Statements (continued) (Dollars in Thousands)
29
7. Fair Value Measurements (continued)
Asset-backed Securities
The fair value of U.S. agency, mortgage, and other asset-backed securities is primarily determined
using techniques that are consistent with the income approach. Significant observable inputs
include prepayment speeds and spreads, benchmark yield curves, volatility measures, and
observable broker/dealer quotes.
Equity Securities
The fair value of investments in U.S. and international equity securities is primarily determined
using techniques that are consistent with the market and income approaches. The values for
underlying investments are based on readily available quoted market prices or represent fair value
estimates determined by an external fund manager based on market prices, operating results,
balance sheet stability, growth, dividend, dividend yield, and other business and market sector
fundamentals.
Alternative Investments and Other Investments
Alternative investments consist of private equity, hedge funds, private equity funds, commodity
funds, and real estate partnerships. The fair value of private equity is primarily determined using
techniques consistent with both the market and income approaches, based on the System’s
estimates and assumptions in the absence of observable market data. The market approach
considers comparable company, comparable transaction, and company-specific information,
including but not limited to restrictions on disposition, subsequent purchases of the same or similar
securities by other investors, pending mergers or acquisitions, and current financial position and
operating results. The income approach considers the projected operating performance of the
portfolio company.
The fair value of hedge funds, private equity funds, commodity funds, and real estate partnerships
is primarily determined using net asset values, which approximate fair value, as determined by an
external fund manager based on quoted market prices, operating results, balance sheet stability,
growth, and other business and market sector fundamentals.
Other investments include derivative assets and derivative liabilities of the Alpha Fund, whose fair
value is primarily determined using techniques consistent with the market approach. Significant
observable inputs to valuation models include the time value of money, counterparty credit risk,
interest rates, Treasury yields, volatilities, credit spreads, maturity date, recovery rates, and the
current market and contractual prices of the underlying financial instruments.
Ascension
Notes to Consolidated Financial Statements (continued) (Dollars in Thousands)
30
7. Fair Value Measurements (continued)
Benefit Plan Assets
The fair value of benefit plan assets is based on original investment into a guaranteed fund, plus
guaranteed, annuity contract-based interest rates. Significant unobservable inputs to the guaranteed
rate include the fair value and average duration of the portfolio of investments underlying annuity
contract, the contract value, and the annualized weighted-average yield to maturity of the
underlying investment portfolio.
Interest Rate Swap Assets and Liabilities
The fair value of interest rate swaps is primarily determined using techniques consistent with the
income method. Under the income method, fair values are calculated based on present value of
expected future cash flows using discount rates appropriate with risks involved.
Significant observable inputs to valuation models include interest rates, Treasury yields,
volatilities, credit spreads, maturity, and recovery rates.
Investments Sold, Not Yet Purchased
The fair value of investments sold, not yet purchased is primarily determined using techniques
consistent with the income approach. Significant observable inputs to the income approach include
data points for benchmark, constant maturity curves, and spreads.

Ascension
Notes to Consolidated Financial Statements (continued) (Dollars in Thousands)
31
7. Fair Value Measurements (continued)
The following table summarizes fair value measurements, by level, at September 30, 2019, for all
financial assets and liabilities measured at fair value on a recurring basis in the System’s
consolidated financial statements:
Level 1 Level 2 Level 3 Total
September 30, 2019
Cash equivalents 54,097$ 602$ -$ 54,699$
Short-term investments 47,371 11,160 - 58,531
Pooled short-term investment funds 197,495 - - 197,495
U.S. government, state, municipal
and agency obligations - 2,314,863 - 2,314,863
Corporate and foreign fixed income securities - 1,672,641 19,795 1,692,436
Asset-backed securities - 2,756,171 331,690 3,087,861
Equity securities 4,776,226 73,400 8,670 4,858,296
Alternative investments and other investments:
Private equity and real estate funds 3,090 2,500 241,608 247,198
Commodities funds and other investments 24,695 (34,194) 1,160 (8,339)
Assets at net asset value:
Corporate and foreign fixed income securities -
Equity securities 212,313
Private equity and real estate funds 2,580,211
Hedge funds 1,808,092
Commodities funds and other investments 1,366,767
Cash and other investments not at fair value 1,969,185
Cash and investments 20,439,608$
Benefit plan assets, in other
noncurrent assets 460,286$ 57$ 50,371$ 510,714$
Interest rate swaps, in other noncurrent assets - 2,590 - 2,590
Investments sold, not yet purchased, in other
noncurrent liabilities - 282 - 282
Interest rate swaps, included in
other noncurrent liabilities - 147,404 - 147,404

Ascension
Notes to Consolidated Financial Statements (continued) (Dollars in Thousands)
32
7. Fair Value Measurements (continued)
For the three months ended September 30, 2019, the changes in the fair value of the assets and
liabilities measured using significant unobservable inputs (Level 3) consisted of the following:
Corporate and
Foreign Fixed
Income
Securities
Asset-Backed
Securities
Equity
Securities
Private Equity
and Real Estate
Funds
Commodities Funds
and Other
Investments
Benefit Plan
Assets
Three Months Ended
September 30, 2019
Beginning balance 3,655$ 203,694$ 8,386$ 333,434$ 1,247$ 50,078$
Total realized and unrealized
gains (losses):
Included in nonoperating
gains (losses) 89 (5,435) 257 (892) 1,876 -
Included in changes in
net assets - - - - 2 -
Purchases 16,504 110,954 31 6,074 443 190
Issuances - - - - - -
Sales (749) (7,470) (4) (22,708) (2,397) (252)
Transfers into Level 3 1,236 99,147 - - - 633
Transfers out of Level 3 (940) (69,200) - (74,300) (11) (278)
Ending balance 19,795$ 331,690$ 8,670$ 241,608$ 1,160$ 50,371$
The amount of total gains
or losses for the period
included in nonoperating gains
(losses) attributable to the
changes in unrealized gains or
losses relating to assets still held
at September 30, 2019 100$ (5,456)$ 285$ -$ 256$ -$
The basis for recognizing and valuing transfers into or out of Level 3, in the Level 3 rollforward,
is as of the beginning of the period in which the transfers occur.

Ascension
Notes to Consolidated Financial Statements (continued) (Dollars in Thousands)
33
7. Fair Value Measurements (continued)
The following table summarizes fair value measurements, by level, at June 30, 2019, for all
financial assets and liabilities measured at fair value on a recurring basis in the System’s
consolidated financial statements:
Level 1 Level 2 Level 3 Total
June 30, 2019
Cash equivalents 51,440$ 702$ -$ 52,142$
Short-term investments 52,989 20,206 - 73,195
Pooled short-term investment funds 728,104 - - 728,104
U.S. government, state, municipal
and agency obligations - 2,741,689 - 2,741,689
Corporate and foreign fixed income securities - 1,622,233 3,655 1,625,888
Asset-backed securities - 2,875,234 203,694 3,078,928
Equity securities 4,212,135 64,892 8,386 4,285,413
Alternative investments and other investments:
Private equity and real estate funds 2,868 2,500 333,434 338,802
Commodities funds and other investments 23,150 24,507 1,247 48,904
Assets at net asset value:
Corporate and foreign fixed income securities 49,986
Equity securities 1,073,411
Private equity and real estate funds 2,429,803
Hedge funds 1,839,334
Commodities funds and other investments 1,363,501
Cash and other investments not at fair value 1,045,295
Cash and investments 20,774,395$
Benefit plan assets, in other
noncurrent assets 461,534$ -$ 50,078$ 511,612$
Interest rate swaps, in other noncurrent assets - 3,174 - 3,174
Investments sold, not yet purchased, in other
noncurrent liabilities - 20 - 20
Interest rate swaps, included in
other noncurrent liabilities - 137,484 - 137,484

Ascension
Notes to Consolidated Financial Statements (continued) (Dollars in Thousands)
34
7. Fair Value Measurements (continued)
For the three months ended September 30, 2018, the changes in the fair value of the assets and
liabilities measured using significant unobservable inputs (Level 3) consisted of the following:
Short-term
investments
Corporate and
Foreign Fixed
Income
Securities
Asset-Backed
Securities
Equity
Securities
Private Equity
and Real Estate
Funds
Commodities Funds
and Other
Investments
Benefit Plan
Assets
Three Months Ended
September 30, 2018
Beginning balance 1,130$ 11,956$ 305,278$ 29,239$ 295,109$ 1,121$ 47,827$
Total realized and unrealized
gains (losses):
Included in nonoperating
gains (losses) (126) (84) (178) 776 20,979 16,154 -
Included in changes in
net assets - - - - - 11 - Purchases - 377 66,981 26 25,572 (1,201) 584
Sales - (1,003) (29,575) (70) - (1,773) (416)
Transfers into Level 3 - 23,773 7,622 - - 200
Transfers out of Level 3 - (4,348) - (18,164) - (412) (1,793)
Ending balance 1,004$ 30,671$ 350,128$ 11,807$ 341,622$ 13,900$ 46,402$
The amount of total gains
or losses for the period
included in nonoperating gains
(losses) attributable to the
changes in unrealized gains or
losses relating to assets still held
at September 30, 2018 -$ (152)$ (182)$ 822$ -$ 15,544$ -$
The basis for recognizing and valuing transfers into or out of Level 3, in the Level 3 rollforward,
is as of the beginning of the period in which the transfers occur.

Ascension
Notes to Consolidated Financial Statements (continued) (Dollars in Thousands)
35
8. Derivative Instruments
The System uses interest rate swap agreements to manage interest rate risk associated with its
outstanding debt. Interest rate swaps with varying characteristics are outstanding under the Master
Trust Indenture of the System. These swaps have historically been used to effectively convert
interest rates on variable rate bonds to fixed rates and rates on fixed rate bonds to variable rates.
At September 30, 2019 and June 30, 2019 the notional values of outstanding interest rate swaps
were $1,019,350 and $1,020,775, respectively.
The System recognizes the fair value of its interest rate swaps in the Consolidated Balance Sheets
as assets, recorded in other noncurrent assets, or liabilities, recorded in other noncurrent liabilities,
as appropriate.
The fair value of interest rate swaps in an asset position was $2,590 and $3,174 at September 30,
2019 and June 30, 2019, respectively. The fair value of interest rate swaps in a liability position
was $147,404 and $137,484 at September 30, 2019 and June 30, 2019, respectively.
The System’s interest rate swap agreements include collateral requirements for each counterparty
under such agreements, based upon specific contractual criteria, subject to master netting
arrangements. Collateral requirements are calculated based on the System’s credit ratings. The
applicable credit rating is the Senior Credit Group long-term debt credit ratings (Senior Debt Credit
Ratings), as obtained from each of two major credit rating agencies. Credit rating and the net
liability position of total interest rate swap agreements outstanding with each counterparty
determine the amount of collateral to be posted. No collateral was posted at September 30, 2019
and June 30, 2019.
The System does not account for any of its interest rate swaps as hedges, and accordingly, all
changes in the fair value of interest rate swaps are recognized in nonoperating gains (losses) in the
accompanying Consolidated Statements of Operations and Changes in Net Assets. The System
does not offset fair value amounts recognized for derivative instruments.

Ascension
Notes to Consolidated Financial Statements (continued) (Dollars in Thousands)
36
9. Leases
The System adopted FASB’s ASU 2016-02, Leases, on July 1, 2019, electing to apply the new
standard at the adoption date and not recast comparative periods presented. For leases that
commenced before the effective date of ASU 2016-02, the System also elected not to reassess
expired or existing contracts, lease classification, or initial direct costs. Using its incremental
borrowing rate, Ascension recorded right-of-use assets and liabilities for operating leases of
approximately $1,400,000 in its consolidated balance sheet, representing the present value of
remaining lease payments for operating leases.
At September 30, 2019, Ascension’s total right of use lease assets and related current and long-
term lease obligations were comprised primarily of operating leases.
The components of lease expense recognized in Other Operating Expenses in the Consolidated
Statement of Operations and Changes in Net Assets were as follows:
Three Months
Ended
September 30,
2019
Operating and finance lease cost 97,783$
Variable lease cost 20,583
Total lease cost 118,366$
The weighted-average remaining lease term for operating leases at September 30, 2019 was
approximately 9 years, while the weighted average discount rate for operating leases was
approximately 2.6%.

Ascension
Notes to Consolidated Financial Statements (continued) (Dollars in Thousands)
37
9. Leases (continued)
The following table reconciles undiscounted future operating and finance lease obligations for
each of the next five years and thereafter, as of September 30, 2019, to lease obligations recorded
on the Consolidated Balance Sheet at September 30, 2019.
Twelve Months Ending September 30,
Operating and
Finance Leases
2020 303,128$
2021 255,350
2022 218,974
2023 183,684
2024 139,747
Thereafter 556,861
Total future undiscounted lease obligations 1,657,744$
Less: amount of lease payments representing interest (182,197)
Present value of future lease obligations 1,475,547
Less: current portion of lease obligations (270,940)
Long-term lease obligations 1,204,607$
10. Retirement Plans
Defined-Benefit Plans
Certain System entities participate in defined-benefit pension plans (the System Plans), which are
noncontributory, defined-benefit pension plans. Benefits are based on each participant’s years of
service and compensation. Primarily all of the System Plans’ assets are invested in the Master
Pension Trust (the Trust).
The System Plans’ assets primarily consist of short-term investments, equity, fixed income, and
alternative investments, consisting of various hedge funds, real estate funds, private equity funds,
commodity funds, private credit funds, and certain other private funds. The investments in these
alternative investment funds may also include contractual commitments to provide capital
contributions during the investment period, which is typically five years, and may extend the end
of the fund term.

Ascension
Notes to Consolidated Financial Statements (continued) (Dollars in Thousands)
38
10. Retirement Plans (continued)
During these contractual periods, investment managers may require the System Plans to invest in
accordance with the terms of the agreement. Commitments not funded during the investment
period will expire and remain unfunded.
Contributions to the System Plans are based on actuarially determined amounts sufficient to meet
the benefits to be paid to participants. Most System defined benefit plans were frozen effective
December 31, 2012. Two of the System Plans remain ongoing at September 30, 2019.
The assets of the System Plans are available to pay the benefits of eligible employees and retirees
of all participating entities. In the event entities participating in the System Plans are unable to
fulfill their financial obligations under the System Plans, the other participating entities are
obligated to do so.
The following table provides the components of net periodic benefit costs for the System plans:
2019 2018
Components of net periodic benefit cost
Service cost, included in operating expenses 82$ 171$
Interest cost 84,997 97,335
Expected return on plan assets (176,153) (179,427)
Amortization of prior service credit (156) (629)
Amortization of actuarial loss 27,717 16,534
Net periodic benefit cost (63,513)$ (66,016)$
Three months ended
September 30,

Ascension
Notes to Consolidated Financial Statements (continued) (Dollars in Thousands)
39
11. Contingencies and Commitments
The System is involved in litigation and regulatory investigations arising in the ordinary course of
business. In the opinion of management, after consultation with legal counsel, these matters are
expected to be resolved without material adverse effect on the System’s Consolidated Balance
Sheet.
The System enters into agreements with non-employed physicians that include minimum revenue
guarantees. The terms of the guarantees vary. The maximum amount of future payments that the
System could be required to make under these guarantees is approximately $9,300.
The System entered into Master Service Agreements for information technology services provided
by third parties. The maximum amount of future payments that the System could be required to
make under these agreements is approximately $244,500.
Guarantees and other commitments represent contingent commitments issued by Ascension Health
Alliance Senior and Subordinate Credit Groups, generally to guarantee the performance of an
affiliate to a third party in borrowing arrangements such as commercial paper issuances, bond
financing, and other transactions. The terms of guarantees are equal to the terms of the related
debt, which can be as long as 21 years. The following represents the remaining guarantees and
other commitments of the Senior and Subordinate Credit Groups at September 30, 2019:
Hospital de la Concepcion 2017 Series A debt guarantee 23,330$
St. Vincent de Paul Series 2000 A debt guarantee 28,300
Other guarantees and commitments 43,961

Ascension
Notes to Consolidated Financial Statements (continued) (Dollars in Thousands)
40
12. Functional Expenses
Ascension provides healthcare services, including inpatient, outpatient, ambulatory, long-term
care and community-based services. Management support services include administration, finance
and accounting, revenue cycle, information technology, public relations, human resources, legal,
supply chain, risk management, compliance and other functions. Expenses are allocated to
healthcare services and management support services based on the functional department for
which they are incurred. Departmental expenses may include various allocations of costs based on
direct assignment, expenses or other methods.
Expenses by functional classification for the three months ended September 30, 2019 consist of
the following:
Health care
services
Management
support services Total
Salaries, wages, and employee benefits 2,939,671$ 207,847$ 3,147,518$
Purchased services and professional fees 766,797 295,261 1,062,058
Supplies 970,346 501 970,847
Other 1,152,149 122,311 1,274,460
Total operating expenses 5,828,963$ 625,920$ 6,454,883$
September 30, 2019
Expenses by functional classification for the three months ended September 30, 2018 consist of
the following:
Health care
services
Management
support services Total
Salaries, wages, and employee benefits 2,874,024$ 202,086$ 3,076,110$
Purchased services and professional fees 674,249 281,196 955,445
Supplies 888,872 335 889,207
Other 1,153,500 104,311 1,257,811
Total operating expenses 5,590,645$ 587,928$ 6,178,573$
September 30, 2018

Supplementary Information

Ascension
Schedule of Net Cost of Providing Care of Persons
Living in Poverty and Other Community Benefit Programs (Dollars in Thousands)
Three Months Ended September 30, 2019 and 2018
42
The net cost of providing care to persons living in poverty and other community benefit programs
is as follows:
2019 2018
Traditional charity care provided 191,723$ 137,543$
Unpaid cost of public programs for persons
living in poverty 283,686 237,533
Other programs for persons living in poverty
and other vulnerable persons 33,583 36,140
Community benefit programs 79,068 81,530
Care of persons living in poverty and other community
benefit programs 588,060$ 492,746$
September 30,

Management’s Discussion and Analysis of Financial Condition and Results of Operations for Ascension | 1
Management’s Discussion and Analysis of Financial Condition and Results of Operations for Ascension
For the three months ended September 30, 2019 and 2018
The following information should be read in conjunction with Ascension’s
consolidated financial statements and related notes to the consolidated
financial statements.

Management’s Discussion and Analysis of Financial Condition and Results of Operations for Ascension | 2
Introduction to Management’s Discussion and Analysis
The purpose of Management’s Discussion and Analysis of Financial Condition and Results of Operations (MD&A) is to provide a narrative explanation of the financial position and operations of Ascension (the System).
Unless otherwise indicated, all financial and statistical information included herein relates to continuing operations. MD&A includes the following sections:
• Strategic Direction
• Portfolio Changes
• New Accounting Standards Adopted
• Results of Operations — Consolidated
• Liquidity and Capital Resources
Strategic Direction
Ascension is driven by the changing consumer landscape to put our patients and their needs first. Providing care for all persons where, how and when they need it – that is the organization’s strategic purpose.
With a commitment to the Mission, Vision and Values of Ascension, the organization is working to optimize and transform core healthcare operations while also creating new models of care that help meet the needs of people in the communities we serve.
Ascension continues to make strategic and purposeful investments to improve the health of individuals and communities served, engage with consumers in new ways and support the shift to expanded ambulatory presence. To best position itself for the future, the organization is connecting with consumers when and where they need care.
Ascension is continuing its Mission-inspired Transformation initiative to accelerate new and innovative approaches to various operational areas. In alignment with the Advanced Strategic Direction, the Mission-inspired Transformation creates a roadmap for how Ascension will work to implement
new strategies while reimagining health and wellness for the sustainability of our organization and to have an even greater impact on all those we serve.
Portfolio Changes during the Quarter
On September 28, 2018, Ascension entered into an agreement to sell certain assets and liabilities and substantially all related operations of St. Vincent’s Medical Center, an Ascension subsidiary located in Bridgeport, Connecticut, to Hartford HealthCare Corporation. The sale was completed on October 1, 2019.
On September 1, 2019, Ascension and Allegan Healthcare Group, Inc., in Allegan, Michigan, signed a definitive agreement for Allegan to join Ascension Michigan. The independent, nonprofit Allegan Healthcare Group includes 25-bed Allegan General Hospital, a critical access hospital; Allegan Professional Health Services, Inc.; and Allegan General Hospital Foundation. The addition of Allegan General Hospital to Ascension Michigan will strengthen healthcare access and delivery to our western Michigan communities and ensure the continued provision of high quality healthcare well into the future.
New Accounting Standards Adopted
In February 2016, the Financial Accounting Standards Board (FASB) issued Accounting Standard Update (ASU) 2016-02, Leases (Topic 842), and a related ASU 2018-11, Leases (Topic 842): Targeted Improvements, in July 2018. The primary effect of prospectively adopting this guidance, effective for the System on July 1, 2019, is the recognition of right-of-use assets and obligations for operating leases and inclusion on the System’s Consolidated Balance Sheet.
The System also adopted FASB ASU 2017-07, Compensation – Retirement Benefits (Topic 715) using the full retrospective method of application. The most significant impact of adopting the new standard is to the presentation of employee benefit costs in the System’s Consolidated Statement of Operations and Changes in Net Assets. Only the service cost component of employer sponsored defined benefit pension and post-retirement benefit plans is now included in employee benefit costs. Other components of such benefit plans are required to be presented separately from the service cost and are included in nonoperating income. The prior period presented has been adjusted for comparability.
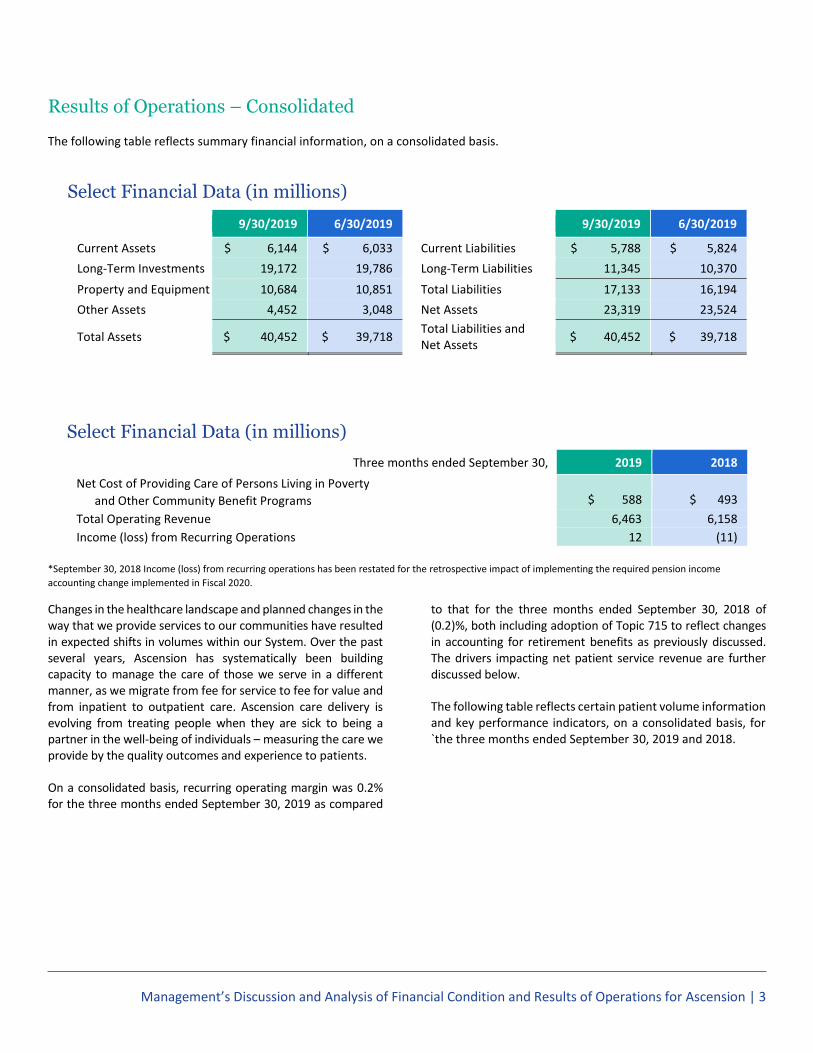
Management’s Discussion and Analysis of Financial Condition and Results of Operations for Ascension | 3
Results of Operations – Consolidated
The following table reflects summary financial information, on a consolidated basis.
Select Financial Data (in millions)
9/30/2019 6/30/2019 9/30/2019 6/30/2019
Current Assets $ 6,144 $ 6,033 Current Liabilities $ 5,788 $ 5,824
Long-Term Investments 19,172 19,786 Long-Term Liabilities 11,345 10,370
Property and Equipment 10,684 10,851 Total Liabilities 17,133 16,194
Other Assets 4,452 3,048 Net Assets 23,319 23,524
Total Assets $ 40,452 $ 39,718 Total Liabilities and Net Assets
$ 40,452 $ 39,718
Select Financial Data (in millions)
Three months ended September 30, 2019 2018
Net Cost of Providing Care of Persons Living in Poverty $ 588 $ 493 and Other Community Benefit Programs
Total Operating Revenue 6,463 6,158
Income (loss) from Recurring Operations 12 (11)
*September 30, 2018 Income (loss) from recurring operations has been restated for the retrospective impact of implementing the required pension income
accounting change implemented in Fiscal 2020.
Changes in the healthcare landscape and planned changes in the way that we provide services to our communities have resulted in expected shifts in volumes within our System. Over the past several years, Ascension has systematically been building capacity to manage the care of those we serve in a different manner, as we migrate from fee for service to fee for value and from inpatient to outpatient care. Ascension care delivery is evolving from treating people when they are sick to being a partner in the well-being of individuals – measuring the care we provide by the quality outcomes and experience to patients.
On a consolidated basis, recurring operating margin was 0.2% for the three months ended September 30, 2019 as compared
to that for the three months ended September 30, 2018 of (0.2)%, both including adoption of Topic 715 to reflect changes in accounting for retirement benefits as previously discussed. The drivers impacting net patient service revenue are further discussed below.
The following table reflects certain patient volume information and key performance indicators, on a consolidated basis, for `the three months ended September 30, 2019 and 2018.

Management’s Discussion and Analysis of Financial Condition and Results of Operations for Ascension | 4
Volume Trends and Key Performance Indicators
Three months ended September 30, 2019 2018
Volume Trends
Equivalent Discharges 439,013 434,590
Total Admissions 205,838 203,863
Case Mix Index 1.70 1.65
Acute Average Length of Stay (days) 4.46 4.41
Emergency Room Visits 839,183 837,602
Surgery Visits (IP & OP) 161,530 158,349
Physician Office and Clinic Visits 3,954,845 3,593,343
Revenue (in millions)
Total Operating Revenue $ 6,463 $ 6,158
Net Patient Service Revenue 6,059 5,729
Key Performance Indicators
Recurring Operating Margin 0.2% (0.2%)
Recurring Operating EBITDA Margin 6.2% 5.9%
Operating EBITDA Margin 5.7% 5.6%
Total Operating Revenue
Total operating revenue increased $305 million, or 4.9%, for the three months ended September 30, 2019, as compared to the same period in the prior year primarily due to expanding service line growth and sites of care as well as the acquisition of the remaining interest in the Bay County Health System (Bay County) joint venture effective March 14, 2019.
Net Patient Service Revenue and Volume Trends
For the period ended September 30, 2019, net patient service
revenue increased $330 million, or 5.8%, compared to the same
period in the prior year. Net patient service revenue per
equivalent discharge increased 4.7% compared to the same
period in the prior year primarily due to the 2.9% increase in
case mix index and inflationary increases in payor payments.
For the period ended September 30, 2019, equivalent
discharges, inpatient admissions, emergency room visits, and
inpatient surgeries increased 1.0%, 1.0%, 0.2%, and 1.5%,
respectively, as compared to the same period in the prior year
primarily due to the expansion of employed physicians in the
System, growth initiatives and the previously mentioned
acquisition of Bay County.
Outpatient volumes increased 2.4% compared to the same
period in the prior year primarily due to an increase in physician
office and clinic visits of 10.1% driven by our strategic purpose.
Outpatient surgeries increased 2.2% compared to the same
period in the prior year.
Community Benefit and Uncompensated Care
Ascension provided over $588 million in Care of Persons Living in Poverty and other Community Benefit Programs for the period ended September 30, 2019. Through programs, donations, health education, free care, and more, the organization’s uncompensated care and other community benefit fulfills unmet needs in communities across 21 states and the District of Columbia.
Total Operating Expenses
Total operating expenses increased $276 million, or 4.5%, as compared to the same period in the prior year primarily due to expanding service line and sites of care partially offset by continued expense management practices.
As volumes continue to shift to outpatient services, Ascension is managing its cost structure to align with revenues.
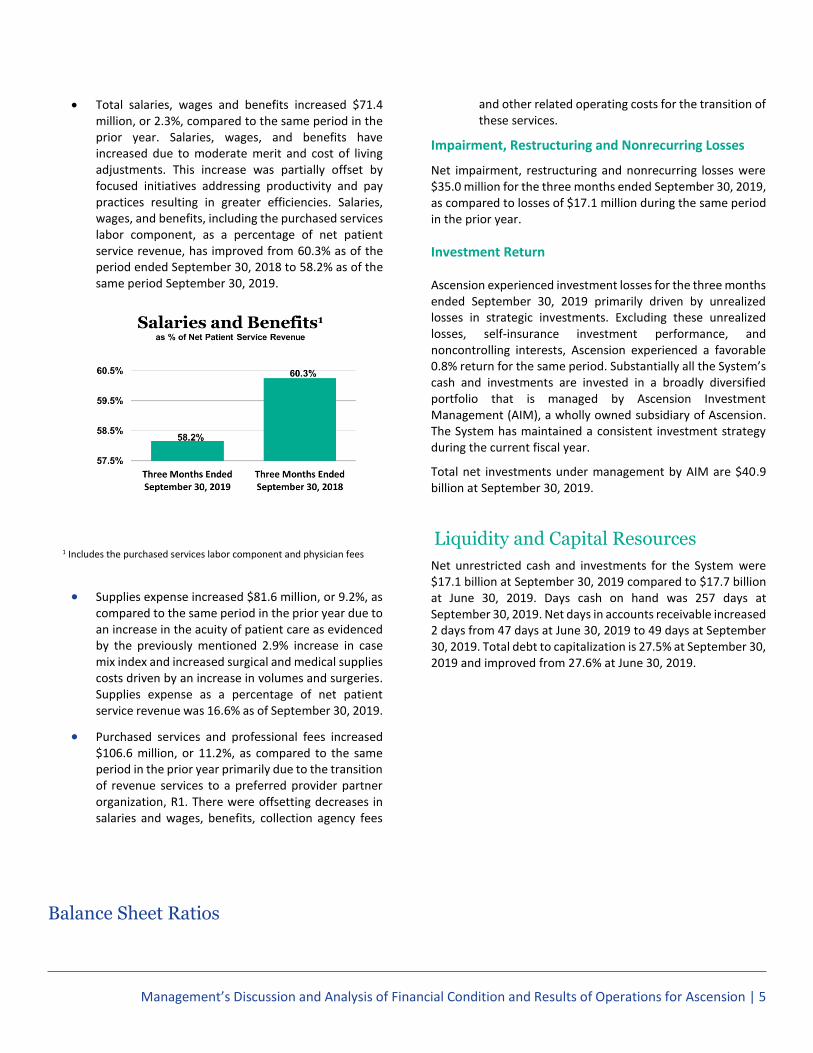
Management’s Discussion and Analysis of Financial Condition and Results of Operations for Ascension | 5
• Total salaries, wages and benefits increased $71.4 million, or 2.3%, compared to the same period in the prior year. Salaries, wages, and benefits have increased due to moderate merit and cost of living adjustments. This increase was partially offset by focused initiatives addressing productivity and pay practices resulting in greater efficiencies. Salaries, wages, and benefits, including the purchased services labor component, as a percentage of net patient service revenue, has improved from 60.3% as of the period ended September 30, 2018 to 58.2% as of the same period September 30, 2019.
• Supplies expense increased $81.6 million, or 9.2%, as compared to the same period in the prior year due to an increase in the acuity of patient care as evidenced by the previously mentioned 2.9% increase in case mix index and increased surgical and medical supplies costs driven by an increase in volumes and surgeries. Supplies expense as a percentage of net patient service revenue was 16.6% as of September 30, 2019.
• Purchased services and professional fees increased $106.6 million, or 11.2%, as compared to the same period in the prior year primarily due to the transition of revenue services to a preferred provider partner organization, R1. There were offsetting decreases in salaries and wages, benefits, collection agency fees
and other related operating costs for the transition of these services.
Impairment, Restructuring and Nonrecurring Losses
Net impairment, restructuring and nonrecurring losses were $35.0 million for the three months ended September 30, 2019, as compared to losses of $17.1 million during the same period in the prior year.
Investment Return
Ascension experienced investment losses for the three months ended September 30, 2019 primarily driven by unrealized losses in strategic investments. Excluding these unrealized losses, self-insurance investment performance, and noncontrolling interests, Ascension experienced a favorable 0.8% return for the same period. Substantially all the System’s cash and investments are invested in a broadly diversified portfolio that is managed by Ascension Investment Management (AIM), a wholly owned subsidiary of Ascension. The System has maintained a consistent investment strategy during the current fiscal year.
Total net investments under management by AIM are $40.9 billion at September 30, 2019.
Liquidity and Capital Resources
Net unrestricted cash and investments for the System were $17.1 billion at September 30, 2019 compared to $17.7 billion at June 30, 2019. Days cash on hand was 257 days at September 30, 2019. Net days in accounts receivable increased 2 days from 47 days at June 30, 2019 to 49 days at September 30, 2019. Total debt to capitalization is 27.5% at September 30, 2019 and improved from 27.6% at June 30, 2019.
Balance Sheet Ratios
1 Includes the purchased services labor component and physician fees

Management’s Discussion and Analysis of Financial Condition and Results of Operations for Ascension | 6
9/30/2019 6/30/2019
Days Cash on Hand 257 271
Net Days in Accounts Receivable 49 47
Cash-to-Senior Debt 224.4% 227.7%
Senior Debt to Capitalization 27.1% 27.2%
Total Debt to Capitalization 27.5% 27.6%

2019 2018Discharges by Service Type Acute Care 186,388 184,595 Psychiatric Care 13,489 14,013 Rehabilitation Care 3,035 3,135 Skilled Nursing Facility Care 626 792 Long Term Acute Care 371 339 Other L.T. Sub-Acute Care 1,929 988
Total Discharges by Service 205,838 203,863
Patient Days by Service Type Acute Care 831,434 815,000 Psychiatric Care 94,034 98,314 Rehabilitation Care 35,306 37,373 Skilled Nursing Facility Care 367,781 374,417 Assisted Living 67,200 82,822 Residential Living 3,574 3,220 Long Term Acute Care 11,343 10,934 Other L.T. Sub-Acute Care 163,416 161,327
Total Patient Days by Service 1,574,088 1,583,408
Newborn Births 22,428 22,731
Newborn Patient Days 42,043 44,860
Outpatient Visits (Includes ER Visits) 7,644,594 7,468,786
Surgical Visits - Outpatient 110,425 108,014
Emergency Room Visits 839,183 837,602
Full Time Equivalent Employees 138,818 139,927
Total Available Beds 28,928 28,419
Total Available Beds Excluding Bassinets 27,747 27,266
Ascension
Consolidated Statistical InformationFor the Year Ended
September 30,