Embed Size (px)
Citation preview
arX
iv:1
312.
4500
v1 [
astr
o-ph
.SR
] 16
Dec
201
3Astronomy & Astrophysicsmanuscript no. 201322477 c© ESO 2013December 17, 2013
Pulsating red giant stars in eccentric binary systems discoveredfrom Kepler space-based photometry
A sample study and the analysis of KIC 5006817
P. G. Beck1, K. Hambleton2,1, J. Vos1, T. Kallinger3, S. Bloemen1, A. Tkachenko1, R. A. Garcıa4, R. H. Østensen1,C. Aerts1,5, D. W. Kurtz2, J. De Ridder1, S. Hekker6, K. Pavlovski7, S. Mathur8, K. De Smedt1, A. Derekas9,
E. Corsaro1, B. Mosser10, H. Van Winckel1, D. Huber11, P. Degroote1, G. R. Davies12, A. Prsa13, J. Debosscher1,Y. Elsworth12, P. Nemeth1, L. Siess14, V. S. Schmid1, P. I. Papics1, B. L. de Vries1, A. J. van Marle1, P. Marcos-Arenal1,
A. Lobel15
1 Instituut voor Sterrenkunde, KU Leuven, 3001 Leuven, Belgium. e-mail:[email protected] Jeremiah Horrocks Institute, University of Central Lancashire, Preston PR1 2HE, UK.3 Institut fur Astronomie der Universitat Wien, Turkenschanzstr. 17, 1180 Wien, Austria.4 Laboratoire AIM, CEA/DSM CNRS - Universite Denis Diderot IRFU/SAp, 91191 Gif-sur-Yvette Cedex, France.5 Department of Astrophysics, IMAPP, University of Nijmegen, PO Box 9010, 6500 GL Nijmegen, The Netherlands6 Astronomical Institute Anton Pannekoek, University of Amsterdam, Science Park 904, 1098 XH Amsterdam, The Netherlands.7 Department of Physics, Faculty of Science, University of Zagreb, Croatia.8 Space Science Institute, 4750 Walnut street Suite#205, Boulder, CO 80301, USA9 Konkoly Observ., Research Centre f. Astronomy and Earth Sciences, Hungarian Academy of Sciences, H-1121 Budapest, Hungary.
10 LESIA, CNRS, Universite Pierre et Marie Curie, Universit´e Denis Diderot, Observatoire de Paris, 92195 Meudon cedex,France.11 NASA Ames Research Center, Moffett Field, CA 94035, USA.12 School of Physics and Astronomy, University of Birmingham,Edgebaston, Birmingham B13 2TT, UK.13 Department of Astronomy and Astrophysics, Villanova University, 800 East Lancaster Avenue, Villanova, PA 19085, USA.14 Institut d’Astronomie et d’Astrophysique, Univ. Libre de Bruxelles, CP226, Boulevard du Triomphe, 1050 Brussels, Belgium.15 Royal Observatory of Belgium, Ringlaan 3, 1180 Brussels, Belgium.
Received 12 August 2013; Accepted 16 December 2013
ABSTRACT
Context. The unparalleled photometric data obtained by NASA’sKepler space telescope led to an improved understanding of redgiant stars and binary stars. Seismology allows us to constrain the properties of red giants. In addition to eclipsing binaries, eccentricnon-eclipsing binaries, exhibiting ellipsoidal modulations, have been detected withKepler.Aims. We aim to study the properties of eccentric binary systems containing a red giant star and derive the parameters of the primarygiant component.Methods. We apply asteroseismic techniques to determine masses and radii of the primary component of each system. For a selectedtarget, light and radial velocity curve modelling techniques are applied to extract the parameters of the system and itsprimary com-ponent. Stellar evolution and its effects on the evolution of the binary system are studied from theoretical models.Results. The paper presents the asteroseismic analysis of 18 pulsating red giants in eccentric binary systems, for which masses andradii were constrained. The orbital periods of these systems range from 20 to 440 days. The results of our ongoing radial velocitymonitoring program with the HERMES spectrograph reveal an eccentricity range ofe= 0.2 to 0.76. As a case study we present a de-tailed analysis of KIC 5006817, whose rich oscillation spectrum allows for a detailed seismic analysis. From seismology we constrainthe rotational period of the envelope to be at least 165 d, which is roughly twice the orbital period. The stellar core rotates 13 timesfaster than the surface. From the spectrum and radial velocities we expect that the Doppler beaming signal should have a maximumamplitude of 300 ppm in the light curve. Fixing the mass and radius to the asteroseismically determined values, from our binarymodelling we find a value of the gravity darkening exponent that is significantly larger than expected. Through binary modelling, wedetermine the mass of the secondary component to be 0.29±0.03M⊙.Conclusions. For KIC 5006817 we exclude pseudo-synchronous rotation of the red giant with the orbit. The comparison of the resultsfrom seismology and modelling of the light curve shows a possible alignment of the rotational and orbital axis at the 2σ level. Redgiant eccentric systems could be progenitors of cataclysmic variables and hot subdwarf B stars.
Key words. Stars: solar-type - Stars: rotation - Stars: oscillations -Stars: interiors - (Stars:) binaries: spectroscopic - Stars: individual:KIC 5006817
1. Introduction
The NASA Kepler space telescope (Borucki et al. 2010) hasbeen delivering unprecedented photometric data for more than150 000 stars. These nearly continuous observations that now
cover more than 1000 d have allowed major advances in our un-5
derstanding of stellar structure of single stars and of multiple-star systems. The asteroseismic investigation of red giantstarshas become one ofKepler’s success stories.
1
P. G. Beck et al.: Pulsating red giant stars in eccentric binaries
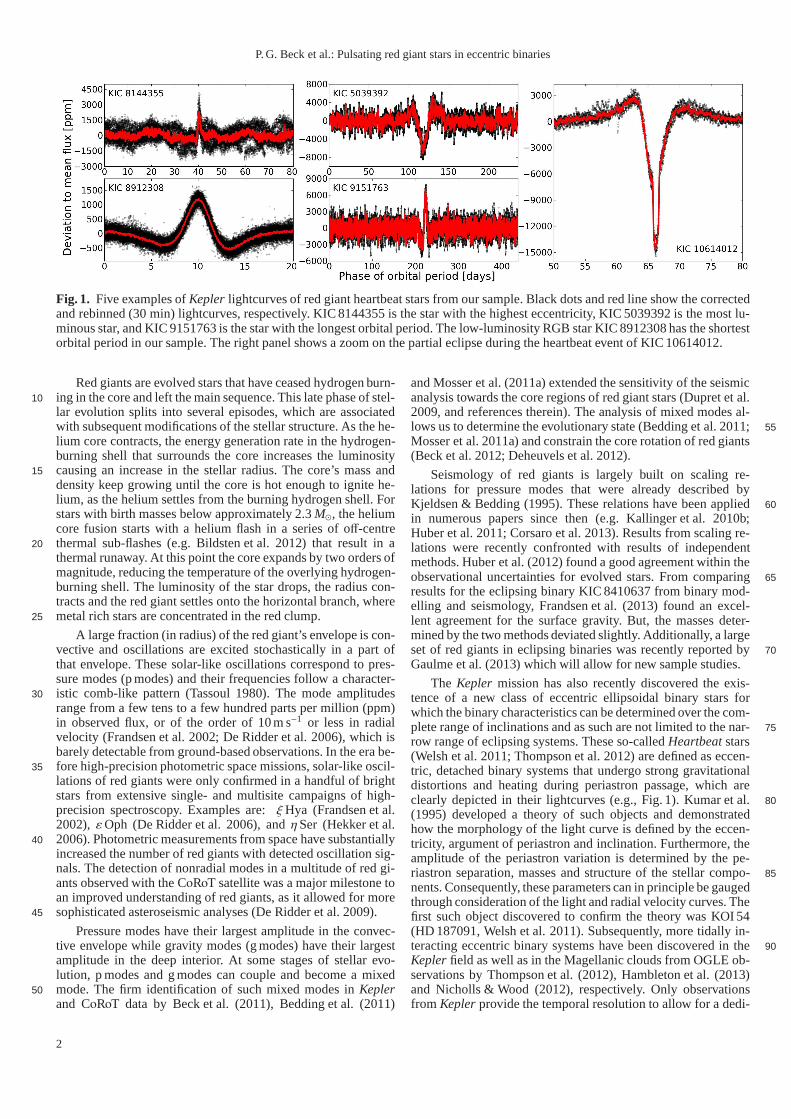
Fig. 1. Five examples ofKepler lightcurves of red giant heartbeat stars from our sample. Black dots and red line show the correctedand rebinned (30 min) lightcurves, respectively. KIC 8144355 is the star with the highest eccentricity, KIC 5039392 is the most lu-minous star, and KIC 9151763 is the star with the longest orbital period. The low-luminosity RGB star KIC 8912308 has the shortestorbital period in our sample. The right panel shows a zoom on the partial eclipse during the heartbeat event of KIC 10614012.
Red giants are evolved stars that have ceased hydrogen burn-ing in the core and left the main sequence. This late phase of stel-10lar evolution splits into several episodes, which are associatedwith subsequent modifications of the stellar structure. As the he-lium core contracts, the energy generation rate in the hydrogen-burning shell that surrounds the core increases the luminositycausing an increase in the stellar radius. The core’s mass and15
density keep growing until the core is hot enough to ignite he-lium, as the helium settles from the burning hydrogen shell.Forstars with birth masses below approximately 2.3M⊙, the heliumcore fusion starts with a helium flash in a series of off-centrethermal sub-flashes (e.g. Bildsten et al. 2012) that result in a20thermal runaway. At this point the core expands by two ordersofmagnitude, reducing the temperature of the overlying hydrogen-burning shell. The luminosity of the star drops, the radius con-tracts and the red giant settles onto the horizontal branch,wheremetal rich stars are concentrated in the red clump.25
A large fraction (in radius) of the red giant’s envelope is con-vective and oscillations are excited stochastically in a part ofthat envelope. These solar-like oscillations correspond to pres-sure modes (p modes) and their frequencies follow a character-istic comb-like pattern (Tassoul 1980). The mode amplitudes30
range from a few tens to a few hundred parts per million (ppm)in observed flux, or of the order of 10 m s−1 or less in radialvelocity (Frandsen et al. 2002; De Ridder et al. 2006), whichisbarely detectable from ground-based observations. In the era be-fore high-precision photometric space missions, solar-like oscil-35lations of red giants were only confirmed in a handful of brightstars from extensive single- and multisite campaigns of high-precision spectroscopy. Examples are:ξHya (Frandsen et al.2002), εOph (De Ridder et al. 2006), andηSer (Hekker et al.2006). Photometric measurements from space have substantially40increased the number of red giants with detected oscillation sig-nals. The detection of nonradial modes in a multitude of red gi-ants observed with the CoRoT satellite was a major milestone toan improved understanding of red giants, as it allowed for moresophisticated asteroseismic analyses (De Ridder et al. 2009).45
Pressure modes have their largest amplitude in the convec-tive envelope while gravity modes (g modes) have their largestamplitude in the deep interior. At some stages of stellar evo-lution, p modes and g modes can couple and become a mixedmode. The firm identification of such mixed modes inKepler50and CoRoT data by Beck et al. (2011), Bedding et al. (2011)
and Mosser et al. (2011a) extended the sensitivity of the seismicanalysis towards the core regions of red giant stars (Dupretet al.2009, and references therein). The analysis of mixed modes al-lows us to determine the evolutionary state (Bedding et al. 2011; 55
Mosser et al. 2011a) and constrain the core rotation of red giants(Beck et al. 2012; Deheuvels et al. 2012).
Seismology of red giants is largely built on scaling re-lations for pressure modes that were already described byKjeldsen & Bedding (1995). These relations have been applied 60in numerous papers since then (e.g. Kallinger et al. 2010b;Huber et al. 2011; Corsaro et al. 2013). Results from scalingre-lations were recently confronted with results of independentmethods. Huber et al. (2012) found a good agreement within theobservational uncertainties for evolved stars. From comparing 65results for the eclipsing binary KIC 8410637 from binary mod-elling and seismology, Frandsen et al. (2013) found an excel-lent agreement for the surface gravity. But, the masses deter-mined by the two methods deviated slightly. Additionally, alargeset of red giants in eclipsing binaries was recently reported by 70
Gaulme et al. (2013) which will allow for new sample studies.
The Kepler mission has also recently discovered the exis-tence of a new class of eccentric ellipsoidal binary stars forwhich the binary characteristics can be determined over thecom-plete range of inclinations and as such are not limited to thenar- 75row range of eclipsing systems. These so-calledHeartbeat stars(Welsh et al. 2011; Thompson et al. 2012) are defined as eccen-tric, detached binary systems that undergo strong gravitationaldistortions and heating during periastron passage, which areclearly depicted in their lightcurves (e.g., Fig. 1). Kumaret al. 80(1995) developed a theory of such objects and demonstratedhow the morphology of the light curve is defined by the eccen-tricity, argument of periastron and inclination. Furthermore, theamplitude of the periastron variation is determined by the pe-riastron separation, masses and structure of the stellar compo- 85
nents. Consequently, these parameters can in principle be gaugedthrough consideration of the light and radial velocity curves. Thefirst such object discovered to confirm the theory was KOI 54(HD 187091, Welsh et al. 2011). Subsequently, more tidally in-teracting eccentric binary systems have been discovered inthe 90Kepler field as well as in the Magellanic clouds from OGLE ob-servations by Thompson et al. (2012), Hambleton et al. (2013)and Nicholls & Wood (2012), respectively. Only observationsfrom Kepler provide the temporal resolution to allow for a dedi-
2
P. G. Beck et al.: Pulsating red giant stars in eccentric binaries
cated seismic analysis for these stars. Table 1 lists several newly-95
found heartbeat stars in theKepler field of view with a compo-nent exhibiting solar-like oscillations.
The seismic study of a sample of 18 eccentric systems(Fig. 2) is presented in Section 3. For a detailed seismic study,a large number of oscillation modes is needed to allow for an100optimal comparison with theoretical models. The star with therichest power density spectrum is KIC 5006817. Section 4, 5 and6 describe the seismic, spectroscopic and binary analyses of thissystem. The results of these different analyses are compared inSection 7. In Section 8 we reflect upon the possibility that heart-105
beat stars are potential subdwarf B (sdB) and cataclysmic vari-ables (CV) progenitors.
2. Observations
The Kepler datasets used in this study cover a time base up to1300 d (Quarters Q0–Q14) in the long cadence observing mode110of Kepler. In this mode, integrations of 6.04 s are taken every6.54 s and 270 such integrations are co-added for transmission toEarth to give an integration time of 29.43 min, leading a Nyquistfrequency of 283.4µHz. For one target a month of short cadencedata was available. In this observing mode, the individual in-115tegrations are stacked to exposures of 58.8 s, which leads toaNyquist frequency of 8495µHz (Fig. 3). To produce lightcurveswhich are robust against long period instrumental drifts, we ex-tracted the photometric flux from the pixel data following themethods described by Bloemen (2013). The lightcurves were120
corrected following Garcıa et al. (2011). The target pixeldatawere also used to inspect whether the light curve was contami-nated by neighbouring field stars. In all cases a significant con-tamination is unlikely.
Red giant heartbeat candidates were selected by inspect-125ing the lightcurves. Also the subsequent versions of theKeplereclipsing binary catalogue (Prsa et al. 2011; Slawson et al. 2011;Matijevic et al. 2012) were searched for candidates among thestars classified as red giants.
The lightcurves of red giant stars are dominated by the low130
frequency signals of the granulation background and of the solar-like oscillations (Fig. 4), which hamper a determination oftheprecise value of the orbital period from the reoccurring fluxmod-ulation at periastron (hereafter referred to asheartbeat event).Therefore, the lightcurves were smoothed with a boxcar with135a width of a few days and analyzed using the phase disper-sion minimization technique (Stellingwerf 1978). By testing forstrictly periodic recurrences, confusion with other variabilitysources, such as stellar activity or instrumental artifacts is ex-cluded.140
For an independent confirmation of the binary nature of thediscovered heartbeat systems, we searched for radial velocityvariations from spectra obtained with the HERMES spectro-graph (Raskin et al. 2011), mounted on the 1.2-m Mercatortelescope at La Palma, Canary Islands, Spain. This highly ef-145ficient echelle spectrograph has a resolving power ofR =
86 000. The raw spectra were reduced with the instrument-specific pipeline. The radial velocities were derived throughweighted cross-correlation of the wavelength range between478 and 653 nm of each spectrum with an Arcturus template150(Raskin et al. 2011). For our prime target, KIC 5006817, two or-bital cycles were monitored in 2012 as well as in 2013. Radialvelocity monitoring for the other stars listed in Table 1 is ongo-ing. Tables 1 to 3 report the first orbital results for stars inoursample.155
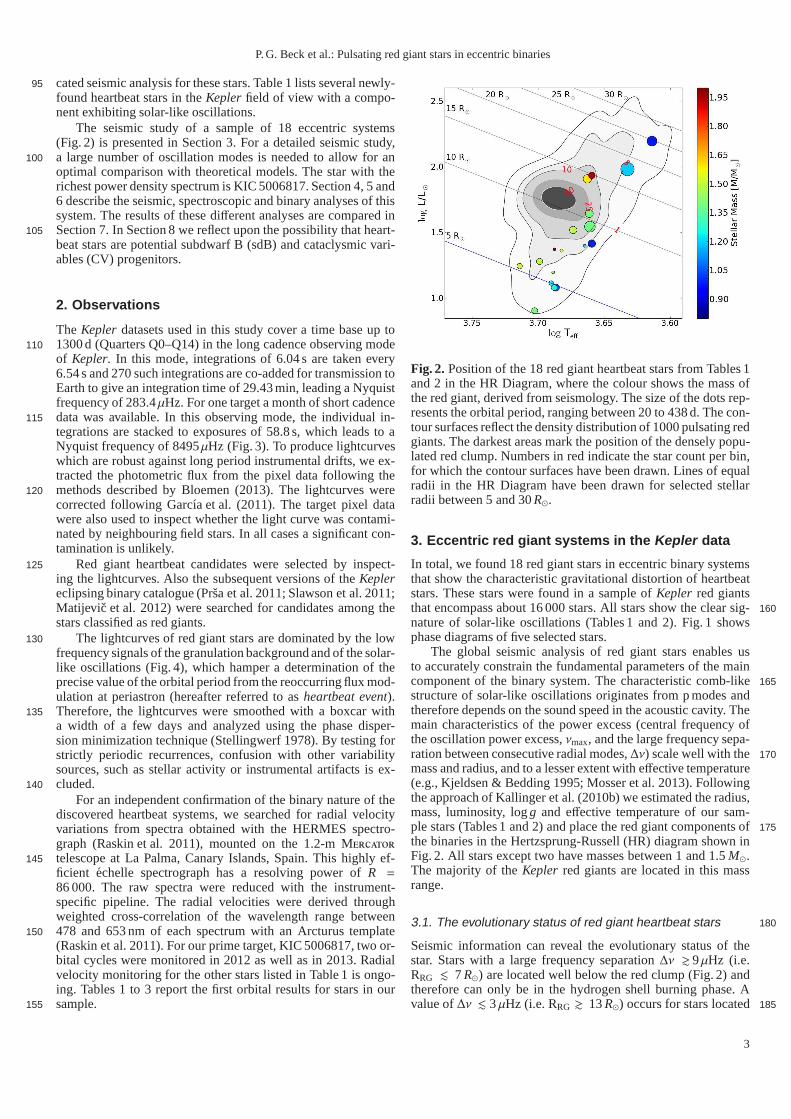
Fig. 2. Position of the 18 red giant heartbeat stars from Tables 1and 2 in the HR Diagram, where the colour shows the mass ofthe red giant, derived from seismology. The size of the dots rep-resents the orbital period, ranging between 20 to 438 d. The con-tour surfaces reflect the density distribution of 1000 pulsating redgiants. The darkest areas mark the position of the densely popu-lated red clump. Numbers in red indicate the star count per bin,for which the contour surfaces have been drawn. Lines of equalradii in the HR Diagram have been drawn for selected stellarradii between 5 and 30R⊙.
3. Eccentric red giant systems in the Kepler data
In total, we found 18 red giant stars in eccentric binary systemsthat show the characteristic gravitational distortion of heartbeatstars. These stars were found in a sample ofKepler red giantsthat encompass about 16 000 stars. All stars show the clear sig- 160
nature of solar-like oscillations (Tables 1 and 2). Fig. 1 showsphase diagrams of five selected stars.
The global seismic analysis of red giant stars enables usto accurately constrain the fundamental parameters of the maincomponent of the binary system. The characteristic comb-like 165structure of solar-like oscillations originates from p modes andtherefore depends on the sound speed in the acoustic cavity.Themain characteristics of the power excess (central frequency ofthe oscillation power excess,νmax, and the large frequency sepa-ration between consecutive radial modes,∆ν) scale well with the 170mass and radius, and to a lesser extent with effective temperature(e.g., Kjeldsen & Bedding 1995; Mosser et al. 2013). Followingthe approach of Kallinger et al. (2010b) we estimated the radius,mass, luminosity, logg and effective temperature of our sam-ple stars (Tables 1 and 2) and place the red giant components of 175
the binaries in the Hertzsprung-Russell (HR) diagram showninFig. 2. All stars except two have masses between 1 and 1.5M⊙.The majority of theKepler red giants are located in this massrange.
3.1. The evolutionary status of red giant heartbeat stars 180
Seismic information can reveal the evolutionary status of thestar. Stars with a large frequency separation∆ν & 9µHz (i.e.RRG . 7R⊙) are located well below the red clump (Fig. 2) andtherefore can only be in the hydrogen shell burning phase. Avalue of∆ν . 3µHz (i.e. RRG & 13R⊙) occurs for stars located185
3
P. G. Beck et al.: Pulsating red giant stars in eccentric binaries
Table 1. Seismic and fundamental parameters for 14 oscillating red giant heartbeat stars, ordered by descending orbital period.
Star νmax ∆ν ∆Π1 δ fmax Evol. R M logg L Teff Porbit A |∆RV|KIC [µHz] [µHz] [sec] [nHz] Phase [R⊙] [ M⊙] [dex] [L⊙ ] [K] [d] [ppt] [km s −1]
9151763 13.8±0.2 1.98±0.01 − − RGB? 17.6±0.4 1.19±0.08 2.01 96±16 4290 437.5 +7.1 32.27431665 54.0±0.7 5.46±0.02 ∼67 − RGB 9.4±0.1 1.39±0.05 2.62 35±2 4580 281.4 -3.0 [37.8]5039392 6.2±0.1 1.13±0.01 − − RGB 24.0±0.7 0.98±0.07 1.67 157±24 4110 236.7 -6.0 42.39540226⋆ 27.4±0.4 3.18±0.01 − − RGB 14.1±0.3 1.6±0.1 2.37 81±13 4600 175.4 -7 45.38210370 44.1±0.8 4.69±0.02 − − RGB? 10.5±0.2 1.40±0.08 2.54 44±4 4585 153.5 -5.3 22.111044668 50.2±0.2 5.65±0.01 ∼60 83(?) RGB 8.18±0.09 0.99±0.03 2.59 26±3 4565 139.5 -3.8 [43.0]10614012⋆ 70.2±0.9 6.54±0.02 − − RGB 8.6±0.2 1.49±0.08 2.74 33±4 4715 132.1 -4.7 49.39163796 153.2±0.7 13.53±0.04 − − RGB 4.46±0.03 0.89±0.01 3.09 12±1 4820 121.3 ±0.5 70.12444348 30.5±0.3 3.26±0.01 − − RGB 14.9±0.3 1.94±0.11 2.38 86±14 4565 103.5 -1.7 7.75006817 145.9±0.5 11.64±0.01 78 450 RGB 5.84±0.09 1.49±0.06 3.08 19±3 5000 94.8 -1.7 23.58803882 347±3 22.6±0.4 − 500(?) RGB 3.68±0.1 1.4±0.1 3.45 8±1 5043 89.7 +0.5 [1.9]8144355 179±2 13.95±0.04 ∼78 210(?) RGB 4.90±0.09 1.26±0.08 3.16 12±2 4875 80.6 +2.1 18.99408183 164.8±0.2 13.29±0.02 ∼93 450 RGB 5.02±0.07 1.23±0.05 3.12 13±1 4900 49.7 +1.5 64.42720096 110.1±0.7 9.17±0.01 − − RGB 6.98±0.08 1.54±0.06 2.95 23±2 4812 26.7 +1.0 4.08095275 69.3±0.3 6.81±0.01 − − RGB 7.78±0.08 1.21±0.05 2.74 25±3 4622 23.0 -6.0 20.6
Notes. The star’s identifier in theKepler Input Catalogue (KIC) is given. Eclipsing systems are marked with an asterisk. The columnsνmax and∆νreport the frequency of the oscillation power excess and thelarge frequency separation between radial modes for a givenstar.∆Π1 quantifies thetrue period spacing of dipole modes. The maximum value of thedetected rotational splittingδ f is listed. The evolutionary phase RGB describesH-shell burning red giant. Ambiguous values are marked with’?’. The columnsR, M, L, and logg report the stellar radius, mass, luminosity,effective temperature and surface gravity from scaling relations, respectively.Teff was adopted from the KIC. The uncertainties of logg are onthe order of 0.01 dex and for the temperature typically smaller than 150 K.Porbit gives the orbital period from photometry. The columnA lists themaximum amplitude of the heartbeat in a rebinned phase diagram. The error estimate forPorbit and A from the PDM is not reliable due to theremaining contamination of the solar-like oscillations and therefore not given.|∆RV| reports the maximum difference in radial velocity. Squaredbrackets mark systems for which the orbital parameters could not yet be determined from radial velocities.
Table 2. Low-luminosity red giants withνmax higher than 283µHz from long cadence data.
Star fmax (νmax) ∆ν R M logg L Teff Porbit A |∆RV|KIC [µHz] [µHz] [µHz] [R⊙] [ M⊙] [dex] [L⊙] [K] [d] [ppt] [km s −1]
7799540 220±5 (347.2) 24.0 3.64 1.52 3.50 17.5 5177 71.8+0.5 [31.8]2697935⋆ 161±3 (405.6) ∼28 3.26 1.45 3.574 15.7 4883 21.5±1.3 52.18912308 217±9 (350.2) 22.7 4.20 2.02 3.50 23.5 4872 20.2+1.2 61.4
Notes. The definition of columnsKIC, ∆ν, M, R, logg, L, Porbit, A and∆|RV| is the same as in Table 1.fmax and (νmax) indicate the frequencyof the maximum oscillation power, reflected at the Nyquist frequency and reconstructed power excess, respectively.Teff was adopted from theKIC-parameters. The uncertainties ofM, R, logg andL are better than 2, 5, 1, and 15 percent, respectively.
Table 3. Orbital parameters for systems for which periastron has been monitored with the HERMES spectrograph.
Star nRV Porbit e Ω K γ T0 EclipseKIC [d] [rad] [km/s] [km/s] [HJD] duration
9151763 24 437.51±0.03 0.73±0.01 3.03±0.01 16.20±0.04 -92.89±0.03 2455949.64±0.065039392 13 236.70±0.02 0.44±0.01 4.96±0.01 22.6±0.2 -14.96±0.05 2454874.2±0.279540226⋆ 31 175.43±0.01 0.39±0.01 0.07±0.01 23.32±0.04 -12.37±0.02 2456425.89±0.09 P: 4 d; S: 3 d8210370 16 153.50±0.01 0.70±0.01 1.17±0.01 12.96±0.36 -0.76±0.08 2454937.35±0.01
10614012⋆ 22 132.13±0.01 0.71±0.01 1.23±0.01 24.68±0.03 -0.92±0.02 2454990.48±0.01 1 d9163796 17 121.30±0.01 0.69±0.01 0.00±0.01 35.64±0.01 -11.05±0.01 2456409.60±0.012444348 17 103.50±0.01 0.48±0.01 4.30±0.01 4.76±0.02 14.47±0.01 2454947.74±0.095006817 70 94.812±0.002 0.7069±0.0002 4.0220±0.0005 11.709±0.005 -14.021±0.002 2456155.924±0.0028144355 19 80.55±0.01 0.76±0.01 2.79±0.01 9.44±0.04 0.02±0.03 2455914.43±0.029408183 7 49.70±0.01 0.42±0.01 0.17±0.01 37.17±0.04 -14.37±0.01 2454989.80±0.012720096 13 26.70±0.01 0.49±0.01 6.11±0.01 2.28±0.03 9.92±0.01 2454990.67±0.058095275 25 23.00±0.01 0.32±0.01 2.19±0.01 10.50±0.06 -8.58±0.03 2454971.02±0.032697935⋆ 27 21.50±0.01 0.41±0.02 2.33±0.06 26.5±0.6 -74.4±0.4 2454990.9±0.1 0.1 d8912308 28 20.17±0.01 0.23±0.01 3.34±0.01 30.78±0.02 -52.69±0.01 2454994.06±0.01
Notes. Number of radial velocity measurements,nRV. The orbital periodPorbit, the eccentricitye, the argument of periastronΩ, the radial velocityamplitudeK, the velocity of the systemγ, and the zero pointT0. The duration of the eclipse is given. P and S indicate the primary and secondaryeclipse, respectively.
4
P. G. Beck et al.: Pulsating red giant stars in eccentric binaries
2500
2000
1500
1000
500
0280 260 240 220 200
2500
2000
1500
1000
500
0360340320300280
Dn
Dn
Pow
er
densi
ty [
ppm
2/µH
z]
Frequency [µHz]
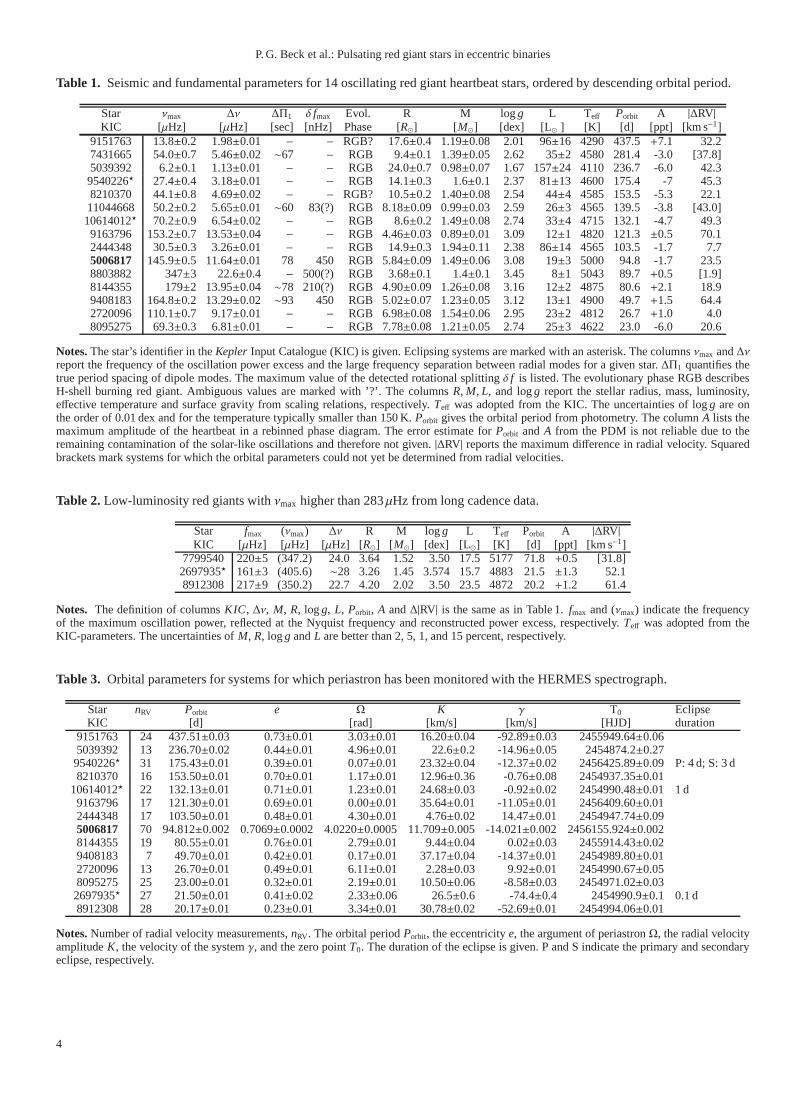
Fig. 3. Power density spectra of KIC 8803882 from 1250 d oflong and 30 d of short cadence data is shown in blue and red,respectively. The formal Nyquist frequency (dashed line) sep-arates the reflected oscillation power (top panel, sub Nyquistfrequency range) and the original power excess (bottom panel,super Nyquist frequency range).
above the red clump. Such stars are likely to be H-shell burningstars, high up on the RGB, although in principle they also couldbe stars on the low asymptotic giant branch (AGB). Stars withfrequency separation 3.∆ν. 9µHz can also be in the heliumcore burning phase (Bedding et al. 2011; Mosser et al. 2012b).190Therefore, a further criterion to determine the evolutionary stateof stars with radii larger than 7R⊙ is needed.
The period separation of mixed dipole modes is a power-ful diagnostic to discriminate between hydrogen shell and he-lium core burning stars (c.f. Bedding et al. 2011; Mosser et al.1952011b). The true period spacing∆Π1 describes the constant pe-riod spacing of pure dipole g modes, which cannot be observeddirectly. However, one can determine the value of∆Π1 by fit-ting a theoretical mixed mode pattern to the actually observedmodes in the power spectrum (Mosser et al. 2012a). Stars which200exhibit a value of∆Π1 . 100 s are burning hydrogen in a shellaround the inert helium core, while stars with a larger∆Π1 valuebelong to stars on the AGB or RC. The estimated values of thetrue period spacing∆Π1 for the pulsators are given in Table 1.
Several stars do not or barely show dipole mixed modes and205it is impossible to recover their mixed mode pattern. For thesestars we did not determine the evolutionary state from the periodspacing but used the phase shift (ǫc) of the central radial mode asan indicator. Kallinger et al. (2012) have shown that in a diagramof ǫc versus the large separation∆ν, the stars fall into groups210
which can be identified as H-shell burning, He-core burning andAGB stars. For most stars, the identification of the evolutionarystage fromǫc and the observed period spacing are in agreement.Therefore we are also able to estimate the evolutionary state ofstars which did not show a clear forest of dipole modes.215
For nearly all heartbeat red giants we could constrain them tobe in the state of H-shell burning. The remaining stars are alsolikely to be in the same evolutionary state but we cannot ruleout more evolved phases. Among our sample there are 5 starsin a∆ν range where the stars can either be an RGB or RC star.220
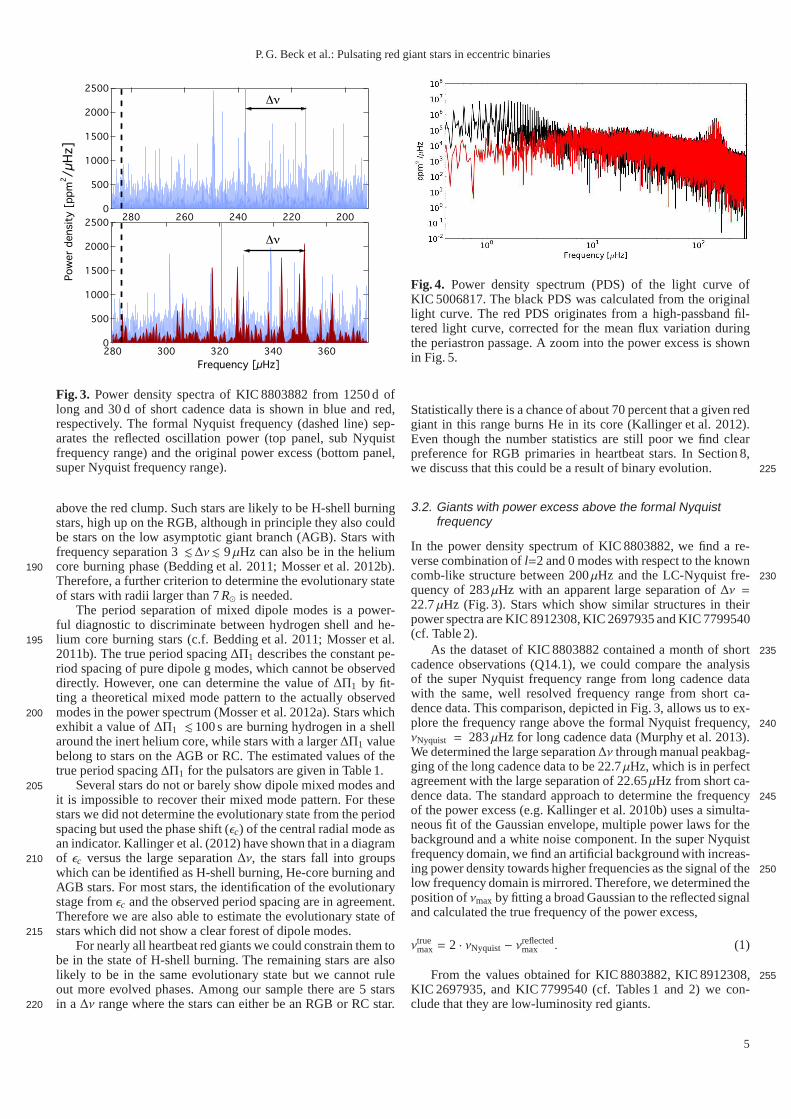
Fig. 4. Power density spectrum (PDS) of the light curve ofKIC 5006817. The black PDS was calculated from the originallight curve. The red PDS originates from a high-passband fil-tered light curve, corrected for the mean flux variation duringthe periastron passage. A zoom into the power excess is shownin Fig. 5.
Statistically there is a chance of about 70 percent that a given redgiant in this range burns He in its core (Kallinger et al. 2012).Even though the number statistics are still poor we find clearpreference for RGB primaries in heartbeat stars. In Section8,we discuss that this could be a result of binary evolution. 225
3.2. Giants with power excess above the formal Nyquistfrequency
In the power density spectrum of KIC 8803882, we find a re-verse combination ofl=2 and 0 modes with respect to the knowncomb-like structure between 200µHz and the LC-Nyquist fre-230quency of 283µHz with an apparent large separation of∆ν =22.7µHz (Fig. 3). Stars which show similar structures in theirpower spectra are KIC 8912308, KIC 2697935 and KIC 7799540(cf. Table 2).
As the dataset of KIC 8803882 contained a month of short235
cadence observations (Q14.1), we could compare the analysisof the super Nyquist frequency range from long cadence datawith the same, well resolved frequency range from short ca-dence data. This comparison, depicted in Fig. 3, allows us toex-plore the frequency range above the formal Nyquist frequency, 240νNyquist = 283µHz for long cadence data (Murphy et al. 2013).We determined the large separation∆ν through manual peakbag-ging of the long cadence data to be 22.7µHz, which is in perfectagreement with the large separation of 22.65µHz from short ca-dence data. The standard approach to determine the frequency 245of the power excess (e.g. Kallinger et al. 2010b) uses a simulta-neous fit of the Gaussian envelope, multiple power laws for thebackground and a white noise component. In the super Nyquistfrequency domain, we find an artificial background with increas-ing power density towards higher frequencies as the signal of the 250low frequency domain is mirrored. Therefore, we determinedtheposition ofνmax by fitting a broad Gaussian to the reflected signaland calculated the true frequency of the power excess,
νtruemax = 2 · νNyquist− ν
reflectedmax . (1)
From the values obtained for KIC 8803882, KIC 8912308,255KIC 2697935, and KIC 7799540 (cf. Tables 1 and 2) we con-clude that they are low-luminosity red giants.
5
P. G. Beck et al.: Pulsating red giant stars in eccentric binaries
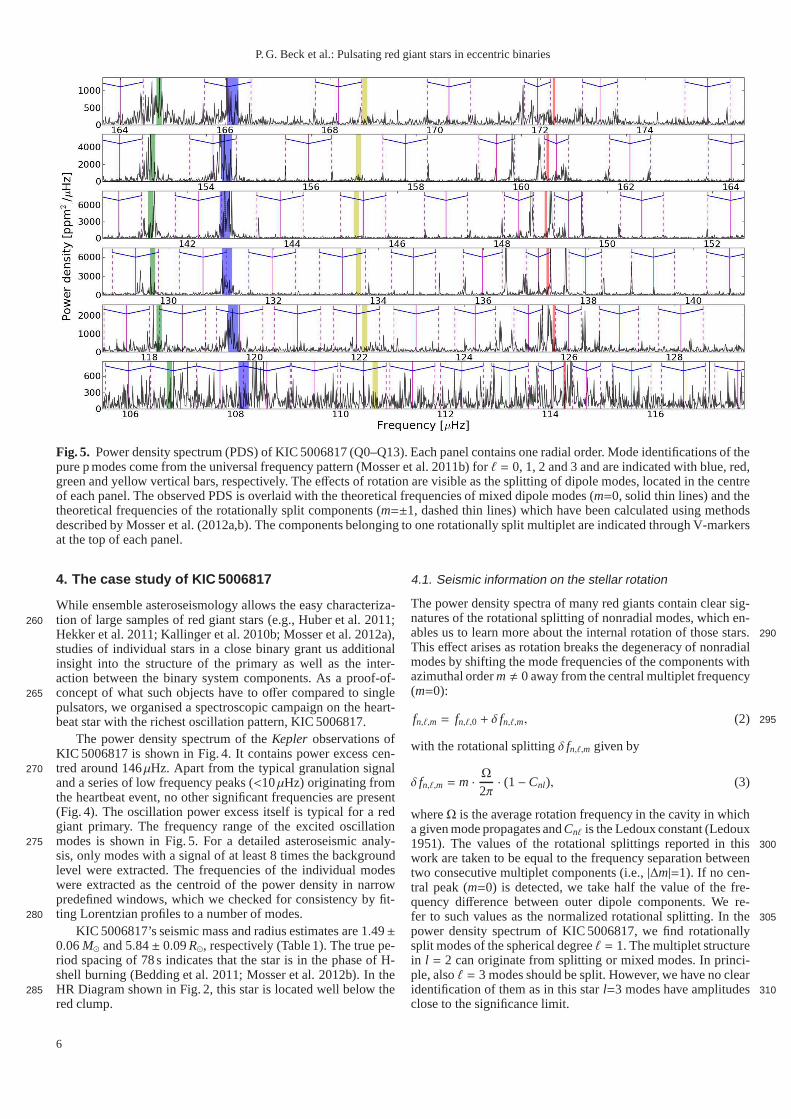
Fig. 5. Power density spectrum (PDS) of KIC 5006817 (Q0–Q13). Each panel contains one radial order. Mode identifications of thepure p modes come from the universal frequency pattern (Mosser et al. 2011b) forℓ = 0, 1, 2 and 3 and are indicated with blue, red,green and yellow vertical bars, respectively. The effects of rotation are visible as the splitting of dipole modes, located in the centreof each panel. The observed PDS is overlaid with the theoretical frequencies of mixed dipole modes (m=0, solid thin lines) and thetheoretical frequencies of the rotationally split components (m=±1, dashed thin lines) which have been calculated using methodsdescribed by Mosser et al. (2012a,b). The components belonging to one rotationally split multiplet are indicated through V-markersat the top of each panel.
4. The case study of KIC 5006817
While ensemble asteroseismology allows the easy characteriza-tion of large samples of red giant stars (e.g., Huber et al. 2011;260Hekker et al. 2011; Kallinger et al. 2010b; Mosser et al. 2012a),studies of individual stars in a close binary grant us additionalinsight into the structure of the primary as well as the inter-action between the binary system components. As a proof-of-concept of what such objects have to offer compared to single265
pulsators, we organised a spectroscopic campaign on the heart-beat star with the richest oscillation pattern, KIC 5006817.
The power density spectrum of theKepler observations ofKIC 5006817 is shown in Fig. 4. It contains power excess cen-tred around 146µHz. Apart from the typical granulation signal270and a series of low frequency peaks (<10µHz) originating fromthe heartbeat event, no other significant frequencies are present(Fig. 4). The oscillation power excess itself is typical fora redgiant primary. The frequency range of the excited oscillationmodes is shown in Fig. 5. For a detailed asteroseismic analy-275sis, only modes with a signal of at least 8 times the backgroundlevel were extracted. The frequencies of the individual modeswere extracted as the centroid of the power density in narrowpredefined windows, which we checked for consistency by fit-ting Lorentzian profiles to a number of modes.280
KIC 5006817’s seismic mass and radius estimates are 1.49±0.06M⊙ and 5.84± 0.09R⊙, respectively (Table 1). The true pe-riod spacing of 78 s indicates that the star is in the phase of H-shell burning (Bedding et al. 2011; Mosser et al. 2012b). In theHR Diagram shown in Fig. 2, this star is located well below the285red clump.
4.1. Seismic information on the stellar rotation
The power density spectra of many red giants contain clear sig-natures of the rotational splitting of nonradial modes, which en-ables us to learn more about the internal rotation of those stars. 290
This effect arises as rotation breaks the degeneracy of nonradialmodes by shifting the mode frequencies of the components withazimuthal orderm , 0 away from the central multiplet frequency(m=0):
fn,ℓ,m = fn,ℓ,0 + δ fn,ℓ,m, (2) 295
with the rotational splittingδ fn,ℓ,m given by
δ fn,ℓ,m = m ·Ω
2π· (1−Cnl), (3)
whereΩ is the average rotation frequency in the cavity in whicha given mode propagates andCnℓ is the Ledoux constant (Ledoux1951). The values of the rotational splittings reported in this 300work are taken to be equal to the frequency separation betweentwo consecutive multiplet components (i.e.,|∆m|=1). If no cen-tral peak (m=0) is detected, we take half the value of the fre-quency difference between outer dipole components. We re-fer to such values as the normalized rotational splitting. In the 305
power density spectrum of KIC 5006817, we find rotationallysplit modes of the spherical degreeℓ = 1. The multiplet structurein l = 2 can originate from splitting or mixed modes. In princi-ple, alsoℓ = 3 modes should be split. However, we have no clearidentification of them as in this starl=3 modes have amplitudes310close to the significance limit.
6
P. G. Beck et al.: Pulsating red giant stars in eccentric binaries
0.45
0.40
0.35
0.30
0.25
0.20
Rota
tional Split
ting, df [µ
Hz]
-0.4 -0.2 0.0 0.2 0.4
(nl=1,mixed - nl=1,pressure) / Dn
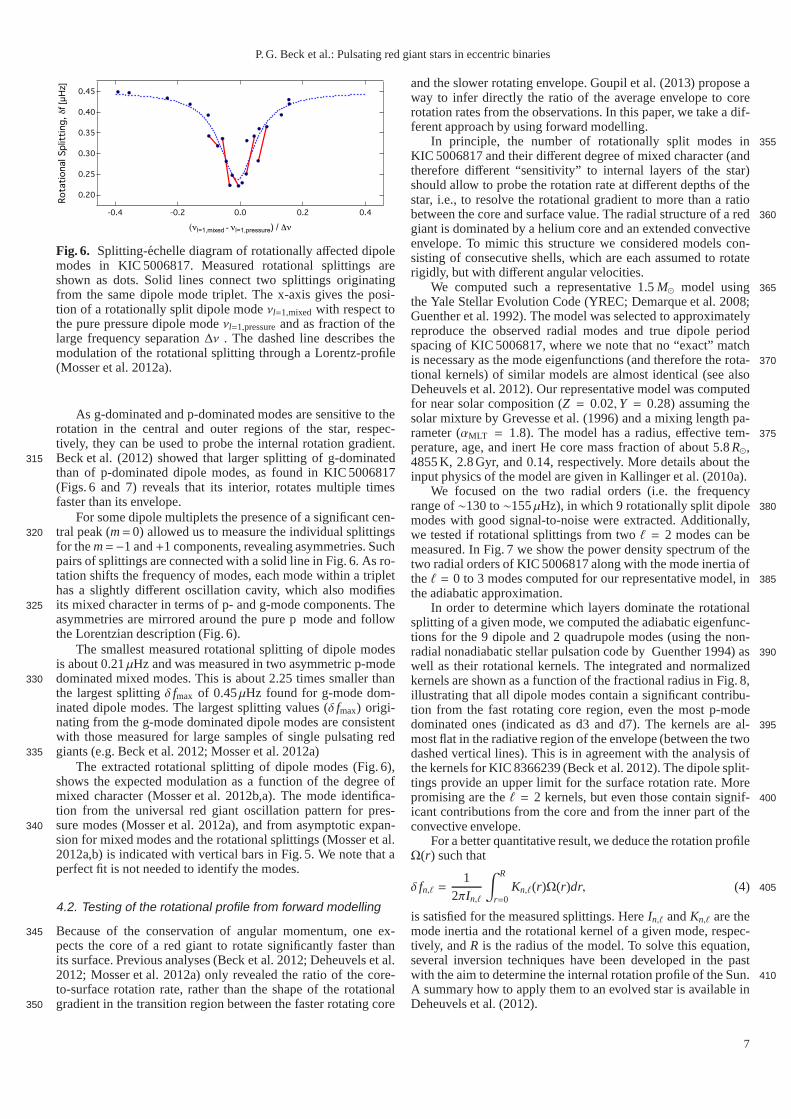
Fig. 6. Splitting-echelle diagram of rotationally affected dipolemodes in KIC 5006817. Measured rotational splittings areshown as dots. Solid lines connect two splittings originatingfrom the same dipole mode triplet. The x-axis gives the posi-tion of a rotationally split dipole modeνl=1,mixed with respect tothe pure pressure dipole modeνl=1,pressureand as fraction of thelarge frequency separation∆ν . The dashed line describes themodulation of the rotational splitting through a Lorentz-profile(Mosser et al. 2012a).
As g-dominated and p-dominated modes are sensitive to therotation in the central and outer regions of the star, respec-tively, they can be used to probe the internal rotation gradient.Beck et al. (2012) showed that larger splitting of g-dominated315than of p-dominated dipole modes, as found in KIC 5006817(Figs. 6 and 7) reveals that its interior, rotates multiple timesfaster than its envelope.
For some dipole multiplets the presence of a significant cen-tral peak (m=0) allowed us to measure the individual splittings320
for them=−1 and+1 components, revealing asymmetries. Suchpairs of splittings are connected with a solid line in Fig. 6.As ro-tation shifts the frequency of modes, each mode within a triplethas a slightly different oscillation cavity, which also modifiesits mixed character in terms of p- and g-mode components. The325asymmetries are mirrored around the pure p mode and followthe Lorentzian description (Fig. 6).
The smallest measured rotational splitting of dipole modesis about 0.21µHz and was measured in two asymmetric p-modedominated mixed modes. This is about 2.25 times smaller than330the largest splittingδ fmax of 0.45µHz found for g-mode dom-inated dipole modes. The largest splitting values (δ fmax) origi-nating from the g-mode dominated dipole modes are consistentwith those measured for large samples of single pulsating redgiants (e.g. Beck et al. 2012; Mosser et al. 2012a)335
The extracted rotational splitting of dipole modes (Fig. 6),shows the expected modulation as a function of the degree ofmixed character (Mosser et al. 2012b,a). The mode identifica-tion from the universal red giant oscillation pattern for pres-sure modes (Mosser et al. 2012a), and from asymptotic expan-340sion for mixed modes and the rotational splittings (Mosser et al.2012a,b) is indicated with vertical bars in Fig. 5. We note that aperfect fit is not needed to identify the modes.
4.2. Testing of the rotational profile from forward modelling
Because of the conservation of angular momentum, one ex-345pects the core of a red giant to rotate significantly faster thanits surface. Previous analyses (Beck et al. 2012; Deheuvelset al.2012; Mosser et al. 2012a) only revealed the ratio of the core-to-surface rotation rate, rather than the shape of the rotationalgradient in the transition region between the faster rotating core350
and the slower rotating envelope. Goupil et al. (2013) propose away to infer directly the ratio of the average envelope to corerotation rates from the observations. In this paper, we takea dif-ferent approach by using forward modelling.
In principle, the number of rotationally split modes in355
KIC 5006817 and their different degree of mixed character (andtherefore different “sensitivity” to internal layers of the star)should allow to probe the rotation rate at different depths of thestar, i.e., to resolve the rotational gradient to more than aratiobetween the core and surface value. The radial structure of ared 360giant is dominated by a helium core and an extended convectiveenvelope. To mimic this structure we considered models con-sisting of consecutive shells, which are each assumed to rotaterigidly, but with different angular velocities.
We computed such a representative 1.5M⊙ model using 365the Yale Stellar Evolution Code (YREC; Demarque et al. 2008;Guenther et al. 1992). The model was selected to approximatelyreproduce the observed radial modes and true dipole periodspacing of KIC 5006817, where we note that no “exact” matchis necessary as the mode eigenfunctions (and therefore the rota- 370
tional kernels) of similar models are almost identical (seealsoDeheuvels et al. 2012). Our representative model was computedfor near solar composition (Z = 0.02, Y = 0.28) assuming thesolar mixture by Grevesse et al. (1996) and a mixing length pa-rameter (αMLT = 1.8). The model has a radius, effective tem- 375perature, age, and inert He core mass fraction of about 5.8R⊙,4855 K, 2.8 Gyr, and 0.14, respectively. More details about theinput physics of the model are given in Kallinger et al. (2010a).
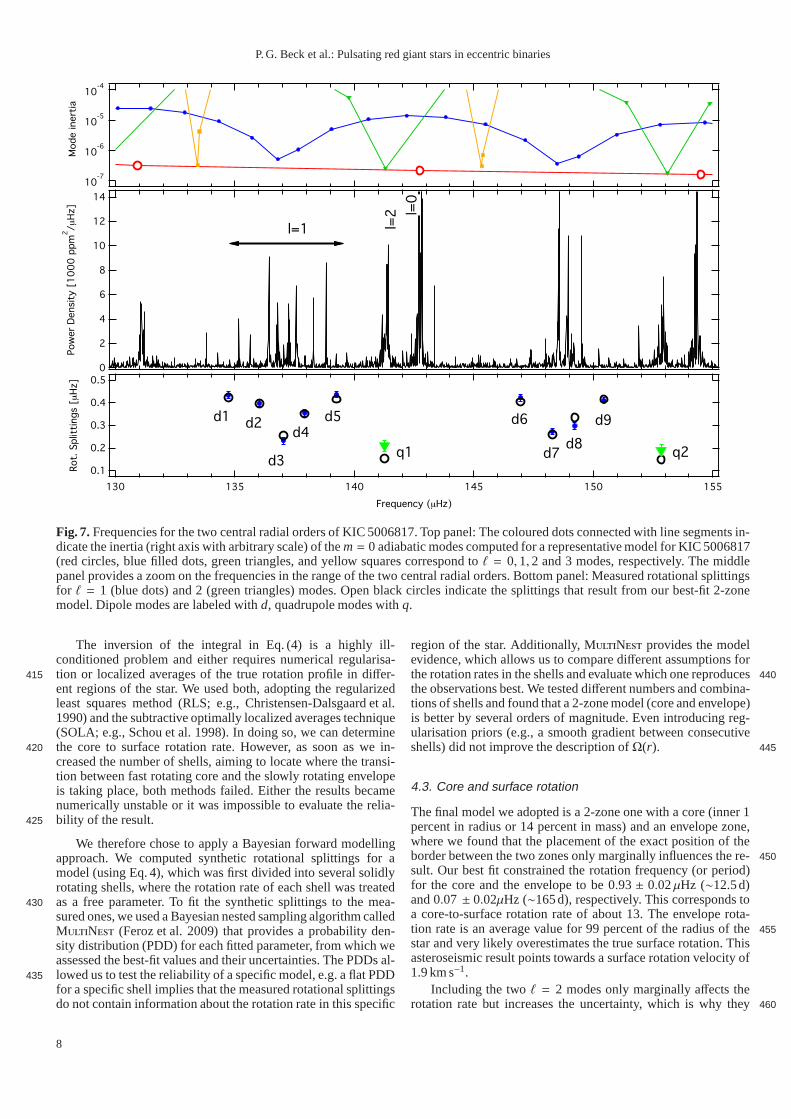
We focused on the two radial orders (i.e. the frequencyrange of∼130 to∼155µHz), in which 9 rotationally split dipole380modes with good signal-to-noise were extracted. Additionally,we tested if rotational splittings from twoℓ = 2 modes can bemeasured. In Fig. 7 we show the power density spectrum of thetwo radial orders of KIC 5006817 along with the mode inertia oftheℓ = 0 to 3 modes computed for our representative model, in385
the adiabatic approximation.In order to determine which layers dominate the rotational
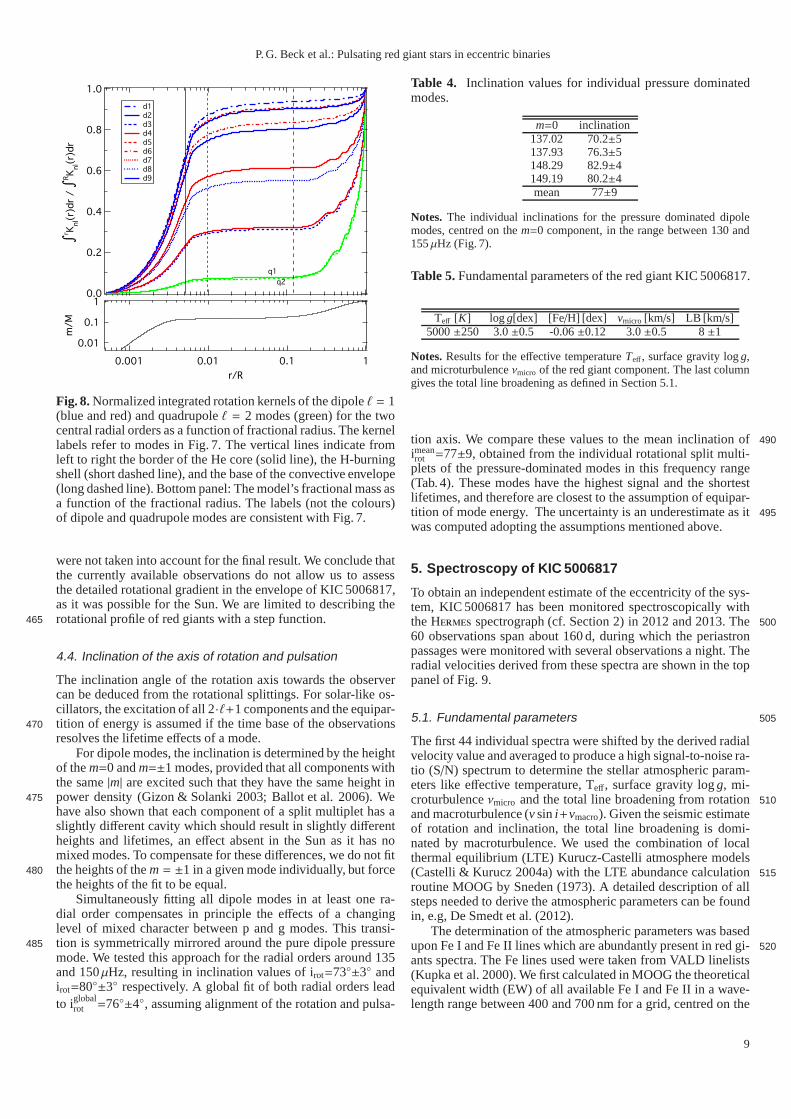
splitting of a given mode, we computed the adiabatic eigenfunc-tions for the 9 dipole and 2 quadrupole modes (using the non-radial nonadiabatic stellar pulsation code by Guenther 1994) as 390well as their rotational kernels. The integrated and normalizedkernels are shown as a function of the fractional radius in Fig. 8,illustrating that all dipole modes contain a significant contribu-tion from the fast rotating core region, even the most p-modedominated ones (indicated as d3 and d7). The kernels are al-395
most flat in the radiative region of the envelope (between thetwodashed vertical lines). This is in agreement with the analysis ofthe kernels for KIC 8366239 (Beck et al. 2012). The dipole split-tings provide an upper limit for the surface rotation rate. Morepromising are theℓ = 2 kernels, but even those contain signif-400icant contributions from the core and from the inner part of theconvective envelope.
For a better quantitative result, we deduce the rotation profileΩ(r) such that
δ fn,ℓ =1
2πIn,ℓ
∫ R
r=0Kn,ℓ(r)Ω(r)dr, (4) 405
is satisfied for the measured splittings. HereIn,ℓ andKn,ℓ are themode inertia and the rotational kernel of a given mode, respec-tively, andR is the radius of the model. To solve this equation,several inversion techniques have been developed in the pastwith the aim to determine the internal rotation profile of theSun. 410A summary how to apply them to an evolved star is available inDeheuvels et al. (2012).
7
P. G. Beck et al.: Pulsating red giant stars in eccentric binaries
14
12
10
8
6
4
2
0
Pow
er
Densi
ty [
1000 p
pm
2/mH
z]
0.5
0.4
0.3
0.2
0.1Rot.
Split
tings
[mH
z]
155150145140135130
Frequency (mHz)
d1 d2
d3
d4d5 d6
d7d8
d9
q2q1
10-7
10-6
10-5
10-4
Mode inert
ia
l=2 l=
0
l=1
Fig. 7. Frequencies for the two central radial orders of KIC 5006817. Top panel: The coloured dots connected with line segments in-dicate the inertia (right axis with arbitrary scale) of them = 0 adiabatic modes computed for a representative model for KIC 5006817(red circles, blue filled dots, green triangles, and yellow squares correspond toℓ = 0, 1, 2 and 3 modes, respectively. The middlepanel provides a zoom on the frequencies in the range of the two central radial orders. Bottom panel: Measured rotationalsplittingsfor ℓ = 1 (blue dots) and 2 (green triangles) modes. Open black circles indicate the splittings that result from our best-fit 2-zonemodel. Dipole modes are labeled withd, quadrupole modes withq.
The inversion of the integral in Eq. (4) is a highly ill-conditioned problem and either requires numerical regularisa-tion or localized averages of the true rotation profile in differ-415ent regions of the star. We used both, adopting the regularizedleast squares method (RLS; e.g., Christensen-Dalsgaard etal.1990) and the subtractive optimally localized averages technique(SOLA; e.g., Schou et al. 1998). In doing so, we can determinethe core to surface rotation rate. However, as soon as we in-420
creased the number of shells, aiming to locate where the transi-tion between fast rotating core and the slowly rotating envelopeis taking place, both methods failed. Either the results becamenumerically unstable or it was impossible to evaluate the relia-bility of the result.425
We therefore chose to apply a Bayesian forward modellingapproach. We computed synthetic rotational splittings foramodel (using Eq. 4), which was first divided into several solidlyrotating shells, where the rotation rate of each shell was treatedas a free parameter. To fit the synthetic splittings to the mea-430sured ones, we used a Bayesian nested sampling algorithm calledMultiNest (Feroz et al. 2009) that provides a probability den-sity distribution (PDD) for each fitted parameter, from which weassessed the best-fit values and their uncertainties. The PDDs al-lowed us to test the reliability of a specific model, e.g. a flatPDD435for a specific shell implies that the measured rotational splittingsdo not contain information about the rotation rate in this specific
region of the star. Additionally, MultiNest provides the modelevidence, which allows us to compare different assumptions forthe rotation rates in the shells and evaluate which one reproduces 440the observations best. We tested different numbers and combina-tions of shells and found that a 2-zone model (core and envelope)is better by several orders of magnitude. Even introducing reg-ularisation priors (e.g., a smooth gradient between consecutiveshells) did not improve the description ofΩ(r). 445
4.3. Core and surface rotation
The final model we adopted is a 2-zone one with a core (inner 1percent in radius or 14 percent in mass) and an envelope zone,where we found that the placement of the exact position of theborder between the two zones only marginally influences the re- 450sult. Our best fit constrained the rotation frequency (or period)for the core and the envelope to be 0.93± 0.02µHz (∼12.5d)and 0.07 ± 0.02µHz (∼165d), respectively. This corresponds toa core-to-surface rotation rate of about 13. The envelope rota-tion rate is an average value for 99 percent of the radius of the 455star and very likely overestimates the true surface rotation. Thisasteroseismic result points towards a surface rotation velocity of1.9 km s−1.
Including the twoℓ = 2 modes only marginally affects therotation rate but increases the uncertainty, which is why they 460
8
P. G. Beck et al.: Pulsating red giant stars in eccentric binaries
1.0
0.8
0.6
0.4
0.2
0.0
ºr K
nl(r)
dr
/ º
RK
nl(r)
dr
q1
q2
d1 d2 d3 d4 d5 d6 d7 d8 d9
0.01
0.1
1
m/M
0.001 0.01 0.1 1
r/R
Fig. 8. Normalized integrated rotation kernels of the dipoleℓ = 1(blue and red) and quadrupoleℓ = 2 modes (green) for the twocentral radial orders as a function of fractional radius. The kernellabels refer to modes in Fig. 7. The vertical lines indicate fromleft to right the border of the He core (solid line), the H-burningshell (short dashed line), and the base of the convective envelope(long dashed line). Bottom panel: The model’s fractional mass asa function of the fractional radius. The labels (not the colours)of dipole and quadrupole modes are consistent with Fig. 7.
were not taken into account for the final result. We conclude thatthe currently available observations do not allow us to assessthe detailed rotational gradient in the envelope of KIC 5006817,as it was possible for the Sun. We are limited to describing therotational profile of red giants with a step function.465
4.4. Inclination of the axis of rotation and pulsation
The inclination angle of the rotation axis towards the observercan be deduced from the rotational splittings. For solar-like os-cillators, the excitation of all 2·ℓ+1 components and the equipar-tition of energy is assumed if the time base of the observations470resolves the lifetime effects of a mode.
For dipole modes, the inclination is determined by the heightof them=0 andm=±1 modes, provided that all components withthe same|m| are excited such that they have the same height inpower density (Gizon & Solanki 2003; Ballot et al. 2006). We475have also shown that each component of a split multiplet has aslightly different cavity which should result in slightly differentheights and lifetimes, an effect absent in the Sun as it has nomixed modes. To compensate for these differences, we do not fitthe heights of them = ±1 in a given mode individually, but force480
the heights of the fit to be equal.Simultaneously fitting all dipole modes in at least one ra-
dial order compensates in principle the effects of a changinglevel of mixed character between p and g modes. This transi-tion is symmetrically mirrored around the pure dipole pressure485
mode. We tested this approach for the radial orders around 135and 150µHz, resulting in inclination values of irot=73±3 andirot=80±3 respectively. A global fit of both radial orders leadto iglobal
rot =76±4, assuming alignment of the rotation and pulsa-
Table 4. Inclination values for individual pressure dominatedmodes.
m=0 inclination137.02 70.2±5137.93 76.3±5148.29 82.9±4149.19 80.2±4mean 77±9
Notes. The individual inclinations for the pressure dominated dipolemodes, centred on them=0 component, in the range between 130 and155µHz (Fig. 7).
Table 5. Fundamental parameters of the red giant KIC 5006817.
Teff [K] log g[dex] [Fe/H] [dex] vmicro [km/s] LB [km/s]5000±250 3.0±0.5 -0.06±0.12 3.0±0.5 8±1
Notes. Results for the effective temperatureTeff, surface gravity logg,and microturbulenceνmicro of the red giant component. The last columngives the total line broadening as defined in Section 5.1.
tion axis. We compare these values to the mean inclination of490imeanrot =77±9, obtained from the individual rotational split multi-plets of the pressure-dominated modes in this frequency range(Tab. 4). These modes have the highest signal and the shortestlifetimes, and therefore are closest to the assumption of equipar-tition of mode energy. The uncertainty is an underestimate as it 495
was computed adopting the assumptions mentioned above.
5. Spectroscopy of KIC 5006817
To obtain an independent estimate of the eccentricity of thesys-tem, KIC 5006817 has been monitored spectroscopically withthe Hermes spectrograph (cf. Section 2) in 2012 and 2013. The500
60 observations span about 160 d, during which the periastronpassages were monitored with several observations a night.Theradial velocities derived from these spectra are shown in the toppanel of Fig. 9.
5.1. Fundamental parameters 505
The first 44 individual spectra were shifted by the derived radialvelocity value and averaged to produce a high signal-to-noise ra-tio (S/N) spectrum to determine the stellar atmospheric param-eters like effective temperature, Teff, surface gravity logg, mi-croturbulenceνmicro and the total line broadening from rotation510and macroturbulence (v sini+vmacro). Given the seismic estimateof rotation and inclination, the total line broadening is domi-nated by macroturbulence. We used the combination of localthermal equilibrium (LTE) Kurucz-Castelli atmosphere models(Castelli & Kurucz 2004a) with the LTE abundance calculation 515
routine MOOG by Sneden (1973). A detailed description of allsteps needed to derive the atmospheric parameters can be foundin, e.g, De Smedt et al. (2012).
The determination of the atmospheric parameters was basedupon Fe I and Fe II lines which are abundantly present in red gi- 520ants spectra. The Fe lines used were taken from VALD linelists(Kupka et al. 2000). We first calculated in MOOG the theoreticalequivalent width (EW) of all available Fe I and Fe II in a wave-length range between 400 and 700 nm for a grid, centred on the
9
P. G. Beck et al.: Pulsating red giant stars in eccentric binaries
seismic parameters found (Table 1). The equivalent widths (EW)525
of lines were measured via direct integration, the abundance ofthe line was then computed by an iterative process where theo-retically calculated EWs were matched to the observed EW. Ifthe calculated EW deviated from the theoretical EW by a factorof 10, the line was rejected due to possible blends. The stellar pa-530rameters are listed in Table 5 and are based on the results from52 Fe I and 32 Fe II lines.
5.2. Spectral disentangling
In order to look for signatures of a companion in our spectra,we used the spectral disentangling (spd) method as implemented535
in thefdbinary code (Ilijic et al. 2004). Being applied in Fourierspace, the method provides a self-consistent and fast solutionfor the individual spectra of stellar components of a multiplesystem and a set of orbital parameters simultaneously (Hadrava1995). Thespd method usually requires a time-series of spec-540tra with good, homogeneous orbital phase coverage and delivershigh S/N mean spectra of individual components.
We used the highest S/N spectra to perform the spectral dis-entangling in a wide wavelength range from 480 to 580 nm.The spectra were split into smaller chunks, typically 5 nm wide,545
to avoid strong undulations in the continuum of the resultingdecomposed spectra from which the Fourier-basedspd methodis known to suffer (see, e.g., Hadrava 1995; Ilijic et al. 2004).Besides the above mentioned metal lines region that also con-tains the Hβ spectral line, we also focused on a few other regions550centered at some helium lines (He I 447, 492, and 502 nm, andHe II 469, 541, and 656 nm,) as well as the Hα line. This wasdone to verify whether the companion could be a white dwarfshowing helium and/or hydrogen lines only. In neither of theseregions could we detect the lines of the secondary. We estimate555the detection limit of the order of 3 percent of the continuum,which means that any contribution below this level would notbedetectable in our rather low S/N spectra (≃20 - 30 in Johnson V).
We also attempted to go beyond our actual detection limit of3 percent, by applying the least-squares deconvolution (LSD)560method (Donati et al. 1997) to the 44 individual spectra. Thismethod is based on the two fundamental assumptions of self-similarity of all spectral lines and linear addition of blends, andallows to compute a high-quality average line profile, whichisformally characterized by a very high S/N. The first assump-565tion requires hydrogen and helium lines as well as the metallines with pronounced damping wings to be excluded from thecalculations. Moreover, for slowly rotating stars (the case ofKIC 5006817), where the rotation is not the dominant source ofthe line broadening, the selfsimilarity is only applicableto the570
lines of (nearly) the same strengths. To account for this, weintro-duced a multiprofile technique as described by Kochukhov et al.(2010), which allows the computation of several average pro-files simultaneously for several sets of spectral lines grouped,e.g., according to their relative strengths. The model is then rep-575resented as a convolution of the computed mean profiles withthe line mask which contains information about the position ofindividual lines as well as their relative strengths.
Furthermore, part of the lines in the spectrum (e.g., thosewith overlapping absorption coefficients) add up non-linearly580
which requires a revision of the second fundamental assump-tion of the technique. In order to account for the model imper-fections due to non-linear blending of the lines, we additionallyfitted strengths of the individual lines from the mask to matchthe observations. This improved procedure (for more details, see585Tkachenko et al. 2013) provided us with high S/N (of the or-
0.9980
0.9985
0.9990
0.9995
1.0000
1.0005
1.0010
1.0015
Rel
ativ
e F
lux
-0.00020.00000.0002
-0.6 -0.4 -0.2 0.0 0.2 0.4 0.6
Phase
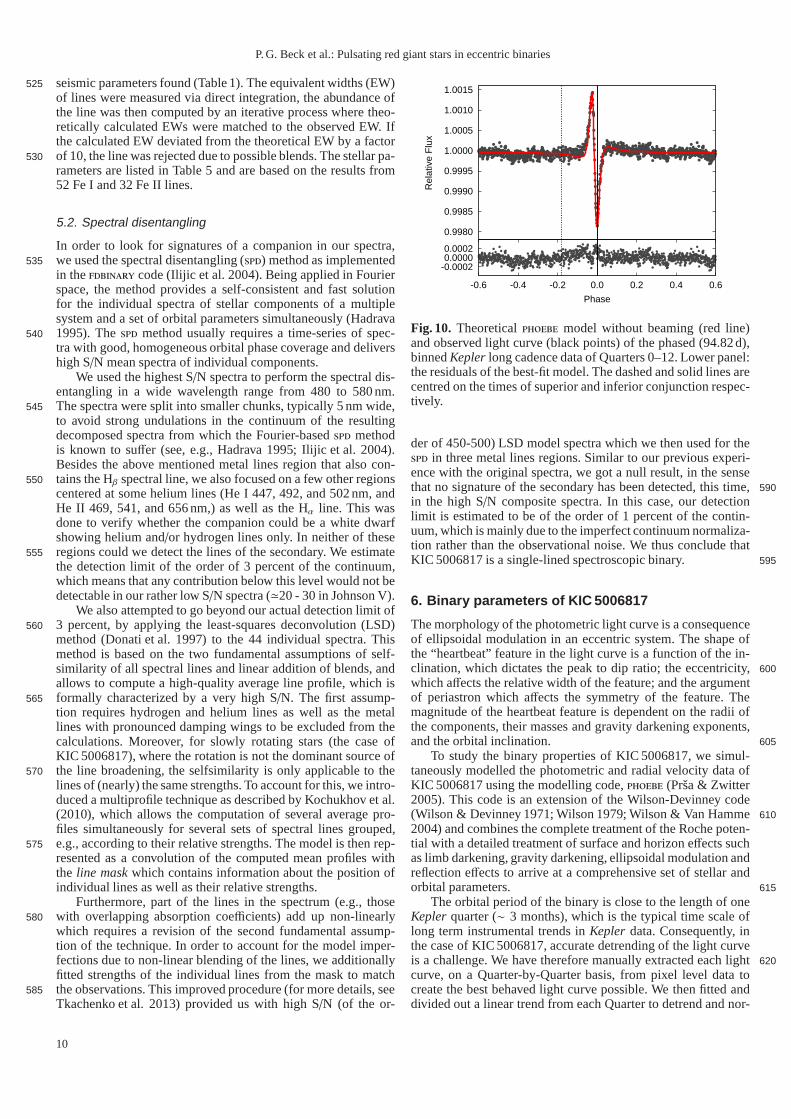
Fig. 10. Theoreticalphoebe model without beaming (red line)and observed light curve (black points) of the phased (94.82d),binnedKepler long cadence data of Quarters 0–12. Lower panel:the residuals of the best-fit model. The dashed and solid lines arecentred on the times of superior and inferior conjunction respec-tively.
der of 450-500) LSD model spectra which we then used for thespd in three metal lines regions. Similar to our previous experi-ence with the original spectra, we got a null result, in the sensethat no signature of the secondary has been detected, this time, 590in the high S/N composite spectra. In this case, our detectionlimit is estimated to be of the order of 1 percent of the contin-uum, which is mainly due to the imperfect continuum normaliza-tion rather than the observational noise. We thus conclude thatKIC 5006817 is a single-lined spectroscopic binary. 595
6. Binary parameters of KIC 5006817
The morphology of the photometric light curve is a consequenceof ellipsoidal modulation in an eccentric system. The shapeofthe “heartbeat” feature in the light curve is a function of the in-clination, which dictates the peak to dip ratio; the eccentricity, 600
which affects the relative width of the feature; and the argumentof periastron which affects the symmetry of the feature. Themagnitude of the heartbeat feature is dependent on the radiiofthe components, their masses and gravity darkening exponents,and the orbital inclination. 605
To study the binary properties of KIC 5006817, we simul-taneously modelled the photometric and radial velocity data ofKIC 5006817 using the modelling code,phoebe (Prsa & Zwitter2005). This code is an extension of the Wilson-Devinney code(Wilson & Devinney 1971; Wilson 1979; Wilson & Van Hamme610
2004) and combines the complete treatment of the Roche poten-tial with a detailed treatment of surface and horizon effects suchas limb darkening, gravity darkening, ellipsoidal modulation andreflection effects to arrive at a comprehensive set of stellar andorbital parameters. 615
The orbital period of the binary is close to the length of oneKepler quarter (∼ 3 months), which is the typical time scale oflong term instrumental trends inKepler data. Consequently, inthe case of KIC 5006817, accurate detrending of the light curveis a challenge. We have therefore manually extracted each light 620
curve, on a Quarter-by-Quarter basis, from pixel level datatocreate the best behaved light curve possible. We then fitted anddivided out a linear trend from each Quarter to detrend and nor-
10
P. G. Beck et al.: Pulsating red giant stars in eccentric binaries
-40
-20
0
20
40
60
80R
adia
l Vel
ocity
(
km/s
)
-0.20.00.2
-0.20.00.2
-0.6 -0.4 -0.2 0.0 0.2 0.4 0.6
Res
idua
ls
(km
/s)
Phase
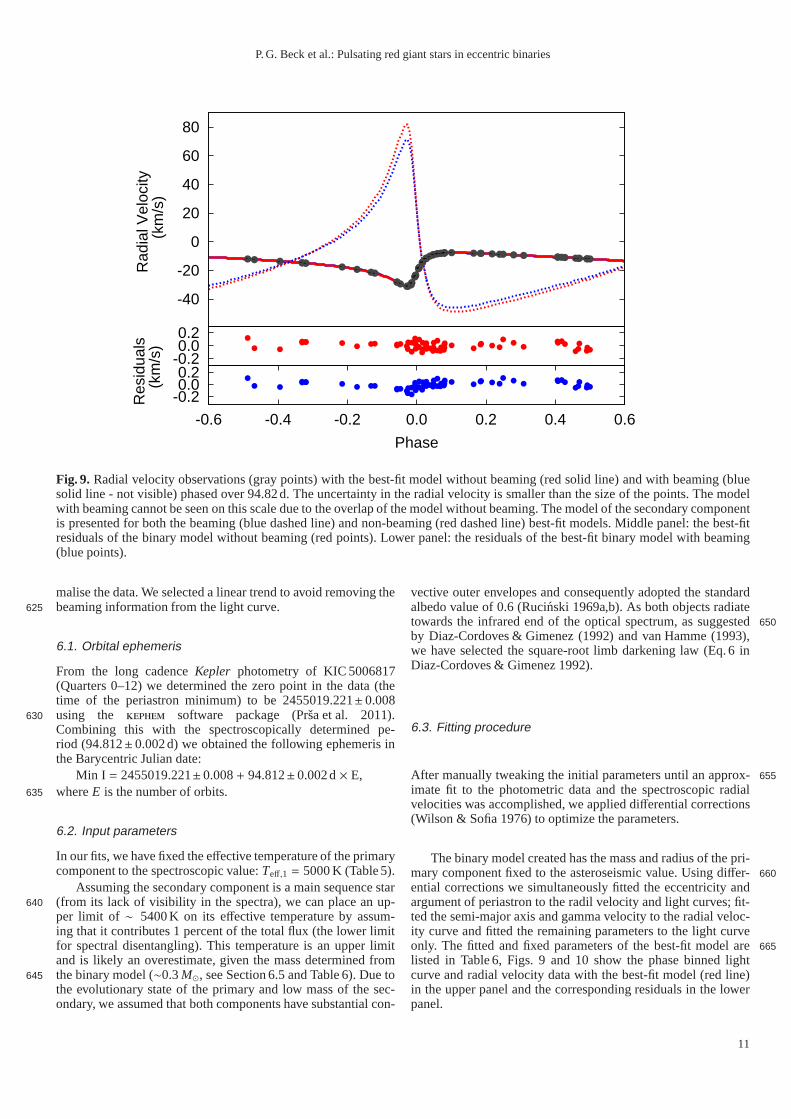
Fig. 9. Radial velocity observations (gray points) with the best-fit model without beaming (red solid line) and with beaming (bluesolid line - not visible) phased over 94.82d. The uncertainty in the radial velocity is smaller than the size of the points. The modelwith beaming cannot be seen on this scale due to the overlap ofthe model without beaming. The model of the secondary componentis presented for both the beaming (blue dashed line) and non-beaming (red dashed line) best-fit models. Middle panel: thebest-fitresiduals of the binary model without beaming (red points).Lower panel: the residuals of the best-fit binary model with beaming(blue points).
malise the data. We selected a linear trend to avoid removingthebeaming information from the light curve.625
6.1. Orbital ephemeris
From the long cadenceKepler photometry of KIC 5006817(Quarters 0–12) we determined the zero point in the data (thetime of the periastron minimum) to be 2455019.221± 0.008using the kephem software package (Prsa et al. 2011).630Combining this with the spectroscopically determined pe-riod (94.812± 0.002d) we obtained the following ephemeris inthe Barycentric Julian date:
Min I = 2455019.221± 0.008+ 94.812± 0.002d× E,whereE is the number of orbits.635
6.2. Input parameters
In our fits, we have fixed the effective temperature of the primarycomponent to the spectroscopic value:Teff,1 = 5000 K (Table 5).
Assuming the secondary component is a main sequence star(from its lack of visibility in the spectra), we can place an up-640per limit of ∼ 5400 K on its effective temperature by assum-ing that it contributes 1 percent of the total flux (the lower limitfor spectral disentangling). This temperature is an upper limitand is likely an overestimate, given the mass determined fromthe binary model (∼0.3M⊙, see Section 6.5 and Table 6). Due to645the evolutionary state of the primary and low mass of the sec-ondary, we assumed that both components have substantial con-
vective outer envelopes and consequently adopted the standardalbedo value of 0.6 (Rucinski 1969a,b). As both objects radiatetowards the infrared end of the optical spectrum, as suggested 650by Diaz-Cordoves & Gimenez (1992) and van Hamme (1993),we have selected the square-root limb darkening law (Eq. 6 inDiaz-Cordoves & Gimenez 1992).
6.3. Fitting procedure
After manually tweaking the initial parameters until an approx- 655
imate fit to the photometric data and the spectroscopic radialvelocities was accomplished, we applied differential corrections(Wilson & Sofia 1976) to optimize the parameters.
The binary model created has the mass and radius of the pri-mary component fixed to the asteroseismic value. Using differ- 660
ential corrections we simultaneously fitted the eccentricity andargument of periastron to the radil velocity and light curves; fit-ted the semi-major axis and gamma velocity to the radial veloc-ity curve and fitted the remaining parameters to the light curveonly. The fitted and fixed parameters of the best-fit model are665listed in Table 6, Figs. 9 and 10 show the phase binned lightcurve and radial velocity data with the best-fit model (red line)in the upper panel and the corresponding residuals in the lowerpanel.
11
P. G. Beck et al.: Pulsating red giant stars in eccentric binaries
Table 6. Parameters and coefficients for thephoebe best-fitmodel to theKepler light curve for Quarters 0−12 long cadencedata for the non-beaming and beaming cases. For the beamingcase we assumed 100% of the flux comes from the primary com-ponent.
Parameter Non-beaming BeamingMass ratio,q 0.199±0.001 0.20±0.03Secondary mass (M⊙), M2 0.30±0.01 0.29±0.03Semi-major axis (R⊙), a 106.1±0.5 105.6± 0.9Orbital eccentricity,e 0.71±0.01 0.71±0.02Argument of periastron (rad),ω 4.0±0.1 4.01±0.06Orbital inclination (), i 62±4 61±6Primary potential,Ω1 16.7±0.2 16.2±0.2Gamma velocity (km s−1), γ -14.01±0.01 -14.43±0.08Primary logg (cgs), logg1 3.078±0.007 3.022±0.007Gravity darkening exponent,grd 1.00±0.03 1.07±0.03Primary fractional point radius 0.0644 0.0679Primary fractional pole radius 0.0637 0.0676Phase of periastron 0.0121 0.0094Primaryx1 coeff. 0.718 0.717Primaryy1 coeff. 0.716 0.714Fixed Parameters Values: Both CasesPrimaryTe f f (K) 5000±250Third light 0.0Orbital Period (d) 94.812±0.002Time of primary minimum (BJD) 245019.221±0.008Primary Bolometric albedo 0.6
Notes. The secondary component’s potential, radius and logg are notnoted as these parameters have no signature in the light curve and radialvelocity data. The fractional radii quoted are the radii relative to thesemi-major axis. For the mass and radius of the primary component, seeTable 1. The limb darkening coefficients (x1 andy1) are for the squareroot limb darkening law and were taken from thephoebe limb darkeningtables (Prsa et al. 2011).
0.9980
0.9985
0.9990
0.9995
1.0000
1.0005
1.0010
1.0015
Rel
ativ
e F
lux
-0.00020.00000.0002
0.99981.00001.0002
-0.6 -0.4 -0.2 0.0 0.2 0.4 0.6
Bea
min
gF
unct
ion
Phase
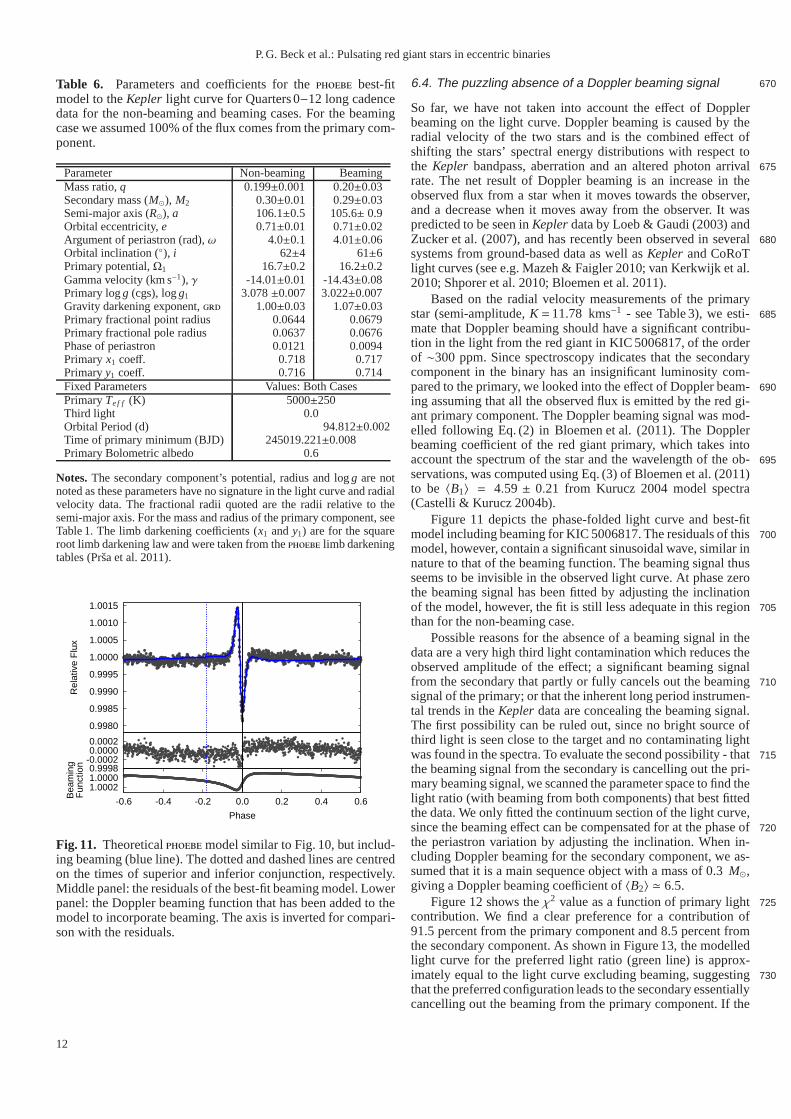
Fig. 11. Theoreticalphoebemodel similar to Fig. 10, but includ-ing beaming (blue line). The dotted and dashed lines are centredon the times of superior and inferior conjunction, respectively.Middle panel: the residuals of the best-fit beaming model. Lowerpanel: the Doppler beaming function that has been added to themodel to incorporate beaming. The axis is inverted for compari-son with the residuals.
6.4. The puzzling absence of a Doppler beaming signal 670
So far, we have not taken into account the effect of Dopplerbeaming on the light curve. Doppler beaming is caused by theradial velocity of the two stars and is the combined effect ofshifting the stars’ spectral energy distributions with respect tothe Kepler bandpass, aberration and an altered photon arrival675rate. The net result of Doppler beaming is an increase in theobserved flux from a star when it moves towards the observer,and a decrease when it moves away from the observer. It waspredicted to be seen inKepler data by Loeb & Gaudi (2003) andZucker et al. (2007), and has recently been observed in several 680systems from ground-based data as well asKepler and CoRoTlight curves (see e.g. Mazeh & Faigler 2010; van Kerkwijk et al.2010; Shporer et al. 2010; Bloemen et al. 2011).
Based on the radial velocity measurements of the primarystar (semi-amplitude,K =11.78 kms−1 - see Table 3), we esti-685
mate that Doppler beaming should have a significant contribu-tion in the light from the red giant in KIC 5006817, of the orderof ∼300 ppm. Since spectroscopy indicates that the secondarycomponent in the binary has an insignificant luminosity com-pared to the primary, we looked into the effect of Doppler beam-690ing assuming that all the observed flux is emitted by the red gi-ant primary component. The Doppler beaming signal was mod-elled following Eq. (2) in Bloemen et al. (2011). The Dopplerbeaming coefficient of the red giant primary, which takes intoaccount the spectrum of the star and the wavelength of the ob-695
servations, was computed using Eq. (3) of Bloemen et al. (2011)to be 〈B1〉 = 4.59 ± 0.21 from Kurucz 2004 model spectra(Castelli & Kurucz 2004b).
Figure 11 depicts the phase-folded light curve and best-fitmodel including beaming for KIC 5006817. The residuals of this 700model, however, contain a significant sinusoidal wave, similar innature to that of the beaming function. The beaming signal thusseems to be invisible in the observed light curve. At phase zerothe beaming signal has been fitted by adjusting the inclinationof the model, however, the fit is still less adequate in this region 705than for the non-beaming case.
Possible reasons for the absence of a beaming signal in thedata are a very high third light contamination which reducestheobserved amplitude of the effect; a significant beaming signalfrom the secondary that partly or fully cancels out the beaming 710signal of the primary; or that the inherent long period instrumen-tal trends in theKepler data are concealing the beaming signal.The first possibility can be ruled out, since no bright sourceofthird light is seen close to the target and no contaminating lightwas found in the spectra. To evaluate the second possibility- that 715the beaming signal from the secondary is cancelling out the pri-mary beaming signal, we scanned the parameter space to find thelight ratio (with beaming from both components) that best fittedthe data. We only fitted the continuum section of the light curve,since the beaming effect can be compensated for at the phase of720
the periastron variation by adjusting the inclination. When in-cluding Doppler beaming for the secondary component, we as-sumed that it is a main sequence object with a mass of 0.3M⊙,giving a Doppler beaming coefficient of〈B2〉 ≃ 6.5.
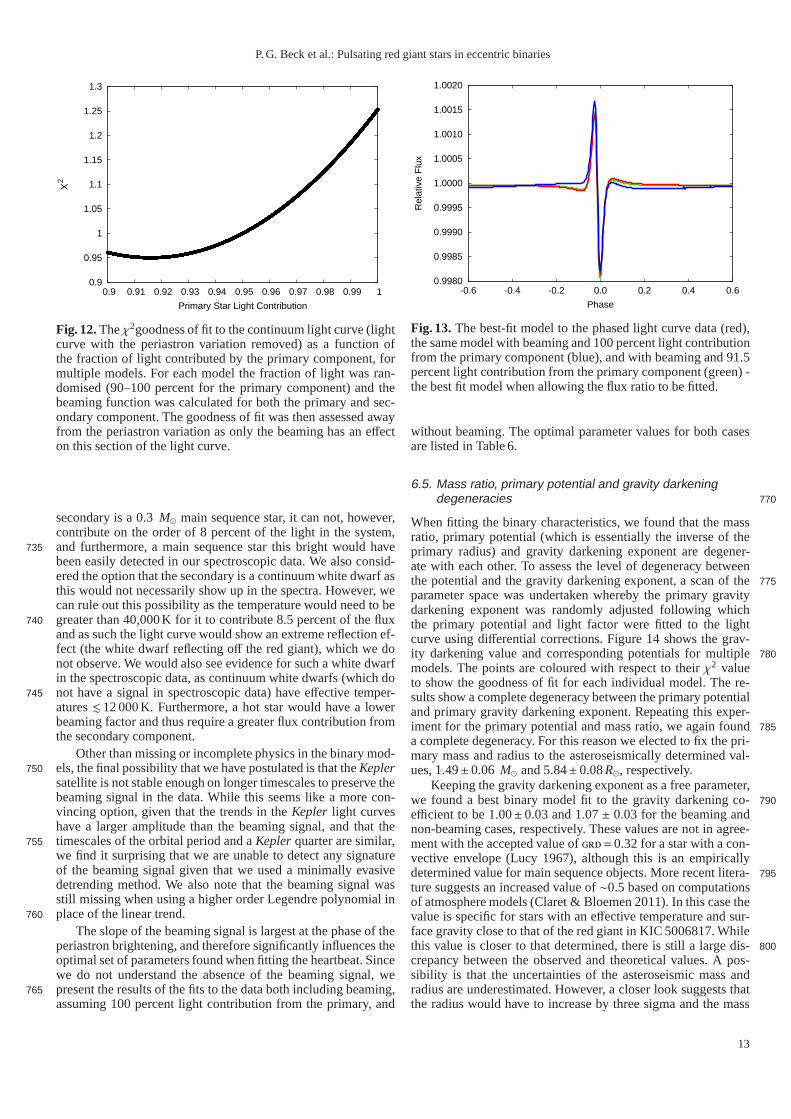
Figure 12 shows theχ2 value as a function of primary light725contribution. We find a clear preference for a contribution of91.5 percent from the primary component and 8.5 percent fromthe secondary component. As shown in Figure 13, the modelledlight curve for the preferred light ratio (green line) is approx-imately equal to the light curve excluding beaming, suggesting 730that the preferred configuration leads to the secondary essentiallycancelling out the beaming from the primary component. If the
12
P. G. Beck et al.: Pulsating red giant stars in eccentric binaries
0.9
0.95
1
1.05
1.1
1.15
1.2
1.25
1.3
0.9 0.91 0.92 0.93 0.94 0.95 0.96 0.97 0.98 0.99 1
Χ2
Primary Star Light Contribution
Fig. 12. Theχ2goodness of fit to the continuum light curve (lightcurve with the periastron variation removed) as a function ofthe fraction of light contributed by the primary component,formultiple models. For each model the fraction of light was ran-domised (90–100 percent for the primary component) and thebeaming function was calculated for both the primary and sec-ondary component. The goodness of fit was then assessed awayfrom the periastron variation as only the beaming has an effecton this section of the light curve.
secondary is a 0.3M⊙ main sequence star, it can not, however,contribute on the order of 8 percent of the light in the system,and furthermore, a main sequence star this bright would have735been easily detected in our spectroscopic data. We also consid-ered the option that the secondary is a continuum white dwarfasthis would not necessarily show up in the spectra. However, wecan rule out this possibility as the temperature would need to begreater than 40,000K for it to contribute 8.5 percent of the flux740and as such the light curve would show an extreme reflection ef-fect (the white dwarf reflecting off the red giant), which we donot observe. We would also see evidence for such a white dwarfin the spectroscopic data, as continuum white dwarfs (whichdonot have a signal in spectroscopic data) have effective temper-745
atures. 12 000 K. Furthermore, a hot star would have a lowerbeaming factor and thus require a greater flux contribution fromthe secondary component.
Other than missing or incomplete physics in the binary mod-els, the final possibility that we have postulated is that theKepler750
satellite is not stable enough on longer timescales to preserve thebeaming signal in the data. While this seems like a more con-vincing option, given that the trends in theKepler light curveshave a larger amplitude than the beaming signal, and that thetimescales of the orbital period and aKepler quarter are similar,755we find it surprising that we are unable to detect any signatureof the beaming signal given that we used a minimally evasivedetrending method. We also note that the beaming signal wasstill missing when using a higher order Legendre polynomialinplace of the linear trend.760
The slope of the beaming signal is largest at the phase of theperiastron brightening, and therefore significantly influences theoptimal set of parameters found when fitting the heartbeat. Sincewe do not understand the absence of the beaming signal, wepresent the results of the fits to the data both including beaming,765assuming 100 percent light contribution from the primary, and
0.9980
0.9985
0.9990
0.9995
1.0000
1.0005
1.0010
1.0015
1.0020
-0.6 -0.4 -0.2 0.0 0.2 0.4 0.6
Rel
ativ
e F
lux
Phase
Fig. 13. The best-fit model to the phased light curve data (red),the same model with beaming and 100 percent light contributionfrom the primary component (blue), and with beaming and 91.5percent light contribution from the primary component (green) -the best fit model when allowing the flux ratio to be fitted.
without beaming. The optimal parameter values for both casesare listed in Table 6.
6.5. Mass ratio, primary potential and gravity darkeningdegeneracies 770
When fitting the binary characteristics, we found that the massratio, primary potential (which is essentially the inverseof theprimary radius) and gravity darkening exponent are degener-ate with each other. To assess the level of degeneracy betweenthe potential and the gravity darkening exponent, a scan of the 775parameter space was undertaken whereby the primary gravitydarkening exponent was randomly adjusted following whichthe primary potential and light factor were fitted to the lightcurve using differential corrections. Figure 14 shows the grav-ity darkening value and corresponding potentials for multiple 780
models. The points are coloured with respect to theirχ2 valueto show the goodness of fit for each individual model. The re-sults show a complete degeneracy between the primary potentialand primary gravity darkening exponent. Repeating this exper-iment for the primary potential and mass ratio, we again found 785a complete degeneracy. For this reason we elected to fix the pri-mary mass and radius to the asteroseismically determined val-ues, 1.49± 0.06 M⊙ and 5.84± 0.08R⊙, respectively.
Keeping the gravity darkening exponent as a free parameter,we found a best binary model fit to the gravity darkening co-790efficient to be 1.00± 0.03 and 1.07± 0.03 for the beaming andnon-beaming cases, respectively. These values are not in agree-ment with the accepted value ofgrd=0.32 for a star with a con-vective envelope (Lucy 1967), although this is an empiricallydetermined value for main sequence objects. More recent litera- 795
ture suggests an increased value of∼0.5 based on computationsof atmosphere models (Claret & Bloemen 2011). In this case thevalue is specific for stars with an effective temperature and sur-face gravity close to that of the red giant in KIC 5006817. Whilethis value is closer to that determined, there is still a large dis- 800crepancy between the observed and theoretical values. A pos-sibility is that the uncertainties of the asteroseismic mass andradius are underestimated. However, a closer look suggeststhatthe radius would have to increase by three sigma and the mass
13
P. G. Beck et al.: Pulsating red giant stars in eccentric binaries
0
0.1
0.2
0.3
0.4
0.5
0.6
0.7
0.8
0.9
1
14 14.5 15 15.5 16 16.5 17 17.5 18 18.5
Gra
vity
Dar
keni
ng
Potential
0
0.02
0.04
0.06
0.08
0.1
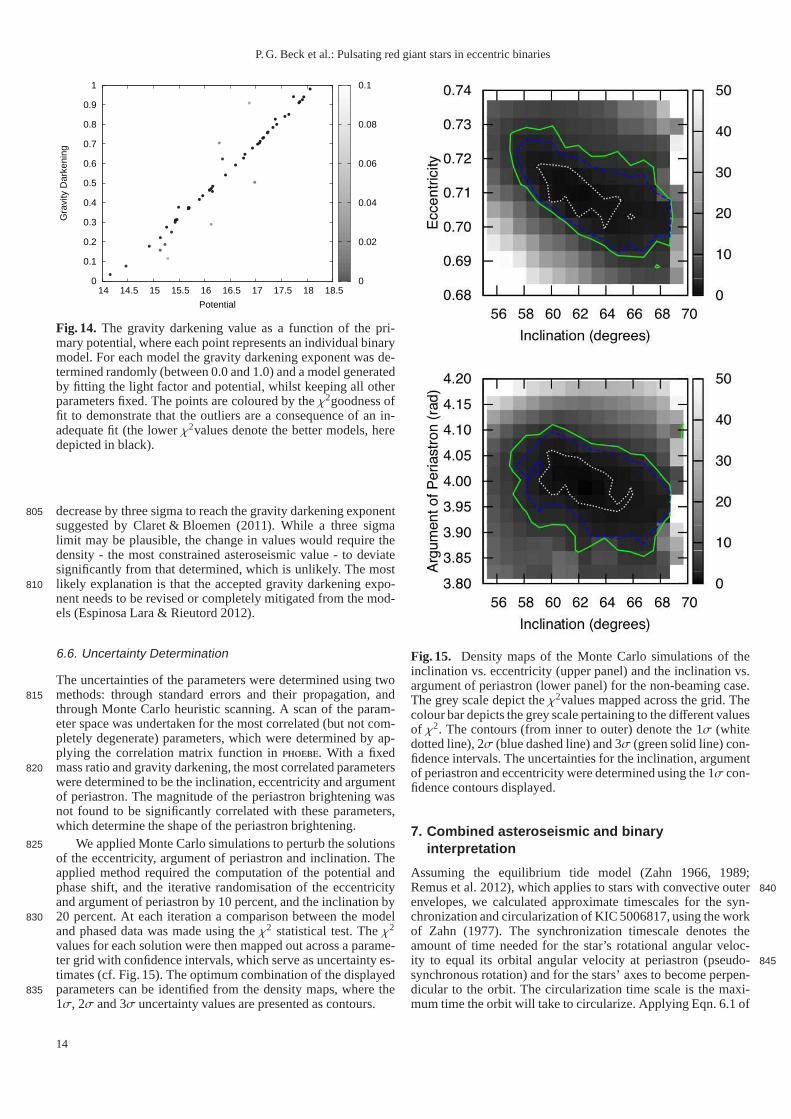
Fig. 14. The gravity darkening value as a function of the pri-mary potential, where each point represents an individual binarymodel. For each model the gravity darkening exponent was de-termined randomly (between 0.0 and 1.0) and a model generatedby fitting the light factor and potential, whilst keeping allotherparameters fixed. The points are coloured by theχ2goodness offit to demonstrate that the outliers are a consequence of an in-adequate fit (the lowerχ2values denote the better models, heredepicted in black).
decrease by three sigma to reach the gravity darkening exponent805suggested by Claret & Bloemen (2011). While a three sigmalimit may be plausible, the change in values would require thedensity - the most constrained asteroseismic value - to deviatesignificantly from that determined, which is unlikely. The mostlikely explanation is that the accepted gravity darkening expo-810nent needs to be revised or completely mitigated from the mod-els (Espinosa Lara & Rieutord 2012).
6.6. Uncertainty Determination
The uncertainties of the parameters were determined using twomethods: through standard errors and their propagation, and815through Monte Carlo heuristic scanning. A scan of the param-eter space was undertaken for the most correlated (but not com-pletely degenerate) parameters, which were determined by ap-plying the correlation matrix function inphoebe. With a fixedmass ratio and gravity darkening, the most correlated parameters820
were determined to be the inclination, eccentricity and argumentof periastron. The magnitude of the periastron brighteningwasnot found to be significantly correlated with these parameters,which determine the shape of the periastron brightening.
We applied Monte Carlo simulations to perturb the solutions825of the eccentricity, argument of periastron and inclination. Theapplied method required the computation of the potential andphase shift, and the iterative randomisation of the eccentricityand argument of periastron by 10 percent, and the inclination by20 percent. At each iteration a comparison between the model830
and phased data was made using theχ2 statistical test. Theχ2
values for each solution were then mapped out across a parame-ter grid with confidence intervals, which serve as uncertainty es-timates (cf. Fig. 15). The optimum combination of the displayedparameters can be identified from the density maps, where the8351σ, 2σ and 3σ uncertainty values are presented as contours.
Fig. 15. Density maps of the Monte Carlo simulations of theinclination vs. eccentricity (upper panel) and the inclination vs.argument of periastron (lower panel) for the non-beaming case.The grey scale depict theχ2values mapped across the grid. Thecolour bar depicts the grey scale pertaining to the different valuesof χ2. The contours (from inner to outer) denote the 1σ (whitedotted line), 2σ (blue dashed line) and 3σ (green solid line) con-fidence intervals. The uncertainties for the inclination, argumentof periastron and eccentricity were determined using the 1σ con-fidence contours displayed.
7. Combined asteroseismic and binaryinterpretation
Assuming the equilibrium tide model (Zahn 1966, 1989;Remus et al. 2012), which applies to stars with convective outer 840envelopes, we calculated approximate timescales for the syn-chronization and circularization of KIC 5006817, using theworkof Zahn (1977). The synchronization timescale denotes theamount of time needed for the star’s rotational angular veloc-ity to equal its orbital angular velocity at periastron (pseudo- 845
synchronous rotation) and for the stars’ axes to become perpen-dicular to the orbit. The circularization time scale is the maxi-mum time the orbit will take to circularize. Applying Eqn. 6.1 of
14
P. G. Beck et al.: Pulsating red giant stars in eccentric binaries
0.9980
0.9985
0.9990
0.9995
1.0000
1.0005
1.0010
1.0015
-0.15 -0.10 -0.05 0.00 0.05 0.10
Rel
ativ
e F
lux
Phase
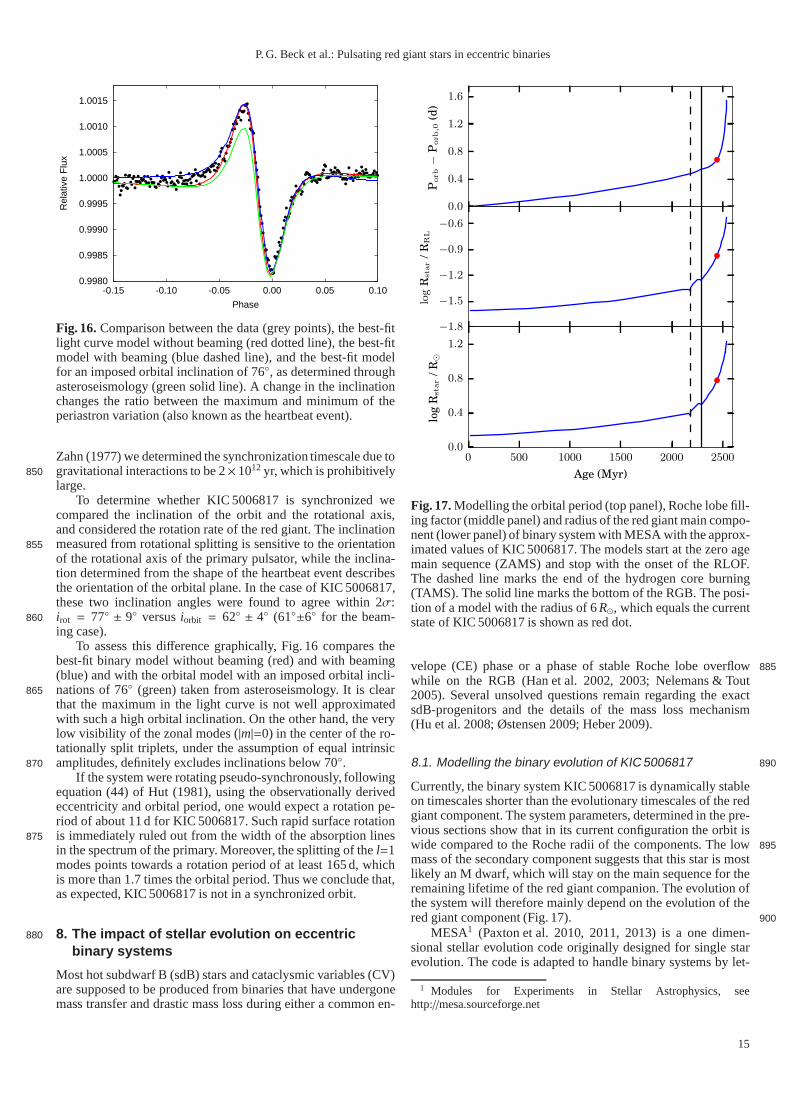
Fig. 16. Comparison between the data (grey points), the best-fitlight curve model without beaming (red dotted line), the best-fitmodel with beaming (blue dashed line), and the best-fit modelfor an imposed orbital inclination of 76, as determined throughasteroseismology (green solid line). A change in the inclinationchanges the ratio between the maximum and minimum of theperiastron variation (also known as the heartbeat event).
Zahn (1977) we determined the synchronization timescale due togravitational interactions to be 2× 10¹² yr, which is prohibitively850large.
To determine whether KIC 5006817 is synchronized wecompared the inclination of the orbit and the rotational axis,and considered the rotation rate of the red giant. The inclinationmeasured from rotational splitting is sensitive to the orientation855
of the rotational axis of the primary pulsator, while the inclina-tion determined from the shape of the heartbeat event describesthe orientation of the orbital plane. In the case of KIC 5006817,these two inclination angles were found to agree within 2σ:irot = 77 ± 9 versusiorbit = 62 ± 4 (61±6 for the beam-860ing case).
To assess this difference graphically, Fig. 16 compares thebest-fit binary model without beaming (red) and with beaming(blue) and with the orbital model with an imposed orbital incli-nations of 76 (green) taken from asteroseismology. It is clear865that the maximum in the light curve is not well approximatedwith such a high orbital inclination. On the other hand, the verylow visibility of the zonal modes (|m|=0) in the center of the ro-tationally split triplets, under the assumption of equal intrinsicamplitudes, definitely excludes inclinations below 70.870
If the system were rotating pseudo-synchronously, followingequation (44) of Hut (1981), using the observationally derivedeccentricity and orbital period, one would expect a rotation pe-riod of about 11 d for KIC 5006817. Such rapid surface rotationis immediately ruled out from the width of the absorption lines875in the spectrum of the primary. Moreover, the splitting of the l=1modes points towards a rotation period of at least 165 d, whichis more than 1.7 times the orbital period. Thus we conclude that,as expected, KIC 5006817 is not in a synchronized orbit.
8. The impact of stellar evolution on eccentric880
binary systems
Most hot subdwarf B (sdB) stars and cataclysmic variables (CV)are supposed to be produced from binaries that have undergonemass transfer and drastic mass loss during either a common en-
0.0
0.4
0.8
1.2
1.6
Porb−
Porb,0
(d)
−1.8
−1.5
−1.2
−0.9
−0.6
log
Rstar
/R
RL
0 500 1000 1500 2000 2500
Age (Myr)
0.0
0.4
0.8
1.2
log
Rstar
/R
⊙
Fig. 17. Modelling the orbital period (top panel), Roche lobe fill-ing factor (middle panel) and radius of the red giant main compo-nent (lower panel) of binary system with MESA with the approx-imated values of KIC 5006817. The models start at the zero agemain sequence (ZAMS) and stop with the onset of the RLOF.The dashed line marks the end of the hydrogen core burning(TAMS). The solid line marks the bottom of the RGB. The posi-tion of a model with the radius of 6R⊙, which equals the currentstate of KIC 5006817 is shown as red dot.
velope (CE) phase or a phase of stable Roche lobe overflow885
while on the RGB (Han et al. 2002, 2003; Nelemans & Tout2005). Several unsolved questions remain regarding the exactsdB-progenitors and the details of the mass loss mechanism(Hu et al. 2008; Østensen 2009; Heber 2009).
8.1. Modelling the binary evolution of KIC 5006817 890
Currently, the binary system KIC 5006817 is dynamically stableon timescales shorter than the evolutionary timescales of the redgiant component. The system parameters, determined in the pre-vious sections show that in its current configuration the orbit iswide compared to the Roche radii of the components. The low895mass of the secondary component suggests that this star is mostlikely an M dwarf, which will stay on the main sequence for theremaining lifetime of the red giant companion. The evolution ofthe system will therefore mainly depend on the evolution of thered giant component (Fig. 17). 900
MESA1 (Paxton et al. 2010, 2011, 2013) is a one dimen-sional stellar evolution code originally designed for single starevolution. The code is adapted to handle binary systems by let-
1 Modules for Experiments in Stellar Astrophysics, seehttp://mesa.sourceforge.net
15
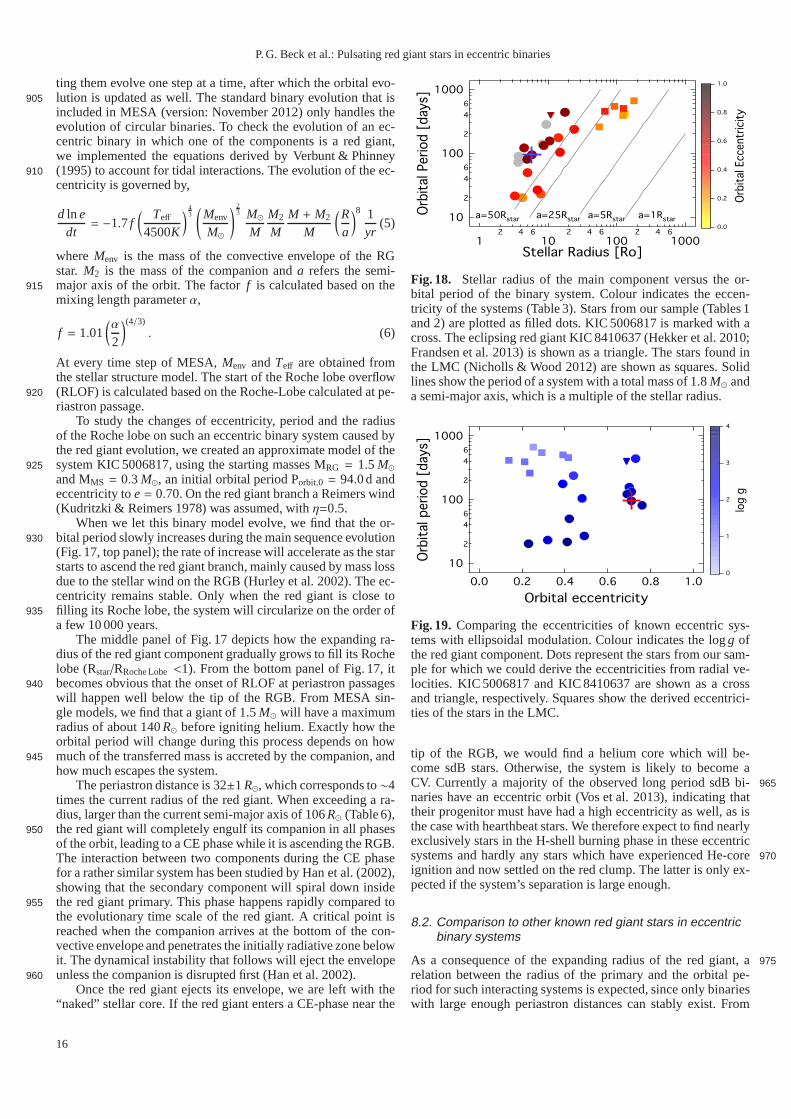
P. G. Beck et al.: Pulsating red giant stars in eccentric binaries
ting them evolve one step at a time, after which the orbital evo-lution is updated as well. The standard binary evolution that is905included in MESA (version: November 2012) only handles theevolution of circular binaries. To check the evolution of anec-centric binary in which one of the components is a red giant,we implemented the equations derived by Verbunt & Phinney(1995) to account for tidal interactions. The evolution of the ec-910centricity is governed by,
d ln edt= −1.7 f
( Teff
4500K
)
43(
Menv
M⊙
)23 M⊙
MM2
MM + M2
M
(Ra
)8 1yr
(5)
whereMenv is the mass of the convective envelope of the RGstar. M2 is the mass of the companion anda refers the semi-major axis of the orbit. The factorf is calculated based on the915mixing length parameterα,
f = 1.01(
α
2
)(4/3). (6)
At every time step of MESA,Menv andTeff are obtained fromthe stellar structure model. The start of the Roche lobe overflow(RLOF) is calculated based on the Roche-Lobe calculated at pe-920riastron passage.
To study the changes of eccentricity, period and the radiusof the Roche lobe on such an eccentric binary system caused bythe red giant evolution, we created an approximate model of thesystem KIC 5006817, using the starting masses MRG = 1.5 M⊙925
and MMS = 0.3 M⊙, an initial orbital period Porbit,0 = 94.0 d andeccentricity toe = 0.70. On the red giant branch a Reimers wind(Kudritzki & Reimers 1978) was assumed, withη=0.5.
When we let this binary model evolve, we find that the or-bital period slowly increases during the main sequence evolution930(Fig. 17, top panel); the rate of increase will accelerate asthe starstarts to ascend the red giant branch, mainly caused by mass lossdue to the stellar wind on the RGB (Hurley et al. 2002). The ec-centricity remains stable. Only when the red giant is close tofilling its Roche lobe, the system will circularize on the order of935
a few 10 000 years.The middle panel of Fig. 17 depicts how the expanding ra-
dius of the red giant component gradually grows to fill its Rochelobe (Rstar/RRoche Lobe<1). From the bottom panel of Fig. 17, itbecomes obvious that the onset of RLOF at periastron passages940will happen well below the tip of the RGB. From MESA sin-gle models, we find that a giant of 1.5M⊙ will have a maximumradius of about 140R⊙ before igniting helium. Exactly how theorbital period will change during this process depends on howmuch of the transferred mass is accreted by the companion, and945how much escapes the system.
The periastron distance is 32±1R⊙, which corresponds to∼4times the current radius of the red giant. When exceeding a ra-dius, larger than the current semi-major axis of 106R⊙ (Table 6),the red giant will completely engulf its companion in all phases950
of the orbit, leading to a CE phase while it is ascending the RGB.The interaction between two components during the CE phasefor a rather similar system has been studied by Han et al. (2002),showing that the secondary component will spiral down insidethe red giant primary. This phase happens rapidly compared to955the evolutionary time scale of the red giant. A critical point isreached when the companion arrives at the bottom of the con-vective envelope and penetrates the initially radiative zone belowit. The dynamical instability that follows will eject the envelopeunless the companion is disrupted first (Han et al. 2002).960
Once the red giant ejects its envelope, we are left with the“naked” stellar core. If the red giant enters a CE-phase nearthe
10
2
4
6
100
2
4
6
1000
Orb
ital
Period [
day
s]
12 4 6
102 4 6
1002 4 6
1000Stellar Radius [Ro]
1.0
0.8
0.6
0.4
0.2
0.0
Orb
ital
Ecc
entr
icit
y
a=1Rstara=5Rstara=25Rstara=50Rstar
Fig. 18. Stellar radius of the main component versus the or-bital period of the binary system. Colour indicates the eccen-tricity of the systems (Table 3). Stars from our sample (Tables 1and 2) are plotted as filled dots. KIC 5006817 is marked with across. The eclipsing red giant KIC 8410637 (Hekker et al. 2010;Frandsen et al. 2013) is shown as a triangle. The stars found inthe LMC (Nicholls & Wood 2012) are shown as squares. Solidlines show the period of a system with a total mass of 1.8M⊙ anda semi-major axis, which is a multiple of the stellar radius.
1.00.80.60.40.20.0
Orbital eccentricity
10
2
4
6
100
2
4
6
1000
Orb
ital
period [
day
s]4
3
2
1
0
log g
Fig. 19. Comparing the eccentricities of known eccentric sys-tems with ellipsoidal modulation. Colour indicates the logg ofthe red giant component. Dots represent the stars from our sam-ple for which we could derive the eccentricities from radialve-locities. KIC 5006817 and KIC 8410637 are shown as a crossand triangle, respectively. Squares show the derived eccentrici-ties of the stars in the LMC.
tip of the RGB, we would find a helium core which will be-come sdB stars. Otherwise, the system is likely to become aCV. Currently a majority of the observed long period sdB bi-965naries have an eccentric orbit (Vos et al. 2013), indicatingthattheir progenitor must have had a high eccentricity as well, as isthe case with hearthbeat stars. We therefore expect to find nearlyexclusively stars in the H-shell burning phase in these eccentricsystems and hardly any stars which have experienced He-core970ignition and now settled on the red clump. The latter is only ex-pected if the system’s separation is large enough.
8.2. Comparison to other known red giant stars in eccentricbinary systems
As a consequence of the expanding radius of the red giant, a975
relation between the radius of the primary and the orbital pe-riod for such interacting systems is expected, since only binarieswith large enough periastron distances can stably exist. From
16
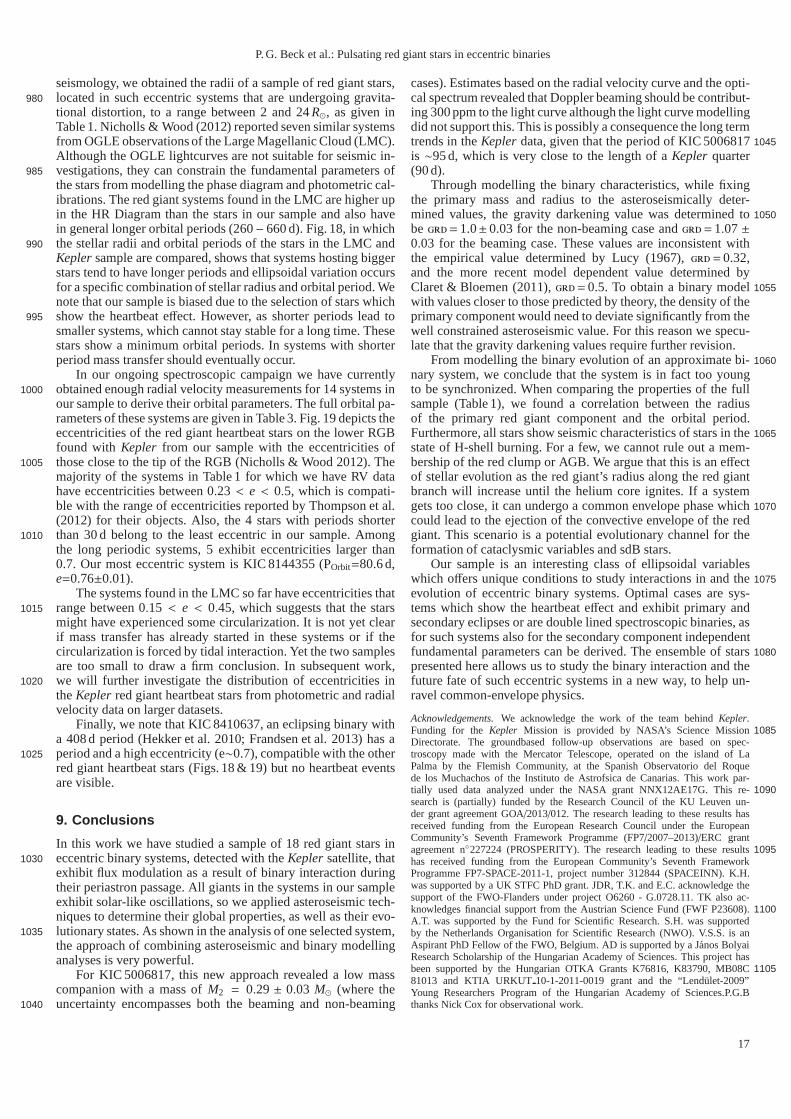
P. G. Beck et al.: Pulsating red giant stars in eccentric binaries
seismology, we obtained the radii of a sample of red giant stars,located in such eccentric systems that are undergoing gravita-980tional distortion, to a range between 2 and 24R⊙, as given inTable 1. Nicholls & Wood (2012) reported seven similar systemsfrom OGLE observations of the Large Magellanic Cloud (LMC).Although the OGLE lightcurves are not suitable for seismic in-vestigations, they can constrain the fundamental parameters of985the stars from modelling the phase diagram and photometric cal-ibrations. The red giant systems found in the LMC are higher upin the HR Diagram than the stars in our sample and also havein general longer orbital periods (260− 660 d). Fig. 18, in whichthe stellar radii and orbital periods of the stars in the LMC and990Kepler sample are compared, shows that systems hosting biggerstars tend to have longer periods and ellipsoidal variationoccursfor a specific combination of stellar radius and orbital period. Wenote that our sample is biased due to the selection of stars whichshow the heartbeat effect. However, as shorter periods lead to995
smaller systems, which cannot stay stable for a long time. Thesestars show a minimum orbital periods. In systems with shorterperiod mass transfer should eventually occur.
In our ongoing spectroscopic campaign we have currentlyobtained enough radial velocity measurements for 14 systems in1000our sample to derive their orbital parameters. The full orbital pa-rameters of these systems are given in Table 3. Fig. 19 depicts theeccentricities of the red giant heartbeat stars on the lowerRGBfound with Kepler from our sample with the eccentricities ofthose close to the tip of the RGB (Nicholls & Wood 2012). The1005majority of the systems in Table 1 for which we have RV datahave eccentricities between 0.23 < e < 0.5, which is compati-ble with the range of eccentricities reported by Thompson etal.(2012) for their objects. Also, the 4 stars with periods shorterthan 30 d belong to the least eccentric in our sample. Among1010
the long periodic systems, 5 exhibit eccentricities largerthan0.7. Our most eccentric system is KIC 8144355 (POrbit=80.6 d,e=0.76±0.01).
The systems found in the LMC so far have eccentricities thatrange between 0.15 < e < 0.45, which suggests that the stars1015might have experienced some circularization. It is not yet clearif mass transfer has already started in these systems or if thecircularization is forced by tidal interaction. Yet the twosamplesare too small to draw a firm conclusion. In subsequent work,we will further investigate the distribution of eccentricities in1020
theKepler red giant heartbeat stars from photometric and radialvelocity data on larger datasets.
Finally, we note that KIC 8410637, an eclipsing binary witha 408 d period (Hekker et al. 2010; Frandsen et al. 2013) has aperiod and a high eccentricity (e∼0.7), compatible with the other1025red giant heartbeat stars (Figs. 18 & 19) but no heartbeat eventsare visible.
9. Conclusions
In this work we have studied a sample of 18 red giant stars ineccentric binary systems, detected with theKepler satellite, that1030exhibit flux modulation as a result of binary interaction duringtheir periastron passage. All giants in the systems in our sampleexhibit solar-like oscillations, so we applied asteroseismic tech-niques to determine their global properties, as well as their evo-lutionary states. As shown in the analysis of one selected system,1035the approach of combining asteroseismic and binary modellinganalyses is very powerful.
For KIC 5006817, this new approach revealed a low masscompanion with a mass ofM2 = 0.29 ± 0.03 M⊙ (where theuncertainty encompasses both the beaming and non-beaming1040
cases). Estimates based on the radial velocity curve and theopti-cal spectrum revealed that Doppler beaming should be contribut-ing 300 ppm to the light curve although the light curve modellingdid not support this. This is possibly a consequence the longtermtrends in theKepler data, given that the period of KIC 50068171045
is ∼95 d, which is very close to the length of aKepler quarter(90 d).
Through modelling the binary characteristics, while fixingthe primary mass and radius to the asteroseismically deter-mined values, the gravity darkening value was determined to1050be grd= 1.0± 0.03 for the non-beaming case andgrd= 1.07±0.03 for the beaming case. These values are inconsistent withthe empirical value determined by Lucy (1967),grd=0.32,and the more recent model dependent value determined byClaret & Bloemen (2011),grd= 0.5. To obtain a binary model1055with values closer to those predicted by theory, the densityof theprimary component would need to deviate significantly from thewell constrained asteroseismic value. For this reason we specu-late that the gravity darkening values require further revision.
From modelling the binary evolution of an approximate bi-1060
nary system, we conclude that the system is in fact too youngto be synchronized. When comparing the properties of the fullsample (Table 1), we found a correlation between the radiusof the primary red giant component and the orbital period.Furthermore, all stars show seismic characteristics of stars in the1065state of H-shell burning. For a few, we cannot rule out a mem-bership of the red clump or AGB. We argue that this is an effectof stellar evolution as the red giant’s radius along the red giantbranch will increase until the helium core ignites. If a systemgets too close, it can undergo a common envelope phase which1070could lead to the ejection of the convective envelope of the redgiant. This scenario is a potential evolutionary channel for theformation of cataclysmic variables and sdB stars.
Our sample is an interesting class of ellipsoidal variableswhich offers unique conditions to study interactions in and the1075
evolution of eccentric binary systems. Optimal cases are sys-tems which show the heartbeat effect and exhibit primary andsecondary eclipses or are double lined spectroscopic binaries, asfor such systems also for the secondary component independentfundamental parameters can be derived. The ensemble of stars 1080presented here allows us to study the binary interaction andthefuture fate of such eccentric systems in a new way, to help un-ravel common-envelope physics.
Acknowledgements. We acknowledge the work of the team behindKepler.Funding for theKepler Mission is provided by NASA’s Science Mission1085Directorate. The groundbased follow-up observations are based on spec-troscopy made with the Mercator Telescope, operated on the island of LaPalma by the Flemish Community, at the Spanish Observatoriodel Roquede los Muchachos of the Instituto de Astrofsica de Canarias.This work par-tially used data analyzed under the NASA grant NNX12AE17G. This re- 1090search is (partially) funded by the Research Council of the KU Leuven un-der grant agreement GOA/2013/012. The research leading to these results hasreceived funding from the European Research Council under the EuropeanCommunity’s Seventh Framework Programme (FP7/2007–2013)/ERC grantagreement n227224 (PROSPERITY). The research leading to these results1095has received funding from the European Community’s SeventhFrameworkProgramme FP7-SPACE-2011-1, project number 312844 (SPACEINN). K.H.was supported by a UK STFC PhD grant. JDR, T.K. and E.C. acknowledge thesupport of the FWO-Flanders under project O6260 - G.0728.11. TK also ac-knowledges financial support from the Austrian Science Fund(FWF P23608).1100A.T. was supported by the Fund for Scientific Research. S.H. was supportedby the Netherlands Organisation for Scientific Research (NWO). V.S.S. is anAspirant PhD Fellow of the FWO, Belgium. AD is supported by a Janos BolyaiResearch Scholarship of the Hungarian Academy of Sciences.This project hasbeen supported by the Hungarian OTKA Grants K76816, K83790,MB08C 110581013 and KTIA URKUT10-1-2011-0019 grant and the “Lendulet-2009”Young Researchers Program of the Hungarian Academy of Sciences.P.G.Bthanks Nick Cox for observational work.
17
P. G. Beck et al.: Pulsating red giant stars in eccentric binaries
ReferencesBallot, J., Garcıa, R. A., & Lambert, P. 2006, MNRAS, 369, 12811110Beck, P. G., Bedding, T. R., Mosser, B., et al. 2011, Science,332, 205Beck, P. G., Montalban, J., Kallinger, T., et al. 2012, Nature, 481, 55Bedding, T. R., Mosser, B., Huber, D., et al. 2011, Nature, 471, 608Bildsten, L., Paxton, B., Moore, K., & Macias, P. J. 2012, ApJ, 744, L6Bloemen, S. 2013, PhD thesis, University of Leuven, Belgium.1115Bloemen, S., Marsh, T. R., Østensen, R. H., & et al. 2011, MNRAS, 410, 1787Borucki, W. J., Koch, D., Basri, G., et al. 2010, Science, 327, 977Castelli, F. & Kurucz, R. L. 2004a, ArXiv Astro-ph/0405087Castelli, F. & Kurucz, R. L. 2004b, arXiv:astro-ph/0405087Christensen-Dalsgaard, J., Schou, J., & Thompson, M. J. 1990, MNRAS, 242,1120
353Claret, A. & Bloemen, S. 2011, A&A, 529, A75Corsaro, E., Frohlich, H.-E., Bonanno, A., et al. 2013, MNRAS, 430, 2313De Ridder, J., Barban, C., Baudin, F., et al. 2009, Nature, 459, 398De Ridder, J., Barban, C., Carrier, F., et al. 2006, A&A, 448,6891125De Smedt, K., Van Winckel, H., Karakas, A. I., et al. 2012, A&A, 541, A67Deheuvels, S., Garcıa, R. A., Chaplin, W. J., et al. 2012, ApJ, 756, 19Demarque, P., Guenther, D. B., Li, L. H., Mazumdar, A., & Straka, C. W. 2008,
ApSS, 316, 31Diaz-Cordoves, J. & Gimenez, A. 1992, A&A, 259, 2271130Donati, J.-F., Semel, M., Carter, B. D., Rees, D. E., & Collier Cameron, A. 1997,
MNRAS, 291, 658Dupret, M.-A., Belkacem, K., Samadi, R., et al. 2009, A&A, 506, 57Espinosa Lara, F. & Rieutord, M. 2012, A&A, 547, A32Feroz, F., Hobson, M. P., & Bridges, M. 2009, MNRAS, 398, 16011135Frandsen, S., Carrier, F., Aerts, C., et al. 2002, A&A, 394, L5Frandsen, S., Lehmann, J., Hekker, S., et al. 2013, A&A (accepted)Garcıa, R. A., Hekker, S., Stello, D., et al. 2011, MNRAS, 414, L6Gaulme, P., McKeever, J., Rawls, M. L., et al. 2013, ApJ, 767,82Gizon, L. & Solanki, S. K. 2003, ApJ, 589, 10091140Goupil, M. J., Mosser, B., Marques, J. P., et al. 2013, A&A, 549, A75Grevesse, N., Noels, A., & Sauval, A. J. 1996, in Astronomical Society of the
Pacific Conference Series, Vol. 99, Cosmic Abundances, ed. S. S. Holt &G. Sonneborn, 117
Guenther, D. B. 1994, ApJ, 422, 4001145Guenther, D. B., Demarque, P., Kim, Y.-C., & Pinsonneault, M. H. 1992, ApJ,
387, 372Hadrava, P. 1995, A&AS, 114, 393Hambleton, K. M., Kurtz, D. W., Prsa, A., et al. 2013, ArXiv e-printsHan, Z., Podsiadlowski, P., Maxted, P. F. L., & Marsh, T. R. 2003, MNRAS, 341,1150
669Han, Z., Podsiadlowski, P., Maxted, P. F. L., Marsh, T. R., & Ivanova, N. 2002,
MNRAS, 336, 449Heber, U. 2009, Annu.Rev.Astron.Astrophys., 47, 211Hekker, S., Aerts, C., De Ridder, J., & Carrier, F. 2006, A&A,458, 9311155Hekker, S., Debosscher, J., Huber, D., et al. 2010, ApJ, 713,L187Hekker, S., Elsworth, Y., De Ridder, J., et al. 2011, A&A, 525, A131Hu, H., Dupret, M.-A., Aerts, C., et al. 2008, A&A, 490, 243Huber, D., Bedding, T. R., Stello, D., et al. 2011, ApJ, 743, 143Huber, D., Ireland, M. J., Bedding, T. R., et al. 2012, ApJ, 760, 321160Hurley, J. R., Tout, C. A., & Pols, O. R. 2002, MNRAS, 329, 897Hut, P. 1981, A&A, 99, 126Ilijic, S., Hensberge, H., Pavlovski, K., & Freyhammer, L. M. 2004,
in Astronomical Society of the Pacific Conference Series, Vol. 318,Spectroscopically and Spatially Resolving the Componentsof the Close1165Binary Stars, ed. R. W. Hilditch, H. Hensberge, & K. Pavlovski, 111–113
Kallinger, T., Gruberbauer, M., Guenther, D. B., Fossati, L., & Weiss, W. W.2010a, A&A, 510, A106
Kallinger, T., Hekker, S., Mosser, B., et al. 2012, A&A, 541,A51Kallinger, T., Mosser, B., Hekker, S., et al. 2010b, A&A, 522, A11170Kjeldsen, H. & Bedding, T. R. 1995, A&A, 293, 87Kochukhov, O., Makaganiuk, V., & Piskunov, N. 2010, A&A, 524, A5Kudritzki, R. P. & Reimers, D. 1978, A&A, 70, 227Kumar, P., Ao, C. O., & Quataert, E. J. 1995, ApJ, 449, 294Kupka, F. G., Ryabchikova, T. A., Piskunov, N. E., Stempels,H. C., & Weiss,1175
W. W. 2000, Baltic Astronomy, 9, 590Ledoux, P. 1951, ApJ, 114, 373Loeb, A. & Gaudi, B. S. 2003, ApJ, 588, L117Lucy, L. B. 1967, ZAp, 65, 89Matijevic, G., Prsa, A., Orosz, J. A., et al. 2012, AJ, 143,1231180Mazeh, T. & Faigler, S. 2010, A&A, 521, L59+Mosser, B., Barban, C., Montalban, J., et al. 2011a, A&A, 532, A86Mosser, B., Belkacem, K., Goupil, M. J., et al. 2011b, A&A, 525, L9Mosser, B., Goupil, M. J., Belkacem, K., et al. 2012a, A&A, 548, A10Mosser, B., Goupil, M. J., Belkacem, K., et al. 2012b, A&A, 540, A1431185
Mosser, B., Michel, E., Belkacem, K., et al. 2013, A&A, 550, A126Murphy, S. J., Shibahashi, H., & Kurtz, D. W. 2013, MNRAS, 430, 2986Nelemans, G. & Tout, C. A. 2005, MNRAS, 356, 753Nicholls, C. P. & Wood, P. R. 2012, MNRAS, 421, 2616Østensen, R. H. 2009, Communications in Asteroseismology,159, 75 1190Paxton, B., Bildsten, L., Dotter, A., et al. 2010, MESA: Modules for Experiments
in Stellar Astrophysics, astrophysics Source Code LibraryPaxton, B., Bildsten, L., Dotter, A., et al. 2011, ApJS, 192,3Paxton, B., Cantiello, M., Arras, P., et al. 2013, ArXiv: 1301.0319Prsa, A., Batalha, N., Slawson, R. W., et al. 2011, AJ, 141, 83 1195Prsa, A. & Zwitter, T. 2005, ApJ, 628, 426Raskin, G., van Winckel, H., Hensberge, H., et al. 2011, A&A,526, A69Remus, F., Mathis, S., & Zahn, J.-P. 2012, A&A, 544, A132Rucinski, S. M. 1969a, Acta Astron., 19, 125Rucinski, S. M. 1969b, Acta Astron., 19, 245 1200Schou, J., Antia, H. M., Basu, S., et al. 1998, ApJ, 505, 390Shporer, A., Kaplan, D. L., Steinfadt, J. D. R., et al. 2010, ApJ, 725, L200Slawson, R. W., Prsa, A., Welsh, W. F., et al. 2011, AJ, 142, 160Sneden, C. A. 1973, PhD thesis, The Univerisity of Texas at Austin.Stellingwerf, R. F. 1978, ApJ, 224, 953 1205Tassoul, M. 1980, ApJS, 43, 469Thompson, S. E., Everett, M., Mullally, F., et al. 2012, ApJ,753, 86Tkachenko, A., Van Reeth, T., Tsymbal, V., et al. 2013, submittedvan Hamme, W. 1993, AJ, 106, 2096van Kerkwijk, M. H., Rappaport, S. A., Breton, R. P., et al. 2010, ApJ, 715, 51 1210Verbunt, F. & Phinney, E. S. 1995, A&A, 296, 709Vos, J., Østensen, R. H., Nemeth, P., et al. 2013, ArXiv e-printsWelsh, W. F., Orosz, J. A., Aerts, C., et al. 2011, ApJS, 197, 4Wilson, R. E. 1979, ApJ, 234, 1054Wilson, R. E. & Devinney, E. J. 1971, ApJ, 166, 605 1215Wilson, R. E. & Sofia, S. 1976, ApJ, 203, 182Wilson, R. E. & Van Hamme, W. 2004, Computing Binary Star Observables (in
Reference Manual to the Wilson-Devinney Program)Zahn, J. P. 1966, Annales d’Astrophysique, 29, 489Zahn, J.-P. 1977, A&A, 57, 383 1220Zahn, J.-P. 1989, A&A, 220, 112Zucker, S., Mazeh, T., & Alexander, T. 2007, ApJ, 670, 1326
18